戴尔 Latitude 3180 (N4200, 高清) 笔记本电脑简短评测
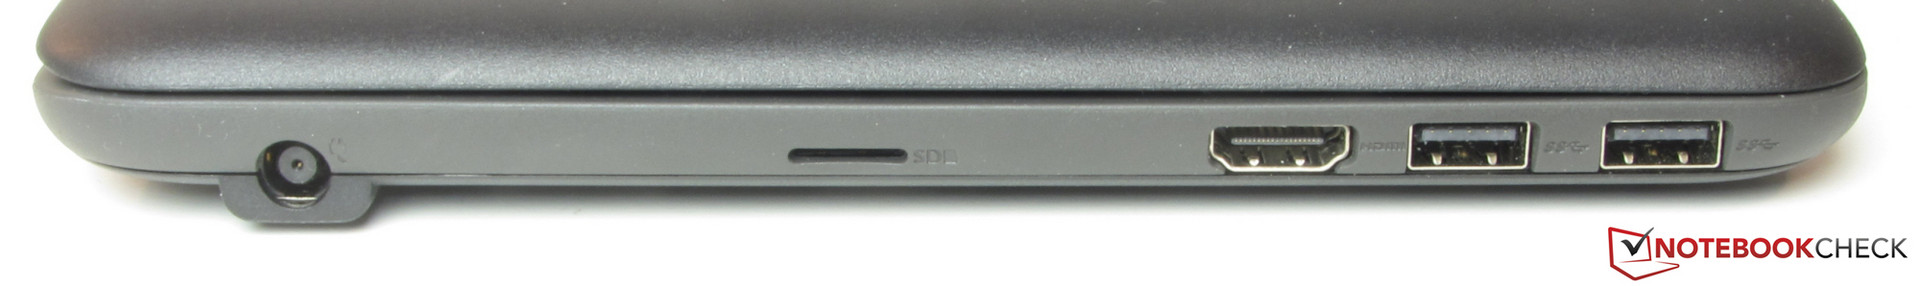
Connectivity
| SD Card Reader | |
| maximum SDCardreader Maximum Transfer Rate | |
| average SDCardreader Average Transfer Rate |
| Networking | |
| iperf3 transmit AX12 | |
| Dell Latitude 3180 | |
| iperf3 receive AX12 | |
| Dell Latitude 3180 | |
| iperf Client (transmit) TCP 1 m | |
| Acer TravelMate B117-M-P16Q (seb) | |
| iperf Server (receive) TCP 1 m | |
| Acer TravelMate B117-M-P16Q (seb) | |
| |||||||||||||||||||||||||
Brightness Distribution: 85 %
Center on Battery: 253 cd/m²
Contrast: 538:1 (Black: 0.47 cd/m²)
ΔE ColorChecker Calman: 12.87 | ∀{0.5-29.43 Ø4.72}
ΔE Greyscale Calman: 13.97 | ∀{0.09-98 Ø4.97}
61% sRGB (Argyll 1.6.3 3D)
39% AdobeRGB 1998 (Argyll 1.6.3 3D)
42.13% AdobeRGB 1998 (Argyll 3D)
61.4% sRGB (Argyll 3D)
40.78% Display P3 (Argyll 3D)
Gamma: 2.46
CCT: 18336 K
| Dell Latitude 3180 TN LED, 1366x768, 11.6" | Dell Latitude 11 3150 TN, 1366x768, 11" | Acer TravelMate B117-M-P16Q TN LED, 1366x768, 11.6" | HP Stream 11-r000ng TN, 1366x768, 11.6" | Medion Akoya S2218 IPS, 1920x1080, 11.6" | |
|---|---|---|---|---|---|
| Display | -5% | 3% | 4% | 17% | |
| Display P3 Coverage (%) | 40.78 | 38.93 -5% | 42.04 3% | 42.52 4% | 48.34 19% |
| sRGB Coverage (%) | 61.4 | 58.5 -5% | 62.9 2% | 63.5 3% | 70.1 14% |
| AdobeRGB 1998 Coverage (%) | 42.13 | 40.23 -5% | 43.46 3% | 43.97 4% | 50 19% |
| Response Times | -7% | -1% | 3% | ||
| Response Time Grey 50% / Grey 80% * (ms) | 40 ? | 38 ? 5% | 44 ? -10% | 27 ? 32% | |
| Response Time Black / White * (ms) | 26 ? | 31 ? -19% | 24 ? 8% | 33 ? -27% | |
| PWM Frequency (Hz) | 200 ? | 200 ? | |||
| Screen | -13% | 7% | 8% | 39% | |
| Brightness middle (cd/m²) | 253 | 235 -7% | 218 -14% | 264 4% | 417 65% |
| Brightness (cd/m²) | 236 | 219 -7% | 215 -9% | 248 5% | 394 67% |
| Brightness Distribution (%) | 85 | 72 -15% | 85 0% | 84 -1% | 88 4% |
| Black Level * (cd/m²) | 0.47 | 0.81 -72% | 0.38 19% | 0.5 -6% | 0.43 9% |
| Contrast (:1) | 538 | 290 -46% | 574 7% | 528 -2% | 970 80% |
| Colorchecker dE 2000 * | 12.87 | 9.67 25% | 10.29 20% | 9.78 24% | 6.7 48% |
| Colorchecker dE 2000 max. * | 21.99 | 17.68 20% | 16.39 25% | 15.07 31% | |
| Greyscale dE 2000 * | 13.97 | 11 21% | 11.71 16% | 11.16 20% | 6.25 55% |
| Gamma | 2.46 89% | 2.2 100% | 2.45 90% | 2.44 90% | 2.48 89% |
| CCT | 18336 35% | 11769 55% | 14164 46% | 12954 50% | 5954 109% |
| Color Space (Percent of AdobeRGB 1998) (%) | 39 | 37 -5% | 40 3% | 41 5% | 46 18% |
| Color Space (Percent of sRGB) (%) | 61 | 63 3% | 63 3% | 69 13% | |
| Total Average (Program / Settings) | -9% /
-11% | 1% /
4% | 4% /
6% | 20% /
30% |
* ... smaller is better
Screen Flickering / PWM (Pulse-Width Modulation)
| Screen flickering / PWM detected | 200 Hz | ≤ 90 % brightness setting | 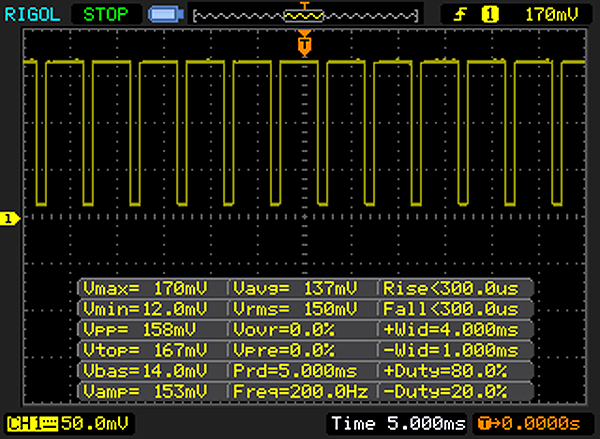 |
The display backlight flickers at 200 Hz (worst case, e.g., utilizing PWM) Flickering detected at a brightness setting of 90 % and below. There should be no flickering or PWM above this brightness setting. The frequency of 200 Hz is relatively low, so sensitive users will likely notice flickering and experience eyestrain at the stated brightness setting and below. In comparison: 52 % of all tested devices do not use PWM to dim the display. If PWM was detected, an average of 7784 (minimum: 5 - maximum: 343500) Hz was measured. | |||
Display Response Times
| ↔ Response Time Black to White | ||
|---|---|---|
| 26 ms ... rise ↗ and fall ↘ combined | ↗ 20 ms rise | 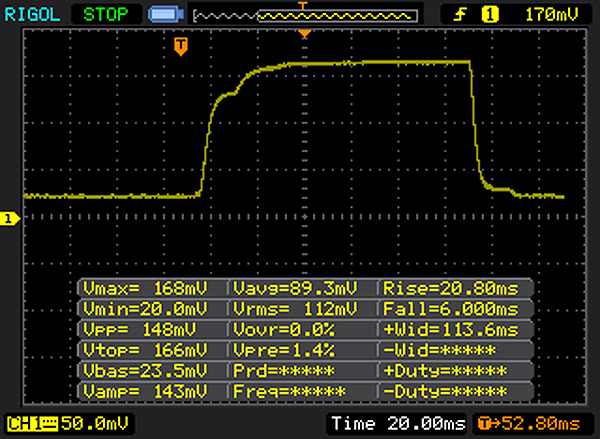 |
| ↘ 6 ms fall | ||
| The screen shows relatively slow response rates in our tests and may be too slow for gamers. In comparison, all tested devices range from 0.1 (minimum) to 240 (maximum) ms. » 62 % of all devices are better. This means that the measured response time is worse than the average of all tested devices (19.9 ms). | ||
| ↔ Response Time 50% Grey to 80% Grey | ||
| 40 ms ... rise ↗ and fall ↘ combined | ↗ 22 ms rise | 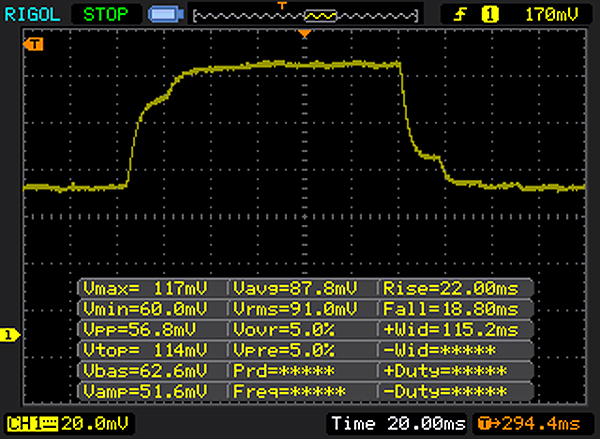 |
| ↘ 18 ms fall | ||
| The screen shows slow response rates in our tests and will be unsatisfactory for gamers. In comparison, all tested devices range from 0.165 (minimum) to 636 (maximum) ms. » 61 % of all devices are better. This means that the measured response time is worse than the average of all tested devices (31.1 ms). | ||
| Cinebench R15 | |
| CPU Single 64Bit | |
| Acer Aspire ES1-332-P91H | |
| Acer Aspire ES1-533-P7WA | |
| Dell Latitude 3180 | |
| Dell Latitude 3189 | |
| Acer TravelMate B117-M-P16Q | |
| Dell Latitude 11 3150 | |
| HP Stream 11-r000ng | |
| CPU Multi 64Bit | |
| Dell Latitude 3180 | |
| Dell Latitude 3189 | |
| Acer Aspire ES1-332-P91H | |
| Acer Aspire ES1-533-P7WA | |
| Dell Latitude 11 3150 | |
| Acer TravelMate B117-M-P16Q | |
| HP Stream 11-r000ng | |
| Cinebench R10 | |
| Rendering Multiple CPUs 32Bit | |
| Dell Latitude 3180 | |
| Dell Latitude 3189 | |
| Acer Aspire ES1-332-P91H | |
| Acer Aspire ES1-533-P7WA | |
| Acer TravelMate B117-M-P16Q | |
| Dell Latitude 11 3150 | |
| Rendering Single 32Bit | |
| Acer Aspire ES1-332-P91H | |
| Acer Aspire ES1-533-P7WA | |
| Dell Latitude 3180 | |
| Dell Latitude 3189 | |
| Dell Latitude 11 3150 | |
| Acer TravelMate B117-M-P16Q | |
| Geekbench 3 | |
| 32 Bit Single-Core Score | |
| Dell Latitude 3180 | |
| Acer Aspire ES1-533-P7WA | |
| Acer Aspire ES1-332-P91H | |
| Acer TravelMate B117-M-P16Q | |
| 32 Bit Multi-Core Score | |
| Dell Latitude 3180 | |
| Acer Aspire ES1-533-P7WA | |
| Acer Aspire ES1-332-P91H | |
| Acer TravelMate B117-M-P16Q | |
| Geekbench 4.0 | |
| 64 Bit Single-Core Score | |
| Acer Aspire ES1-533-P7WA | |
| Acer Aspire ES1-332-P91H | |
| Dell Latitude 3180 | |
| 64 Bit Multi-Core Score | |
| Dell Latitude 3180 | |
| Acer Aspire ES1-533-P7WA | |
| Acer Aspire ES1-332-P91H | |
| Geekbench 4.4 | |
| 64 Bit Single-Core Score | |
| Dell Latitude 3180 | |
| 64 Bit Multi-Core Score | |
| Dell Latitude 3180 | |
| JetStream 1.1 - 1.1 Total | |
| Acer Aspire ES1-533-P7WA | |
| Acer Aspire ES1-332-P91H | |
| Dell Latitude 3180 | |
| Dell Latitude 3189 | |
| Acer TravelMate B117-M-P16Q | |
| PCMark 8 Home Score Accelerated v2 | 2314 points | |
Help | ||
| PCMark 8 - Home Score Accelerated v2 | |
| Dell Latitude 3180 | |
| Acer TravelMate B117-M-P16Q | |
| HP Stream 11-r000ng | |
| Medion Akoya S2218 | |

| Dell Latitude 3180 Liteonit CV3-8D128 | Dell Latitude 11 3150 Samsung SSD PM851 128 GB MZ7TE128HMGR | Acer TravelMate B117-M-P16Q Liteonit CV3-8D256 | HP Stream 11-r000ng 32 GB eMMC Flash | Medion Akoya S2218 64 GB eMMC Flash | |
|---|---|---|---|---|---|
| CrystalDiskMark 3.0 | -25% | 25% | -58% | -67% | |
| Read Seq (MB/s) | 482.6 | 251.5 -48% | 506 5% | 154.2 -68% | 140.2 -71% |
| Write Seq (MB/s) | 213.2 | 124.4 -42% | 393.4 85% | 76.6 -64% | 52.7 -75% |
| Read 512 (MB/s) | 276.5 | 229.2 -17% | 329.1 19% | 165.8 -40% | 98.4 -64% |
| Write 512 (MB/s) | 162.6 | 124.8 -23% | 282.5 74% | 59.9 -63% | 58.7 -64% |
| Read 4k (MB/s) | 18.17 | 13.5 -26% | 23.35 29% | 18.25 0% | 15.25 -16% |
| Write 4k (MB/s) | 44.77 | 39.21 -12% | 45.56 2% | 13.16 -71% | 9.817 -78% |
| Read 4k QD32 (MB/s) | 132.7 | 117.4 -12% | 123.5 -7% | 46.51 -65% | 37.24 -72% |
| Write 4k QD32 (MB/s) | 118.1 | 98.6 -17% | 111.2 -6% | 13.21 -89% | 8.734 -93% |
| 3DMark 11 Performance | 899 points | |
Help | ||
| 3DMark 11 - 1280x720 Performance GPU | |
| Dell Latitude 3180 | |
| Acer Aspire ES1-533-P7WA | |
| Acer Aspire ES1-332-P91H | |
| Acer TravelMate B117-M-P16Q | |
| HP Stream 11-r000ng | |
| Dell Latitude 11 3150 | |
| low | med. | high | ultra | |
|---|---|---|---|---|
| BioShock Infinite (2013) | 32.3 | 18.6 | 16.2 | |
| Deus Ex Mankind Divided (2016) | 5.1 | |||
| Resident Evil 7 (2017) | 14.4 | |||
| For Honor (2017) | 12.1 | |||
| Ghost Recon Wildlands (2017) | 5.9 |
(±) The maximum temperature on the upper side is 40.6 °C / 105 F, compared to the average of 35.9 °C / 97 F, ranging from 21.4 to 59 °C for the class Subnotebook.
(-) The bottom heats up to a maximum of 48.4 °C / 119 F, compared to the average of 39.2 °C / 103 F
(+) In idle usage, the average temperature for the upper side is 23.2 °C / 74 F, compared to the device average of 30.8 °C / 87 F.
(+) The palmrests and touchpad are cooler than skin temperature with a maximum of 27.1 °C / 80.8 F and are therefore cool to the touch.
(±) The average temperature of the palmrest area of similar devices was 28.2 °C / 82.8 F (+1.1 °C / 2 F).
Dell Latitude 3180 audio analysis
(-) | not very loud speakers (68 dB)
Bass 100 - 315 Hz
(±) | reduced bass - on average 12.2% lower than median
(+) | bass is linear (5.9% delta to prev. frequency)
Mids 400 - 2000 Hz
(+) | balanced mids - only 4.5% away from median
(+) | mids are linear (6.9% delta to prev. frequency)
Highs 2 - 16 kHz
(+) | balanced highs - only 3.9% away from median
(+) | highs are linear (6% delta to prev. frequency)
Overall 100 - 16.000 Hz
(±) | linearity of overall sound is average (17.8% difference to median)
Compared to same class
» 50% of all tested devices in this class were better, 7% similar, 43% worse
» The best had a delta of 5%, average was 18%, worst was 53%
Compared to all devices tested
» 36% of all tested devices were better, 8% similar, 56% worse
» The best had a delta of 4%, average was 24%, worst was 134%
Apple MacBook 12 (Early 2016) 1.1 GHz audio analysis
(+) | speakers can play relatively loud (83.6 dB)
Bass 100 - 315 Hz
(±) | reduced bass - on average 11.3% lower than median
(±) | linearity of bass is average (14.2% delta to prev. frequency)
Mids 400 - 2000 Hz
(+) | balanced mids - only 2.4% away from median
(+) | mids are linear (5.5% delta to prev. frequency)
Highs 2 - 16 kHz
(+) | balanced highs - only 2% away from median
(+) | highs are linear (4.5% delta to prev. frequency)
Overall 100 - 16.000 Hz
(+) | overall sound is linear (10.2% difference to median)
Compared to same class
» 7% of all tested devices in this class were better, 2% similar, 91% worse
» The best had a delta of 5%, average was 18%, worst was 53%
Compared to all devices tested
» 5% of all tested devices were better, 1% similar, 94% worse
» The best had a delta of 4%, average was 24%, worst was 134%
| Off / Standby | |
| Idle | |
| Load |
|
Key:
min: | |
| Battery Runtime - WiFi Websurfing | |
| Dell Latitude 3180 | |
| Dell Latitude 11 3150 | |
| Acer TravelMate B117-M-P16Q | |
| HP Stream 11-r000ng | |
| Medion Akoya S2218 | |
Pros
Cons
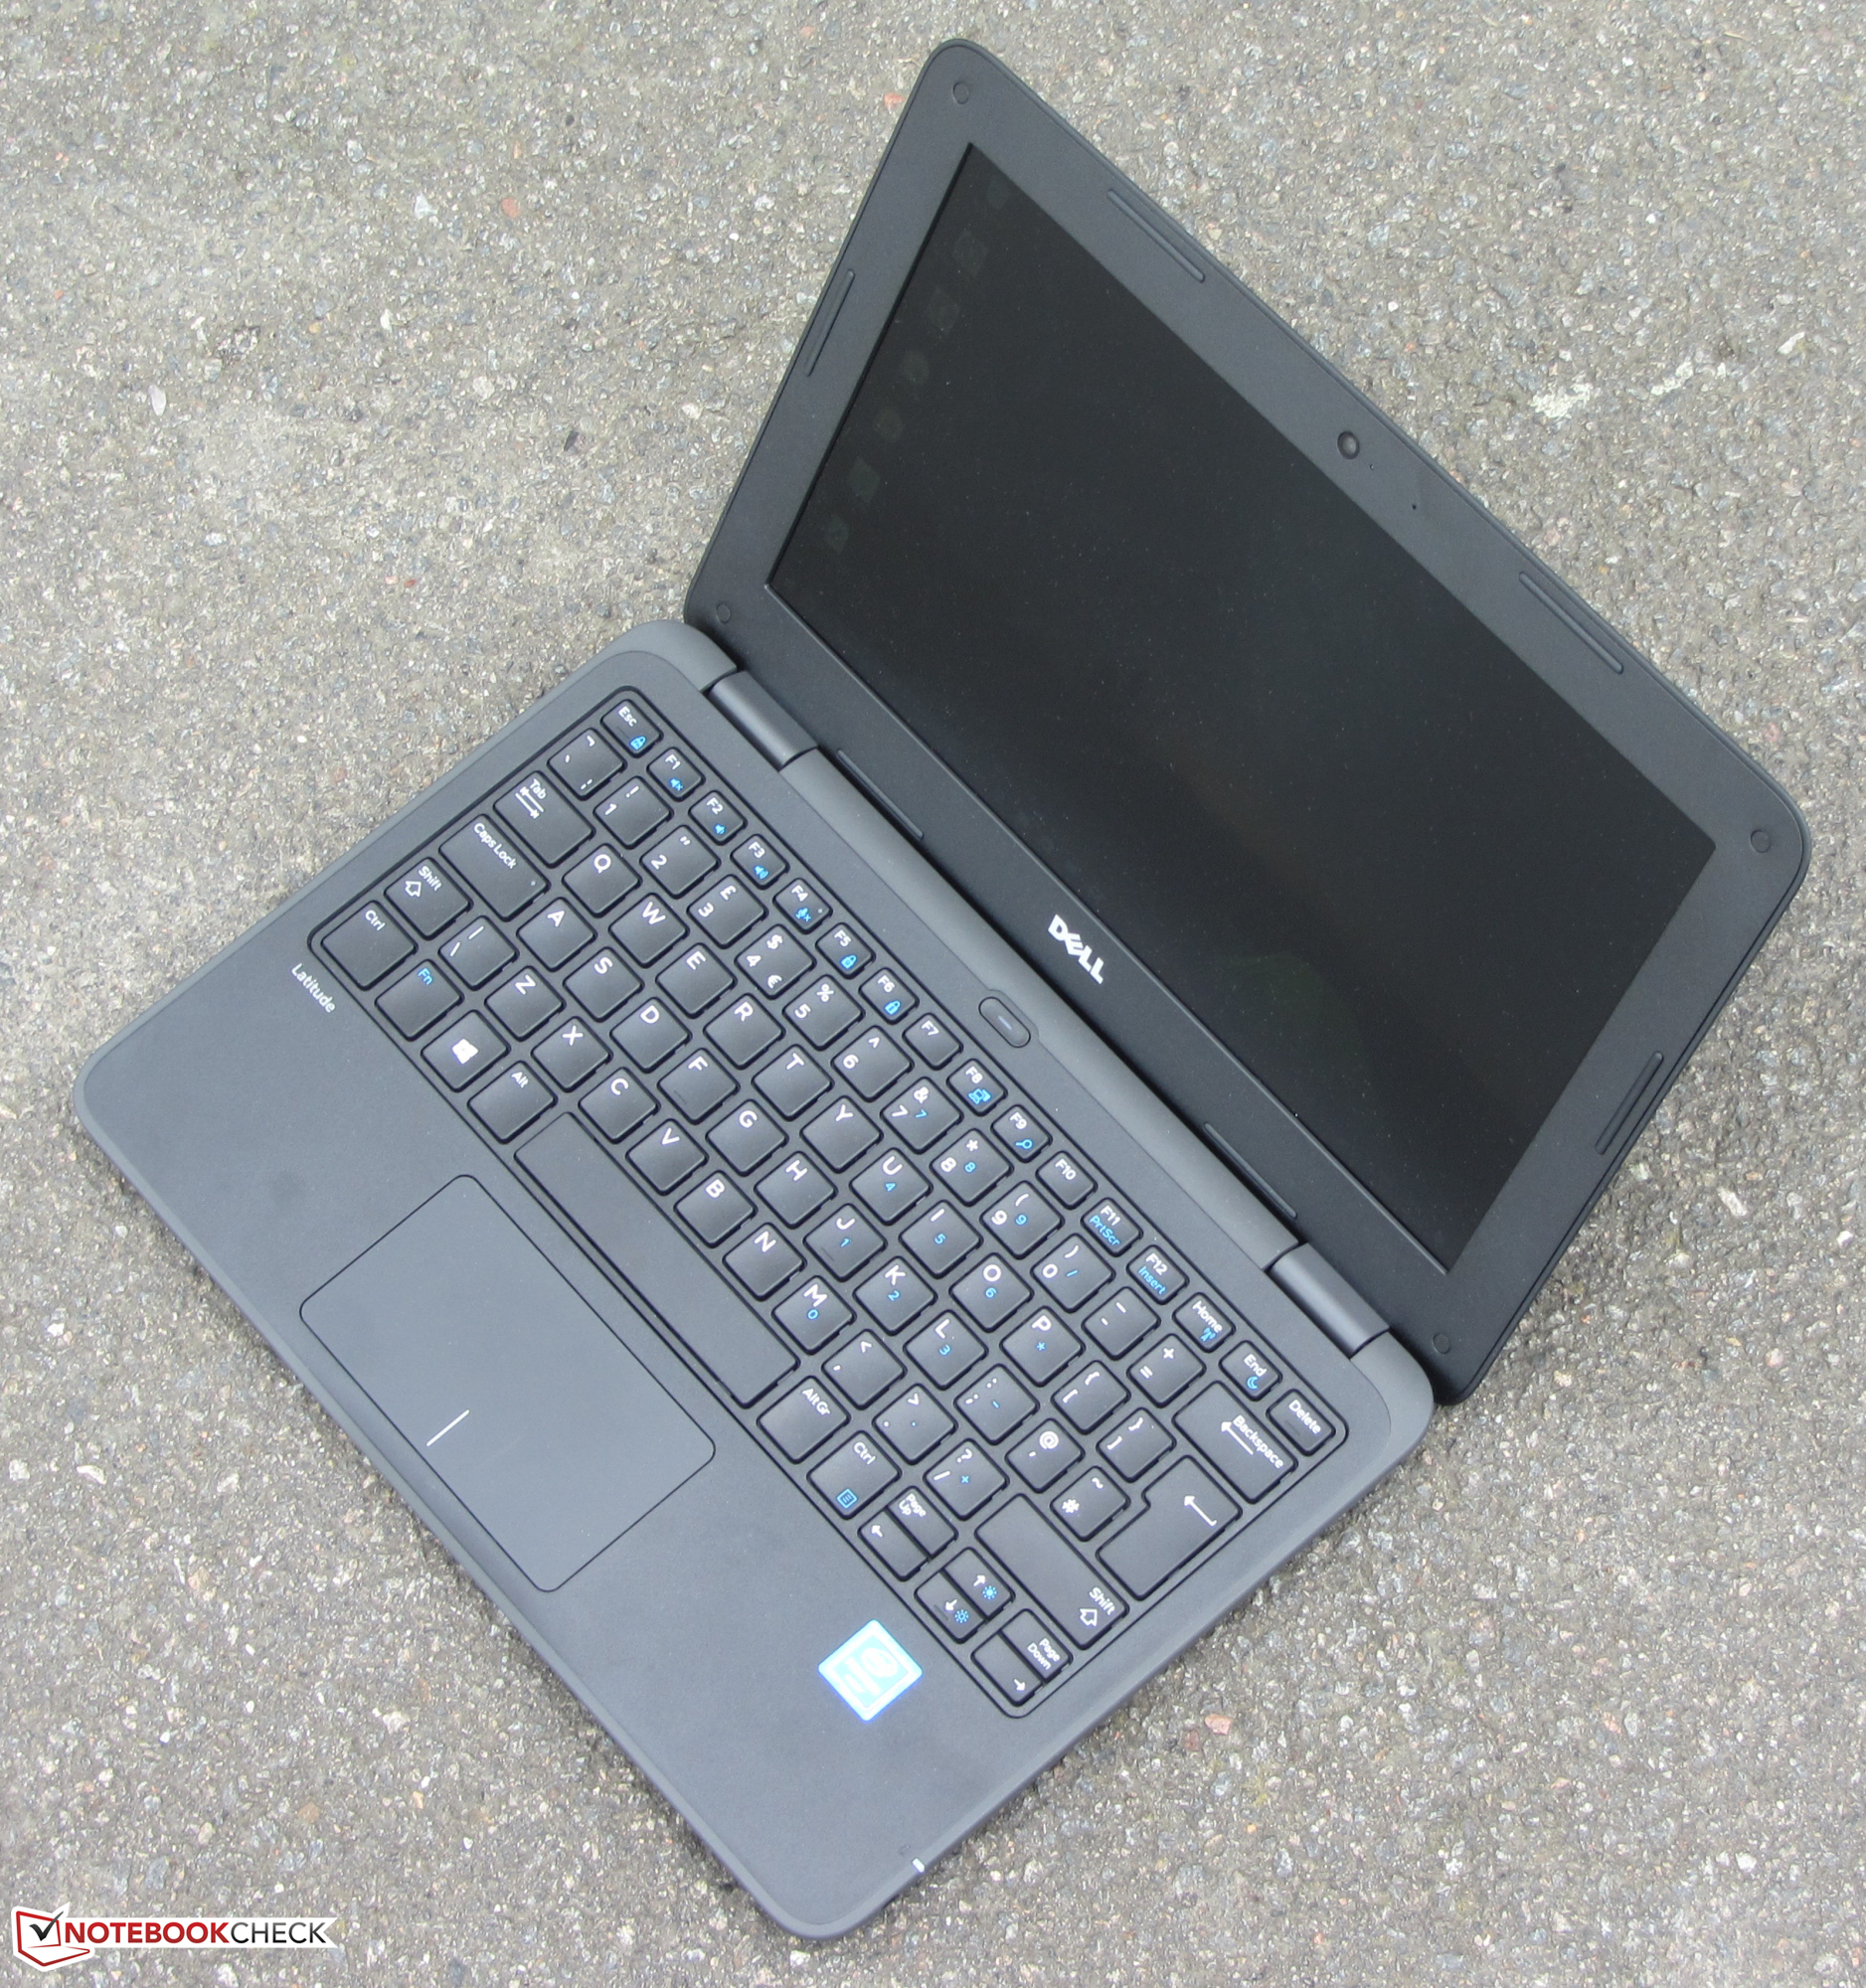
戴尔Latitude 11 3180是一台在设计时充分考虑到教育用户需要的11.6寸笔记本电脑。它采用了坚固的塑料机身,搭载的Apollo Lake处理器可以提供办公和上网浏览所需的性能。这台设备在使用中十分安静,不会变得很热。
戴尔Latitude 11 3180是一台小巧耐久的笔记本电脑,十分适合教育机构用作文字输入和上网浏览设备。
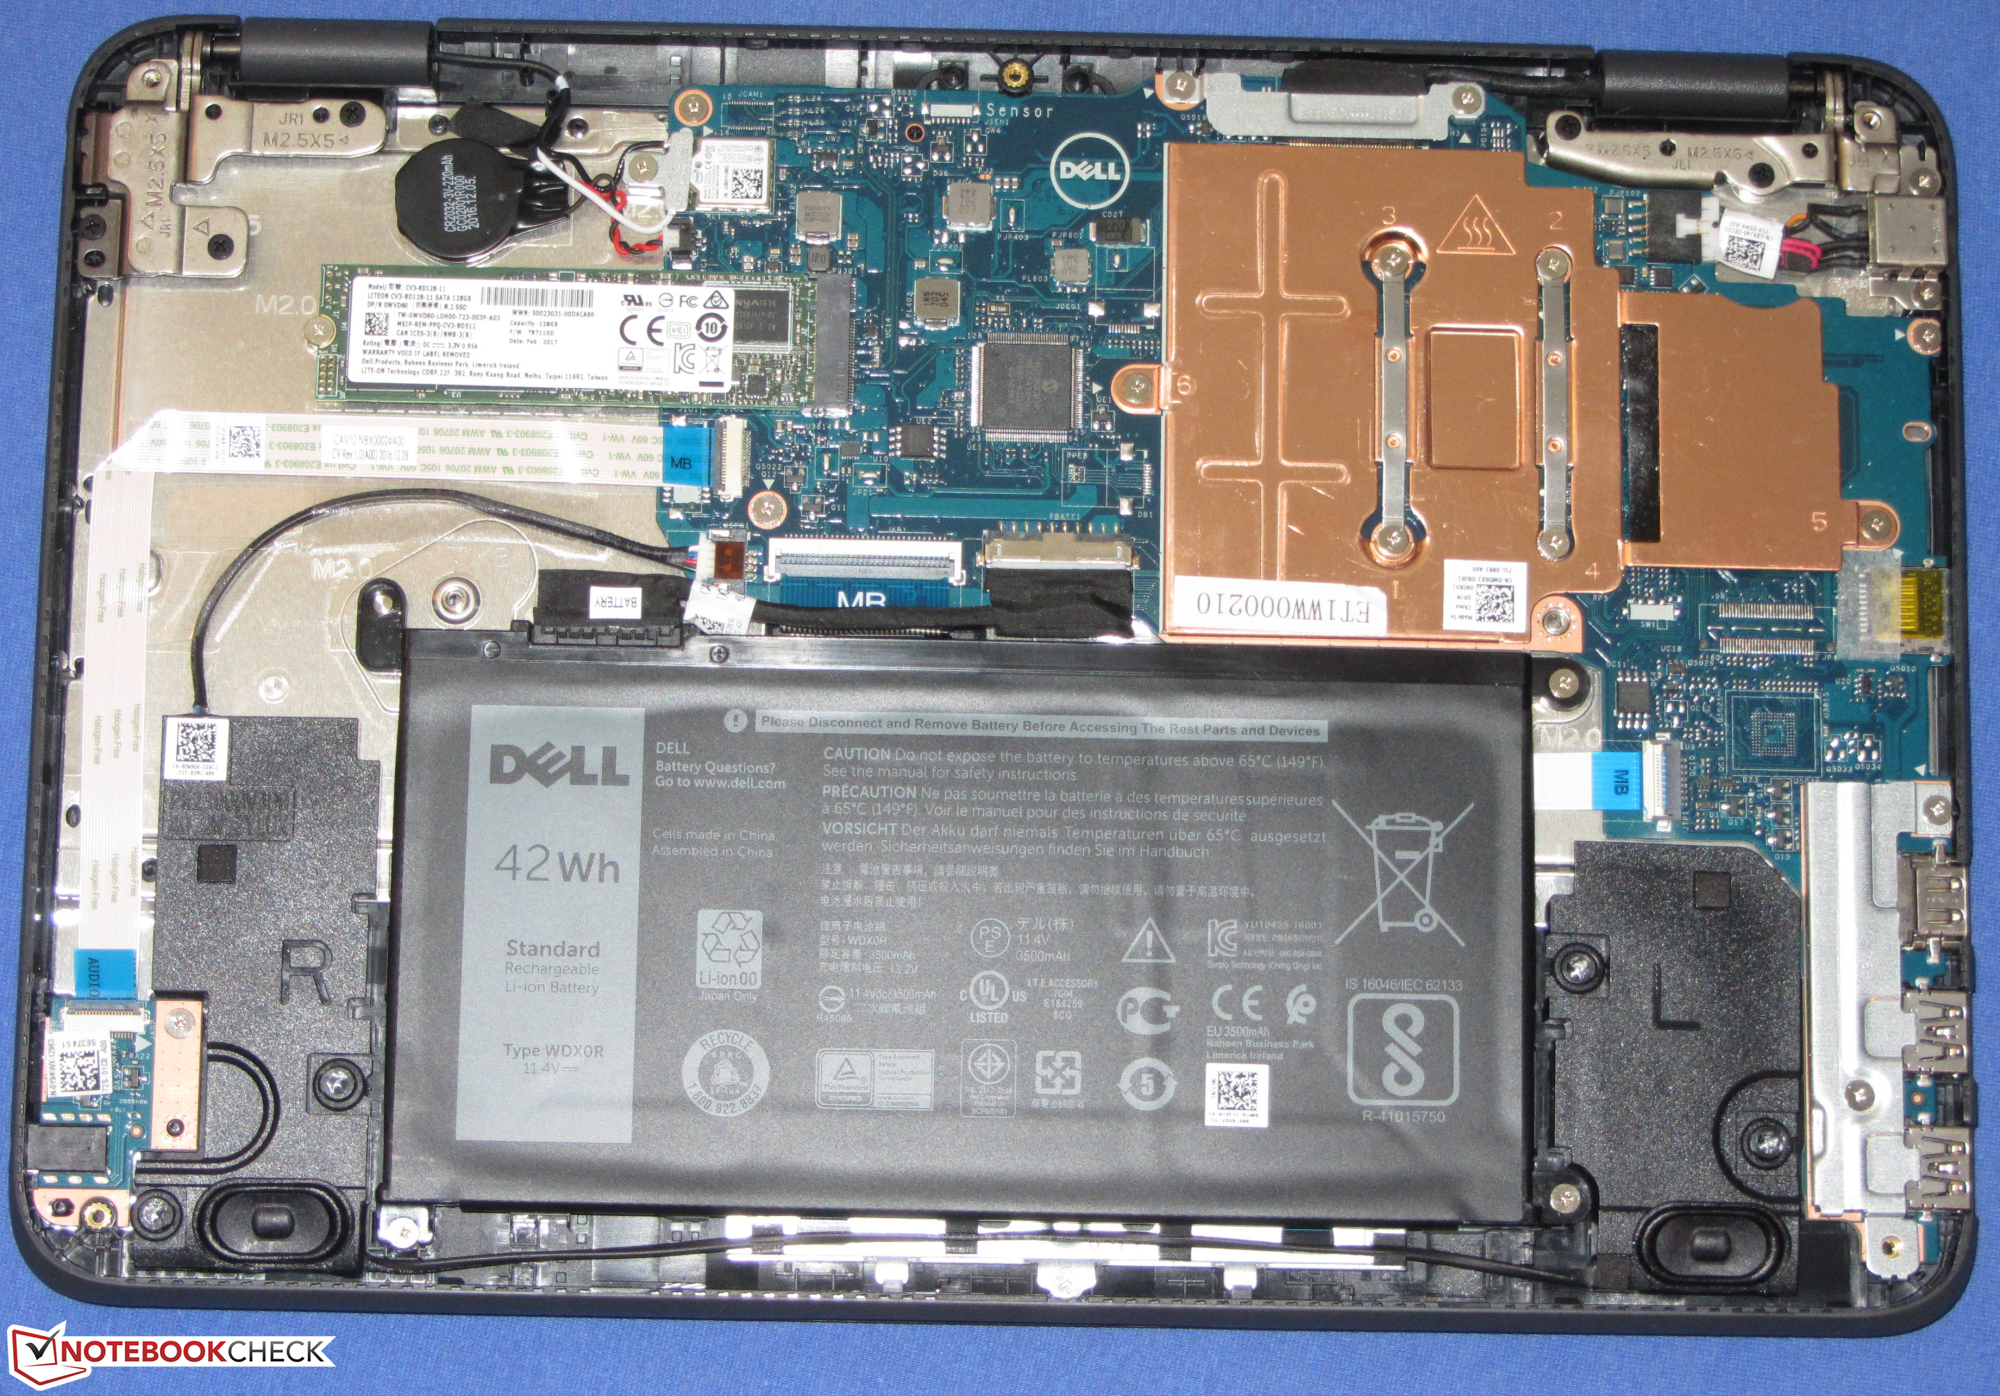
另外,这台笔记本电脑并不是所有型号都搭配了固态硬盘。相对便宜的型号搭配的是不可更换的eMMC闪存,用户无法更换或升级。它的电池续航十分出色,同时搭配实用的键盘可以满足长时间文字输入所需。
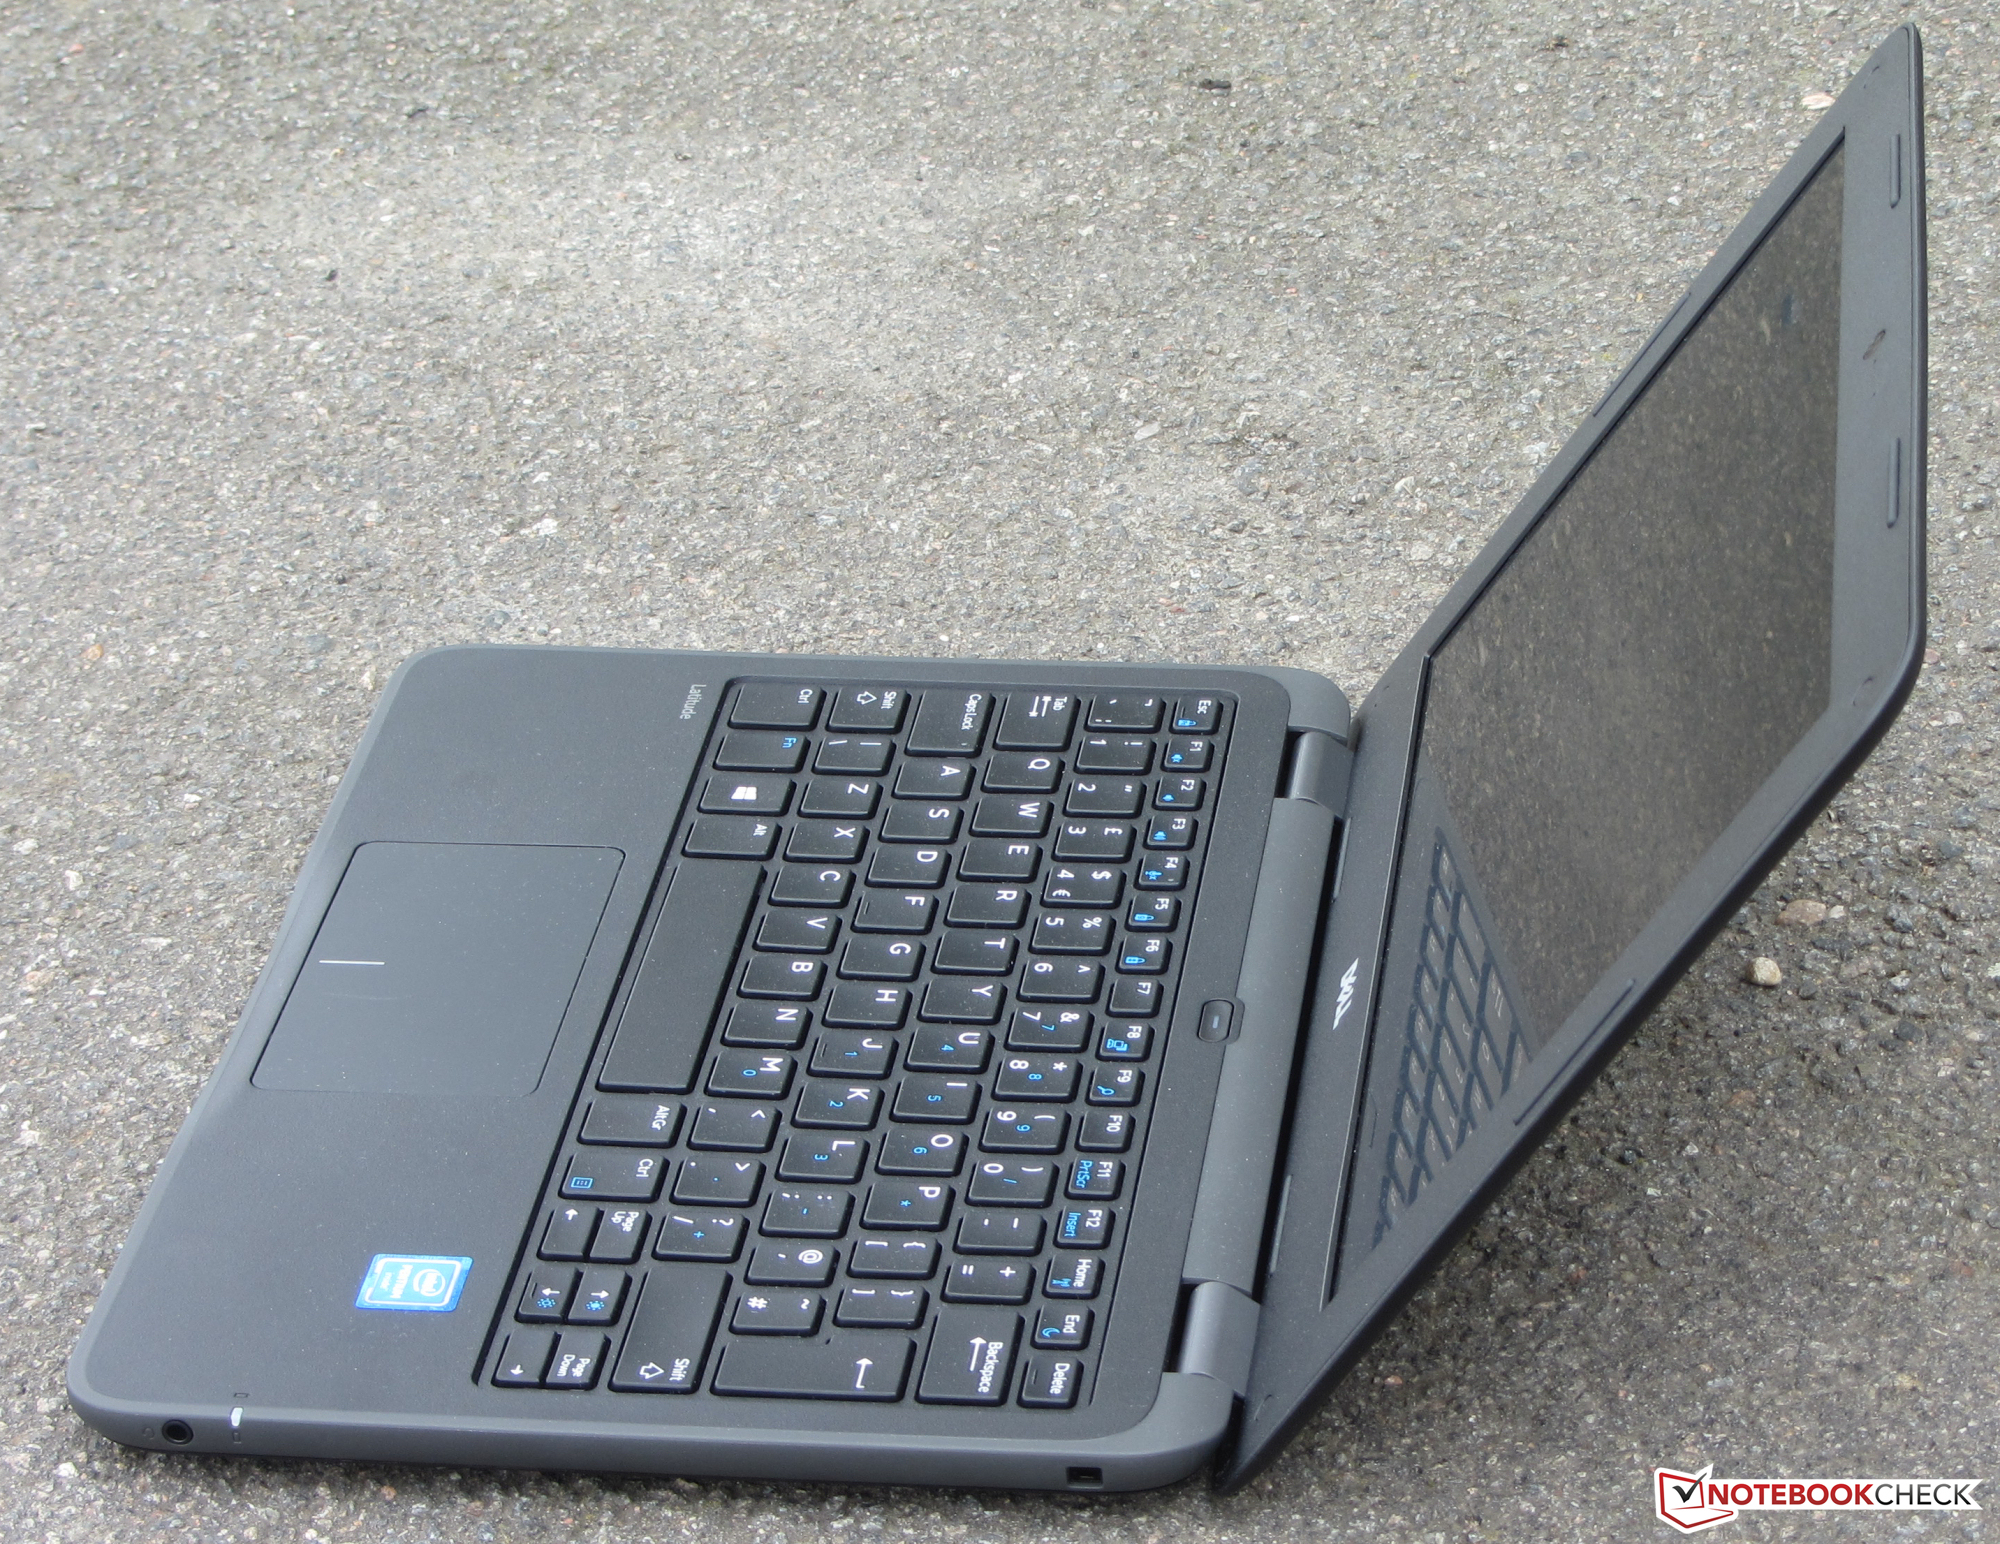
它的屏幕让人十分失望。戴尔为它选择了一块低亮度、低对比度、可视角度很窄的屏幕,这并不适合它的定位——戴尔官网的介绍中提到这台笔记本电脑由于搭配可以180度旋转的屏幕,可以平放在桌面上使用。要达到这个目的,戴尔需要为它搭配一块IPS屏幕,而不是这块可视角度很窄的屏幕。除此之外,如果它作为课堂长时间使用的教育设备的话,不应该使用闪烁屏幕亮度控制。
我们的测试机型在戴尔网上商店中售价582欧元(约4369人民币)——对于这样一款简单的教育设备来说显得十分高昂。因此,它并不适合个人用户选购。
注:本文是基于完整评测的缩减版本,阅读完整的英文评测,请点击这里。
Dell Latitude 3180
- 04/19/2017 v6 (old)
Sascha Mölck