戴尔 Latitude 3189 (N4200, HD) 变形本简短评测


| SD Card Reader | |
| average JPG Copy Test (av. of 3 runs) | |
| HP Pavilion x360 13-u102ng | |
| Dell Latitude 3189 | |
| HP Pavilion 11-k103ng x360 | |
| Lenovo Yoga 700-11ISK | |
| maximum AS SSD Seq Read Test (1GB) | |
| HP Pavilion x360 13-u102ng | |
| Dell Latitude 3189 | |
| HP Pavilion 11-k103ng x360 | |
| Lenovo Yoga 700-11ISK | |
| Networking | |
| iperf3 transmit AX12 | |
| Medion Akoya P3401T 2in1 | |
| Dell Latitude 3189 | |
| iperf3 receive AX12 | |
| Dell Latitude 3189 | |
| Medion Akoya P3401T 2in1 | |
| |||||||||||||||||||||||||
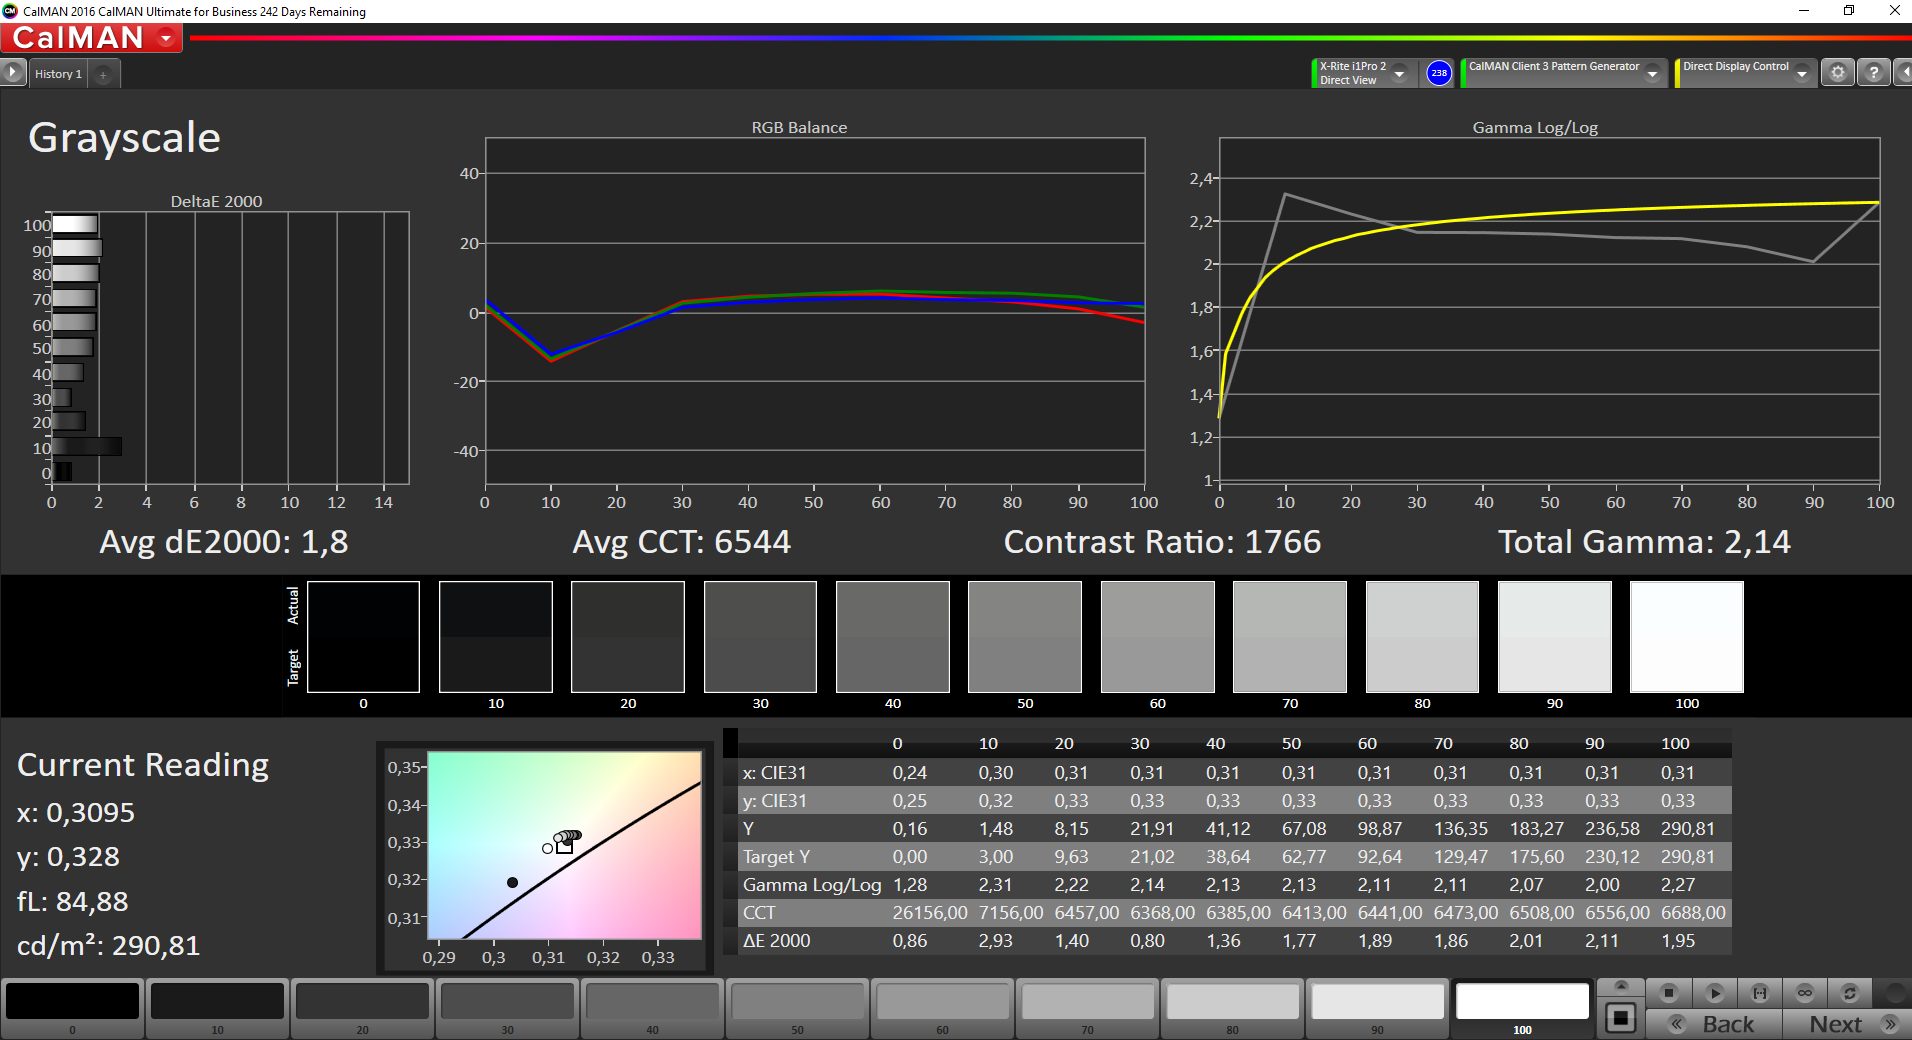
Brightness Distribution: 92 %
Center on Battery: 291 cd/m²
Contrast: 1819:1 (Black: 0.16 cd/m²)
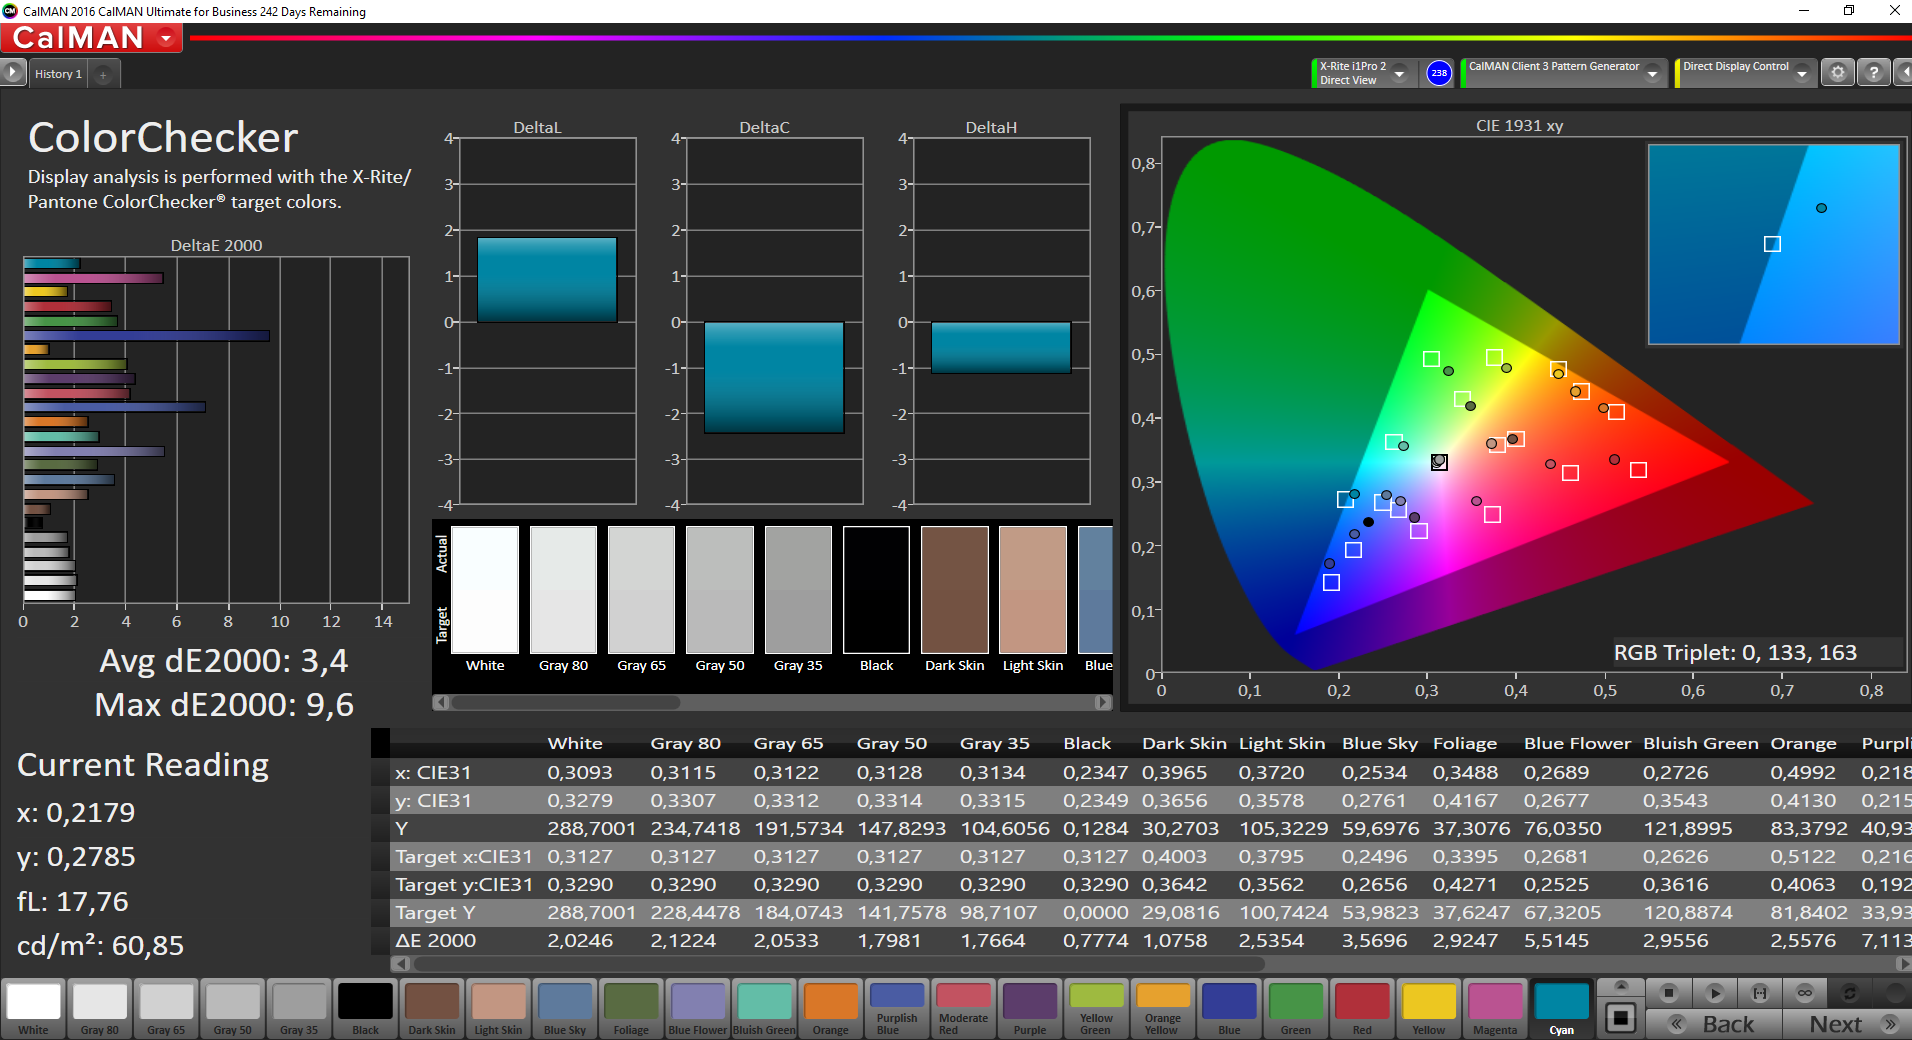
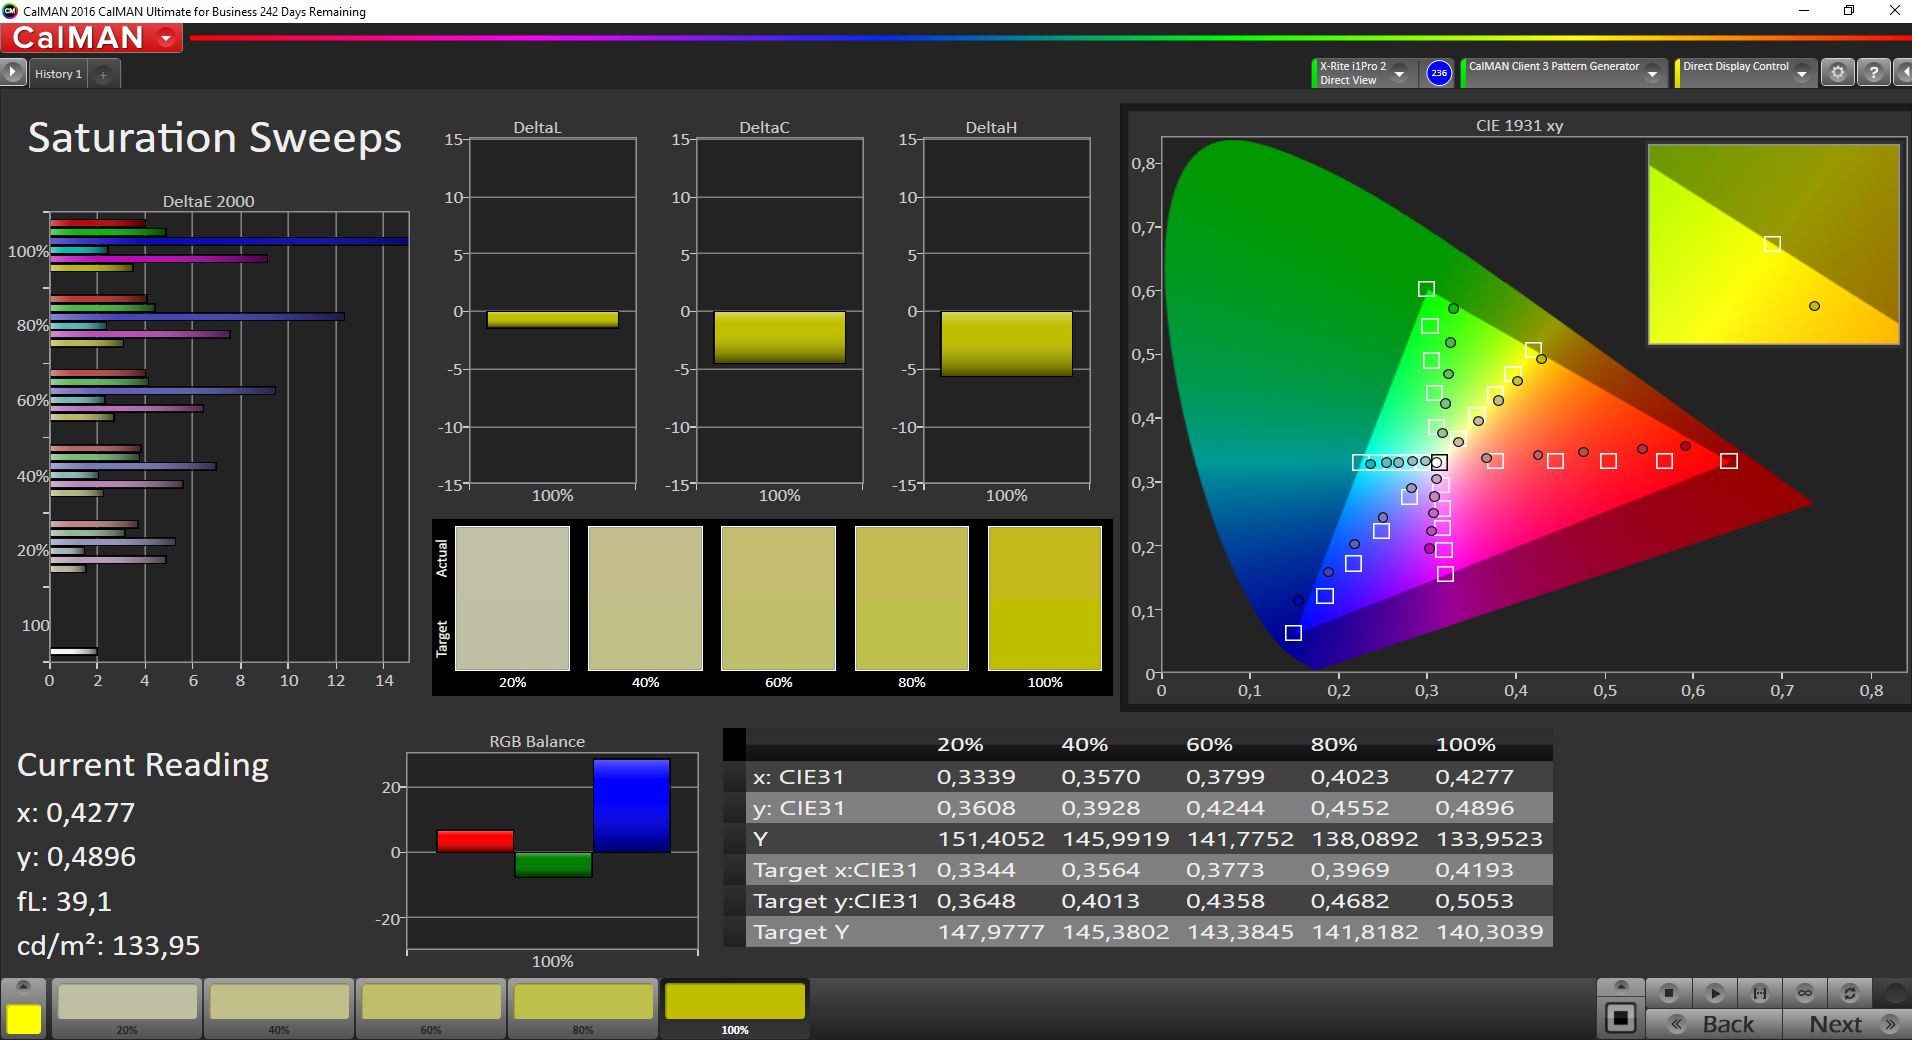
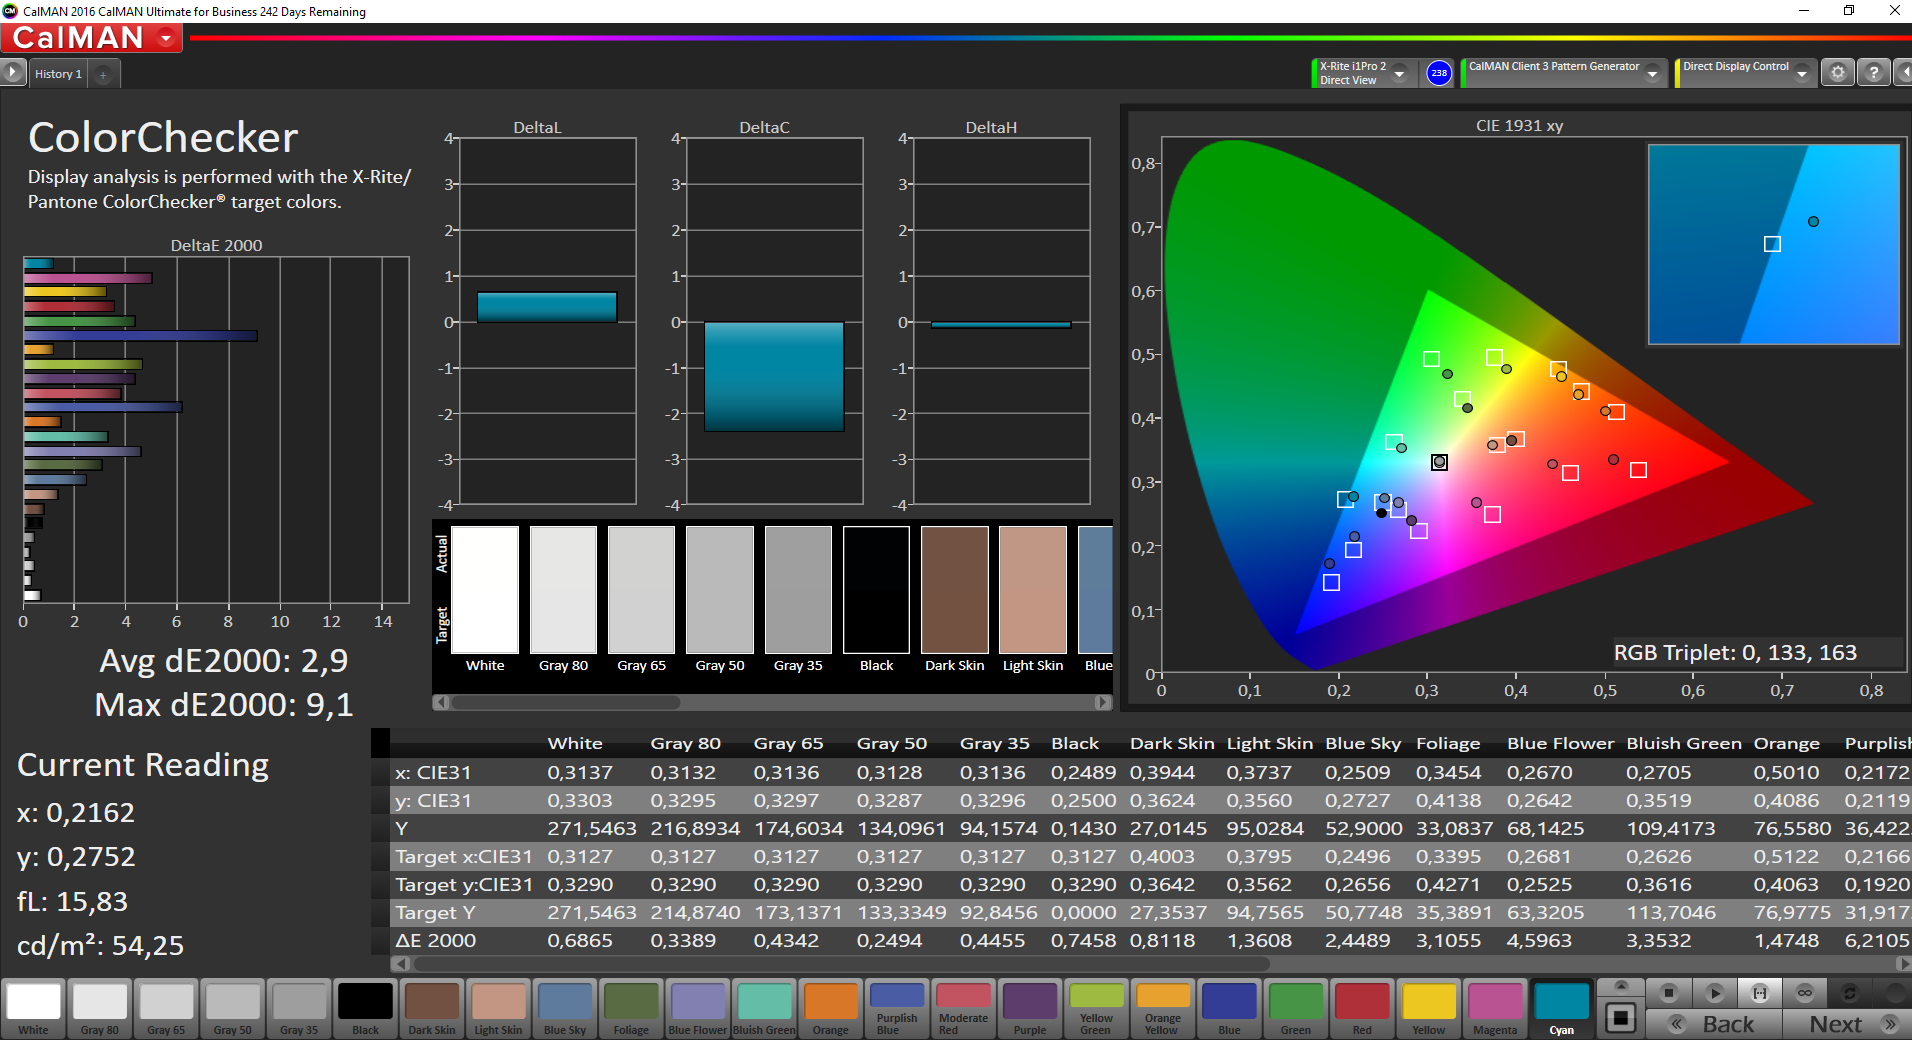
ΔE ColorChecker Calman: 3.4 | ∀{0.5-29.43 Ø4.71}
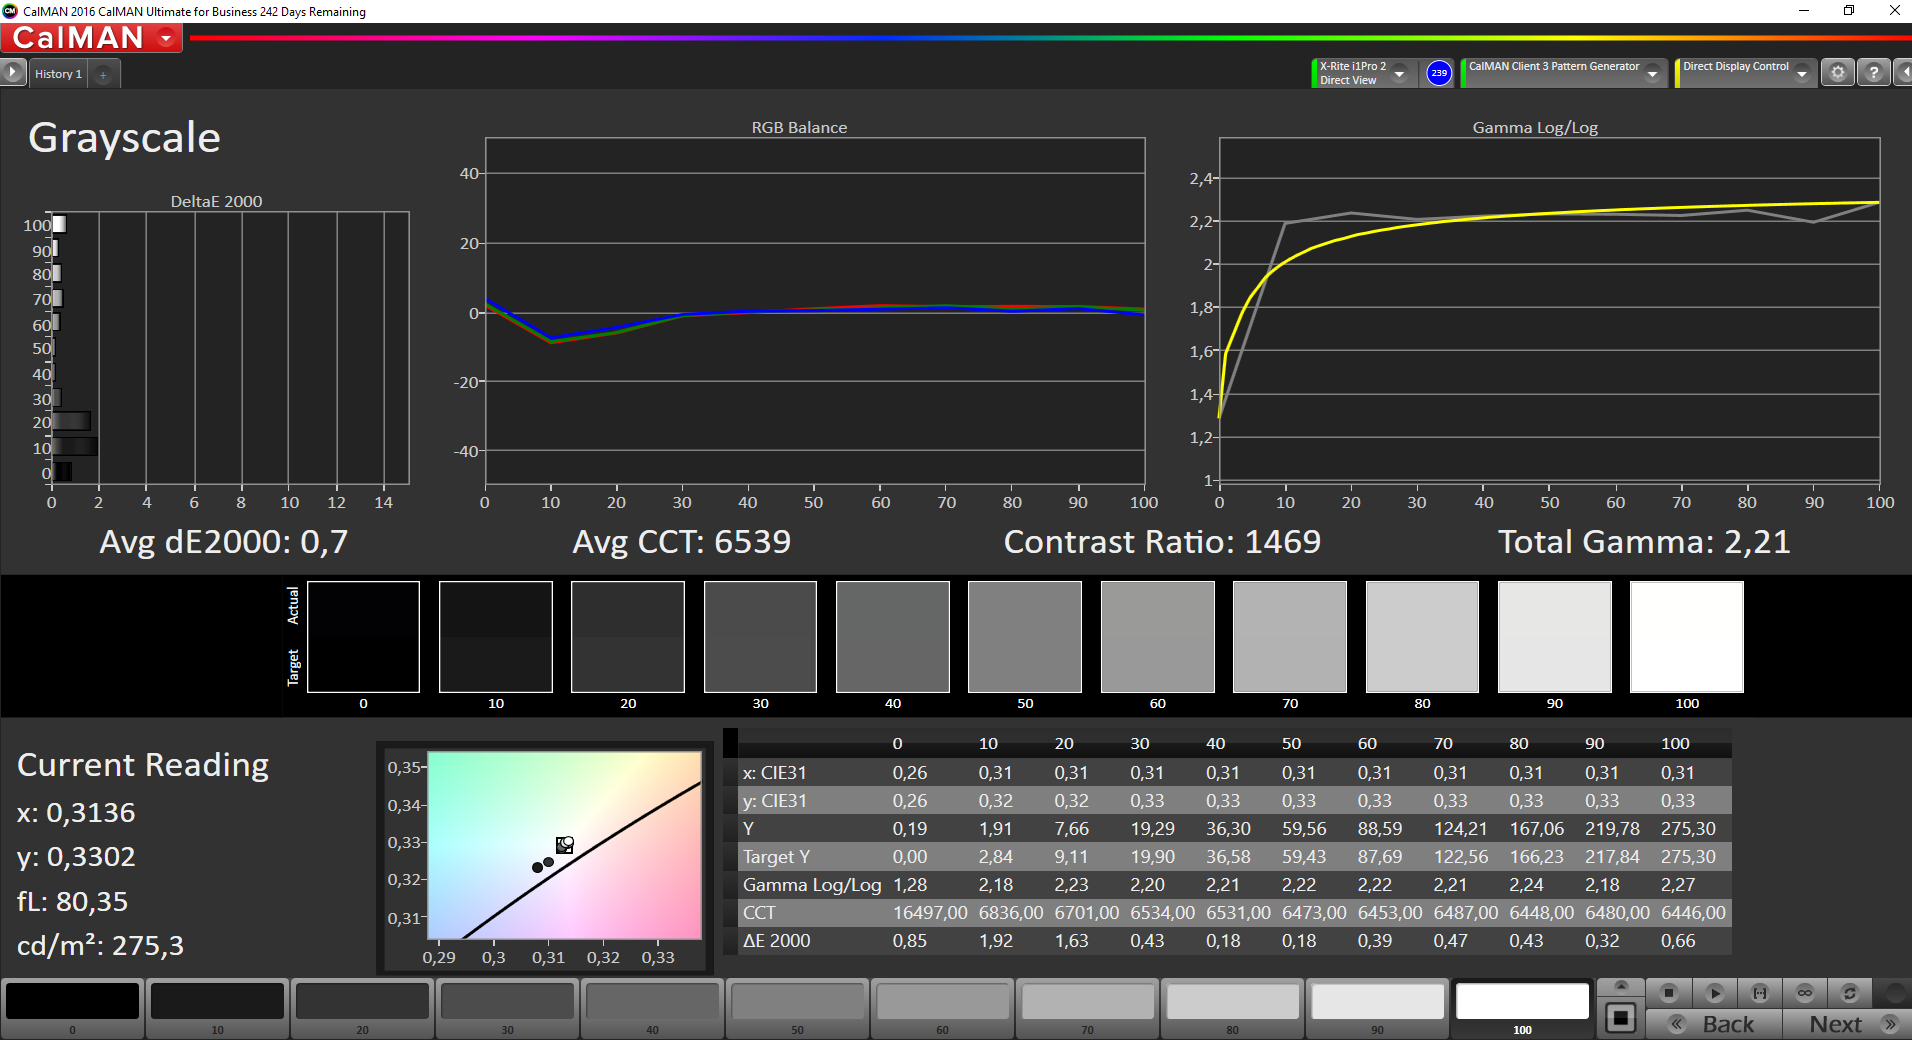
ΔE Greyscale Calman: 1.8 | ∀{0.09-98 Ø4.96}
67% sRGB (Argyll 1.6.3 3D)
42.8% AdobeRGB 1998 (Argyll 1.6.3 3D)
46.49% AdobeRGB 1998 (Argyll 3D)
67.3% sRGB (Argyll 3D)
44.96% Display P3 (Argyll 3D)
Gamma: 2.14
CCT: 6544 K
| Dell Latitude 3189 IPS, 1366x768, 11.6" | Medion Akoya P3401T 2in1 IPS, 1920x1080, 12.5" | HP Pavilion 11-k103ng x360 IPS, 1366x768, 11.6" | HP Pavilion x360 13-u102ng IPS, 1920x1080, 13.3" | Lenovo Yoga 700-11ISK IPS, 1920x1080, 11.6" | Acer Aspire Switch Alpha 12 SA5-271-56HM IPS, 2160x1440, 12" | |
|---|---|---|---|---|---|---|
| Display | -5% | 1% | -12% | -4% | 44% | |
| Display P3 Coverage (%) | 44.96 | 42.92 -5% | 45.21 1% | 39.43 -12% | 43.6 -3% | 65.5 46% |
| sRGB Coverage (%) | 67.3 | 64.3 -4% | 67.8 1% | 59.1 -12% | 64.2 -5% | 96.1 43% |
| AdobeRGB 1998 Coverage (%) | 46.49 | 44.35 -5% | 46.73 1% | 40.76 -12% | 45.17 -3% | 66.9 44% |
| Response Times | 7% | 39% | 12% | 40% | 19% | |
| Response Time Grey 50% / Grey 80% * (ms) | 40 ? | 40 ? -0% | 18.8 ? 53% | 38 ? 5% | 23 ? 43% | 20 ? 50% |
| Response Time Black / White * (ms) | 30.4 ? | 26 ? 14% | 23.2 ? 24% | 25 ? 18% | 19 ? 37% | 34 ? -12% |
| PWM Frequency (Hz) | 50 ? | 1000 ? | ||||
| Screen | -27% | -13% | -44% | -76% | -47% | |
| Brightness middle (cd/m²) | 291 | 392 35% | 194 -33% | 277 -5% | 300 3% | 345 19% |
| Brightness (cd/m²) | 284 | 392 38% | 186 -35% | 263 -7% | 284 0% | 328 15% |
| Brightness Distribution (%) | 92 | 93 1% | 86 -7% | 88 -4% | 82 -11% | 91 -1% |
| Black Level * (cd/m²) | 0.16 | 0.33 -106% | 0.22 -38% | 0.31 -94% | 0.33 -106% | 0.38 -138% |
| Contrast (:1) | 1819 | 1188 -35% | 882 -52% | 894 -51% | 909 -50% | 908 -50% |
| Colorchecker dE 2000 * | 3.4 | 4.99 -47% | 3.06 10% | 5.57 -64% | 7.87 -131% | 8.4 -147% |
| Colorchecker dE 2000 max. * | 9.6 | 9.08 5% | 8.81 8% | 13.6 -42% | 17.75 -85% | 11.9 -24% |
| Greyscale dE 2000 * | 1.8 | 4.53 -152% | 1.42 21% | 4.56 -153% | 8.45 -369% | 4.3 -139% |
| Gamma | 2.14 103% | 2.46 89% | 2.34 94% | 2.28 96% | 2.42 91% | 2.63 84% |
| CCT | 6544 99% | 7394 88% | 6432 101% | 6648 98% | 6856 95% | 7368 88% |
| Color Space (Percent of AdobeRGB 1998) (%) | 42.8 | 41 -4% | 42.98 0% | 38 -11% | 41 -4% | 62 45% |
| Color Space (Percent of sRGB) (%) | 67 | 64 -4% | 67.56 1% | 59 -12% | 64 -4% | |
| Total Average (Program / Settings) | -8% /
-18% | 9% /
-3% | -15% /
-30% | -13% /
-46% | 5% /
-18% |
* ... smaller is better

Display Response Times
| ↔ Response Time Black to White | ||
|---|---|---|
| 30.4 ms ... rise ↗ and fall ↘ combined | ↗ 16.4 ms rise | 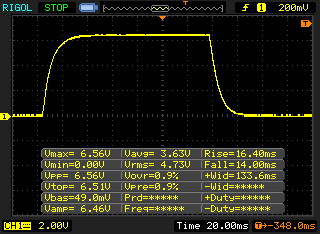 |
| ↘ 14 ms fall | ||
| The screen shows slow response rates in our tests and will be unsatisfactory for gamers. In comparison, all tested devices range from 0.1 (minimum) to 240 (maximum) ms. » 82 % of all devices are better. This means that the measured response time is worse than the average of all tested devices (19.8 ms). | ||
| ↔ Response Time 50% Grey to 80% Grey | ||
| 40 ms ... rise ↗ and fall ↘ combined | ↗ 18.8 ms rise | 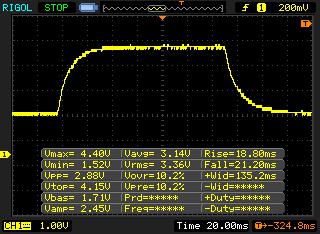 |
| ↘ 21.2 ms fall | ||
| The screen shows slow response rates in our tests and will be unsatisfactory for gamers. In comparison, all tested devices range from 0.165 (minimum) to 636 (maximum) ms. » 61 % of all devices are better. This means that the measured response time is worse than the average of all tested devices (31 ms). | ||
Screen Flickering / PWM (Pulse-Width Modulation)
| Screen flickering / PWM not detected | 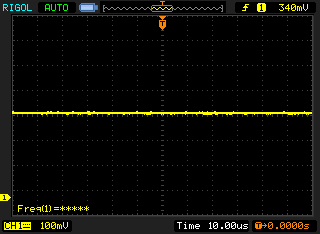 | ||
In comparison: 52 % of all tested devices do not use PWM to dim the display. If PWM was detected, an average of 7754 (minimum: 5 - maximum: 343500) Hz was measured. | |||
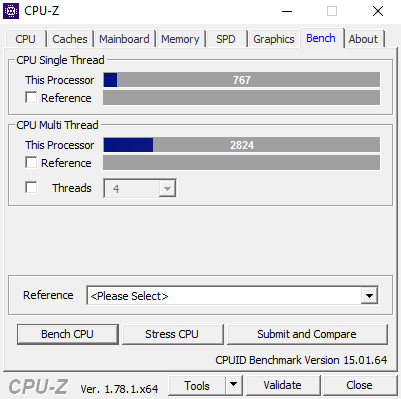
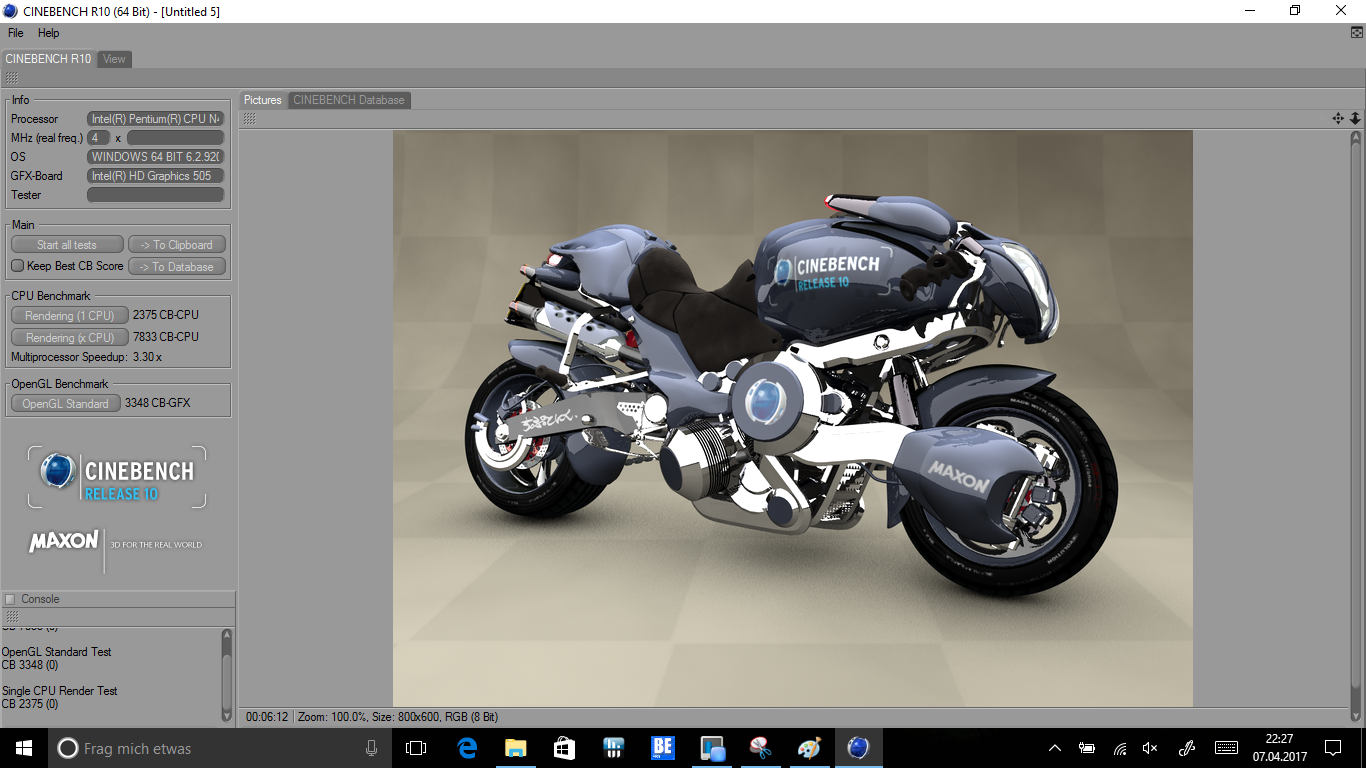
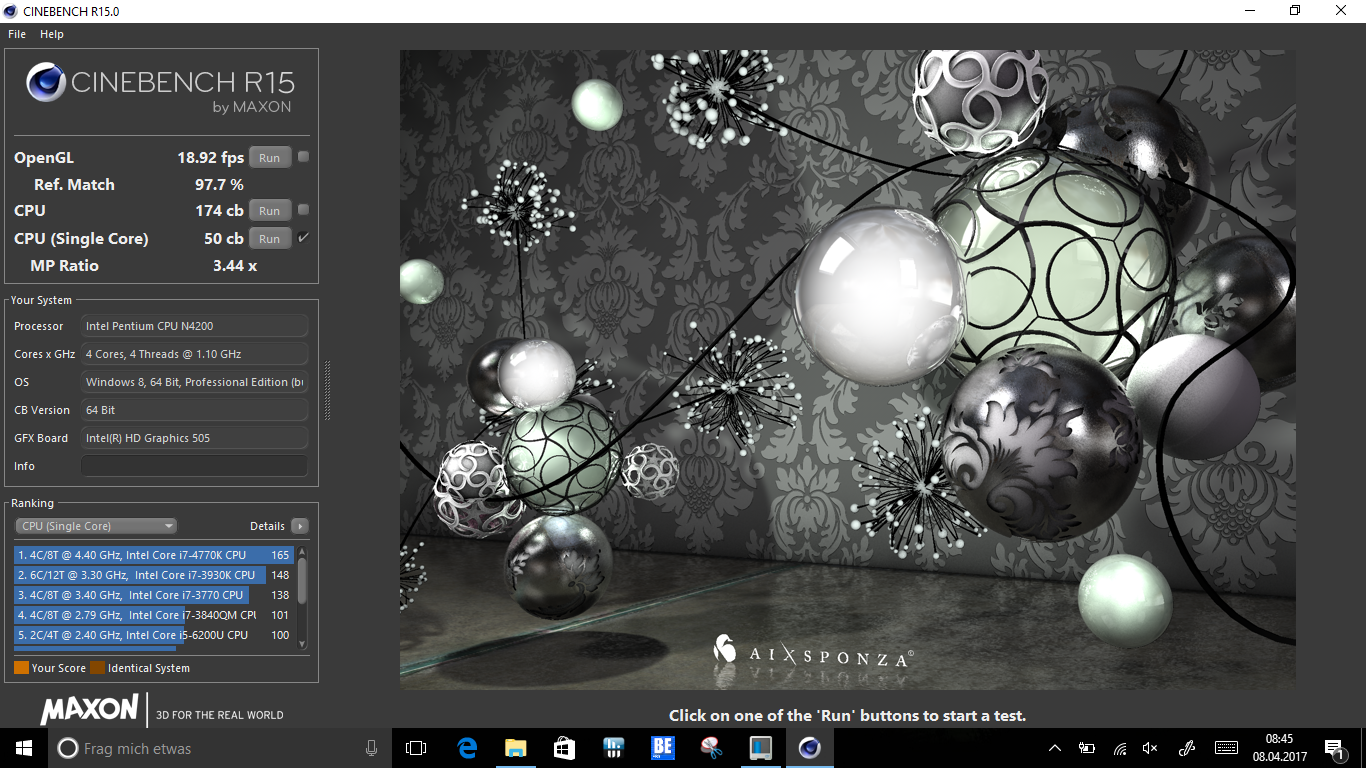
| Cinebench R15 | |
| CPU Single 64Bit | |
| HP Pavilion x360 13-u102ng | |
| Acer Aspire Switch Alpha 12 SA5-271-56HM | |
| Medion Akoya P3401T 2in1 | |
| Lenovo Yoga 700-11ISK | |
| Dell Latitude 3189 | |
| HP Pavilion 11-k103ng x360 | |
| CPU Multi 64Bit | |
| HP Pavilion x360 13-u102ng | |
| Acer Aspire Switch Alpha 12 SA5-271-56HM | |
| Medion Akoya P3401T 2in1 | |
| Dell Latitude 3189 | |
| Lenovo Yoga 700-11ISK | |
| HP Pavilion 11-k103ng x360 | |
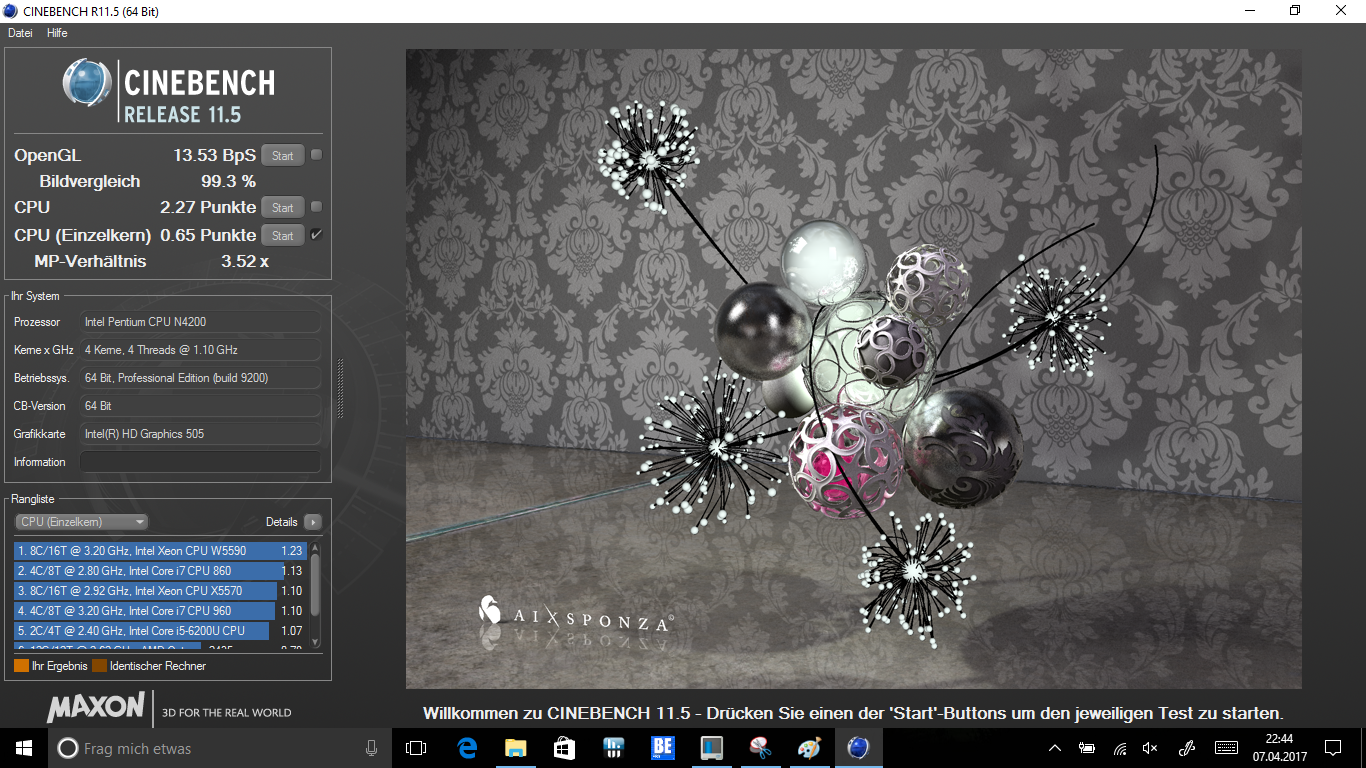
| Cinebench R11.5 | |
| CPU Single 64Bit | |
| HP Pavilion x360 13-u102ng | |
| Dell Latitude 3189 | |
| CPU Multi 64Bit | |
| HP Pavilion x360 13-u102ng | |
| Dell Latitude 3189 | |
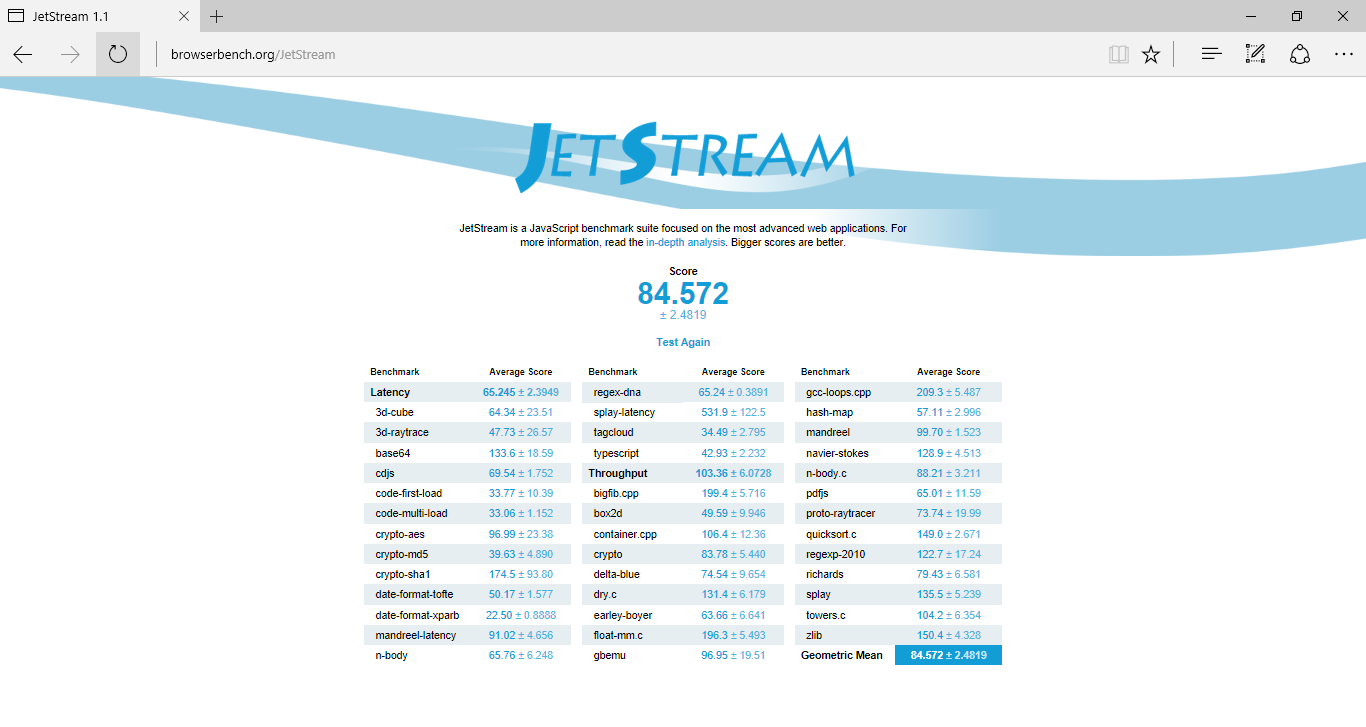
| JetStream 1.1 - 1.1 Total | |
| HP Pavilion x360 13-u102ng | |
| Medion Akoya P3401T 2in1 | |
| Acer Aspire Switch Alpha 12 SA5-271-56HM | |
| Lenovo Yoga 700-11ISK | |
| Dell Latitude 3189 | |
| HP Pavilion 11-k103ng x360 | |
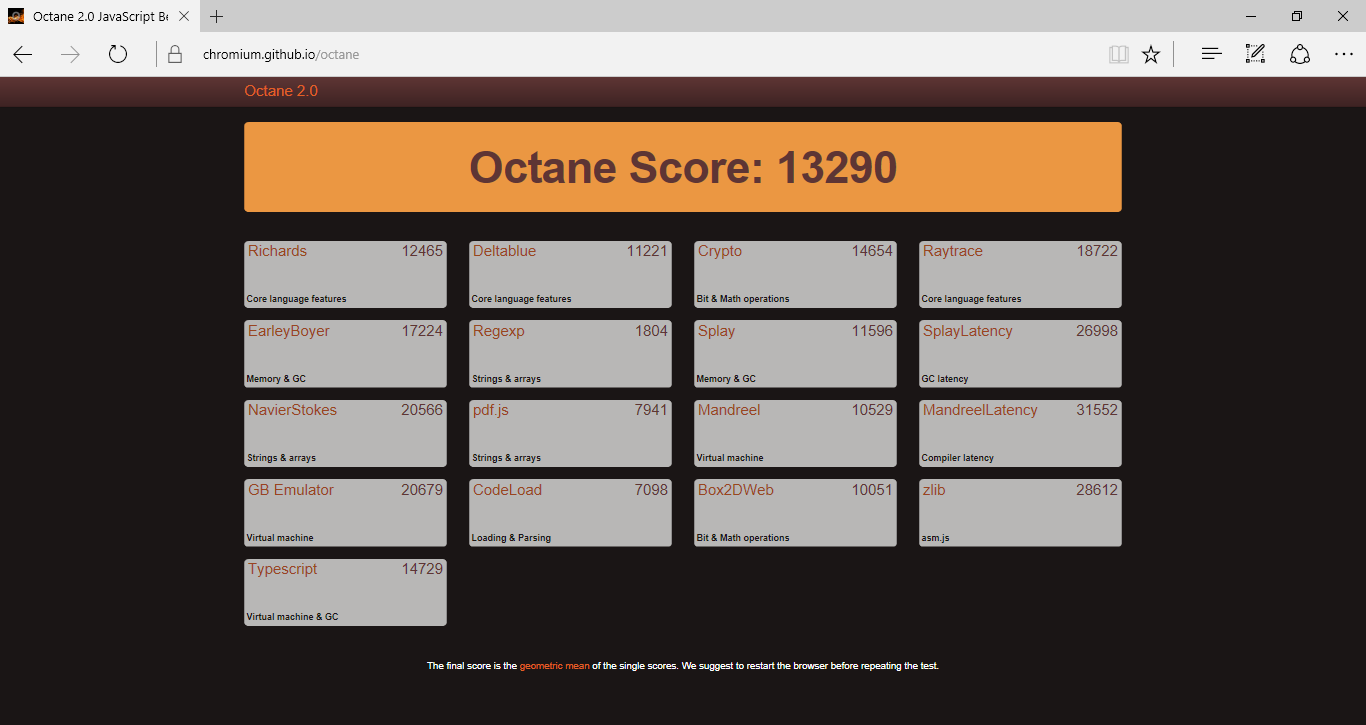
| Octane V2 - Total Score | |
| HP Pavilion x360 13-u102ng | |
| Acer Aspire Switch Alpha 12 SA5-271-56HM | |
| Lenovo Yoga 700-11ISK | |
| Dell Latitude 3189 | |
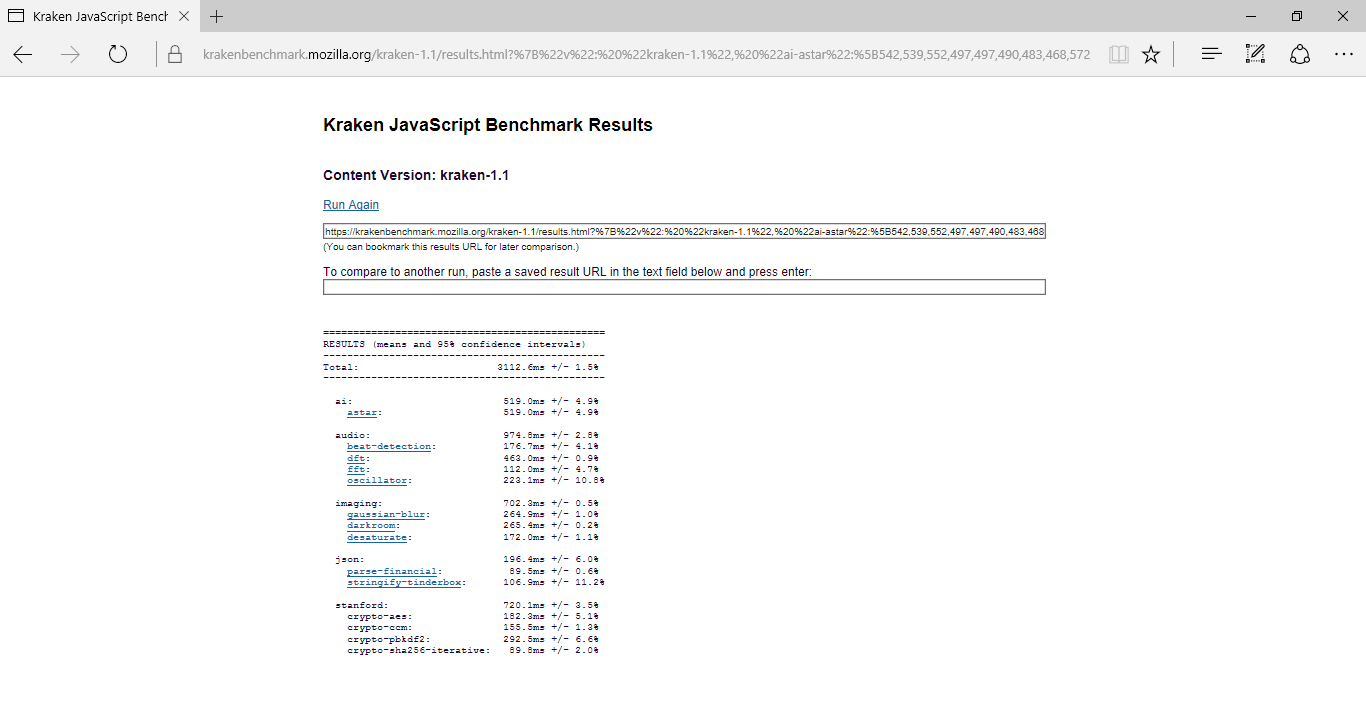
| Mozilla Kraken 1.1 - Total | |
| Dell Latitude 3189 | |
| Lenovo Yoga 700-11ISK | |
| Acer Aspire Switch Alpha 12 SA5-271-56HM | |
| HP Pavilion x360 13-u102ng | |
* ... smaller is better
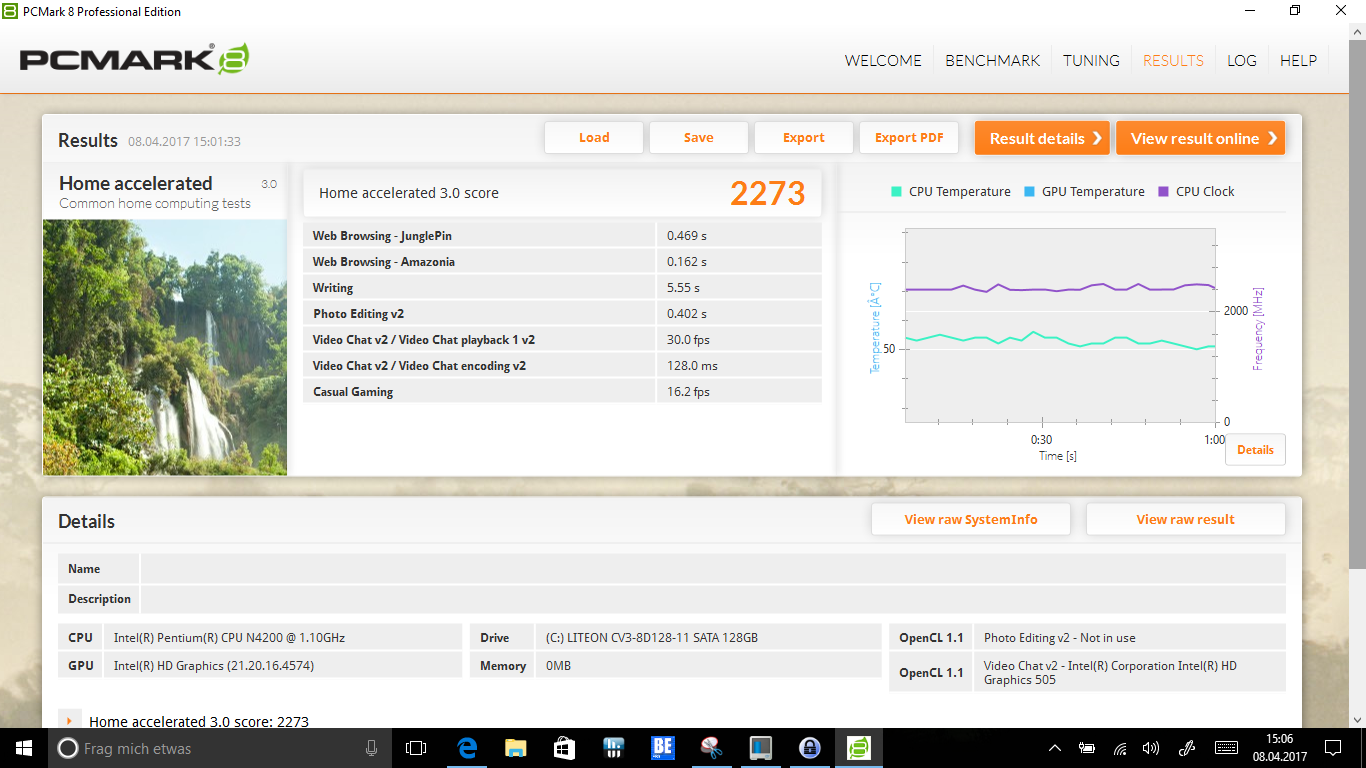
| PCMark 8 | |
| Home Score Accelerated v2 | |
| Acer Aspire Switch Alpha 12 SA5-271-56HM | |
| HP Pavilion x360 13-u102ng | |
| Medion Akoya P3401T 2in1 | |
| Lenovo Yoga 700-11ISK | |
| Dell Latitude 3189 | |
| HP Pavilion 11-k103ng x360 | |
| Work Score Accelerated v2 | |
| HP Pavilion x360 13-u102ng | |
| Acer Aspire Switch Alpha 12 SA5-271-56HM | |
| Lenovo Yoga 700-11ISK | |
| Dell Latitude 3189 | |
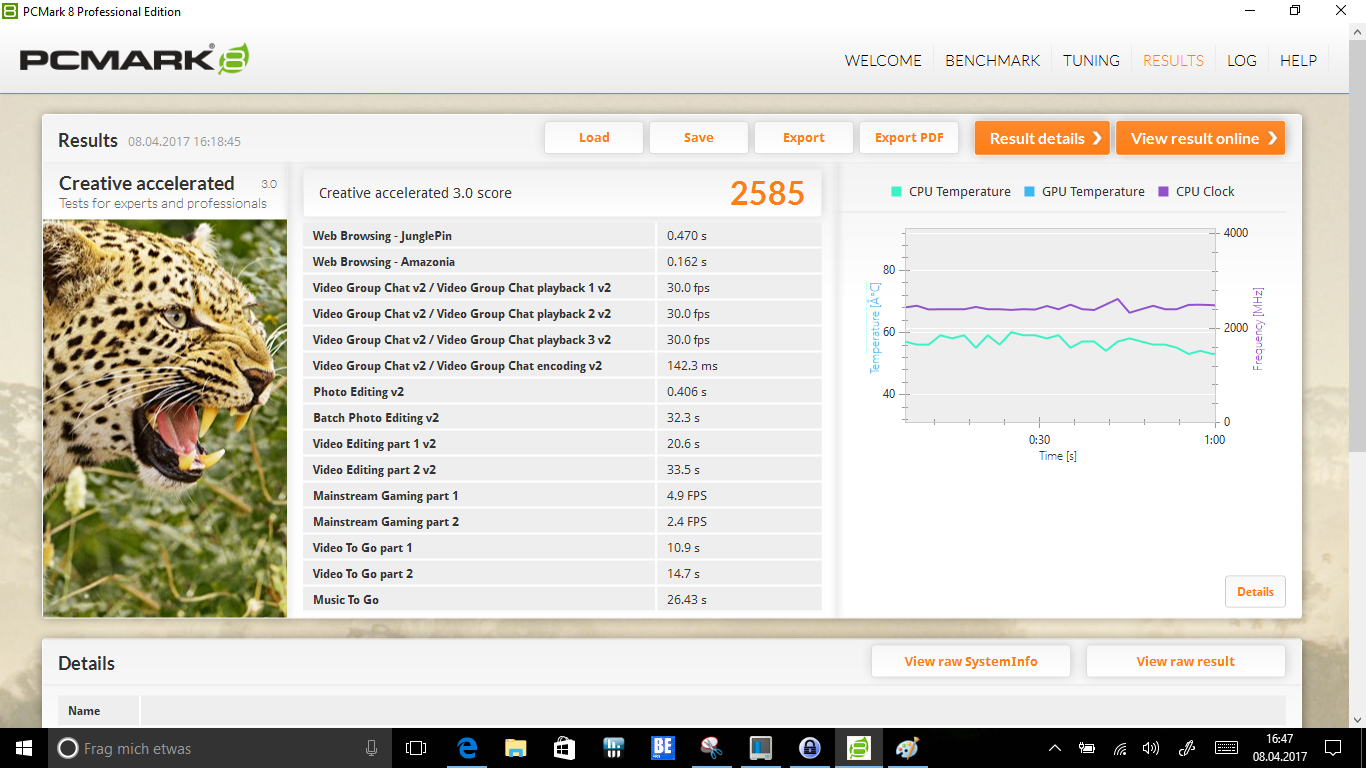
| Creative Score Accelerated v2 | |
| HP Pavilion x360 13-u102ng | |
| Lenovo Yoga 700-11ISK | |
| Dell Latitude 3189 | |
| PCMark 7 | |
| Score | |
| Dell Latitude 3189 | |
| HP Pavilion x360 13-u102ng | |
| Productivity | |
| Dell Latitude 3189 | |
| HP Pavilion x360 13-u102ng | |
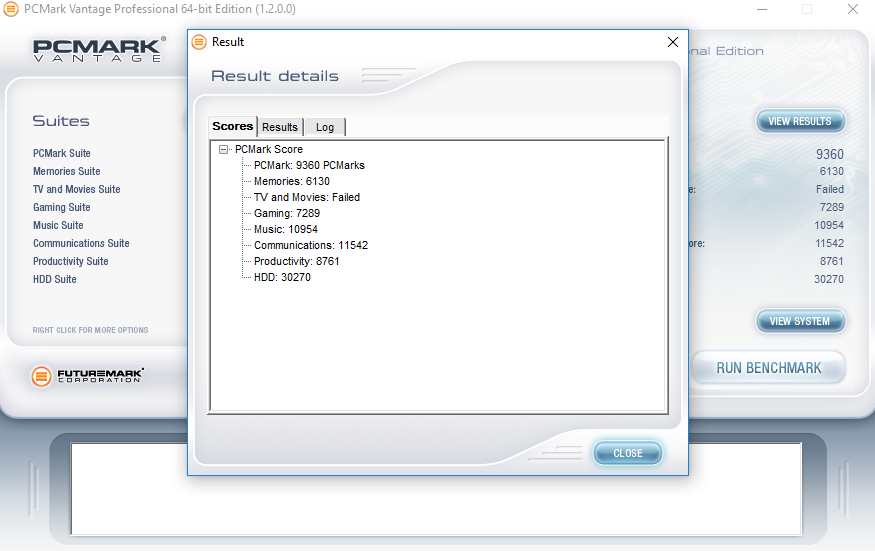
| PCMark Vantage Result | 9360 points | |
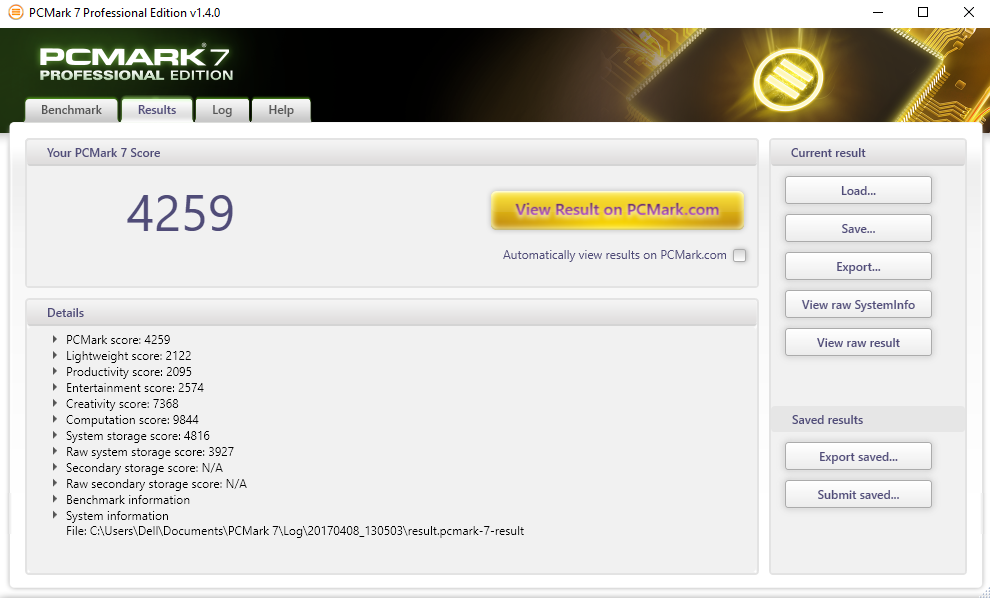
| PCMark 7 Score | 4259 points | |
| PCMark 8 Home Score Accelerated v2 | 2273 points | |
| PCMark 8 Creative Score Accelerated v2 | 2585 points | |
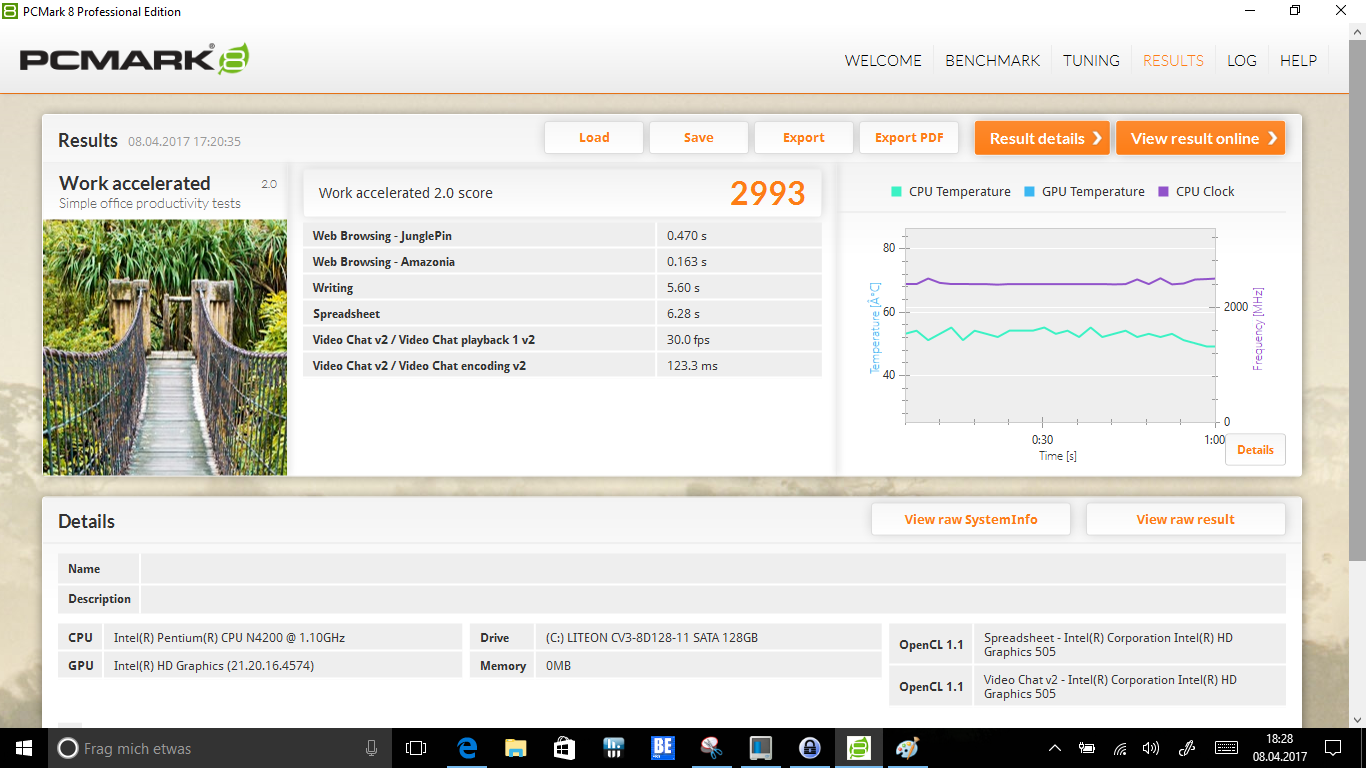
| PCMark 8 Work Score Accelerated v2 | 2993 points | |
Help | ||
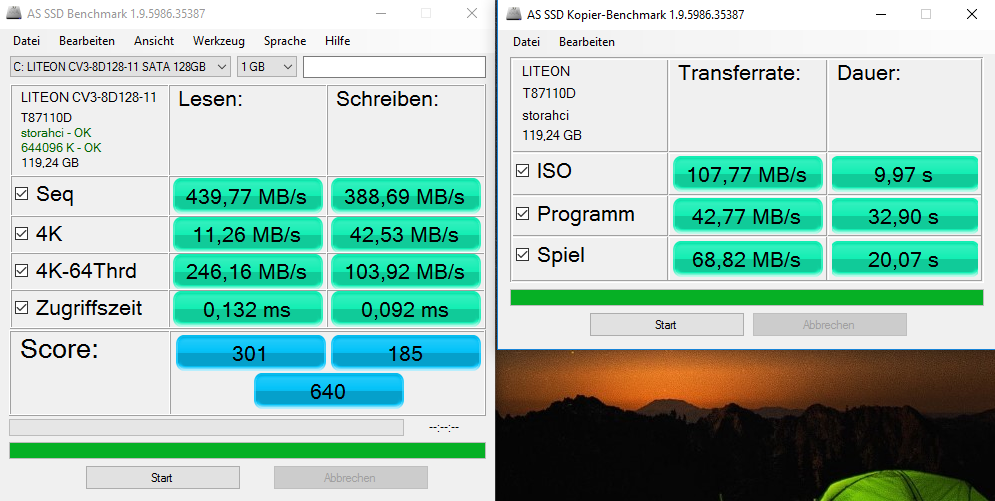
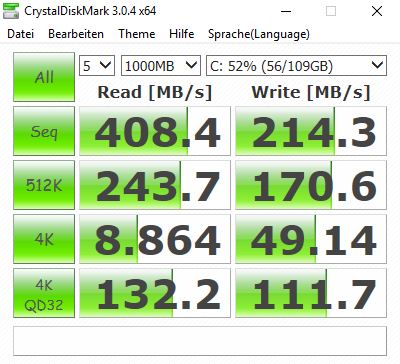
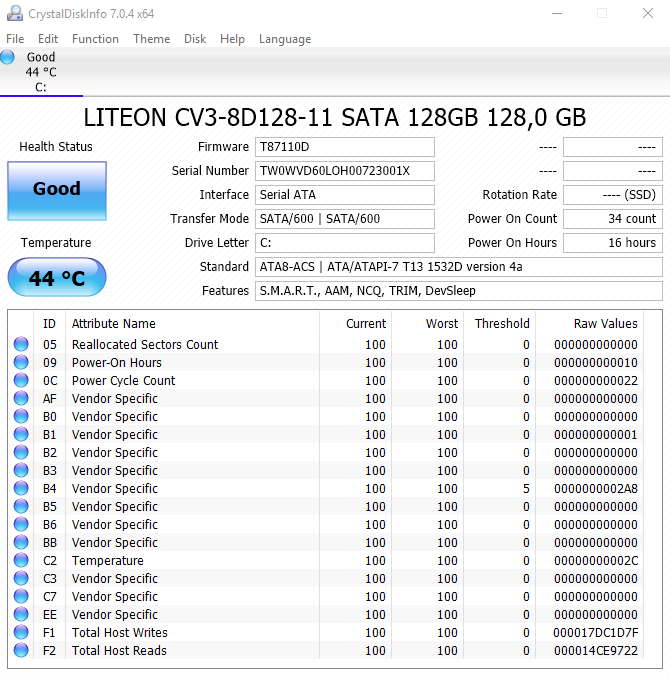
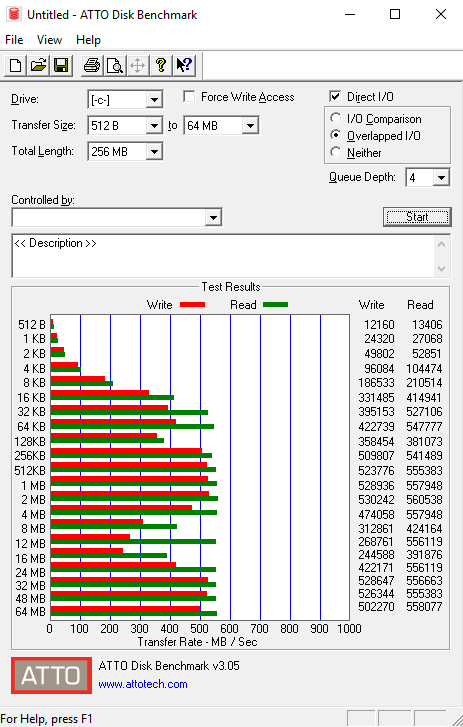
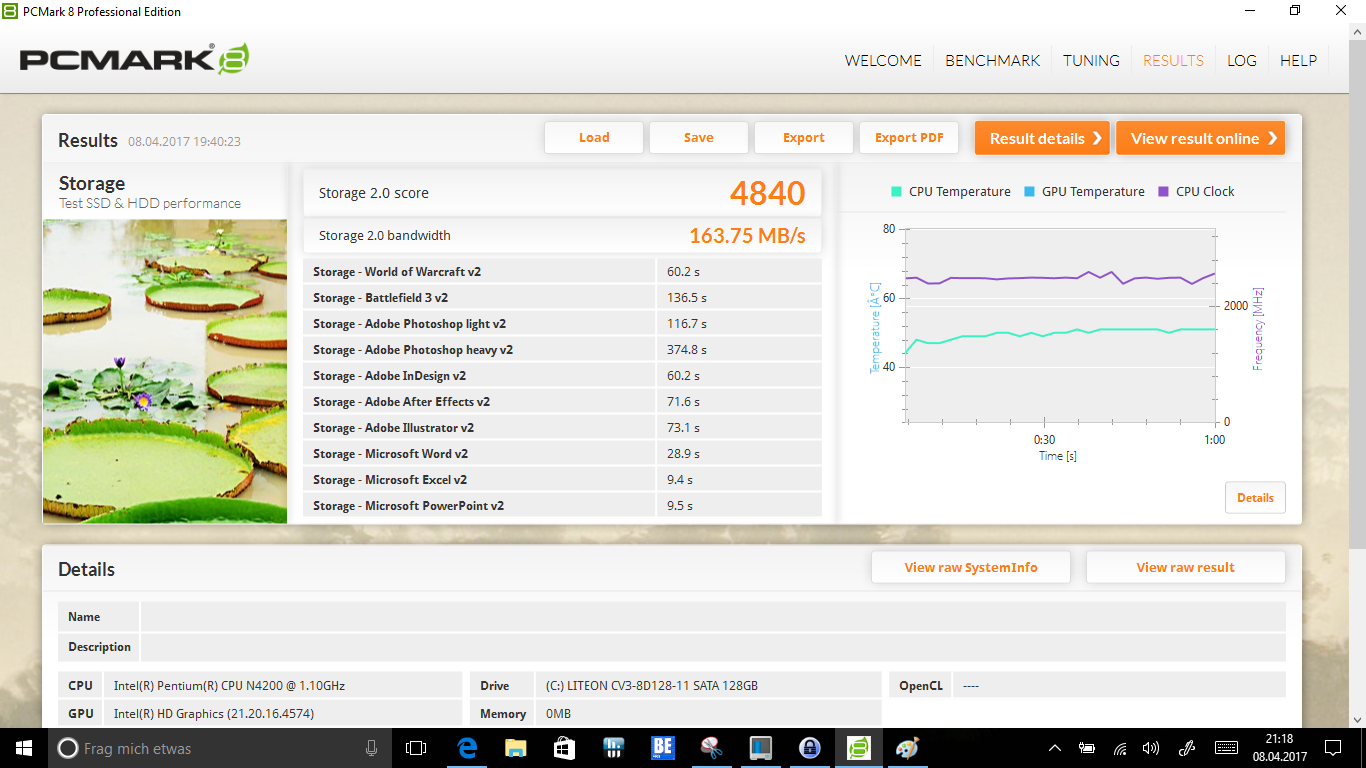
| Dell Latitude 3189 Liteonit CV3-8D128 | Medion Akoya P3401T 2in1 | HP Pavilion 11-k103ng x360 Hitachi Travelstar Z5K500 HTS545050A7E680 | HP Pavilion x360 13-u102ng HGST Travelstar 5K1000 HTS541010A7E630 | Lenovo Yoga 700-11ISK Samsung SSD PM871 MZNLN256HCHP | Acer Aspire Switch Alpha 12 SA5-271-56HM Kingston RBU-SNS8152S3256GG2 | |
|---|---|---|---|---|---|---|
| CrystalDiskMark 3.0 | 37% | -85% | -87% | 97% | 70% | |
| Read Seq (MB/s) | 408.4 | 427.6 5% | 106 -74% | 104.8 -74% | 456.2 12% | 518 27% |
| Write Seq (MB/s) | 214.3 | 286.5 34% | 106.1 -50% | 91 -58% | 302.8 41% | 199.9 -7% |
| Read 512 (MB/s) | 243.7 | 324.1 33% | 33.53 -86% | 20.67 -92% | 385.7 58% | 374.9 54% |
| Write 512 (MB/s) | 170.6 | 121.8 -29% | 39.03 -77% | 45.05 -74% | 301.9 77% | 201 18% |
| Read 4k (MB/s) | 8.864 | 28.11 217% | 0.407 -95% | 0.215 -98% | 31.27 253% | 29.3 231% |
| Write 4k (MB/s) | 49.14 | 41.68 -15% | 1.026 -98% | 1.037 -98% | 73.6 50% | 76.8 56% |
| Read 4k QD32 (MB/s) | 132.2 | 249.2 89% | 0.898 -99% | 0.968 -99% | 324.2 145% | 272 106% |
| Write 4k QD32 (MB/s) | 111.7 | 68.8 -38% | 1.003 -99% | 1.09 -99% | 268.6 140% | 197.1 76% |

| 3DMark | |
| 1280x720 Cloud Gate Standard Graphics | |
| Acer Aspire Switch Alpha 12 SA5-271-56HM | |
| HP Pavilion x360 13-u102ng | |
| Dell Latitude 3189 | |
| Lenovo Yoga 700-11ISK | |
| 1920x1080 Fire Strike Graphics | |
| HP Pavilion x360 13-u102ng | |
| Dell Latitude 3189 | |
| Lenovo Yoga 700-11ISK | |
| 3DMark 11 - 1280x720 Performance GPU | |
| Acer Aspire Switch Alpha 12 SA5-271-56HM | |
| HP Pavilion x360 13-u102ng | |
| Medion Akoya P3401T 2in1 | |
| Lenovo Yoga 700-11ISK | |
| Dell Latitude 3189 | |
| HP Pavilion 11-k103ng x360 | |
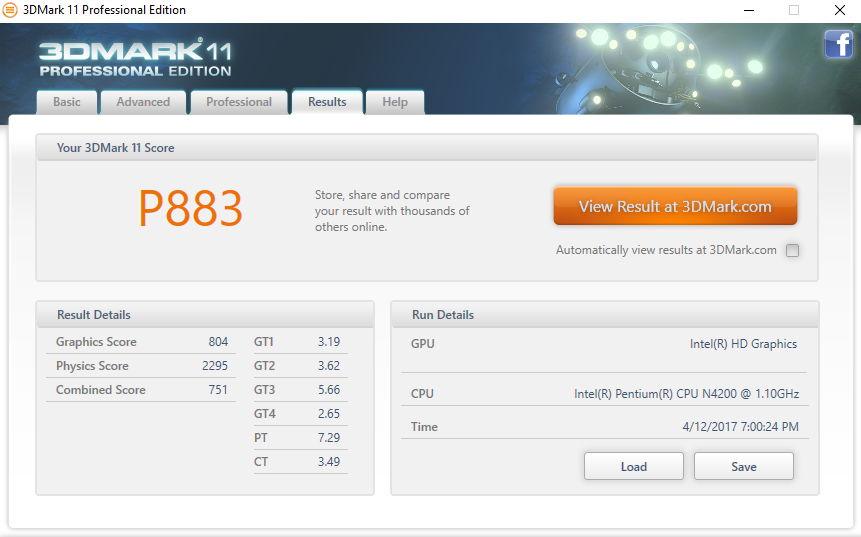
| 3DMark 11 Performance | 883 points | |
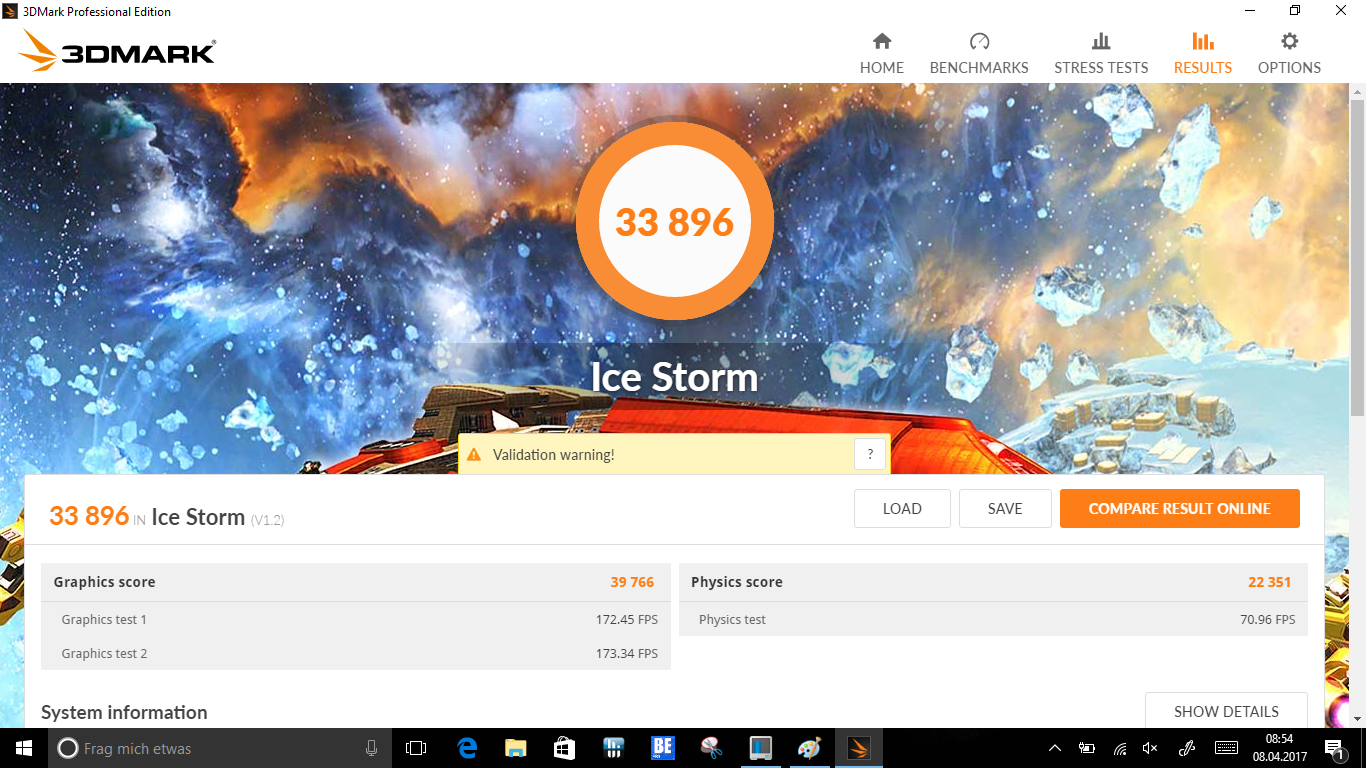
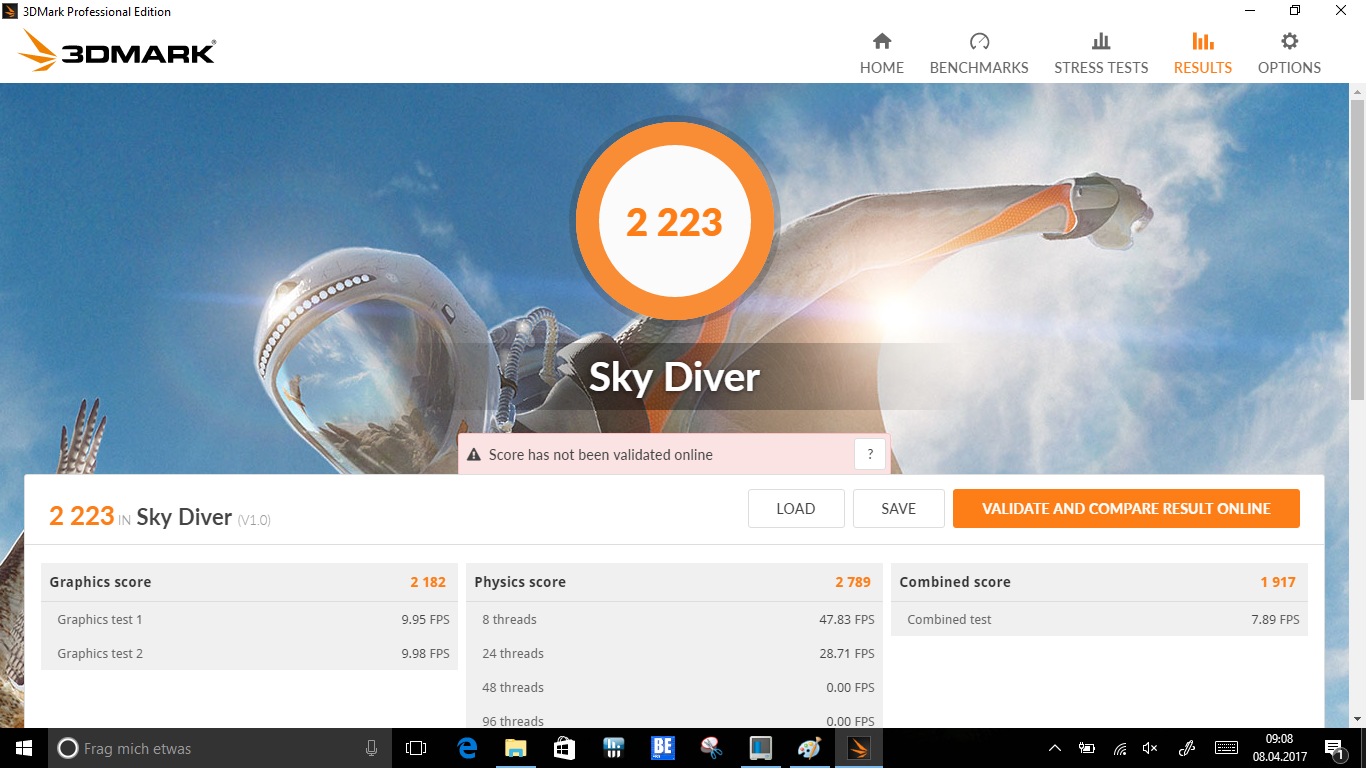
| 3DMark Ice Storm Standard Score | 33896 points | |
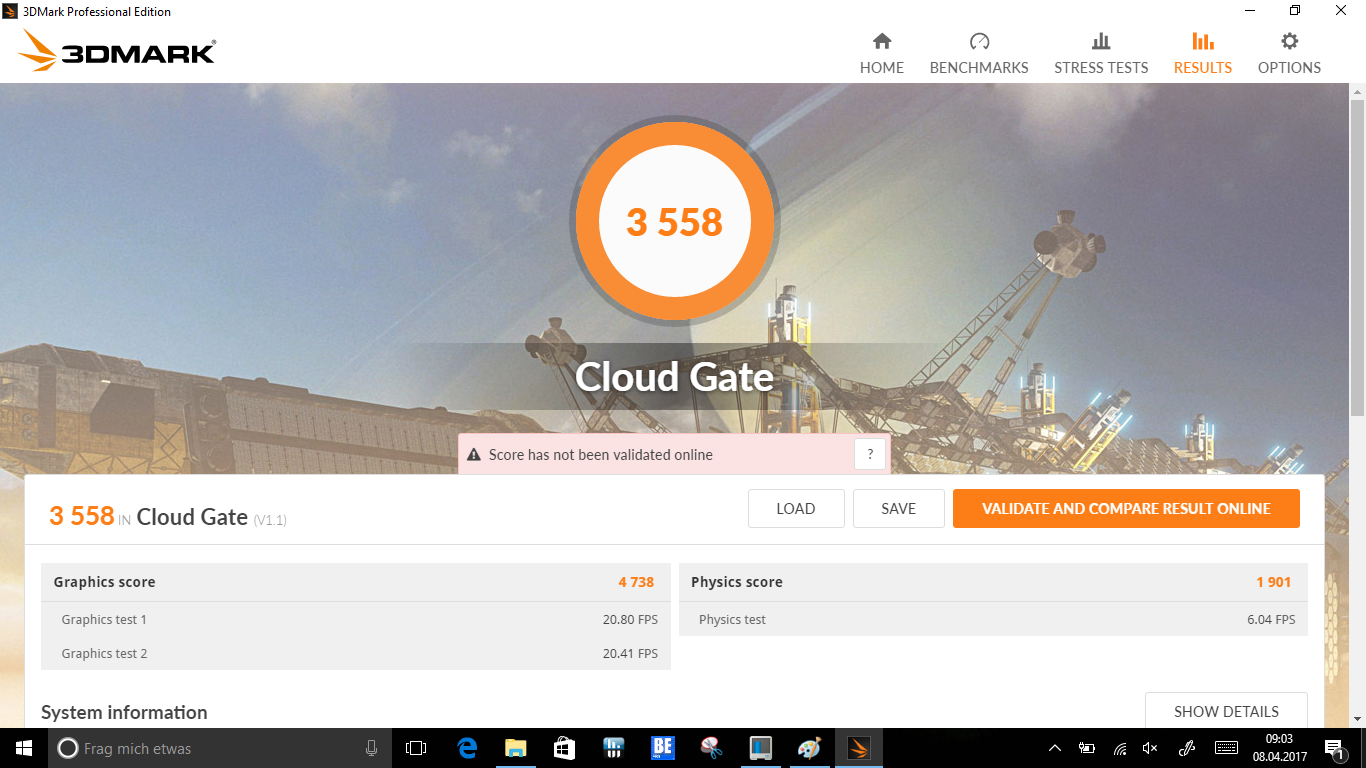
| 3DMark Cloud Gate Standard Score | 3558 points | |
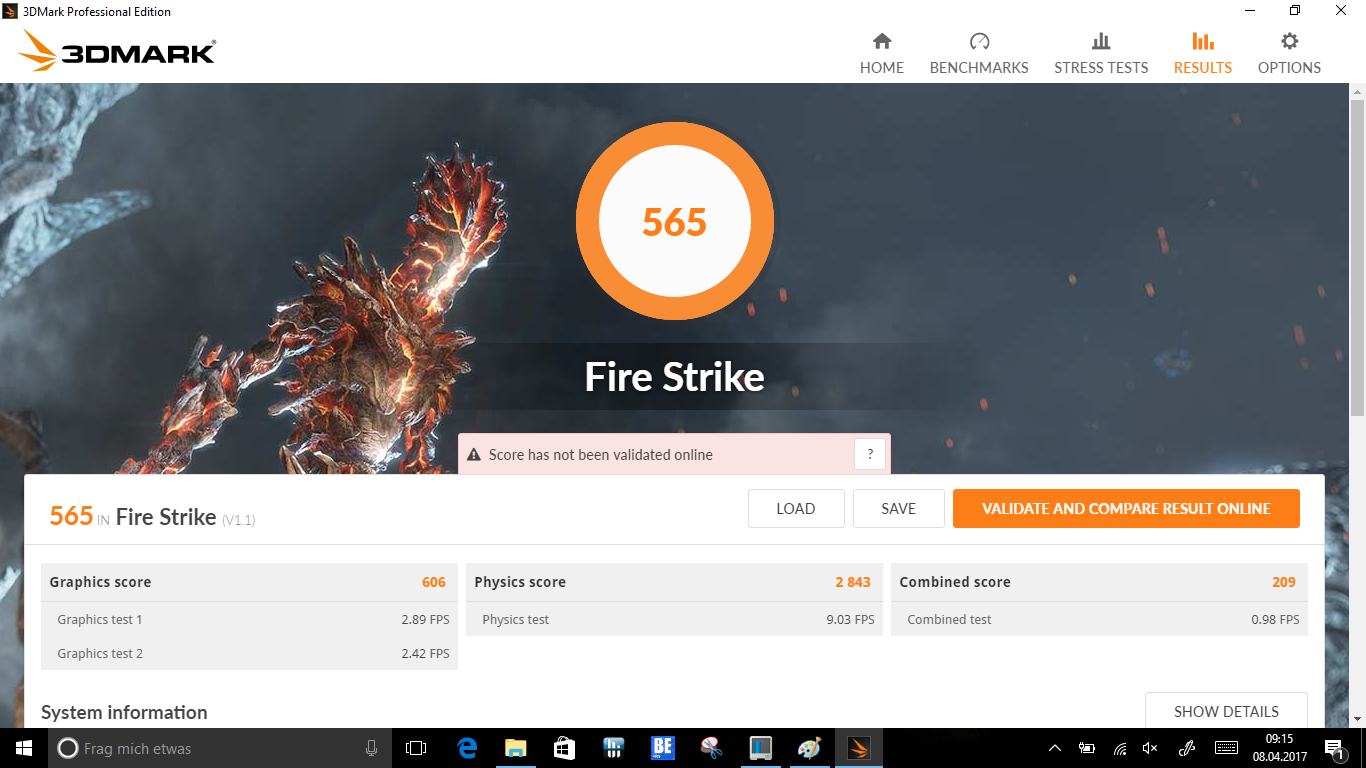
| 3DMark Fire Strike Score | 565 points | |
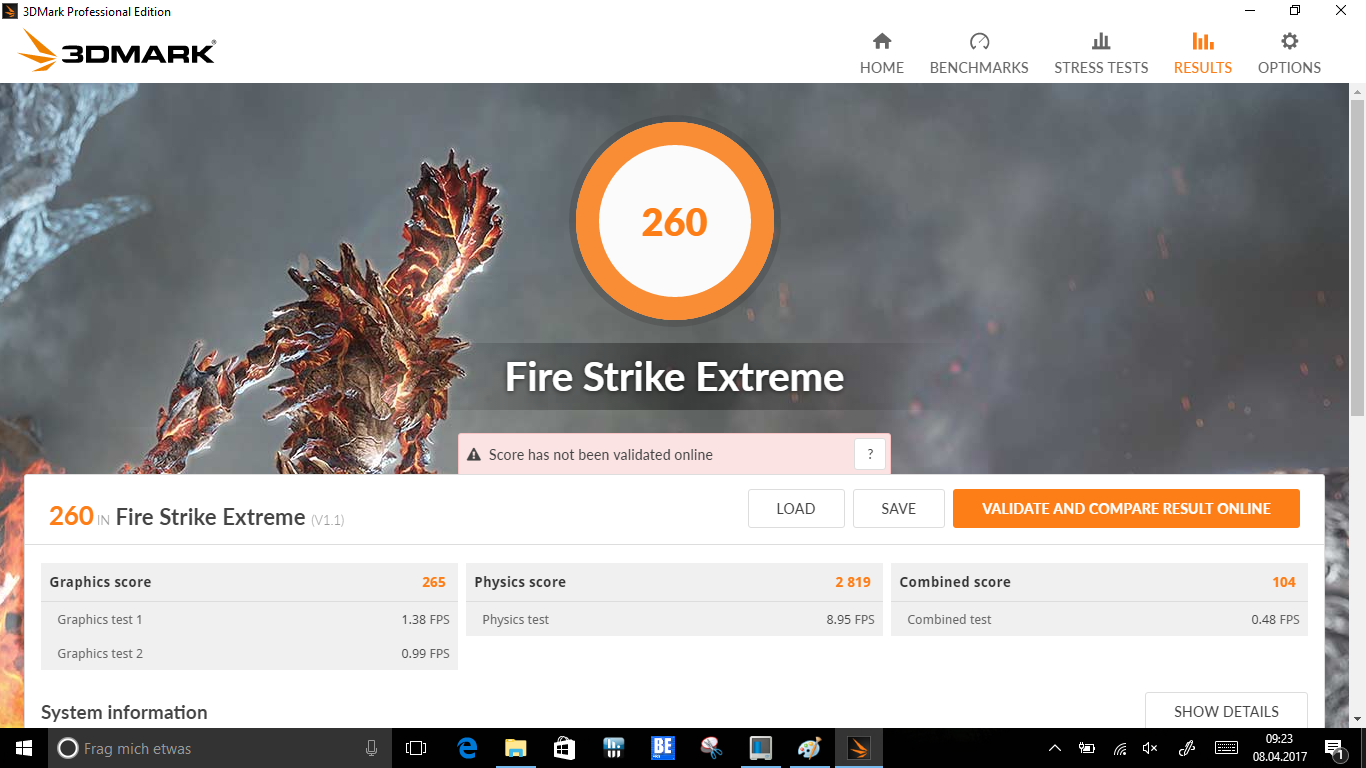
| 3DMark Fire Strike Extreme Score | 260 points | |
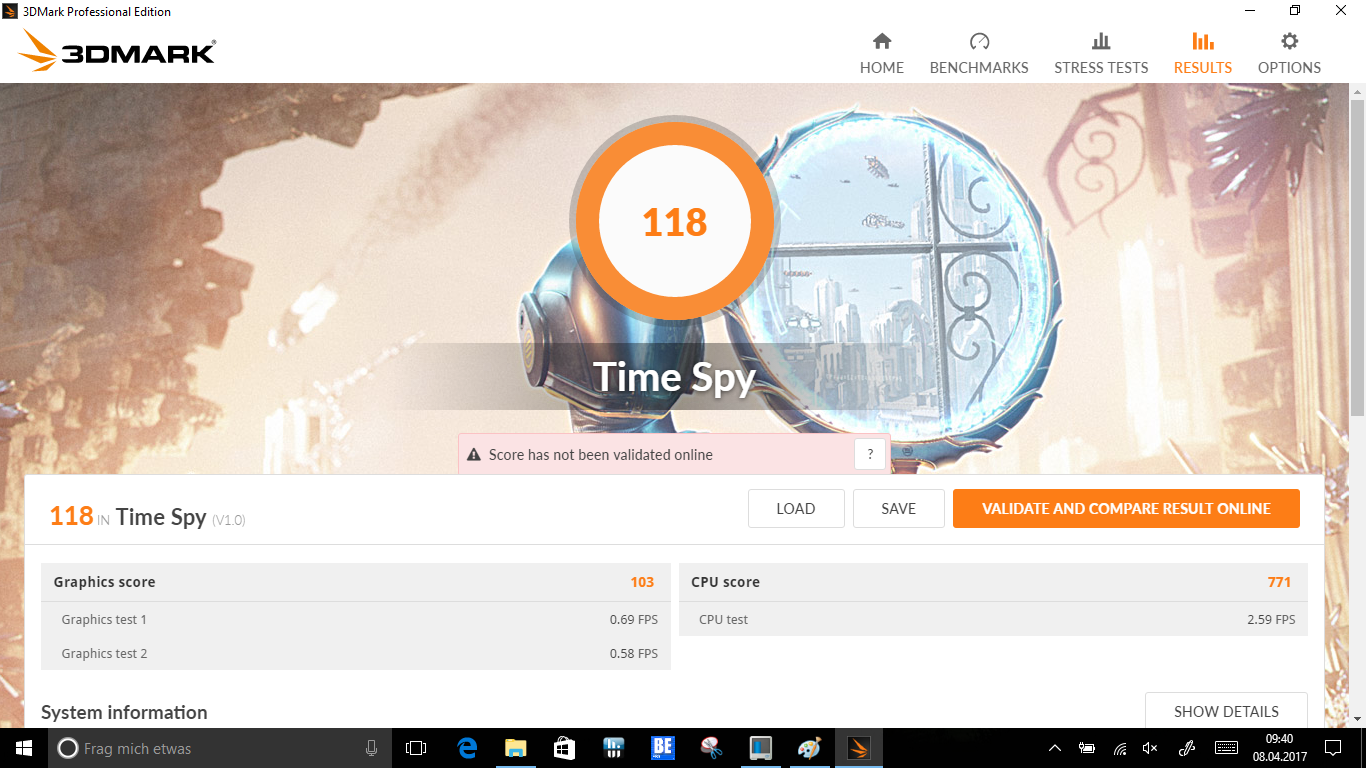
| 3DMark Time Spy Score | 118 points | |
Help | ||
| low | med. | high | ultra | |
|---|---|---|---|---|
| BioShock Infinite (2013) | 30.6 | 17.3 | 15.1 | |
| Battlefield 4 (2013) | 20.9 | 15.2 | 9.5 | |
| Rise of the Tomb Raider (2016) | 6.1 | 4 |
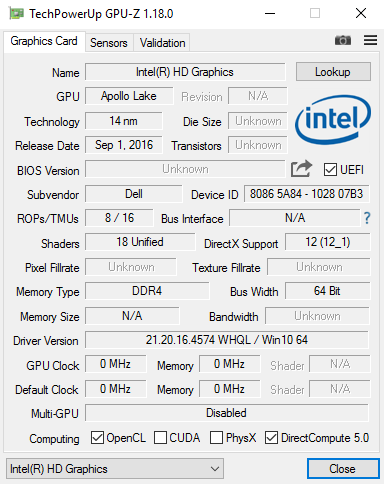
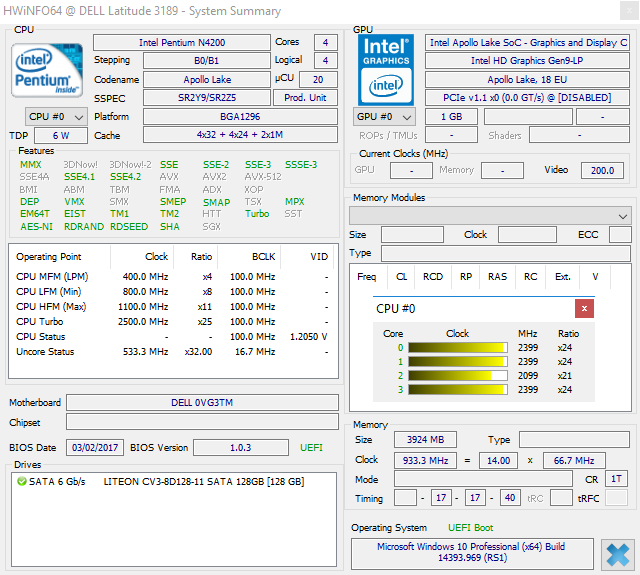
| Dell Latitude 3189 Pentium N4200, HD Graphics 505 | Medion Akoya P3401T 2in1 6Y54, HD Graphics 515 | HP Pavilion 11-k103ng x360 N3050, HD Graphics (Braswell) | HP Pavilion x360 13-u102ng i5-7200U, HD Graphics 620 | Lenovo Yoga 700-11ISK 6Y30, HD Graphics 515 | Acer Aspire Switch Alpha 12 SA5-271-56HM 6200U, HD Graphics 520 | |
|---|---|---|---|---|---|---|
| Emissions | ||||||
| Fan Noise (dB(A)) | 37.3 |
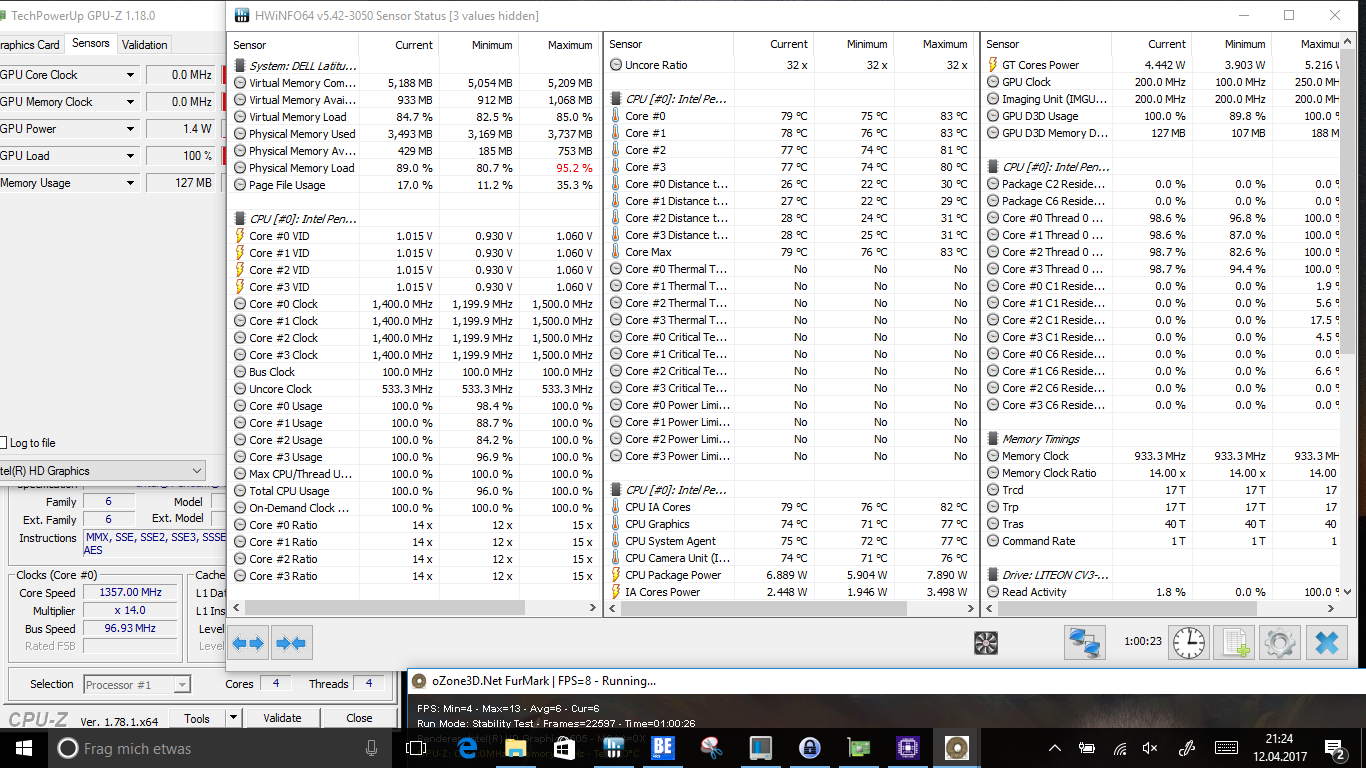
(±) The maximum temperature on the upper side is 43.3 °C / 110 F, compared to the average of 35.4 °C / 96 F, ranging from 19.6 to 60 °C for the class Convertible.
(-) The bottom heats up to a maximum of 54.9 °C / 131 F, compared to the average of 36.9 °C / 98 F
(+) In idle usage, the average temperature for the upper side is 26 °C / 79 F, compared to the device average of 30.3 °C / 87 F.
(±) The palmrests and touchpad can get very hot to the touch with a maximum of 37.9 °C / 100.2 F.
(-) The average temperature of the palmrest area of similar devices was 28 °C / 82.4 F (-9.9 °C / -17.8 F).
| Dell Latitude 3189 Pentium N4200, HD Graphics 505 | Medion Akoya P3401T 2in1 6Y54, HD Graphics 515 | HP Pavilion 11-k103ng x360 N3050, HD Graphics (Braswell) | HP Pavilion x360 13-u102ng i5-7200U, HD Graphics 620 | Lenovo Yoga 700-11ISK 6Y30, HD Graphics 515 | Acer Aspire Switch Alpha 12 SA5-271-56HM 6200U, HD Graphics 520 | |
|---|---|---|---|---|---|---|
| Heat | 12% | -17% | 15% | -1% | -3% | |
| Maximum Upper Side * (°C) | 43.3 | 38.1 12% | 44.6 -3% | 34.6 20% | 36.8 15% | 46.7 -8% |
| Maximum Bottom * (°C) | 54.9 | 41.7 24% | 53.1 3% | 36.4 34% | 42 23% | 51 7% |
| Idle Upper Side * (°C) | 27.5 | 27.9 -1% | 35.2 -28% | 26.6 3% | 32.1 -17% | 29.5 -7% |
| Idle Bottom * (°C) | 27.9 | 24.1 14% | 38.6 -38% | 27.7 1% | 34.4 -23% | 28.6 -3% |
* ... smaller is better

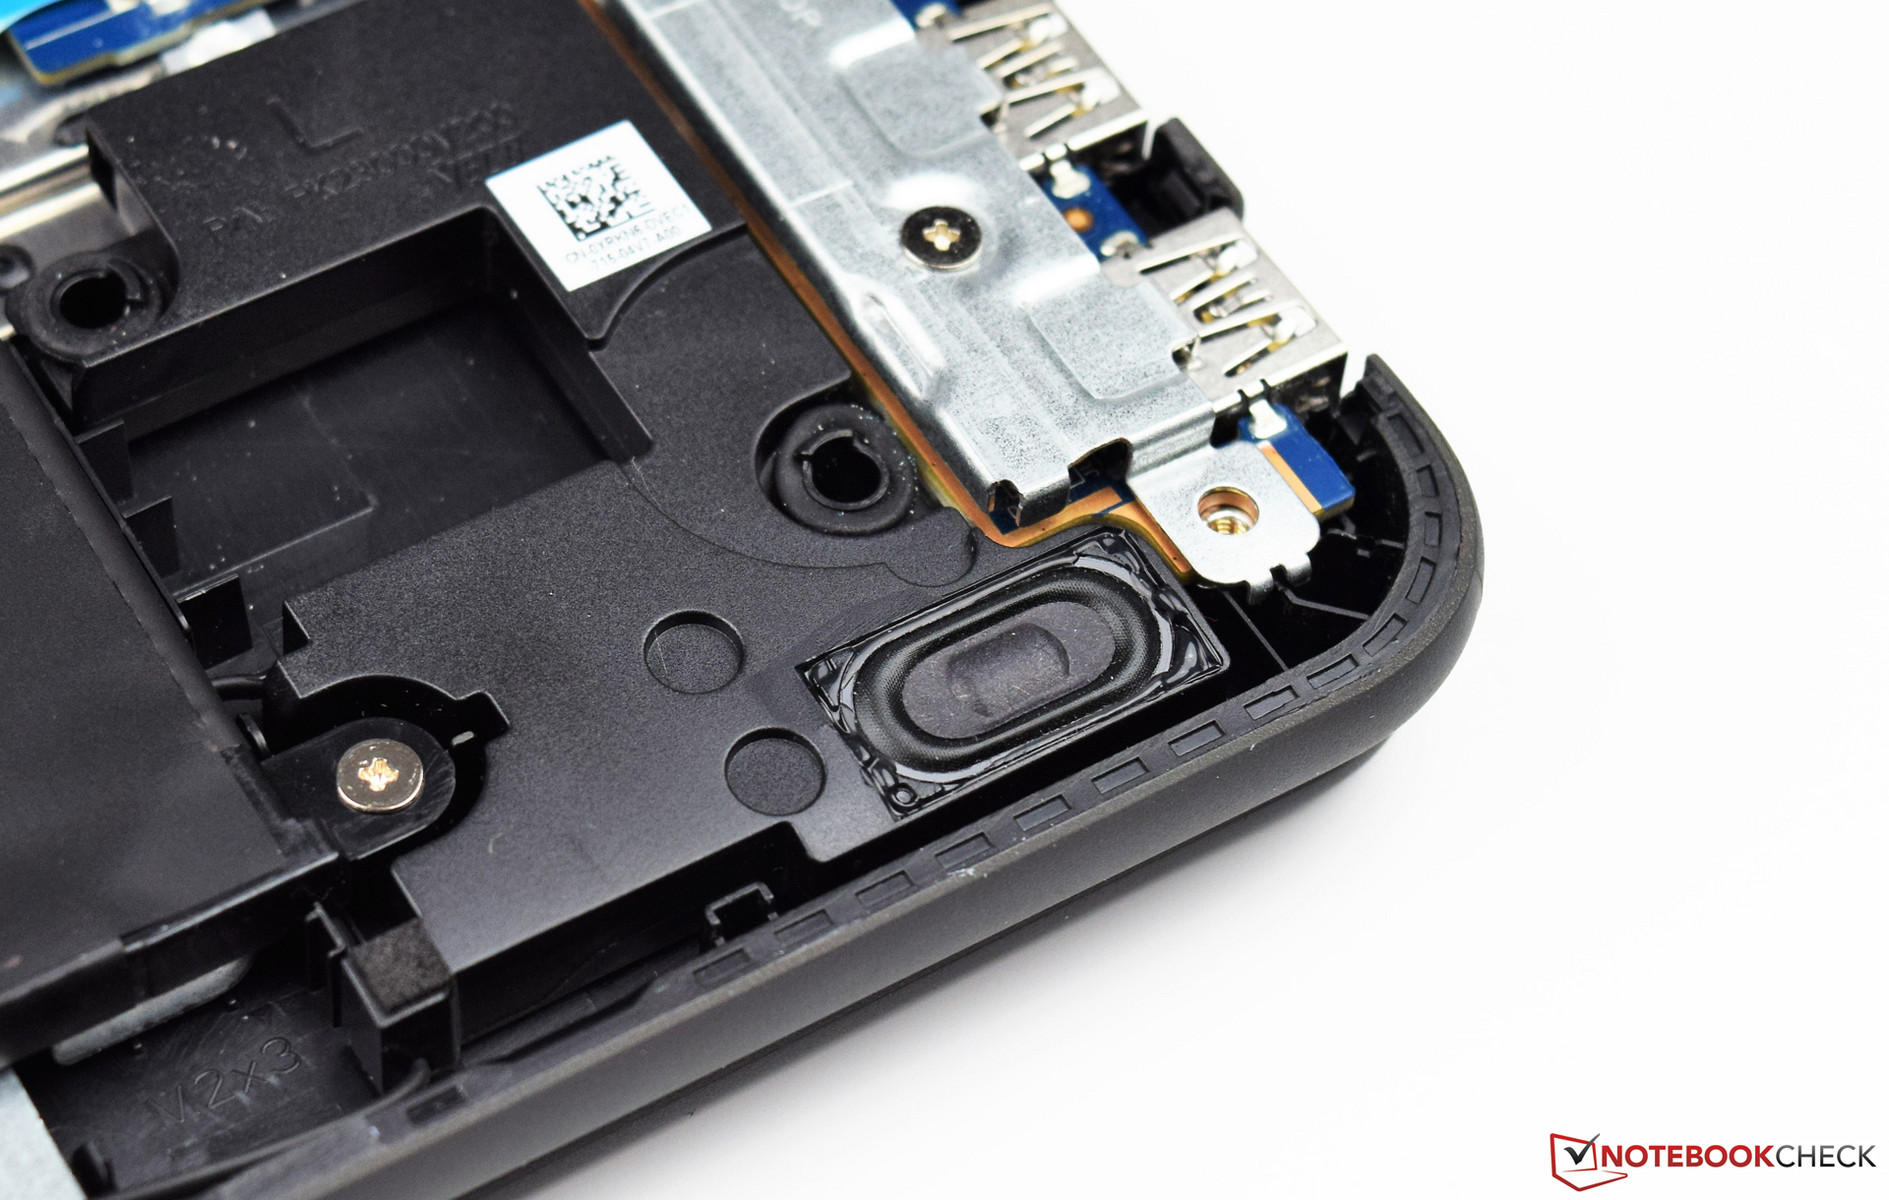
Dell Latitude 3189 audio analysis
(+) | speakers can play relatively loud (83 dB)
Bass 100 - 315 Hz
(-) | nearly no bass - on average 23.3% lower than median
(±) | linearity of bass is average (8.3% delta to prev. frequency)
Mids 400 - 2000 Hz
(±) | reduced mids - on average 5% lower than median
(±) | linearity of mids is average (8.1% delta to prev. frequency)
Highs 2 - 16 kHz
(+) | balanced highs - only 4.5% away from median
(+) | highs are linear (6.5% delta to prev. frequency)
Overall 100 - 16.000 Hz
(±) | linearity of overall sound is average (19.2% difference to median)
Compared to same class
» 46% of all tested devices in this class were better, 7% similar, 47% worse
» The best had a delta of 6%, average was 20%, worst was 57%
Compared to all devices tested
» 46% of all tested devices were better, 7% similar, 46% worse
» The best had a delta of 4%, average was 23%, worst was 134%
Apple MacBook 12 (Early 2016) 1.1 GHz audio analysis
(+) | speakers can play relatively loud (83.6 dB)
Bass 100 - 315 Hz
(±) | reduced bass - on average 11.3% lower than median
(±) | linearity of bass is average (14.2% delta to prev. frequency)
Mids 400 - 2000 Hz
(+) | balanced mids - only 2.4% away from median
(+) | mids are linear (5.5% delta to prev. frequency)
Highs 2 - 16 kHz
(+) | balanced highs - only 2% away from median
(+) | highs are linear (4.5% delta to prev. frequency)
Overall 100 - 16.000 Hz
(+) | overall sound is linear (10.2% difference to median)
Compared to same class
» 7% of all tested devices in this class were better, 2% similar, 90% worse
» The best had a delta of 5%, average was 18%, worst was 53%
Compared to all devices tested
» 5% of all tested devices were better, 1% similar, 94% worse
» The best had a delta of 4%, average was 23%, worst was 134%
| Off / Standby | |
| Idle | |
| Load |
|
Key:
min: | |
| Dell Latitude 3189 Pentium N4200, HD Graphics 505, Liteonit CV3-8D128, IPS, 1366x768, 11.6" | Medion Akoya P3401T 2in1 6Y54, HD Graphics 515, , IPS, 1920x1080, 12.5" | HP Pavilion 11-k103ng x360 N3050, HD Graphics (Braswell), Hitachi Travelstar Z5K500 HTS545050A7E680, IPS, 1366x768, 11.6" | HP Pavilion x360 13-u102ng i5-7200U, HD Graphics 620, HGST Travelstar 5K1000 HTS541010A7E630, IPS, 1920x1080, 13.3" | Lenovo Yoga 700-11ISK 6Y30, HD Graphics 515, Samsung SSD PM871 MZNLN256HCHP, IPS, 1920x1080, 11.6" | Acer Aspire Switch Alpha 12 SA5-271-56HM 6200U, HD Graphics 520, Kingston RBU-SNS8152S3256GG2, IPS, 2160x1440, 12" | |
|---|---|---|---|---|---|---|
| Power Consumption | -37% | -45% | -66% | -29% | -105% | |
| Idle Minimum * (Watt) | 2.17 | 3.8 -75% | 5.3 -144% | 4.7 -117% | 4.3 -98% | 7.3 -236% |
| Idle Average * (Watt) | 4.31 | 7.1 -65% | 7.1 -65% | 7.2 -67% | 7.1 -65% | 10 -132% |
| Idle Maximum * (Watt) | 5.79 | 8.1 -40% | 8.2 -42% | 7.9 -36% | 7.2 -24% | 10.15 -75% |
| Load Average * (Watt) | 15.8 | 19.1 -21% | 15.5 2% | 30 -90% | 14.6 8% | 25.2 -59% |
| Load Maximum * (Watt) | 24.2 | 20.2 17% | 18.9 22% | 29 -20% | 15.7 35% | 29.3 -21% |
* ... smaller is better

| Dell Latitude 3189 Pentium N4200, HD Graphics 505, 42 Wh | Medion Akoya P3401T 2in1 6Y54, HD Graphics 515, 51 Wh | HP Pavilion 11-k103ng x360 N3050, HD Graphics (Braswell), 32 Wh | HP Pavilion x360 13-u102ng i5-7200U, HD Graphics 620, 41 Wh | Lenovo Yoga 700-11ISK 6Y30, HD Graphics 515, 40 Wh | Acer Aspire Switch Alpha 12 SA5-271-56HM 6200U, HD Graphics 520, 37 Wh | |
|---|---|---|---|---|---|---|
| Battery runtime | -28% | -52% | -52% | -21% | -40% | |
| Reader / Idle (h) | 22 | 9.3 -58% | 14.4 -35% | 10.7 -51% | ||
| H.264 (h) | 8.4 | 5.3 -37% | 7.7 -8% | 7.8 -7% | ||
| WiFi v1.3 (h) | 10.1 | 7.3 -28% | 4.8 -52% | 5.4 -47% | 7 -31% | 5.4 -47% |
| Load (h) | 4.2 | 1.4 -67% | 3.8 -10% | 1.9 -55% |
Pros
Cons
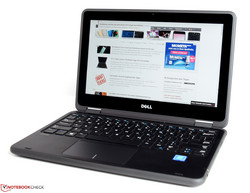
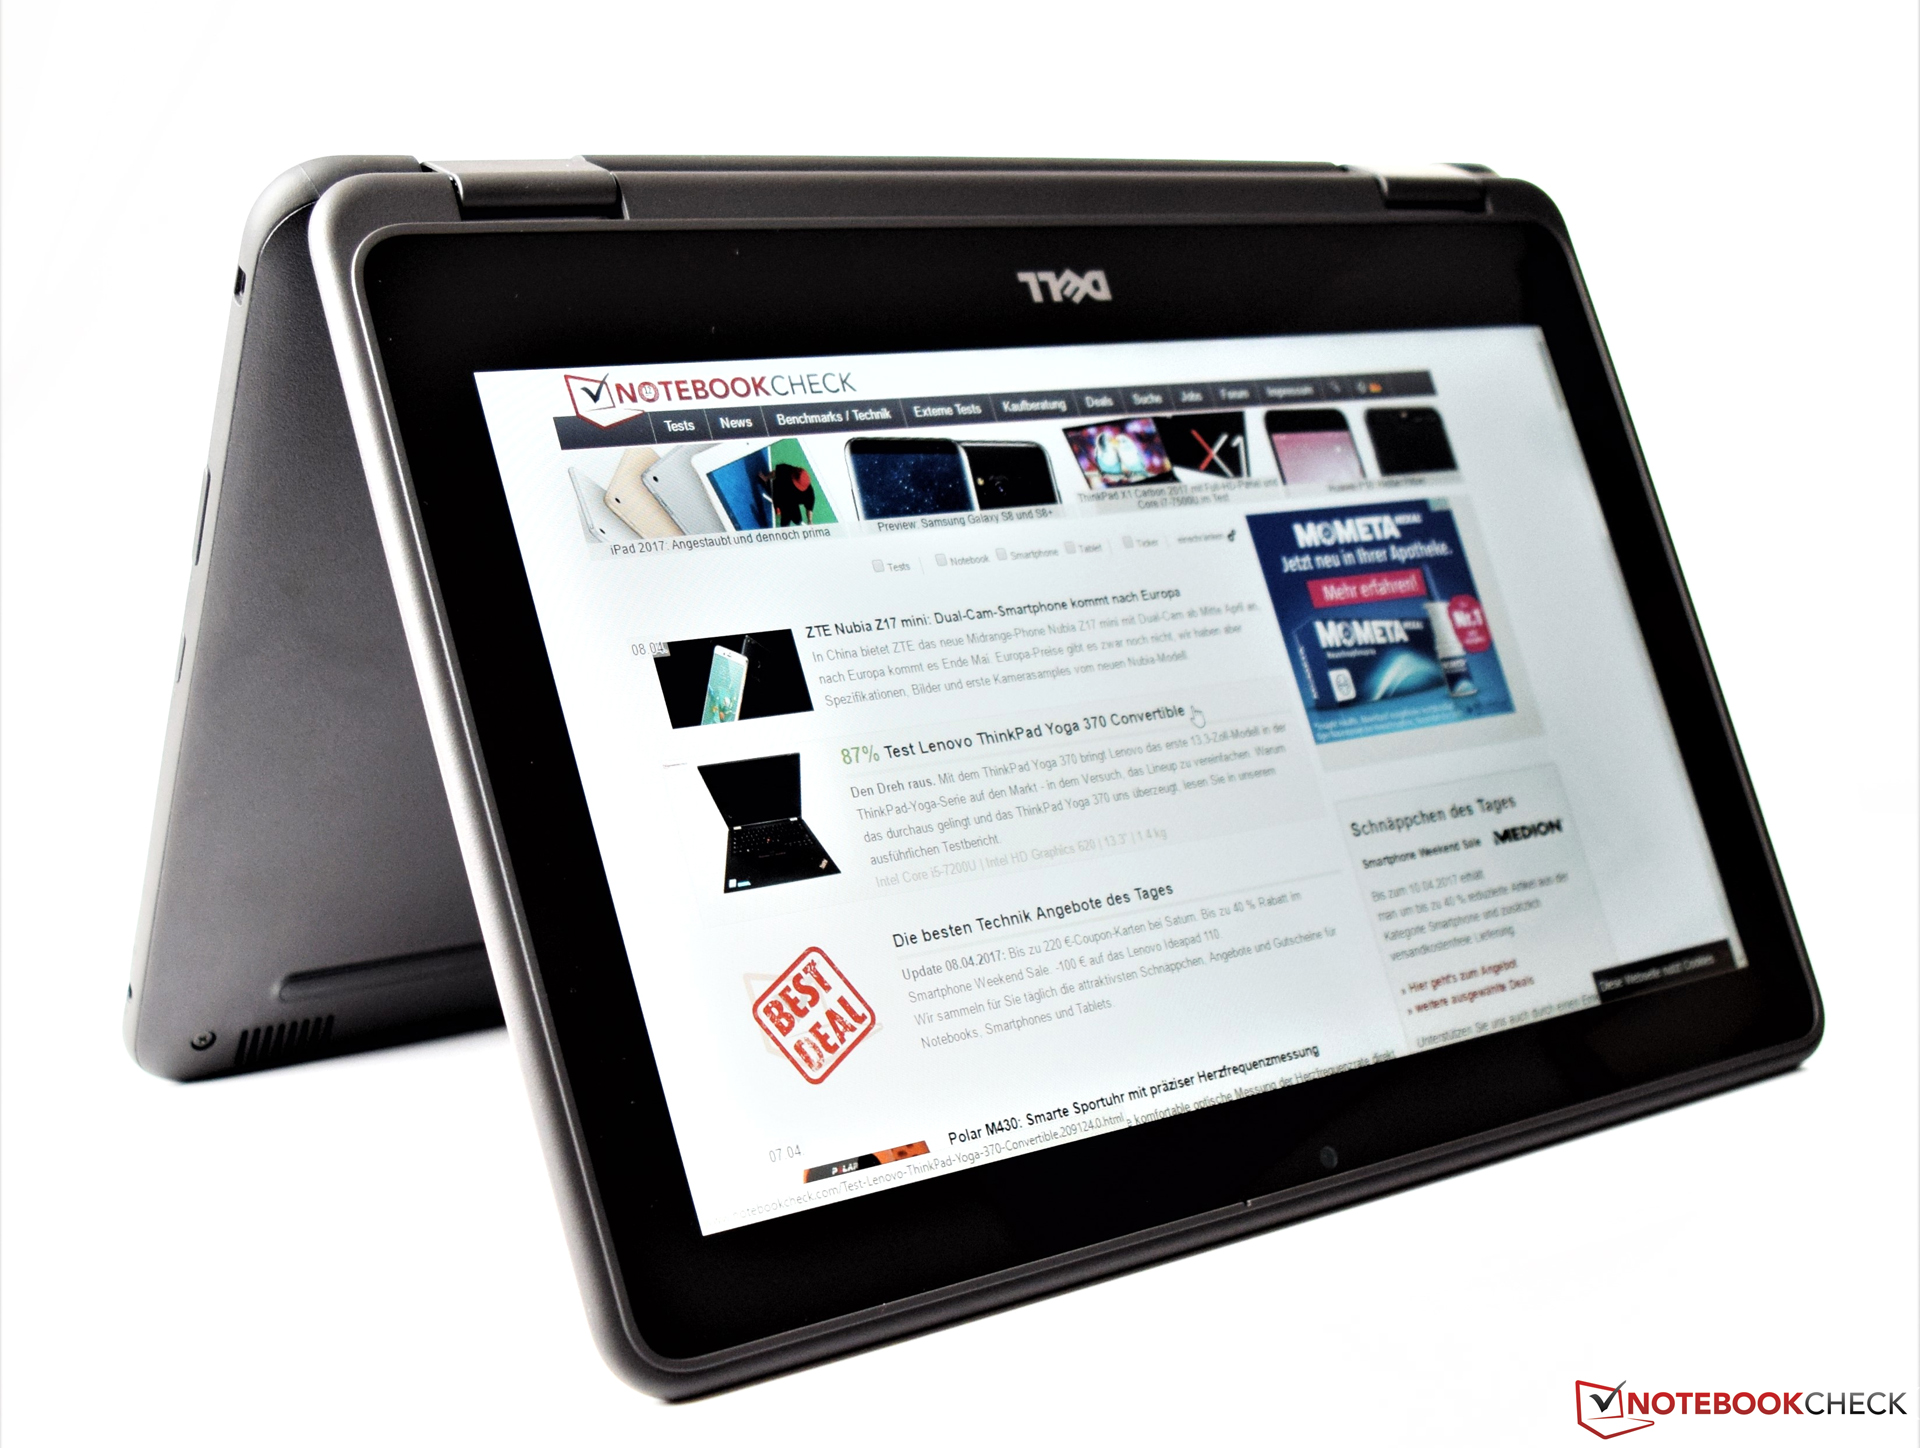
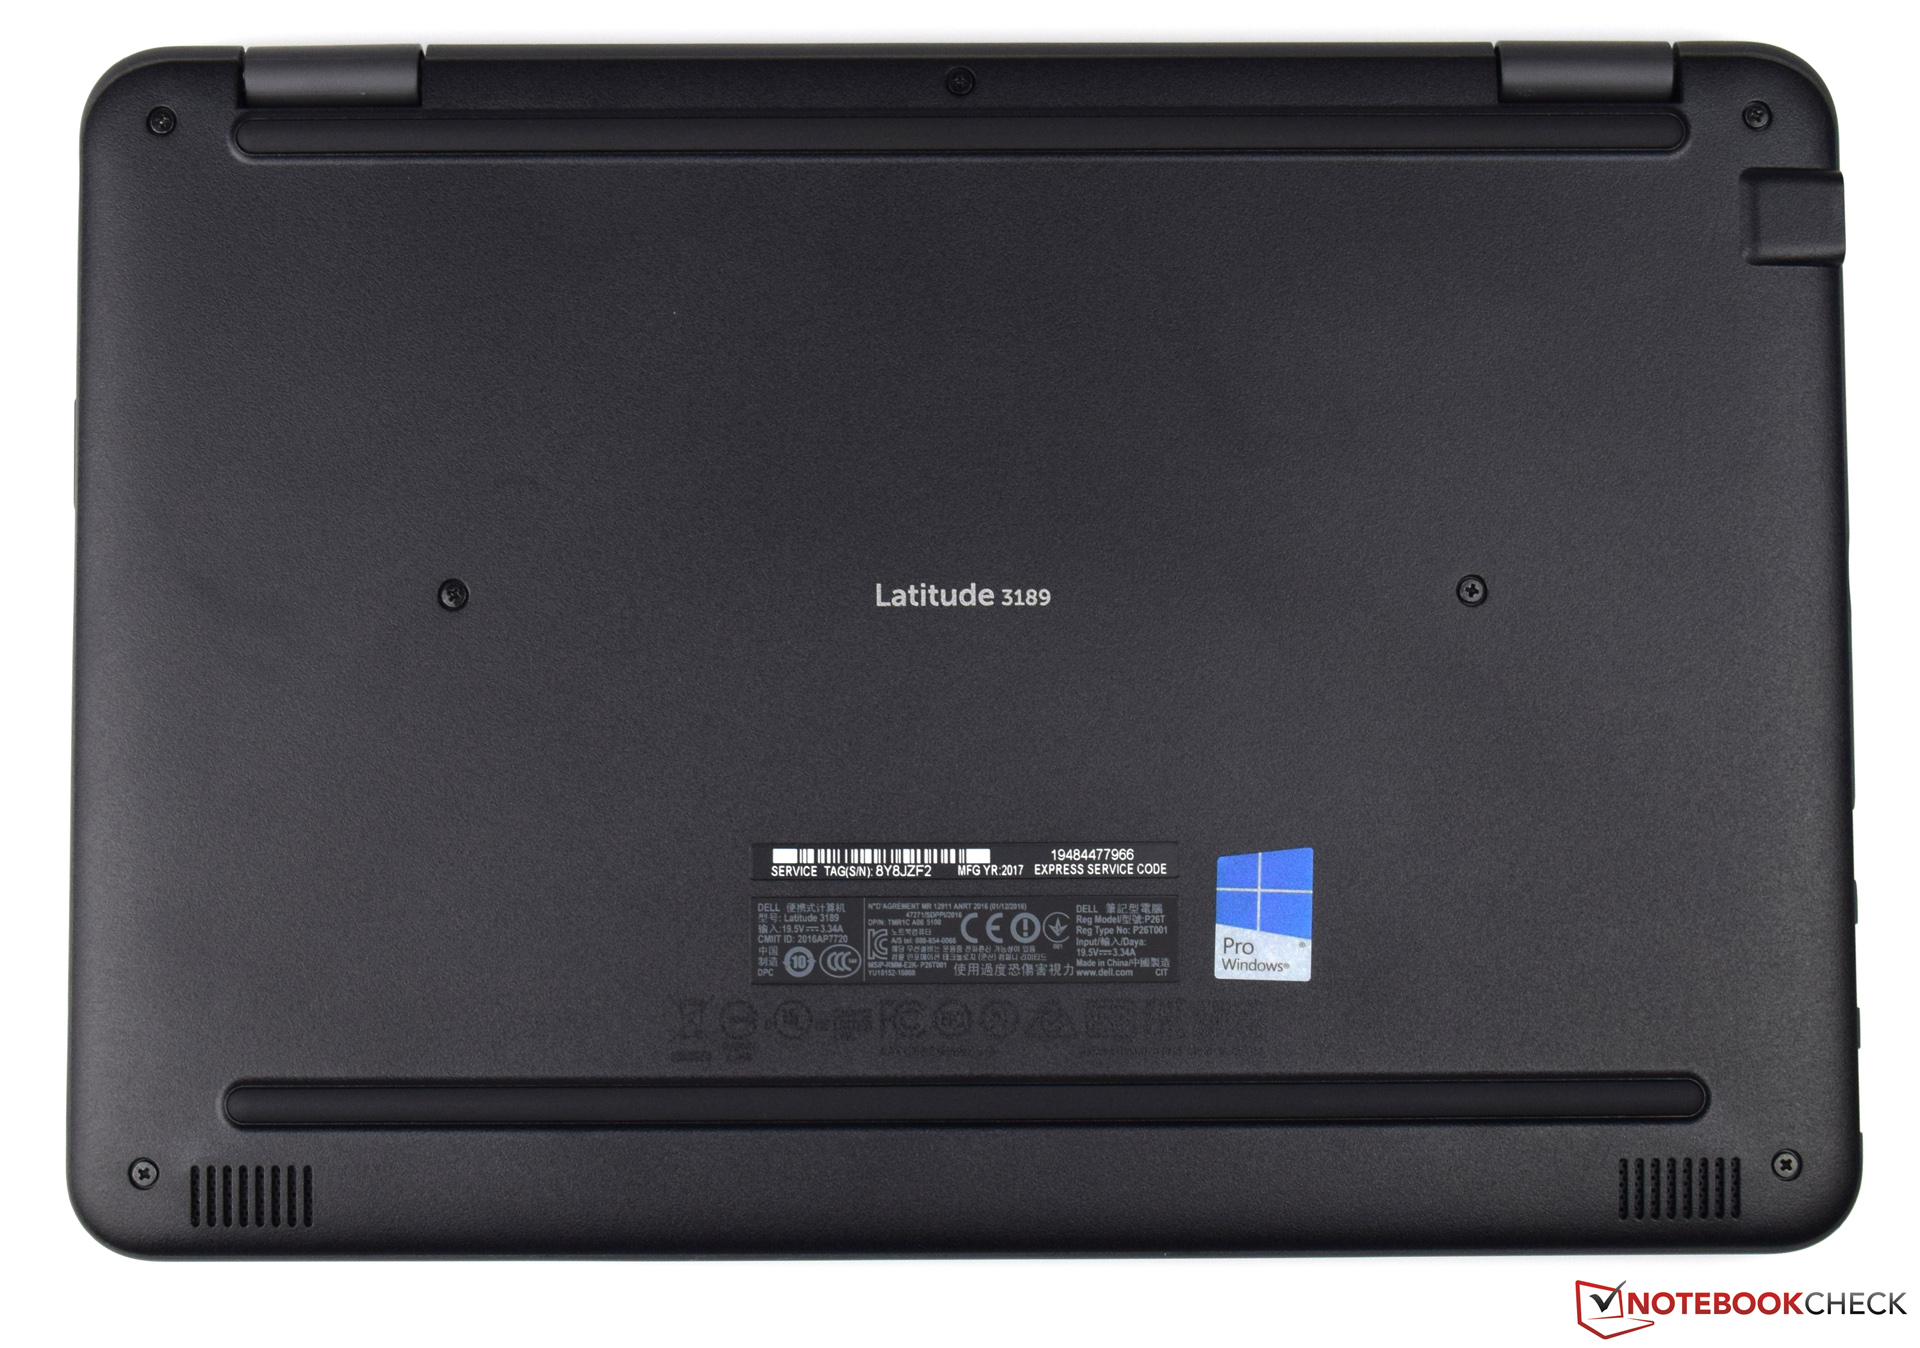
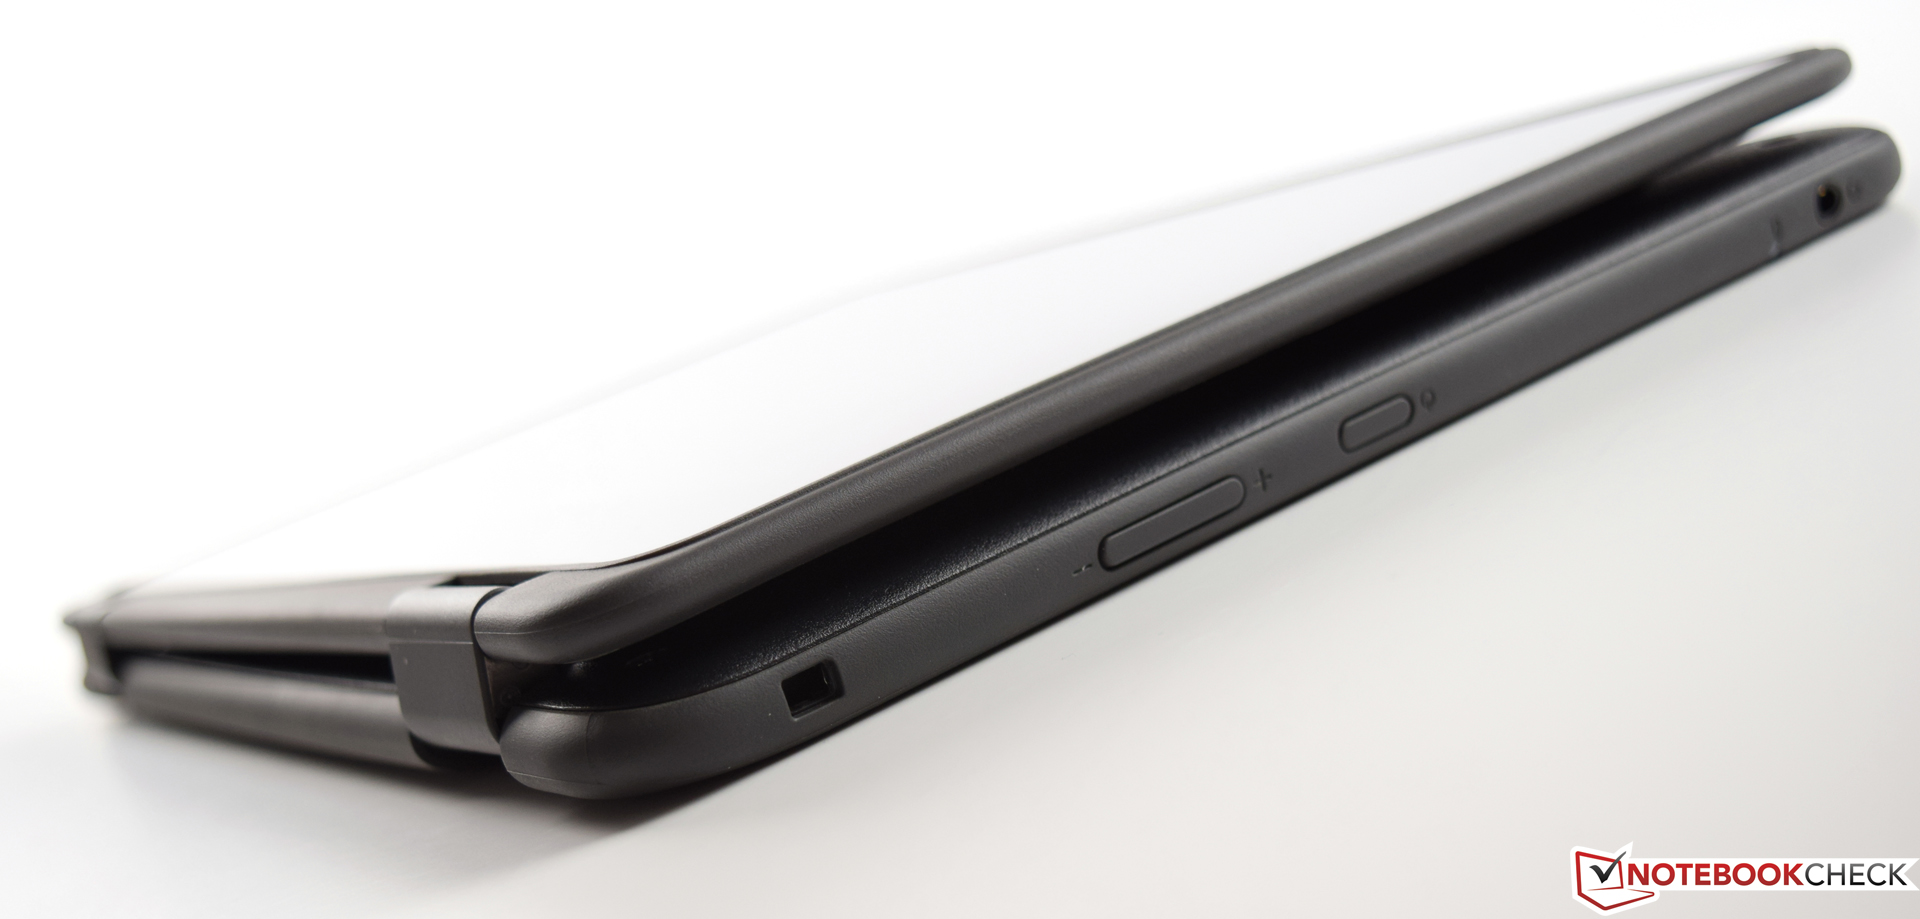
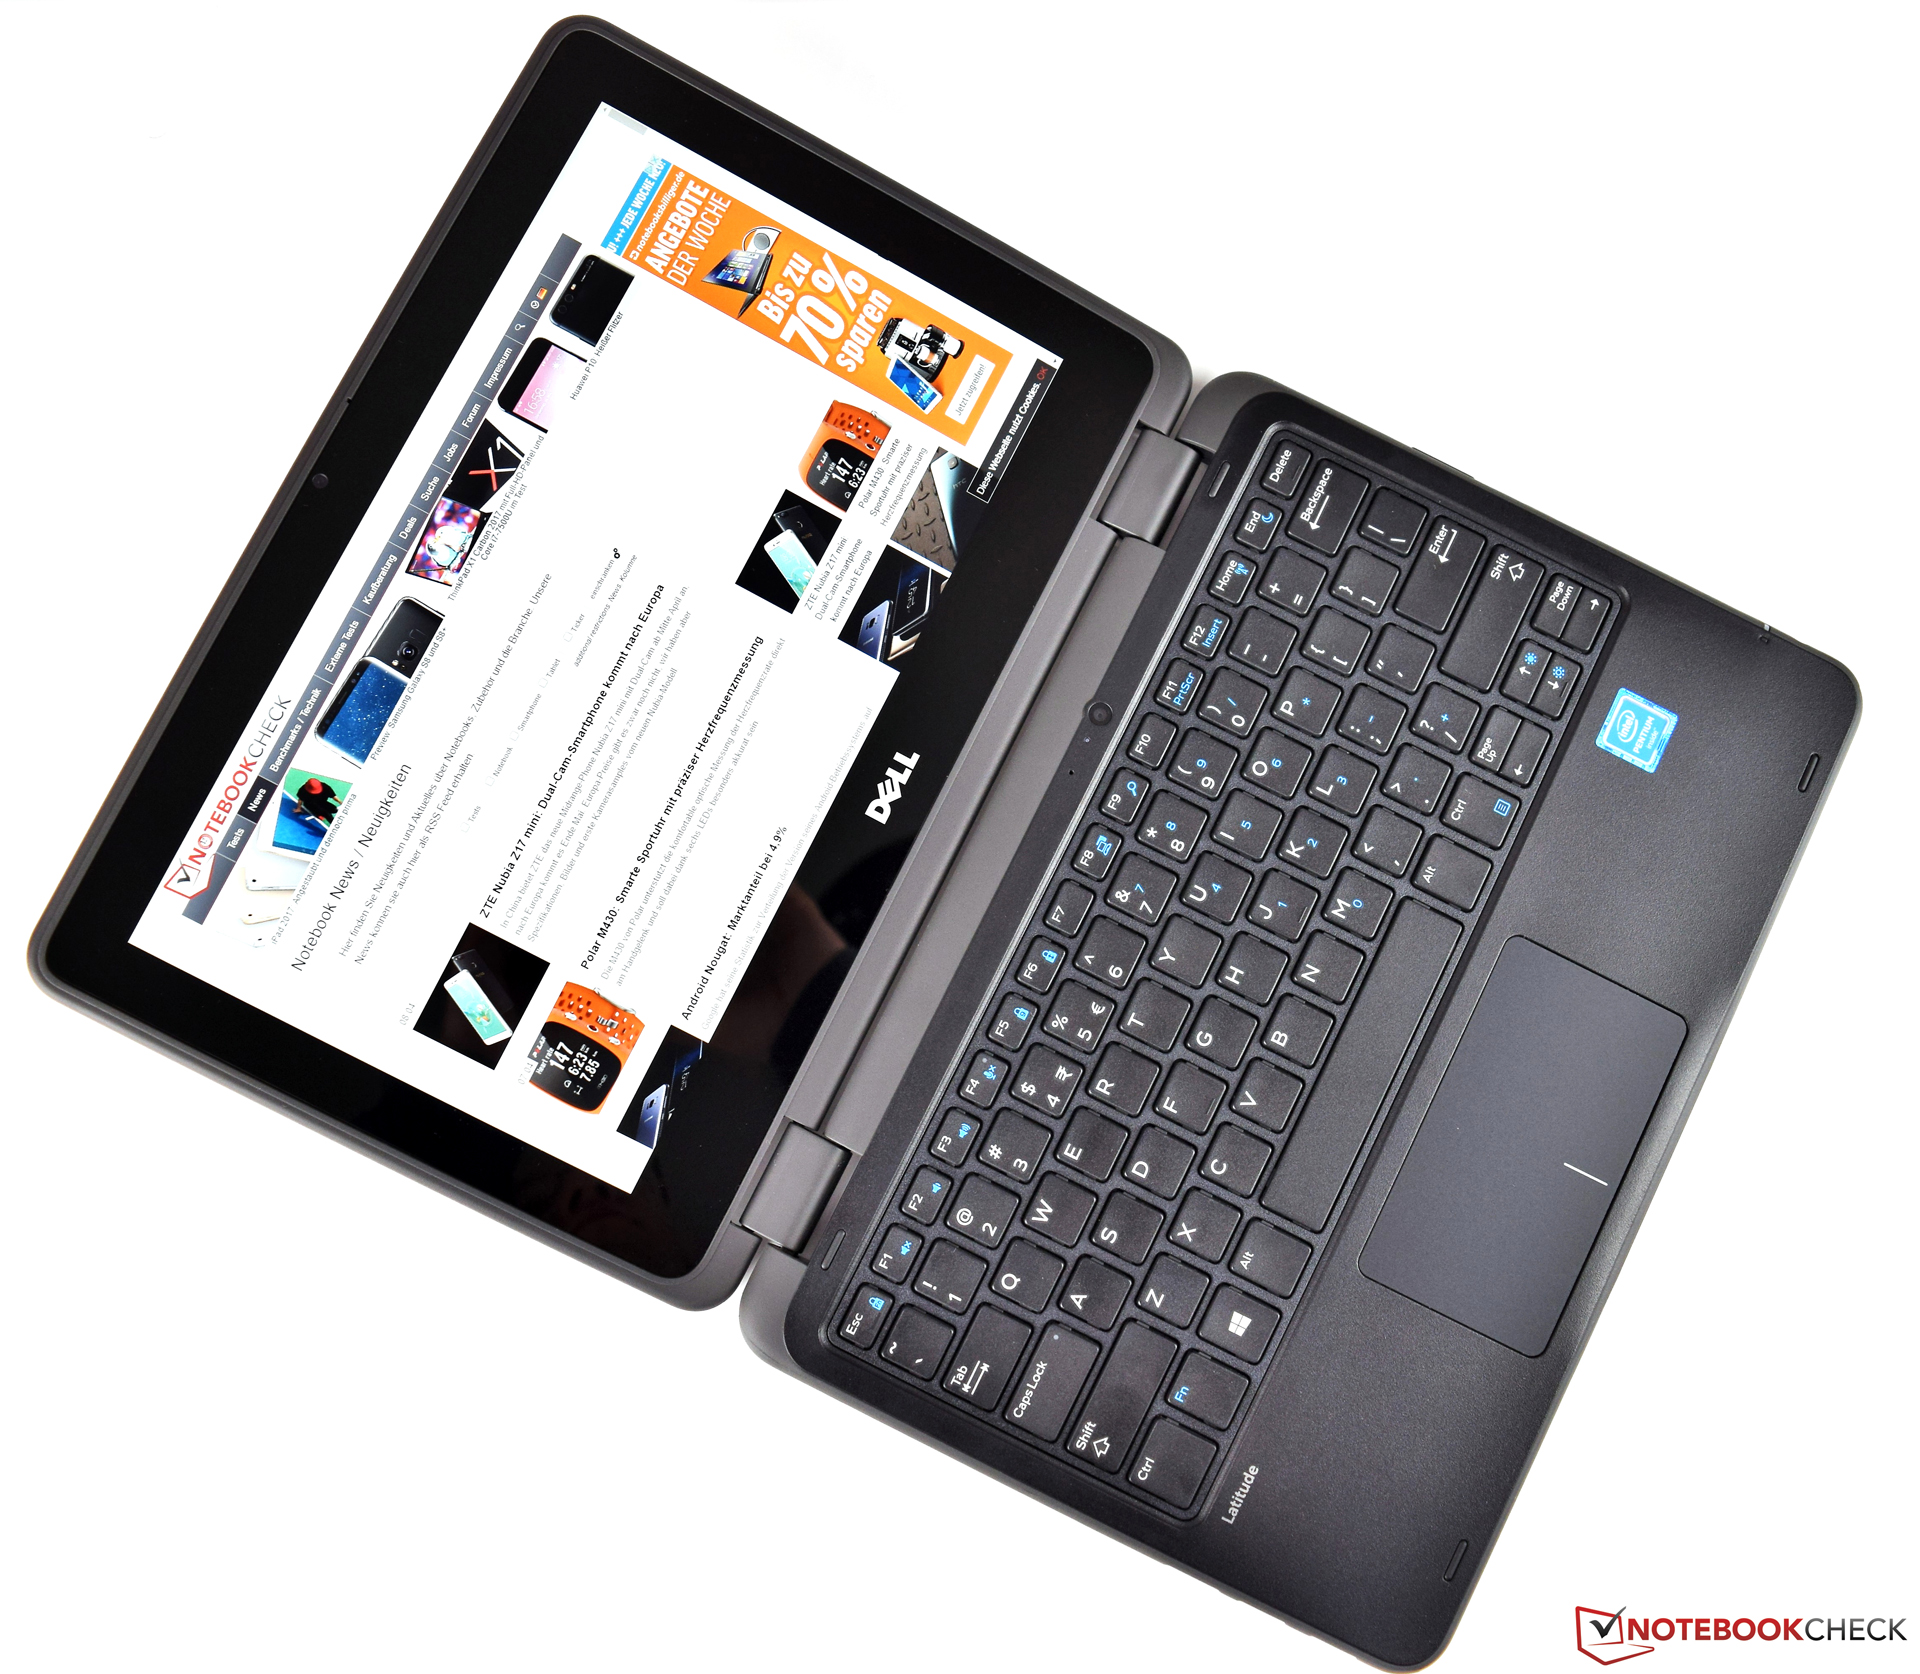
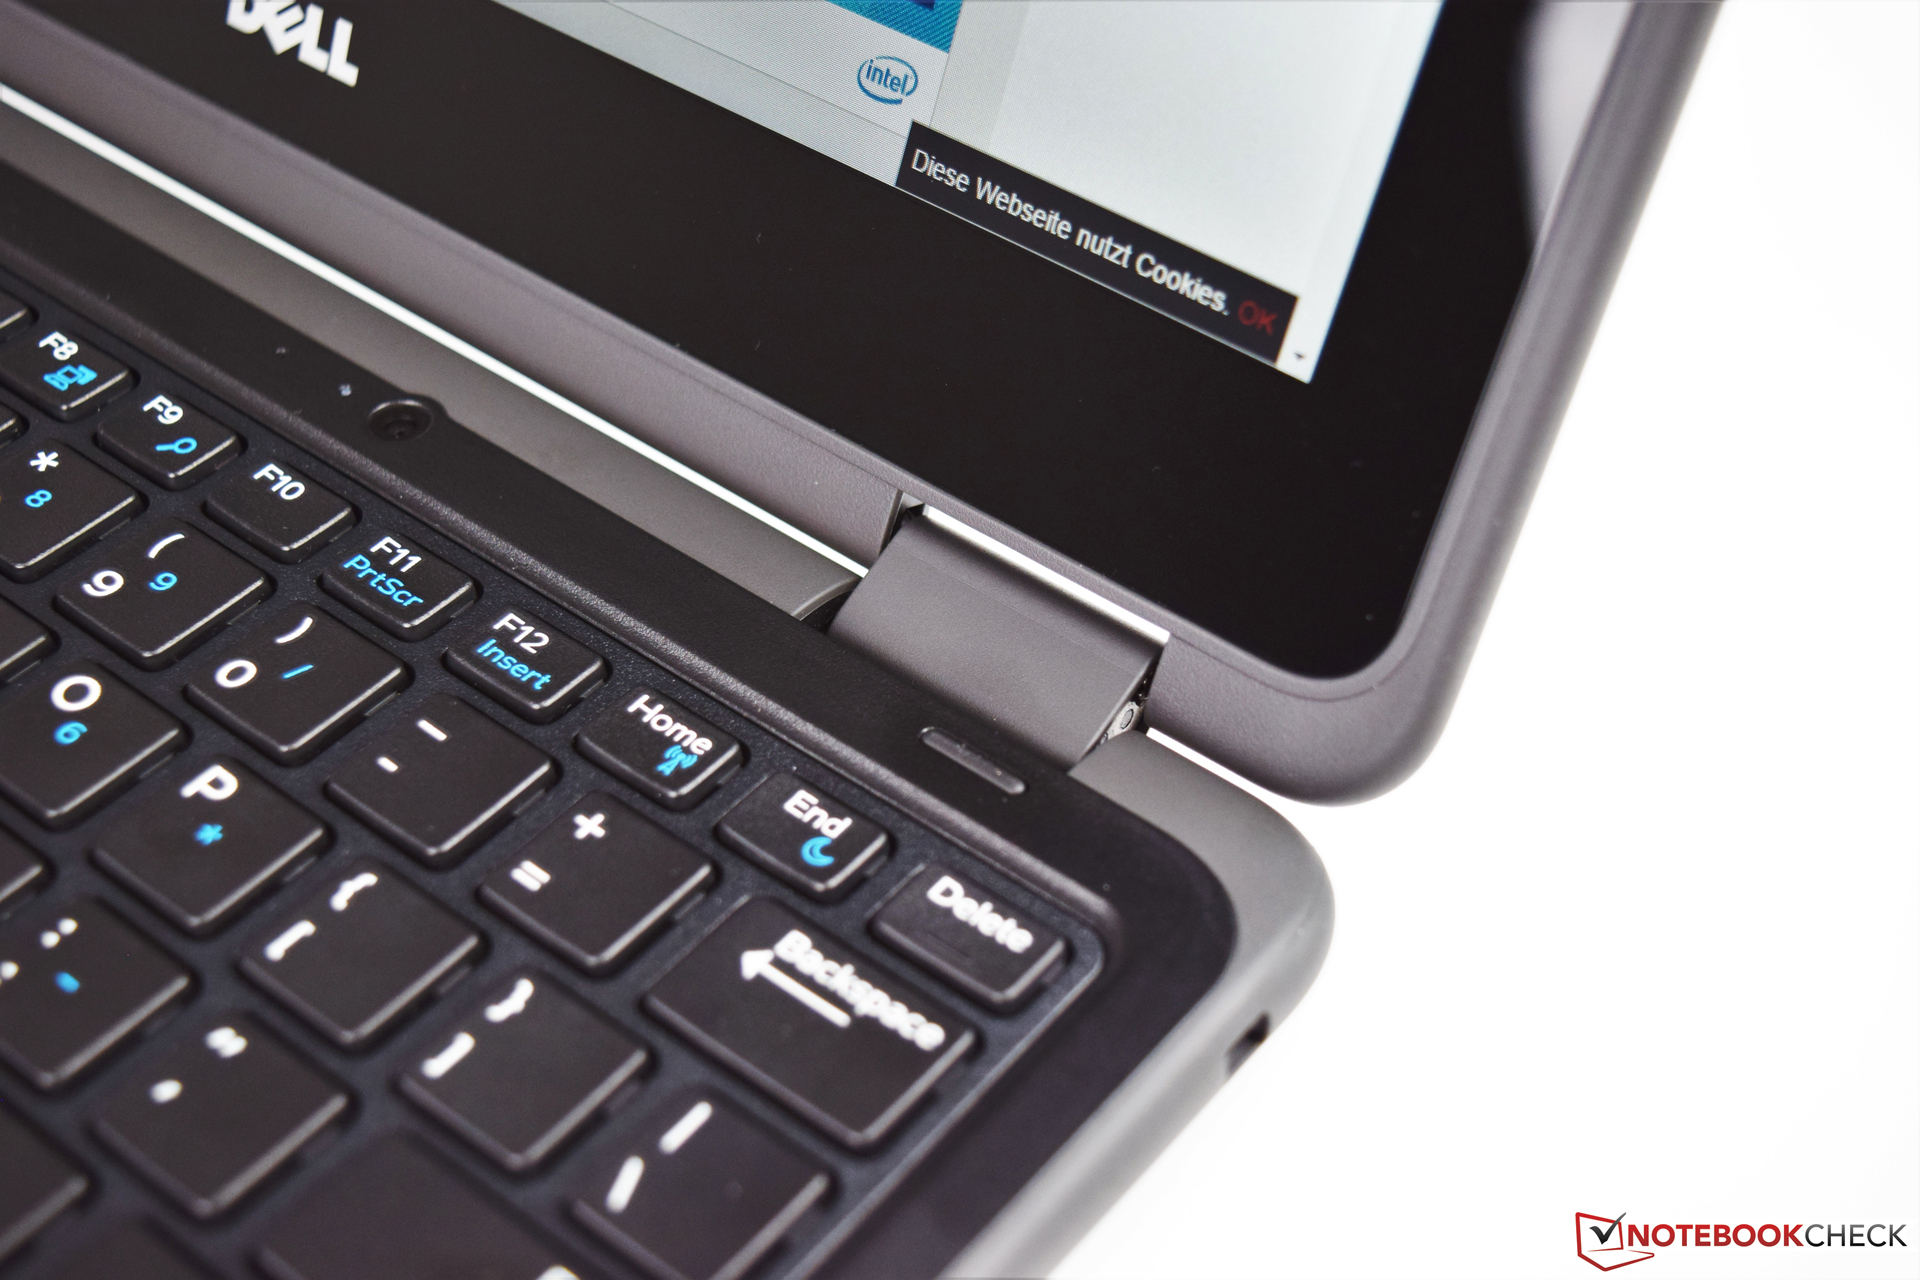
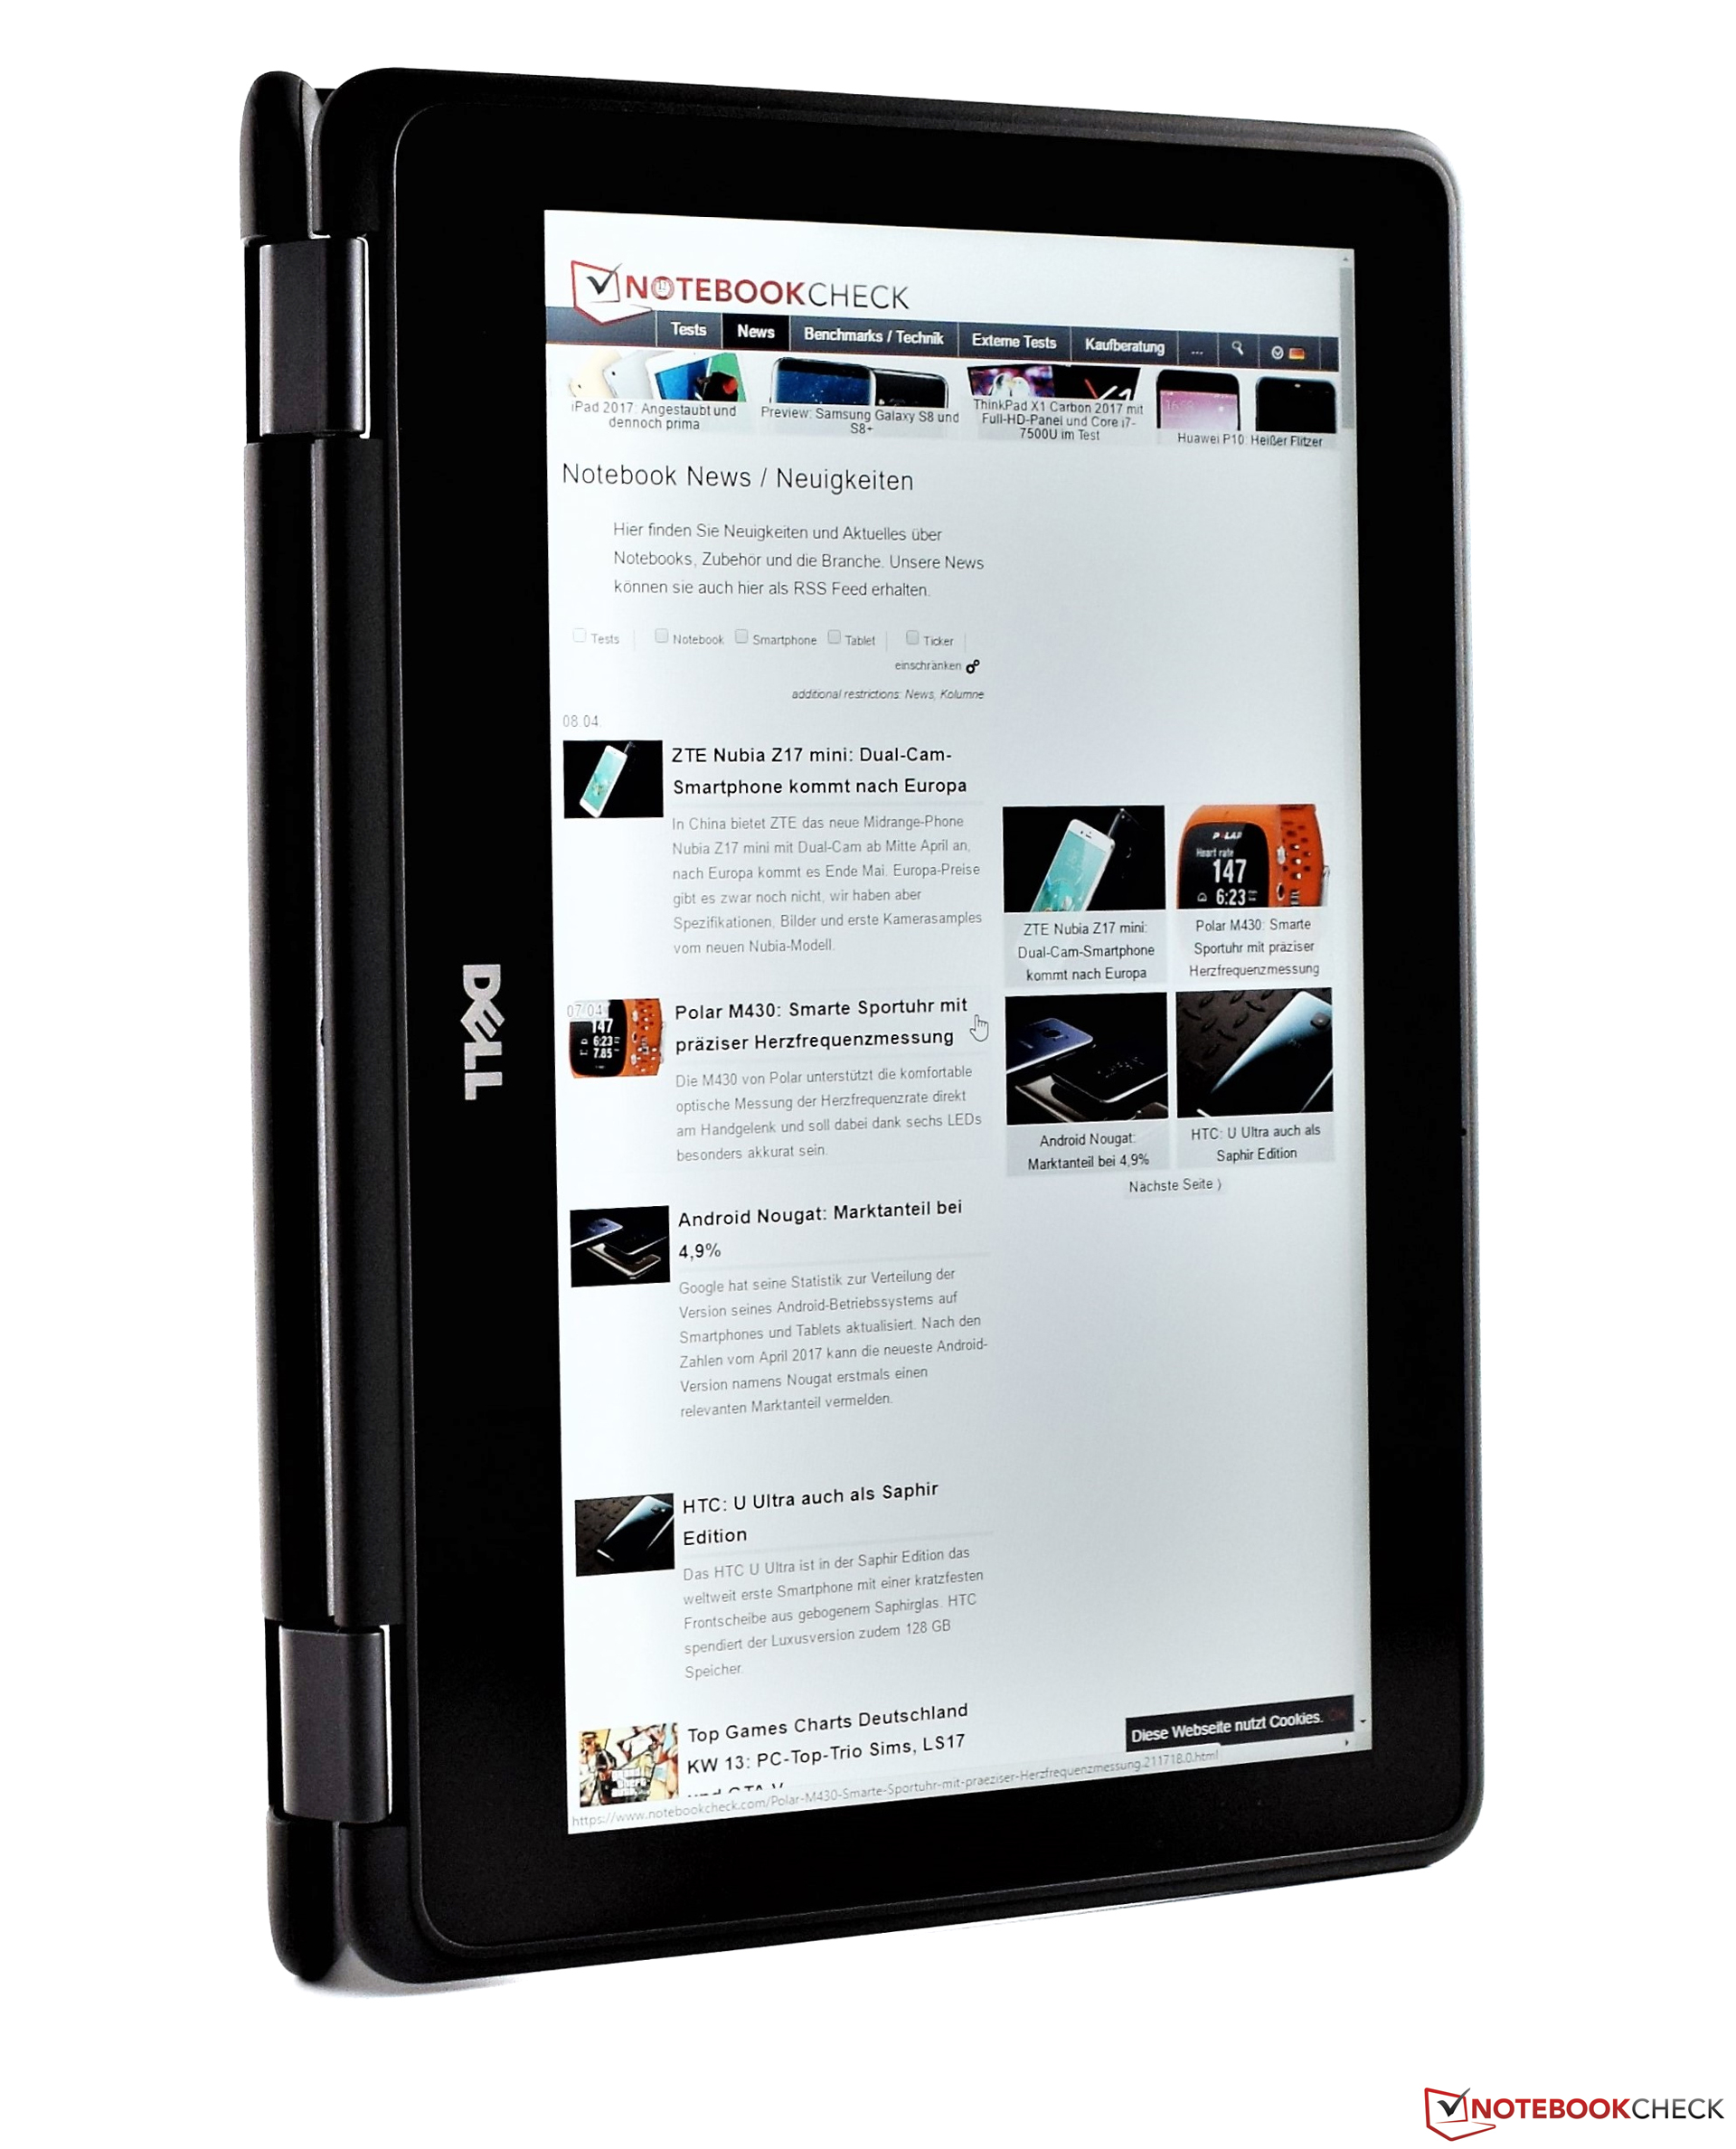
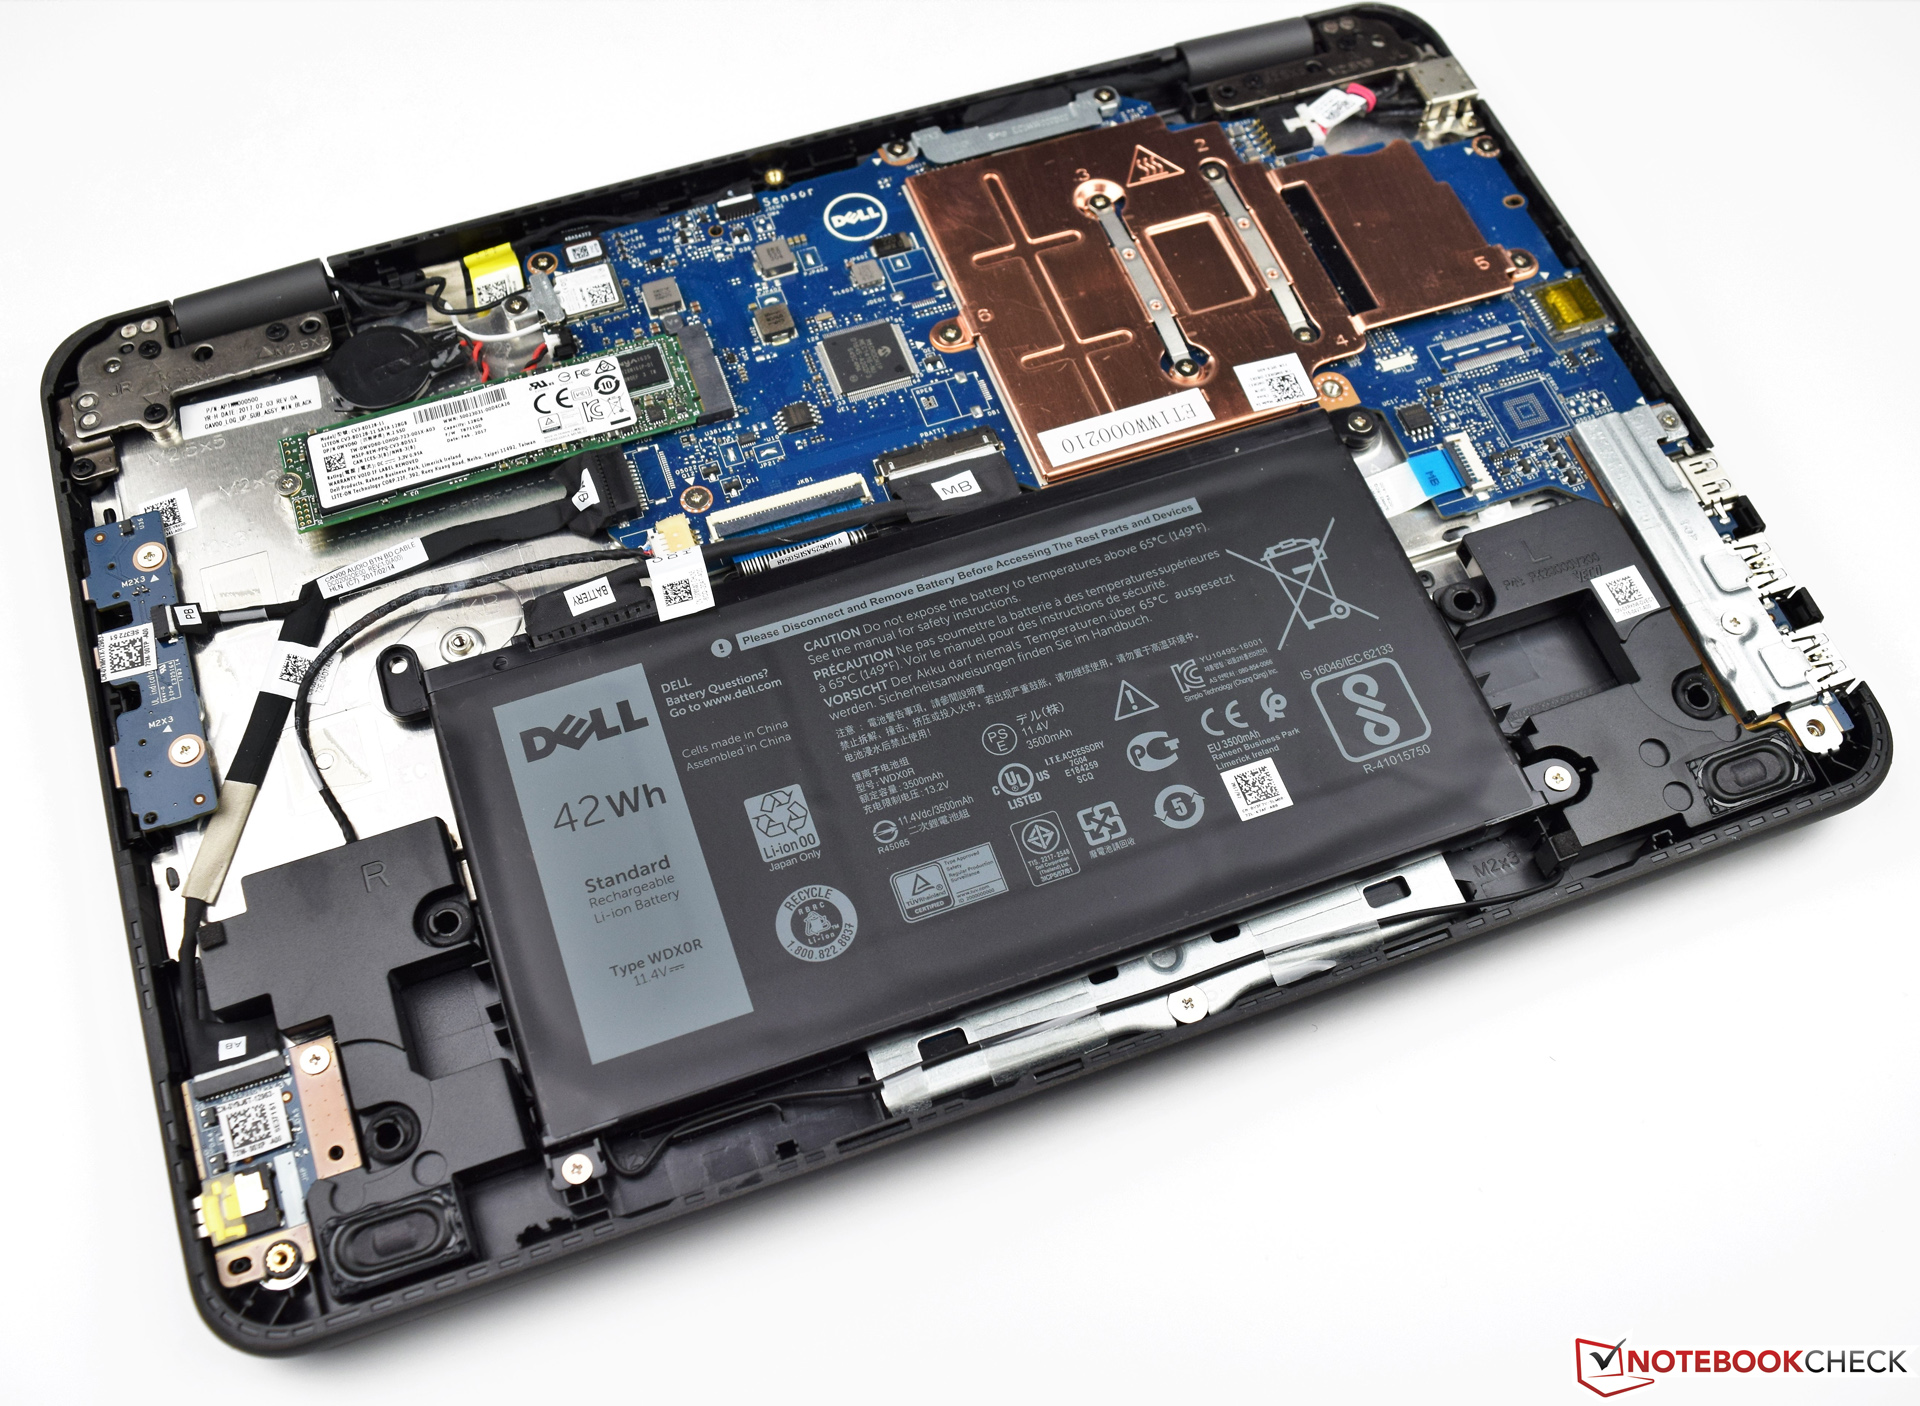
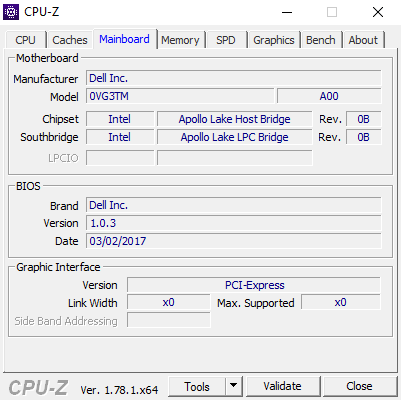
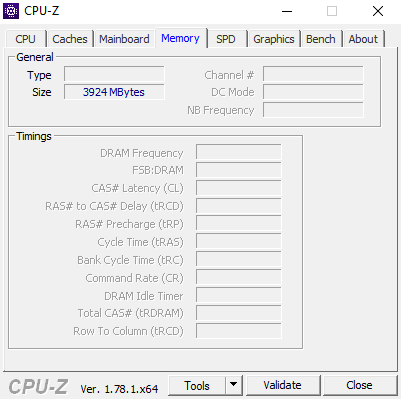
戴尔主要将Latitude 3189定位在教育领域。这么说的依据是其结实的设计。如良好的触摸屏等额外的功能给这台设备增加了附加价值。这也使得这台设备多用途化。英特尔奔腾N4200处理器,4GB大小的DDR3 RAM,这是厂商在性能方面提供最强选项。我们不会推荐选配英特尔赛扬N335理器的型号。我们的测试型号运行的非常不错,尽管它最低要价799欧元(约合870美元)。但是,配以英特尔赛扬3350(双核处理器)的设备型号,性能相较而言明显下降。
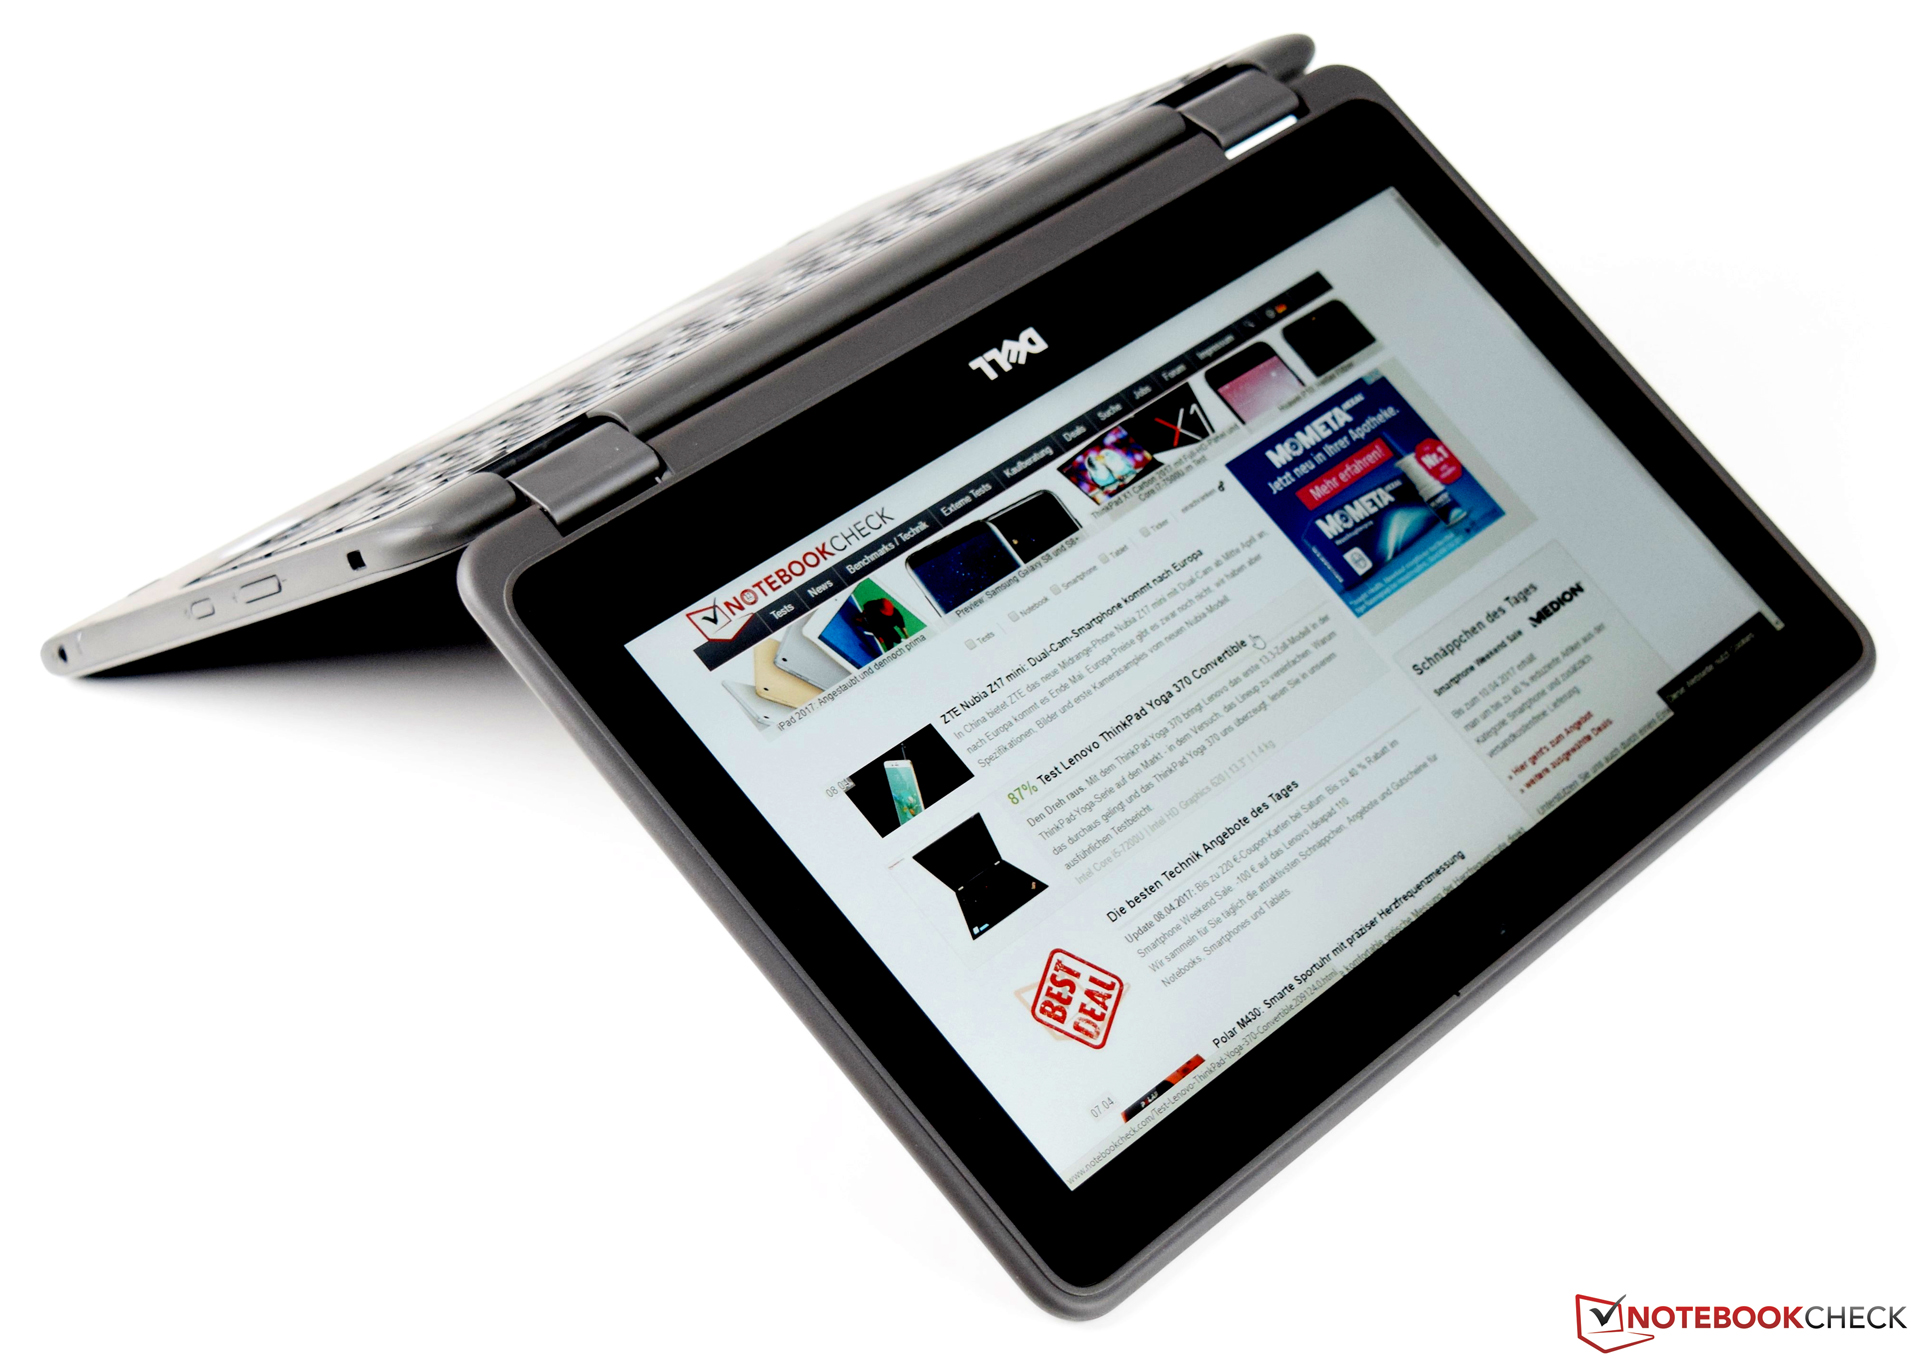
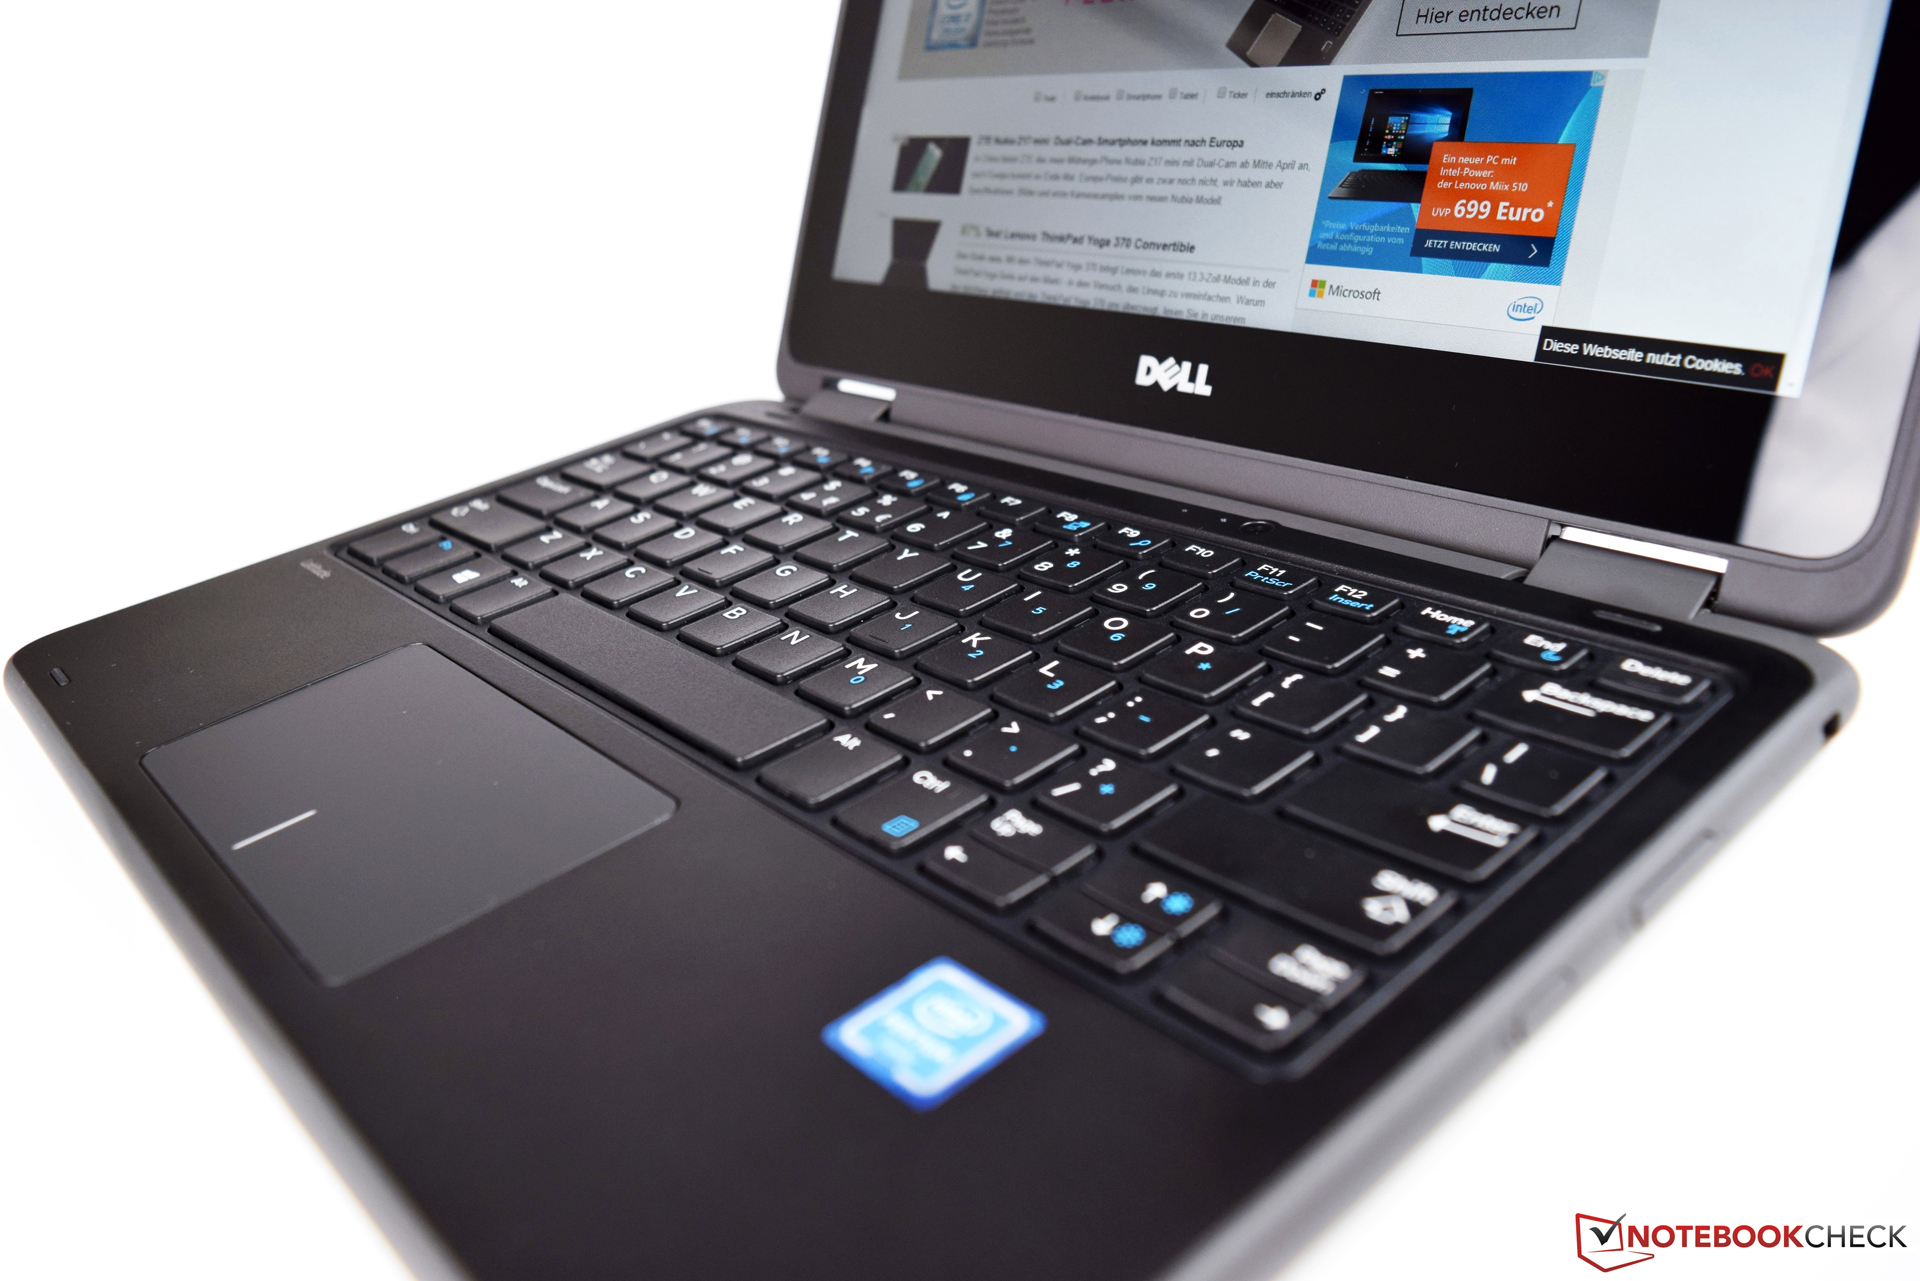
戴尔Latitude 3189是一台非常坚固的设备,这能够帮助孩子学习如何使用新媒体。有着稳固基础的设备能够执行很多任务,并且由于它出色的电池续航时间,一次充电能够轻松的坚持一整天的学校使用。
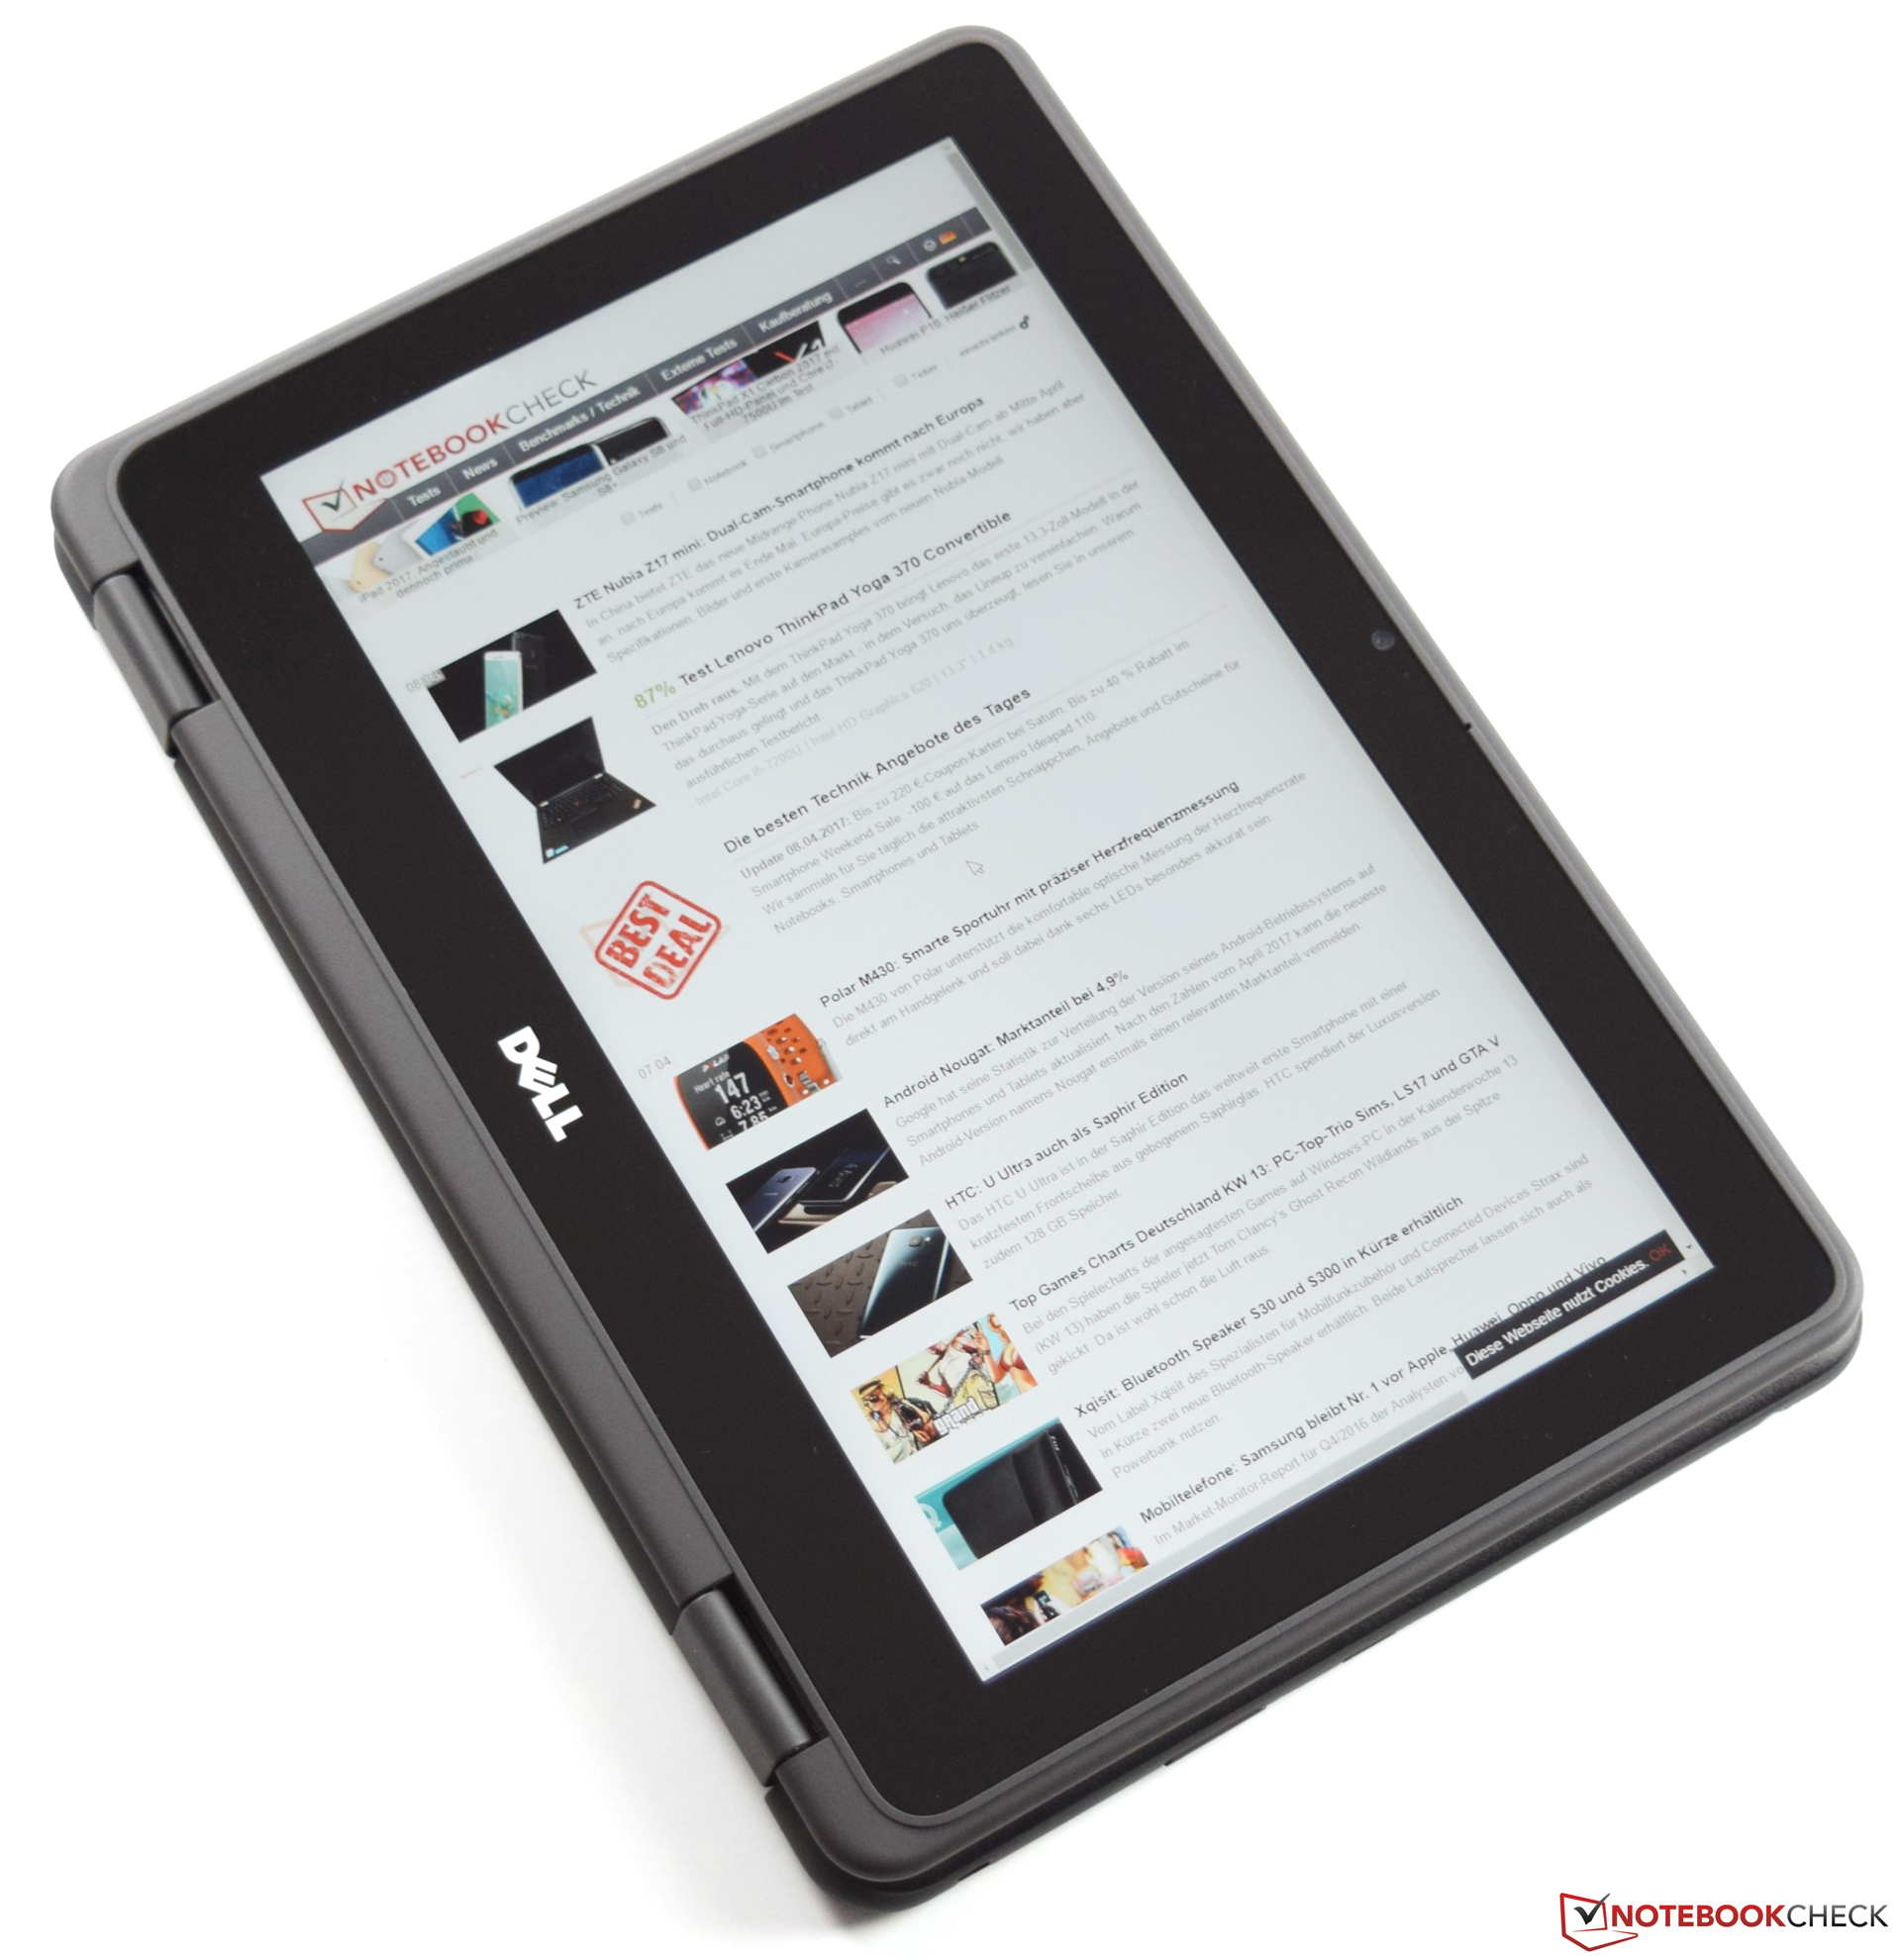
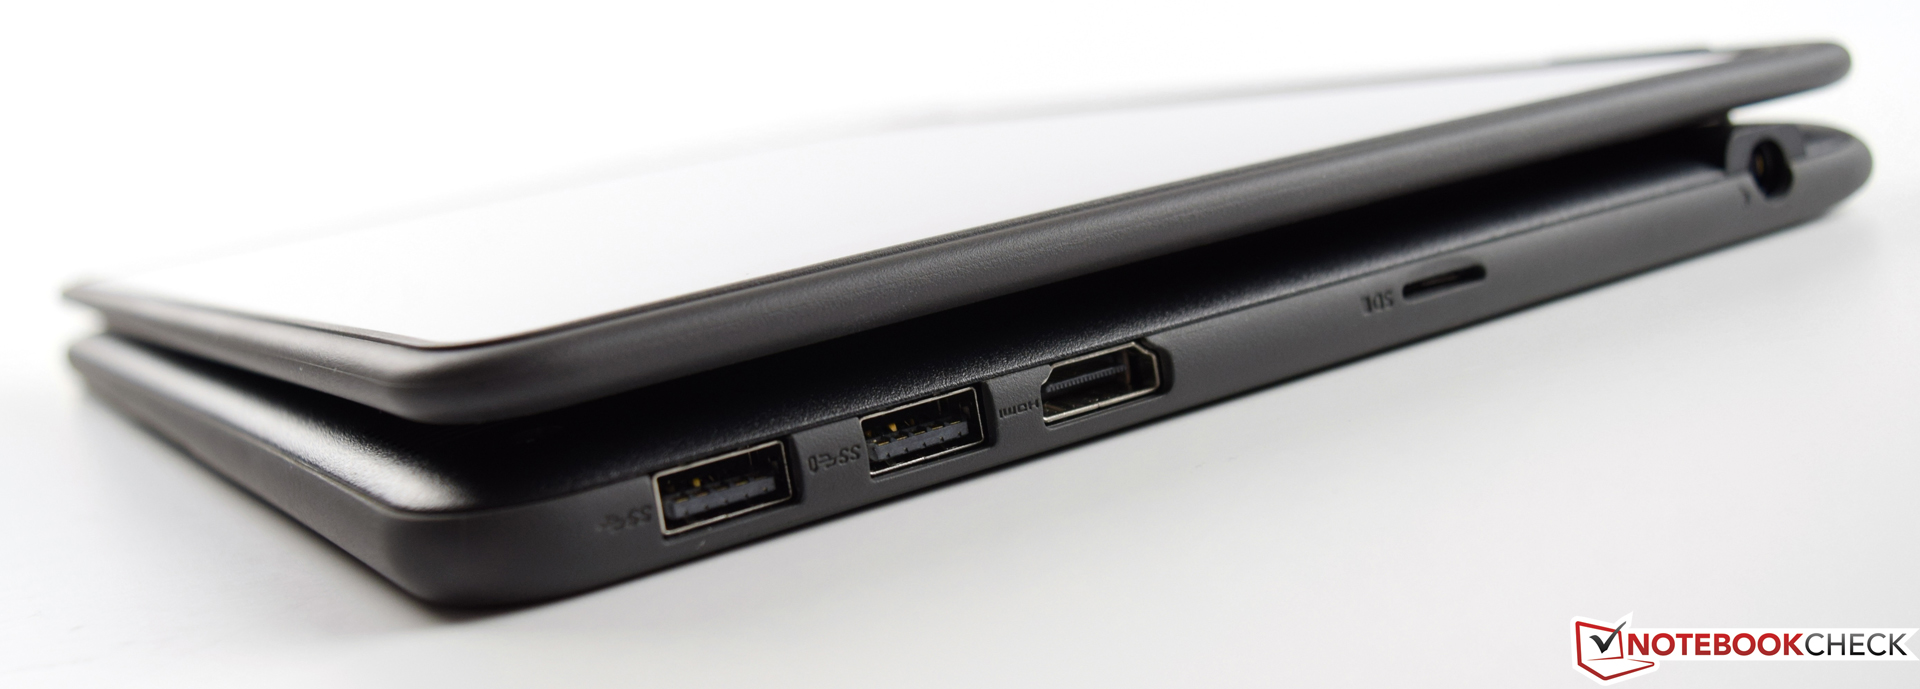
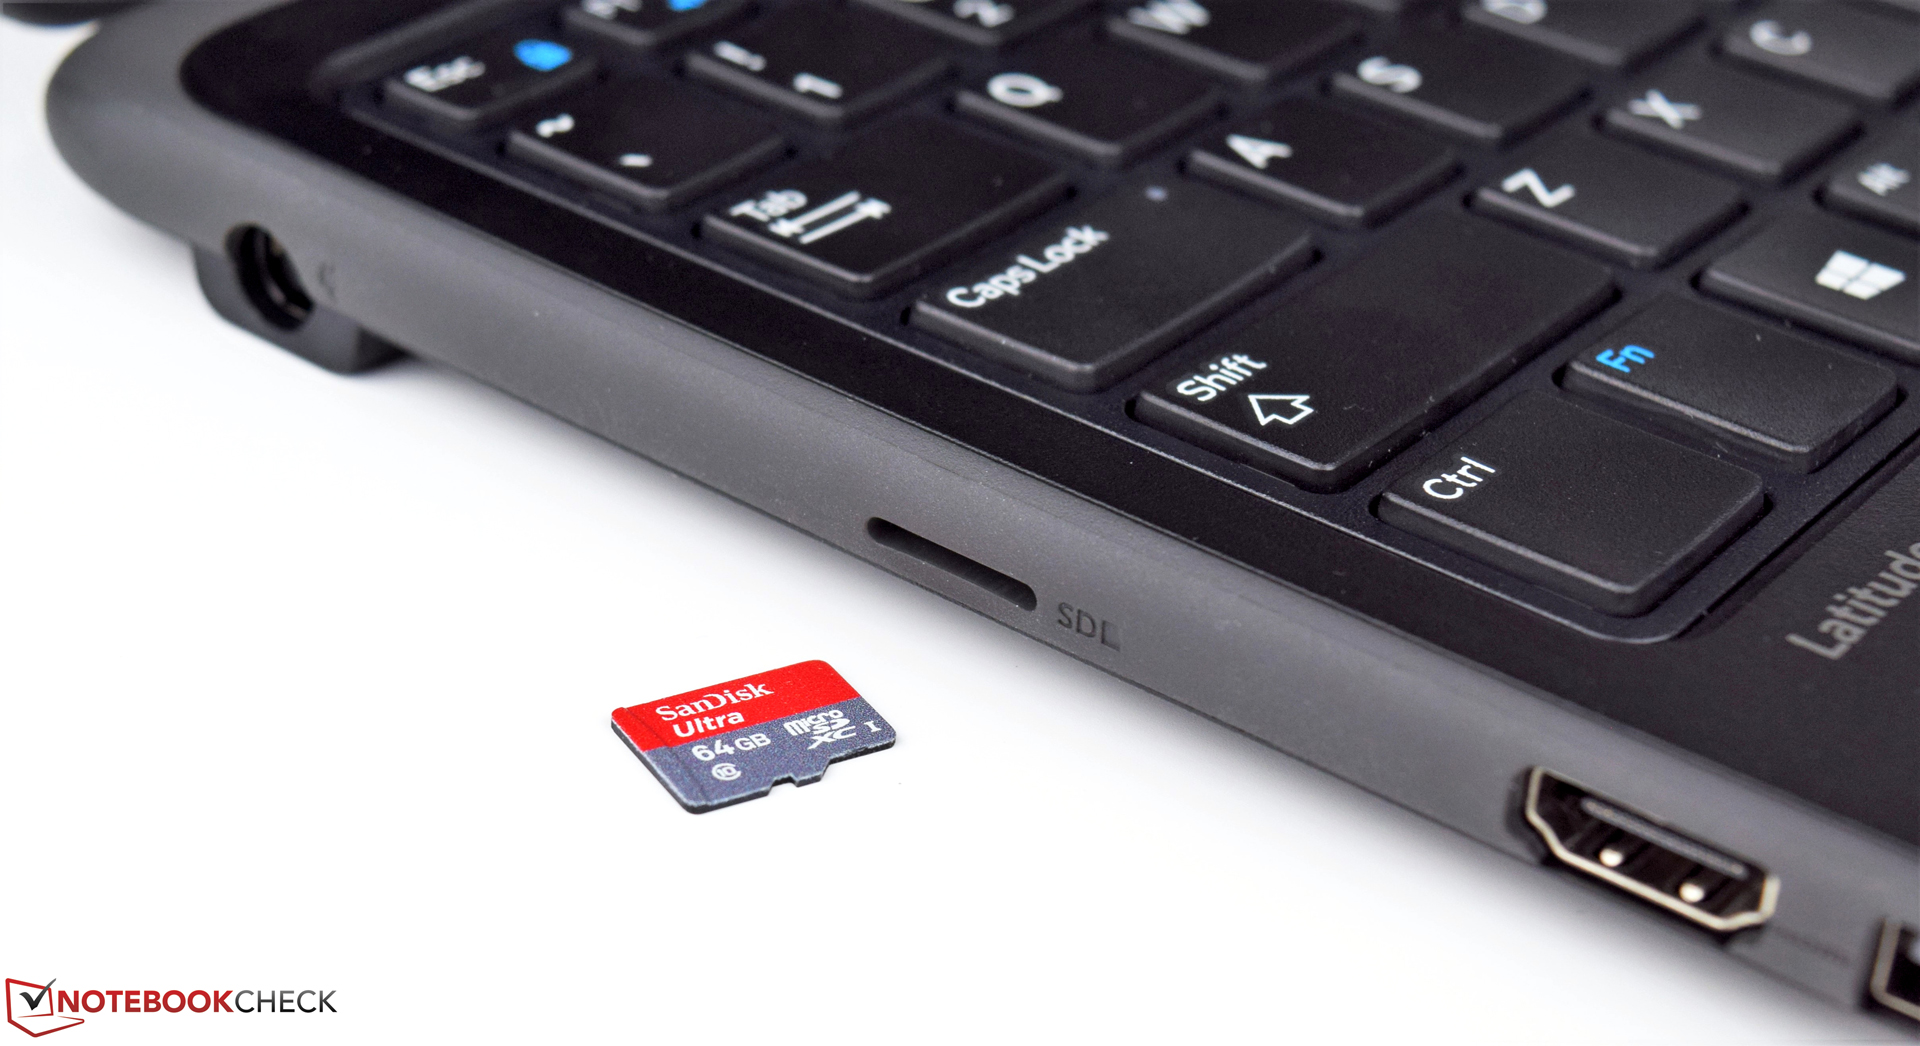
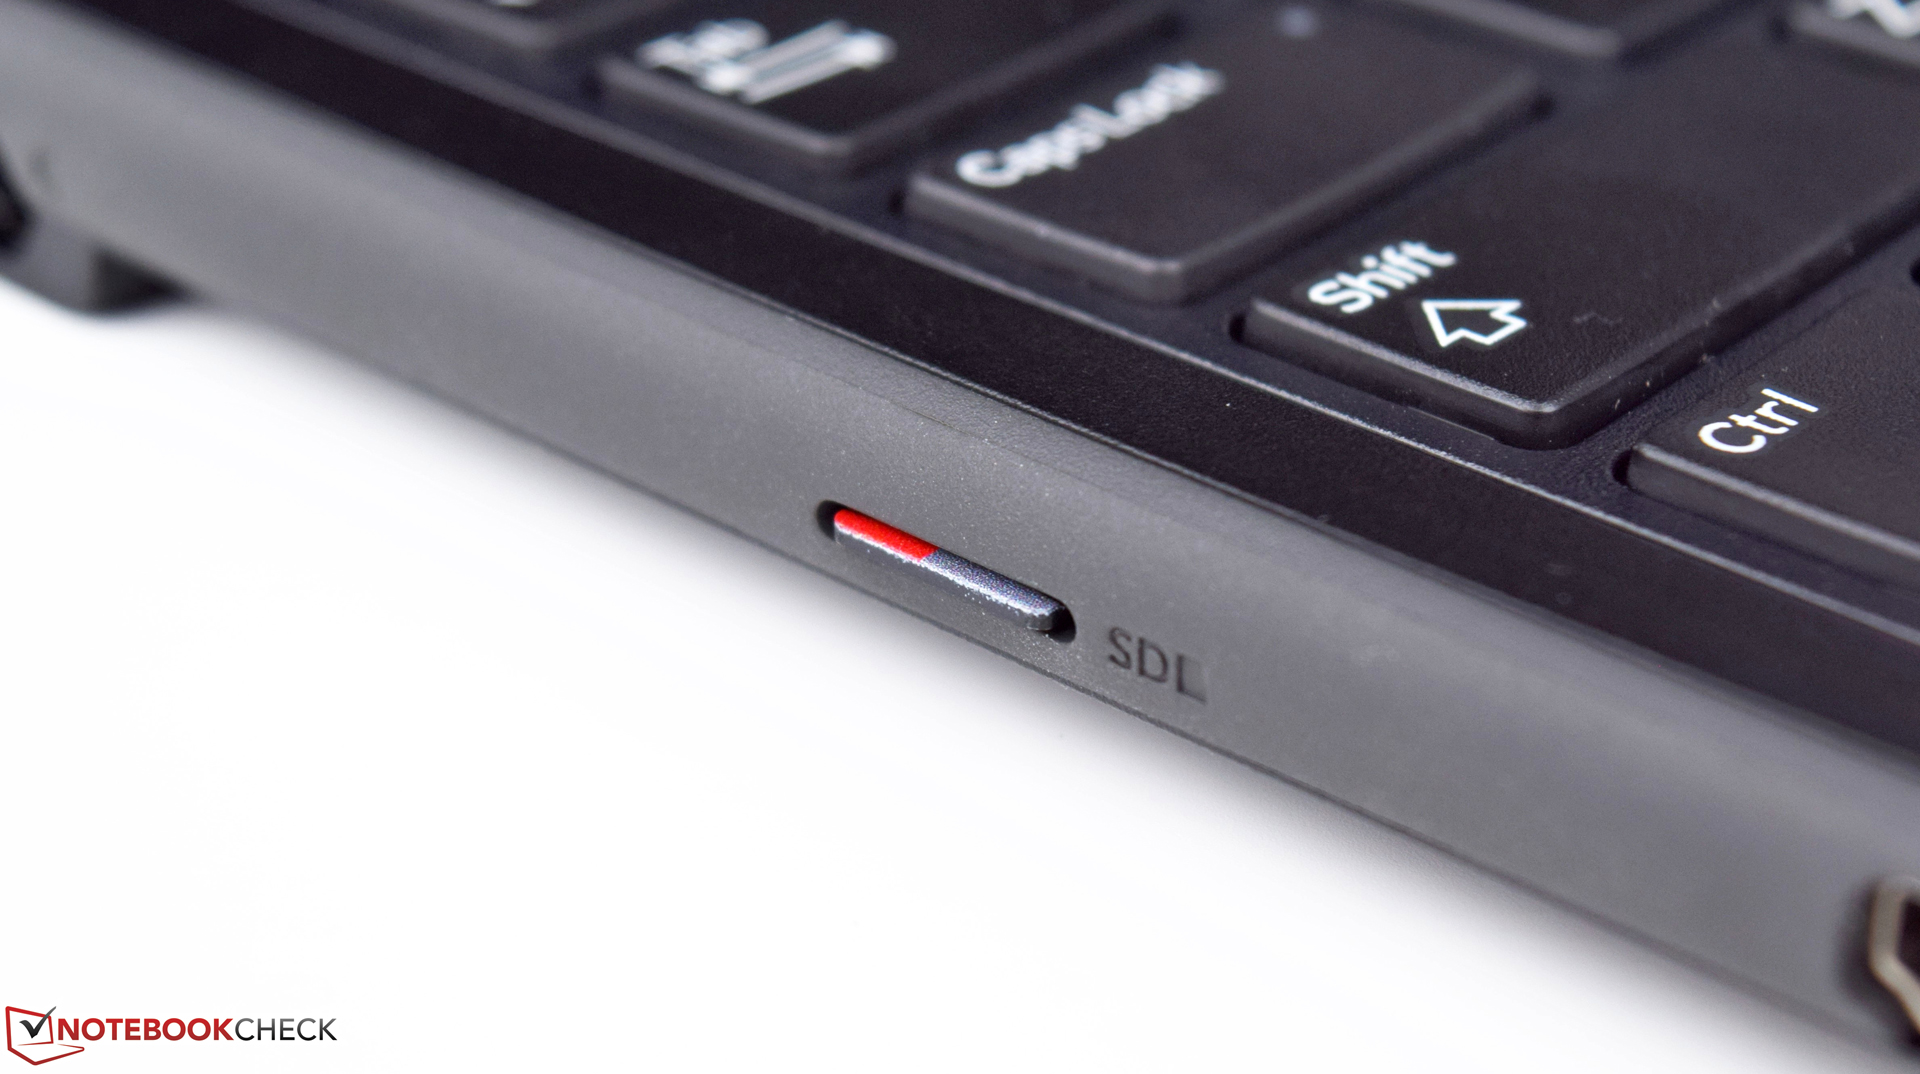
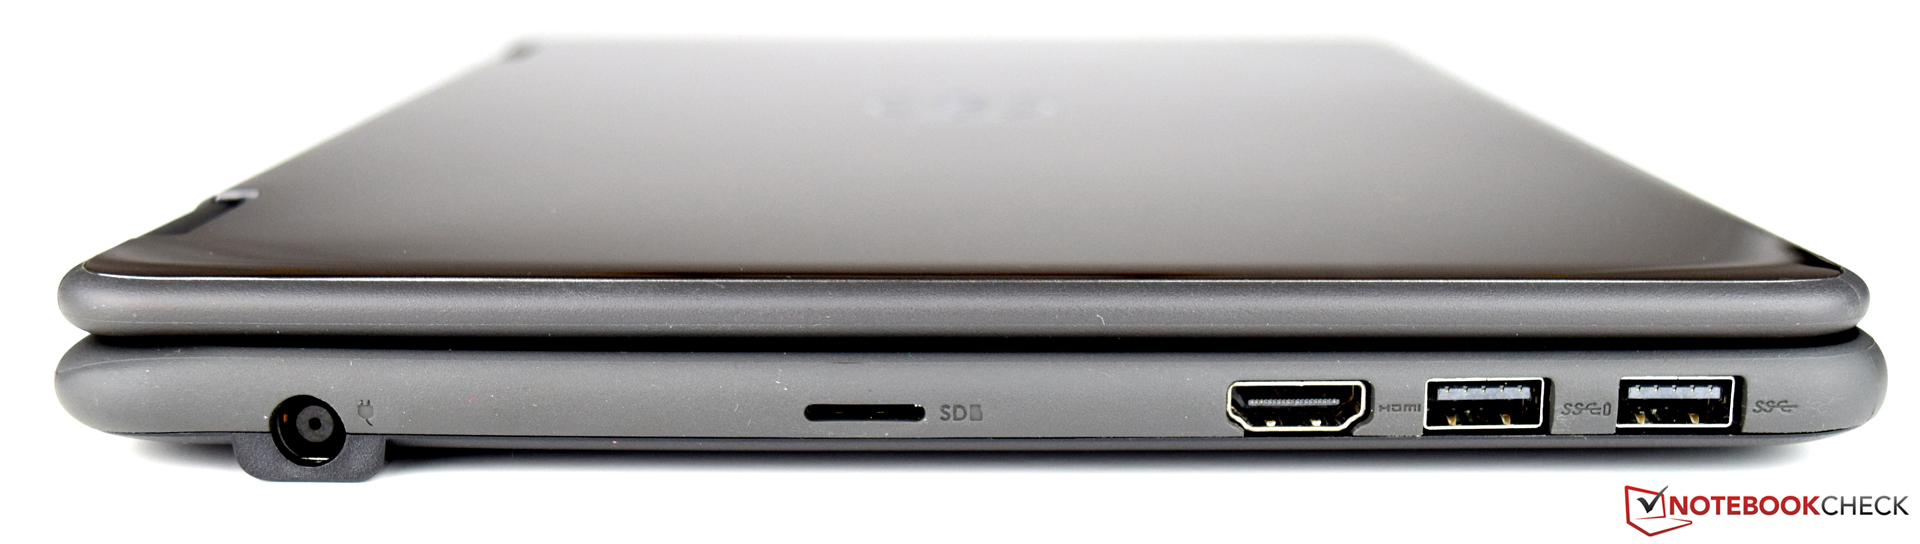
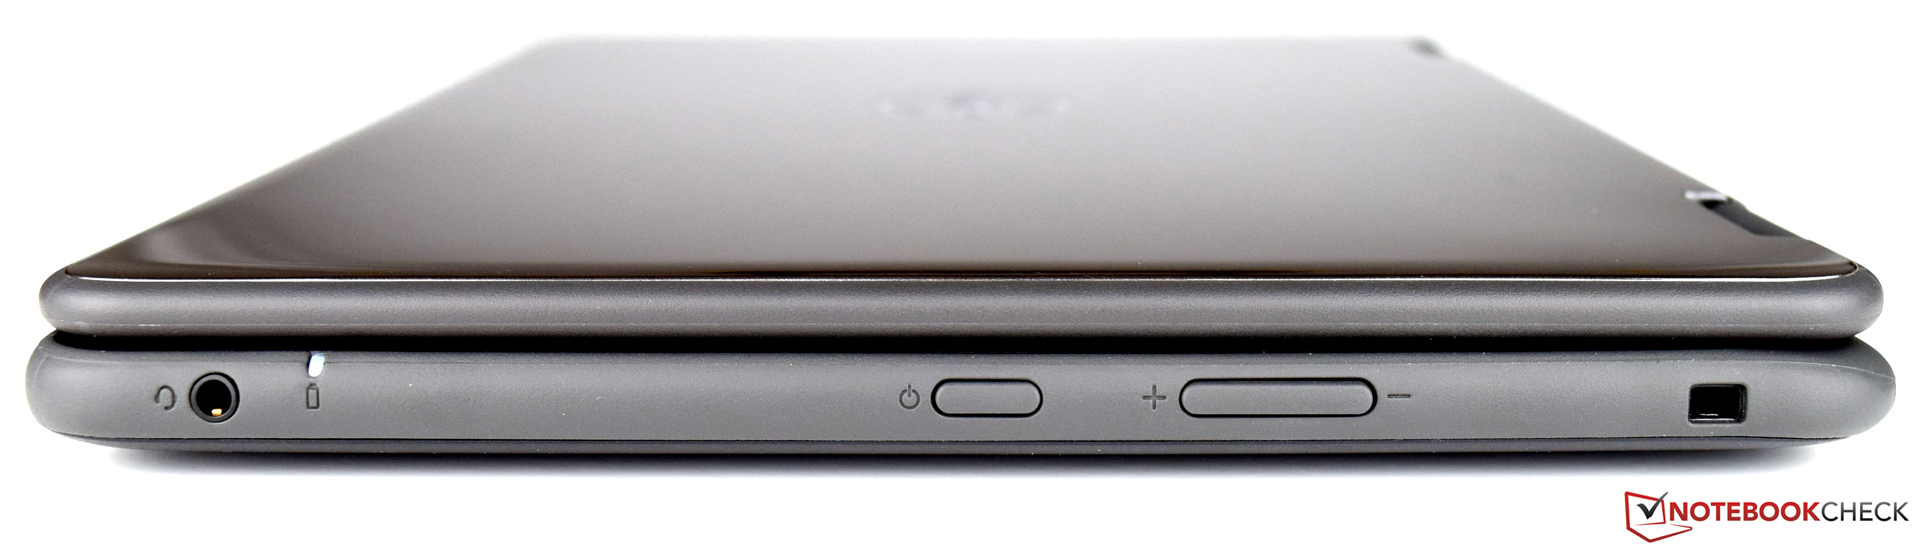
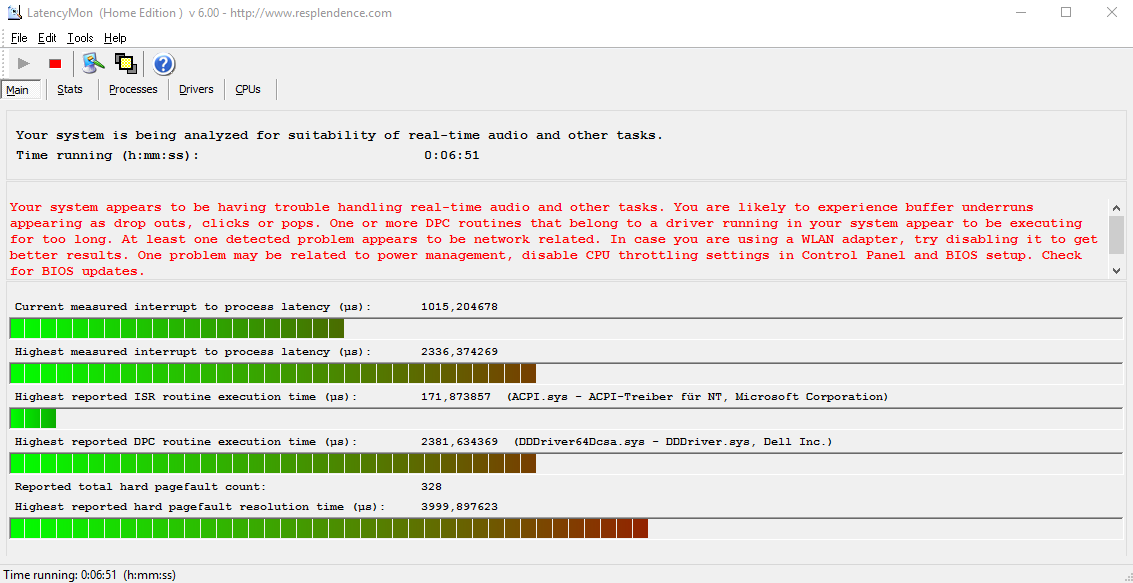
我们对戴尔Latitude 3189也有一些不满的地方:例如,缺失的USB Type-C型接口,这将保障这台设备的未来使用,高反射的显示屏,这让人不舒服同时难以在光亮环境中设备既有优点也有缺点。安装完操作系统和一些程序之后,128GB的存储空间所剩无几。总体来说,尽管在我们的部分测试项目中这台设备发挥的不是很好,但是我们觉得戴尔 Latitude 3189总体表现不错。从主观来看,这台设备的性能比跑分结果要强得多。
注:本文是基于完整评测的缩减版本,阅读完整的英文评测,请点击这里。
Dell Latitude 3189
- 04/25/2017 v6 (old)
Sebastian Bade