微星Bravo 15 B5DD笔记本电脑回顾。可怕的Radeon RX 5500M每美元性能
微星Bravo 15 B5DD是2020年Bravo 15 A4DCR的更新。尽管它们的名字可能相当相似,但较新的型号带有重新设计的机箱和较新的AMD处理器,同时保持700至900美元的诱人低价。
目前的SKU配备了Ryzen 5 5600H或Ryzen 7 5800H CPU,有不同级别的存储或内存。所有配置都采用相同的144赫兹FHD面板和Radeon RX 5500M GPU,没有其他选择。
这一领域的竞争者包括其他入门级15.6英寸游戏笔记本电脑,如 华硕TUF游戏F15, 联想Legion 5 15, 戴尔G15系列, 或 HPPavilion Gaming 15.
更多的微星评论。
潜在的竞争对手比较
Rating | Date | Model | Weight | Height | Size | Resolution | Price |
|---|---|---|---|---|---|---|---|
| 78.2 % v7 (old) | 04 / 2022 | MSI Bravo 15 B5DD-010US R5 5600H, Radeon RX 5500M | 2.3 kg | 24.95 mm | 15.60" | 1920x1080 | |
| 79.5 % v7 (old) | MSI Bravo 15 A4DCR R7 4800H, Radeon RX 5300M | 2 kg | 22 mm | 15.60" | 1920x1080 | ||
| 87.2 % v7 (old) | 03 / 2022 | Asus TUF Gaming F15 FX507ZM i7-12700H, GeForce RTX 3060 Laptop GPU | 2.1 kg | 24.95 mm | 15.60" | 1920x1080 | |
| 82.7 % v7 (old) | 10 / 2021 | Dell G15 5515 R7 5800H, GeForce RTX 3050 Ti Laptop GPU | 2.4 kg | 24.9 mm | 15.60" | 1920x1080 | |
| 79.7 % v7 (old) | 03 / 2022 | Lenovo Ideapad Gaming 3 15IHU-82K1002RGE i5-11300H, GeForce RTX 3050 Ti Laptop GPU | 2 kg | 24.2 mm | 15.60" | 1920x1080 | |
| 82.2 % v7 (old) | 08 / 2021 | Acer Nitro 5 AN515-45-R1JH R7 5800H, GeForce RTX 3070 Laptop GPU | 2.3 kg | 23.9 mm | 15.60" | 2560x1440 |
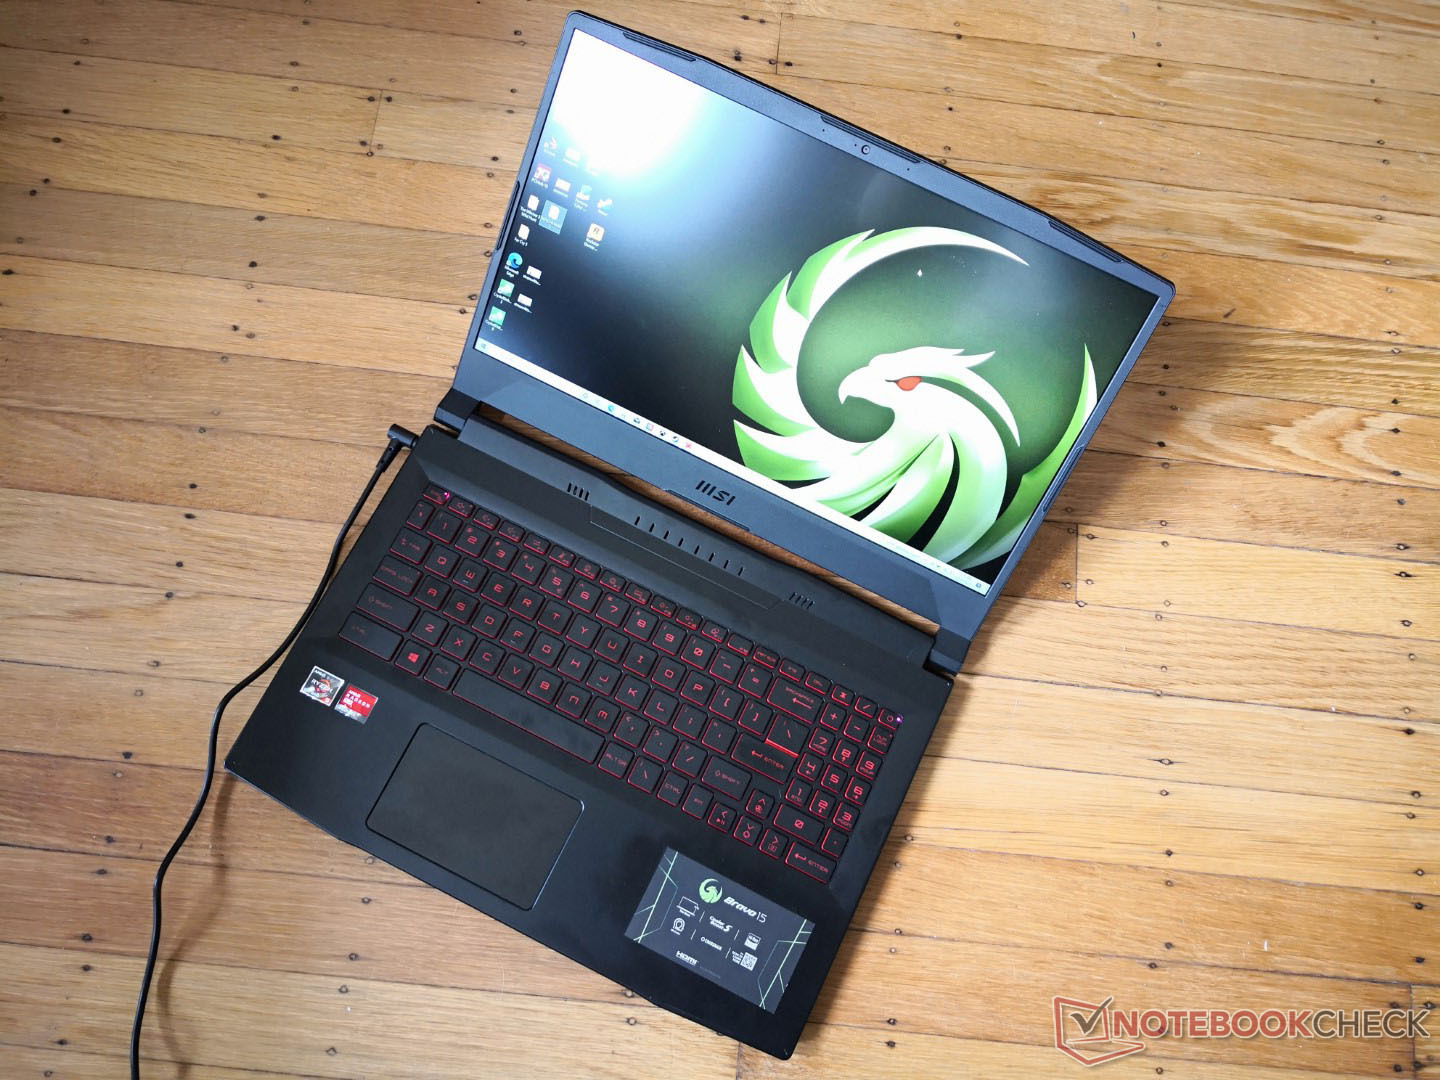
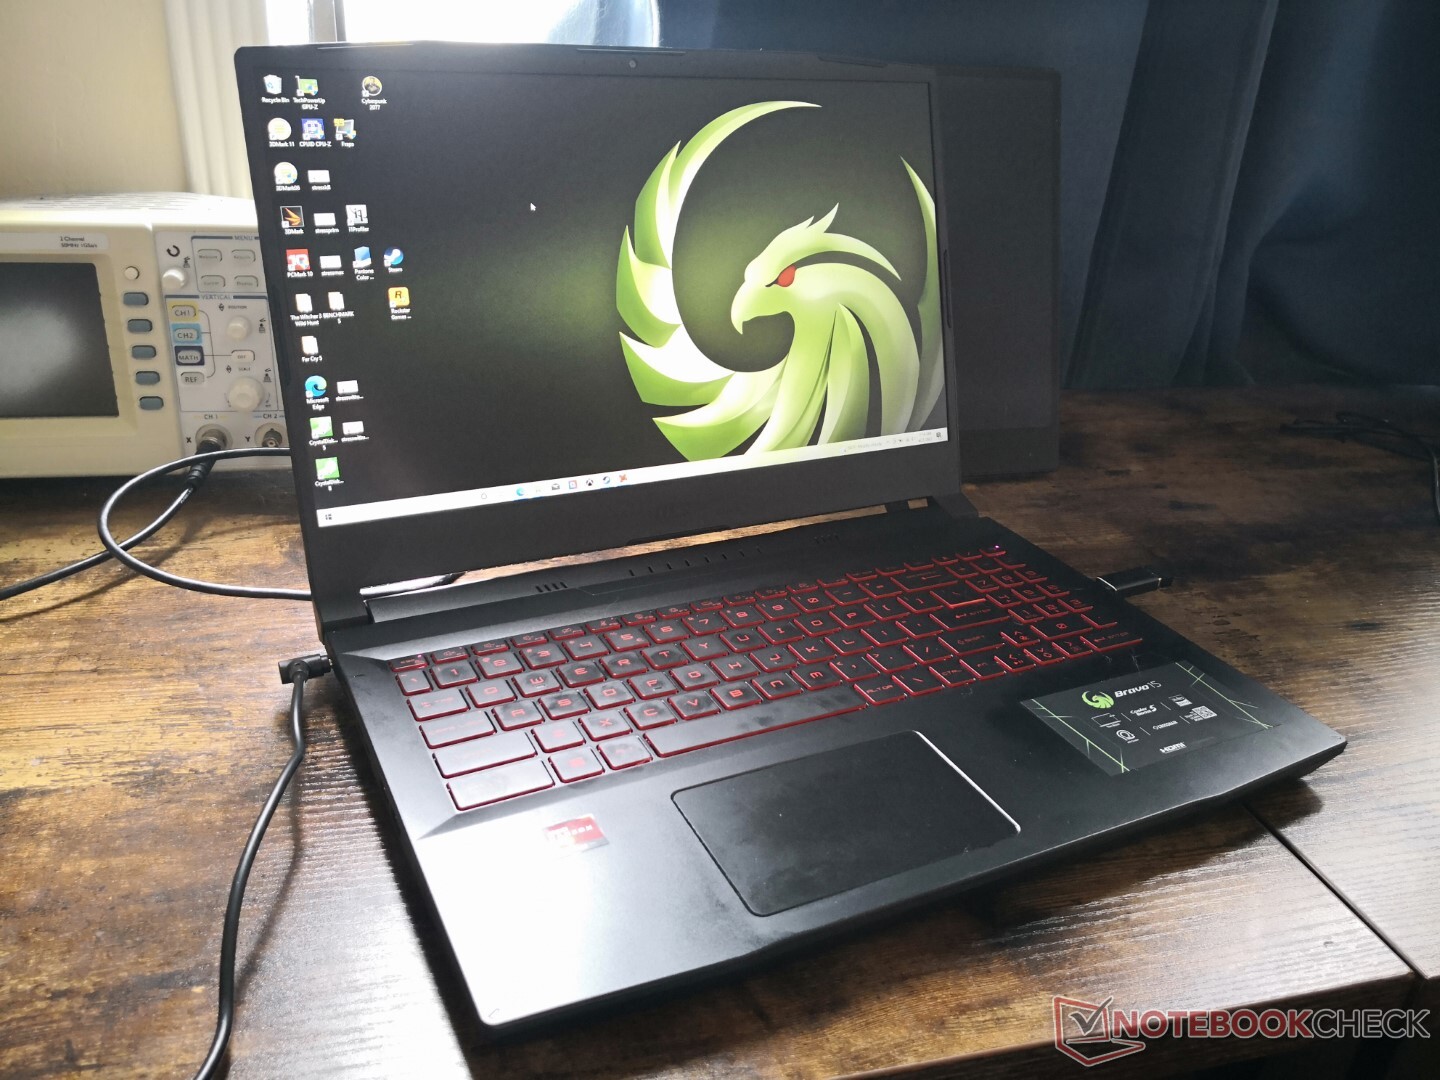
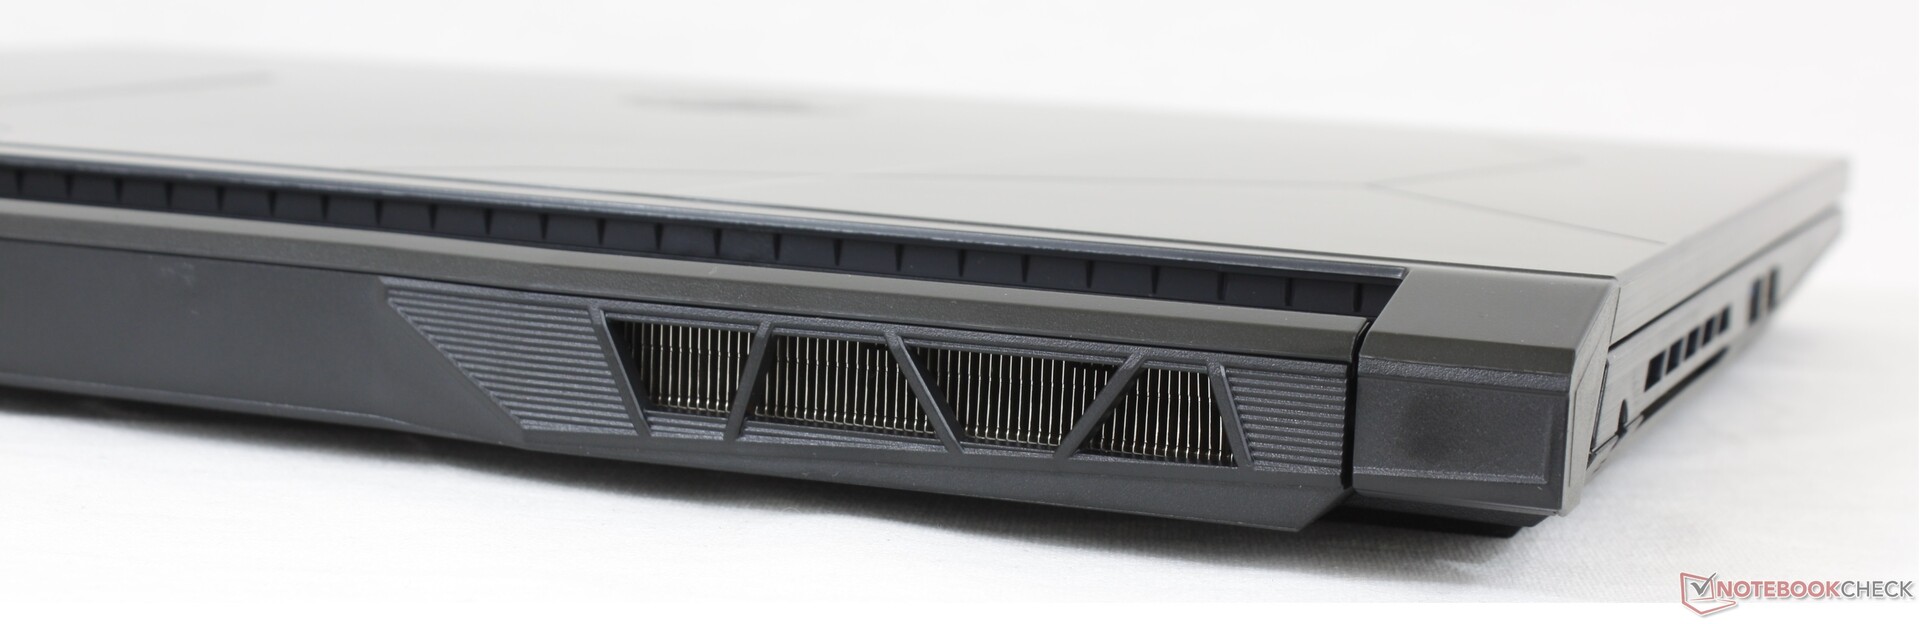
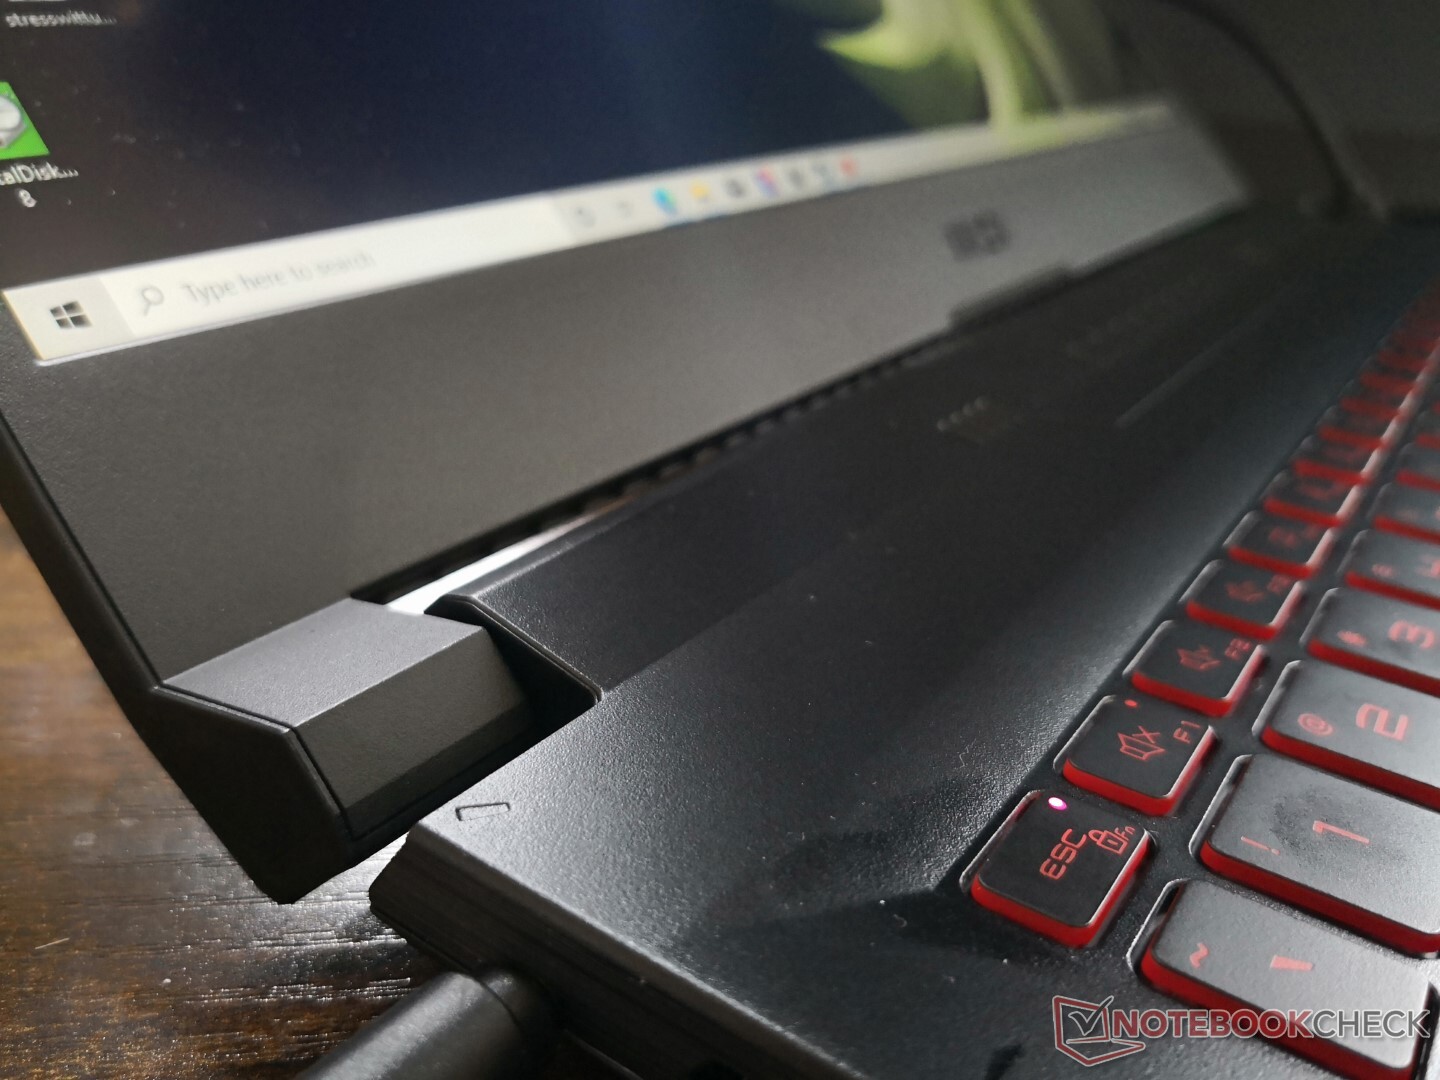
案例 - 塑料无处不在
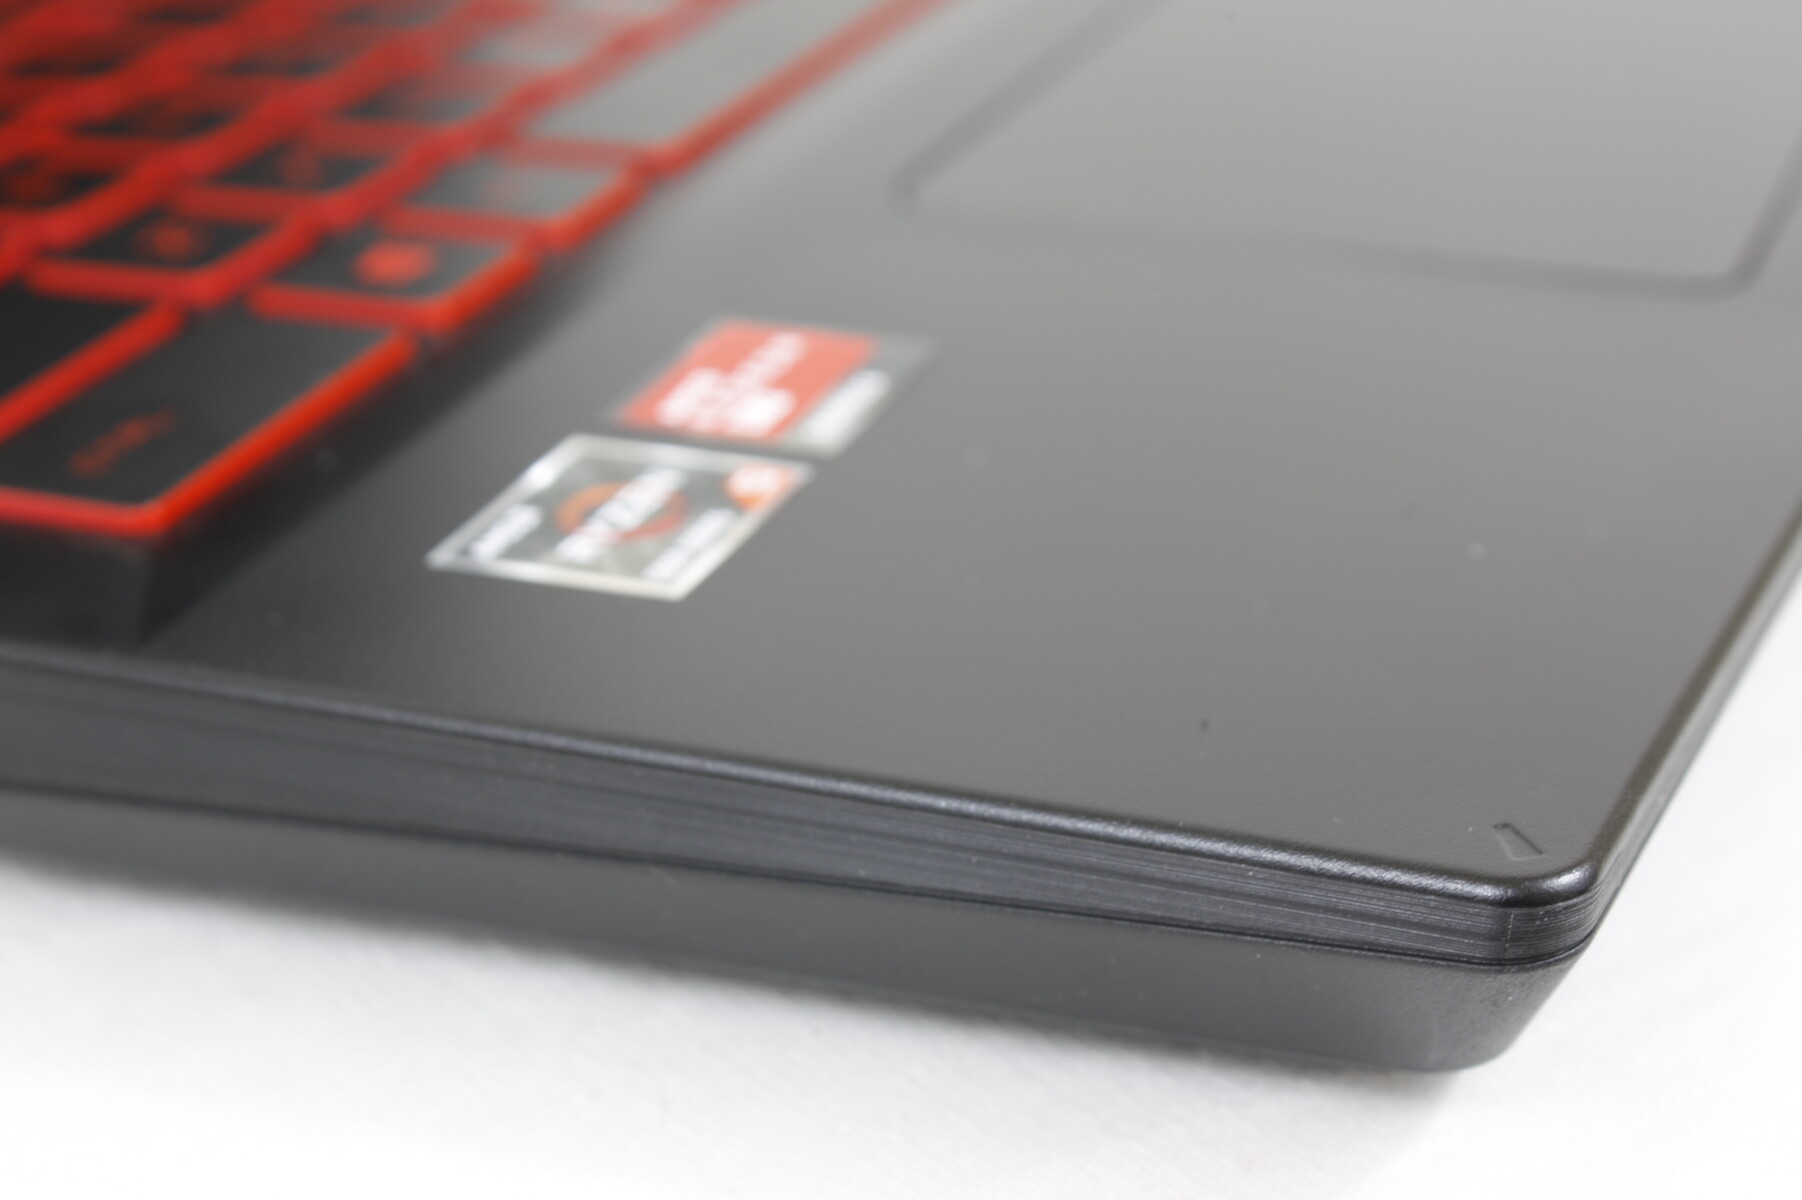
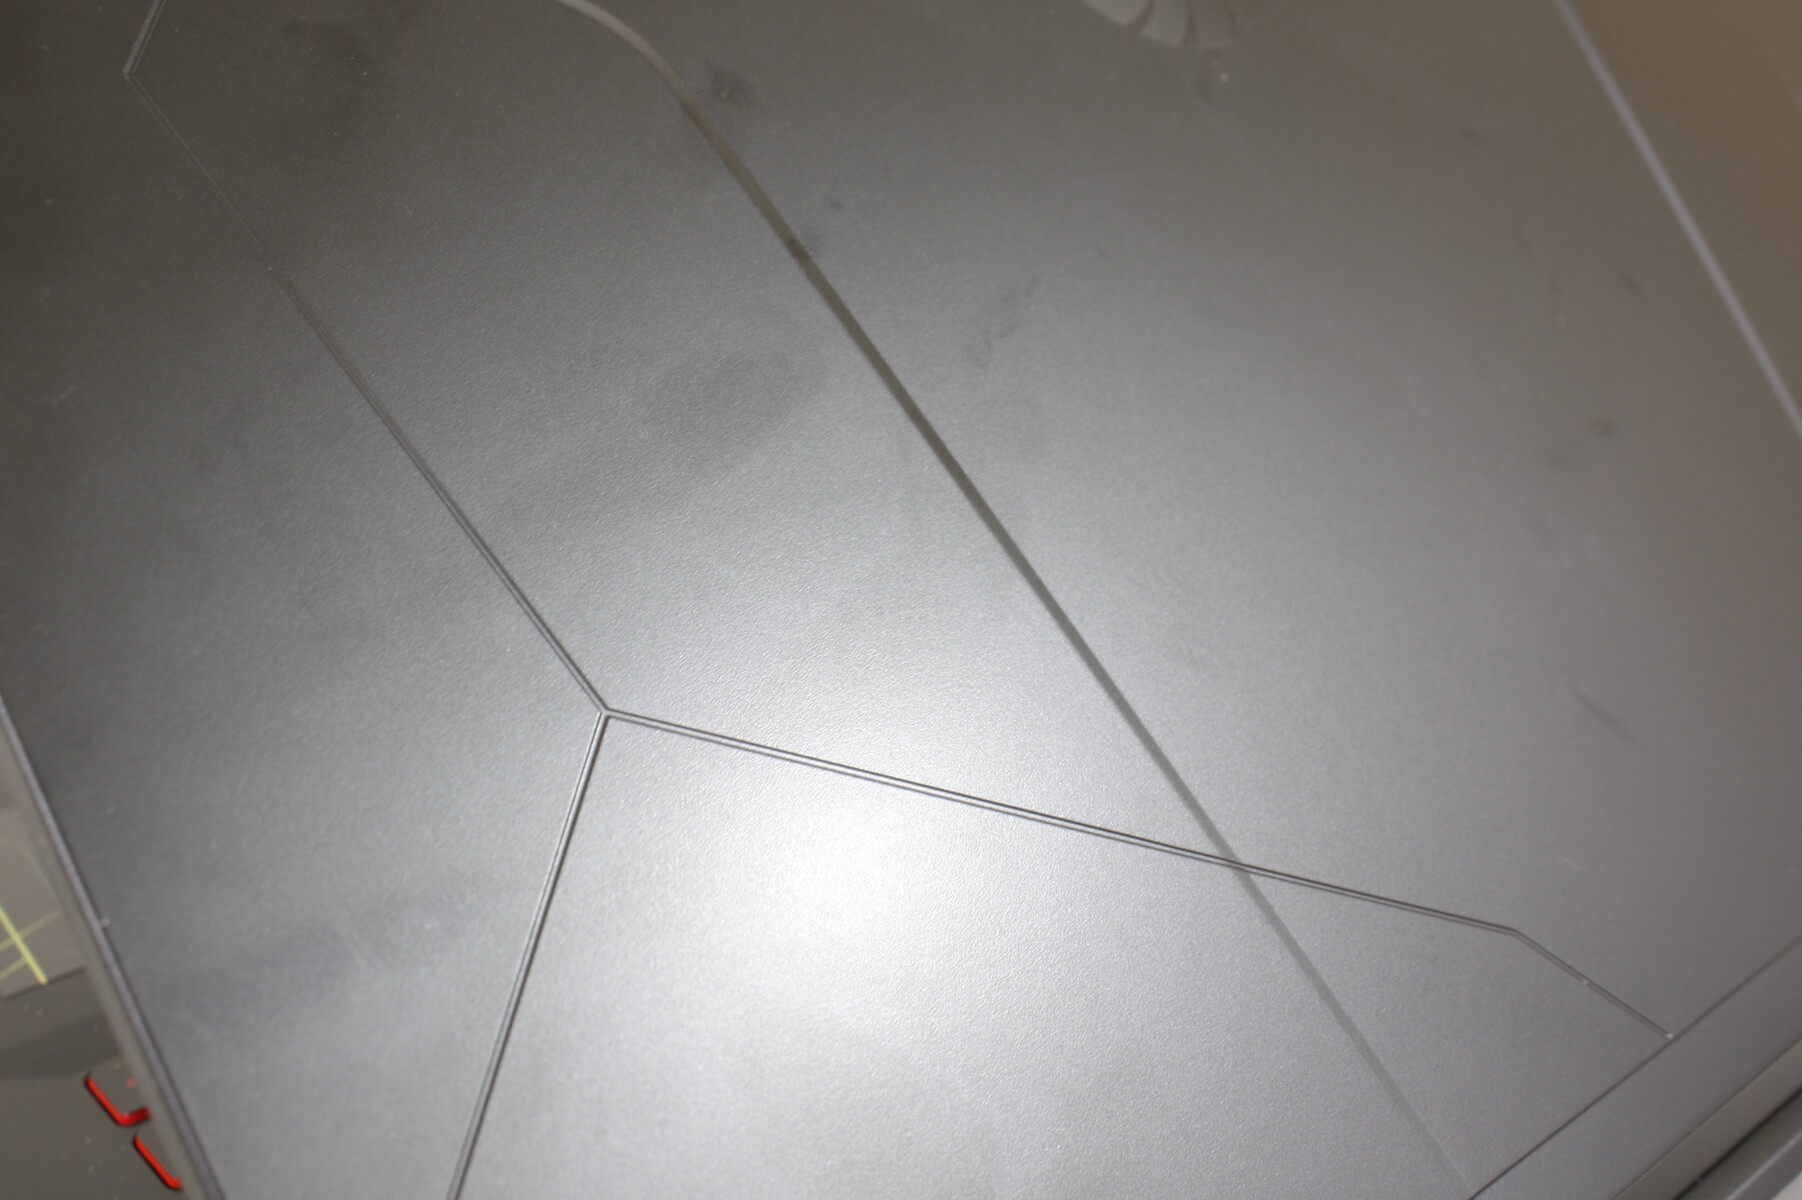
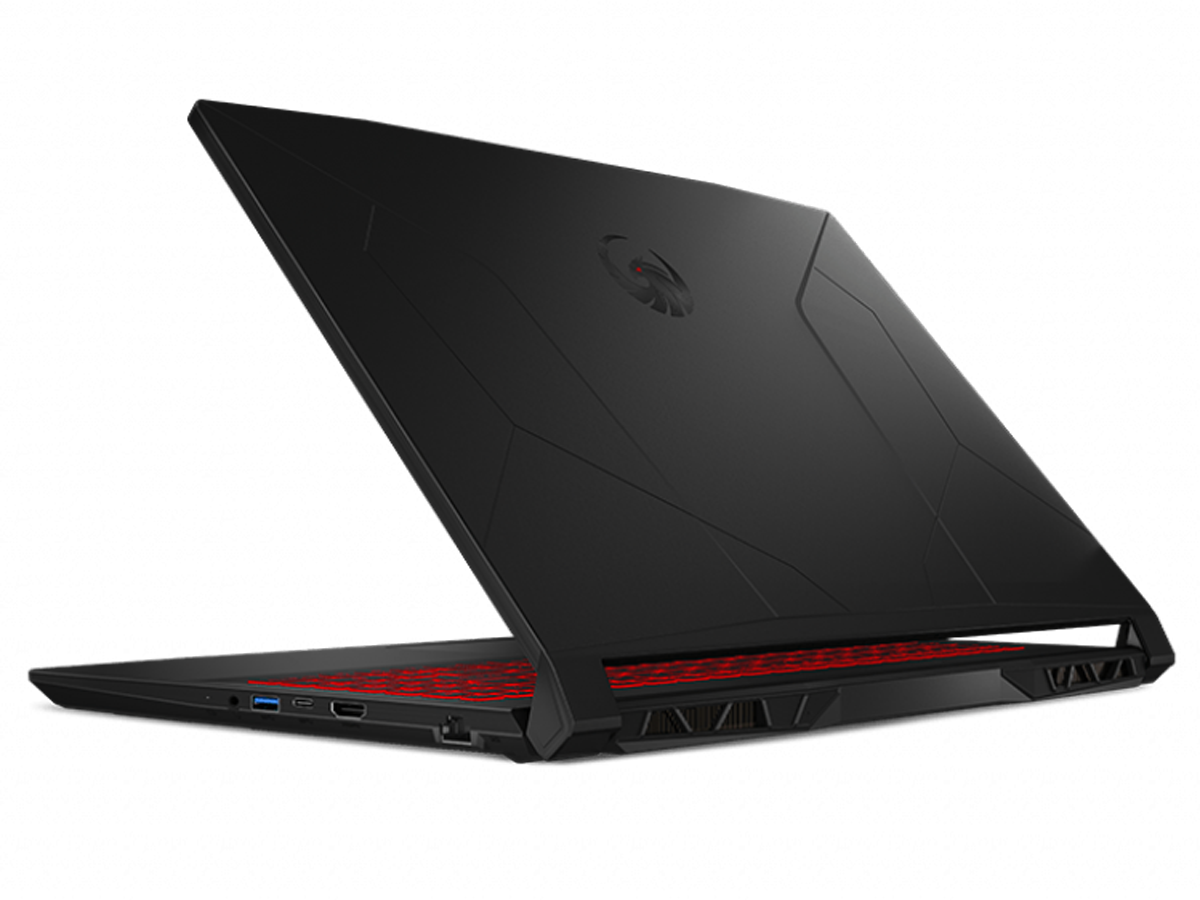
2020年的Bravo 15有一个拉丝铝制外盖和底座,而最新的Bravo 15设计则相反,大部分是哑光塑料。这是一个比较沉闷的外观,与其他预算游戏笔记本电脑如 Acer Nitro 5或 技嘉G5.微星将其更光滑和更豪华的设计保留给更高端的GE、GT或GS系列的机型。
对于一台廉价的游戏笔记本电脑来说,机箱的刚性很强。在键盘中心或外盖上施加压力会使它们各自的表面轻微翘起,但不会达到令人担忧的程度。试图扭动系统也不会导致任何吱吱作响。然而,在调整角度时,铰链的摆动幅度太大,不符合我们的喜好,这使系统感觉很廉价。
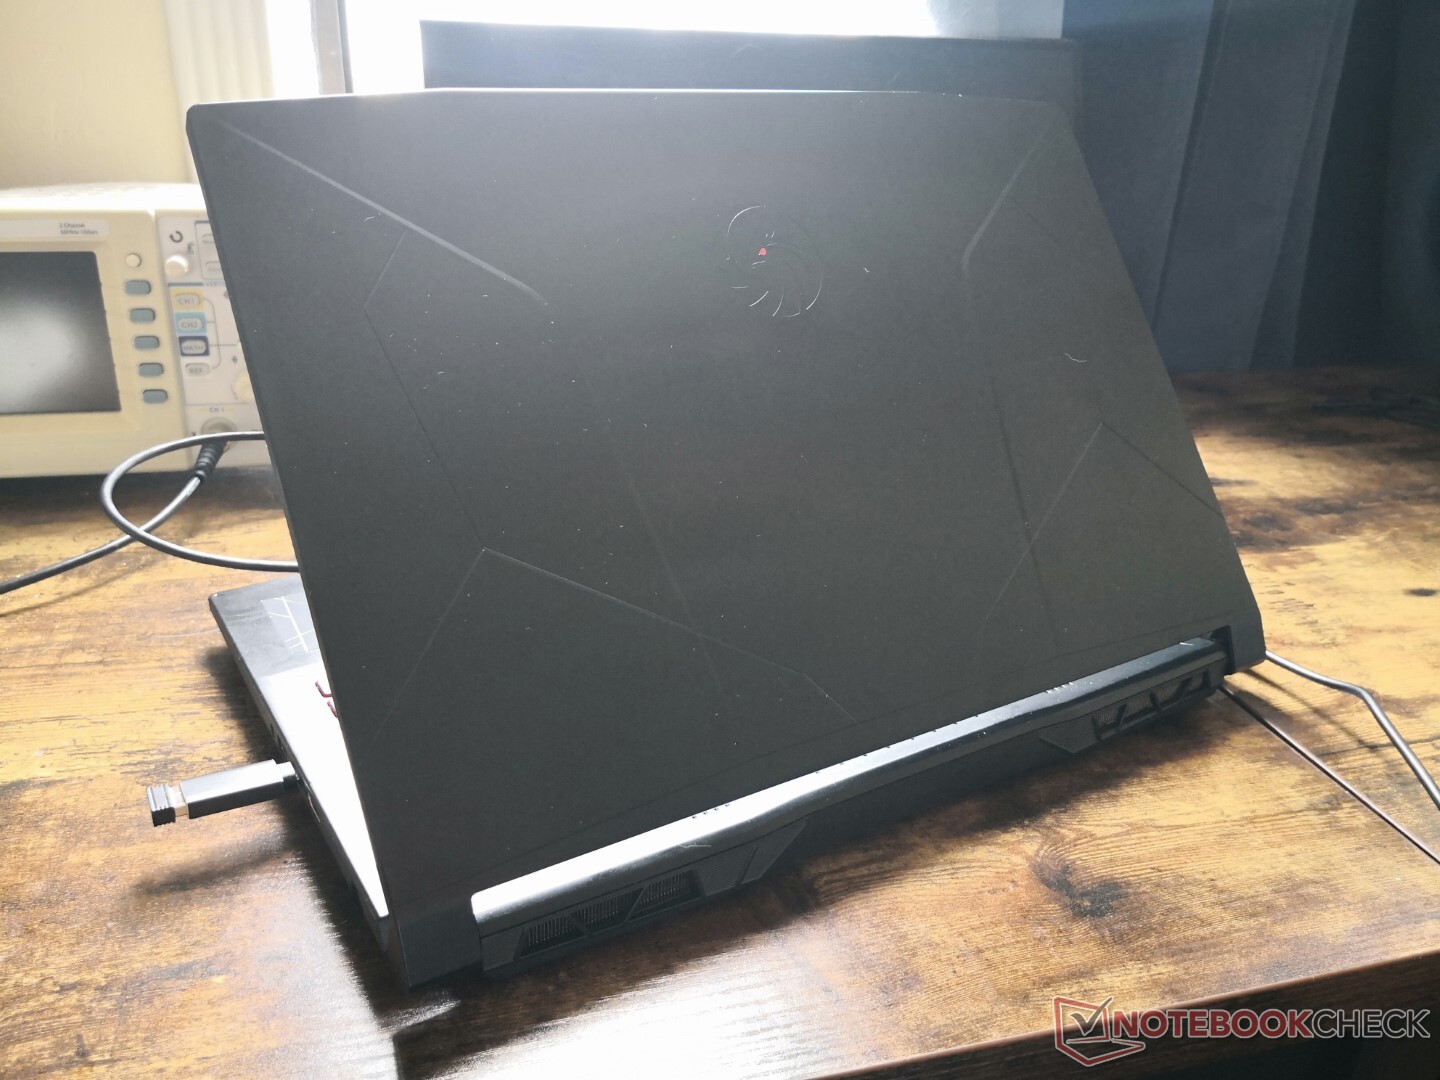
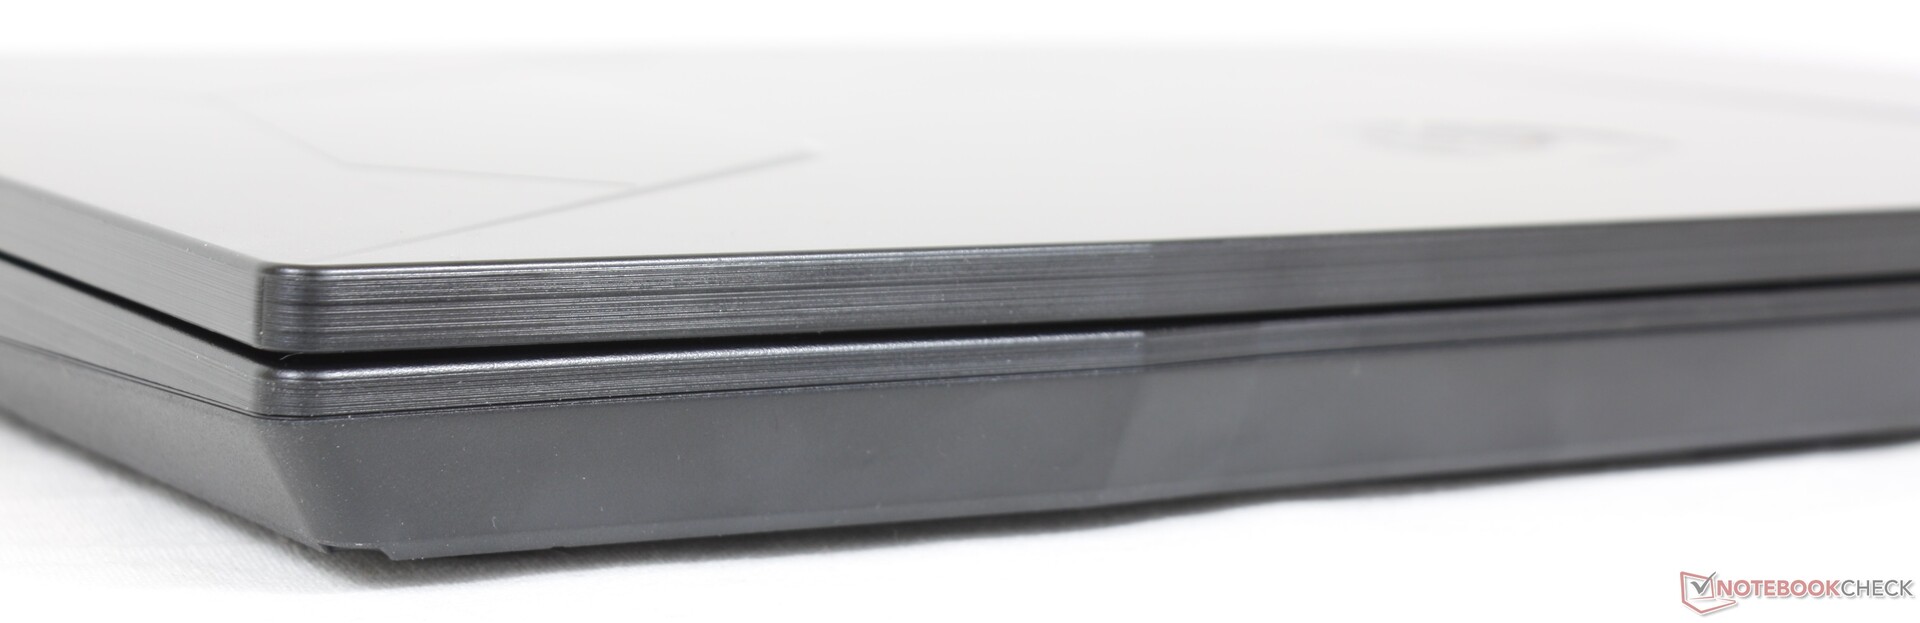
在尺寸和重量方面,较新的Bravo 15型号比其直接的前辈更大更重(2.3公斤对2.0公斤),正如我们下面的尺寸比较所示。像联想Ideapad Gaming 3 15或华硕TUF Gaming F15 FX507ZM这样的竞争机型总体上更轻更小。
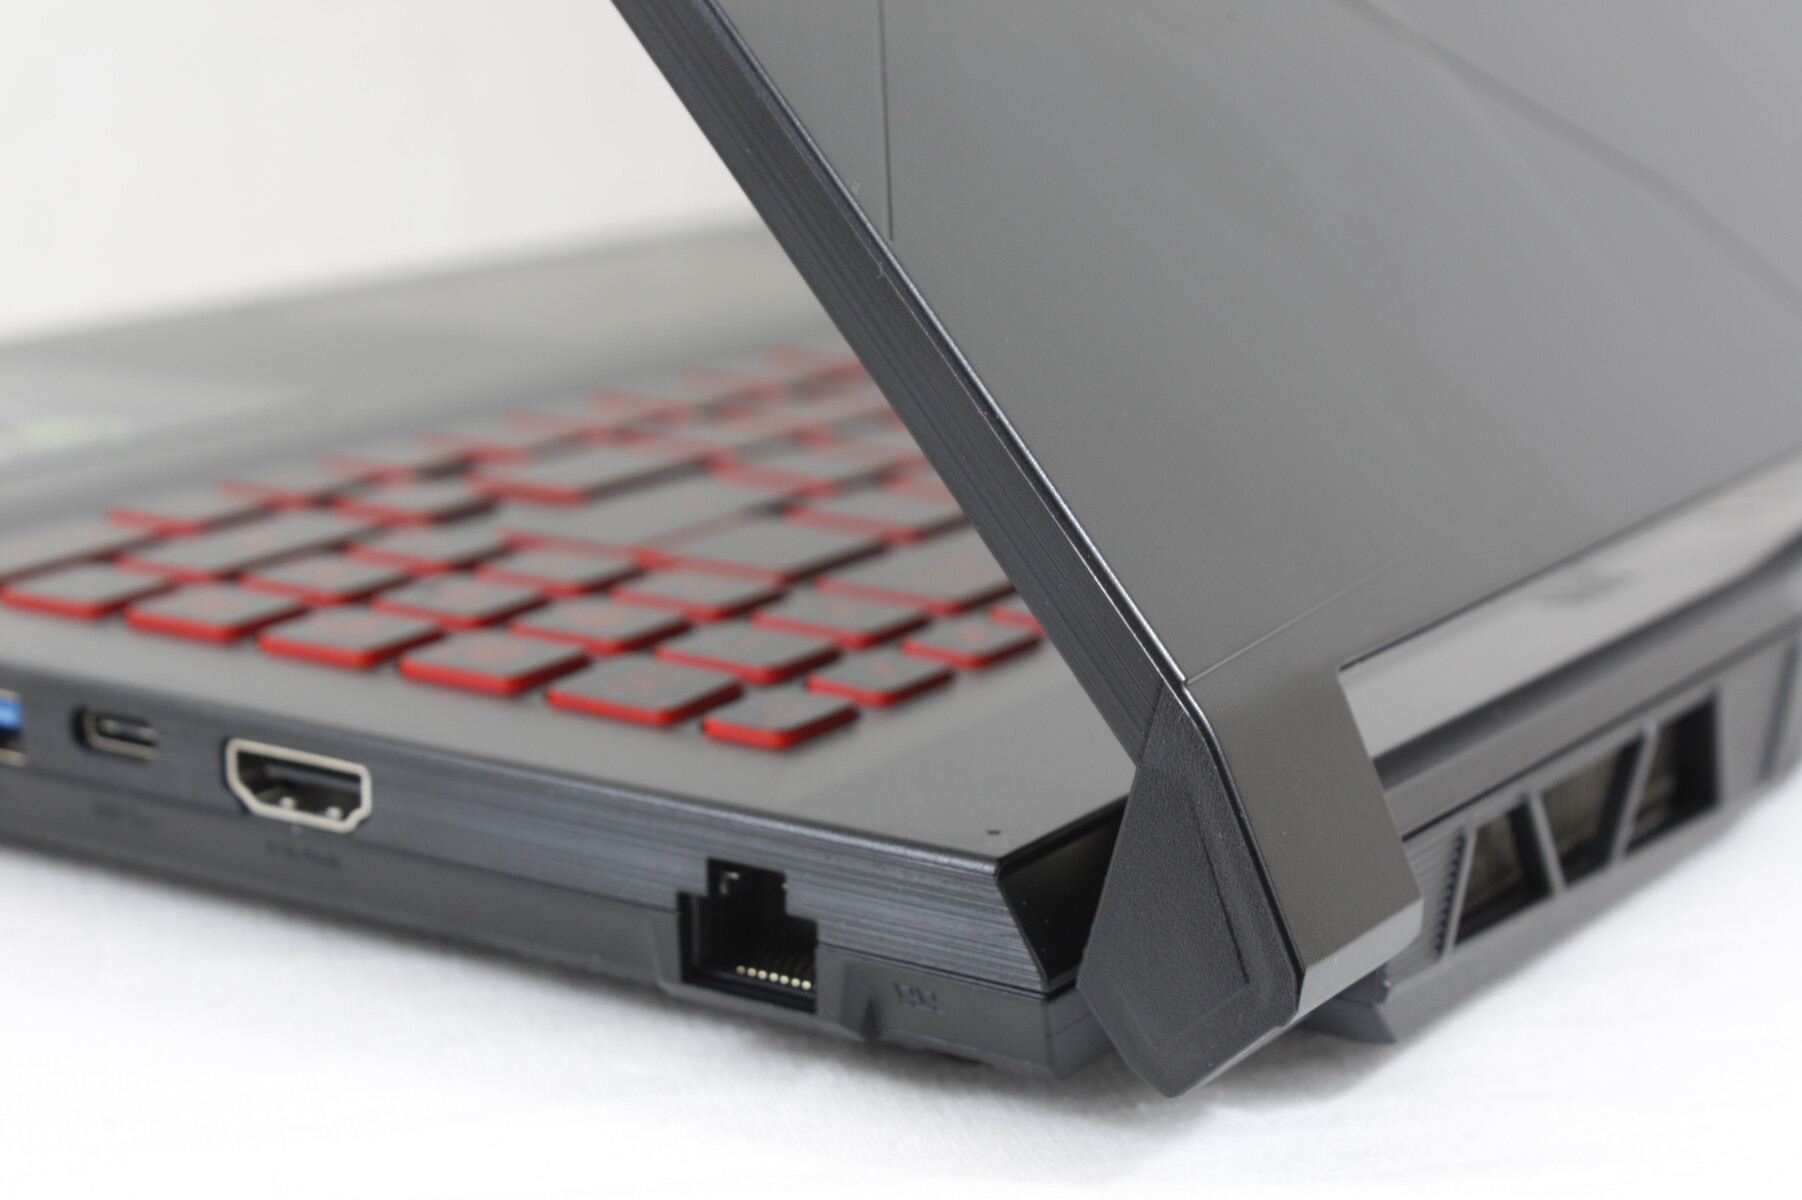
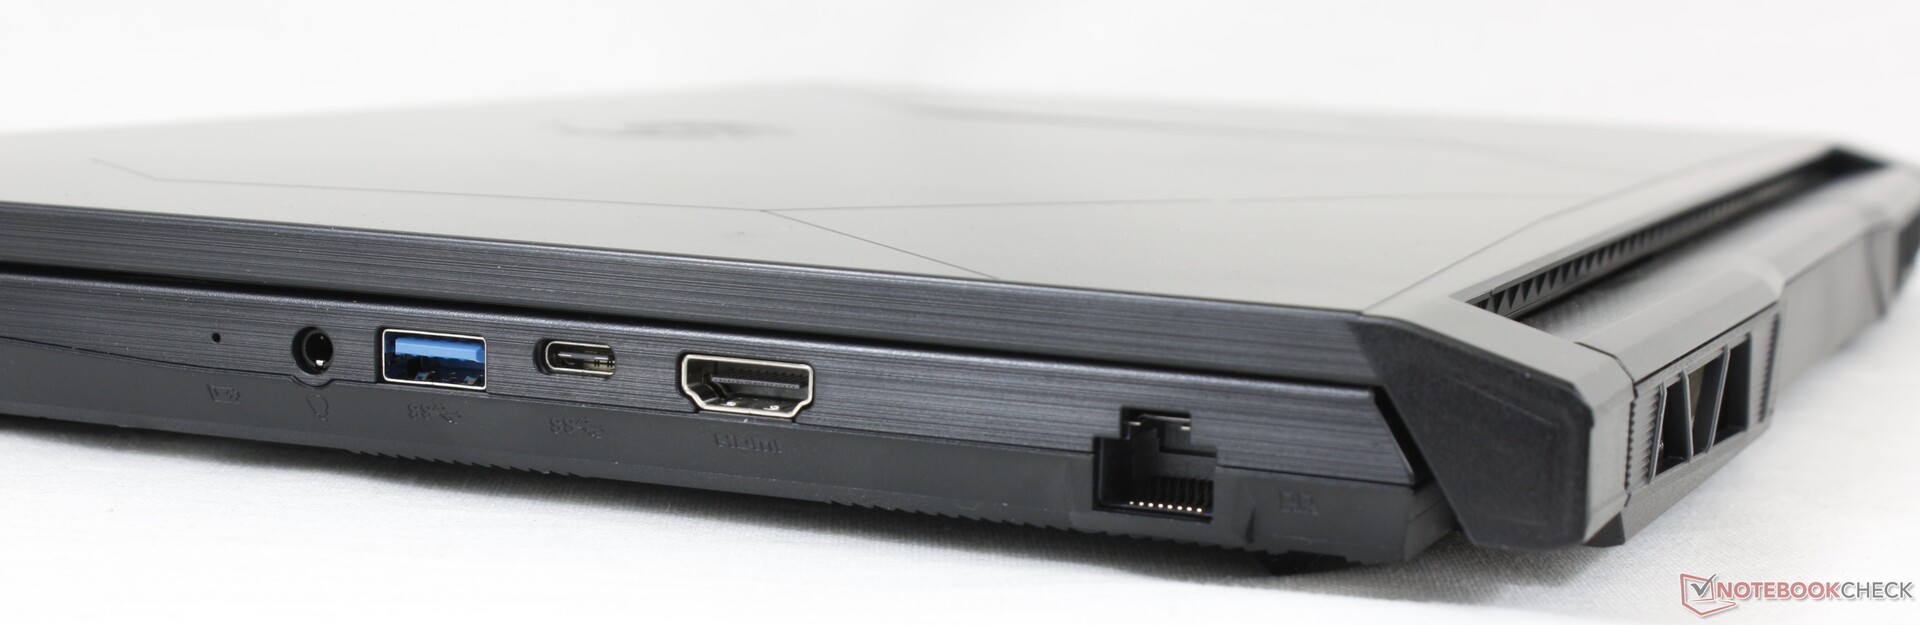
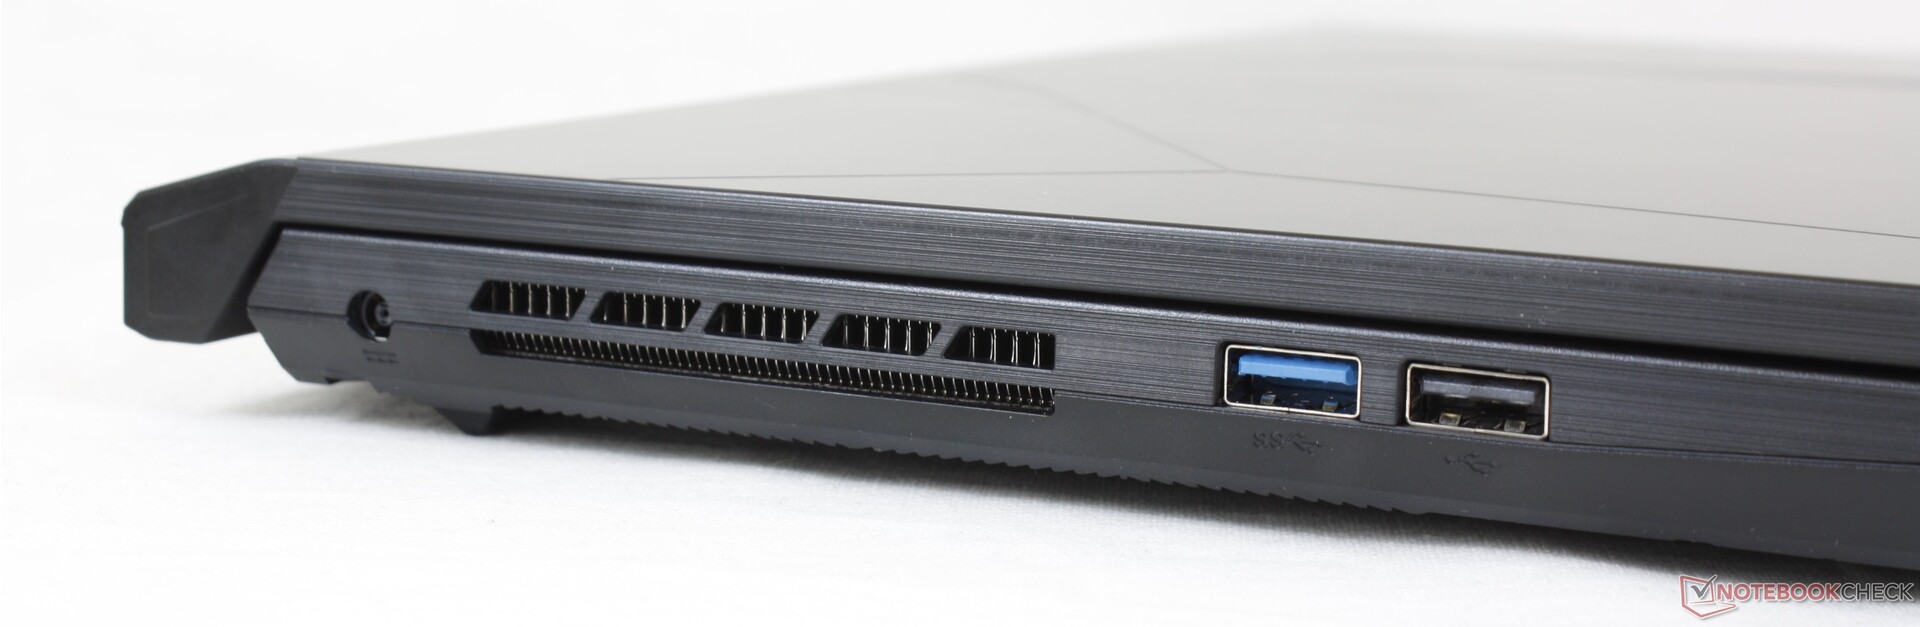
连接性--仅仅是基本的
与2020年的Bravo 15相比,端口选项和定位都有很大变化。例如,肯辛顿锁现在已经消失了,而其中一个USB-C端口已经被换成了第三个USB-A端口。大多数其他游戏笔记本电脑往往有多个USB-C端口,而不是只有一个,包括在竞争者华硕TUF FX507系列上。
请记住,该模型上的USB-C端口不支持DisplayPort-out、Power Delivery或Thunderbolt。
沟通
| Networking | |
| iperf3 transmit AX12 | |
| Dell G15 5515 | |
| Lenovo Ideapad Gaming 3 15IHU-82K1002RGE | |
| MSI Bravo 15 A4DCR | |
| MSI Bravo 15 B5DD-010US | |
| Asus TUF Gaming F15 FX507ZM | |
| Acer Nitro 5 AN515-45-R1JH | |
| iperf3 receive AX12 | |
| Lenovo Ideapad Gaming 3 15IHU-82K1002RGE | |
| Asus TUF Gaming F15 FX507ZM | |
| Dell G15 5515 | |
| MSI Bravo 15 A4DCR | |
| MSI Bravo 15 B5DD-010US | |
| Acer Nitro 5 AN515-45-R1JH | |
网络摄像头
集成的网络摄像头是标准的720p,不支持Windows Hello。用户可以通过F6键以电子方式禁用该摄像头。


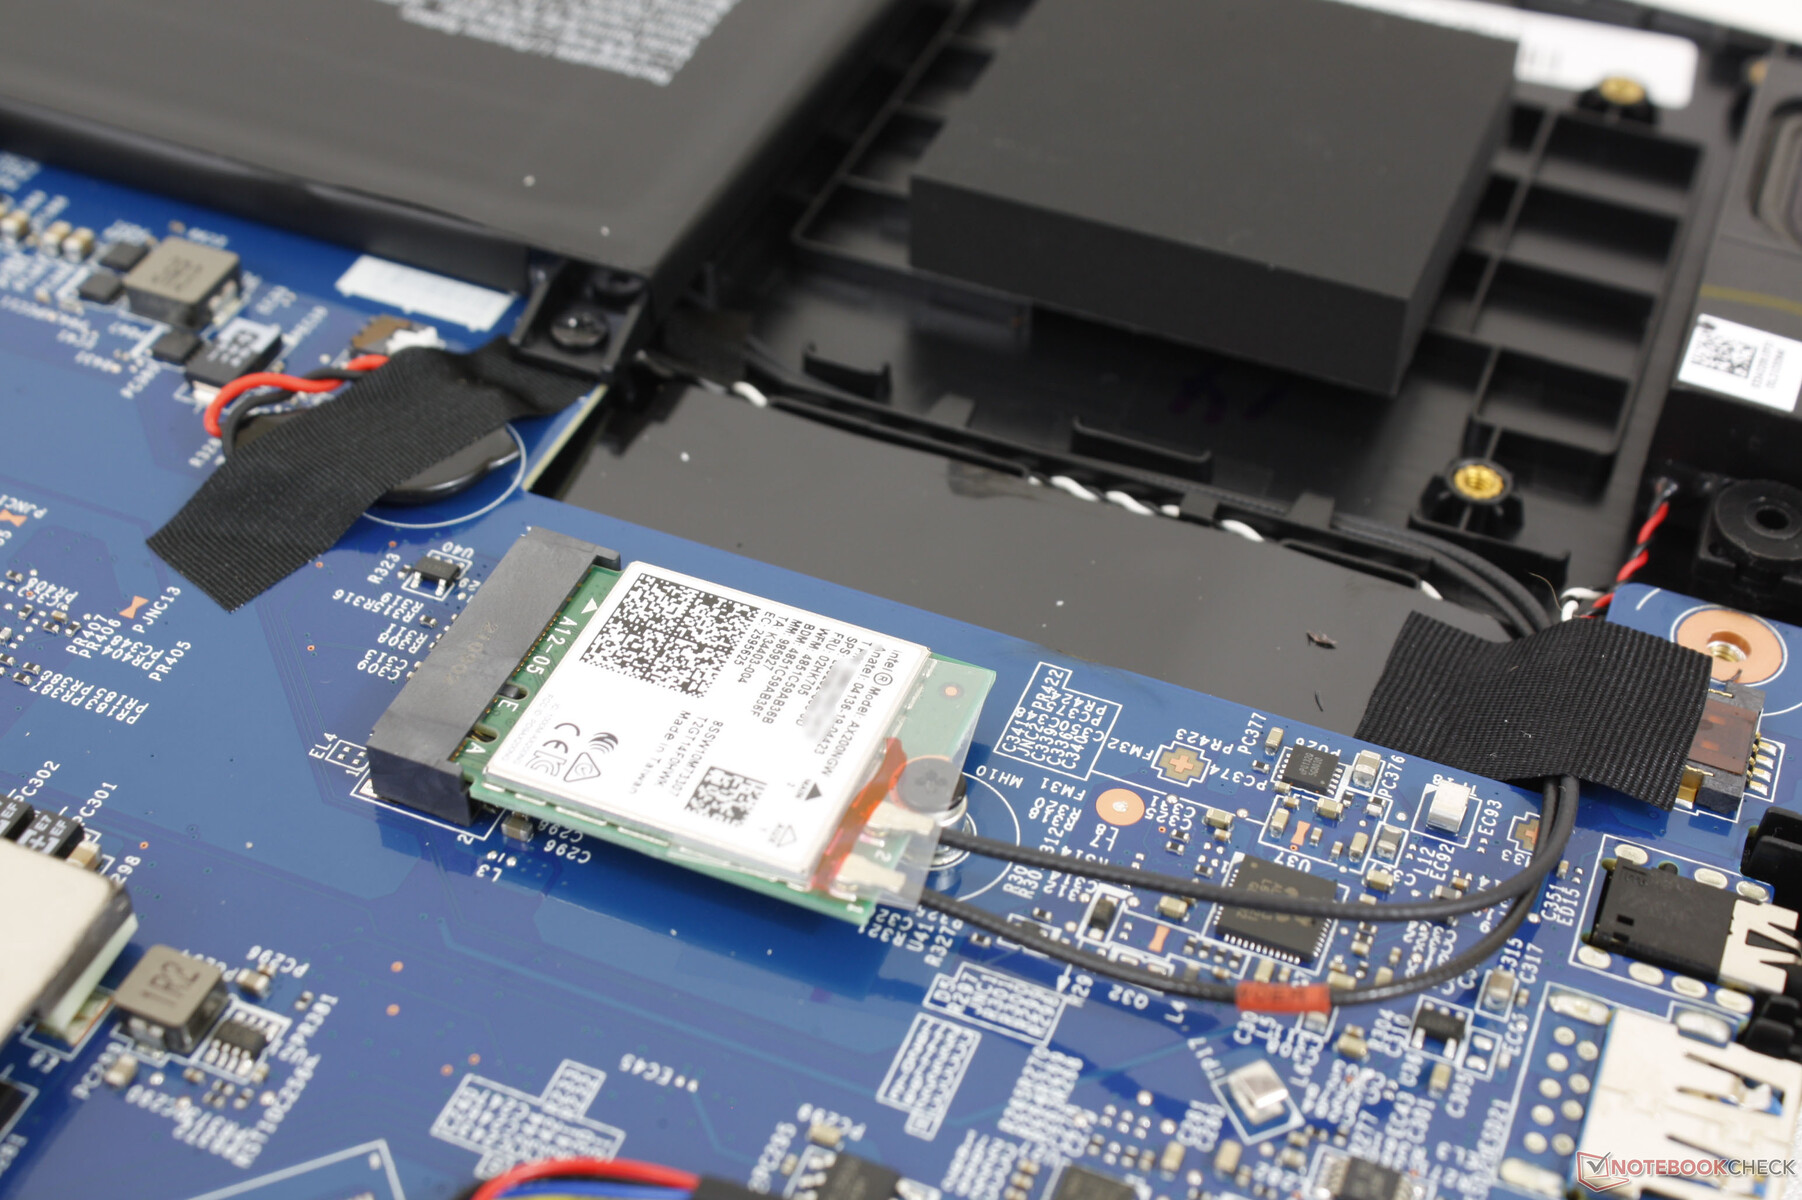
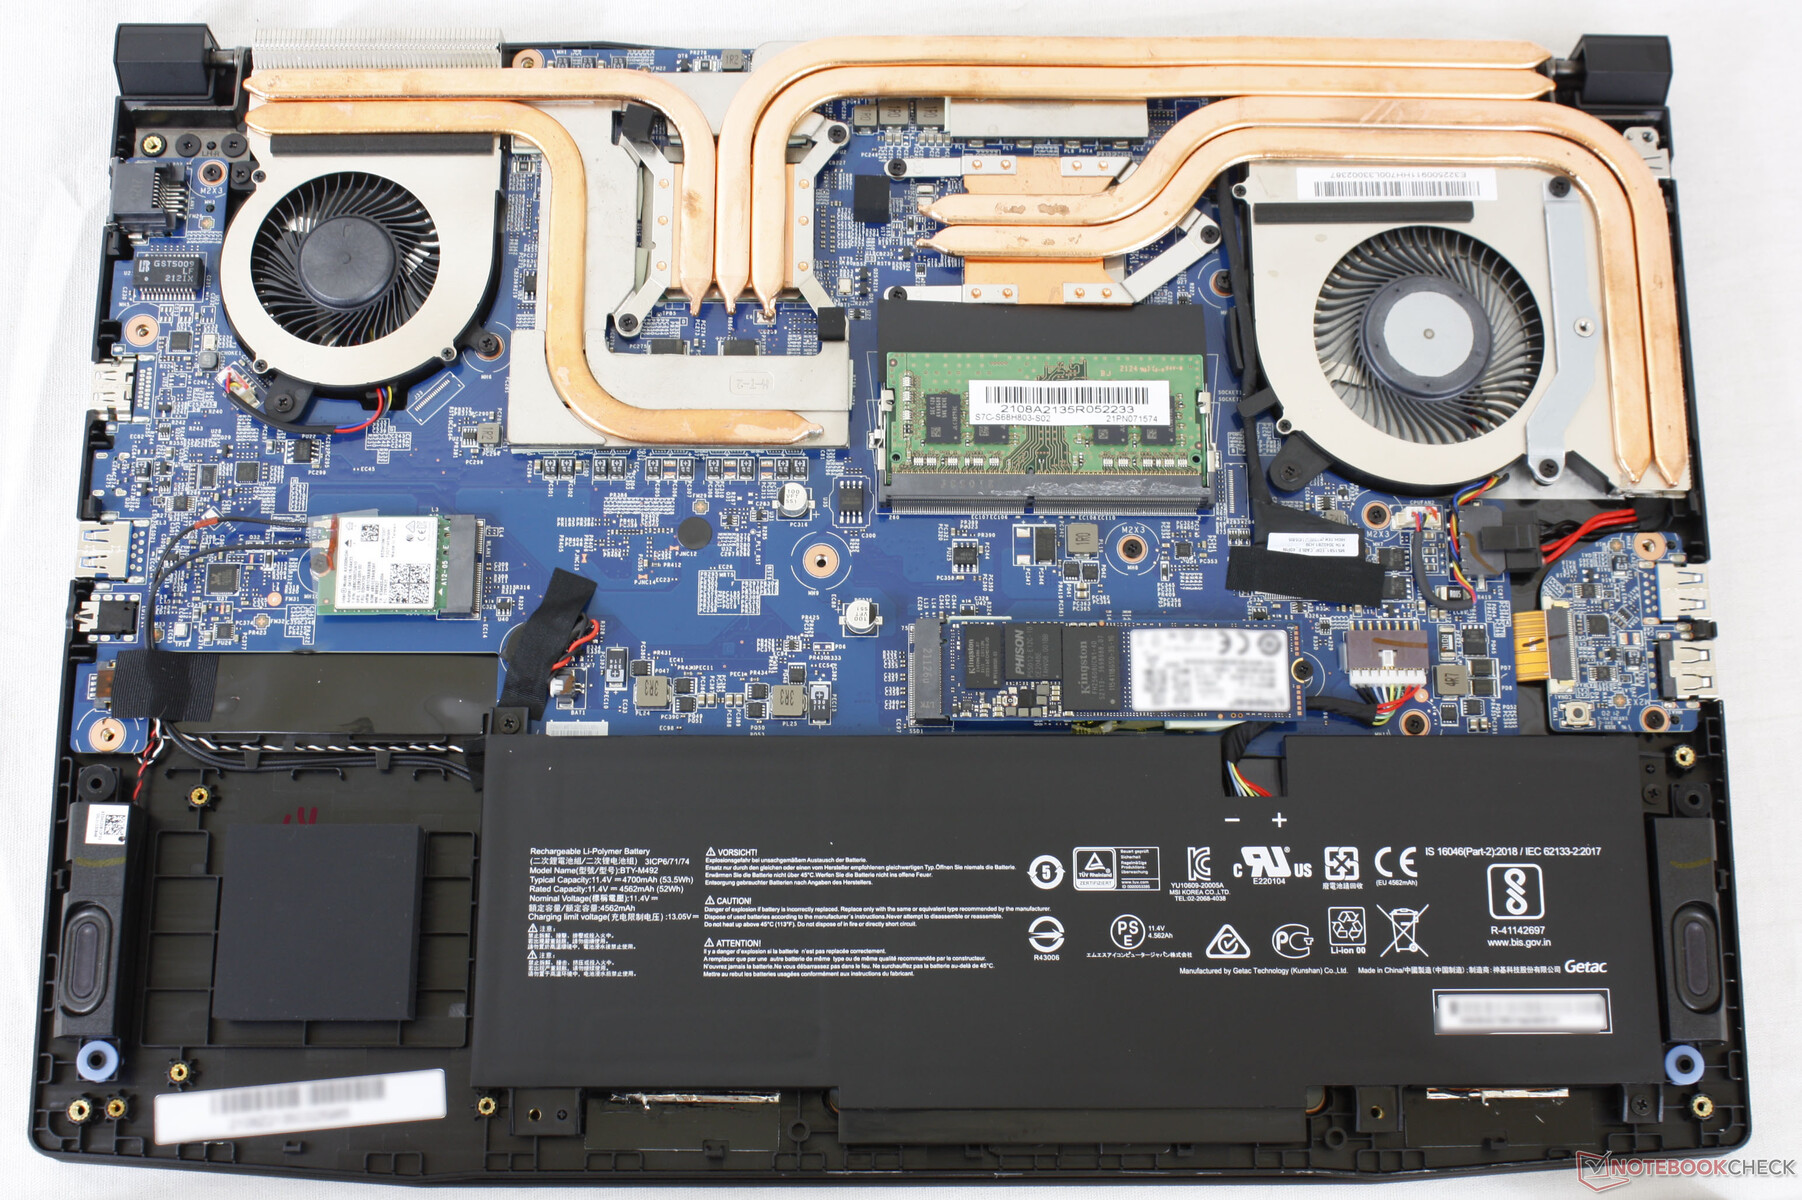
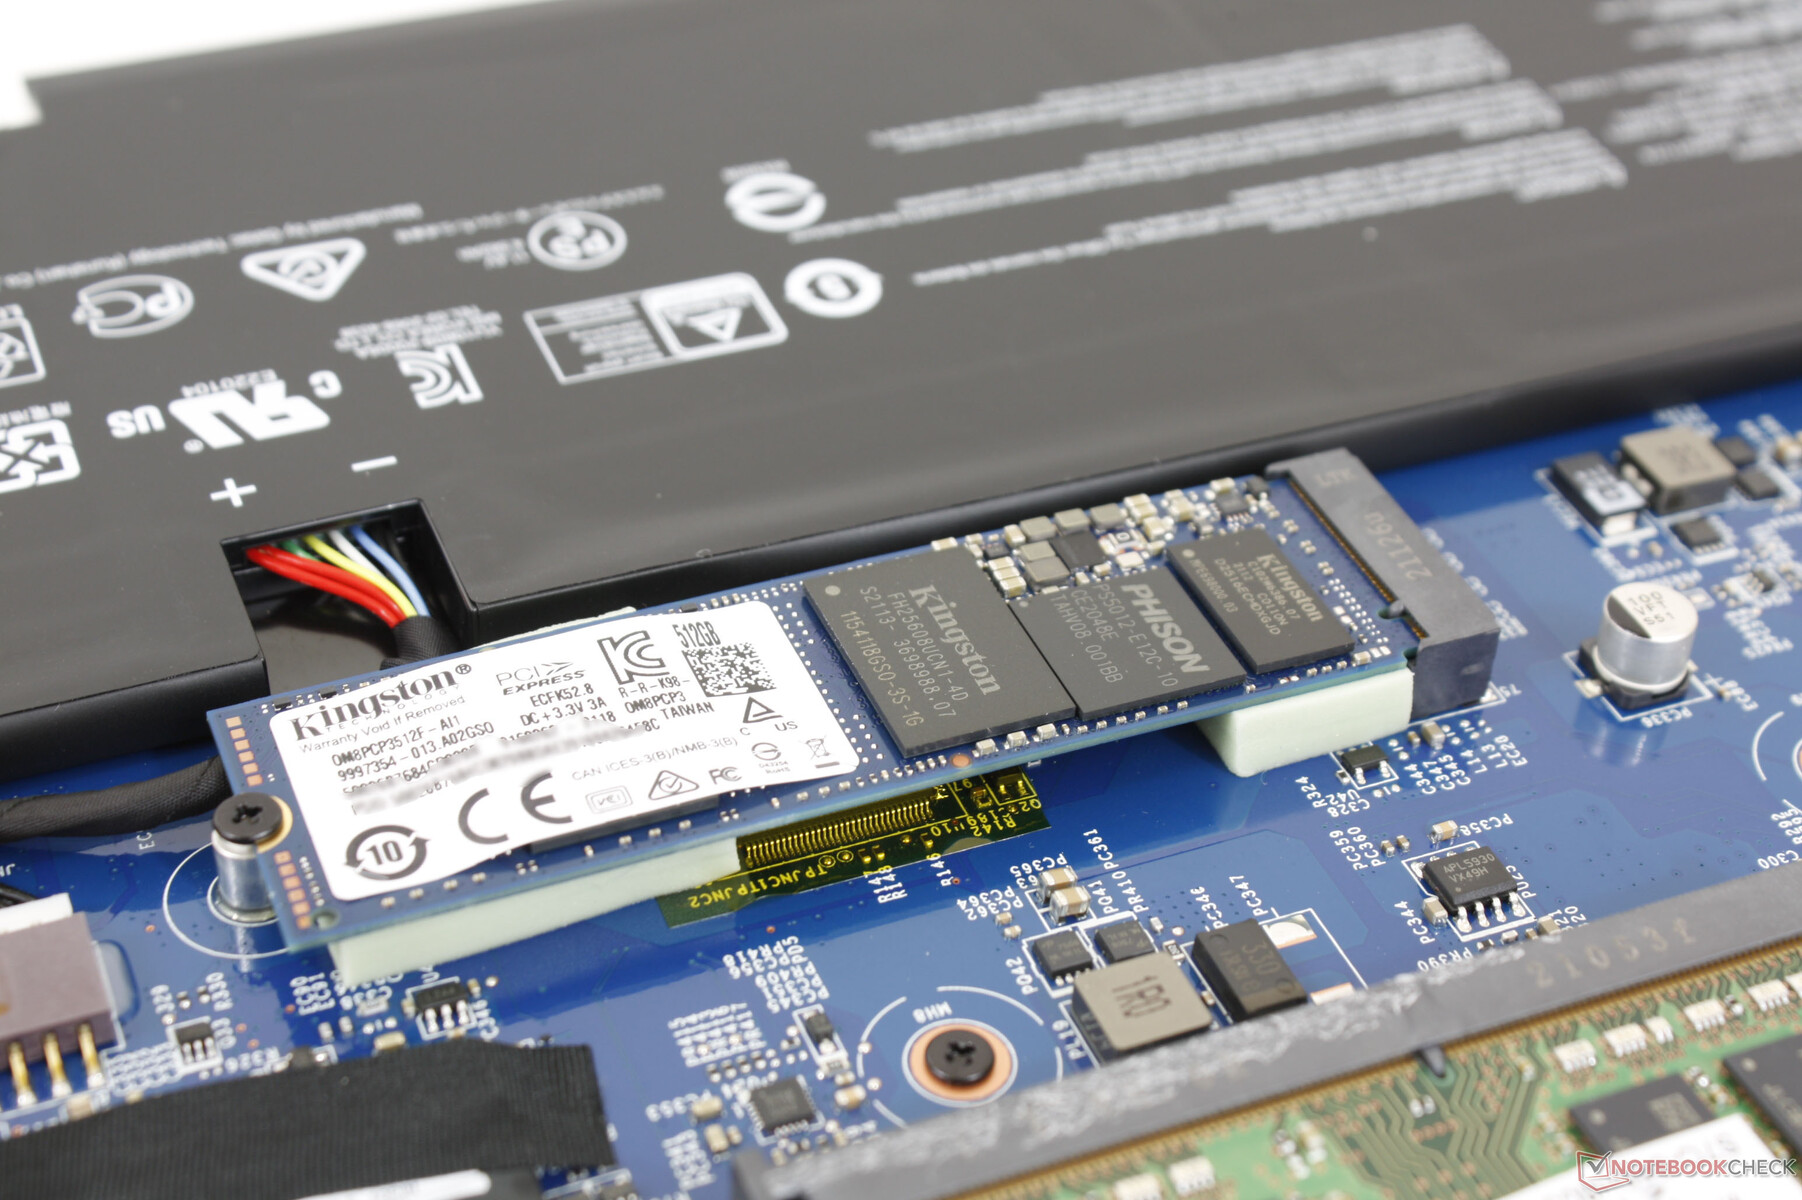
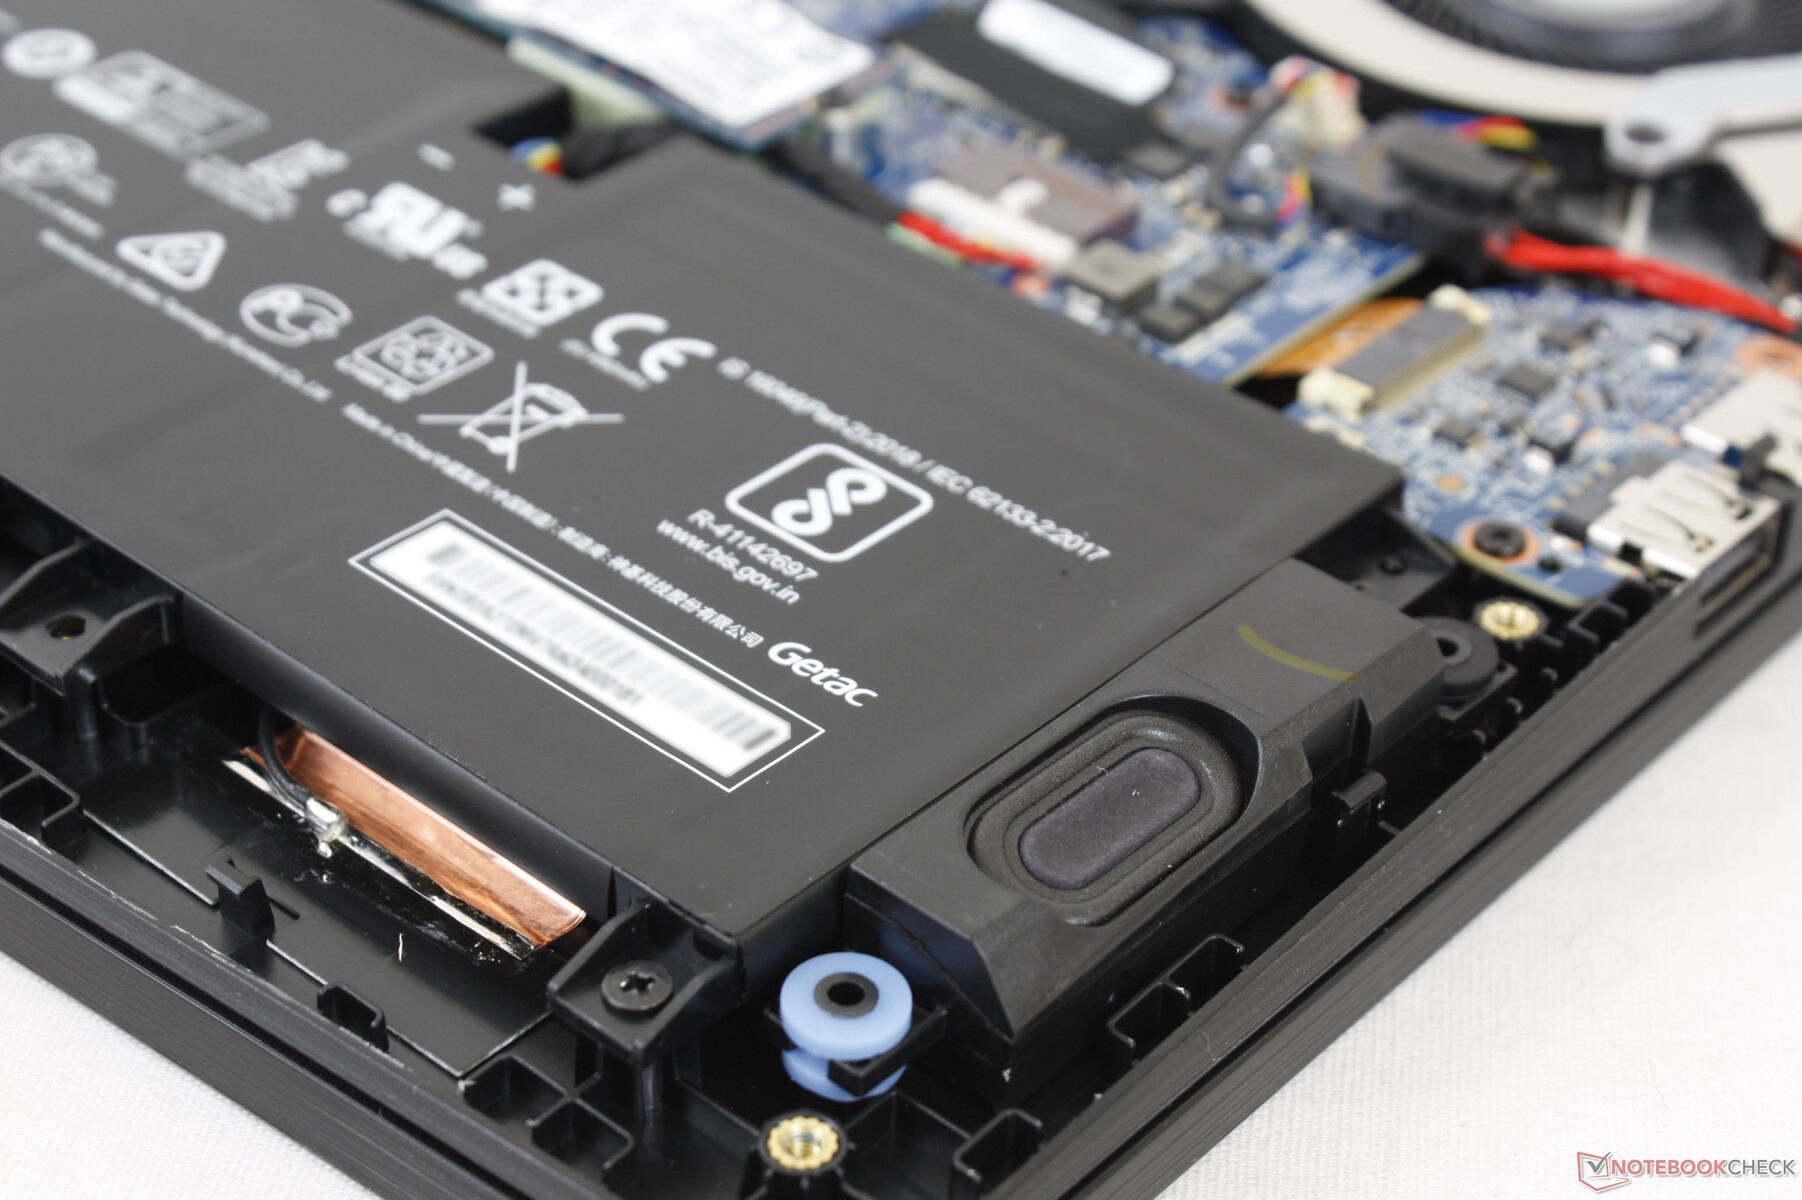
维护
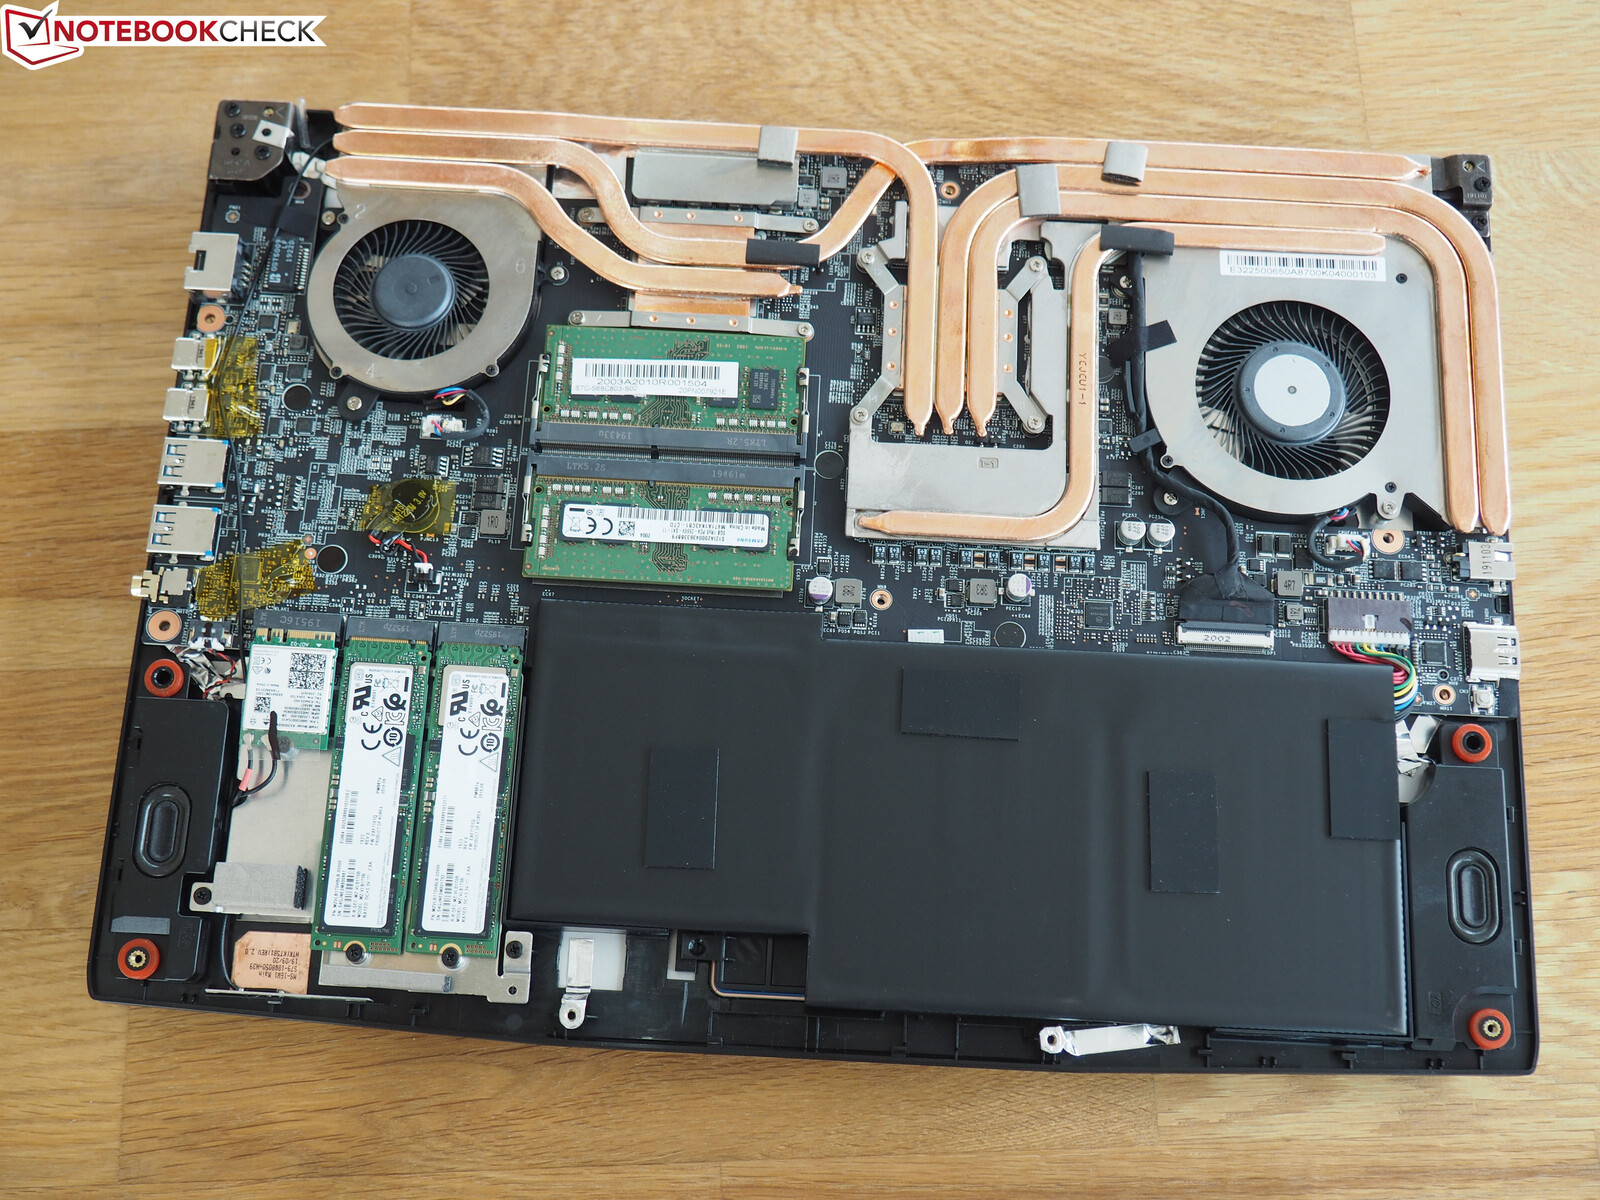
使用飞利浦螺丝刀和锋利的边缘,底板是比较容易拆卸的。注意,如果你想进入内部,必须打破 "工厂密封 "贴纸。
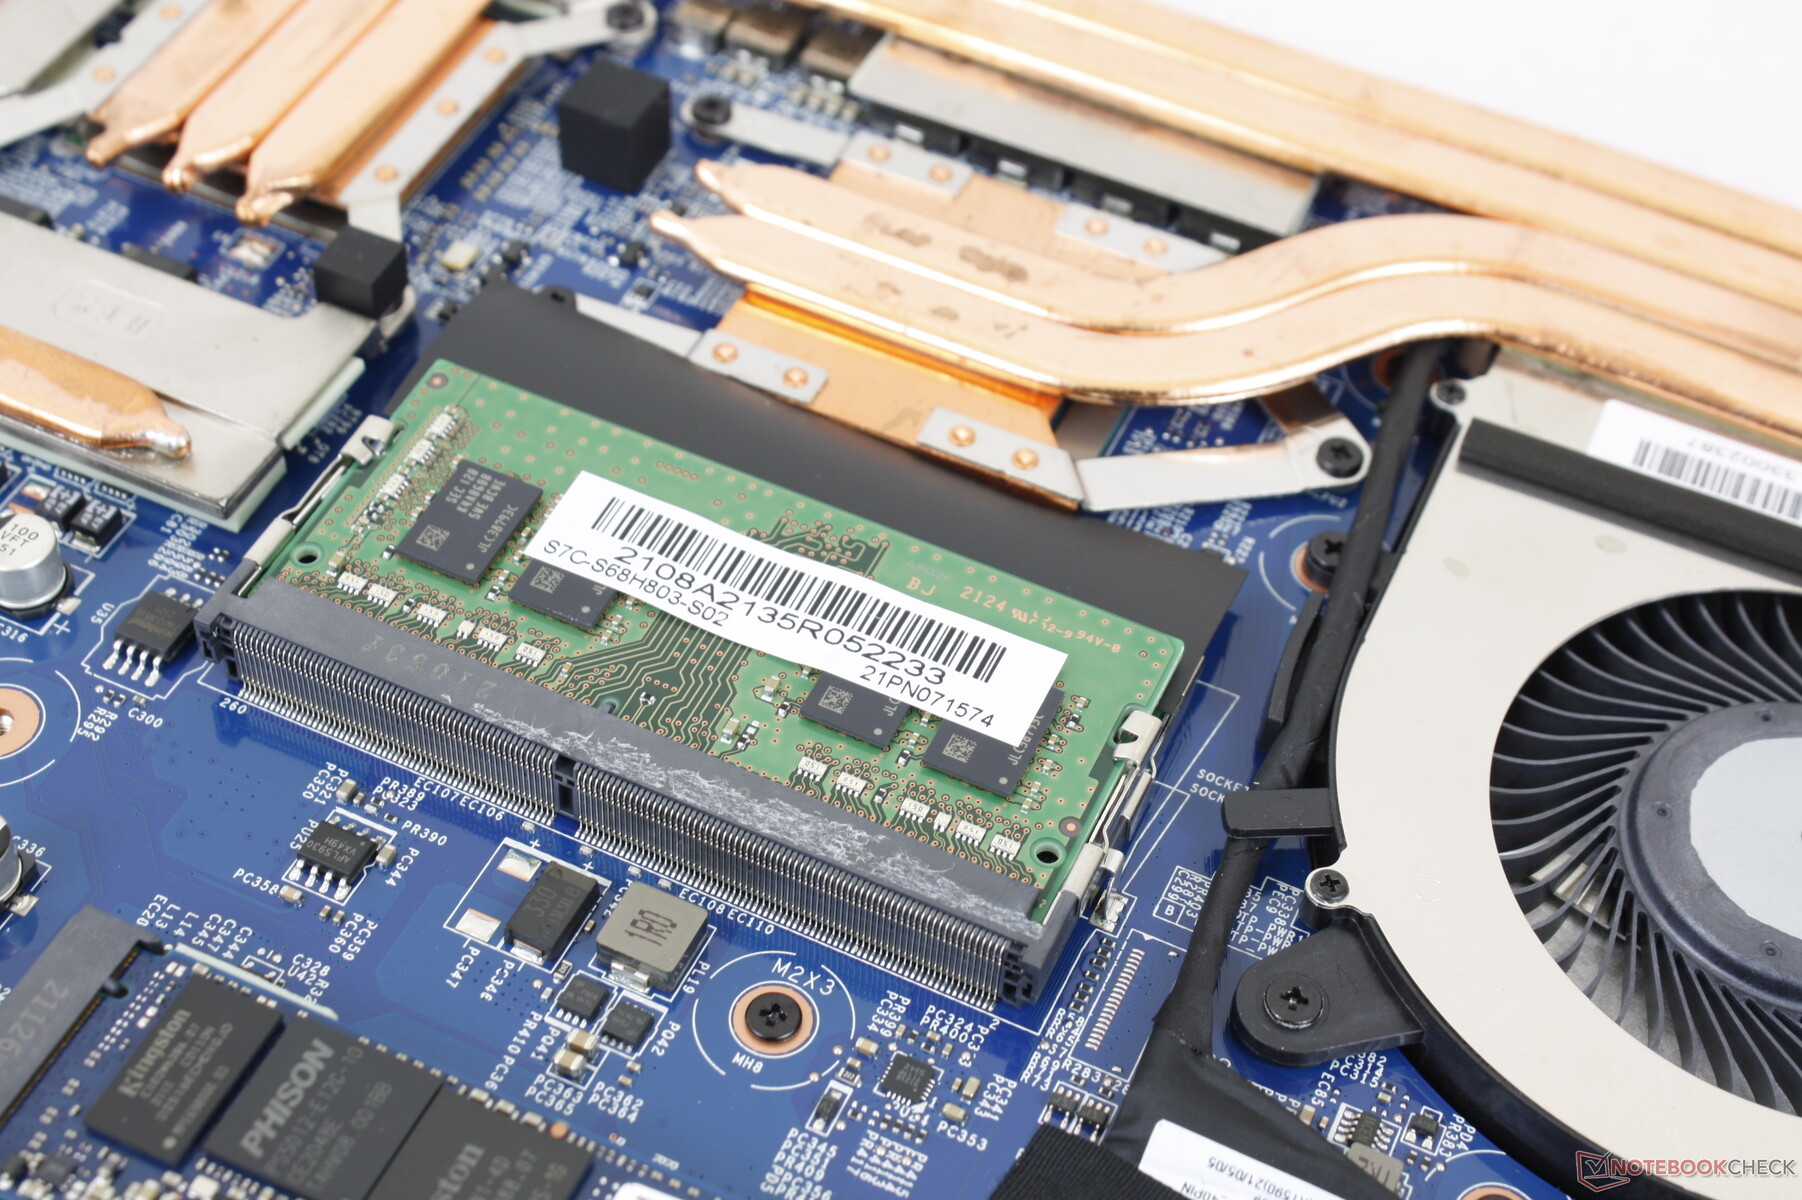
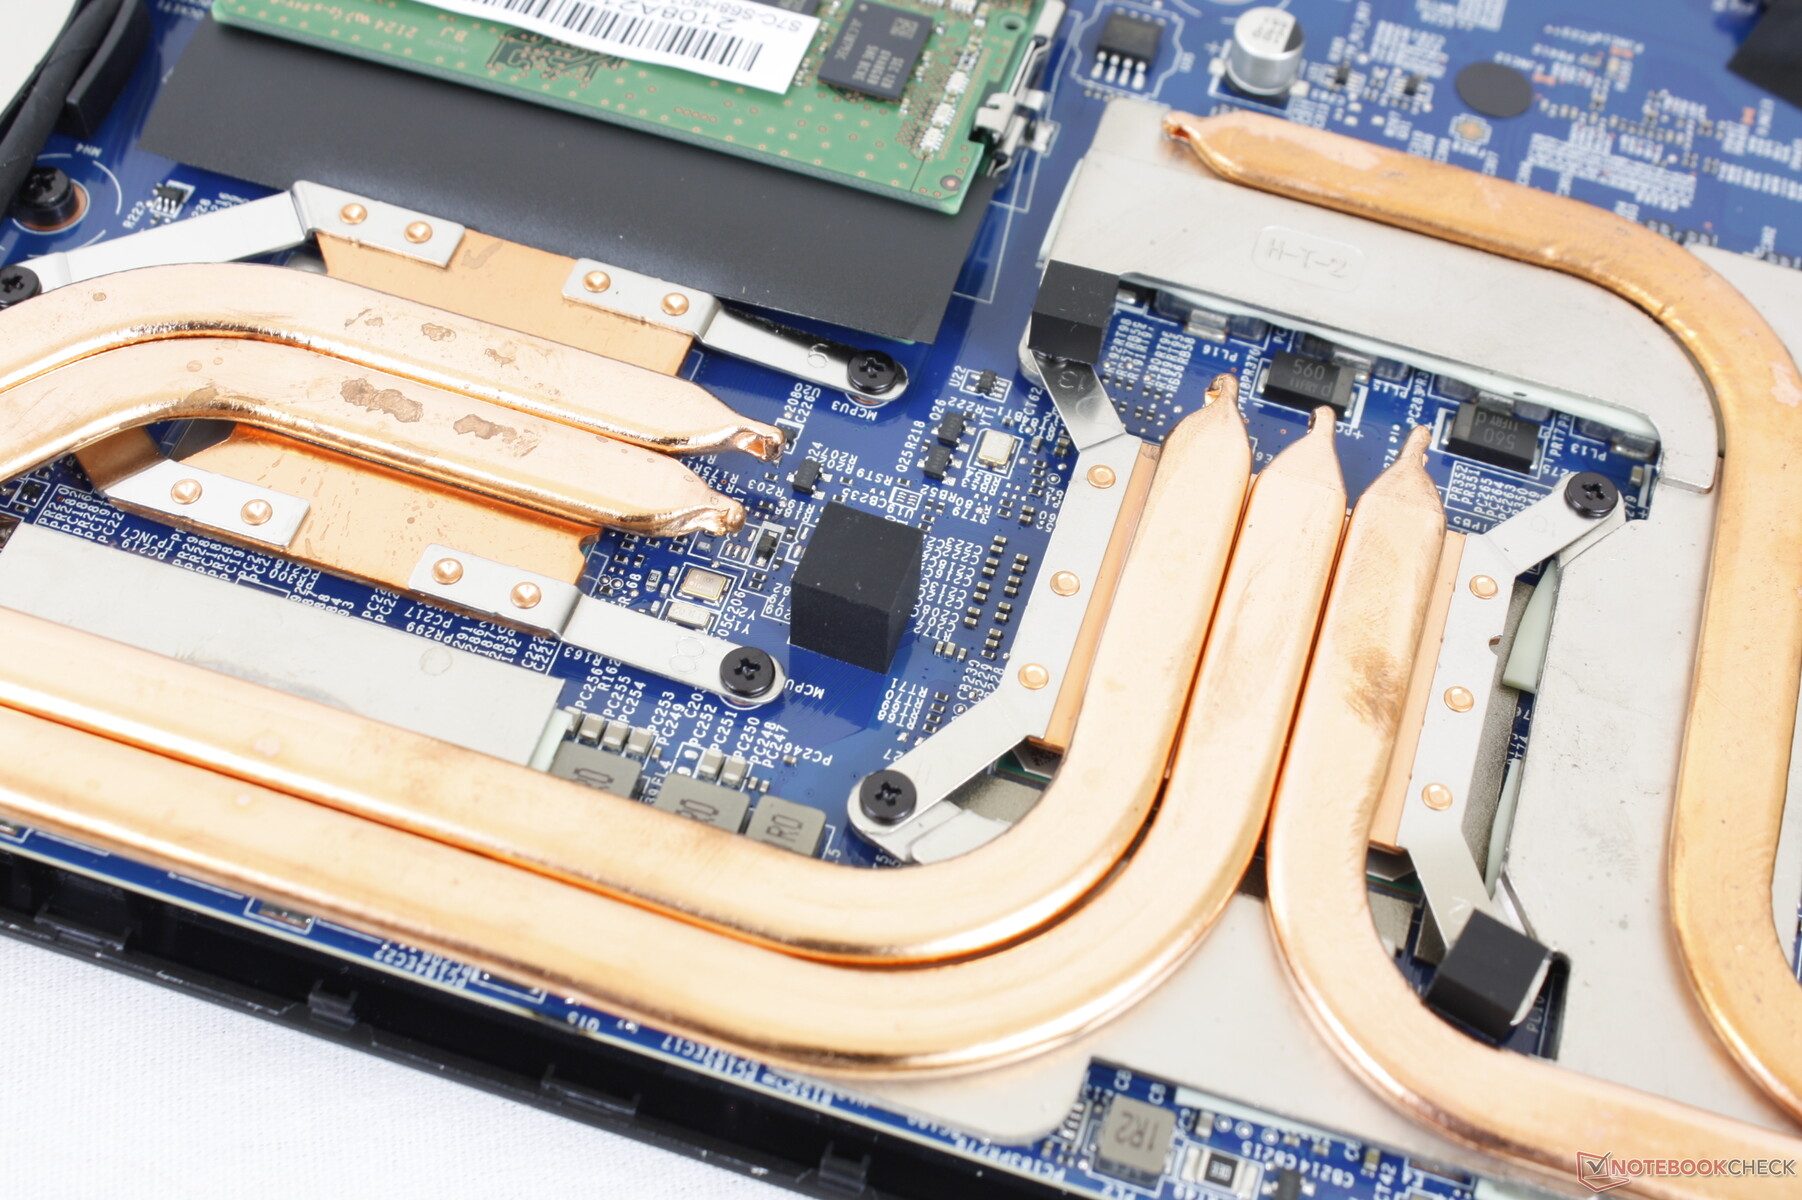
一旦进入内部,用户将可以直接接触到2个SODIMM插槽,可拆卸的WLAN模块,以及一个M.2 2280 PCIe3插槽,这比2020年Bravo型号上的两个M.2 2280插槽有所降低。正如我们下面的对比图片所显示的那样,微星今年已经做了几个主板的改变。
配件和保修
除了交流电适配器和文件外,盒子里没有其他额外的东西。通常的一年有限保修期适用。
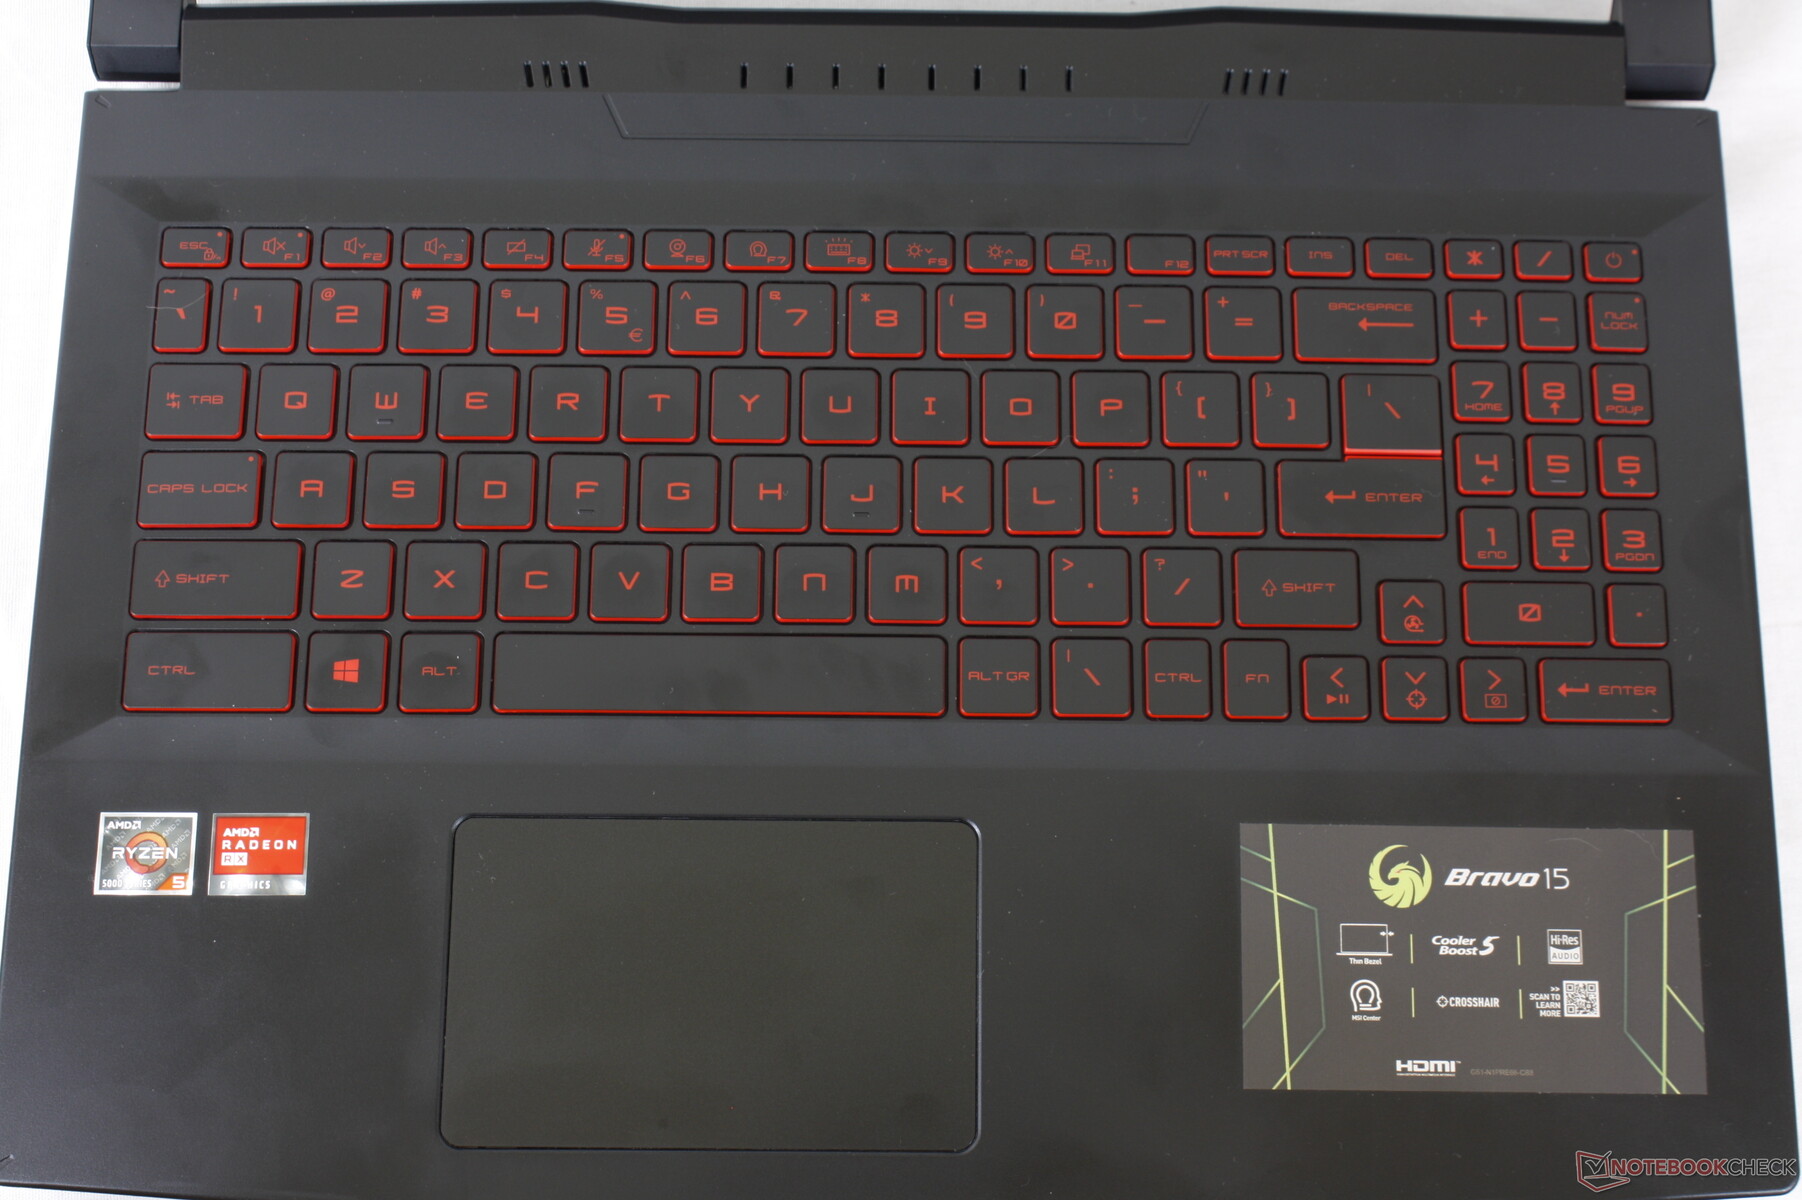
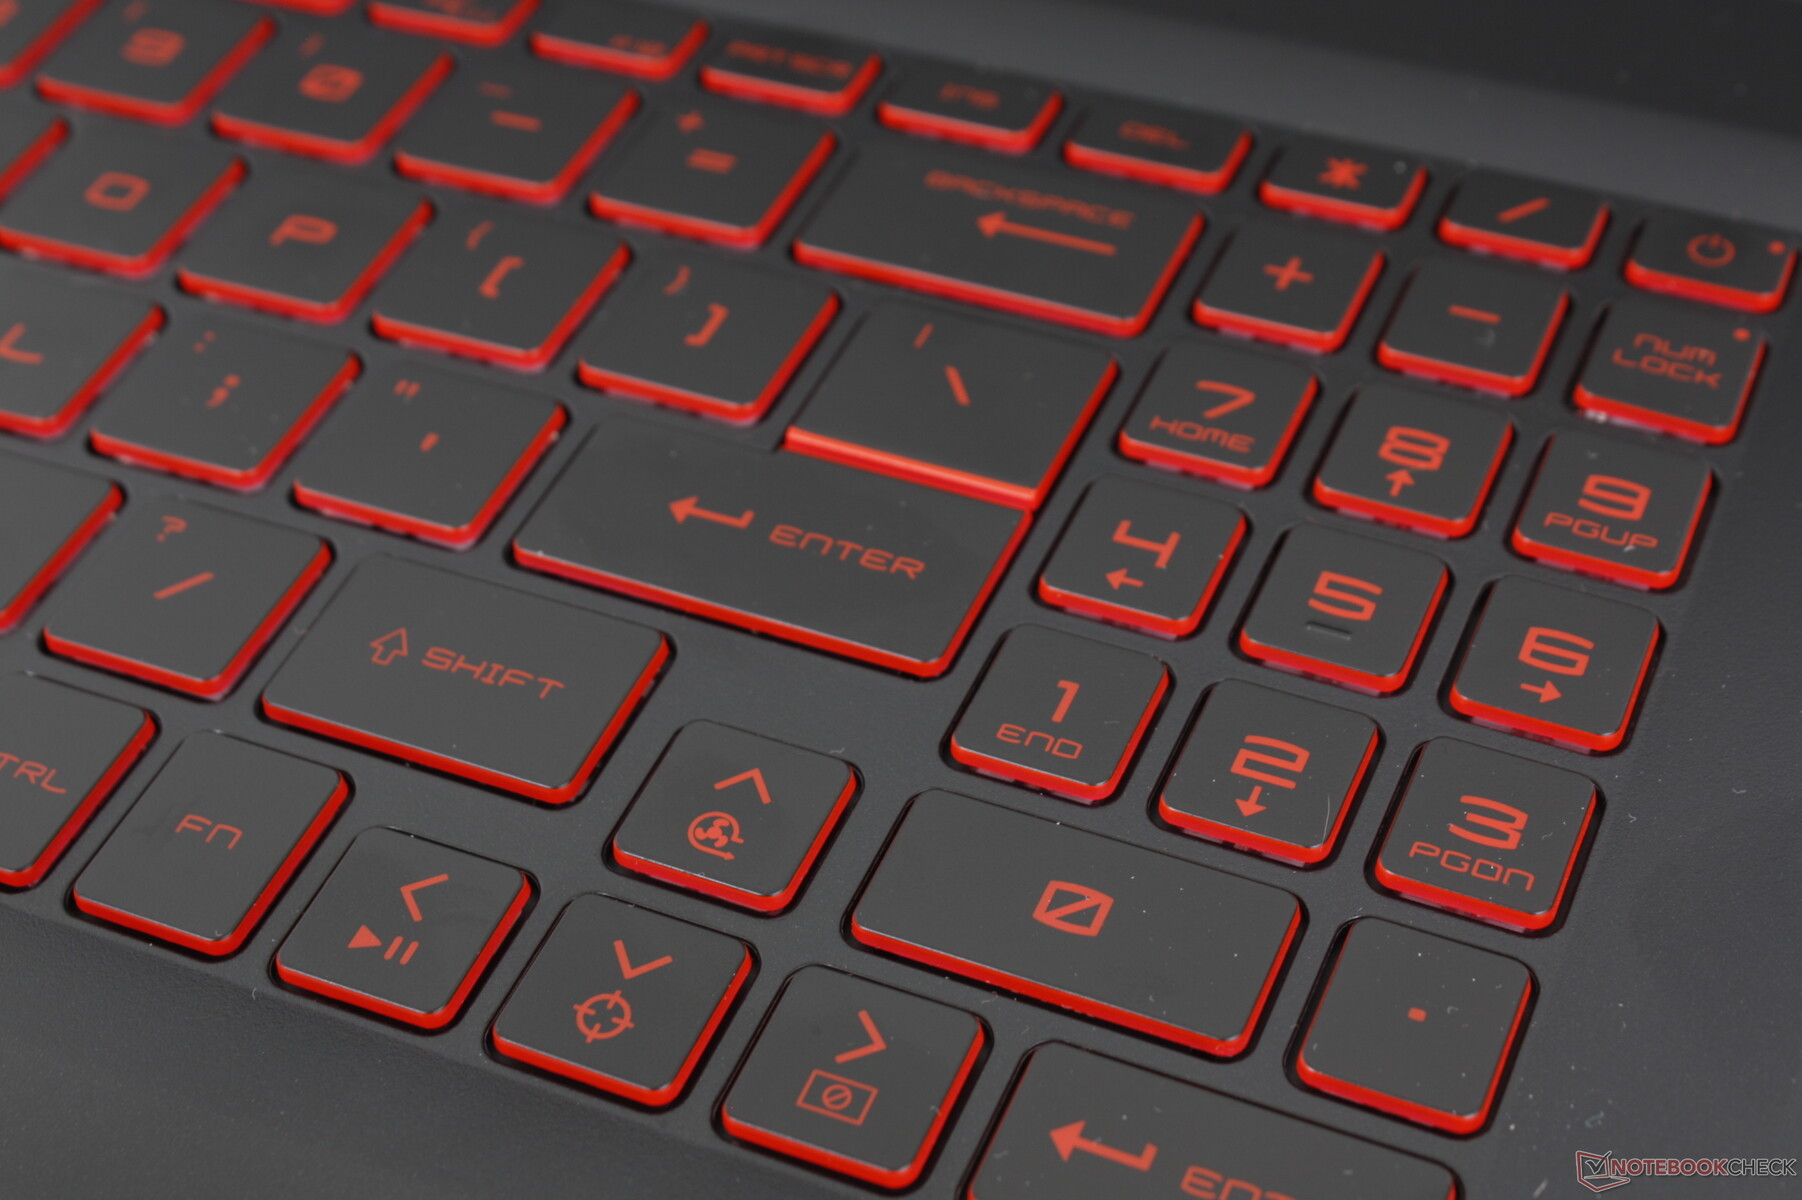
输入设备--新键盘,旧点击板
键盘
描述触摸板:滑行特性、表面结构、尺寸、功能,如多点触摸、滚动、反应能力、精度、触摸板按钮、其他鼠标替代品,如跟踪点......。
单独的一章描述触摸屏(响应性,......)可能适合于平板电脑/转化器。
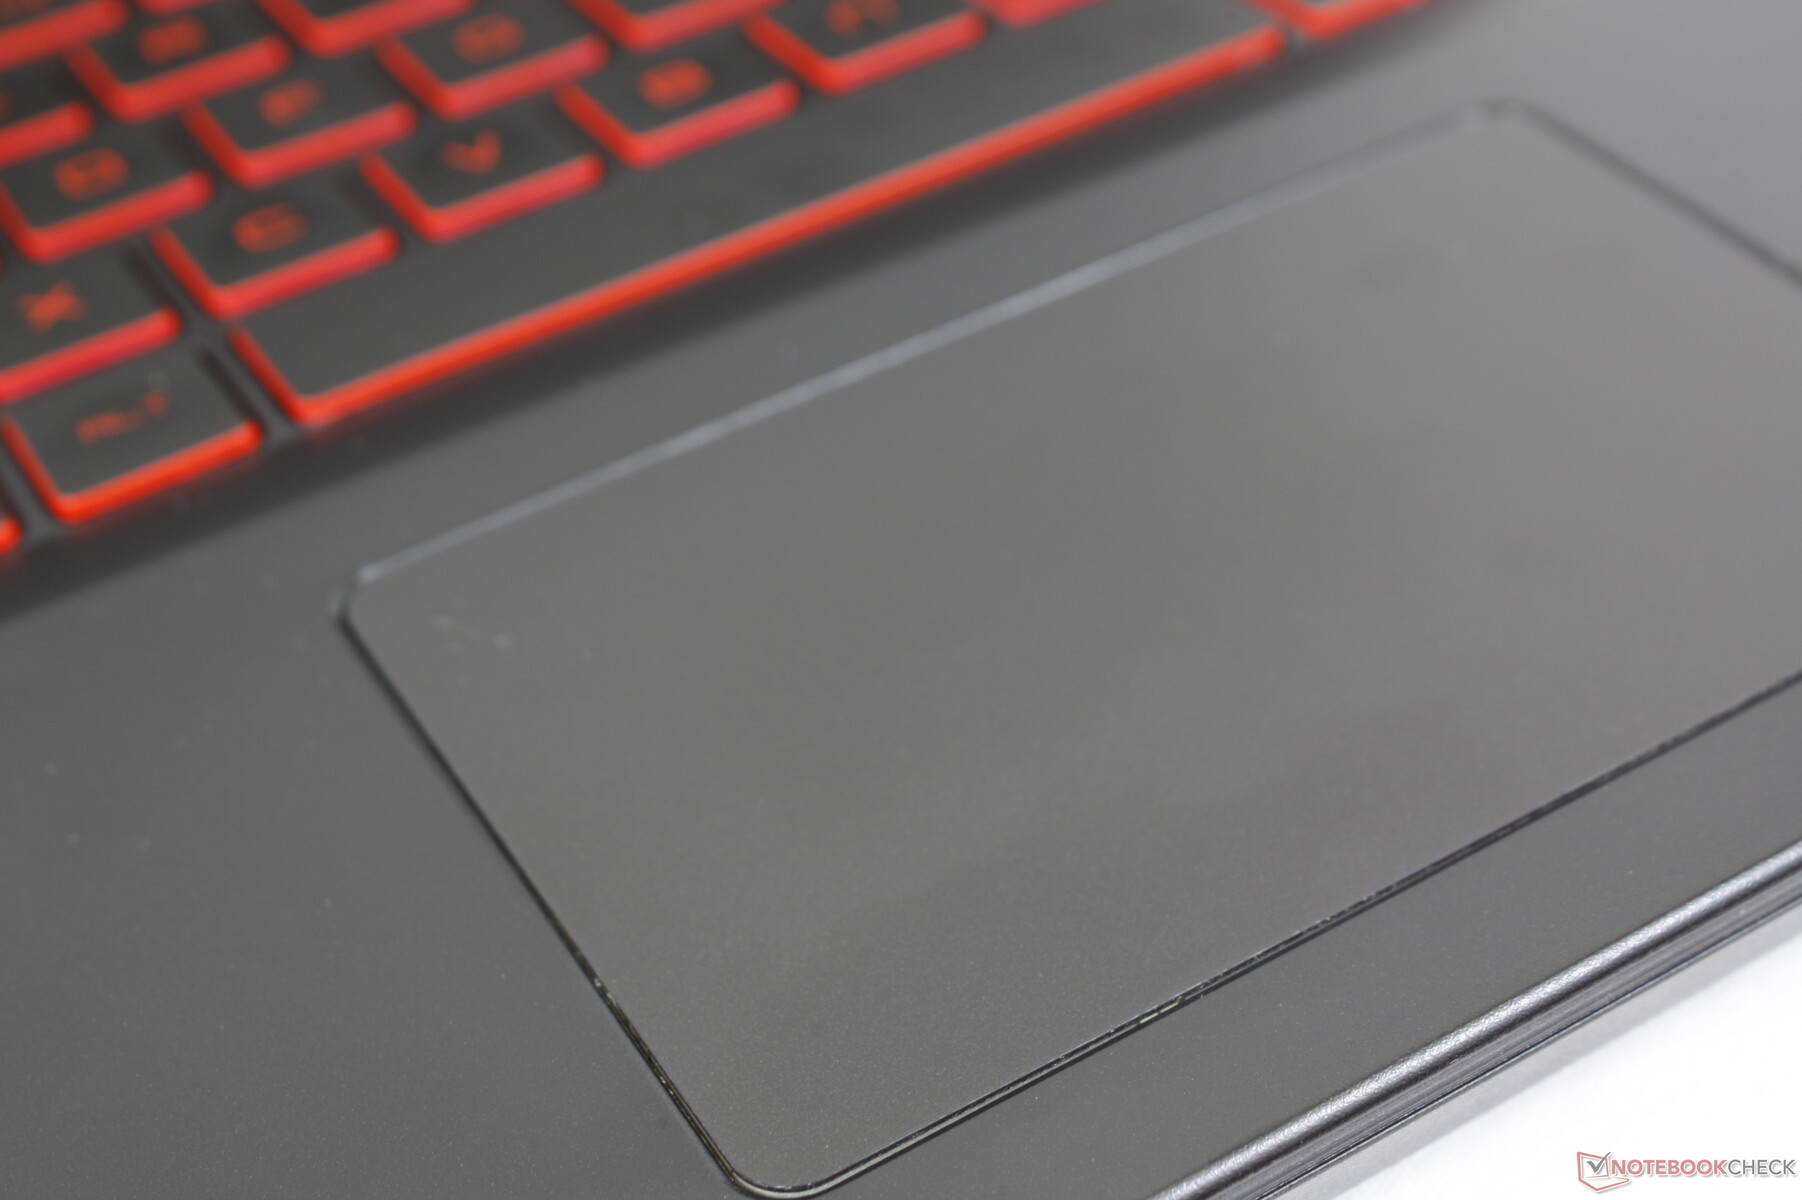
触摸板
点击板(10.5 x 6.5厘米)与2020年Bravo 15上的大小相同。不幸的是,它在牵引力和反馈方面没有改进,我们发现旧的设计也很差。滑动不是很顺畅,因为手指太容易粘住,而按下时的反馈是在海绵的一边。如果微星坚持不增加点击板的尺寸,那么我们希望看到专用的鼠标按钮,使点击和拖放动作更加容易。
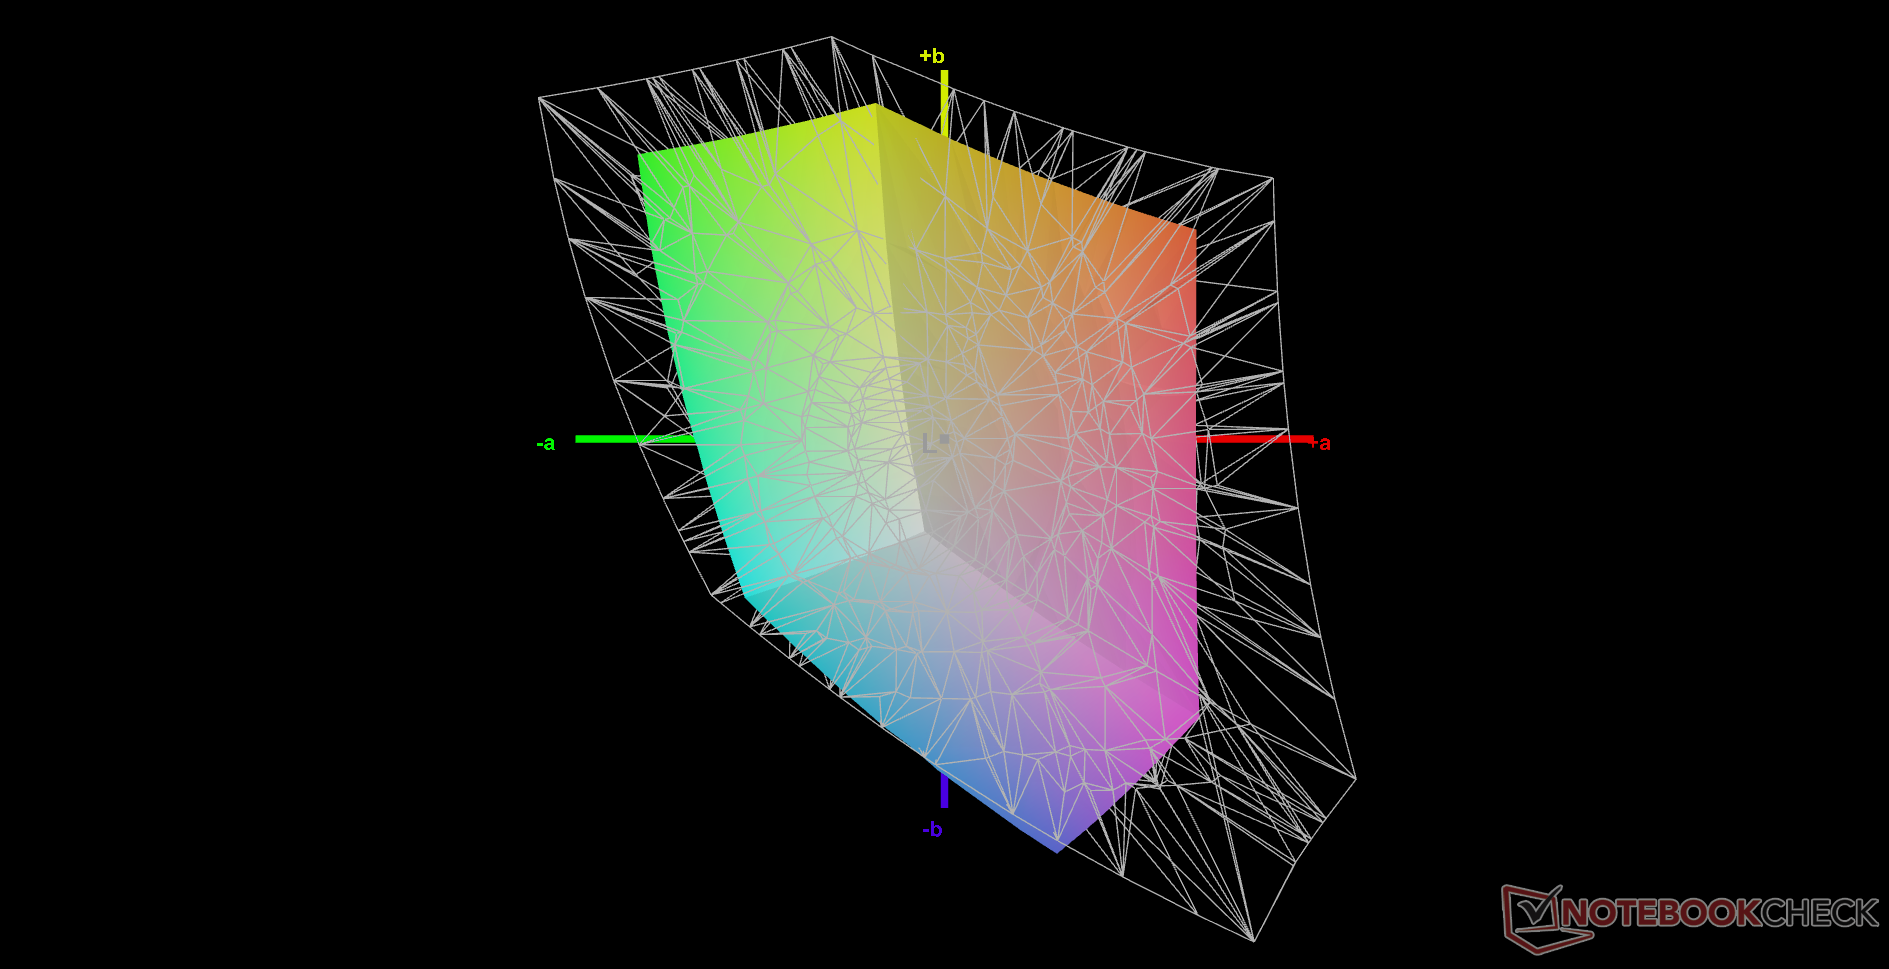
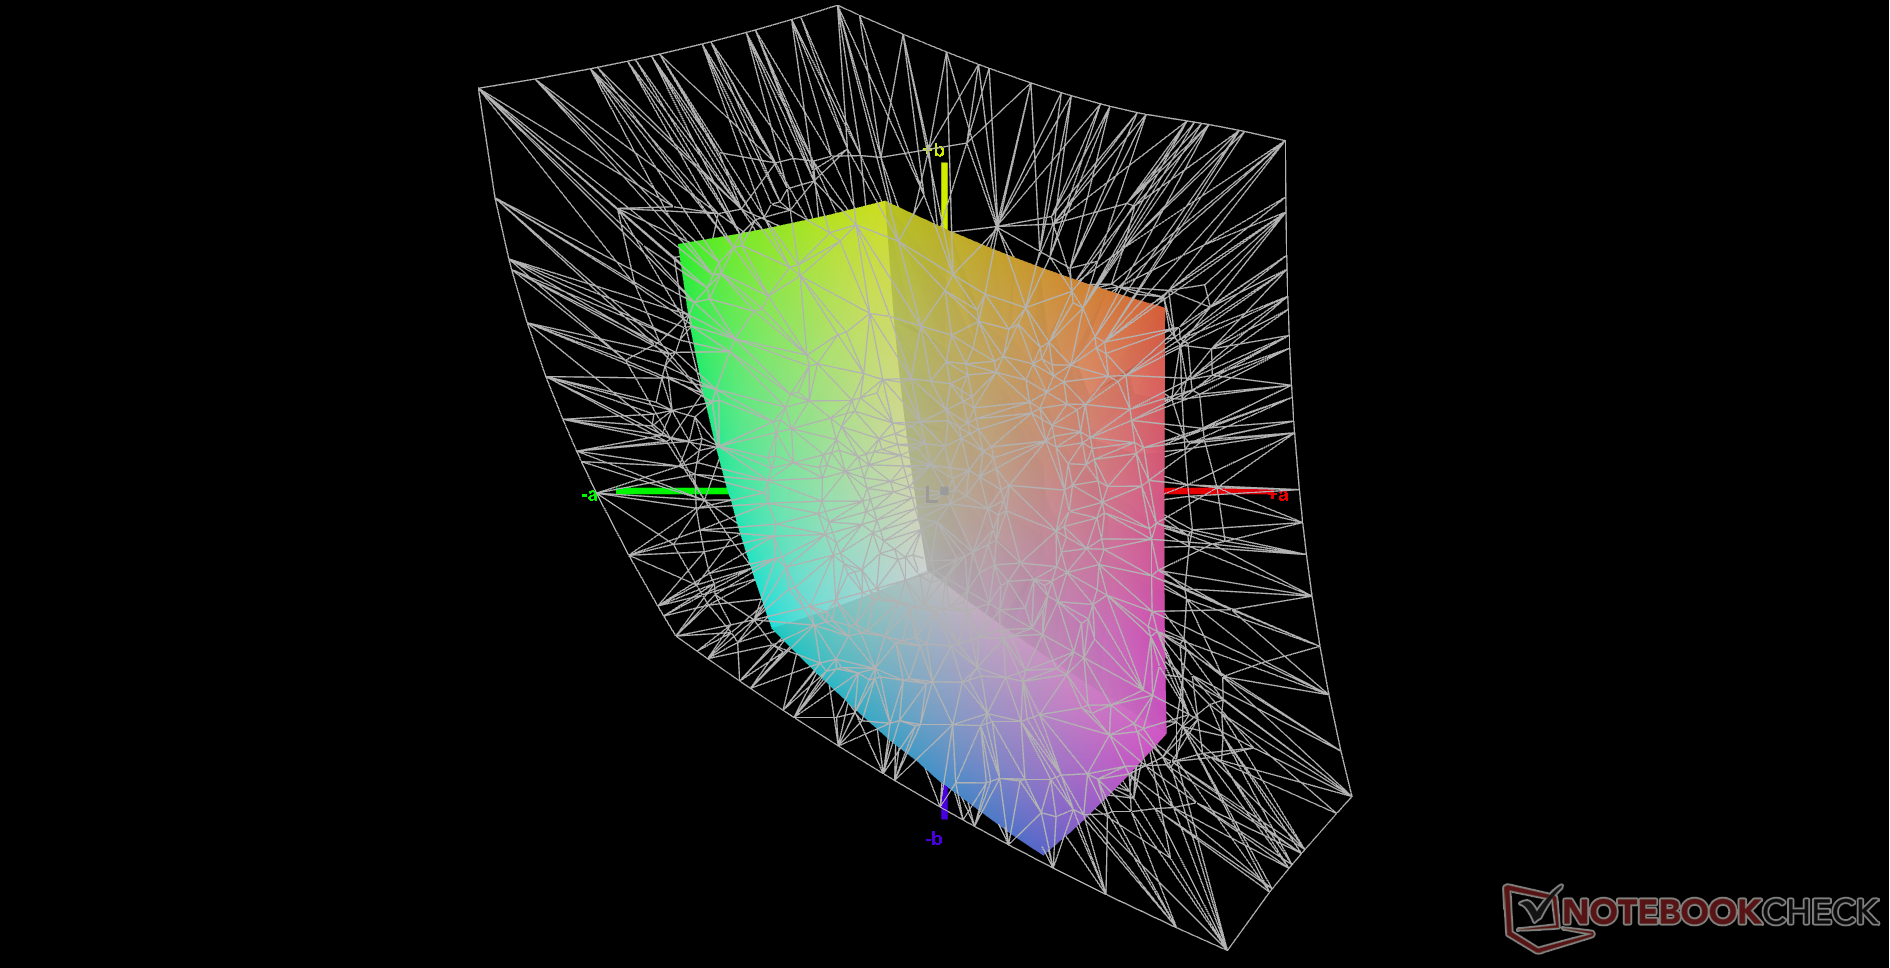
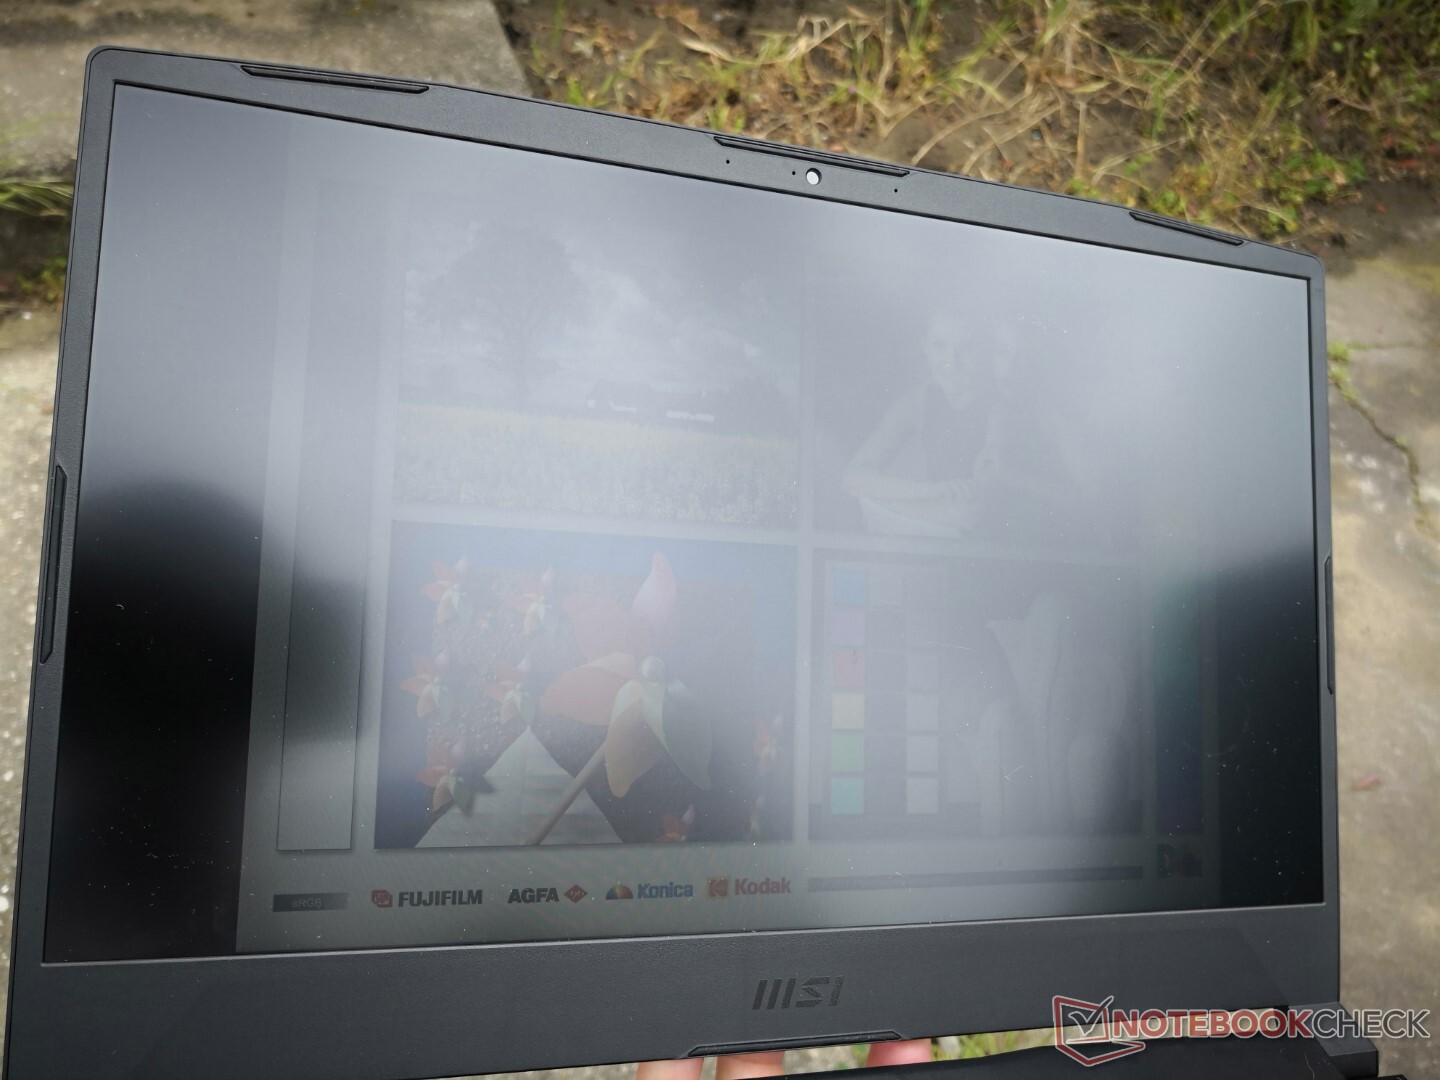
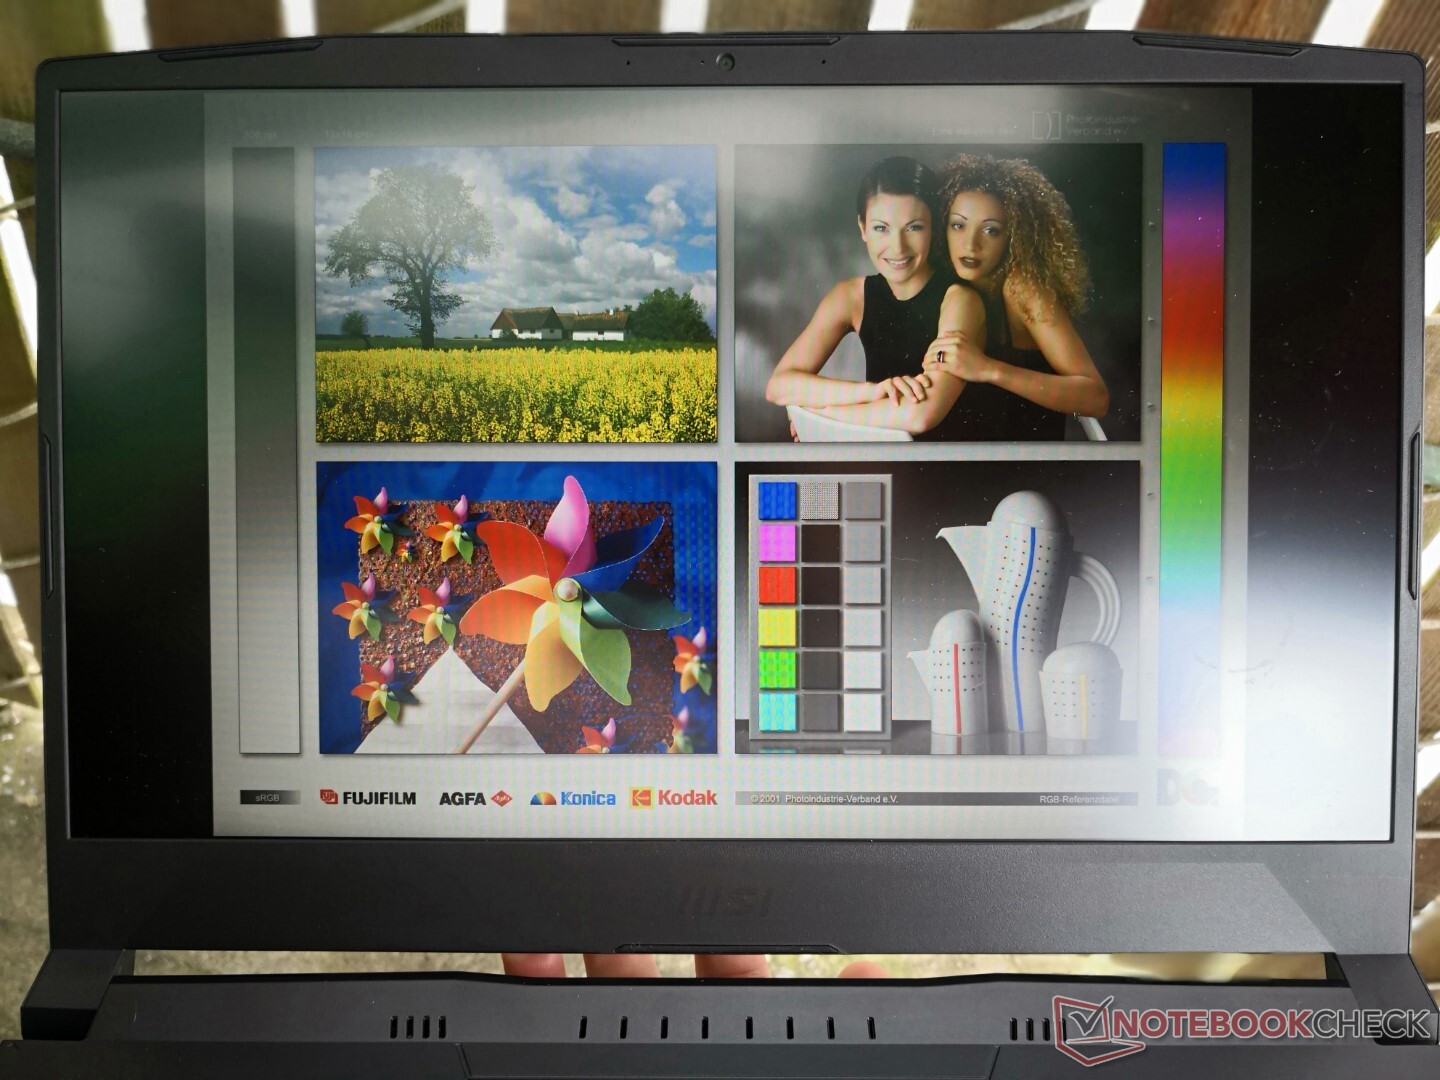
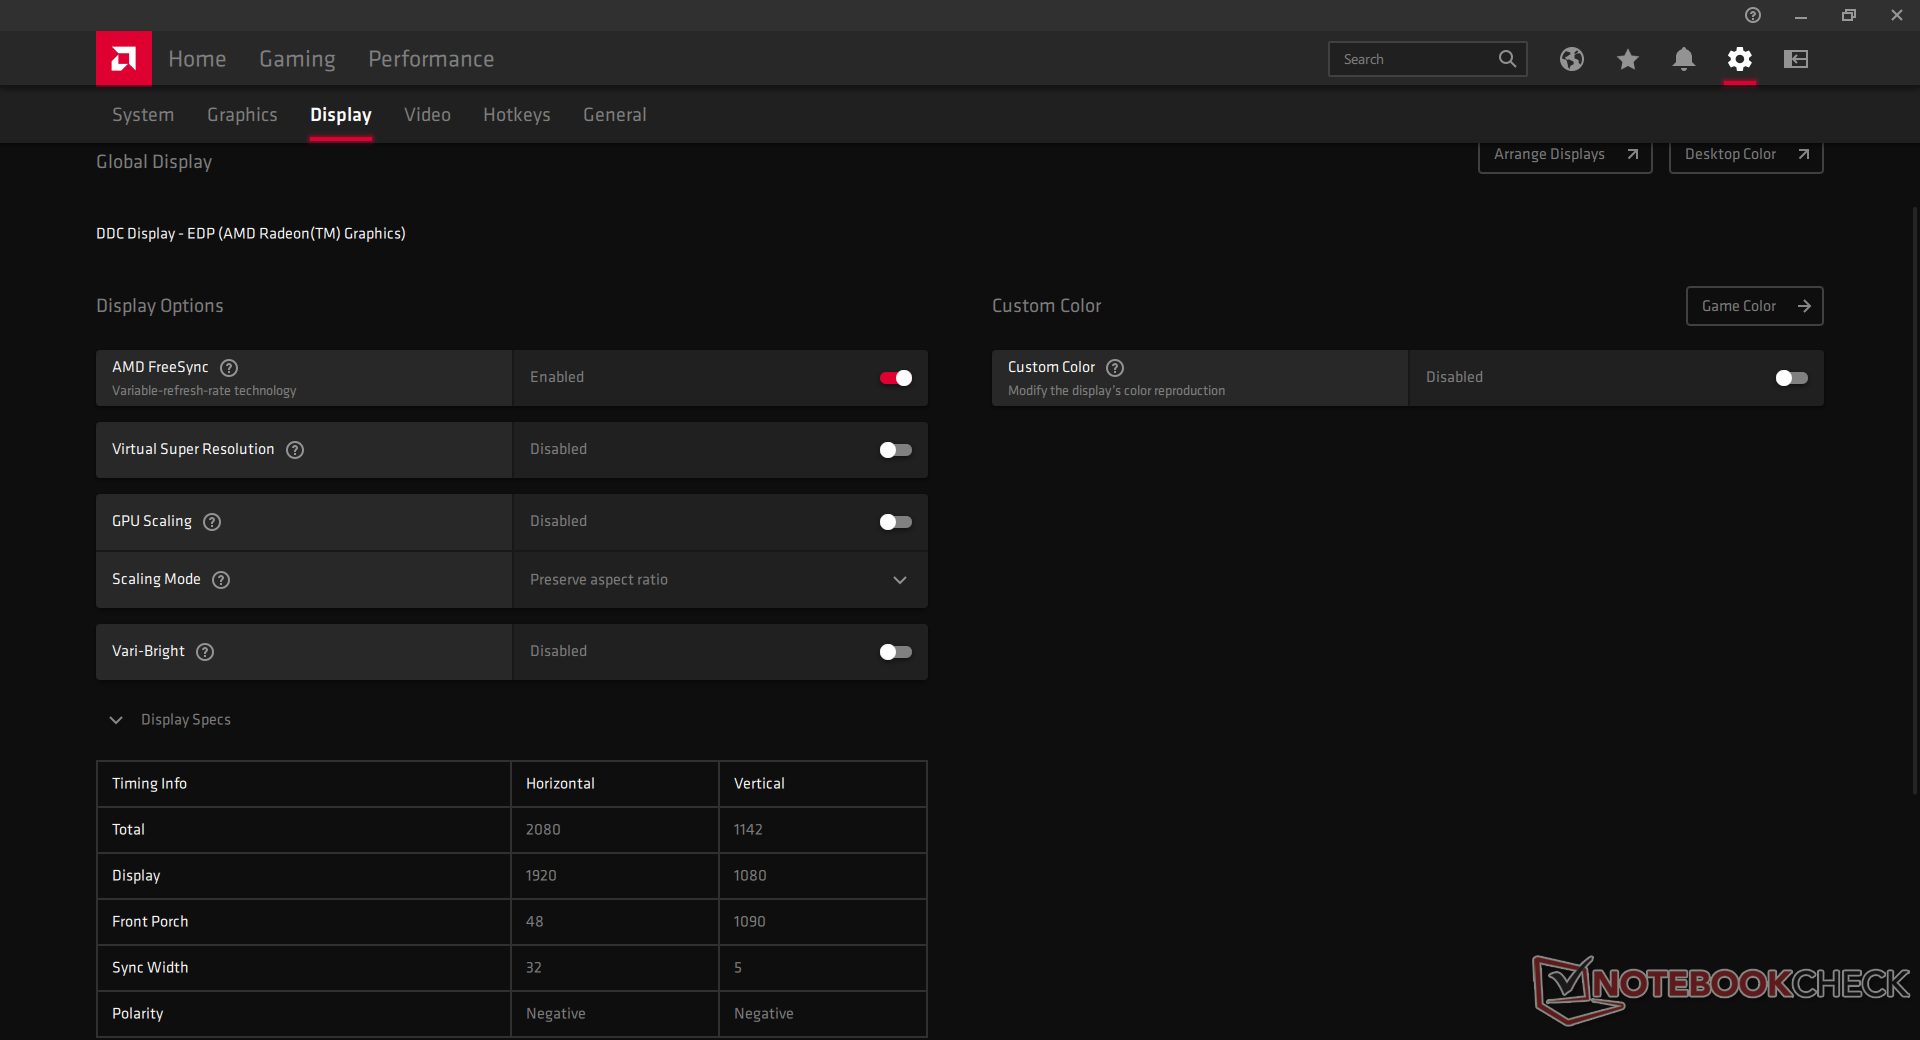
显示器 - FreeSync与144赫兹刷新率
我们的Bravo 15测试装置配备了与宏碁Nitro 5 AN515或华硕TUF Gaming F15 FX506HM上相同的奇美N156HRA-EA1 IPS面板。该面板因其原生144赫兹刷新率和体面的黑白和灰度响应时间而引人注目,但有限的色域使其不适合大多数图形编辑工作。结果比2020年的Bravo 15有所下降,后者有一个更高质量的AU Optronics面板,响应时间更快,颜色更好,背光更亮。


| |||||||||||||||||||||||||
Brightness Distribution: 87 %
Center on Battery: 265.1 cd/m²
Contrast: 757:1 (Black: 0.35 cd/m²)
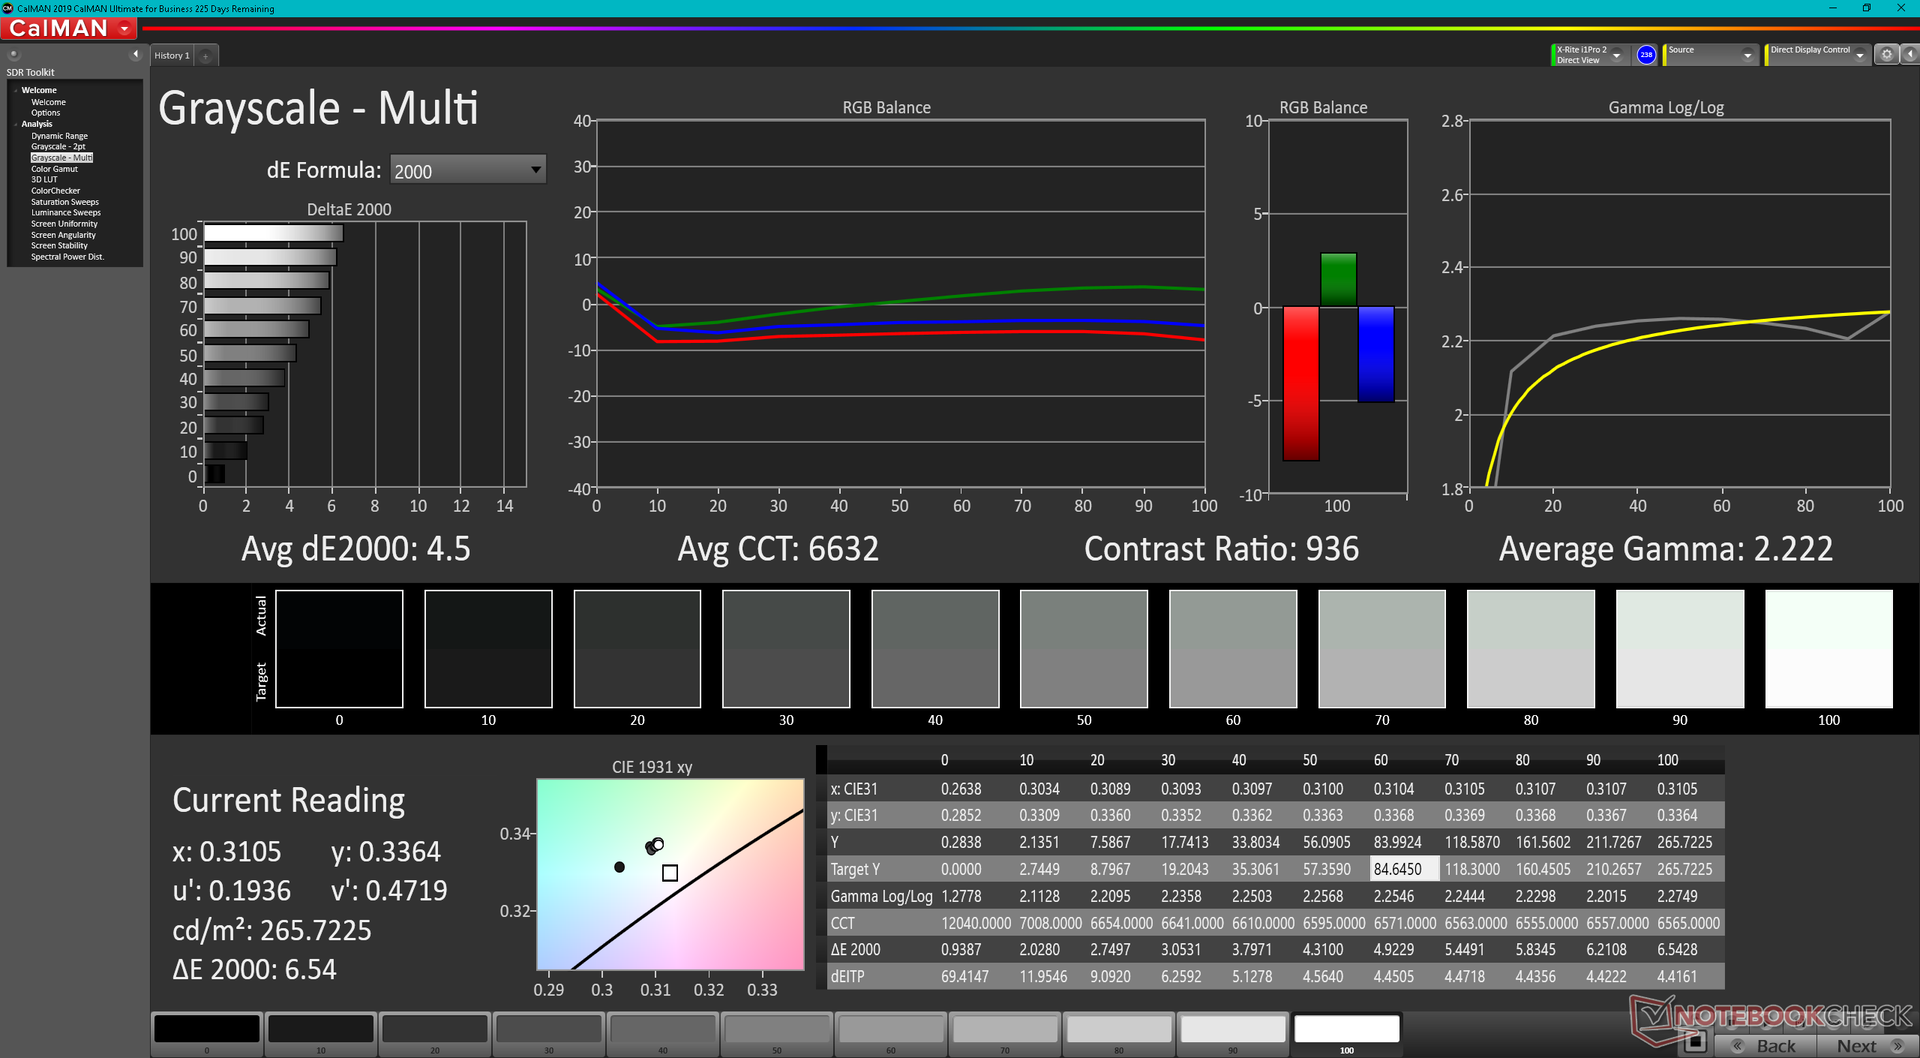
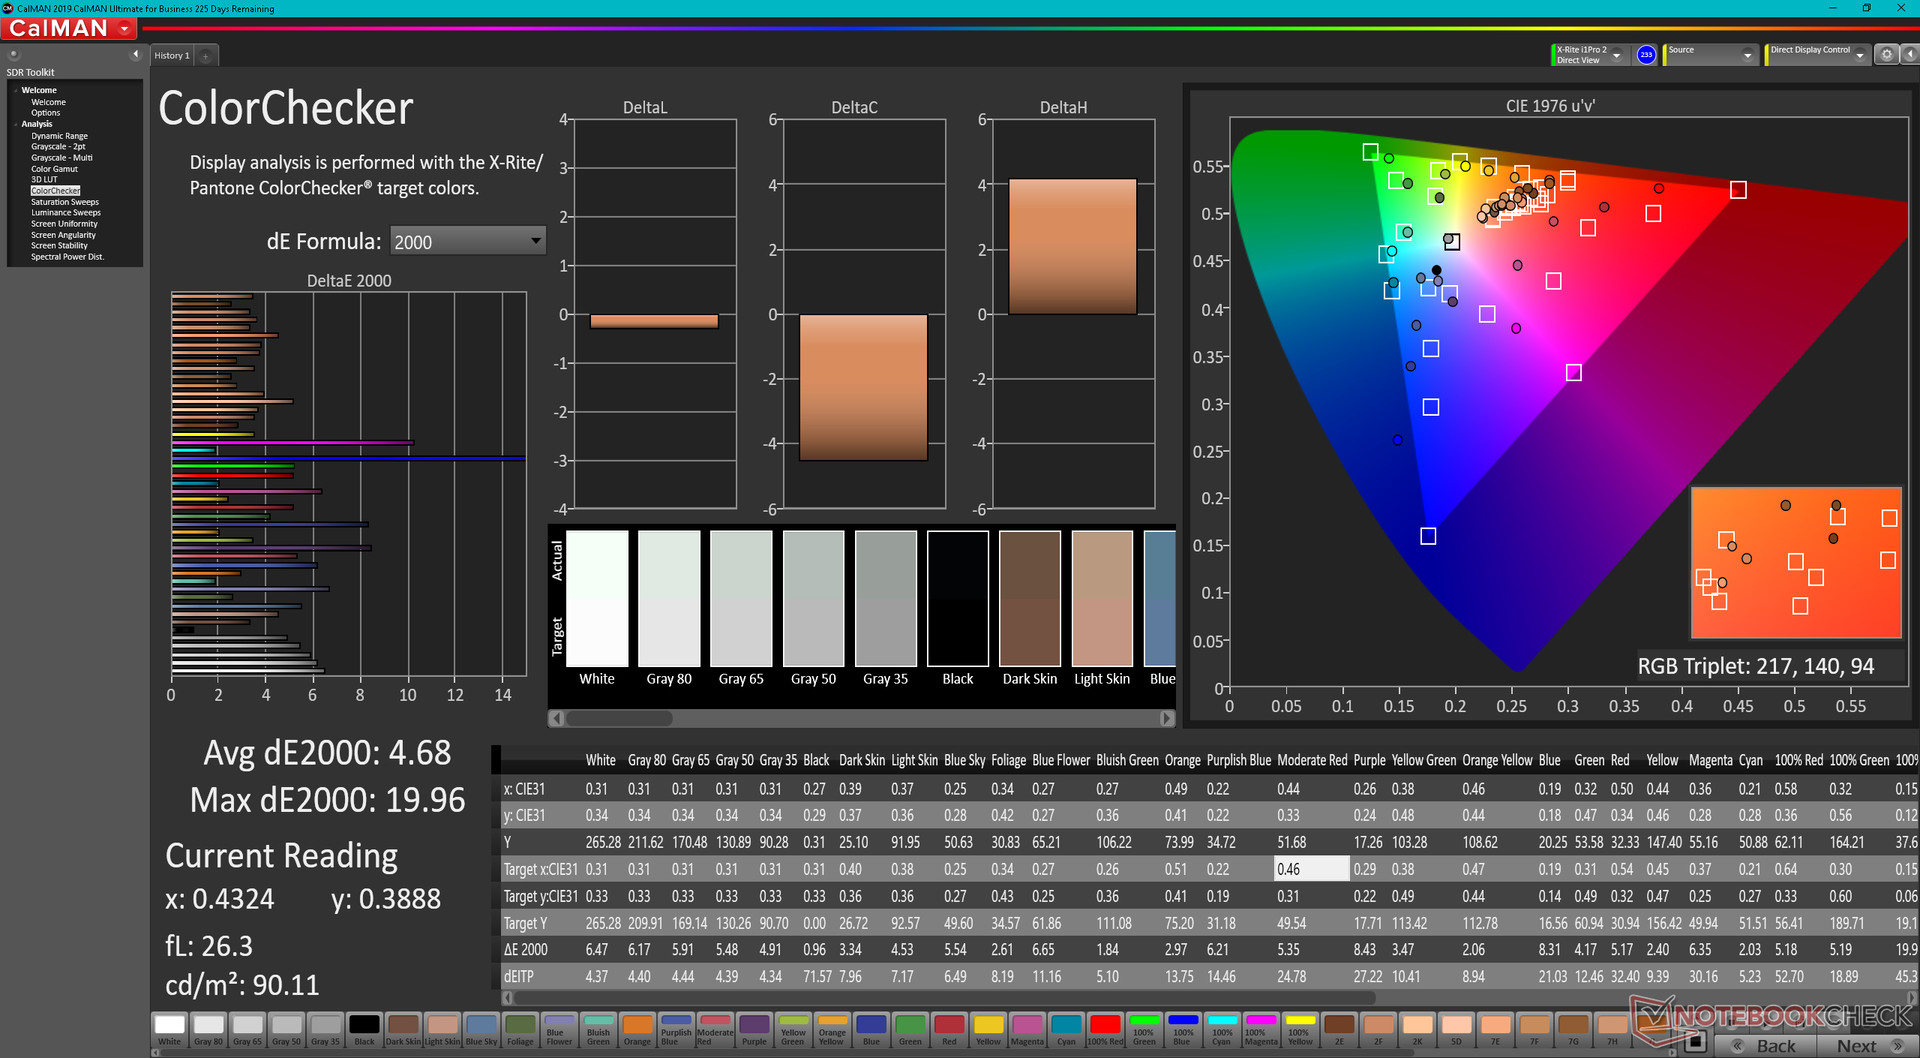
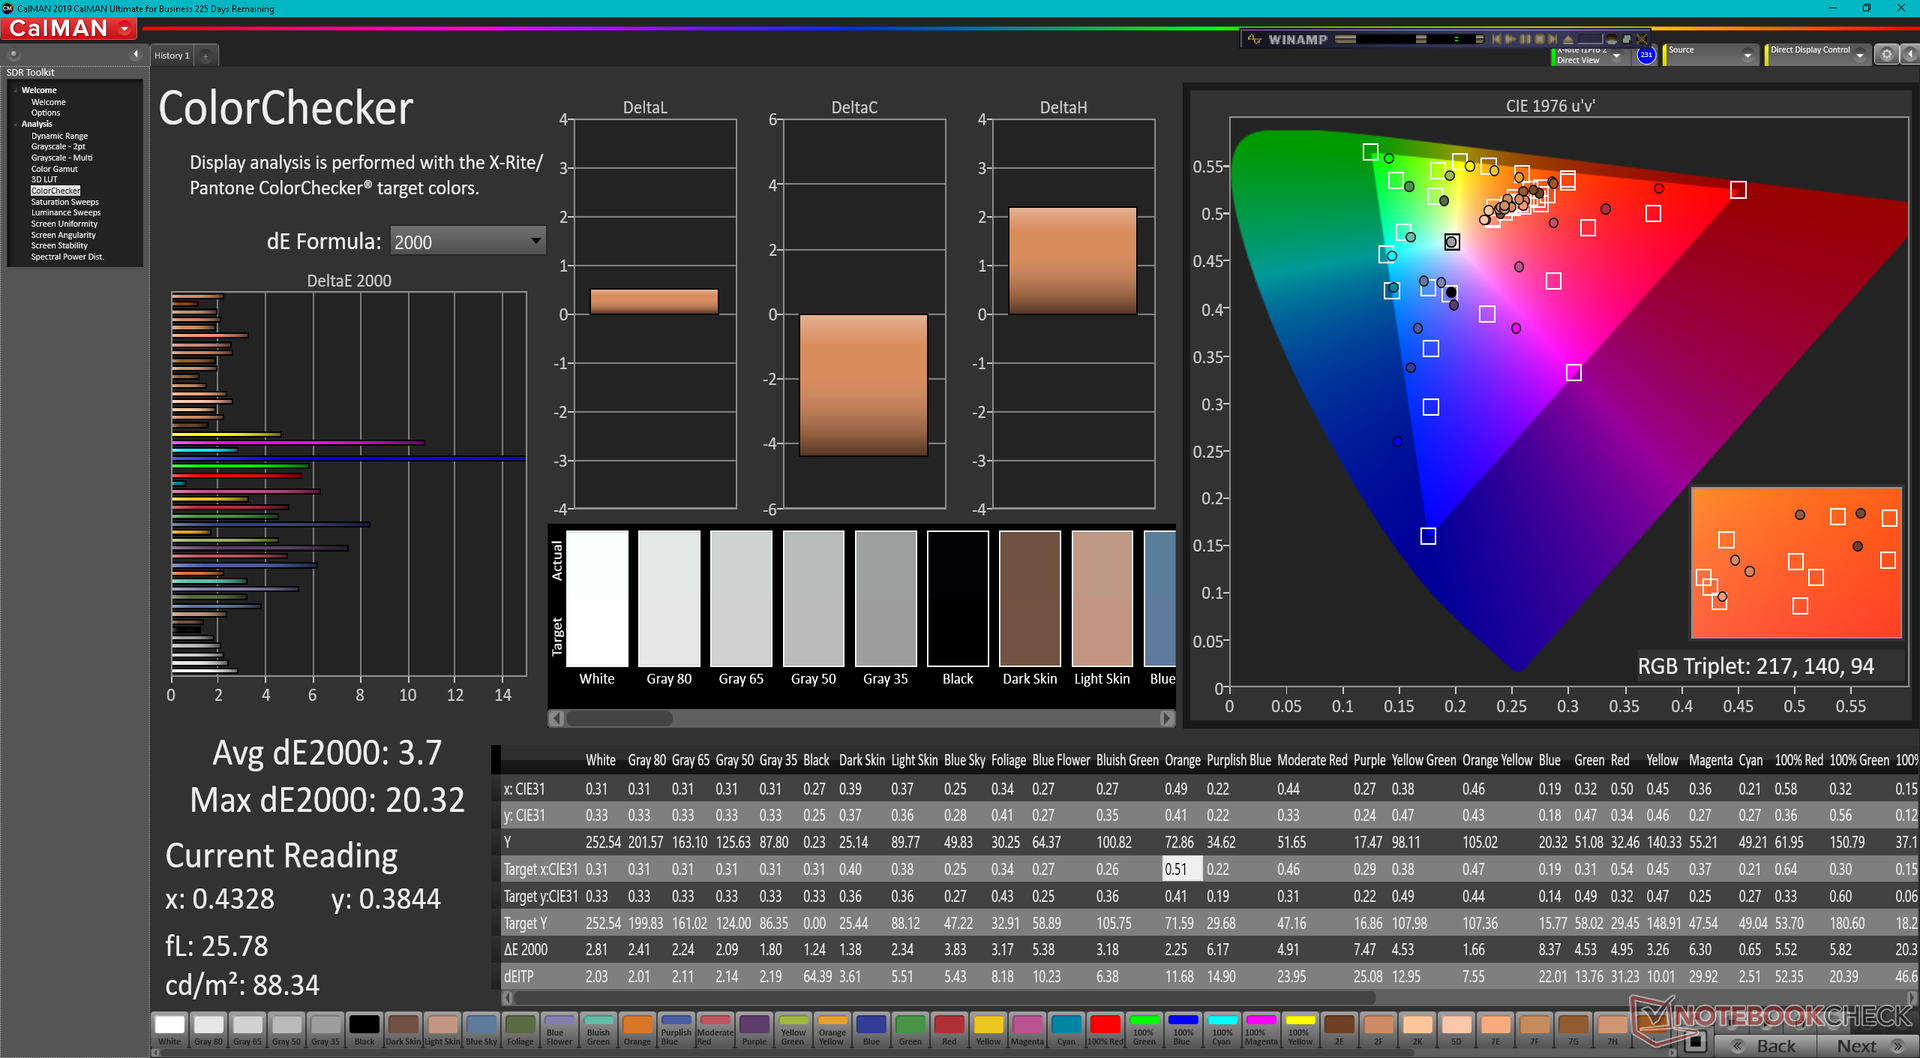
ΔE ColorChecker Calman: 4.68 | ∀{0.5-29.43 Ø4.73}
calibrated: 3.7
ΔE Greyscale Calman: 4.5 | ∀{0.09-98 Ø4.97}
43.6% AdobeRGB 1998 (Argyll 3D)
62.8% sRGB (Argyll 3D)
42.1% Display P3 (Argyll 3D)
Gamma: 2.22
CCT: 6632 K
| MSI Bravo 15 B5DD-010US Chi Mei N156HRA-EA1, IPS, 1920x1080, 15.6" | MSI Bravo 15 A4DCR AU Optronics B156HAN08.0 (AUO80ED), IPS-Level, 1920x1080, 15.6" | Asus TUF Gaming F15 FX507ZM TL156VDXP0101, IPS, 1920x1080, 15.6" | Dell G15 5515 BOE092A, IPS, 1920x1080, 15.6" | Lenovo Ideapad Gaming 3 15IHU-82K1002RGE LEN156FHD, IPS, 1920x1080, 15.6" | Acer Nitro 5 AN515-45-R1JH BOE BOE09B8, IPS, 2560x1440, 15.6" | |
|---|---|---|---|---|---|---|
| Display | 43% | 56% | -8% | -6% | 55% | |
| Display P3 Coverage (%) | 42.1 | 62 47% | 66.4 58% | 39.1 -7% | 39.7 -6% | 66.2 57% |
| sRGB Coverage (%) | 62.8 | 86.8 38% | 97 54% | 56.9 -9% | 59.6 -5% | 96.3 53% |
| AdobeRGB 1998 Coverage (%) | 43.6 | 62.7 44% | 68.5 57% | 40.4 -7% | 41.1 -6% | 67.1 54% |
| Response Times | 46% | 61% | 14% | -68% | 55% | |
| Response Time Grey 50% / Grey 80% * (ms) | 25.6 ? | 16 ? 37% | 5.6 ? 78% | 25.2 ? 2% | 46.4 ? -81% | 14 ? 45% |
| Response Time Black / White * (ms) | 22.8 ? | 10.4 ? 54% | 12.8 ? 44% | 16.8 ? 26% | 35.2 ? -54% | 8 ? 65% |
| PWM Frequency (Hz) | 200 ? | |||||
| Screen | 15% | 44% | -1% | 11% | 7% | |
| Brightness middle (cd/m²) | 265.1 | 311 17% | 353.7 33% | 278 5% | 307 16% | 349 32% |
| Brightness (cd/m²) | 245 | 313 28% | 340 39% | 262 7% | 292 19% | 304 24% |
| Brightness Distribution (%) | 87 | 88 1% | 89 2% | 83 -5% | 88 1% | 79 -9% |
| Black Level * (cd/m²) | 0.35 | 0.43 -23% | 0.34 3% | 0.36 -3% | 0.21 40% | 0.535 -53% |
| Contrast (:1) | 757 | 723 -4% | 1040 37% | 772 2% | 1462 93% | 652 -14% |
| Colorchecker dE 2000 * | 4.68 | 4.5 4% | 1.74 63% | 5.74 -23% | 5.9 -26% | 3.11 34% |
| Colorchecker dE 2000 max. * | 19.96 | 7.97 60% | 3.63 82% | 19.63 2% | 21.6 -8% | 9.57 52% |
| Colorchecker dE 2000 calibrated * | 3.7 | 2.65 28% | 0.5 86% | 4.7 -27% | 4.8 -30% | |
| Greyscale dE 2000 * | 4.5 | 3.3 27% | 2.1 53% | 3.1 31% | 4.9 -9% | 5 -11% |
| Gamma | 2.22 99% | 2.129 103% | 2.3 96% | 2.011 109% | 2.26 97% | 2.36 93% |
| CCT | 6632 98% | 7227 90% | 6257 104% | 6207 105% | 6504 100% | 6976 93% |
| Color Space (Percent of AdobeRGB 1998) (%) | 63 | |||||
| Color Space (Percent of sRGB) (%) | 86 | |||||
| Total Average (Program / Settings) | 35% /
26% | 54% /
49% | 2% /
-0% | -21% /
-4% | 39% /
25% |
* ... smaller is better
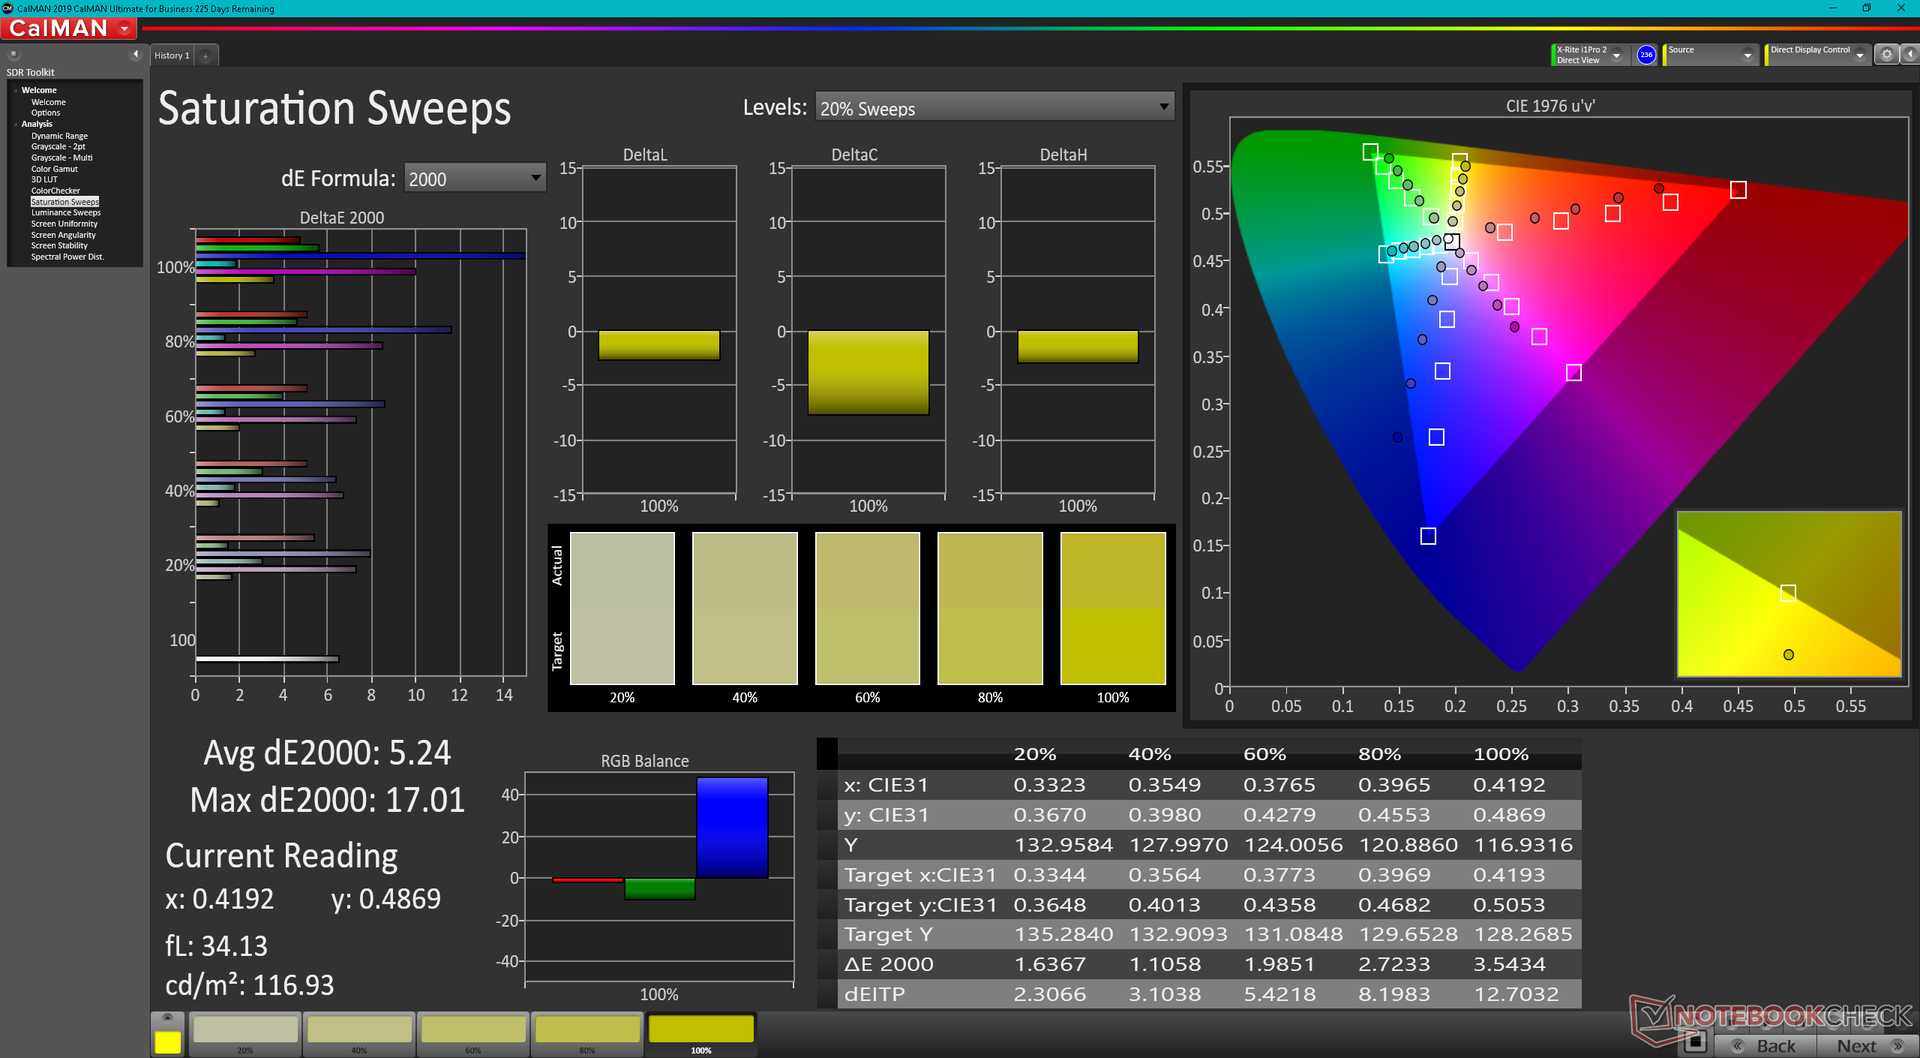
色彩空间狭窄,仅为sRGB的63%,这是面向预算的面板的一个共同属性。大多数中档游戏笔记本都有全sRGB覆盖的选项,而新的Bravo 15则没有。看来,微星这次取消了一些更高端的显示选项。
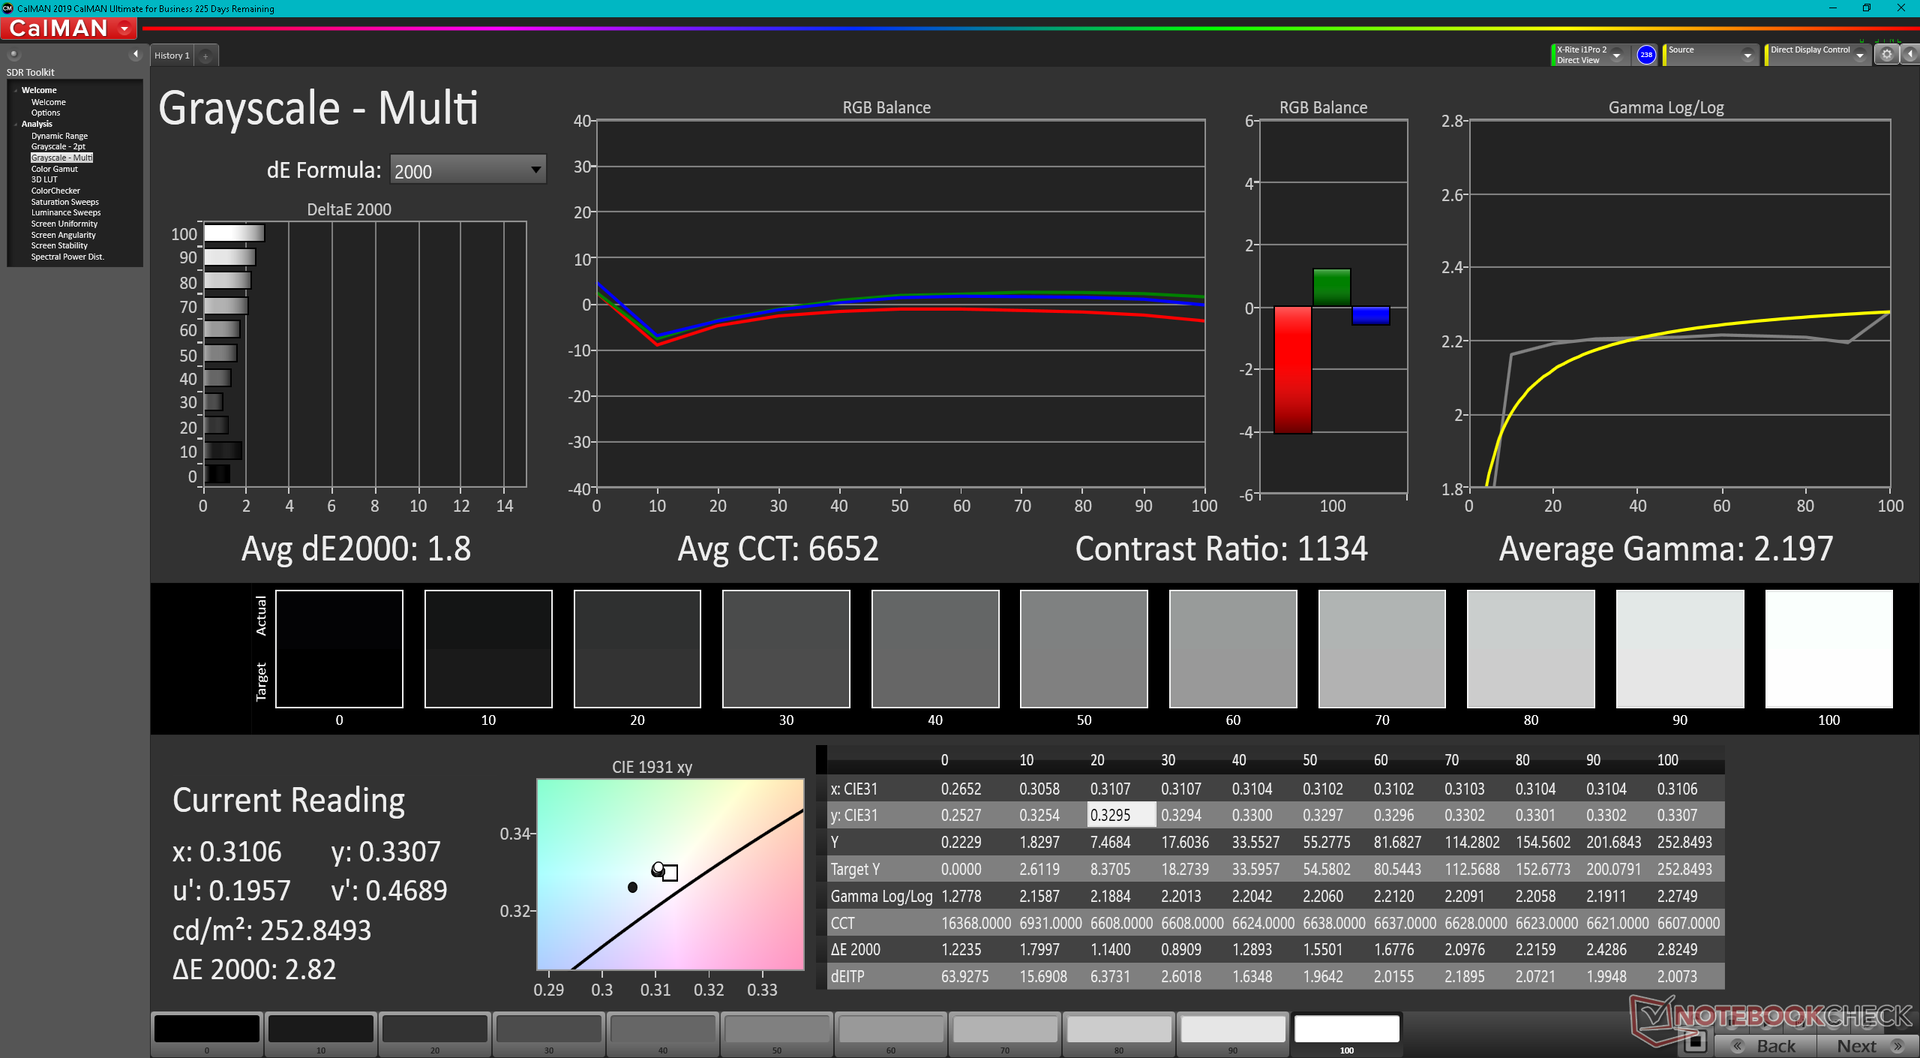
平均灰度和彩色DeltaE值对于一台预算游戏笔记本来说实际上并不坏,因为廉价的面板在默认情况下往往过于冷淡。我们能够用X-Rite色度计进一步提高精确度(灰度DeltaE 4.5 -> 1.8,ColorChecker DeltaE 4.68 -> 3.7),但由于上述有限的色域,用户不应该期望有什么大的变化。

Display Response Times
| ↔ Response Time Black to White | ||
|---|---|---|
| 22.8 ms ... rise ↗ and fall ↘ combined | ↗ 13.2 ms rise | 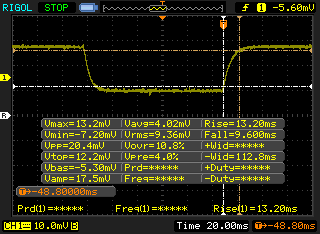 |
| ↘ 9.6 ms fall | ||
| The screen shows good response rates in our tests, but may be too slow for competitive gamers. In comparison, all tested devices range from 0.1 (minimum) to 240 (maximum) ms. » 51 % of all devices are better. This means that the measured response time is worse than the average of all tested devices (19.9 ms). | ||
| ↔ Response Time 50% Grey to 80% Grey | ||
| 25.6 ms ... rise ↗ and fall ↘ combined | ↗ 14 ms rise | 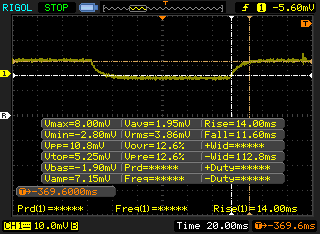 |
| ↘ 11.6 ms fall | ||
| The screen shows relatively slow response rates in our tests and may be too slow for gamers. In comparison, all tested devices range from 0.165 (minimum) to 636 (maximum) ms. » 36 % of all devices are better. This means that the measured response time is better than the average of all tested devices (31.1 ms). | ||
Screen Flickering / PWM (Pulse-Width Modulation)
| Screen flickering / PWM not detected | 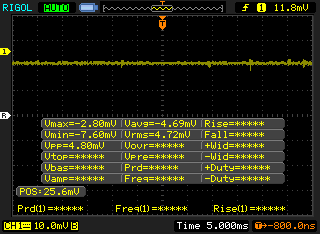 | ||
In comparison: 52 % of all tested devices do not use PWM to dim the display. If PWM was detected, an average of 7784 (minimum: 5 - maximum: 343500) Hz was measured. | |||
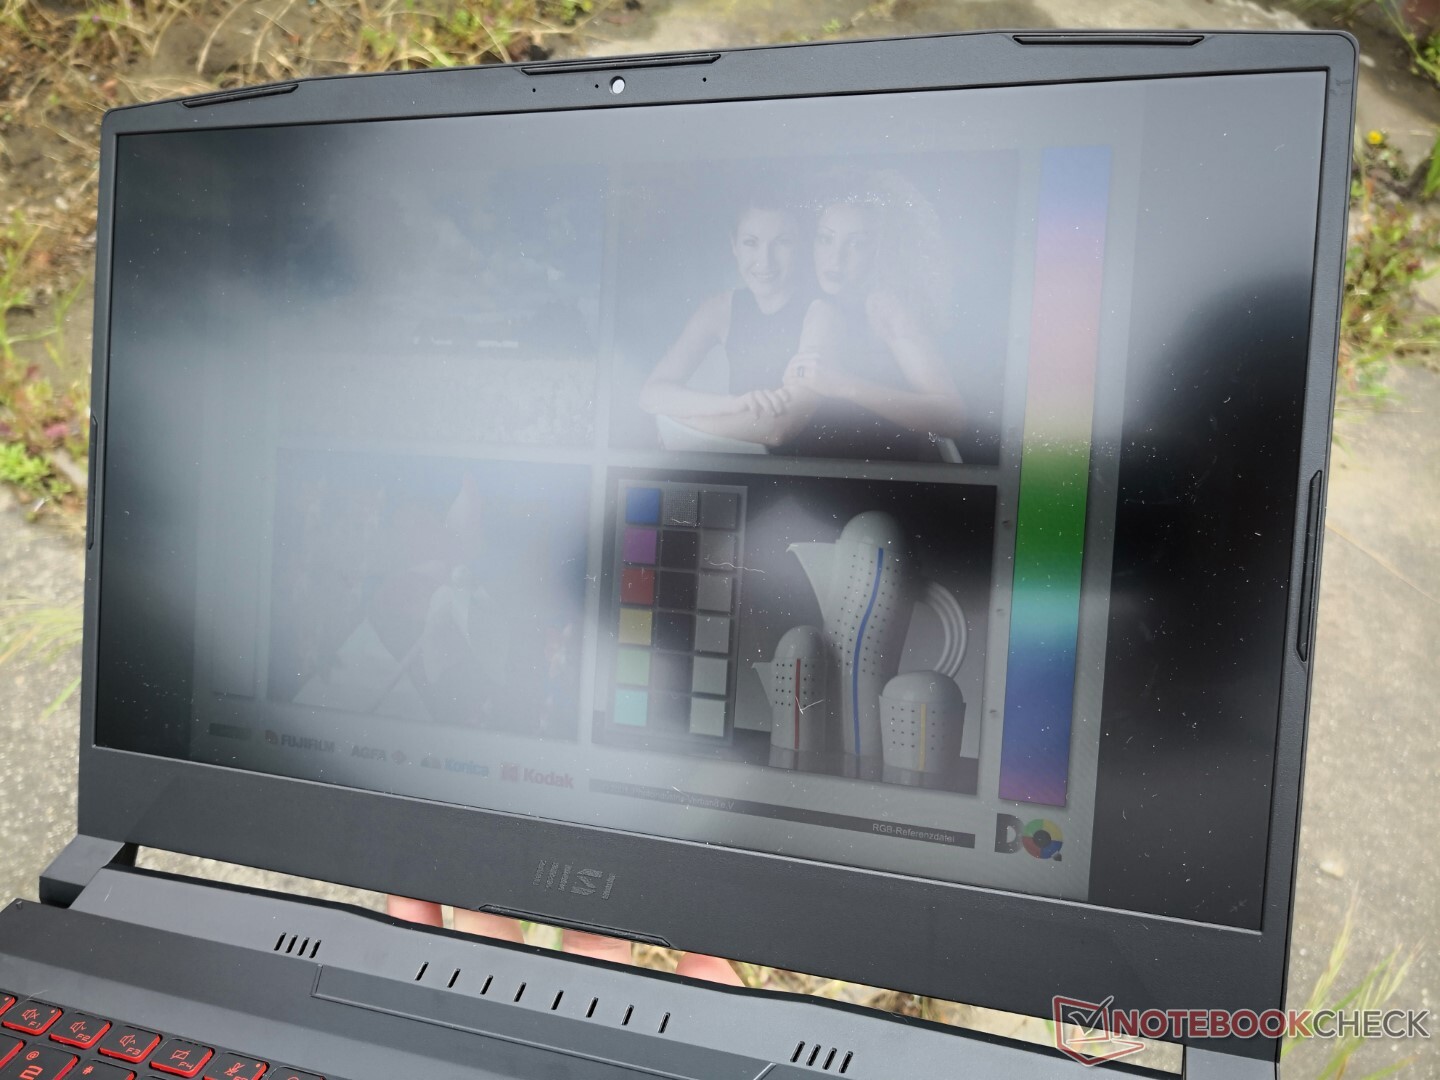
室外能见度低于平均水平,因为大多数其他游戏笔记本电脑的显示屏都在300尼特左右,而我们的Bravo 15测试装置的显示屏在九个象限的平均亮度达到了250尼特左右。用户可能希望禁用默认启用的AMD Vari-Bright,否则在电池供电的情况下,最大亮度将进一步下降。

业绩
测试条件
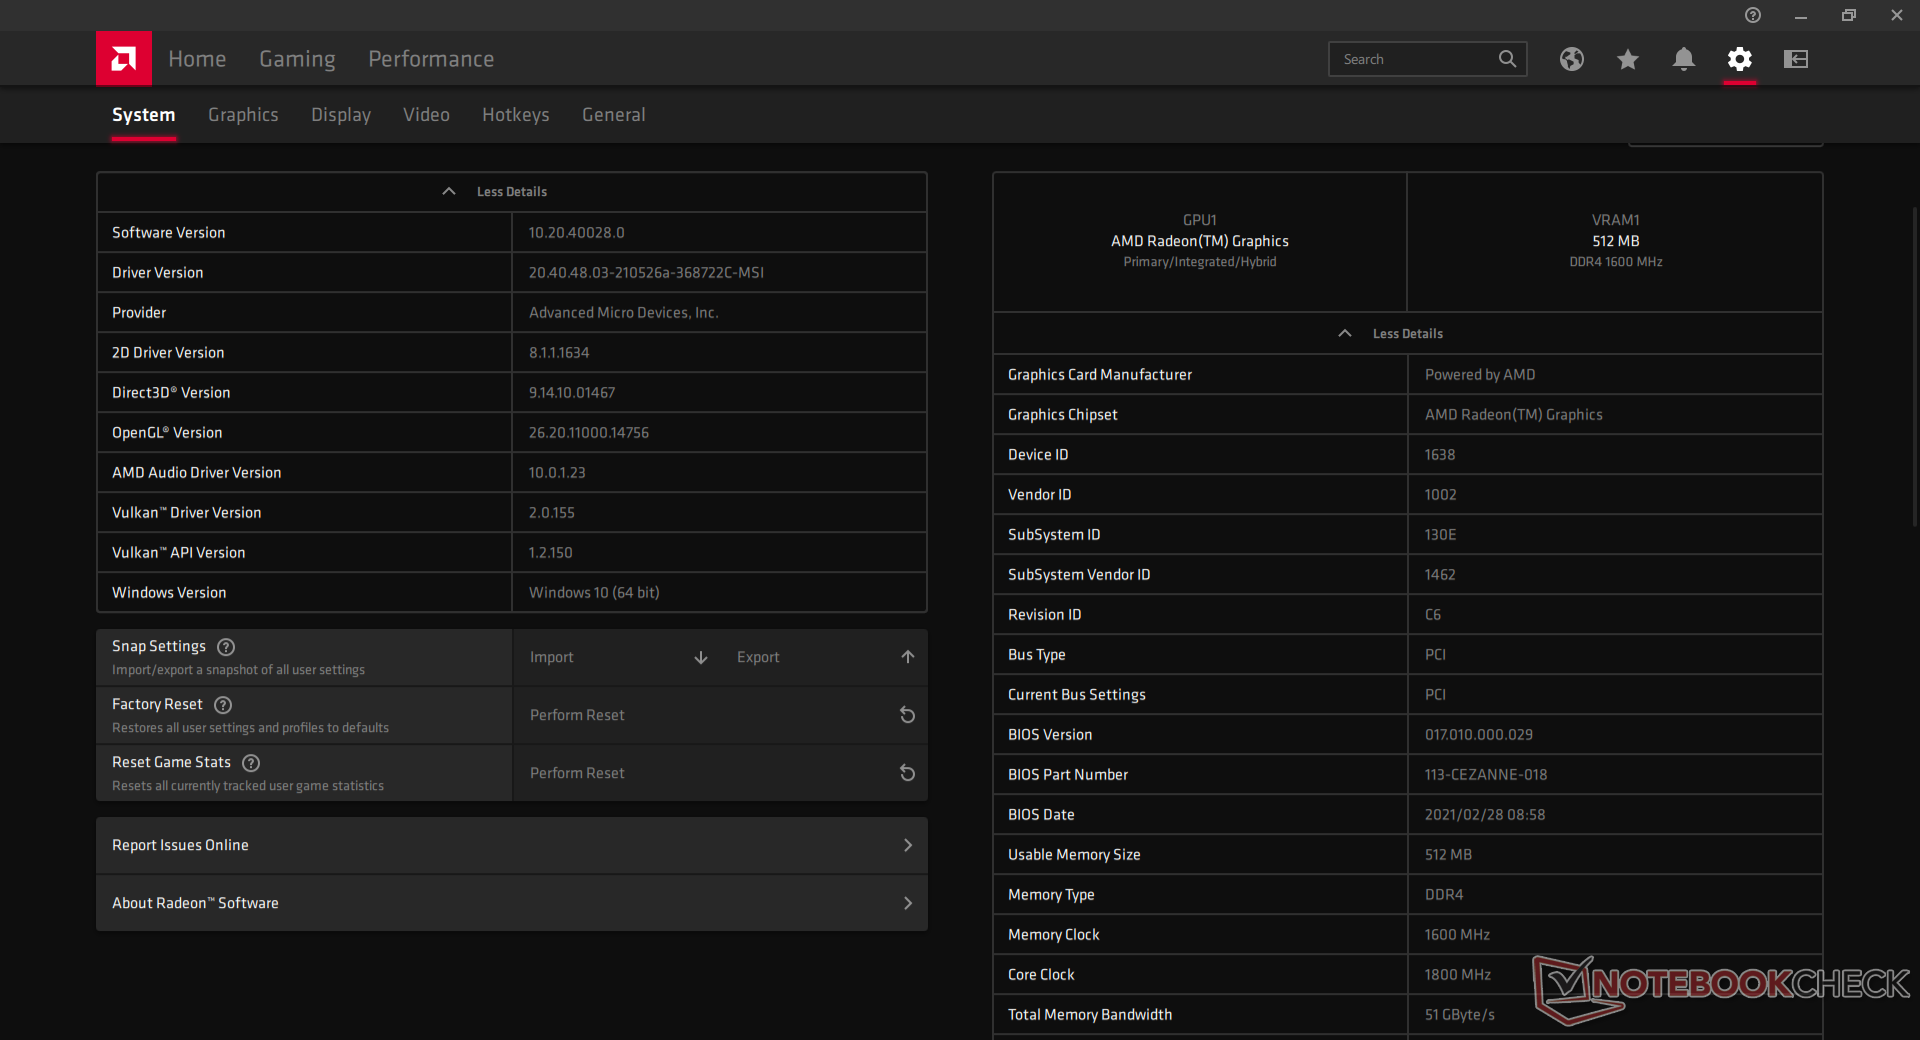
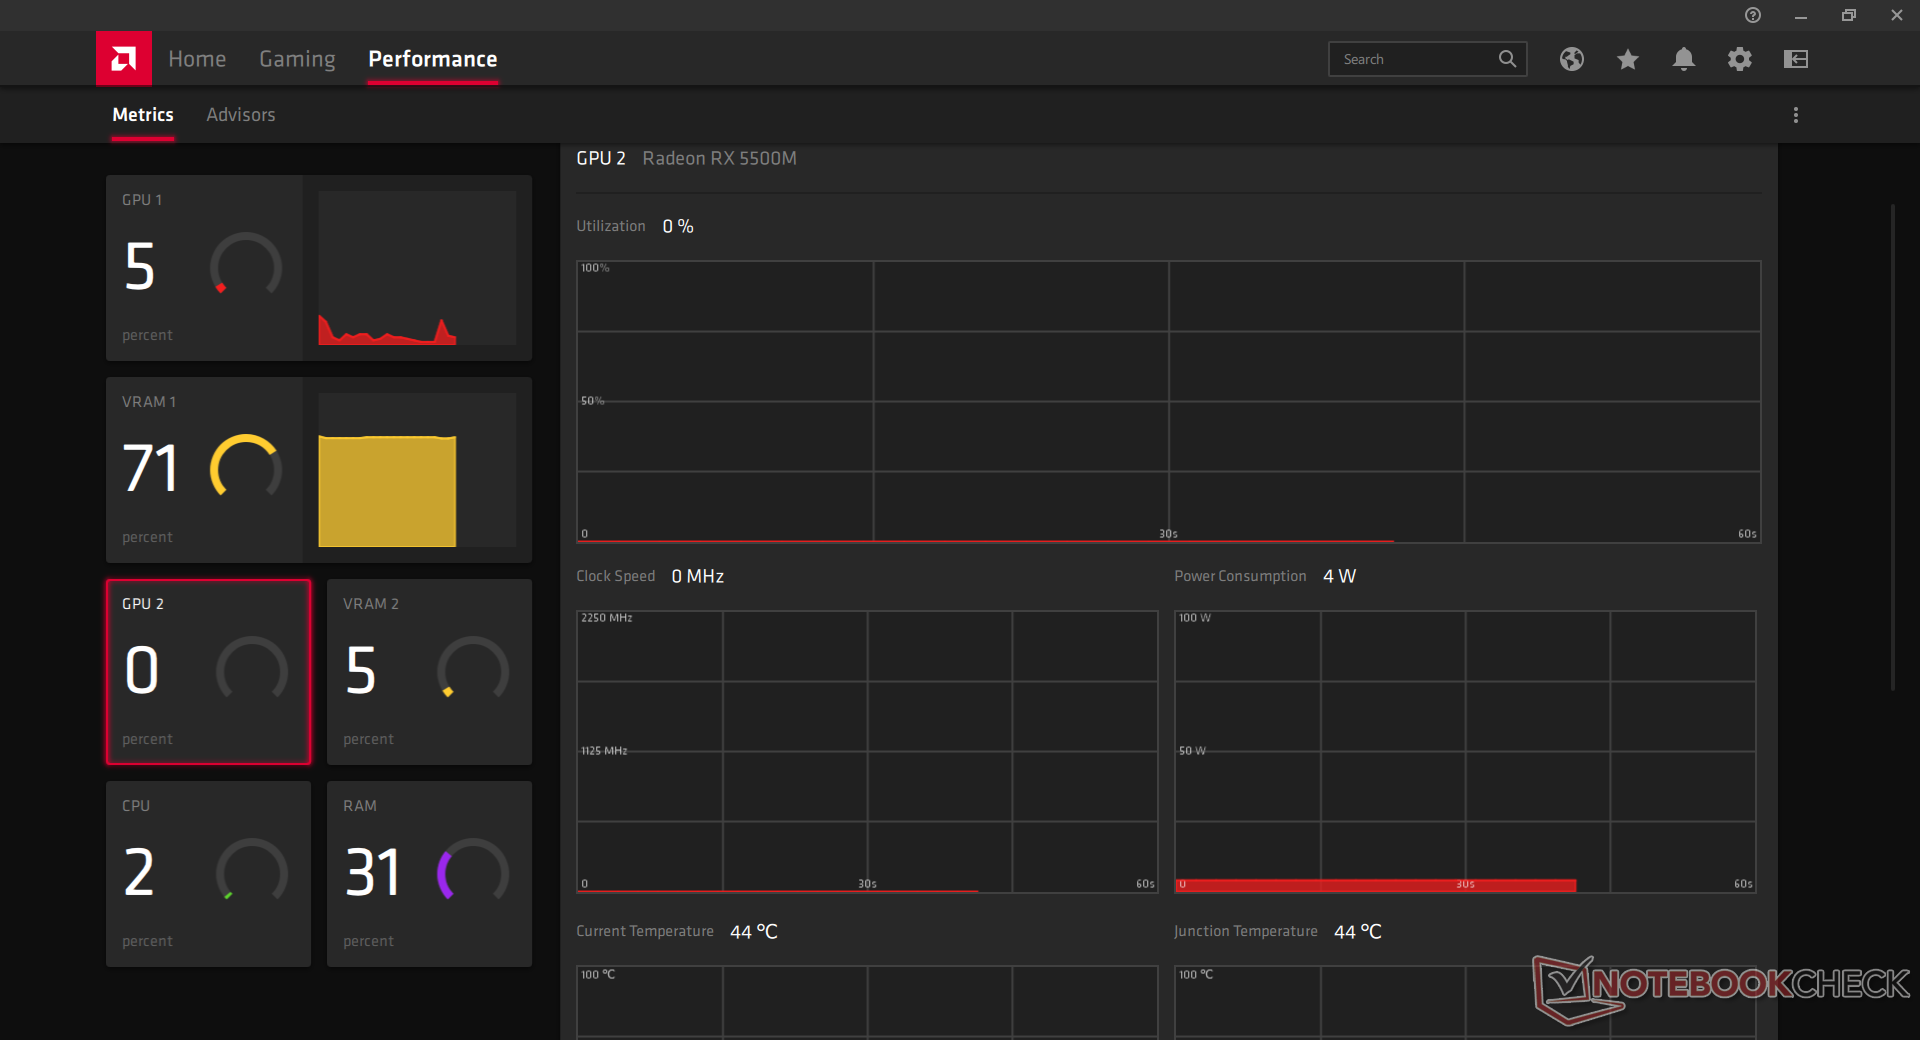
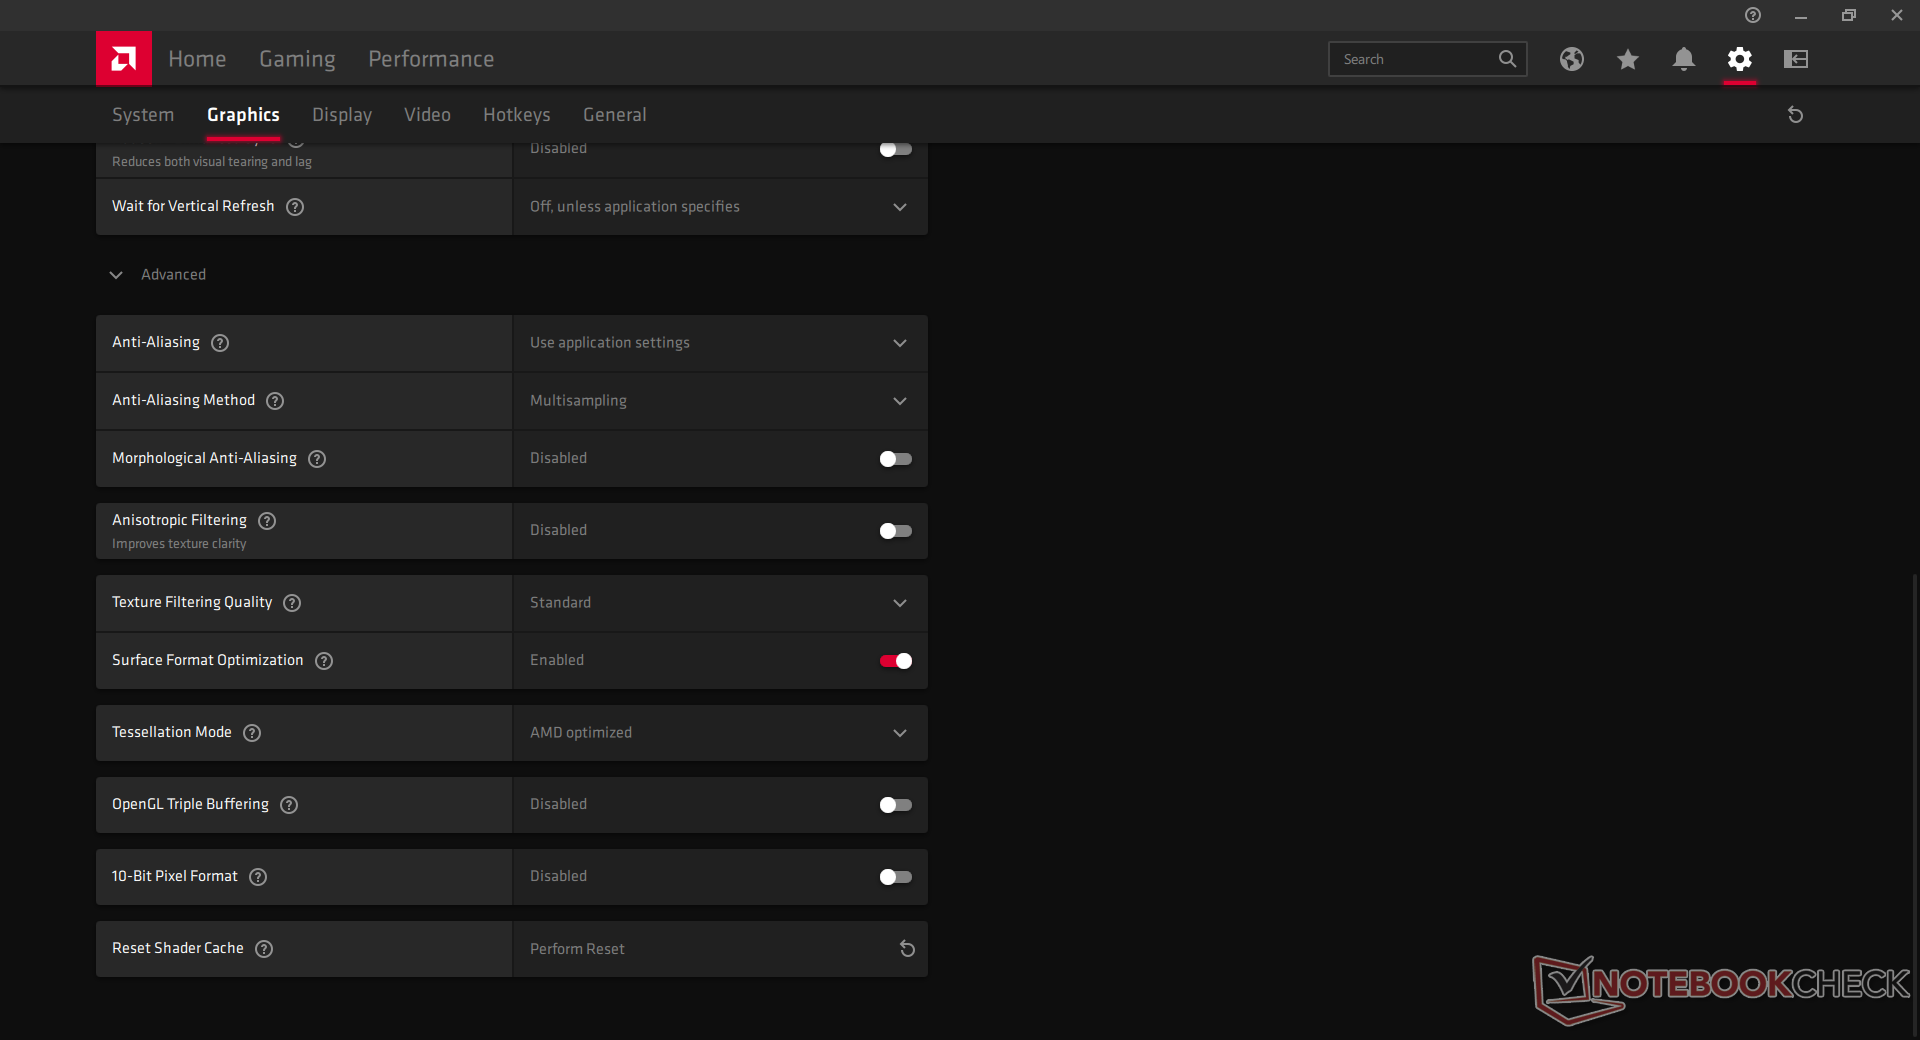
在运行下面的任何基准测试之前,我们的设备通过预装的微星中心软件被设置为极限性能模式。强烈建议用户熟悉微星中心、AMD Radeon软件和Nahimic Companion软件,因为关键的系统功能是通过这些特定的应用程序进行切换的。
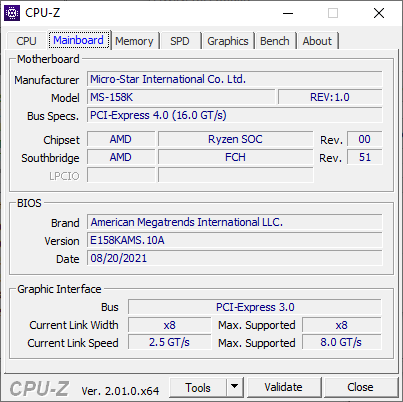
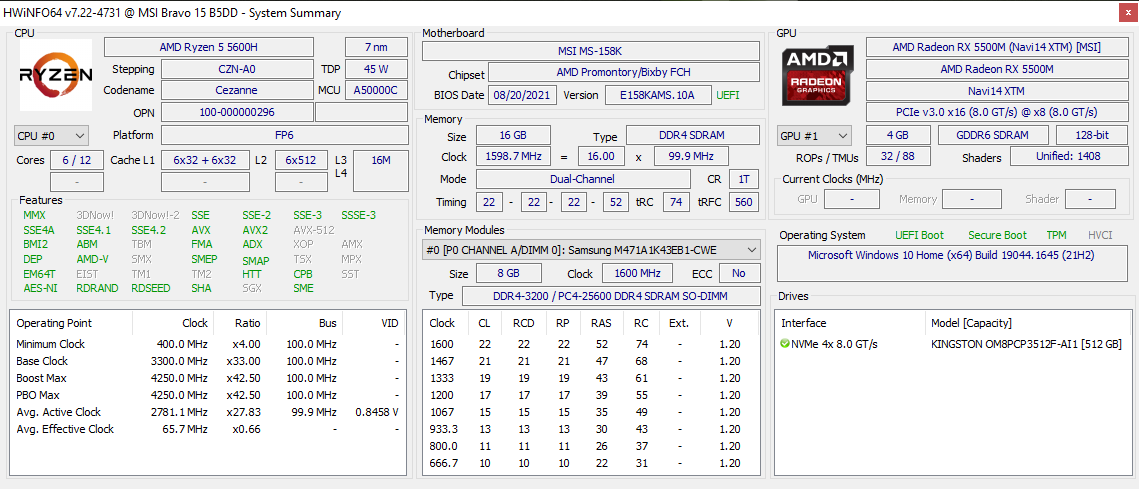
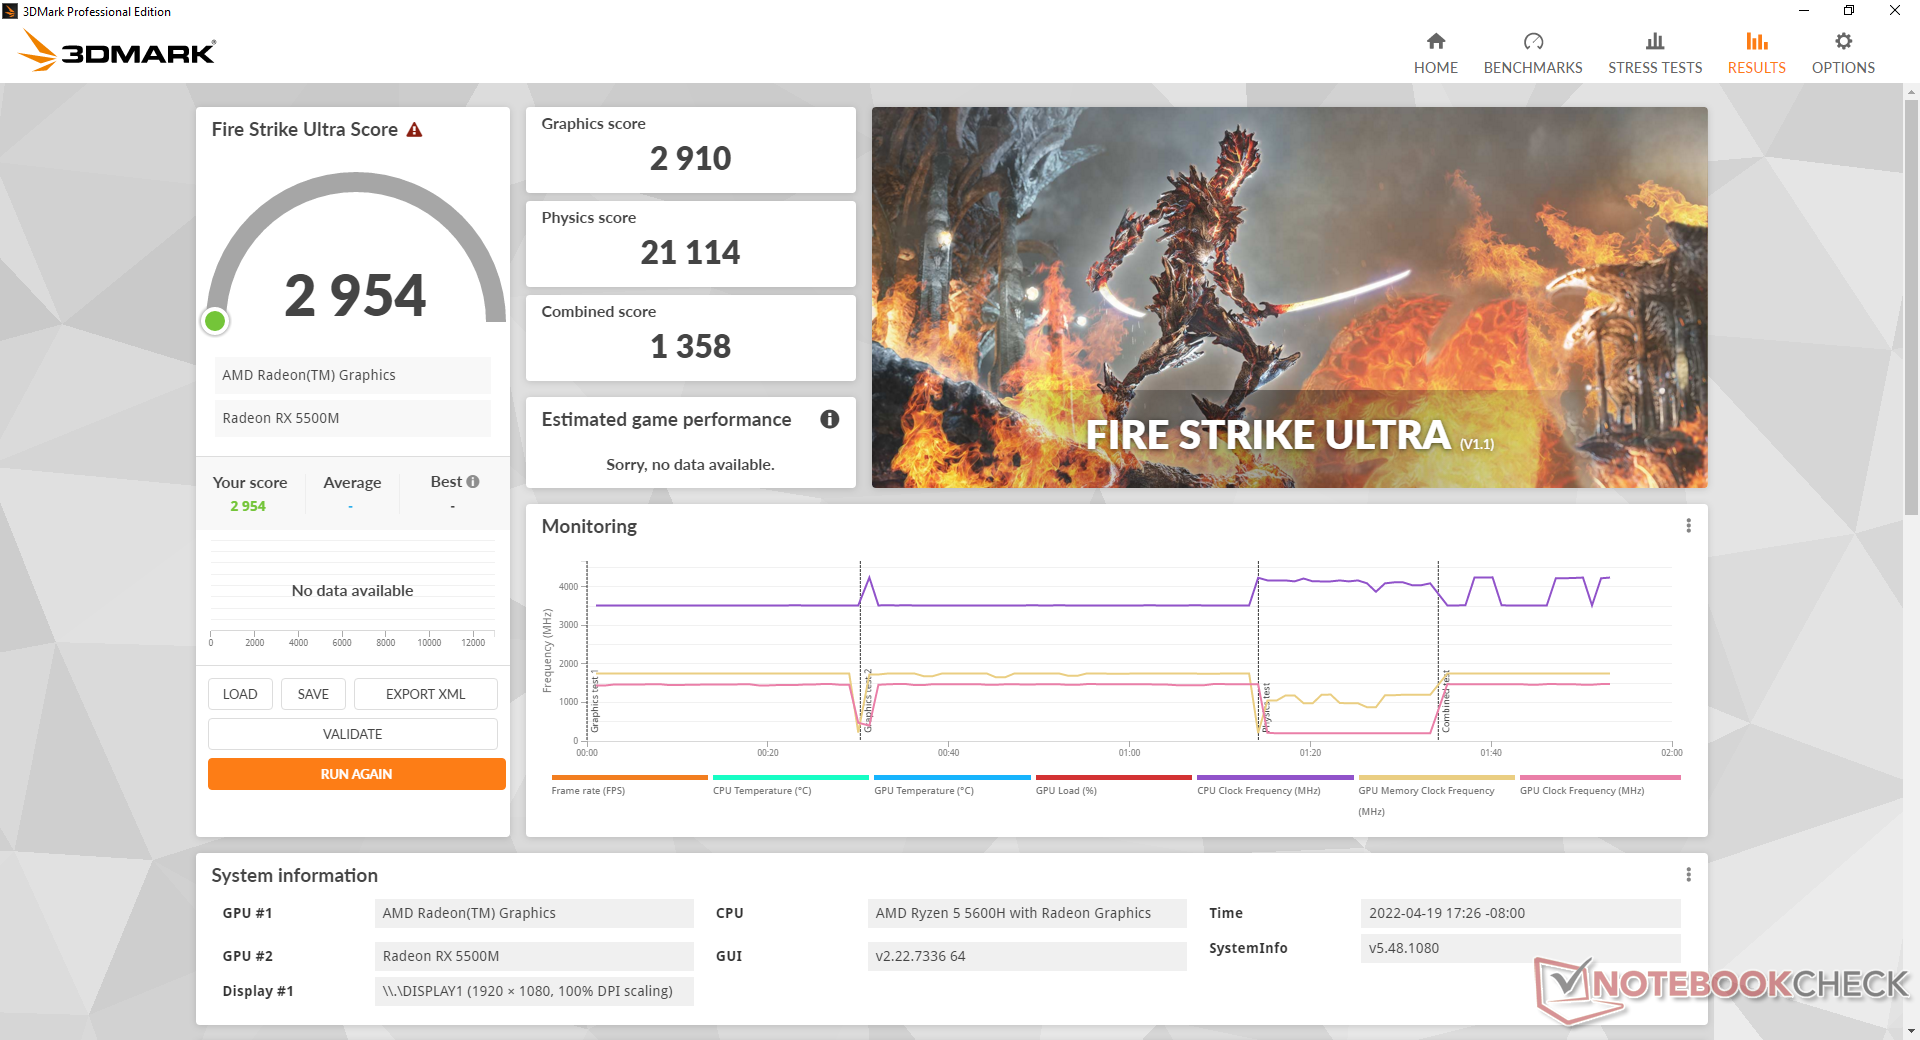
根据Renoir Mobile Tuning工具,默认的CPU PL状态被设置为45W,而根据HWiNFO,Radeon RX 5500M PPT被设置为65W。这里的TGP与2016年起许多游戏笔记本上常见的移动GeForce GTX 1060相一致。
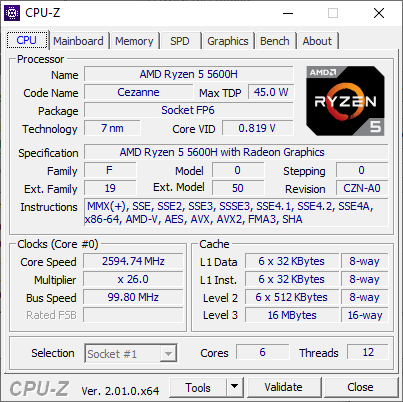
处理器 - Ryzen CPU是亮点
从Ryzen 5 3550H到Ryzen 5 4600H的跳跃对AMD来说已经很重要了。因此,从Ryzen 5 4600H到Ryzen 5 5600H的跳跃在我们的MSI上发现是相对较小的。在单线程和多线程负载方面,该CPU只比其直接的前辈快10%和25%,尽管如此,对于一个面向预算的H系列CPU来说,这仍然是很好的。原始多线程性能始终比Ryzen 5 5600H直接竞争的任何10代或11代英特尔酷睿i5系列CPU快。
性能的可持续性非常好,在循环运行CineBench R15 xT时,没有波动的时钟速率或随时间下降。
Cinebench R15 Multi Loop
Cinebench R23: Multi Core | Single Core
Cinebench R15: CPU Multi 64Bit | CPU Single 64Bit
Blender: v2.79 BMW27 CPU
7-Zip 18.03: 7z b 4 | 7z b 4 -mmt1
Geekbench 5.5: Multi-Core | Single-Core
HWBOT x265 Benchmark v2.2: 4k Preset
LibreOffice : 20 Documents To PDF
R Benchmark 2.5: Overall mean
| Cinebench R20 / CPU (Multi Core) | |
| Asus TUF Gaming F15 FX507ZM | |
| MSI Pulse GL66 12UEK | |
| Razer Blade 15 2022 | |
| Asus ROG Strix Scar 15 G533QS | |
| Medion Erazer Deputy P25 | |
| Eurocom RX315 NH57AF1 | |
| MSI Alpha 15 B5EEK-008 | |
| Schenker XMG Core 15 Ampere | |
| Average AMD Ryzen 5 5600H (3074 - 4059, n=16) | |
| MSI Bravo 15 B5DD-010US | |
| HP Pavilion Gaming 15-ec1206ng | |
| Gigabyte G5 KC | |
| Lenovo Ideapad Gaming 3 15IHU-82K1002RGE | |
| HP Pavilion Gaming 15-ec0002ng | |
| Cinebench R20 / CPU (Single Core) | |
| MSI Pulse GL66 12UEK | |
| Razer Blade 15 2022 | |
| Asus TUF Gaming F15 FX507ZM | |
| Eurocom RX315 NH57AF1 | |
| Asus ROG Strix Scar 15 G533QS | |
| Medion Erazer Deputy P25 | |
| MSI Alpha 15 B5EEK-008 | |
| MSI Bravo 15 B5DD-010US | |
| Average AMD Ryzen 5 5600H (527 - 538, n=15) | |
| Lenovo Ideapad Gaming 3 15IHU-82K1002RGE | |
| Schenker XMG Core 15 Ampere | |
| Gigabyte G5 KC | |
| HP Pavilion Gaming 15-ec1206ng | |
| HP Pavilion Gaming 15-ec0002ng | |
| Cinebench R23 / Multi Core | |
| Asus TUF Gaming F15 FX507ZM | |
| MSI Pulse GL66 12UEK | |
| Razer Blade 15 2022 | |
| Asus ROG Strix Scar 15 G533QS | |
| Medion Erazer Deputy P25 | |
| Eurocom RX315 NH57AF1 | |
| MSI Alpha 15 B5EEK-008 | |
| Schenker XMG Core 15 Ampere | |
| Average AMD Ryzen 5 5600H (7945 - 10416, n=13) | |
| MSI Bravo 15 B5DD-010US | |
| Gigabyte G5 KC | |
| Lenovo Ideapad Gaming 3 15IHU-82K1002RGE | |
| Cinebench R23 / Single Core | |
| MSI Pulse GL66 12UEK | |
| Razer Blade 15 2022 | |
| Asus TUF Gaming F15 FX507ZM | |
| Eurocom RX315 NH57AF1 | |
| Asus ROG Strix Scar 15 G533QS | |
| Medion Erazer Deputy P25 | |
| MSI Alpha 15 B5EEK-008 | |
| MSI Bravo 15 B5DD-010US | |
| Average AMD Ryzen 5 5600H (1316 - 1381, n=13) | |
| Lenovo Ideapad Gaming 3 15IHU-82K1002RGE | |
| Schenker XMG Core 15 Ampere | |
| Gigabyte G5 KC | |
| Cinebench R15 / CPU Multi 64Bit | |
| Asus TUF Gaming F15 FX507ZM | |
| MSI Pulse GL66 12UEK | |
| Asus ROG Strix Scar 15 G533QS | |
| Razer Blade 15 2022 | |
| Medion Erazer Deputy P25 | |
| MSI Alpha 15 B5EEK-008 | |
| Schenker XMG Core 15 Ampere | |
| Eurocom RX315 NH57AF1 | |
| Average AMD Ryzen 5 5600H (1319 - 1723, n=16) | |
| MSI Bravo 15 B5DD-010US | |
| HP Pavilion Gaming 15-ec1206ng | |
| Gigabyte G5 KC | |
| Lenovo Ideapad Gaming 3 15IHU-82K1002RGE | |
| HP Pavilion Gaming 15-ec0002ng | |
| Cinebench R15 / CPU Single 64Bit | |
| MSI Pulse GL66 12UEK | |
| Razer Blade 15 2022 | |
| Asus TUF Gaming F15 FX507ZM | |
| Asus ROG Strix Scar 15 G533QS | |
| Medion Erazer Deputy P25 | |
| MSI Alpha 15 B5EEK-008 | |
| Eurocom RX315 NH57AF1 | |
| MSI Bravo 15 B5DD-010US | |
| Average AMD Ryzen 5 5600H (218 - 225, n=14) | |
| Lenovo Ideapad Gaming 3 15IHU-82K1002RGE | |
| Schenker XMG Core 15 Ampere | |
| Gigabyte G5 KC | |
| HP Pavilion Gaming 15-ec1206ng | |
| HP Pavilion Gaming 15-ec0002ng | |
| Blender / v2.79 BMW27 CPU | |
| Lenovo Ideapad Gaming 3 15IHU-82K1002RGE | |
| Gigabyte G5 KC | |
| HP Pavilion Gaming 15-ec1206ng | |
| MSI Bravo 15 B5DD-010US | |
| Average AMD Ryzen 5 5600H (300 - 384, n=14) | |
| Eurocom RX315 NH57AF1 | |
| MSI Alpha 15 B5EEK-008 | |
| Schenker XMG Core 15 Ampere | |
| Medion Erazer Deputy P25 | |
| Asus ROG Strix Scar 15 G533QS | |
| Razer Blade 15 2022 | |
| MSI Pulse GL66 12UEK | |
| Asus TUF Gaming F15 FX507ZM | |
| 7-Zip 18.03 / 7z b 4 | |
| Asus TUF Gaming F15 FX507ZM | |
| MSI Pulse GL66 12UEK | |
| Razer Blade 15 2022 | |
| Asus ROG Strix Scar 15 G533QS | |
| MSI Alpha 15 B5EEK-008 | |
| Medion Erazer Deputy P25 | |
| Schenker XMG Core 15 Ampere | |
| Eurocom RX315 NH57AF1 | |
| MSI Bravo 15 B5DD-010US | |
| Average AMD Ryzen 5 5600H (36315 - 46562, n=14) | |
| HP Pavilion Gaming 15-ec1206ng | |
| Gigabyte G5 KC | |
| Lenovo Ideapad Gaming 3 15IHU-82K1002RGE | |
| 7-Zip 18.03 / 7z b 4 -mmt1 | |
| MSI Pulse GL66 12UEK | |
| Razer Blade 15 2022 | |
| Asus ROG Strix Scar 15 G533QS | |
| MSI Alpha 15 B5EEK-008 | |
| Medion Erazer Deputy P25 | |
| Eurocom RX315 NH57AF1 | |
| Asus TUF Gaming F15 FX507ZM | |
| Average AMD Ryzen 5 5600H (5213 - 5446, n=14) | |
| MSI Bravo 15 B5DD-010US | |
| Gigabyte G5 KC | |
| Lenovo Ideapad Gaming 3 15IHU-82K1002RGE | |
| Schenker XMG Core 15 Ampere | |
| HP Pavilion Gaming 15-ec1206ng | |
| Geekbench 5.5 / Multi-Core | |
| Razer Blade 15 2022 | |
| Asus TUF Gaming F15 FX507ZM | |
| MSI Pulse GL66 12UEK | |
| Eurocom RX315 NH57AF1 | |
| MSI Alpha 15 B5EEK-008 | |
| Schenker XMG Core 15 Ampere | |
| Medion Erazer Deputy P25 | |
| MSI Bravo 15 B5DD-010US | |
| Average AMD Ryzen 5 5600H (4990 - 7253, n=14) | |
| Gigabyte G5 KC | |
| Gigabyte G5 KC | |
| HP Pavilion Gaming 15-ec1206ng | |
| Lenovo Ideapad Gaming 3 15IHU-82K1002RGE | |
| HP Pavilion Gaming 15-ec0002ng | |
| Geekbench 5.5 / Single-Core | |
| MSI Pulse GL66 12UEK | |
| Razer Blade 15 2022 | |
| Asus TUF Gaming F15 FX507ZM | |
| Eurocom RX315 NH57AF1 | |
| MSI Alpha 15 B5EEK-008 | |
| Medion Erazer Deputy P25 | |
| MSI Bravo 15 B5DD-010US | |
| Average AMD Ryzen 5 5600H (1365 - 1445, n=14) | |
| Lenovo Ideapad Gaming 3 15IHU-82K1002RGE | |
| Gigabyte G5 KC | |
| Gigabyte G5 KC | |
| Schenker XMG Core 15 Ampere | |
| HP Pavilion Gaming 15-ec1206ng | |
| HP Pavilion Gaming 15-ec0002ng | |
| HWBOT x265 Benchmark v2.2 / 4k Preset | |
| Asus TUF Gaming F15 FX507ZM | |
| MSI Pulse GL66 12UEK | |
| Razer Blade 15 2022 | |
| Asus ROG Strix Scar 15 G533QS | |
| MSI Alpha 15 B5EEK-008 | |
| Medion Erazer Deputy P25 | |
| Eurocom RX315 NH57AF1 | |
| Schenker XMG Core 15 Ampere | |
| Average AMD Ryzen 5 5600H (9.92 - 13.3, n=14) | |
| MSI Bravo 15 B5DD-010US | |
| HP Pavilion Gaming 15-ec1206ng | |
| Gigabyte G5 KC | |
| Lenovo Ideapad Gaming 3 15IHU-82K1002RGE | |
| LibreOffice / 20 Documents To PDF | |
| HP Pavilion Gaming 15-ec1206ng | |
| Average AMD Ryzen 5 5600H (52.2 - 81.5, n=14) | |
| Schenker XMG Core 15 Ampere | |
| MSI Bravo 15 B5DD-010US | |
| Medion Erazer Deputy P25 | |
| MSI Alpha 15 B5EEK-008 | |
| Lenovo Ideapad Gaming 3 15IHU-82K1002RGE | |
| Asus ROG Strix Scar 15 G533QS | |
| Razer Blade 15 2022 | |
| Gigabyte G5 KC | |
| Asus TUF Gaming F15 FX507ZM | |
| Eurocom RX315 NH57AF1 | |
| MSI Pulse GL66 12UEK | |
| R Benchmark 2.5 / Overall mean | |
| Gigabyte G5 KC | |
| Lenovo Ideapad Gaming 3 15IHU-82K1002RGE | |
| HP Pavilion Gaming 15-ec1206ng | |
| Schenker XMG Core 15 Ampere | |
| Eurocom RX315 NH57AF1 | |
| Average AMD Ryzen 5 5600H (0.526 - 0.596, n=14) | |
| MSI Bravo 15 B5DD-010US | |
| Medion Erazer Deputy P25 | |
| MSI Alpha 15 B5EEK-008 | |
| Asus ROG Strix Scar 15 G533QS | |
| Razer Blade 15 2022 | |
| Asus TUF Gaming F15 FX507ZM | |
| MSI Pulse GL66 12UEK | |
Cinebench R23: Multi Core | Single Core
Cinebench R15: CPU Multi 64Bit | CPU Single 64Bit
Blender: v2.79 BMW27 CPU
7-Zip 18.03: 7z b 4 | 7z b 4 -mmt1
Geekbench 5.5: Multi-Core | Single-Core
HWBOT x265 Benchmark v2.2: 4k Preset
LibreOffice : 20 Documents To PDF
R Benchmark 2.5: Overall mean
* ... smaller is better
AIDA64: FP32 Ray-Trace | FPU Julia | CPU SHA3 | CPU Queen | FPU SinJulia | FPU Mandel | CPU AES | CPU ZLib | FP64 Ray-Trace | CPU PhotoWorxx
| Performance rating | |
| Acer Nitro 5 AN515-45-R1JH | |
| Dell G15 5515 | |
| MSI Bravo 15 A4DCR | |
| Asus TUF Gaming F15 FX507ZM | |
| MSI Bravo 15 B5DD-010US | |
| Average AMD Ryzen 5 5600H | |
| Lenovo Ideapad Gaming 3 15IHU-82K1002RGE | |
| AIDA64 / FP32 Ray-Trace | |
| Dell G15 5515 | |
| Acer Nitro 5 AN515-45-R1JH | |
| MSI Bravo 15 A4DCR | |
| Average AMD Ryzen 5 5600H (9181 - 12636, n=14) | |
| MSI Bravo 15 B5DD-010US | |
| Asus TUF Gaming F15 FX507ZM | |
| Lenovo Ideapad Gaming 3 15IHU-82K1002RGE | |
| AIDA64 / FPU Julia | |
| Acer Nitro 5 AN515-45-R1JH | |
| Dell G15 5515 | |
| Average AMD Ryzen 5 5600H (51994 - 78250, n=14) | |
| MSI Bravo 15 B5DD-010US | |
| MSI Bravo 15 A4DCR | |
| Asus TUF Gaming F15 FX507ZM | |
| Lenovo Ideapad Gaming 3 15IHU-82K1002RGE | |
| AIDA64 / CPU SHA3 | |
| Asus TUF Gaming F15 FX507ZM | |
| Acer Nitro 5 AN515-45-R1JH | |
| Dell G15 5515 | |
| Average AMD Ryzen 5 5600H (1587 - 2675, n=14) | |
| MSI Bravo 15 B5DD-010US | |
| Lenovo Ideapad Gaming 3 15IHU-82K1002RGE | |
| MSI Bravo 15 A4DCR | |
| AIDA64 / CPU Queen | |
| Asus TUF Gaming F15 FX507ZM | |
| Acer Nitro 5 AN515-45-R1JH | |
| MSI Bravo 15 A4DCR | |
| Dell G15 5515 | |
| MSI Bravo 15 B5DD-010US | |
| Average AMD Ryzen 5 5600H (66699 - 77213, n=14) | |
| Lenovo Ideapad Gaming 3 15IHU-82K1002RGE | |
| AIDA64 / FPU SinJulia | |
| MSI Bravo 15 A4DCR | |
| Dell G15 5515 | |
| Acer Nitro 5 AN515-45-R1JH | |
| Asus TUF Gaming F15 FX507ZM | |
| MSI Bravo 15 B5DD-010US | |
| Average AMD Ryzen 5 5600H (8340 - 9159, n=14) | |
| Lenovo Ideapad Gaming 3 15IHU-82K1002RGE | |
| AIDA64 / FPU Mandel | |
| Acer Nitro 5 AN515-45-R1JH | |
| Dell G15 5515 | |
| Average AMD Ryzen 5 5600H (28268 - 43274, n=14) | |
| MSI Bravo 15 B5DD-010US | |
| MSI Bravo 15 A4DCR | |
| Asus TUF Gaming F15 FX507ZM | |
| Lenovo Ideapad Gaming 3 15IHU-82K1002RGE | |
| AIDA64 / CPU AES | |
| Acer Nitro 5 AN515-45-R1JH | |
| Dell G15 5515 | |
| MSI Bravo 15 B5DD-010US | |
| Average AMD Ryzen 5 5600H (39852 - 98939, n=14) | |
| Lenovo Ideapad Gaming 3 15IHU-82K1002RGE | |
| Asus TUF Gaming F15 FX507ZM | |
| MSI Bravo 15 A4DCR | |
| AIDA64 / CPU ZLib | |
| Asus TUF Gaming F15 FX507ZM | |
| Acer Nitro 5 AN515-45-R1JH | |
| Dell G15 5515 | |
| MSI Bravo 15 A4DCR | |
| Average AMD Ryzen 5 5600H (507 - 649, n=14) | |
| MSI Bravo 15 B5DD-010US | |
| Lenovo Ideapad Gaming 3 15IHU-82K1002RGE | |
| AIDA64 / FP64 Ray-Trace | |
| Acer Nitro 5 AN515-45-R1JH | |
| Dell G15 5515 | |
| MSI Bravo 15 A4DCR | |
| Average AMD Ryzen 5 5600H (4811 - 6652, n=14) | |
| MSI Bravo 15 B5DD-010US | |
| Asus TUF Gaming F15 FX507ZM | |
| Lenovo Ideapad Gaming 3 15IHU-82K1002RGE | |
| AIDA64 / CPU PhotoWorxx | |
| Asus TUF Gaming F15 FX507ZM | |
| MSI Bravo 15 A4DCR | |
| MSI Bravo 15 B5DD-010US | |
| Average AMD Ryzen 5 5600H (7419 - 24746, n=14) | |
| Dell G15 5515 | |
| Acer Nitro 5 AN515-45-R1JH | |
| Lenovo Ideapad Gaming 3 15IHU-82K1002RGE | |
系统性能
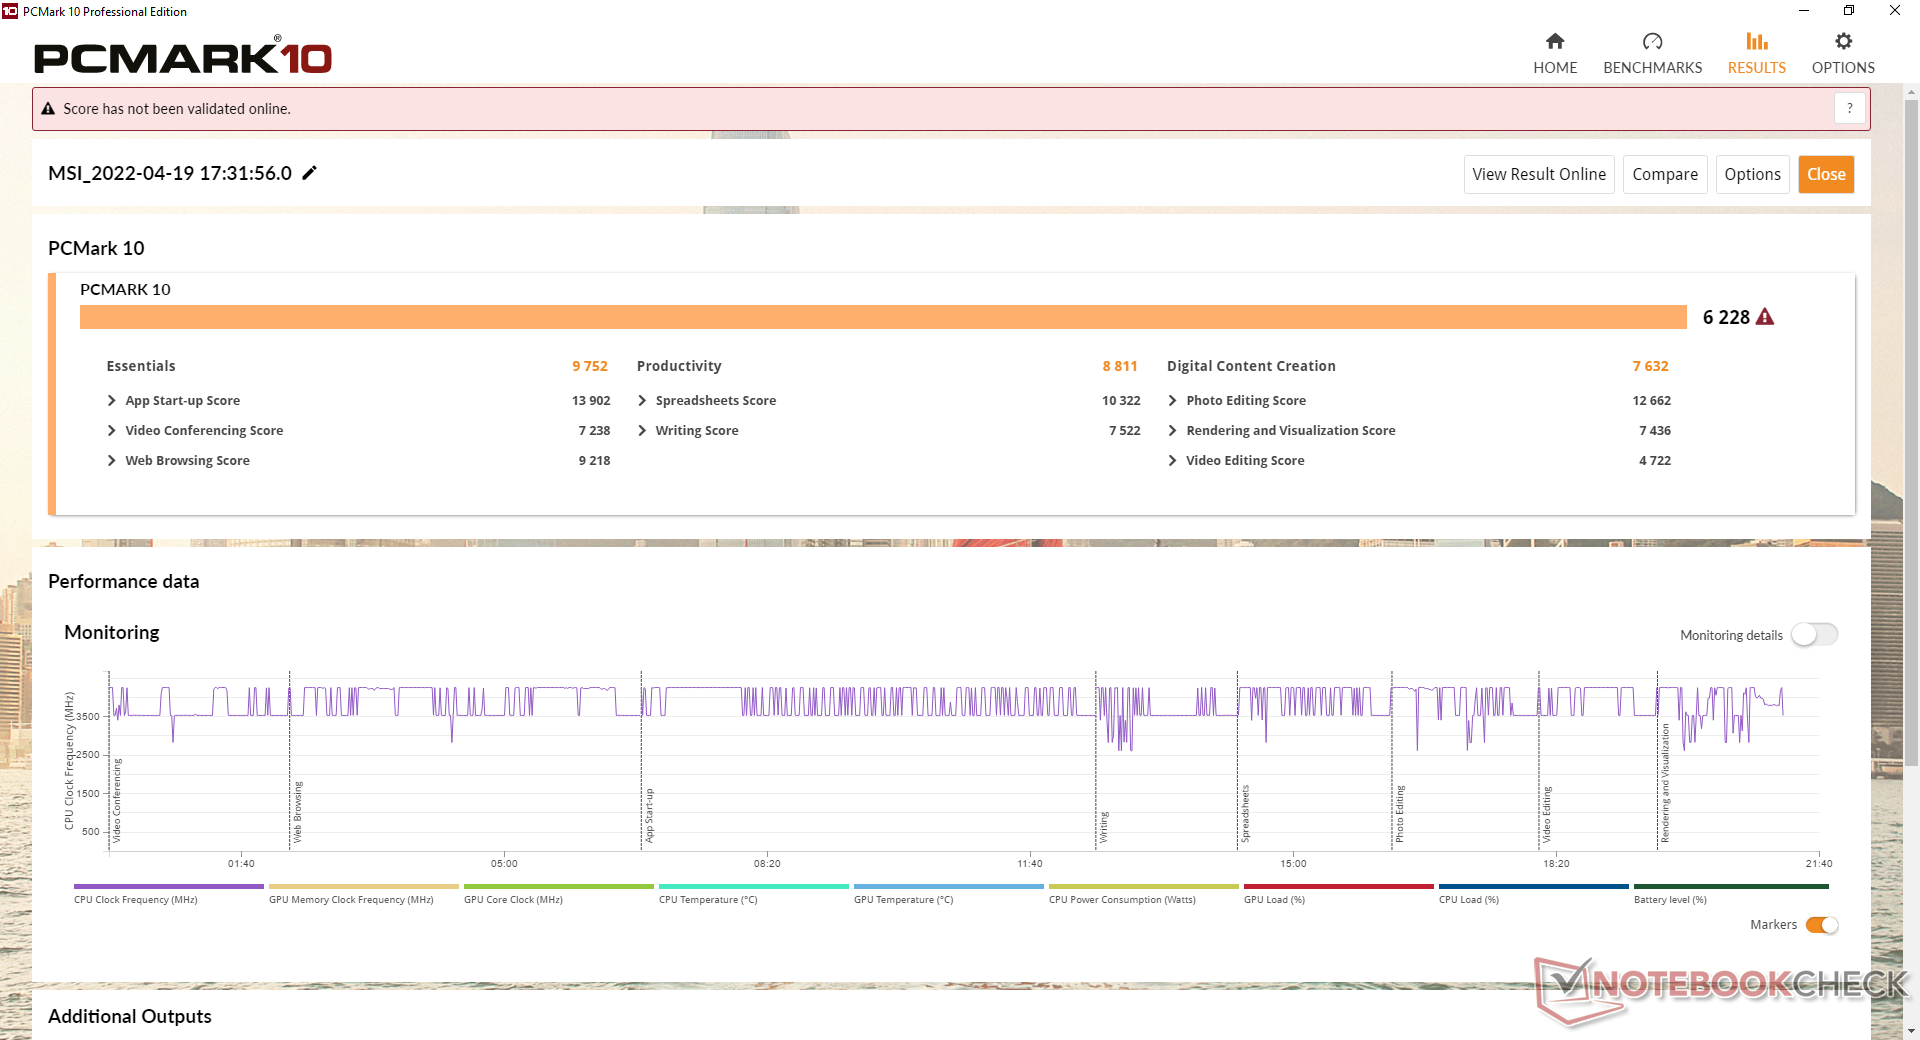
PCMark 10的得分与其他具有入门级GPU的游戏笔记本电脑相当,如戴尔G15 5515。结果比2020年的微星Bravo 15有进步,特别是在生产力子测试中。
CrossMark: Overall | Productivity | Creativity | Responsiveness
| PCMark 10 / Score | |
| Asus TUF Gaming F15 FX507ZM | |
| Acer Nitro 5 AN515-45-R1JH | |
| MSI Bravo 15 B5DD-010US | |
| Average AMD Ryzen 5 5600H, AMD Radeon RX 5500M (n=1) | |
| Dell G15 5515 | |
| Lenovo Ideapad Gaming 3 15IHU-82K1002RGE | |
| MSI Bravo 15 A4DCR | |
| PCMark 10 / Essentials | |
| Asus TUF Gaming F15 FX507ZM | |
| Acer Nitro 5 AN515-45-R1JH | |
| MSI Bravo 15 A4DCR | |
| MSI Bravo 15 B5DD-010US | |
| Average AMD Ryzen 5 5600H, AMD Radeon RX 5500M (n=1) | |
| Dell G15 5515 | |
| Lenovo Ideapad Gaming 3 15IHU-82K1002RGE | |
| PCMark 10 / Productivity | |
| Acer Nitro 5 AN515-45-R1JH | |
| Lenovo Ideapad Gaming 3 15IHU-82K1002RGE | |
| Asus TUF Gaming F15 FX507ZM | |
| MSI Bravo 15 B5DD-010US | |
| Average AMD Ryzen 5 5600H, AMD Radeon RX 5500M (n=1) | |
| Dell G15 5515 | |
| MSI Bravo 15 A4DCR | |
| PCMark 10 / Digital Content Creation | |
| Asus TUF Gaming F15 FX507ZM | |
| Acer Nitro 5 AN515-45-R1JH | |
| MSI Bravo 15 B5DD-010US | |
| Average AMD Ryzen 5 5600H, AMD Radeon RX 5500M (n=1) | |
| Dell G15 5515 | |
| MSI Bravo 15 A4DCR | |
| Lenovo Ideapad Gaming 3 15IHU-82K1002RGE | |
| CrossMark / Overall | |
| Lenovo Ideapad Gaming 3 15IHU-82K1002RGE | |
| CrossMark / Productivity | |
| Lenovo Ideapad Gaming 3 15IHU-82K1002RGE | |
| CrossMark / Creativity | |
| Lenovo Ideapad Gaming 3 15IHU-82K1002RGE | |
| CrossMark / Responsiveness | |
| Lenovo Ideapad Gaming 3 15IHU-82K1002RGE | |
| PCMark 10 Score | 6228 points | |
Help | ||
| AIDA64 / Memory Copy | |
| Asus TUF Gaming F15 FX507ZM | |
| MSI Bravo 15 B5DD-010US | |
| Dell G15 5515 | |
| Acer Nitro 5 AN515-45-R1JH | |
| Average AMD Ryzen 5 5600H (20549 - 42141, n=14) | |
| MSI Bravo 15 A4DCR | |
| Lenovo Ideapad Gaming 3 15IHU-82K1002RGE | |
| AIDA64 / Memory Read | |
| Asus TUF Gaming F15 FX507ZM | |
| MSI Bravo 15 B5DD-010US | |
| Dell G15 5515 | |
| Acer Nitro 5 AN515-45-R1JH | |
| Average AMD Ryzen 5 5600H (22917 - 47595, n=14) | |
| MSI Bravo 15 A4DCR | |
| Lenovo Ideapad Gaming 3 15IHU-82K1002RGE | |
| AIDA64 / Memory Write | |
| Asus TUF Gaming F15 FX507ZM | |
| MSI Bravo 15 A4DCR | |
| MSI Bravo 15 B5DD-010US | |
| Average AMD Ryzen 5 5600H (20226 - 44872, n=14) | |
| Dell G15 5515 | |
| Acer Nitro 5 AN515-45-R1JH | |
| Lenovo Ideapad Gaming 3 15IHU-82K1002RGE | |
| AIDA64 / Memory Latency | |
| MSI Bravo 15 A4DCR | |
| Lenovo Ideapad Gaming 3 15IHU-82K1002RGE | |
| Average AMD Ryzen 5 5600H (75 - 89.1, n=14) | |
| Dell G15 5515 | |
| MSI Bravo 15 B5DD-010US | |
| Acer Nitro 5 AN515-45-R1JH | |
| Asus TUF Gaming F15 FX507ZM | |
* ... smaller is better
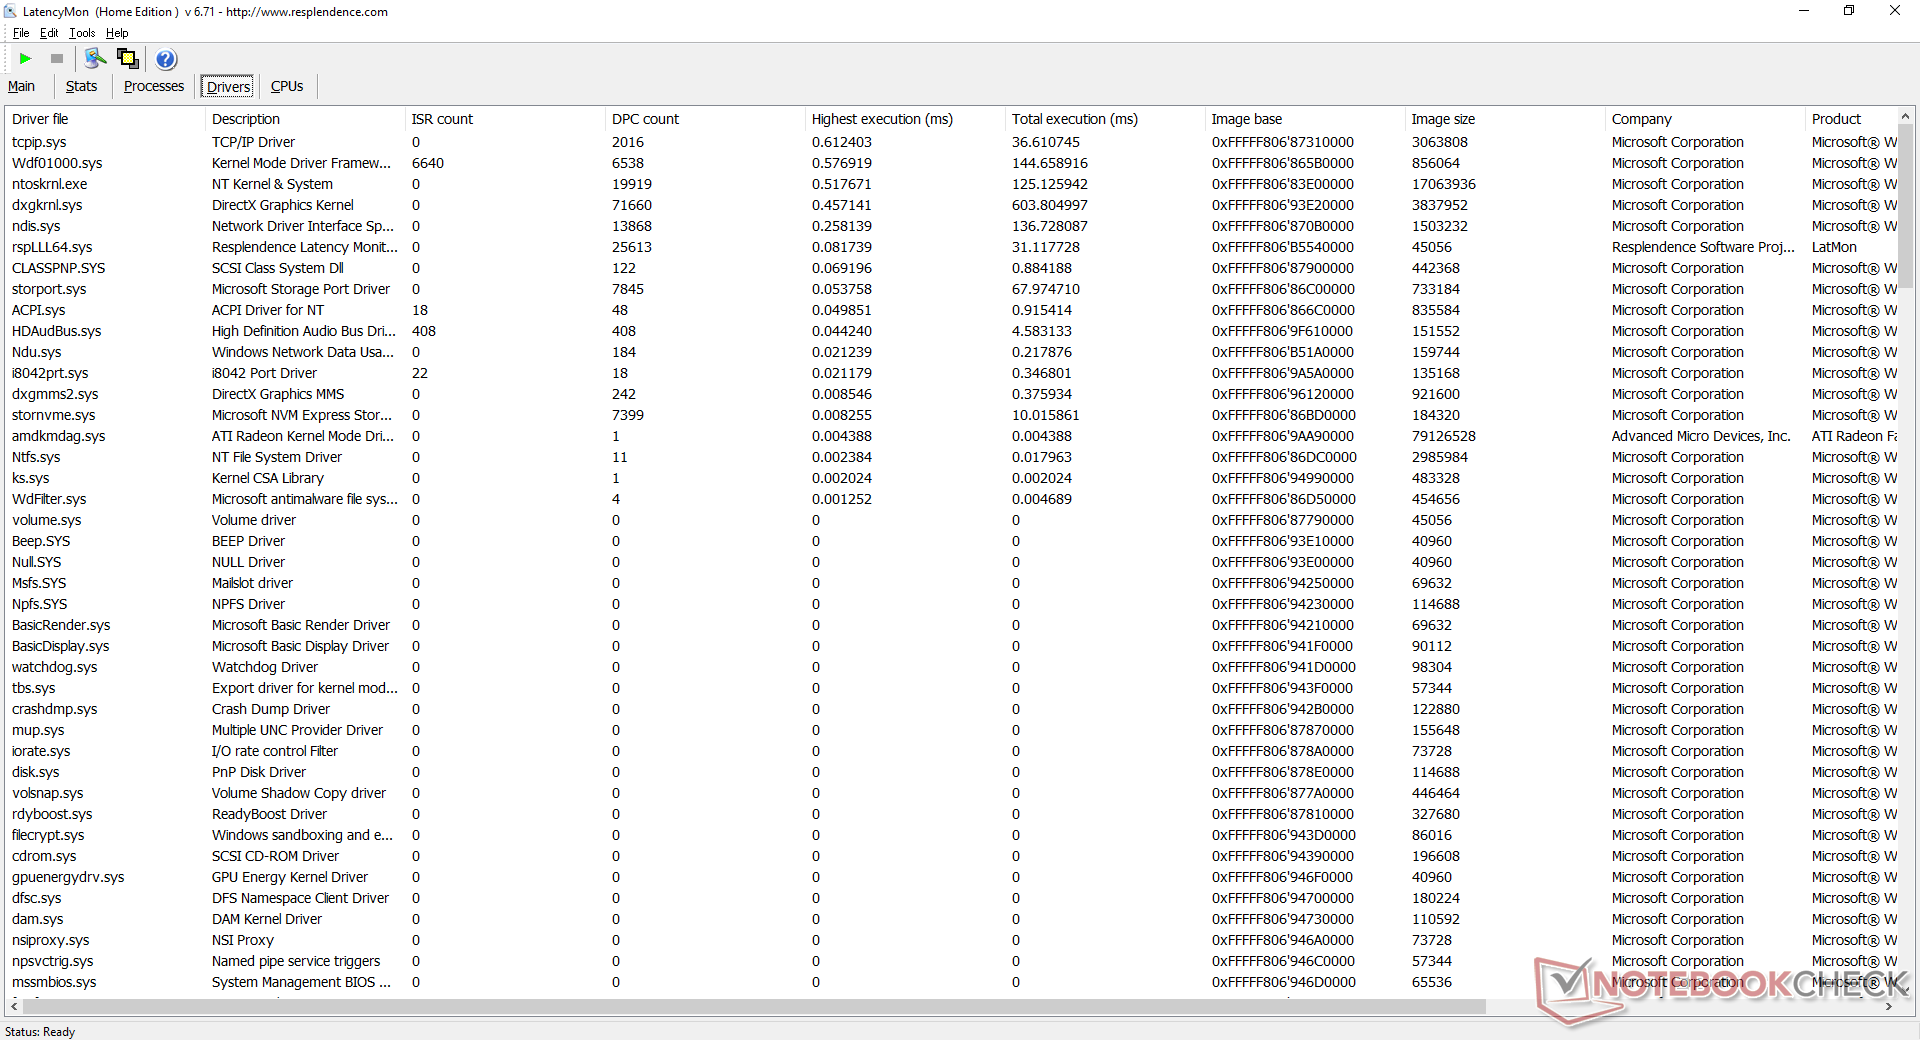
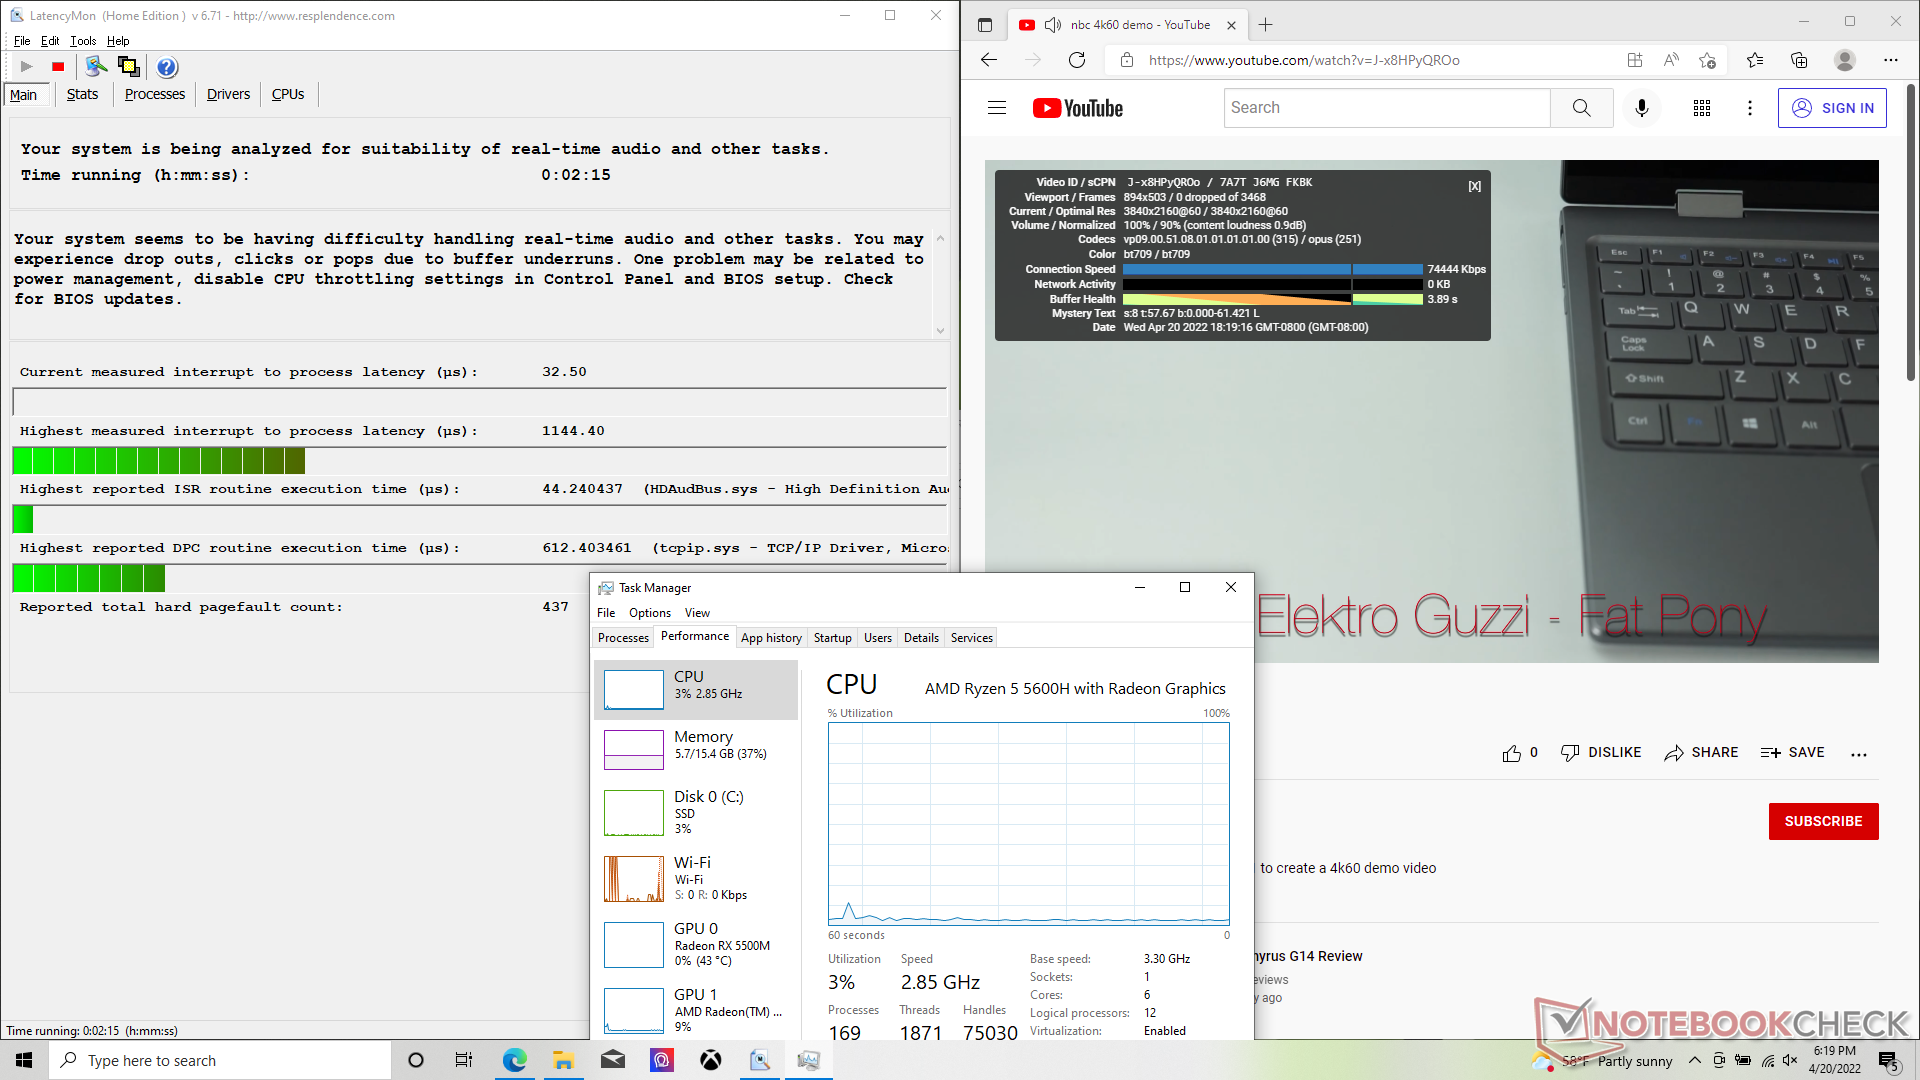
DPC延时
在我们的标准化延迟监测测试中注意监测。遵循基准页条目中的准则 - 观察到的所有好的或高的延迟? 可能是实时音频和视频编辑的问题(对于被测试的软件/硬件配置)。
在中心下方添加两张截图(latencymon主屏幕和驱动标签)。
| DPC Latencies / LatencyMon - interrupt to process latency (max), Web, Youtube, Prime95 | |
| MSI Bravo 15 A4DCR | |
| MSI Bravo 15 B5DD-010US | |
| Lenovo Ideapad Gaming 3 15IHU-82K1002RGE | |
| Asus TUF Gaming F15 FX507ZM | |
| Dell G15 5515 | |
| Acer Nitro 5 AN515-45-R1JH | |
* ... smaller is better
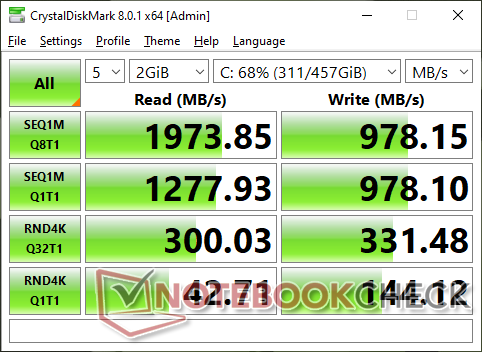
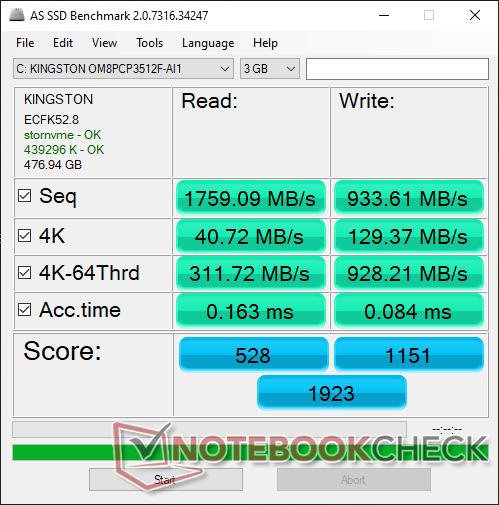
存储设备--最多只有一个驱动器
我们的设备配置了预算的512GB金士顿OM8PCP3512F PCIe3 NVMe固态硬盘,提供高达2000MB/s的传输率。虽然写入速度只有一半左右,但它们还是反映了预算价位的特点。

| Drive Performance rating - Percent | |
| Asus TUF Gaming F15 FX507ZM | |
| MSI Bravo 15 A4DCR | |
| Dell G15 5515 | |
| Lenovo Ideapad Gaming 3 15IHU-82K1002RGE | |
| Acer Nitro 5 AN515-45-R1JH -1! | |
| MSI Bravo 15 B5DD-010US | |
* ... smaller is better
Disk Throttling: DiskSpd Read Loop, Queue Depth 8
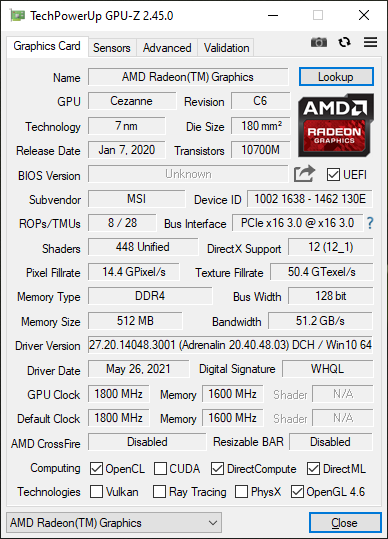
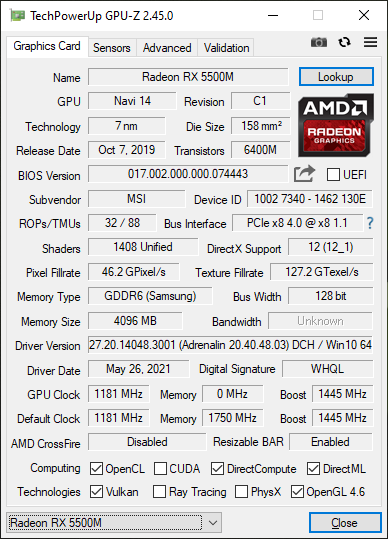
GPU性能--旧一代Radeon
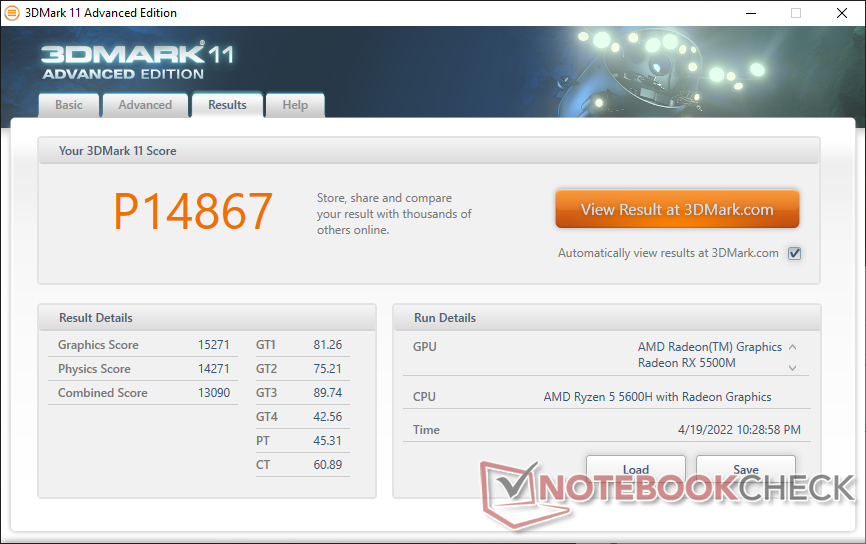
图形性能在老式移动GeForce GTX 1060的几个百分点之内。升级到一个入门级的Nvidia替代品,如移动GTX 1660 Ti或移动RTX 3050 Ti,可以将帧率提高40%至60%。值得庆幸的是,内部显示器支持FreeSync,这对性能较低的GPU(如我们的Radeon RX 5500M)有极大的帮助。
截至目前,微星没有提供Radeon RX 5600M选项,这将使图形性能比我们的RX 5500M提高约40%。
| 3DMark 11 - 1280x720 Performance GPU | |
| MSI GP66 Leopard 11UH-028 | |
| Eurocom RX315 NH57AF1 | |
| Asus TUF Gaming F15 FX507ZM | |
| MSI Alpha 15 B5EEK-008 | |
| MSI RTX 2060 Gaming Z 6G | |
| Gateway Creator Series 15.6 GWTN156-3BK | |
| MSI Alpha 17 A4DEK | |
| Asus ROG Zephyrus M15 GU502LU-BI7N4 | |
| Lenovo Ideapad Gaming 3 15IHU-82K1002RGE | |
| Average AMD Radeon RX 5500M (15271 - 17668, n=8) | |
| MSI Alpha 15 A3DDK-034 | |
| MSI Bravo 15 B5DD-010US | |
| MSI Bravo 15 A4DCR | |
| Asus Zephyrus S GX531GM | |
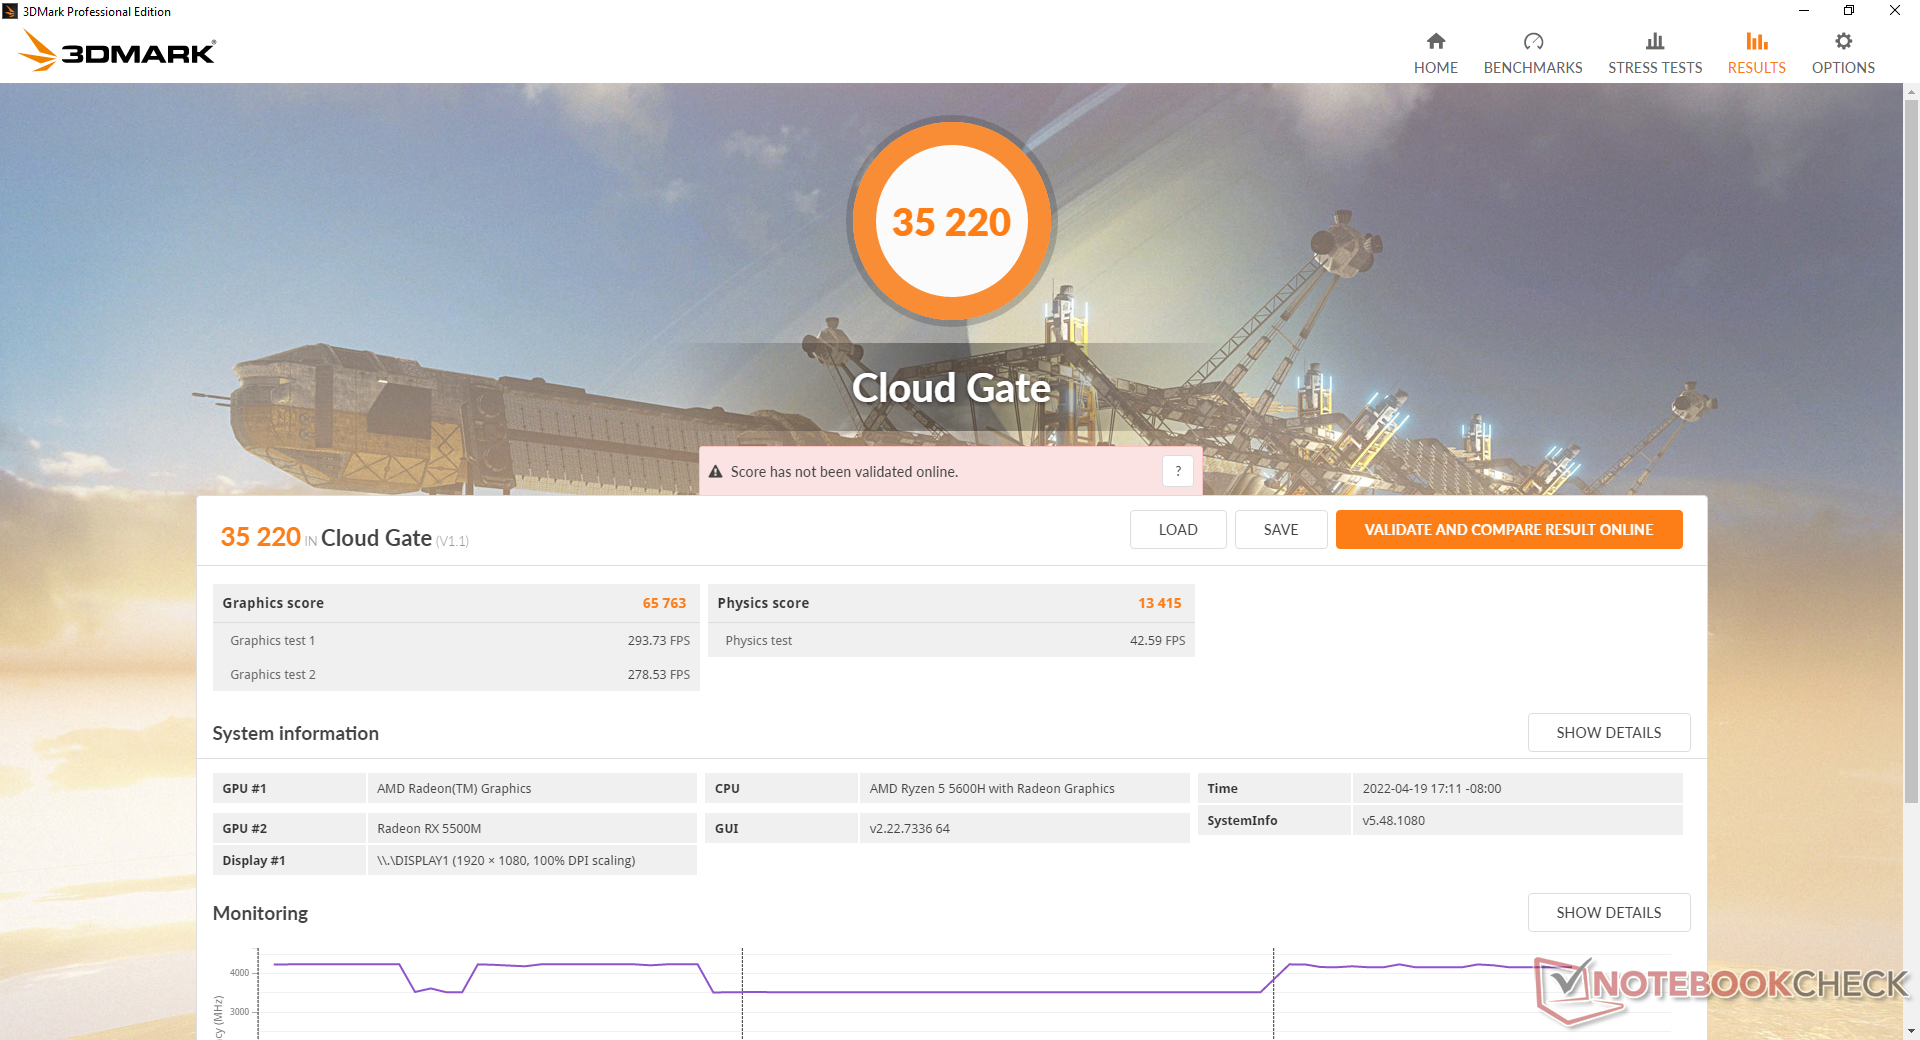
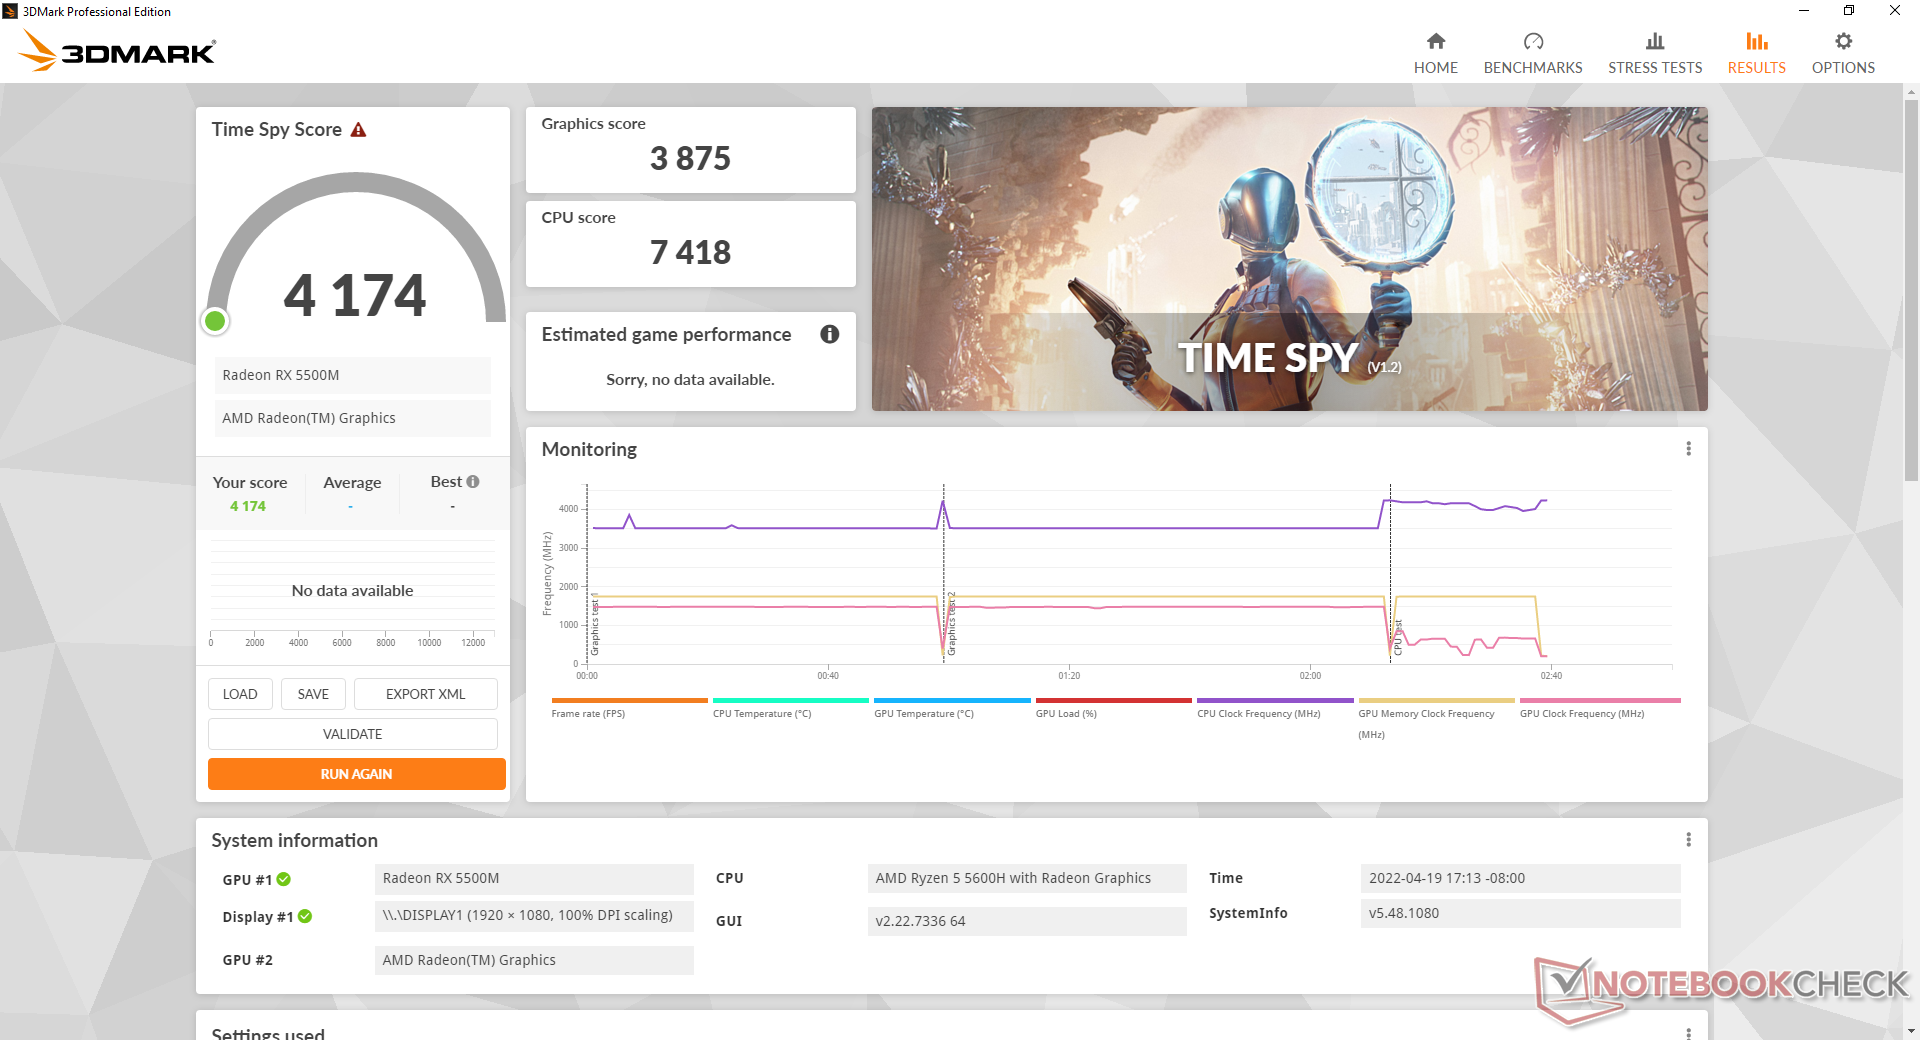
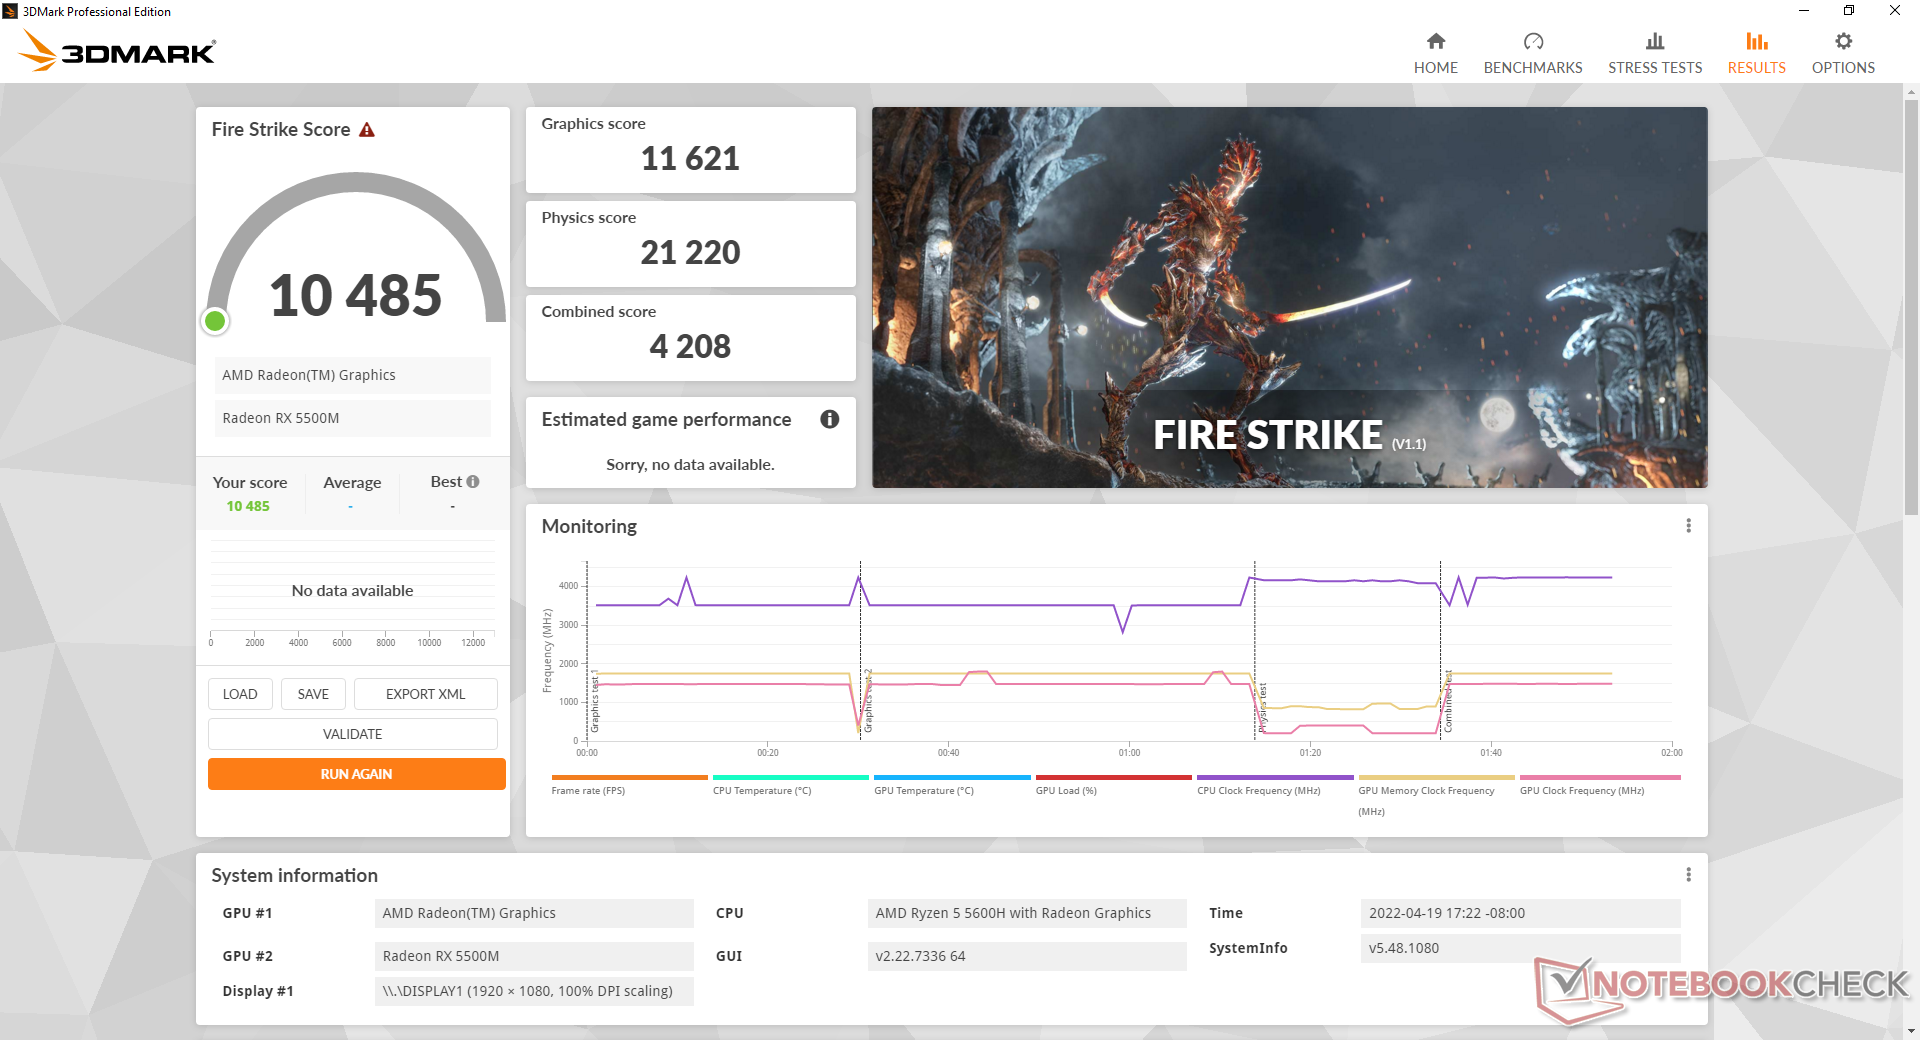
| 3DMark 11 Performance | 14867 points | |
| 3DMark Cloud Gate Standard Score | 35220 points | |
| 3DMark Fire Strike Score | 10485 points | |
| 3DMark Time Spy Score | 4174 points | |
Help | ||
| Cyberpunk 2077 1.6 | |
| 1920x1080 Low Preset | |
| Lenovo Ideapad Gaming 3 15IHU-82K1002RGE | |
| Average AMD Radeon RX 5500M (53.2 - 55.9, n=2) | |
| MSI Bravo 15 B5DD-010US | |
| 1920x1080 Medium Preset | |
| Lenovo Ideapad Gaming 3 15IHU-82K1002RGE | |
| Average AMD Radeon RX 5500M (41.5 - 44.9, n=2) | |
| MSI Bravo 15 B5DD-010US | |
| 1920x1080 High Preset | |
| Lenovo Ideapad Gaming 3 15IHU-82K1002RGE | |
| Average AMD Radeon RX 5500M (31.2 - 34.4, n=2) | |
| MSI Bravo 15 B5DD-010US | |
| 1920x1080 Ultra Preset | |
| Lenovo Ideapad Gaming 3 15IHU-82K1002RGE | |
| MSI Bravo 15 B5DD-010US | |
| Average AMD Radeon RX 5500M (27.7 - 31.3, n=2) | |
Witcher 3 FPS Chart
| low | med. | high | ultra | |
|---|---|---|---|---|
| GTA V (2015) | 173.8 | 106.6 | 54.1 | |
| The Witcher 3 (2015) | 221.1 | 72.5 | 45.5 | |
| Dota 2 Reborn (2015) | 156.4 | 141.7 | 128.4 | 119.8 |
| Final Fantasy XV Benchmark (2018) | 113.2 | 58.6 | 39.2 | |
| X-Plane 11.11 (2018) | 55.4 | 41.9 | 36.5 | |
| Strange Brigade (2018) | 237 | 100.9 | 81.5 | 71.8 |
| Cyberpunk 2077 1.6 (2022) | 53.2 | 41.5 | 31.2 | 31.3 |
排放--在正确设置下的安静
系统噪音
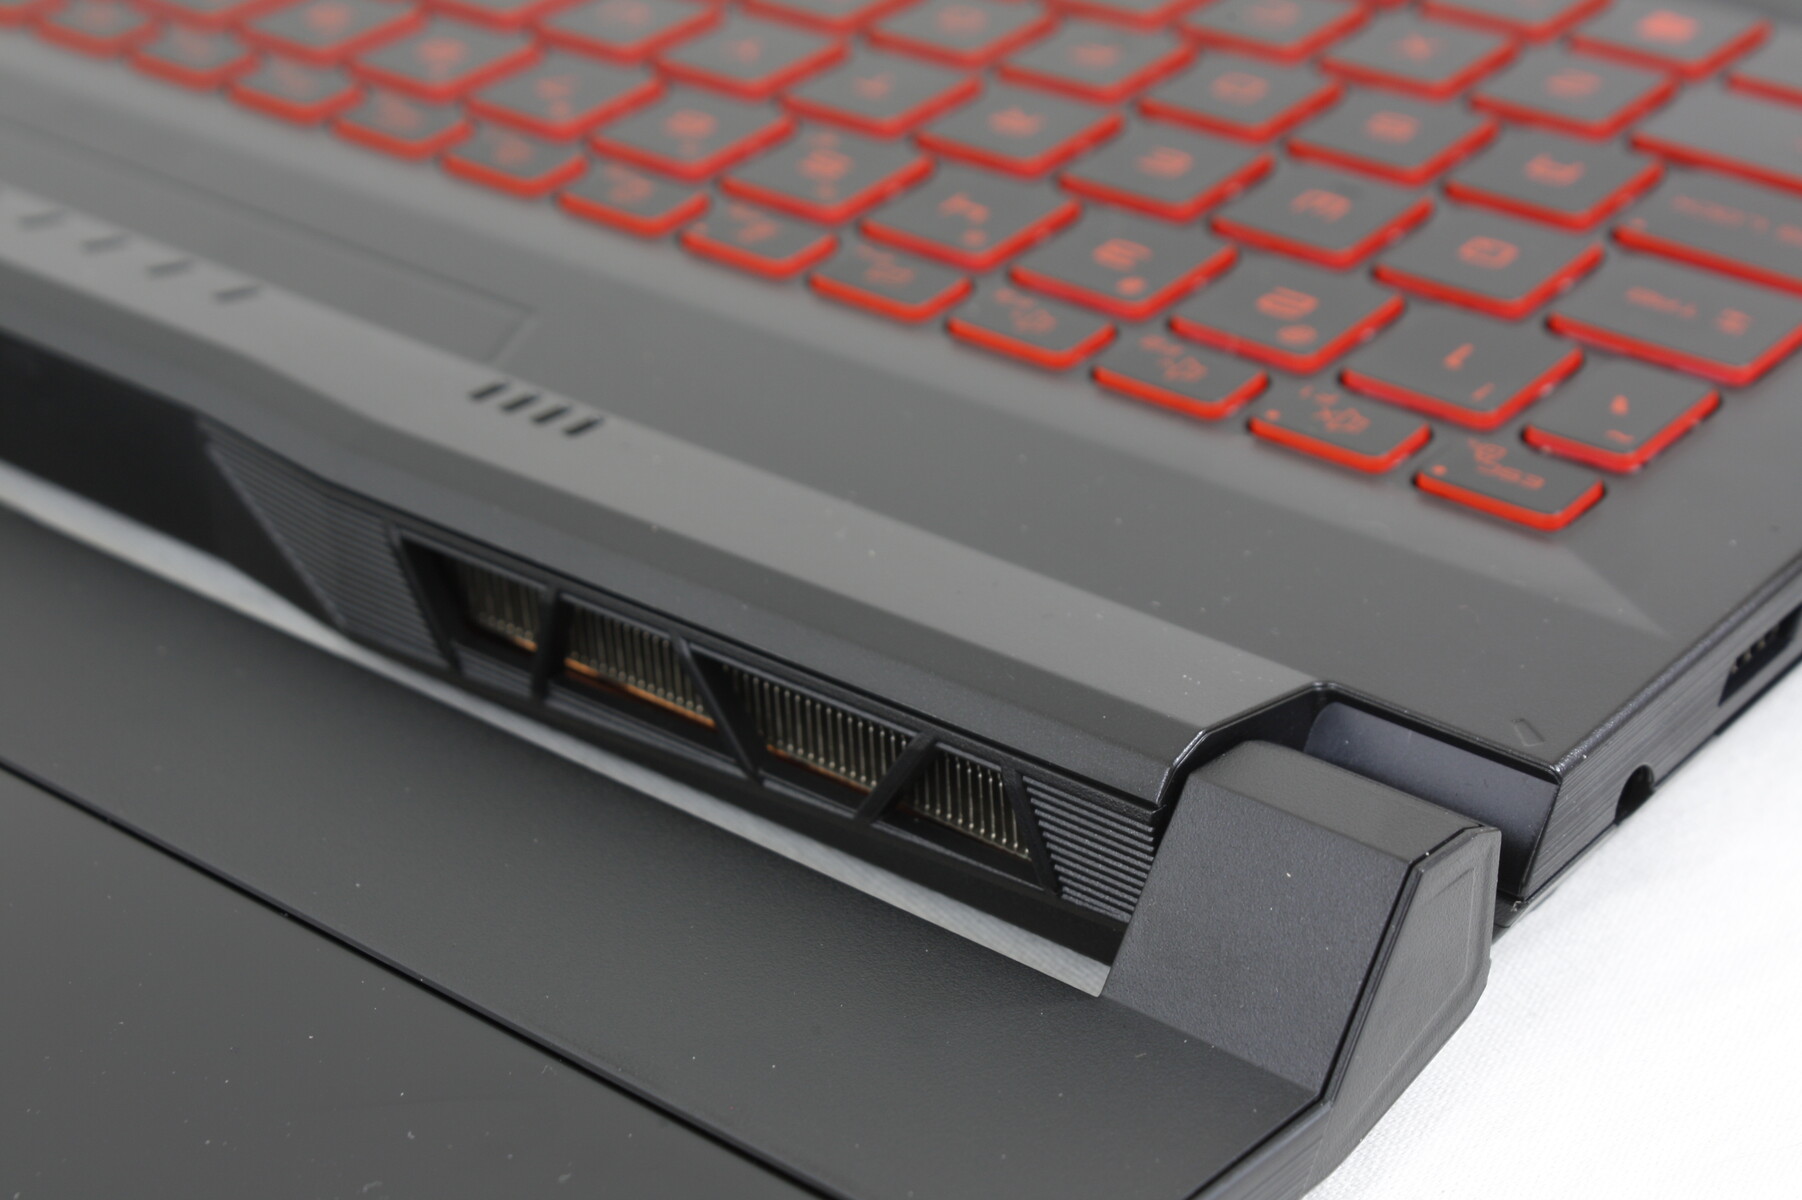
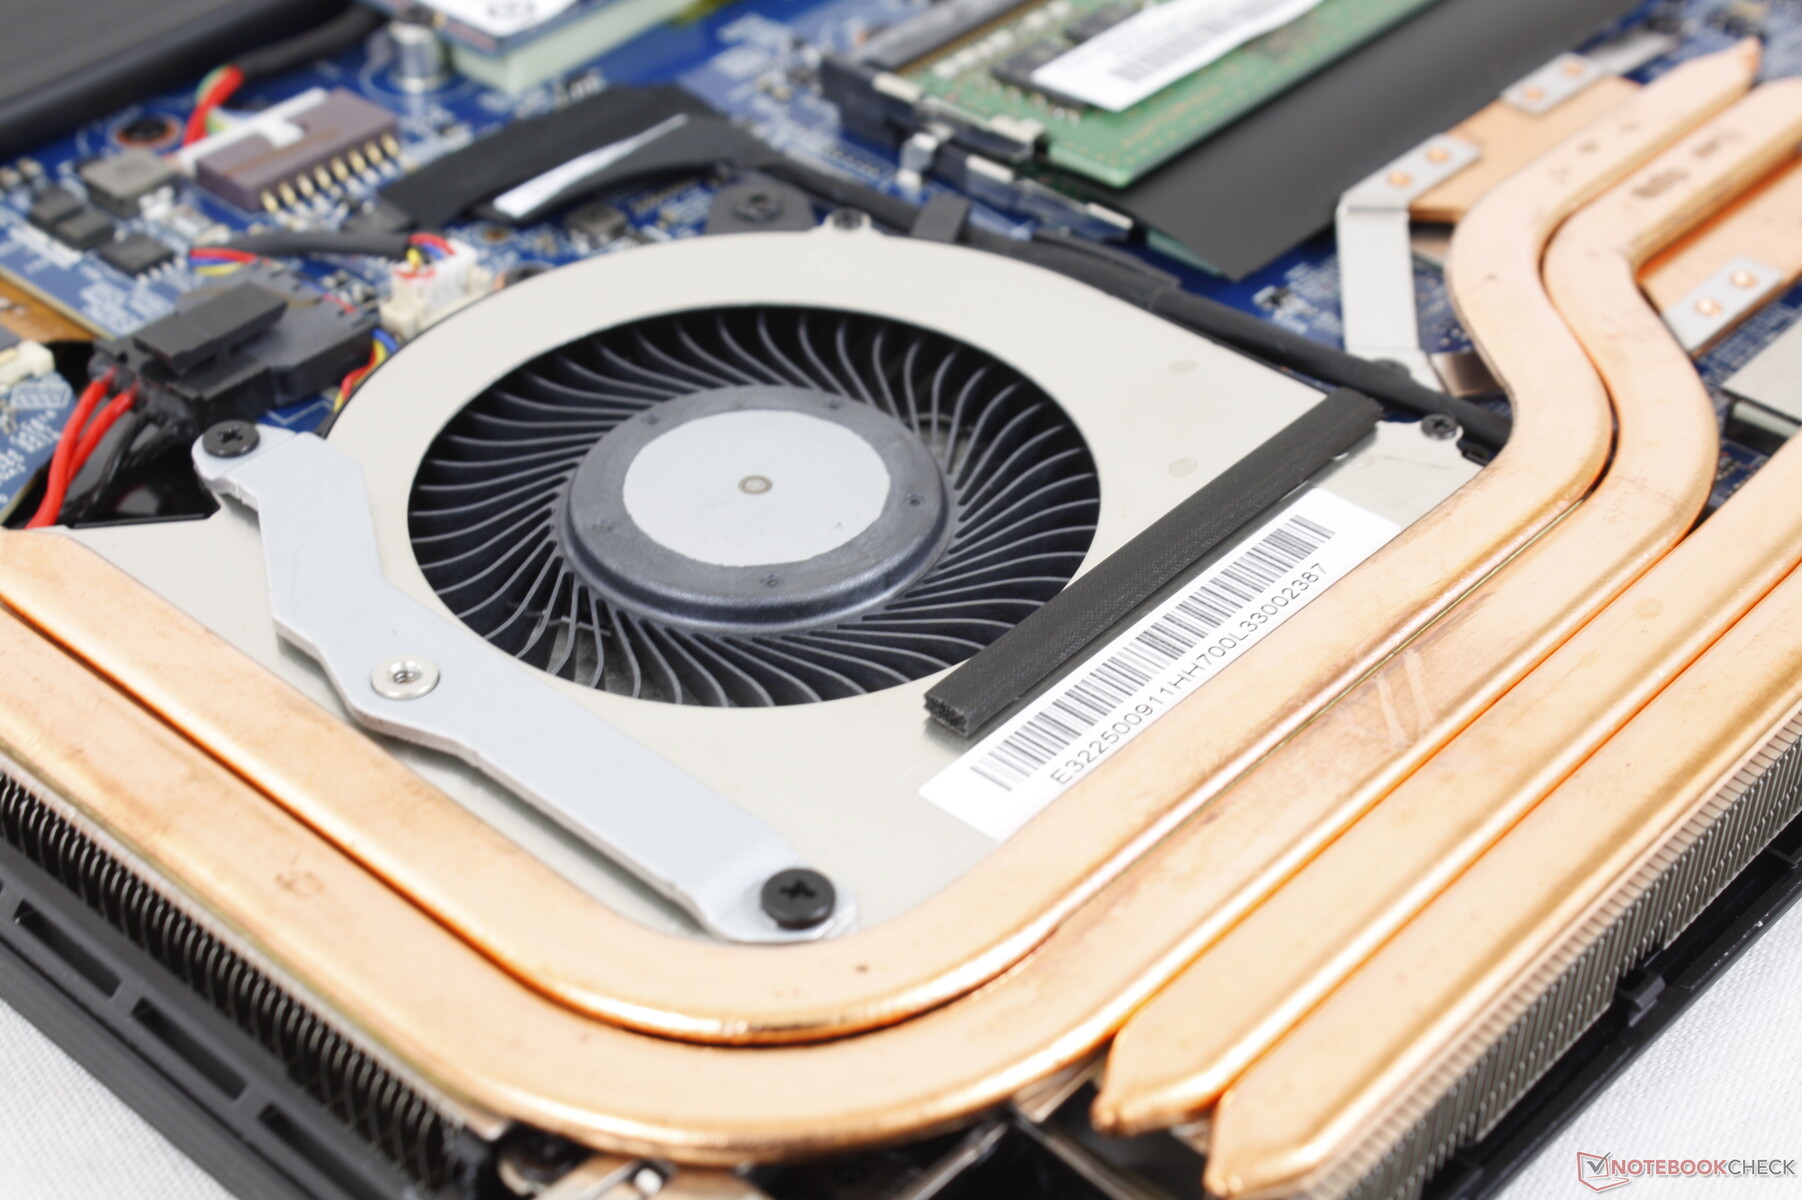
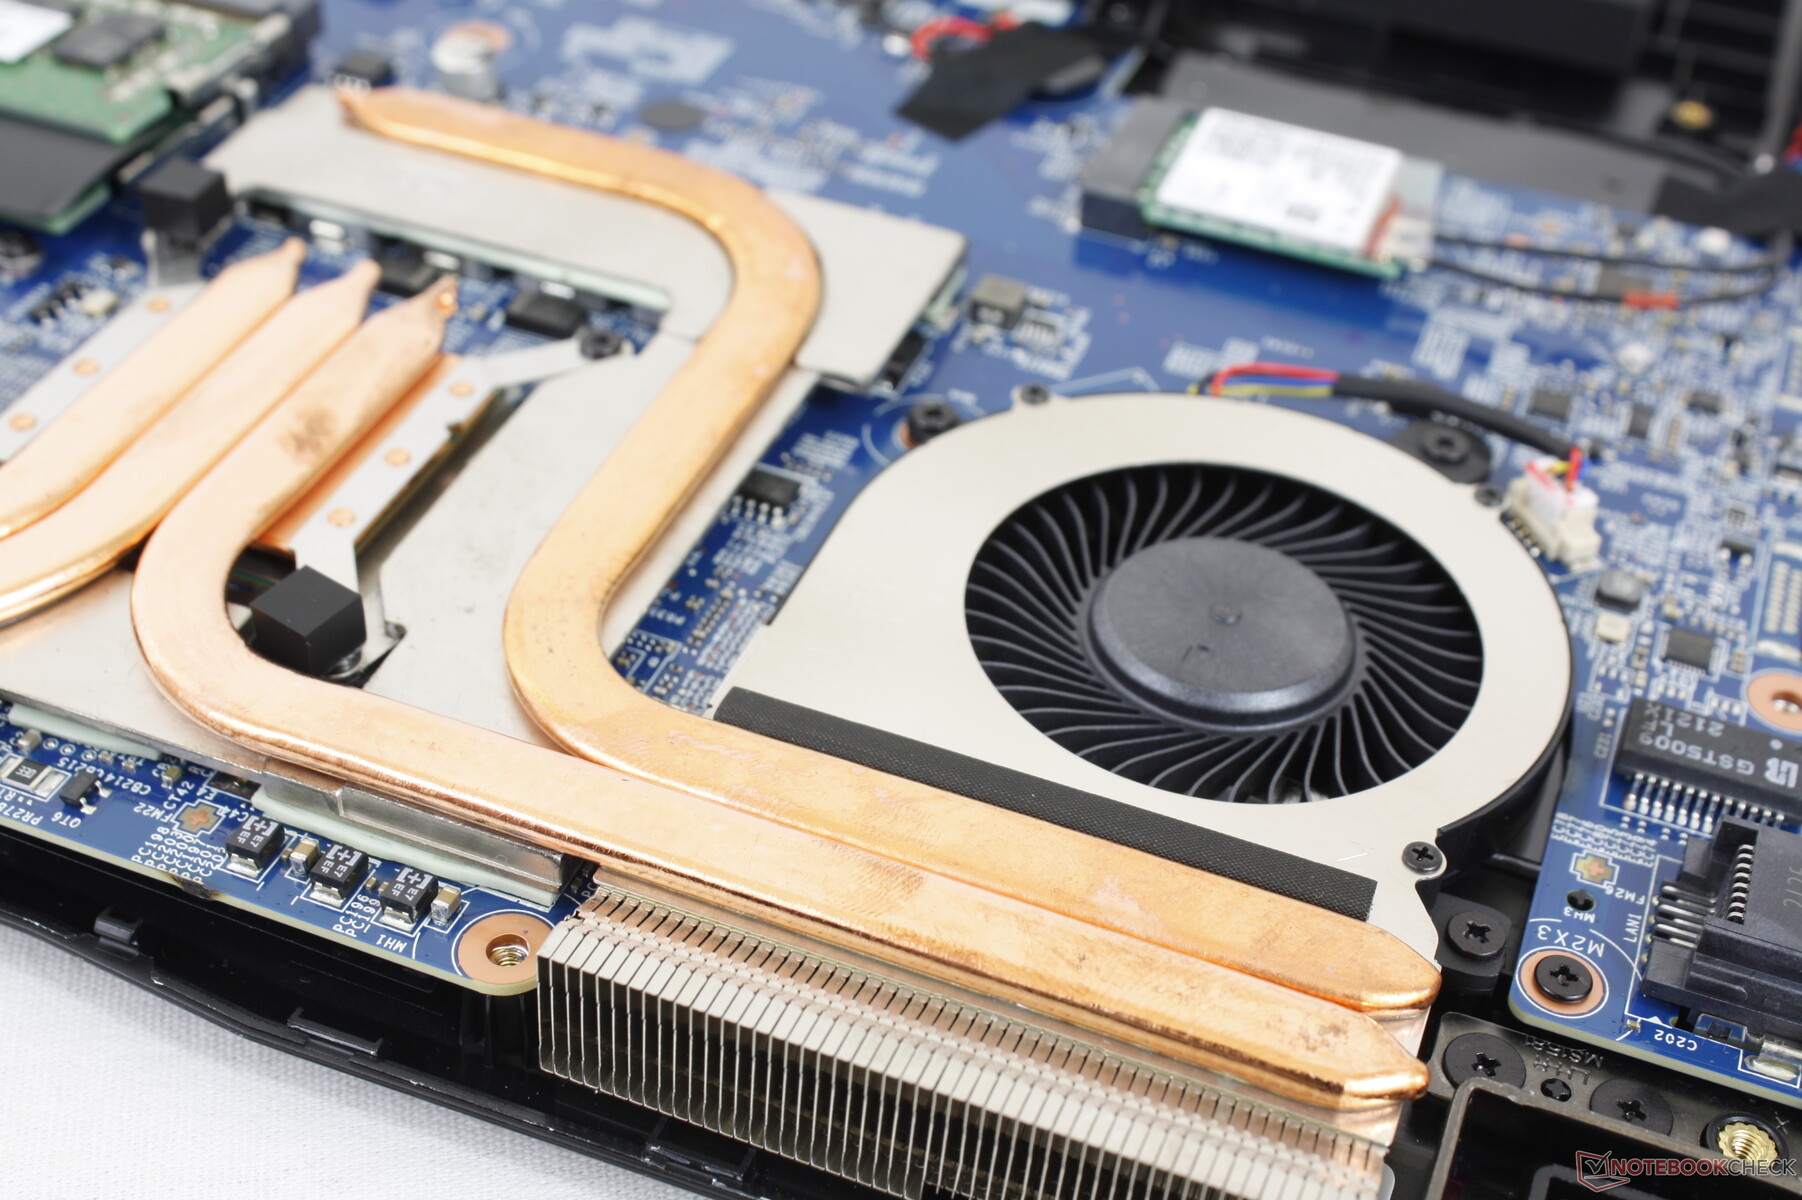
冷却解决方案包括两个不对称的风扇和六个铜质热管,其排列方式与老款2020 Bravo 15不同。风扇噪音在很大程度上取决于微星中心电源配置文件。超级电池,静音,平衡,极限性能和冷却器提升。如果设置为静音或更低,风扇仍然非常安静,在典型的办公室环境中几乎听不到。然而,如果设置为平衡或极限性能,即使在浏览或视频流等低负载情况下,风扇也会在32.8分贝(A)左右徘徊,而静音背景为24.5分贝(A)。因此,对于对噪音敏感的环境,静音模式是值得考虑的。
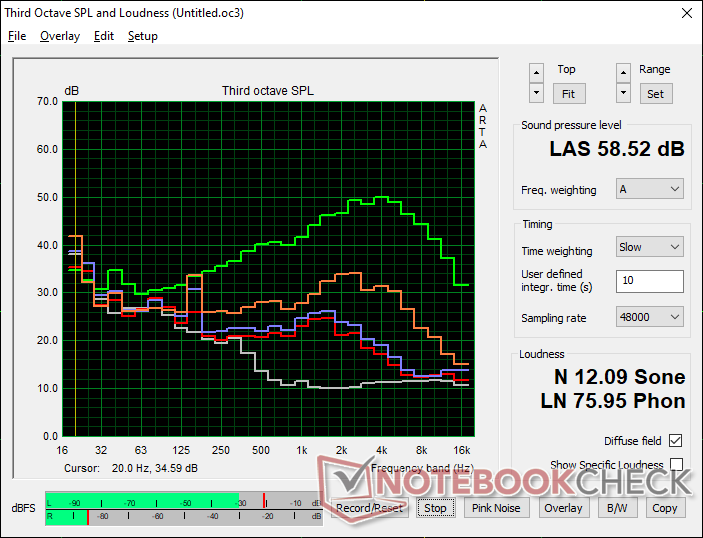
在极限性能模式下进行游戏时,风扇趋于稳定在42.5 dB(A),不频繁的脉冲最高可达49.4 dB(A)。然而,40分贝(A)的低范围比许多更快的游戏笔记本电脑,如华硕TUF游戏F15 FX507或宏碁Nitro 5 AN515更安静。启用Cooler Boost模式将把风扇噪音提高到平坦的58.5 dB(A),而不考虑活动情况。
Noise level
| Idle |
| 24.5 / 32.8 / 32.8 dB(A) |
| Load |
| 34.5 / 58.5 dB(A) |
 | ||
30 dB silent 40 dB(A) audible 50 dB(A) loud |
||
min: | ||
| MSI Bravo 15 B5DD-010US Radeon RX 5500M, R5 5600H, Kingston OM8PCP3512F-AB | MSI Bravo 15 A4DCR Radeon RX 5300M, R7 4800H, Samsung PM981a MZVLB1T0HBLR | Asus TUF Gaming F15 FX507ZM GeForce RTX 3060 Laptop GPU, i7-12700H, SK Hynix HFM001TD3JX013N | Dell G15 5515 GeForce RTX 3050 Ti Laptop GPU, R7 5800H, Samsung PM991a MZ9LQ512HBLU-00BD1 | Lenovo Ideapad Gaming 3 15IHU-82K1002RGE GeForce RTX 3050 Ti Laptop GPU, i5-11300H, Micron 2210 MTFDHBA512QFD | Acer Nitro 5 AN515-45-R1JH GeForce RTX 3070 Laptop GPU, R7 5800H, WDC PC SN530 SDBPNPZ-1T00 | |
|---|---|---|---|---|---|---|
| Noise | -16% | 4% | 2% | 3% | 1% | |
| off / environment * (dB) | 24.5 | 30 -22% | 23.2 5% | 24 2% | 23.9 2% | 25 -2% |
| Idle Minimum * (dB) | 24.5 | 31 -27% | 23.6 4% | 25 -2% | 23.9 2% | 25 -2% |
| Idle Average * (dB) | 32.8 | 32 2% | 23.6 28% | 26 21% | 26.8 18% | 25 24% |
| Idle Maximum * (dB) | 32.8 | 40 -22% | 25.4 23% | 30 9% | 26.8 18% | 32.2 2% |
| Load Average * (dB) | 34.5 | 48 -39% | 38 -10% | 44 -28% | 43.5 -26% | 45.8 -33% |
| Witcher 3 ultra * (dB) | 42.5 | 48 -13% | 54.1 -27% | 44 -4% | 43.5 -2% | |
| Load Maximum * (dB) | 58.5 | 54 8% | 57.2 2% | 48 18% | 53.1 9% | 49.1 16% |
* ... smaller is better
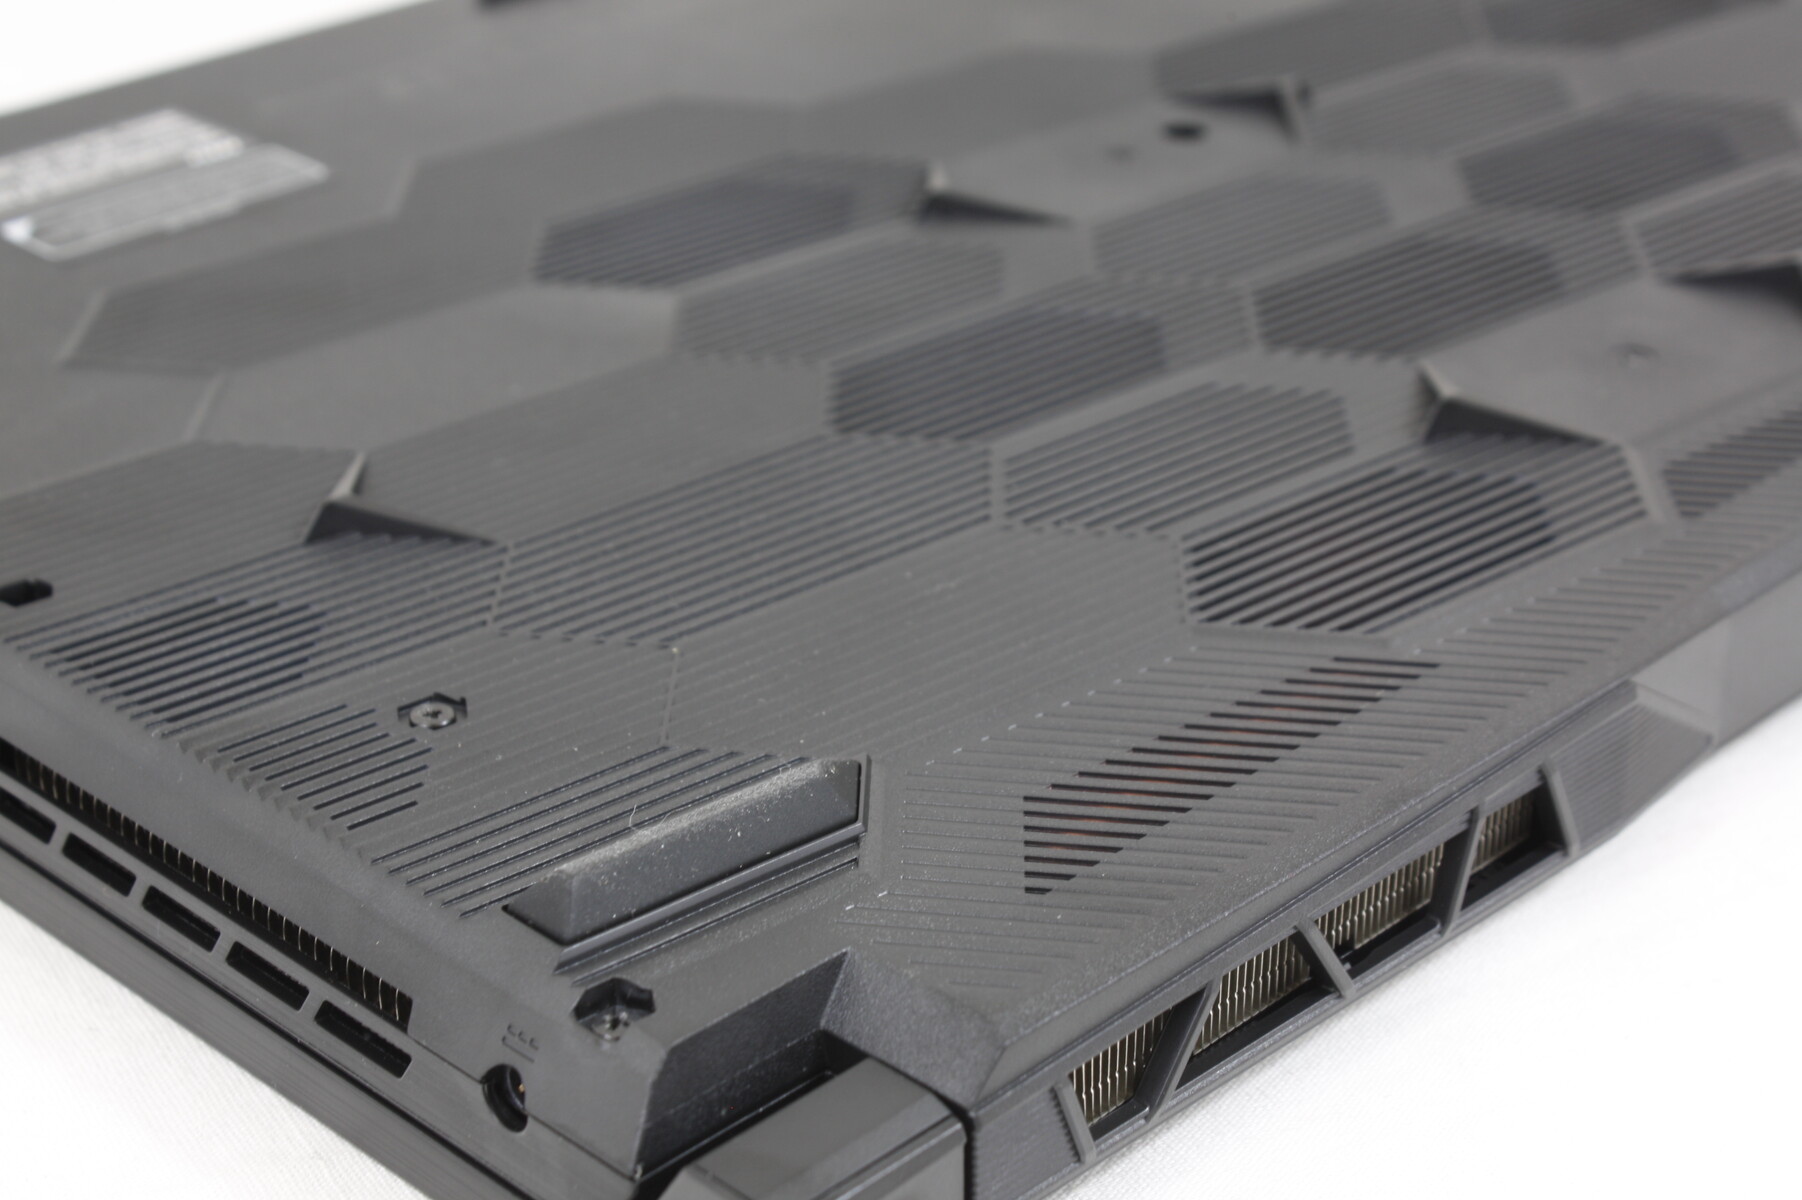
温度
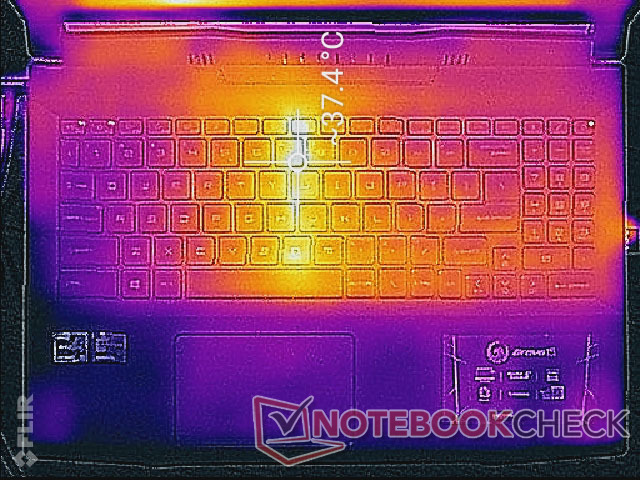
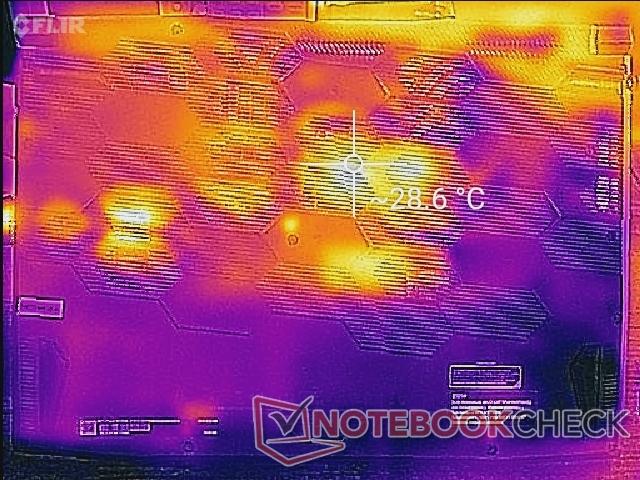
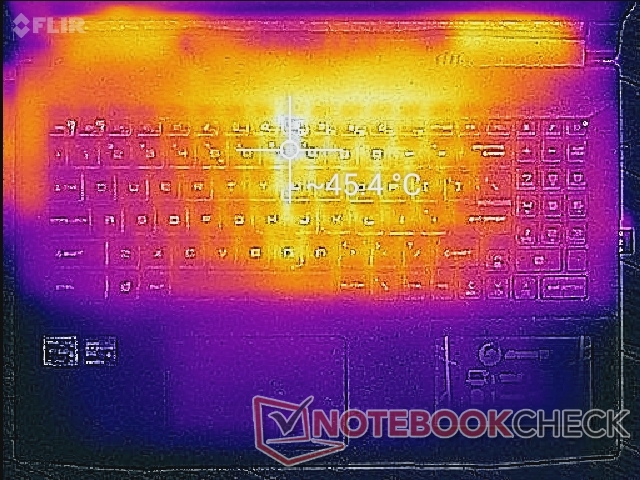
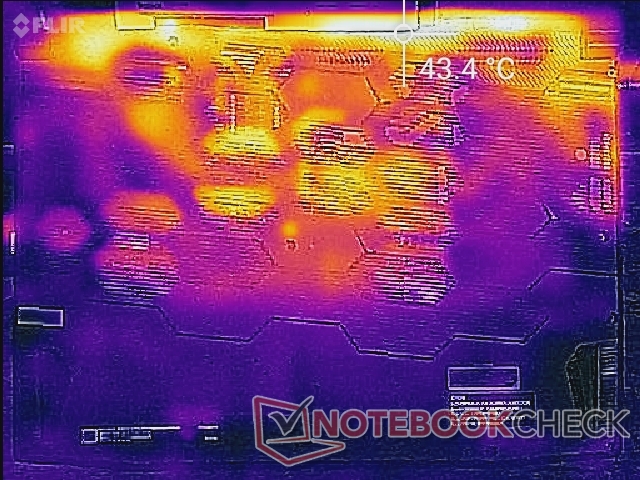
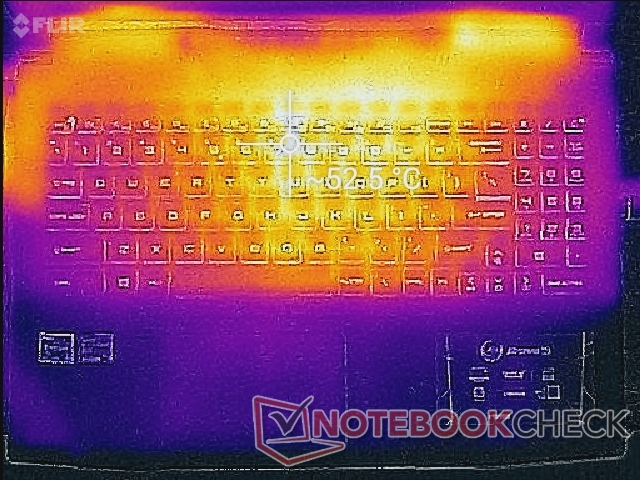
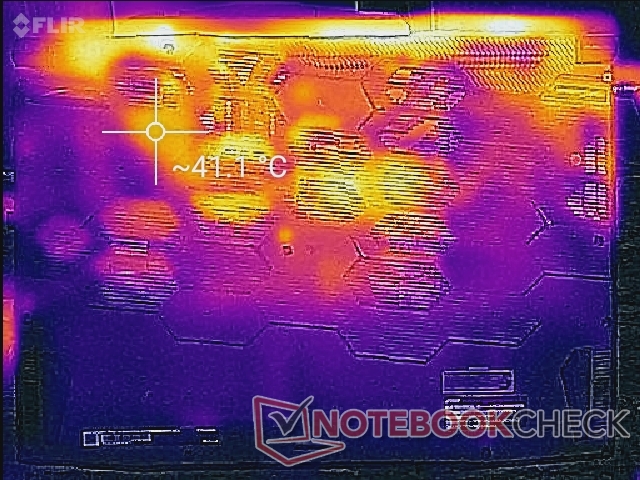
即使在重负荷下,大部分塑料底盘仍然保持相对凉爽的触感,因为这不是一个超薄的金属设计。例如,在游戏时,掌托、WASD键和数字键盘区域的温度只有30℃左右。热点在离键盘中心和后部边缘最近的地方,在使用过程中皮肤不太可能长时间接触这些地方。平均温度比我们在2020 Bravo 15上观察到的要低,特别是在WASD键周围。
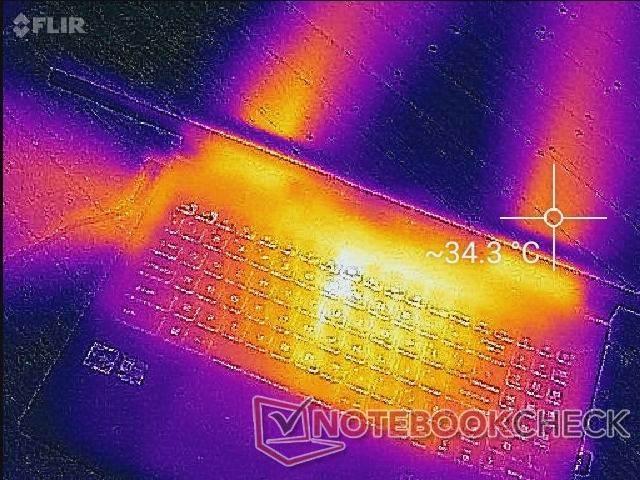
(-) The maximum temperature on the upper side is 52.2 °C / 126 F, compared to the average of 40.4 °C / 105 F, ranging from 21.2 to 68.8 °C for the class Gaming.
(-) The bottom heats up to a maximum of 48.6 °C / 119 F, compared to the average of 43.2 °C / 110 F
(+) In idle usage, the average temperature for the upper side is 30 °C / 86 F, compared to the device average of 33.9 °C / 93 F.
(+) Playing The Witcher 3, the average temperature for the upper side is 31.9 °C / 89 F, compared to the device average of 33.9 °C / 93 F.
(+) The palmrests and touchpad are cooler than skin temperature with a maximum of 27.6 °C / 81.7 F and are therefore cool to the touch.
(±) The average temperature of the palmrest area of similar devices was 28.8 °C / 83.8 F (+1.2 °C / 2.1 F).
| MSI Bravo 15 B5DD-010US AMD Ryzen 5 5600H, AMD Radeon RX 5500M | MSI Bravo 15 A4DCR AMD Ryzen 7 4800H, AMD Radeon RX 5300M | Asus TUF Gaming F15 FX507ZM Intel Core i7-12700H, NVIDIA GeForce RTX 3060 Laptop GPU | Dell G15 5515 AMD Ryzen 7 5800H, NVIDIA GeForce RTX 3050 Ti Laptop GPU | Lenovo Ideapad Gaming 3 15IHU-82K1002RGE Intel Core i5-11300H, NVIDIA GeForce RTX 3050 Ti Laptop GPU | Acer Nitro 5 AN515-45-R1JH AMD Ryzen 7 5800H, NVIDIA GeForce RTX 3070 Laptop GPU | |
|---|---|---|---|---|---|---|
| Heat | 3% | -6% | 11% | 14% | -3% | |
| Maximum Upper Side * (°C) | 52.2 | 51 2% | 44.4 15% | 50 4% | 43.2 17% | 53.2 -2% |
| Maximum Bottom * (°C) | 48.6 | 50 -3% | 48.8 -0% | 49 -1% | 47.9 1% | 58.2 -20% |
| Idle Upper Side * (°C) | 38 | 30 21% | 37.8 1% | 26 32% | 24.9 34% | 29.5 22% |
| Idle Bottom * (°C) | 28.4 | 31 -9% | 39.6 -39% | 26 8% | 27 5% | 31.2 -10% |
* ... smaller is better
压力测试
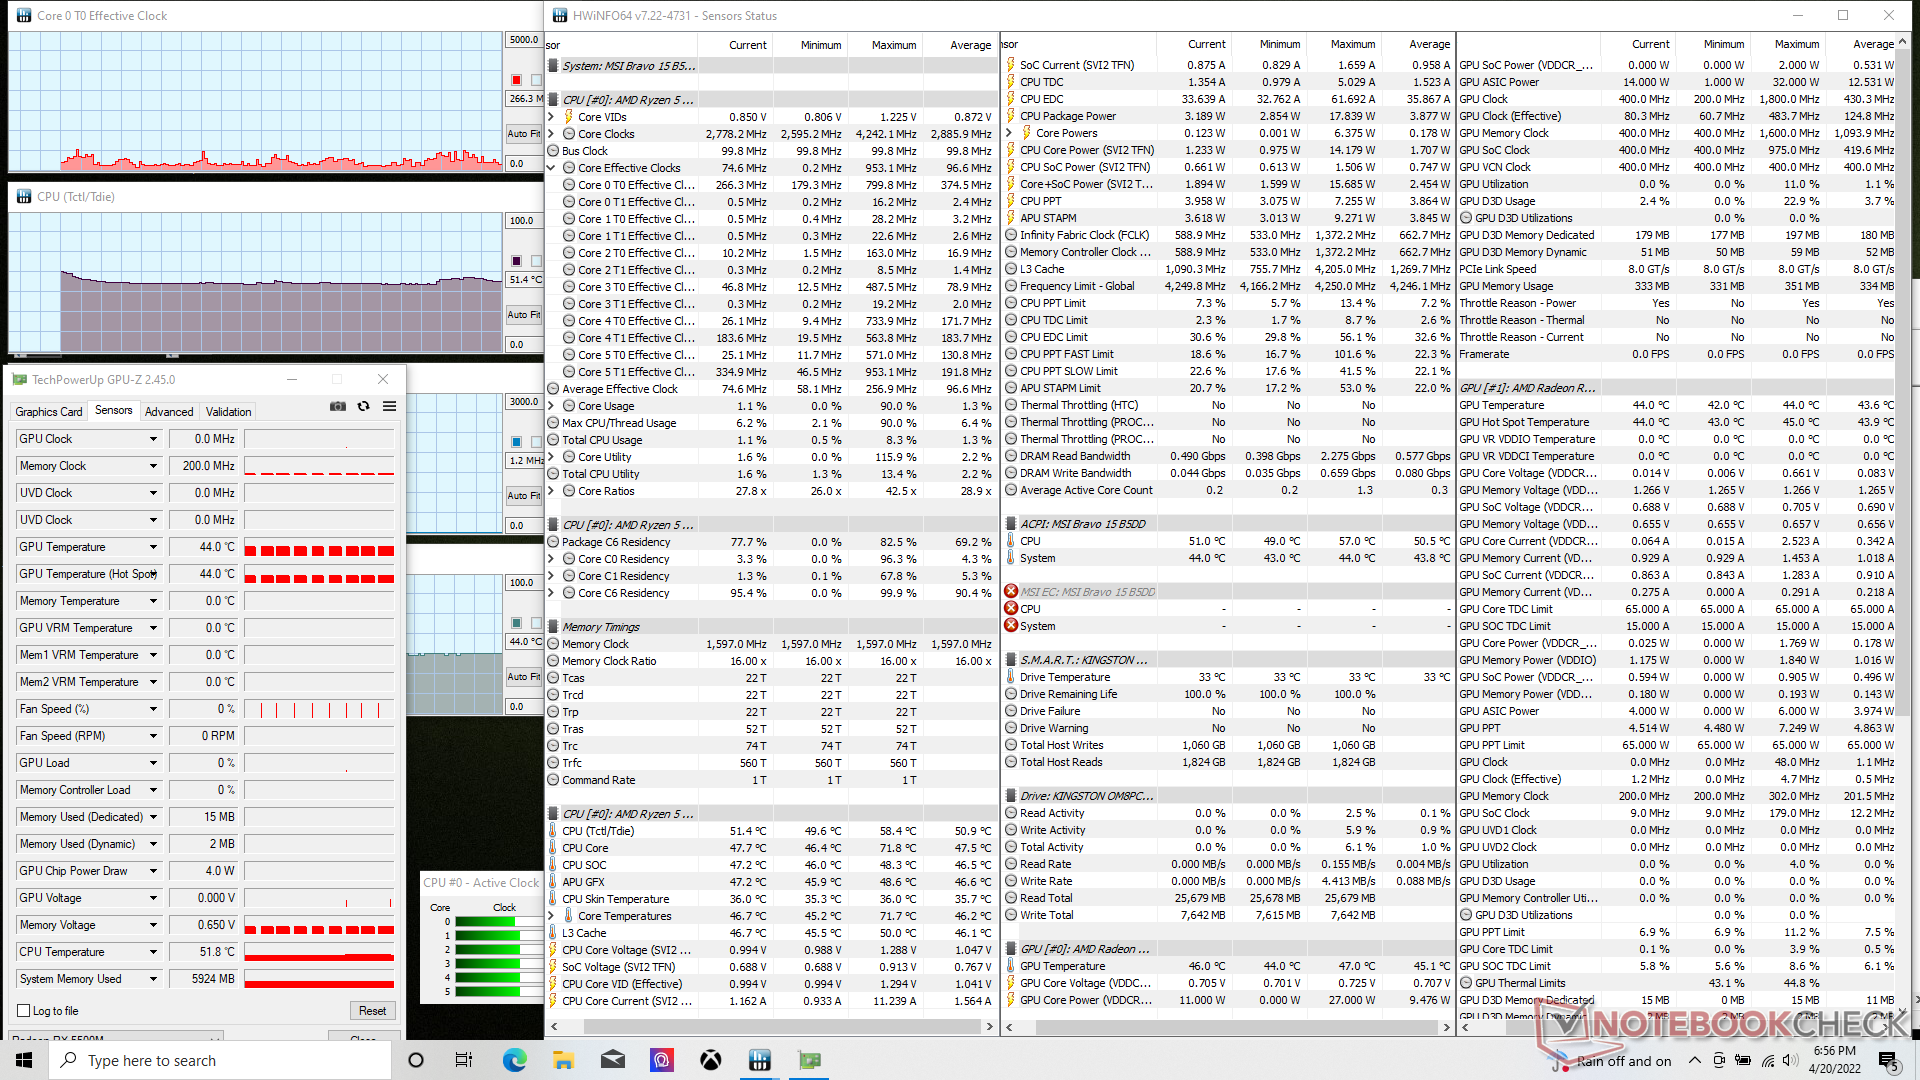
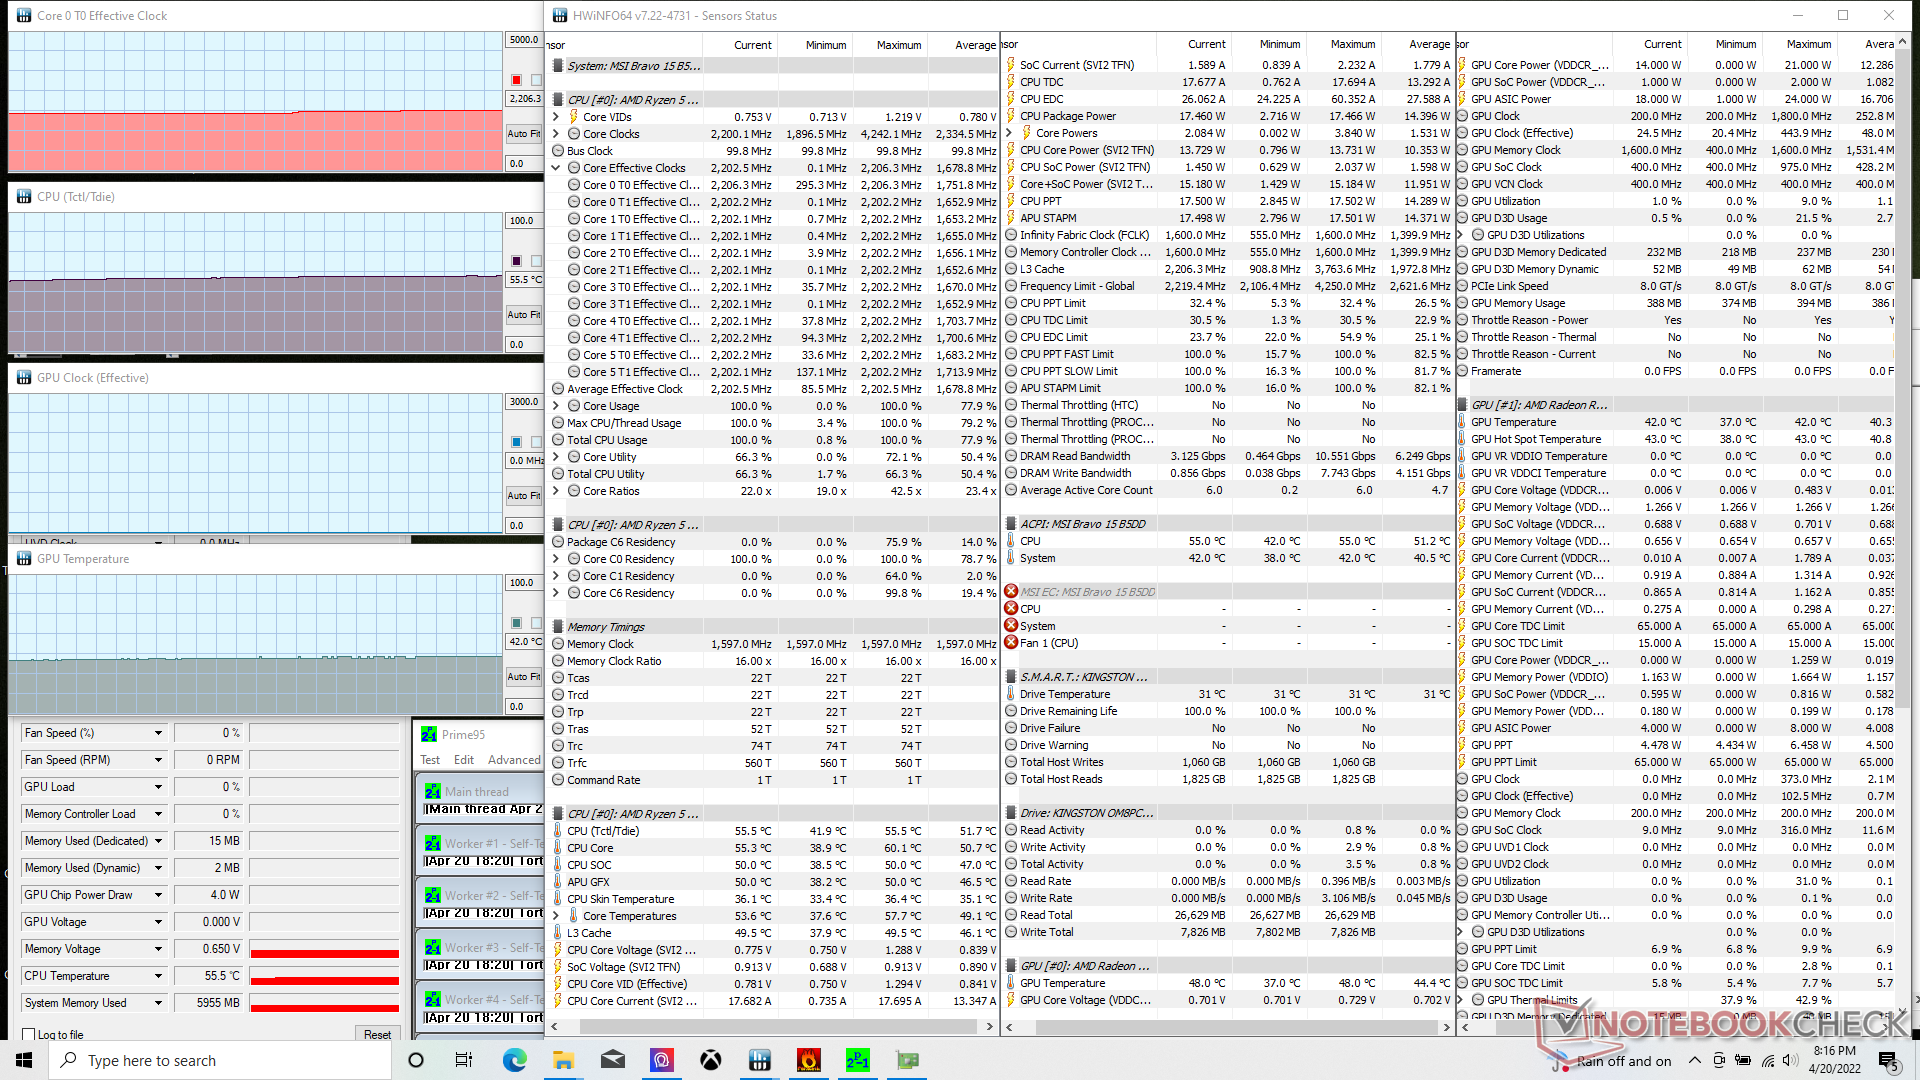
在极端性能模式下运行Prime95时,CPU时钟速率将稳定在2.2 GHz和56 C,而在搭载Ryzen 9的华硕ROG Strix Scar 15 G533QS上则为3.8 GHz和95 C。当运行Prime95时,CPU和GPU温度将分别稳定在68 C和75 C。 Witcher 3.相比之下,2020 Bravo 15的CPU核心和GPU将分别稳定在77 C和71 C。即使在重负荷下,相对较低的温度在入门级游戏笔记本电脑中也很常见,如我们的Bravo 15系列。
启用Cooler Boost(或最大风扇模式)会降低核心温度,但不一定会提高CPU或GPU的性能,如下表所示,这与我们在其他具有相同Cooler Boost功能的微星游戏笔记本上观察到的情况一致。由于温度首先已经很低了,在大多数情况下可以禁用该功能。
用电池供电运行会限制性能。在电池上运行Fire Strike ,物理学和图形学得分将分别达到16804和4552分,而在主电源上则为21220和11621分。
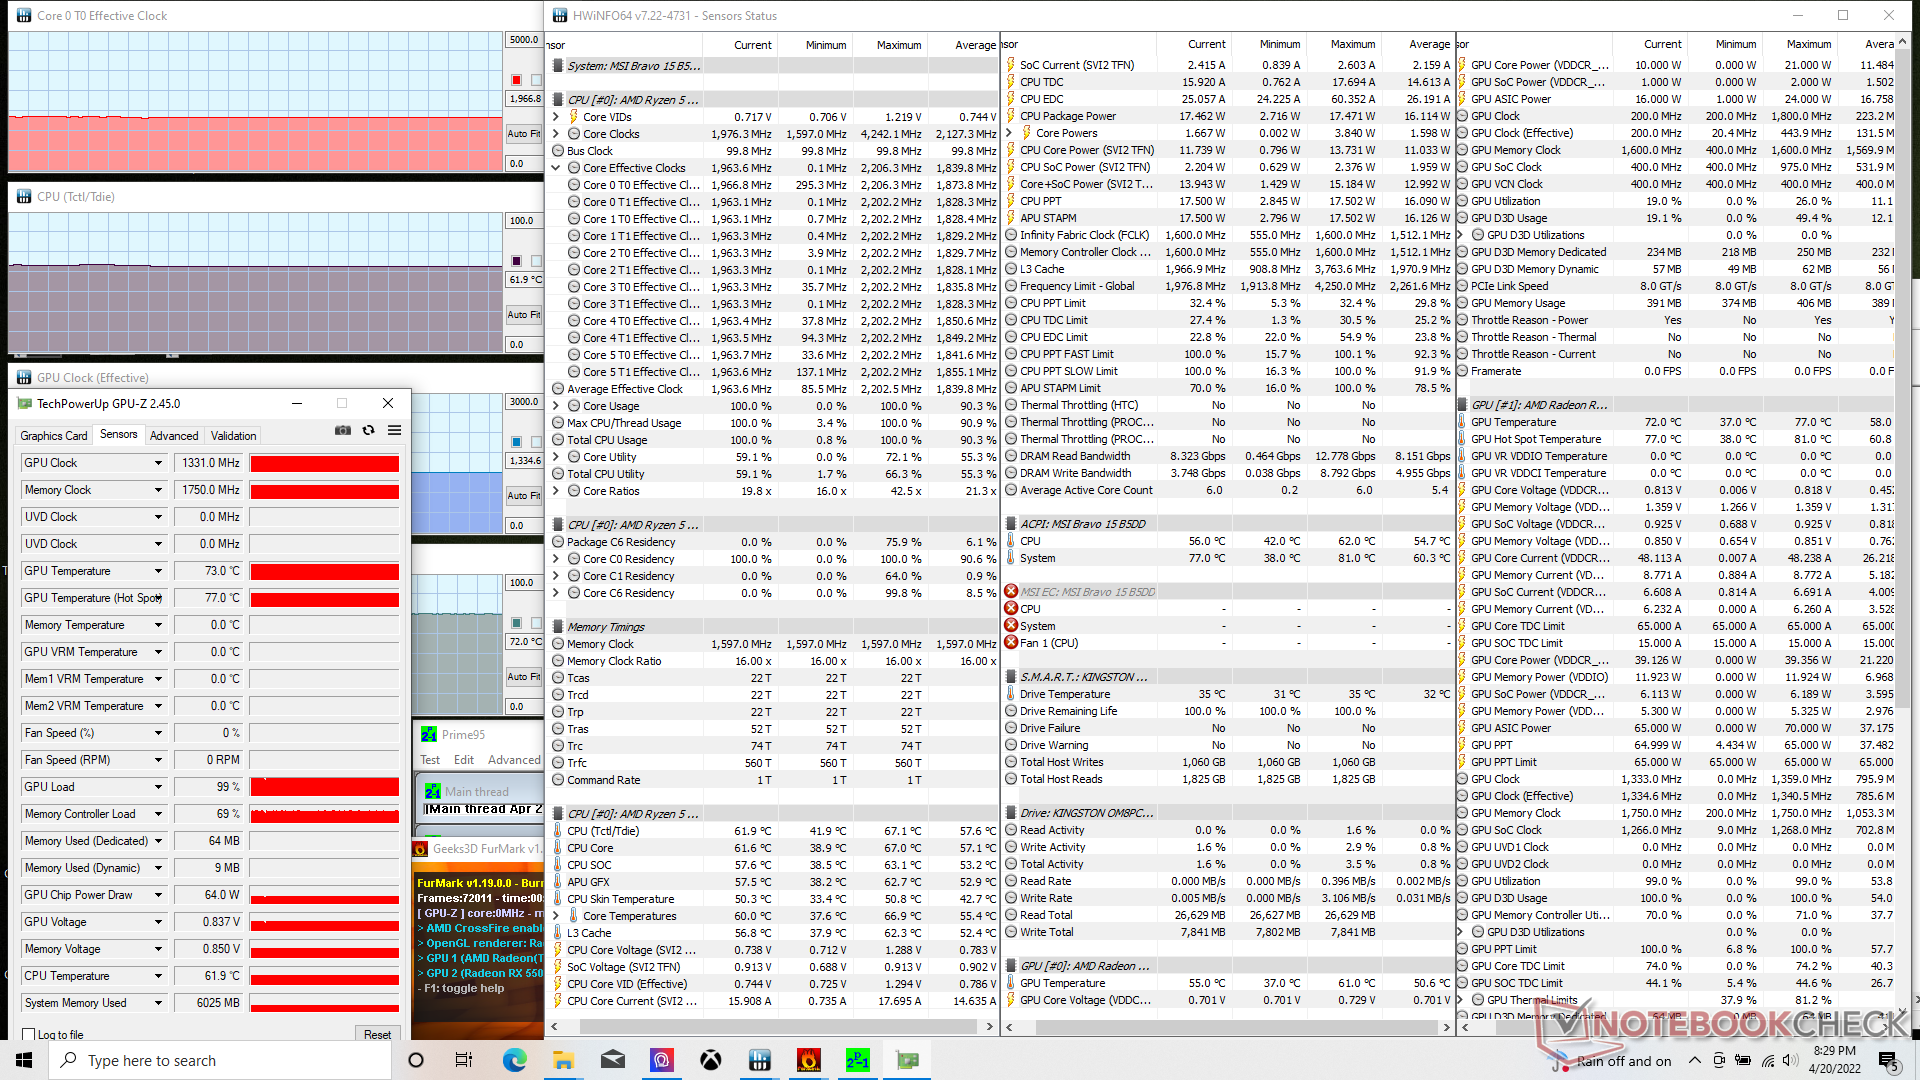
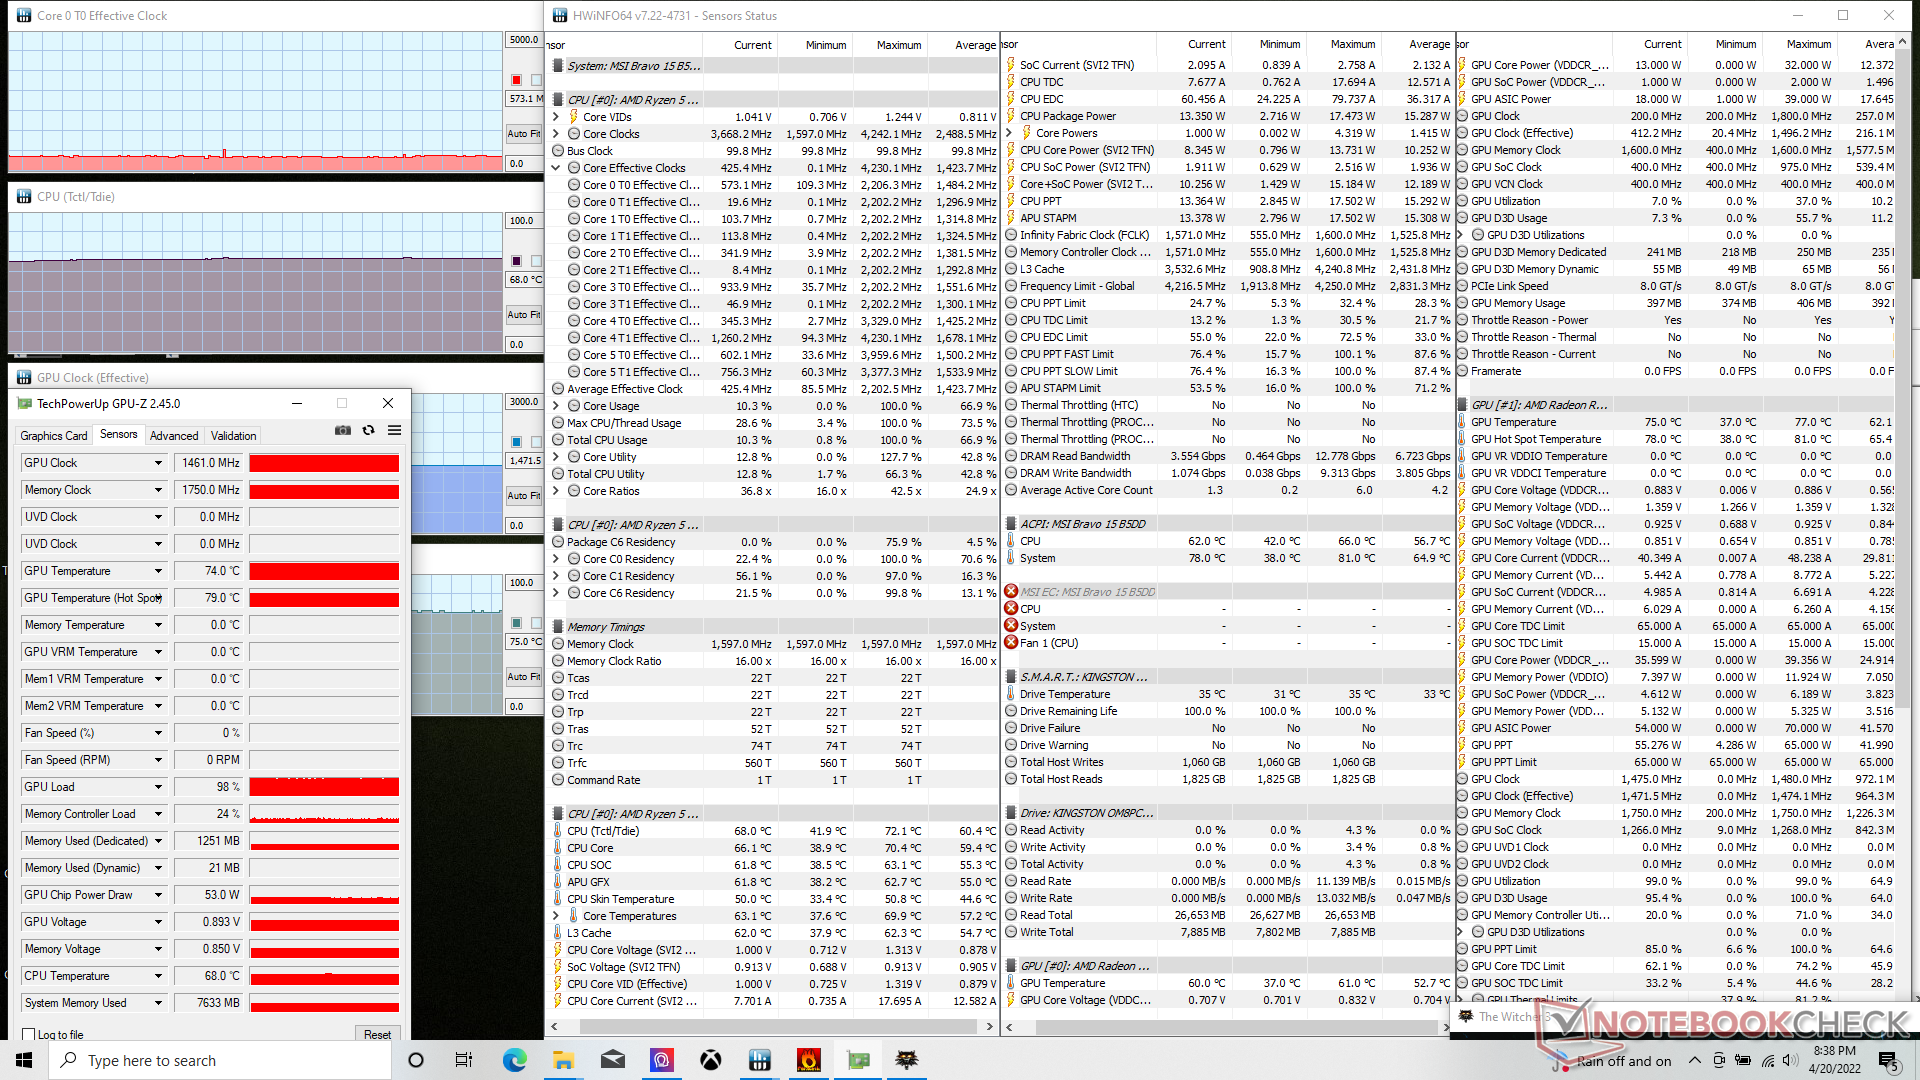
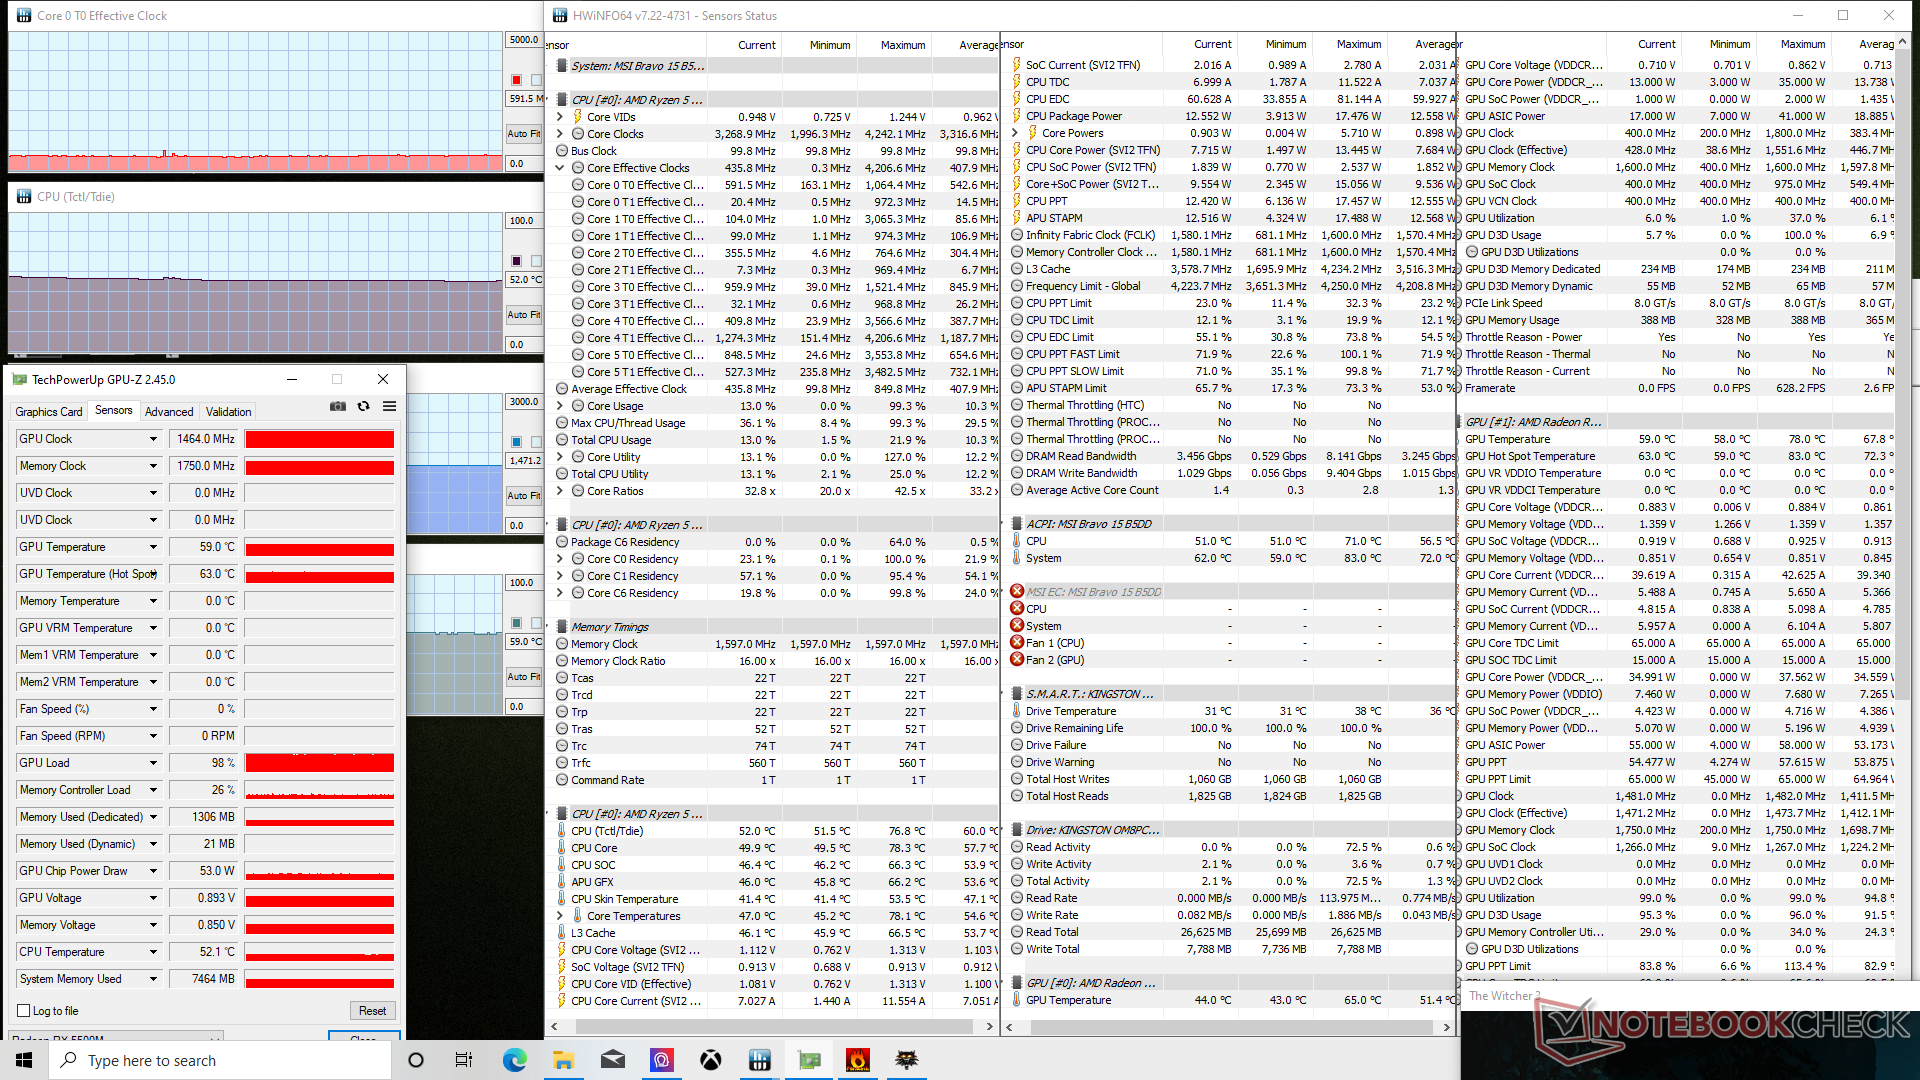
| CPU时钟(GHz) | GPU时钟(MHz) | CPU平均温度Tctl/Tdie(℃) | GPU平均温度(℃) | |
| 系统空闲 | -- | -- | 51 | 44 |
| Prime95压力 | 2.2 | -- | 56 | 42 |
| Prime95 + FurMark 压力 | 2.0 | 1331 | 62 | 72 |
| Witcher 3 应力(冷却器提升关闭) | 0.6 | 1461 | 68 | 75 |
| Witcher 3 压力(冷却器启动) | 0.6 | 1464 | 52 | 59 |
发言人
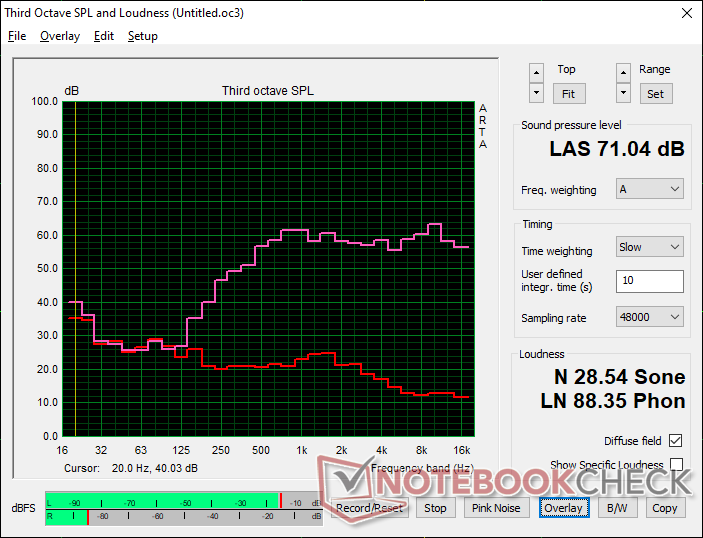
MSI Bravo 15 B5DD-010US audio analysis
(-) | not very loud speakers (71 dB)
Bass 100 - 315 Hz
(-) | nearly no bass - on average 20.2% lower than median
(±) | linearity of bass is average (11.7% delta to prev. frequency)
Mids 400 - 2000 Hz
(+) | balanced mids - only 2.6% away from median
(+) | mids are linear (6.8% delta to prev. frequency)
Highs 2 - 16 kHz
(+) | balanced highs - only 1.9% away from median
(+) | highs are linear (5.1% delta to prev. frequency)
Overall 100 - 16.000 Hz
(±) | linearity of overall sound is average (21.7% difference to median)
Compared to same class
» 78% of all tested devices in this class were better, 6% similar, 17% worse
» The best had a delta of 6%, average was 18%, worst was 132%
Compared to all devices tested
» 61% of all tested devices were better, 7% similar, 31% worse
» The best had a delta of 4%, average was 24%, worst was 134%
Apple MacBook Pro 16 2021 M1 Pro audio analysis
(+) | speakers can play relatively loud (84.7 dB)
Bass 100 - 315 Hz
(+) | good bass - only 3.8% away from median
(+) | bass is linear (5.2% delta to prev. frequency)
Mids 400 - 2000 Hz
(+) | balanced mids - only 1.3% away from median
(+) | mids are linear (2.1% delta to prev. frequency)
Highs 2 - 16 kHz
(+) | balanced highs - only 1.9% away from median
(+) | highs are linear (2.7% delta to prev. frequency)
Overall 100 - 16.000 Hz
(+) | overall sound is linear (4.6% difference to median)
Compared to same class
» 0% of all tested devices in this class were better, 0% similar, 100% worse
» The best had a delta of 5%, average was 17%, worst was 45%
Compared to all devices tested
» 0% of all tested devices were better, 0% similar, 100% worse
» The best had a delta of 4%, average was 24%, worst was 134%
能源管理
功耗 - 好的CPU,坏的GPU
运行游戏或其他更高的负载时的功耗几乎与我们在2020 Bravo 15上记录的相同,后者使用了老一代的Ryzen 7 4800H和较慢的Radeon RX 5300M。然而,每瓦性能是一个混合包。尽管我们的Ryzen 5 5600H CPU可以提供比竞争对手的Core i5-11300H快60%的多线程性能,同时功耗降低12%,但我们的Radeon RX5500M比竞争对手的GeForce RTX 3050 Ti慢约15%至30%,同时功耗降低13%。简而言之,与英特尔相比,AMD的CPU具有明显的每瓦性能优势,而与Nvidia的最新GPU相比,AMD的GPU具有明显的劣势。
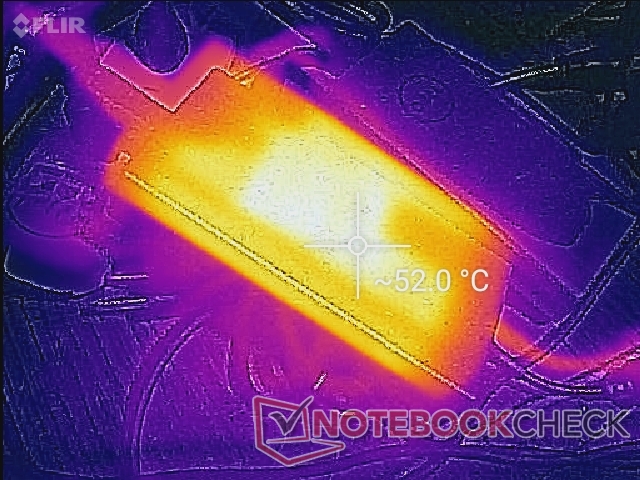
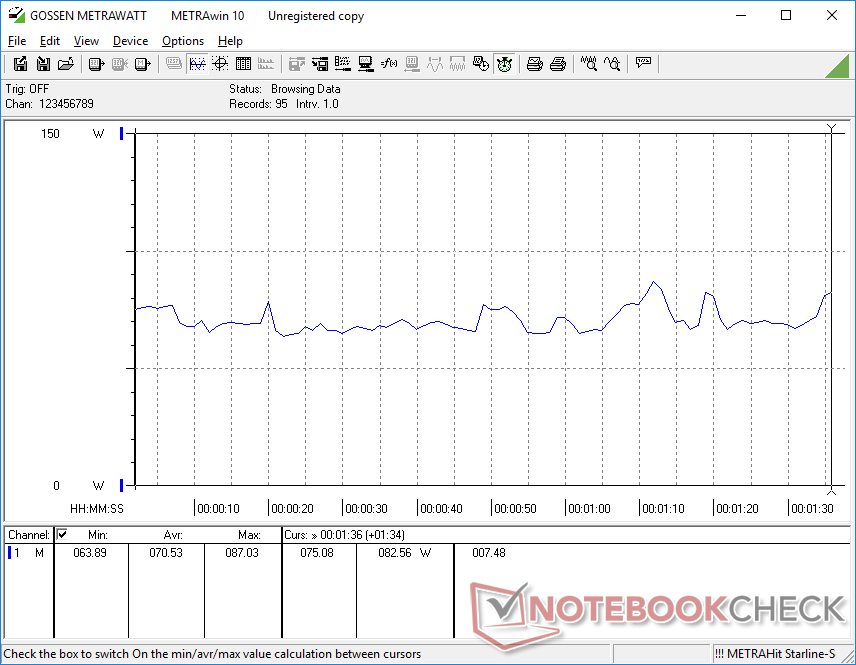
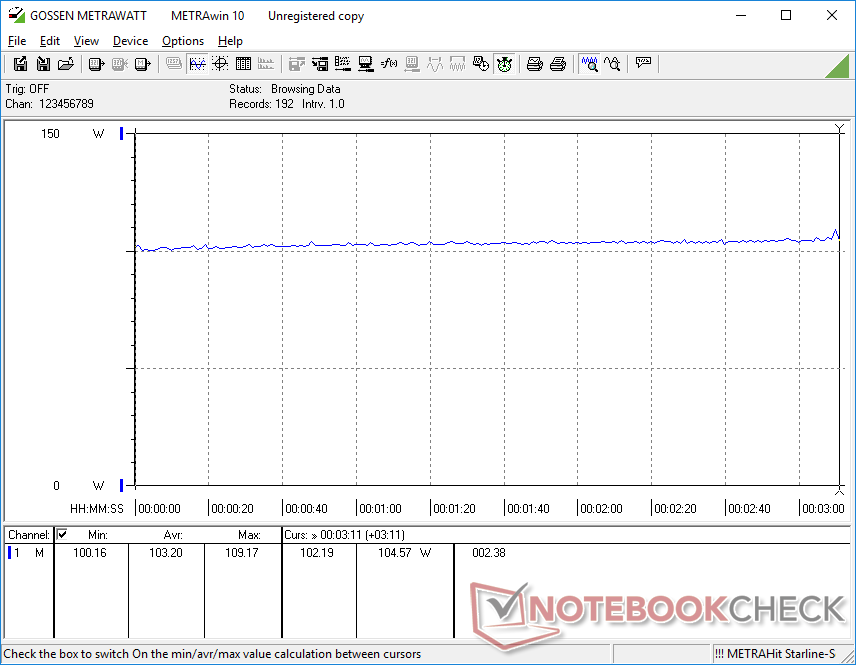
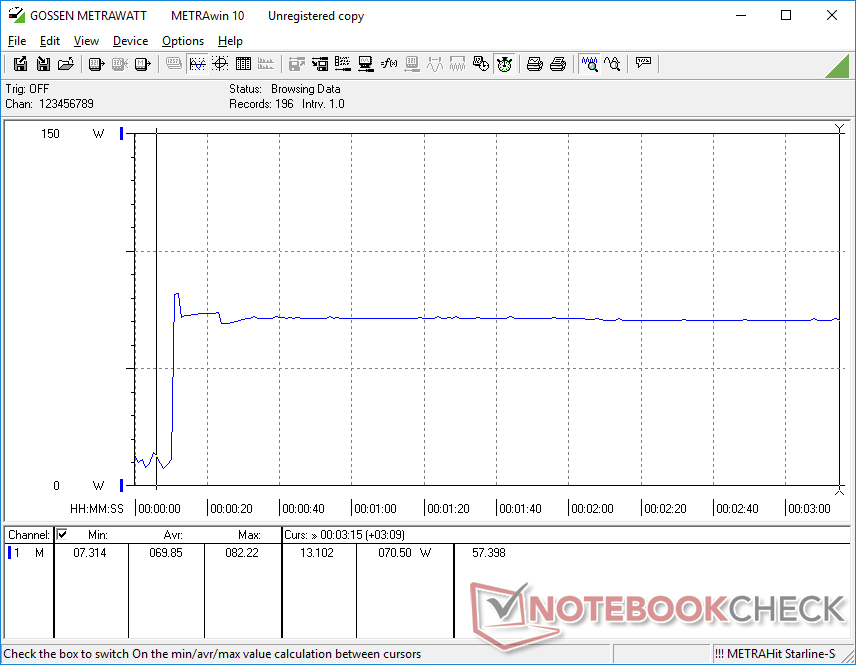
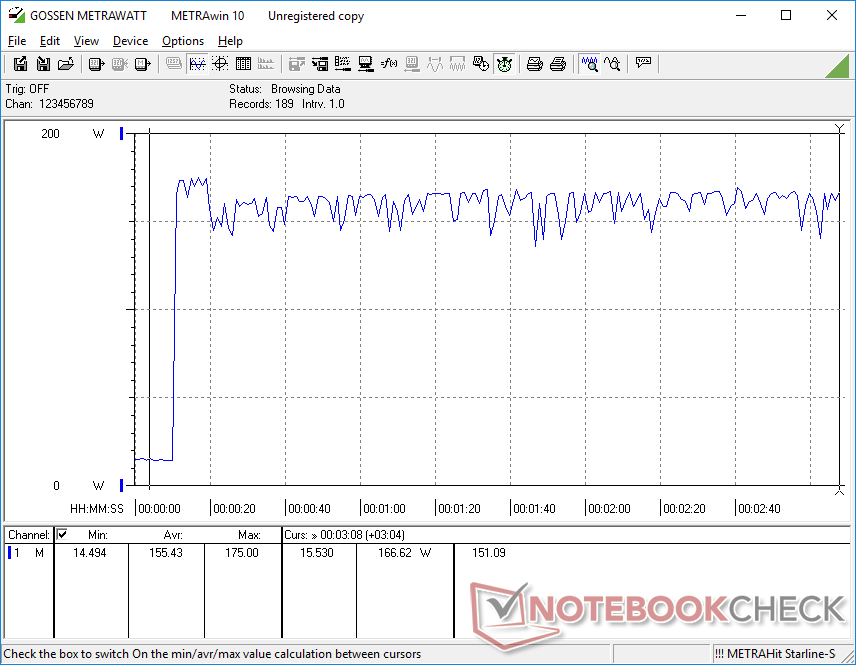
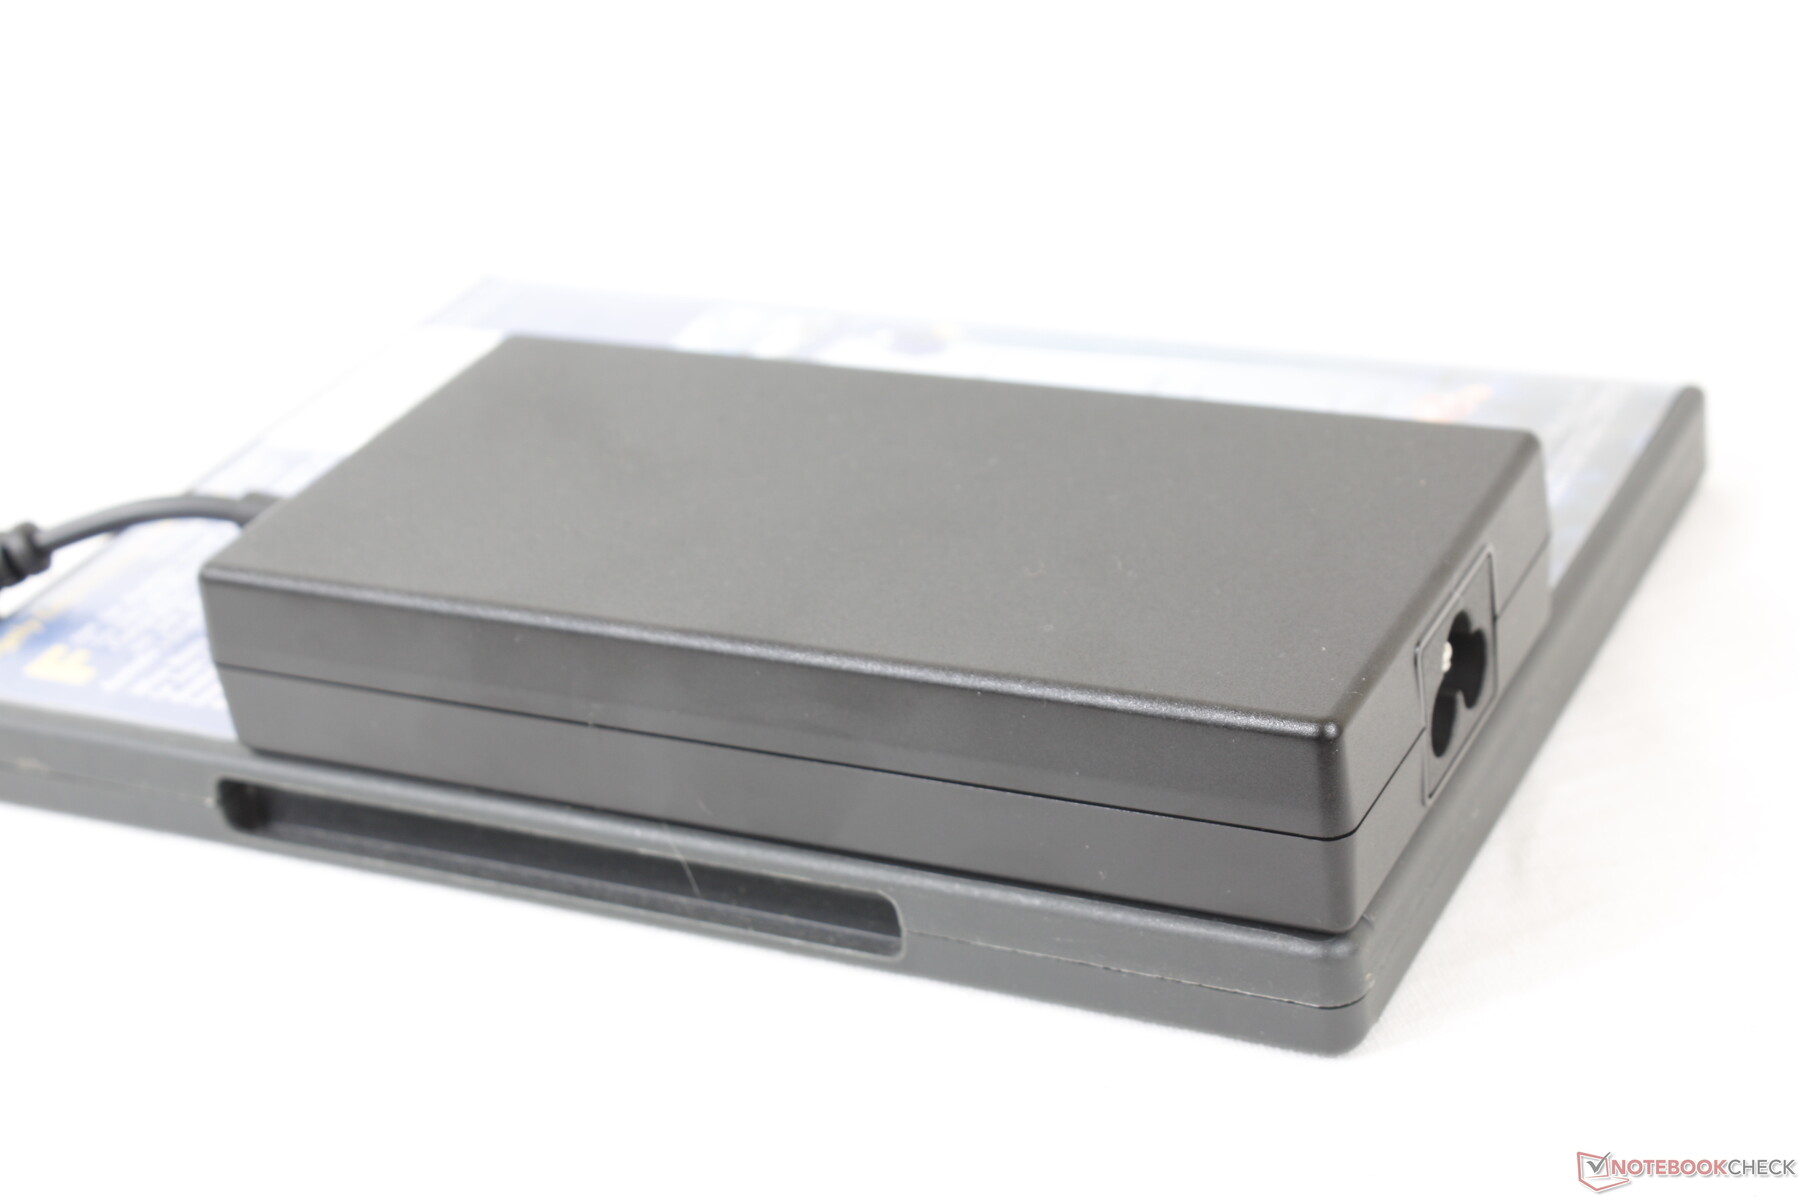
当CPU和GPU都处于100%的利用率时,我们能够从中小型(约13.6 x 6.6 x 2.9厘米)150瓦交流适配器中记录到175瓦的最大消耗。由于系统要求的功率可能超过交流适配器的额定功率,因此该模型可能受益于更高容量的适配器。在运行这种极端负载时,预计充电速度会大大减慢。值得庆幸的是,典型的游戏负载将消耗大约100W,完全在交流适配器的额定输出范围之内。
| Off / Standby | |
| Idle | |
| Load |
|
Key:
min: | |
| MSI Bravo 15 B5DD-010US R5 5600H, Radeon RX 5500M, Kingston OM8PCP3512F-AB, IPS, 1920x1080, 15.6" | MSI Bravo 15 A4DCR R7 4800H, Radeon RX 5300M, Samsung PM981a MZVLB1T0HBLR, IPS-Level, 1920x1080, 15.6" | Asus TUF Gaming F15 FX507ZM i7-12700H, GeForce RTX 3060 Laptop GPU, SK Hynix HFM001TD3JX013N, IPS, 1920x1080, 15.6" | Dell G15 5515 R7 5800H, GeForce RTX 3050 Ti Laptop GPU, Samsung PM991a MZ9LQ512HBLU-00BD1, IPS, 1920x1080, 15.6" | Lenovo Ideapad Gaming 3 15IHU-82K1002RGE i5-11300H, GeForce RTX 3050 Ti Laptop GPU, Micron 2210 MTFDHBA512QFD, IPS, 1920x1080, 15.6" | Asus ROG Zephyrus M15 GU502LU-BI7N4 i7-10750H, GeForce GTX 1660 Ti Mobile, Intel SSD 660p SSDPEKNW512G8, IPS, 1920x1080, 15.6" | |
|---|---|---|---|---|---|---|
| Power Consumption | -39% | -51% | -17% | 5% | -71% | |
| Idle Minimum * (Watt) | 6.6 | 11 -67% | 6.3 5% | 5 24% | 4.9 26% | 10 -52% |
| Idle Average * (Watt) | 9.8 | 14 -43% | 9.8 -0% | 9 8% | 8.3 15% | 16.9 -72% |
| Idle Maximum * (Watt) | 10.8 | 25 -131% | 26.5 -145% | 20 -85% | 8.9 18% | 28.3 -162% |
| Load Average * (Watt) | 70.5 | 72 -2% | 103.8 -47% | 94 -33% | 81 -15% | 122.7 -74% |
| Witcher 3 ultra * (Watt) | 103.2 | 100 3% | 189 -83% | 123 -19% | 119 -15% | 143.2 -39% |
| Load Maximum * (Watt) | 175 | 163 7% | 241.9 -38% | 172 2% | 172 2% | 224.1 -28% |
* ... smaller is better
Power Consumption Witcher 3 / Stresstest
Power Consumption external Monitor
电池寿命--对于游戏笔记本来说是不错的。
尽管电池容量与去年的Bravo型号相比没有明显变化,但运行时间还是增加了。我们能够记录下刚刚超过6小时的实际WLAN使用时间,或者比前一型号多出大约2小时。
从空电到满电的充电时间偏慢,几乎为2.5小时,而其他大多数笔记本电脑只需要1.5到2小时。该模型不能像成本较高的微星GS或GT系列那样通过USB-C进行充电。
| MSI Bravo 15 B5DD-010US R5 5600H, Radeon RX 5500M, 53 Wh | MSI Bravo 15 A4DCR R7 4800H, Radeon RX 5300M, 51 Wh | Asus TUF Gaming F15 FX507ZM i7-12700H, GeForce RTX 3060 Laptop GPU, 90 Wh | Dell G15 5515 R7 5800H, GeForce RTX 3050 Ti Laptop GPU, 56 Wh | Lenovo Ideapad Gaming 3 15IHU-82K1002RGE i5-11300H, GeForce RTX 3050 Ti Laptop GPU, 45 Wh | Acer Nitro 5 AN515-45-R1JH R7 5800H, GeForce RTX 3070 Laptop GPU, 57.5 Wh | |
|---|---|---|---|---|---|---|
| Battery runtime | -21% | 19% | 41% | 8% | -3% | |
| Reader / Idle (h) | 9.2 | 7 -24% | 15.8 72% | 13.5 47% | 9.2 0% | |
| WiFi v1.3 (h) | 6.3 | 4.5 -29% | 4.8 -24% | 8 27% | 6.6 5% | 5.7 -10% |
| Load (h) | 1 | 0.9 -10% | 1.1 10% | 1.5 50% | 1.1 10% | 1 0% |
| H.264 (h) | 8.8 | 7.7 | 6.9 |
Pros
Cons
结论--要避免的人
在2022年为一台比2016年的GeForce GTX 1060还要慢的游戏笔记本支付大约800美元,这并不合适。Zen 3 CPU选项可能很好,但它们与如此老旧的Radeon RX 5500M GPU搭配,该系统将比我们希望的更早地开始与新游戏斗争。
Bravo 15 B5DD是一款2022年的游戏笔记本电脑,配备了2016年的中档GPU。快速的AMD Ryzen CPU受到老化的Radeon RX 5500M的瓶颈限制。
至于笔记本电脑的其他部分,制造商实际上已经从2020年的Bravo 15做了一些明显的降级。例如,较新的模型现在只支持一个M.2固态硬盘,而不是两个,同时还有较少的USB-C端口和没有其他显示选项可供选择。事实上,较新的设计比老款更重更大,也没有帮助。
我们至少可以欣赏到相对较低的运行温度和良好的处理器性能,以满足这个价格。然而,为了获得更好的游戏体验,你将从其他预算游戏笔记本电脑中获得更多的钱,这些笔记本电脑采用了 GeForce RTX 3050或甚至 GeForce GTX 1660 Ti而不是。
MSI Bravo 15 B5DD-010US
- 04/23/2022 v7 (old)
Allen Ngo
Price comparison

