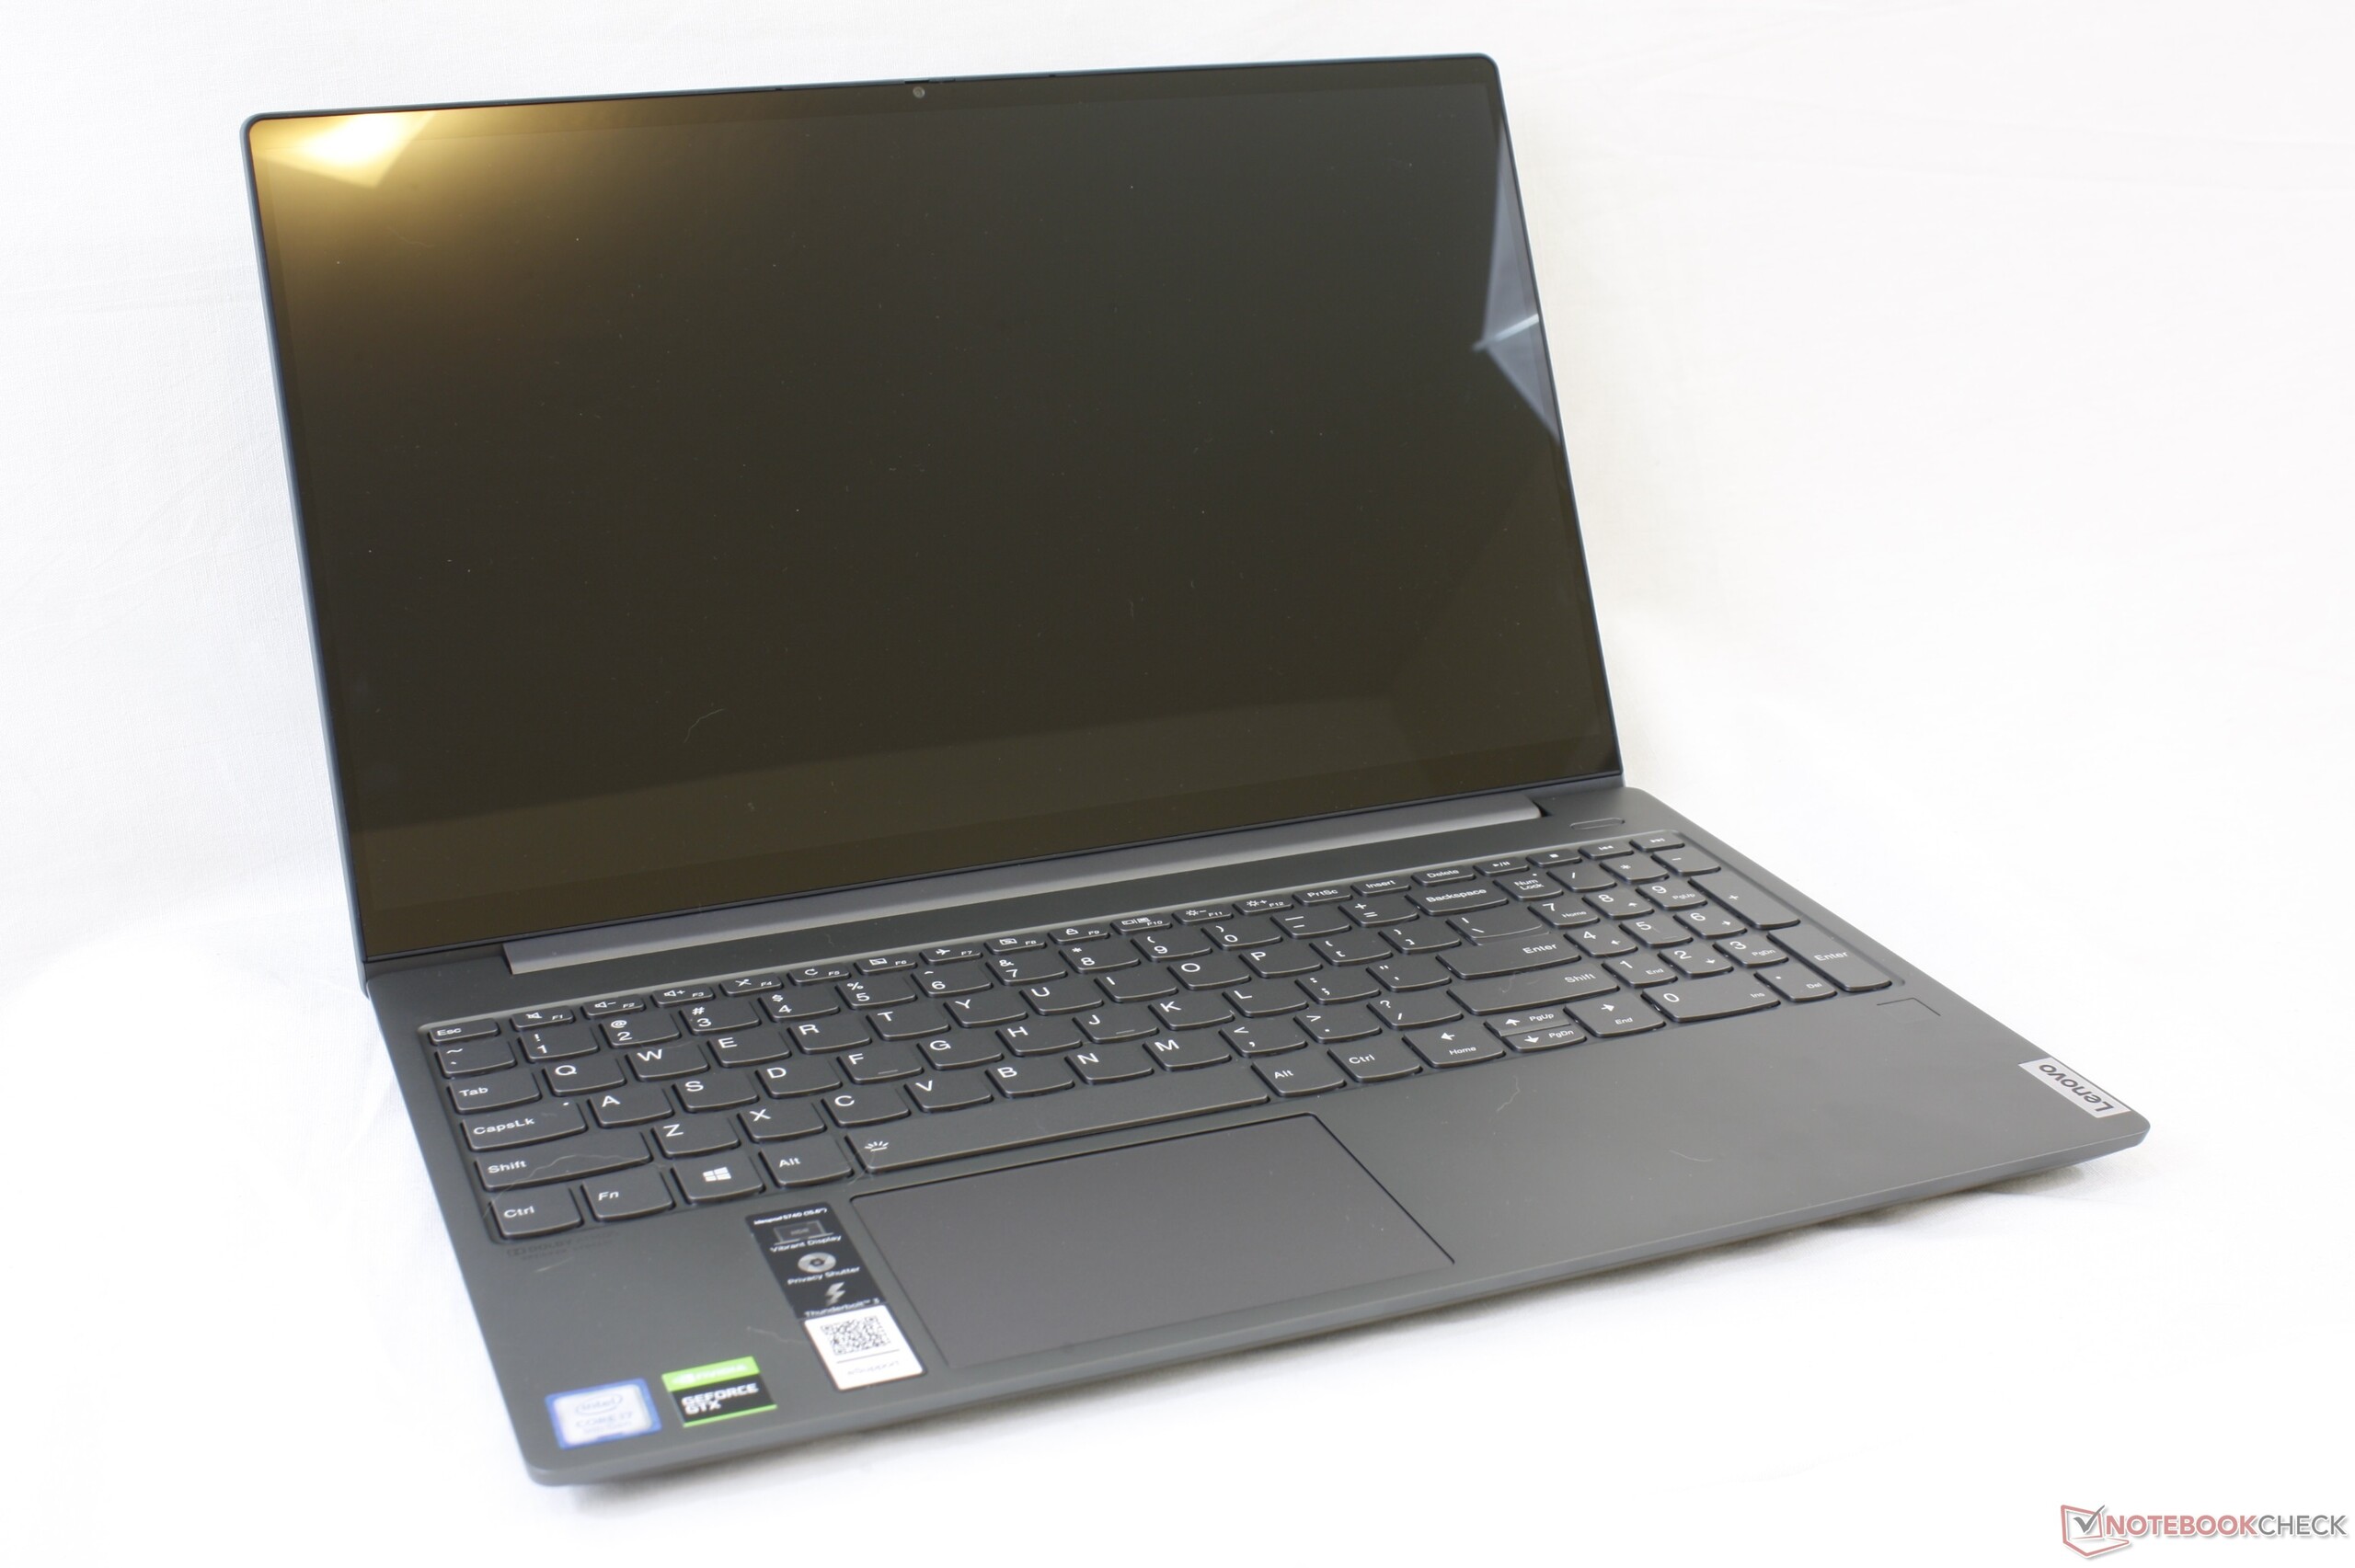
联想IdeaPad S740-15IRH笔记本电脑评测:最贵最好的IdeaPad
Rating | Date | Model | Weight | Height | Size | Resolution | Price |
|---|---|---|---|---|---|---|---|
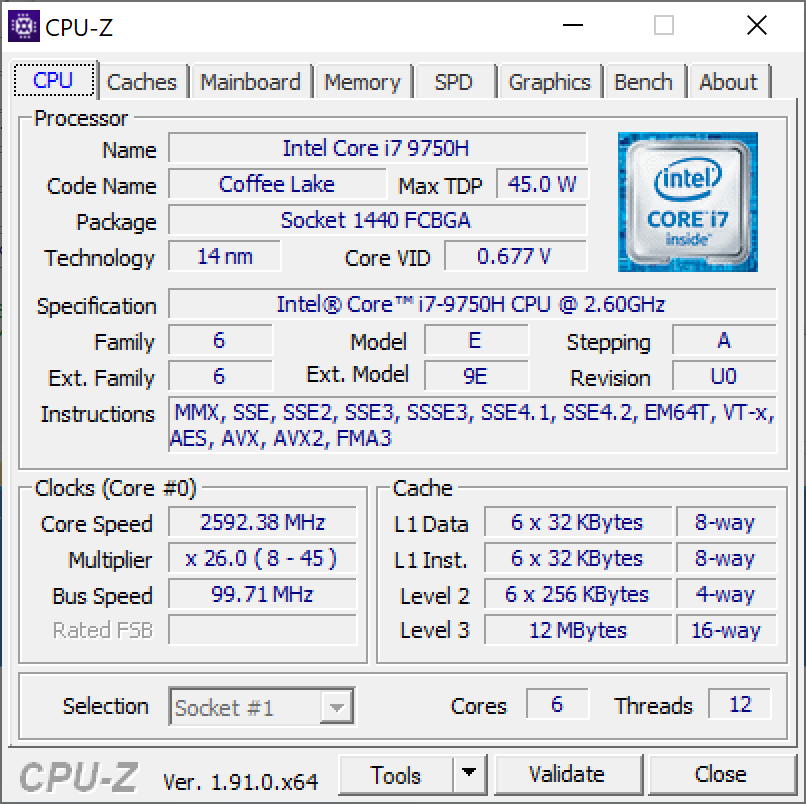
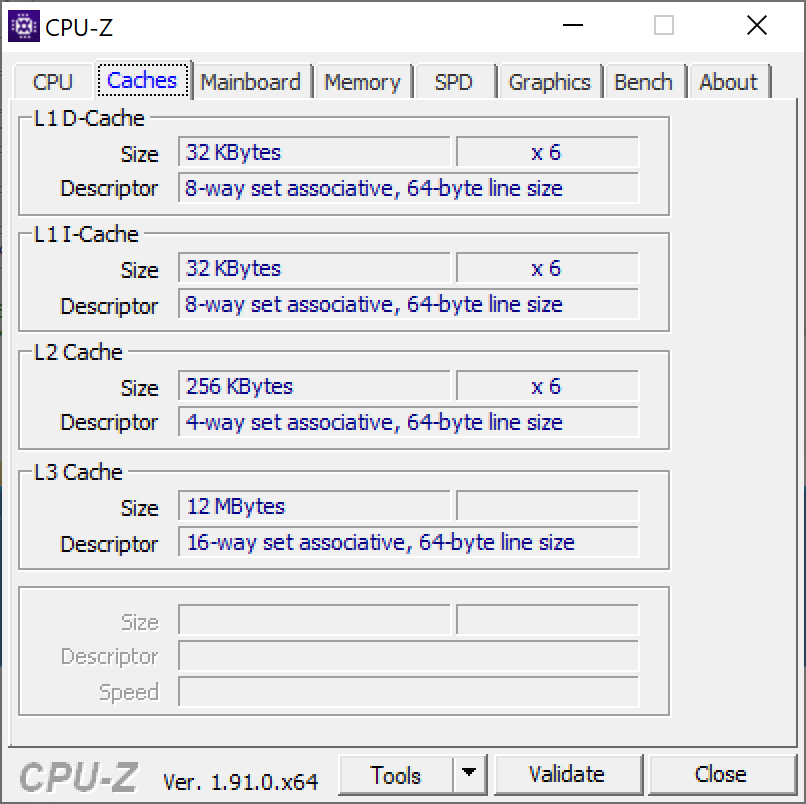
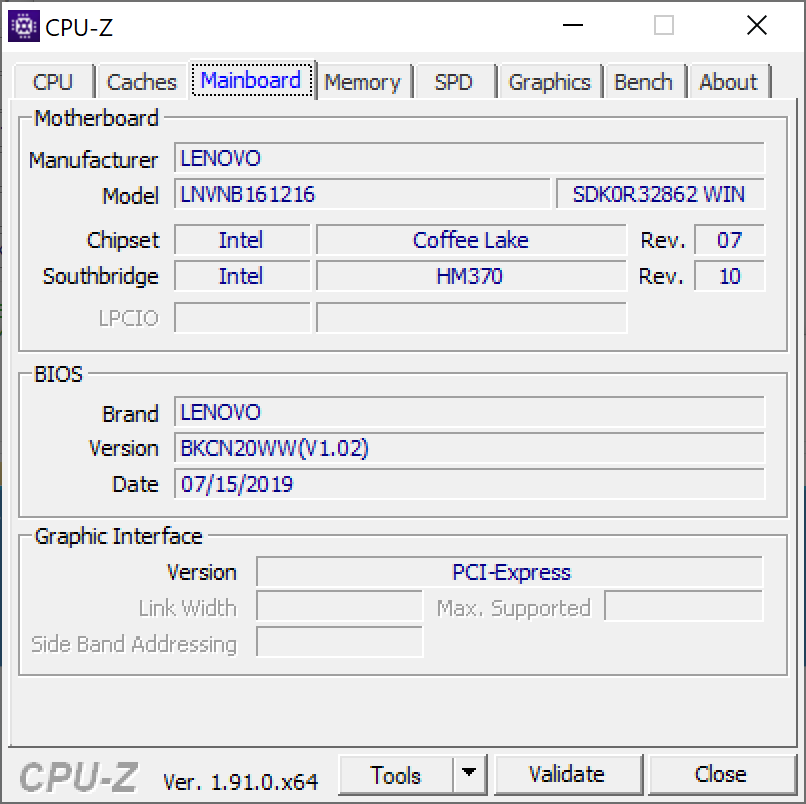
| 85.5 % v7 (old) | 03 / 2020 | Lenovo IdeaPad S740-15IRH i7-9750H, GeForce GTX 1650 Max-Q | 1.9 kg | 19.95 mm | 15.60" | 3840x2160 | |
| 87.8 % v7 (old) | 10 / 2019 | Dell XPS 15 7590 9980HK GTX 1650 i9-9980HK, GeForce GTX 1650 Mobile | 2 kg | 17 mm | 15.60" | 3840x2160 | |
| 85 % v7 (old) | HP Spectre X360 15-5ZV31AV i7-10510U, GeForce MX250 | 2.1 kg | 19.3 mm | 15.60" | 3840x2160 | ||
| 82.7 % v6 (old) | 08 / 2018 | Lenovo Yoga 730-15IKB i5-8550U, GeForce GTX 1050 Mobile | 1.9 kg | 17.2 mm | 15.60" | 3840x2160 | |
| 83.1 % v7 (old) | 12 / 2019 | Asus ZenBook 15 UX534FT-DB77 i7-8565U, GeForce GTX 1650 Max-Q | 1.7 kg | 18.9 mm | 15.60" | 1920x1080 |
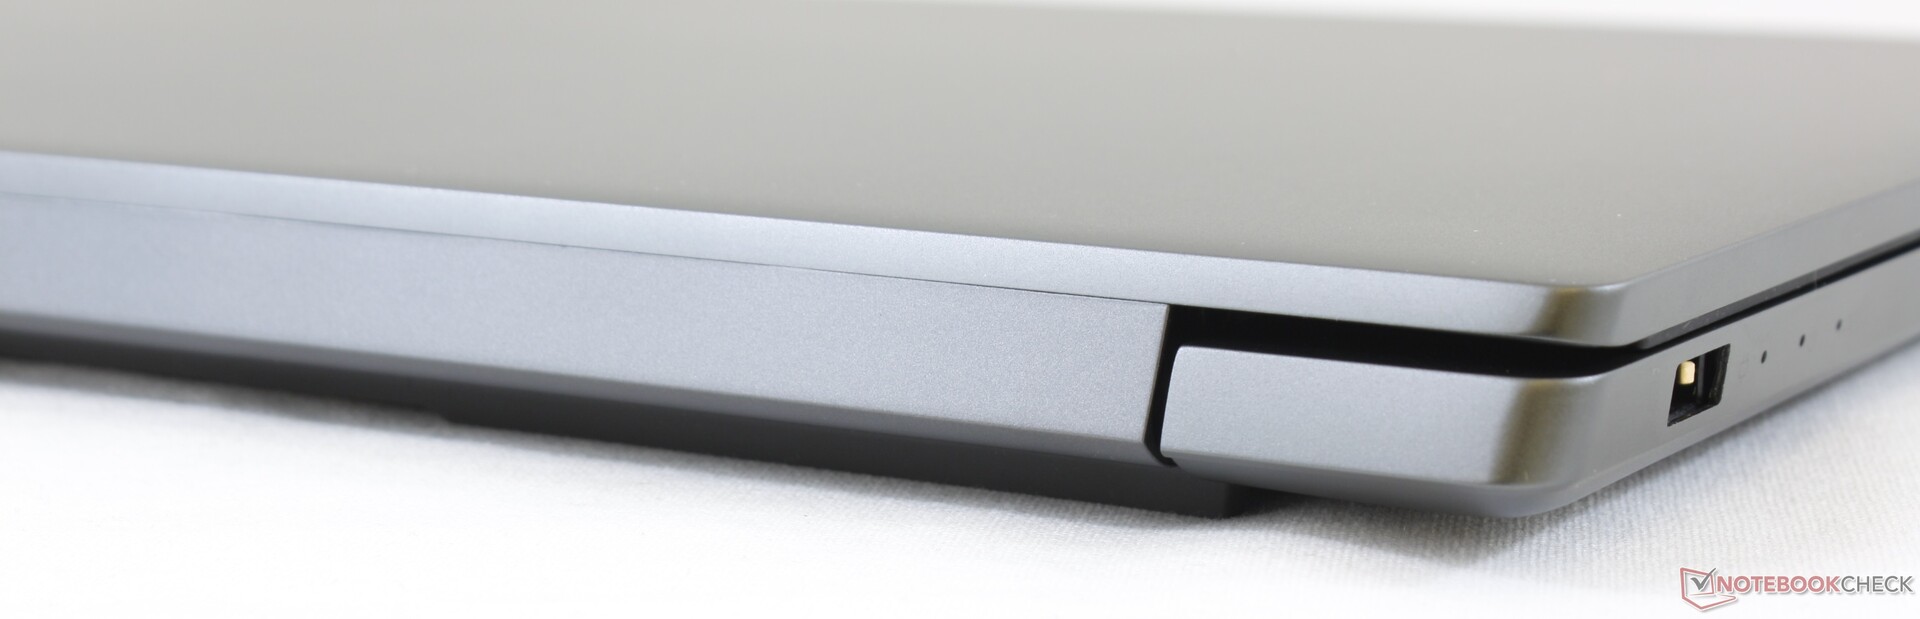
| SD Card Reader | |
| average JPG Copy Test (av. of 3 runs) | |
| Dell XPS 15 7590 9980HK GTX 1650 (Toshiba Exceria Pro SDXC 64 GB UHS-II) | |
| HP Spectre X360 15-5ZV31AV (Toshiba Exceria Pro M501 UHS-II) | |
| MSI Prestige 15 A10SC (Toshiba Exceria Pro M501 UHS-II) | |
| Lenovo IdeaPad S740-15IRH (Toshiba Exceria Pro M501 UHS-II) | |
| Asus ZenBook 15 UX534FT-DB77 (Toshiba Exceria Pro SDXC 64 GB UHS-II) | |
| maximum AS SSD Seq Read Test (1GB) | |
| MSI Prestige 15 A10SC (Toshiba Exceria Pro M501 UHS-II) | |
| Dell XPS 15 7590 9980HK GTX 1650 (Toshiba Exceria Pro SDXC 64 GB UHS-II) | |
| HP Spectre X360 15-5ZV31AV (Toshiba Exceria Pro M501 UHS-II) | |
| Lenovo IdeaPad S740-15IRH (Toshiba Exceria Pro M501 UHS-II) | |
| Asus ZenBook 15 UX534FT-DB77 (Toshiba Exceria Pro SDXC 64 GB UHS-II) | |
| Networking | |
| iperf3 transmit AX12 | |
| MSI Prestige 15 A10SC | |
| Lenovo Yoga 730-15IKB | |
| iperf3 receive AX12 | |
| MSI Prestige 15 A10SC | |
| Lenovo Yoga 730-15IKB | |
| |||||||||||||||||||||||||
Brightness Distribution: 83 %
Center on Battery: 475.8 cd/m²
Contrast: 1220:1 (Black: 0.39 cd/m²)
ΔE ColorChecker Calman: 2.36 | ∀{0.5-29.43 Ø4.71}
calibrated: 1.62
ΔE Greyscale Calman: 3.8 | ∀{0.09-98 Ø4.96}
91.7% sRGB (Argyll 1.6.3 3D)
58% AdobeRGB 1998 (Argyll 1.6.3 3D)
63.1% AdobeRGB 1998 (Argyll 3D)
90.5% sRGB (Argyll 3D)
61.2% Display P3 (Argyll 3D)
Gamma: 2.28
CCT: 7046 K
| Lenovo IdeaPad S740-15IRH BOE HF NE156QUM-N55, IPS, 15.6", 3840x2160 | Dell XPS 15 7590 9980HK GTX 1650 Samsung 156WR04, SDCA029, OLED, 15.6", 3840x2160 | HP Spectre X360 15-5ZV31AV AU Optronics AUO30EB, IPS, 15.6", 3840x2160 | Lenovo Yoga 730-15IKB BOE HF NV156QUM-N51, IPS, 15.6", 3840x2160 | Asus ZenBook 15 UX534FT-DB77 BOE NV156FHM-N63, IPS, 15.6", 1920x1080 | MSI Prestige 15 A10SC Sharp LQ156D1JW42, IPS, 15.6", 3840x2160 | |
|---|---|---|---|---|---|---|
| Display | 33% | 8% | 5% | 3% | 32% | |
| Display P3 Coverage (%) | 61.2 | 88.1 44% | 68.3 12% | 68.7 12% | 66.6 9% | 82 34% |
| sRGB Coverage (%) | 90.5 | 99.6 10% | 94.3 4% | 90 -1% | 87.7 -3% | 98.3 9% |
| AdobeRGB 1998 Coverage (%) | 63.1 | 91.8 45% | 68.4 8% | 65.8 4% | 64.1 2% | 96.2 52% |
| Response Times | 93% | -46% | 12% | -12% | -50% | |
| Response Time Grey 50% / Grey 80% * (ms) | 40.4 ? | 2.3 ? 94% | 56.8 ? -41% | 34 ? 16% | 41.2 ? -2% | 60 ? -49% |
| Response Time Black / White * (ms) | 27.2 ? | 2.4 ? 91% | 40.8 ? -50% | 25 ? 8% | 33.2 ? -22% | 41.2 ? -51% |
| PWM Frequency (Hz) | 59.5 ? | 961 ? | 26040 ? | |||
| Screen | -22% | -13% | -19% | -39% | -8% | |
| Brightness middle (cd/m²) | 475.8 | 421.2 -11% | 284.6 -40% | 309 -35% | 312.6 -34% | 464.5 -2% |
| Brightness (cd/m²) | 439 | 417 -5% | 285 -35% | 299 -32% | 290 -34% | 451 3% |
| Brightness Distribution (%) | 83 | 94 13% | 85 2% | 84 1% | 85 2% | 92 11% |
| Black Level * (cd/m²) | 0.39 | 0.25 36% | 0.29 26% | 0.31 21% | 0.5 -28% | |
| Contrast (:1) | 1220 | 1138 -7% | 1066 -13% | 1008 -17% | 929 -24% | |
| Colorchecker dE 2000 * | 2.36 | 6.06 -157% | 3.52 -49% | 3.9 -65% | 5.78 -145% | 3.36 -42% |
| Colorchecker dE 2000 max. * | 6.29 | 11.89 -89% | 5.56 12% | 7.5 -19% | 8.86 -41% | 7.06 -12% |
| Colorchecker dE 2000 calibrated * | 1.62 | 3 -85% | 3.78 -133% | 3.42 -111% | ||
| Greyscale dE 2000 * | 3.8 | 2.8 26% | 3.2 16% | 4.58 -21% | 5.4 -42% | 1.3 66% |
| Gamma | 2.28 96% | 2.15 102% | 2.28 96% | 2.43 91% | 2.21 100% | 2.14 103% |
| CCT | 7046 92% | 6235 104% | 7070 92% | 7344 89% | 7864 83% | 6596 99% |
| Color Space (Percent of AdobeRGB 1998) (%) | 58 | 81 40% | 61.1 5% | 39 -33% | 57.1 -2% | 84.8 46% |
| Color Space (Percent of sRGB) (%) | 91.7 | 99.6 9% | 93.8 2% | 90 -2% | 87.4 -5% | 98.3 7% |
| Total Average (Program / Settings) | 35% /
8% | -17% /
-13% | -1% /
-10% | -16% /
-28% | -9% /
-6% |
* ... smaller is better
Display Response Times
| ↔ Response Time Black to White | ||
|---|---|---|
| 27.2 ms ... rise ↗ and fall ↘ combined | ↗ 14.8 ms rise | 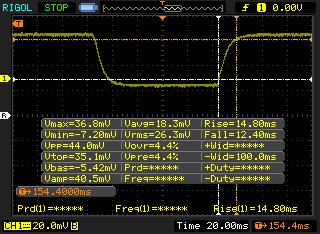 |
| ↘ 12.4 ms fall | ||
| The screen shows relatively slow response rates in our tests and may be too slow for gamers. In comparison, all tested devices range from 0.1 (minimum) to 240 (maximum) ms. » 69 % of all devices are better. This means that the measured response time is worse than the average of all tested devices (19.8 ms). | ||
| ↔ Response Time 50% Grey to 80% Grey | ||
| 40.4 ms ... rise ↗ and fall ↘ combined | ↗ 18 ms rise | 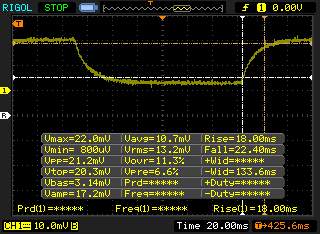 |
| ↘ 22 ms fall | ||
| The screen shows slow response rates in our tests and will be unsatisfactory for gamers. In comparison, all tested devices range from 0.165 (minimum) to 636 (maximum) ms. » 64 % of all devices are better. This means that the measured response time is worse than the average of all tested devices (30.9 ms). | ||
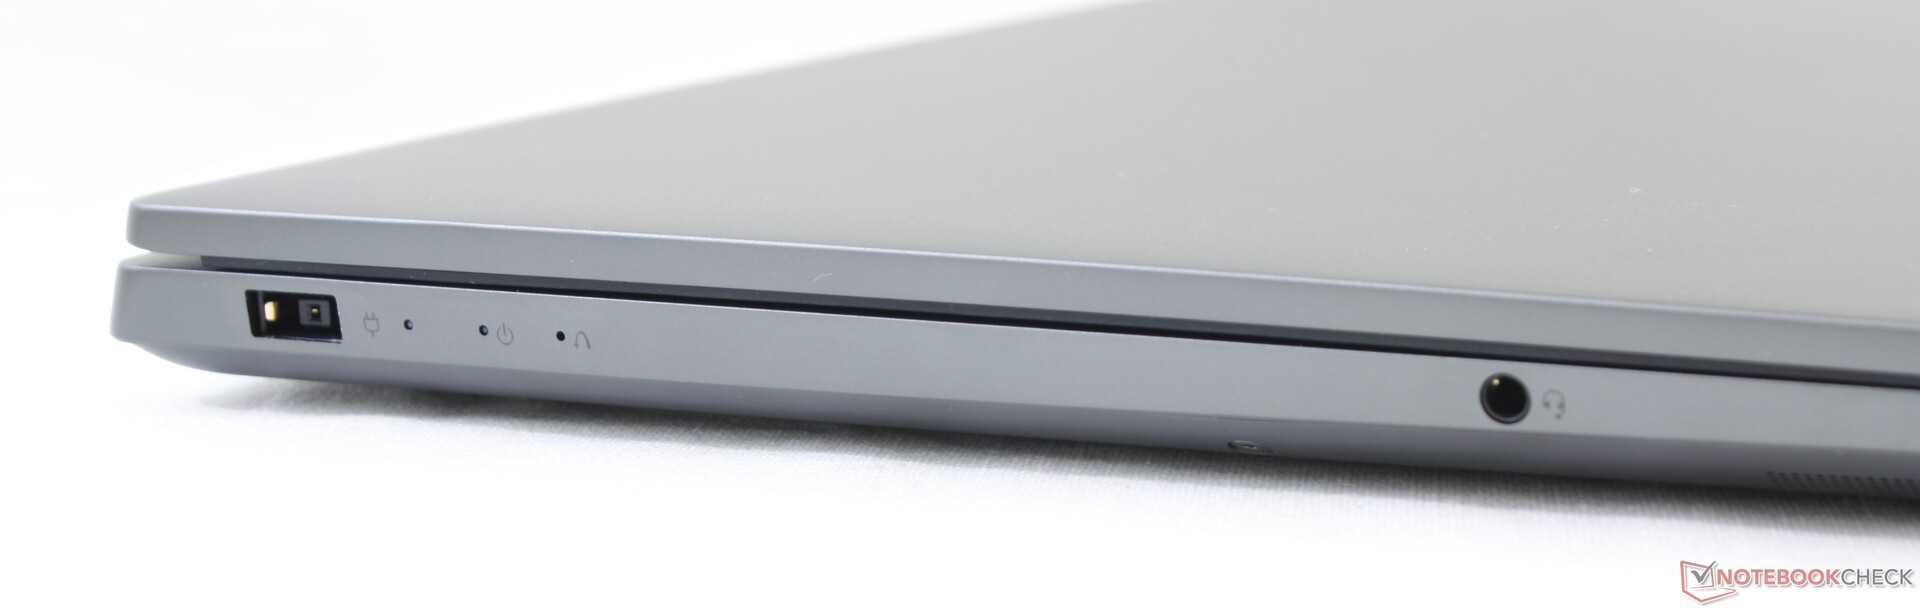
Screen Flickering / PWM (Pulse-Width Modulation)
| Screen flickering / PWM not detected | 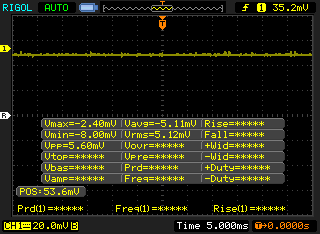 | ||
In comparison: 52 % of all tested devices do not use PWM to dim the display. If PWM was detected, an average of 7741 (minimum: 5 - maximum: 343500) Hz was measured. | |||
| Cinebench R11.5 | |
| CPU Single 64Bit | |
| Corsair One i160 | |
| Dell XPS 13 7390 Core i7-10710U | |
| MSI GE75 9SG | |
| Average Intel Core i7-9750H (1.96 - 2.19, n=10) | |
| Asus Zephyrus GX501 | |
| Asus ROG Zephyrus G15 GA502DU | |
| CPU Multi 64Bit | |
| Corsair One i160 | |
| MSI GE75 9SG | |
| Average Intel Core i7-9750H (11.3 - 14.1, n=10) | |
| Dell XPS 13 7390 Core i7-10710U | |
| Asus ROG Zephyrus G15 GA502DU | |
| Asus Zephyrus GX501 | |
| Cinebench R10 | |
| Rendering Multiple CPUs 32Bit | |
| Corsair One i160 | |
| MSI GE75 9SG | |
| Medion Erazer X15805 | |
| Average Intel Core i7-9750H (28251 - 36304, n=13) | |
| Dell XPS 13 7390 Core i7-10710U | |
| Asus Zephyrus GX501 | |
| Asus ROG Zephyrus G15 GA502DU | |
| Rendering Single 32Bit | |
| Corsair One i160 | |
| Medion Erazer X15805 | |
| Dell XPS 13 7390 Core i7-10710U | |
| MSI GE75 9SG | |
| Average Intel Core i7-9750H (6659 - 7214, n=13) | |
| Asus Zephyrus GX501 | |
| Asus ROG Zephyrus G15 GA502DU | |
| wPrime 2.10 - 1024m | |
| Asus ROG Zephyrus G15 GA502DU | |
| Dell XPS 13 7390 Core i7-10710U | |
| Average Intel Core i7-9750H (n=1) | |
| MSI GE75 9SG | |
| Corsair One i160 | |
* ... smaller is better
| PCMark 8 | |
| Home Score Accelerated v2 | |
| Average Intel Core i7-9750H, NVIDIA GeForce GTX 1650 Max-Q (3548 - 4069, n=2) | |
| Dell XPS 15 7590 9980HK GTX 1650 | |
| Asus ZenBook 15 UX534FT-DB77 | |
| Lenovo IdeaPad S740-15IRH | |
| MSI Prestige 15 A10SC | |
| Lenovo Yoga 730-15IKB | |
| HP Spectre X360 15-5ZV31AV | |
| Work Score Accelerated v2 | |
| Asus ZenBook 15 UX534FT-DB77 | |
| Average Intel Core i7-9750H, NVIDIA GeForce GTX 1650 Max-Q (4555 - 5359, n=2) | |
| Dell XPS 15 7590 9980HK GTX 1650 | |
| HP Spectre X360 15-5ZV31AV | |
| Lenovo IdeaPad S740-15IRH | |
| MSI Prestige 15 A10SC | |
| Lenovo Yoga 730-15IKB | |
| PCMark 8 Home Score Accelerated v2 | 3548 points | |
| PCMark 8 Work Score Accelerated v2 | 4555 points | |
| PCMark 10 Score | 4629 points | |
Help | ||
| Lenovo IdeaPad S740-15IRH Samsung SSD PM981 MZVLB512HAJQ | Dell XPS 15 7590 9980HK GTX 1650 Toshiba XG6 KXG60ZNV1T02 | HP Spectre X360 15-5ZV31AV Intel SSD 660p 2TB SSDPEKNW020T8 | Lenovo Yoga 730-15IKB SK Hynix PC401 512GB M.2 (HFS512GD9TNG) | Asus ZenBook 15 UX534FT-DB77 Samsung SSD PM981 MZVLB1T0HALR | MSI Prestige 15 A10SC Samsung SSD PM981 MZVLB1T0HALR | |
|---|---|---|---|---|---|---|
| AS SSD | 4% | -24% | -26% | -4% | 4% | |
| Seq Read (MB/s) | 1791 | 1723 -4% | 1220 -32% | 2158 20% | 1887 5% | 1274 -29% |
| Seq Write (MB/s) | 1466 | 1386 -5% | 1152 -21% | 680 -54% | 1432 -2% | 1395 -5% |
| 4K Read (MB/s) | 47.24 | 43.25 -8% | 52.3 11% | 44.74 -5% | 52.3 11% | 50.3 6% |
| 4K Write (MB/s) | 96.9 | 98.3 1% | 146.6 51% | 123 27% | 146 51% | 119.8 24% |
| 4K-64 Read (MB/s) | 1077 | 1078 0% | 652 -39% | 623 -42% | 969 -10% | 1599 48% |
| 4K-64 Write (MB/s) | 1997 | 1456 -27% | 847 -58% | 486 -76% | 1375 -31% | 1455 -27% |
| Access Time Read * (ms) | 0.047 | 0.05 -6% | 0.077 -64% | 0.044 6% | 0.034 28% | 0.044 6% |
| Access Time Write * (ms) | 0.116 | 0.039 66% | 0.106 9% | 0.051 56% | 0.075 35% | 0.092 21% |
| Score Read (Points) | 1303 | 1294 -1% | 826 -37% | 884 -32% | 1210 -7% | 1777 36% |
| Score Write (Points) | 2241 | 1693 -24% | 1109 -51% | 677 -70% | 1664 -26% | 1714 -24% |
| Score Total (Points) | 4203 | 3638 -13% | 2371 -44% | 1951 -54% | 3483 -17% | 4411 5% |
| Copy ISO MB/s (MB/s) | 2127 | 3182 50% | 2070 -3% | 1641 -23% | 1375 -35% | 2830 33% |
| Copy Program MB/s (MB/s) | 828 | 984 19% | 571 -31% | 390 -53% | 468 -43% | 609 -26% |
| Copy Game MB/s (MB/s) | 1639 | 1824 11% | 1219 -26% | 574 -65% | 1287 -21% | 1424 -13% |
| CrystalDiskMark 5.2 / 6 | 5% | 1% | 12% | 13% | -5% | |
| Write 4K (MB/s) | 91.6 | 104.3 14% | 151.5 65% | 164.9 80% | 141.6 55% | 150.8 65% |
| Read 4K (MB/s) | 38.61 | 45.23 17% | 59.3 54% | 50.5 31% | 45.28 17% | 47.3 23% |
| Write Seq (MB/s) | 1991 | 1729 -13% | 1424 -28% | 1262 -37% | 1975 -1% | 981 -51% |
| Read Seq (MB/s) | 1827 | 1861 2% | 1609 -12% | 2054 12% | 2272 24% | 976 -47% |
| Write 4K Q32T1 (MB/s) | 490.3 | 509 4% | 393.6 -20% | 477.6 -3% | 458.6 -6% | 442.7 -10% |
| Read 4K Q32T1 (MB/s) | 292 | 388.5 33% | 369.4 27% | 550 88% | 391.4 34% | 499.7 71% |
| Write Seq Q32T1 (MB/s) | 2974 | 2813 -5% | 1946 -35% | 1400 -53% | 2393 -20% | 1706 -43% |
| Read Seq Q32T1 (MB/s) | 3449 | 2906 -16% | 1934 -44% | 2672 -23% | 3464 0% | 1758 -49% |
| Total Average (Program / Settings) | 5% /
4% | -12% /
-15% | -7% /
-12% | 5% /
2% | -1% /
1% |
* ... smaller is better

| 3DMark | |
| 1920x1080 Fire Strike Graphics | |
| Walmart EVOO Gaming 17 | |
| Schenker XMG Neo 15 XNE15M19 | |
| HP Omen 15-dc0015ng | |
| HP Gaming Pavilion 15-dk0009ng | |
| Asus Zephyrus S GX531GM | |
| MSI GT72S-6QEG16SR421BW | |
| Gainward GeForce GTX 1650 4 GB | |
| Lenovo IdeaPad S740-15IRH | |
| Average NVIDIA GeForce GTX 1650 Max-Q (6985 - 8618, n=12) | |
| HP Spectre x360 15-df0126ng | |
| Lenovo Yoga 730-15IKB | |
| Asus Zenbook 14 UX433FN-A6023T | |
| 2560x1440 Time Spy Graphics | |
| Walmart EVOO Gaming 17 | |
| Schenker XMG Neo 15 XNE15M19 | |
| HP Gaming Pavilion 15-dk0009ng | |
| HP Omen 15-dc0015ng | |
| Asus Zephyrus S GX531GM | |
| Gainward GeForce GTX 1650 4 GB | |
| Lenovo IdeaPad S740-15IRH | |
| Average NVIDIA GeForce GTX 1650 Max-Q (2836 - 3238, n=10) | |
| MSI GT72S-6QEG16SR421BW | |
| HP Spectre x360 15-df0126ng | |
| Lenovo Yoga 730-15IKB | |
| Asus Zenbook 14 UX433FN-A6023T | |
| 3DMark 11 | |
| 1280x720 Performance GPU | |
| Walmart EVOO Gaming 17 | |
| Schenker XMG Neo 15 XNE15M19 | |
| HP Omen 15-dc0015ng | |
| HP Gaming Pavilion 15-dk0009ng | |
| Gainward GeForce GTX 1650 4 GB | |
| Asus Zephyrus S GX531GM | |
| MSI GT72S-6QEG16SR421BW | |
| Lenovo IdeaPad S740-15IRH | |
| Average NVIDIA GeForce GTX 1650 Max-Q (10248 - 12259, n=14) | |
| HP Spectre x360 15-df0126ng | |
| Lenovo Yoga 730-15IKB | |
| Asus Zenbook 14 UX433FN-A6023T | |
| 1280x720 Performance Combined | |
| Walmart EVOO Gaming 17 | |
| HP Gaming Pavilion 15-dk0009ng | |
| HP Omen 15-dc0015ng | |
| Schenker XMG Neo 15 XNE15M19 | |
| Gainward GeForce GTX 1650 4 GB | |
| Lenovo IdeaPad S740-15IRH | |
| MSI GT72S-6QEG16SR421BW | |
| Average NVIDIA GeForce GTX 1650 Max-Q (6409 - 10846, n=13) | |
| HP Spectre x360 15-df0126ng | |
| Asus Zephyrus S GX531GM | |
| Lenovo Yoga 730-15IKB | |
| Asus Zenbook 14 UX433FN-A6023T | |
| 3DMark 11 Performance | 11966 points | |
| 3DMark Ice Storm Standard Score | 42968 points | |
| 3DMark Cloud Gate Standard Score | 25731 points | |
| 3DMark Fire Strike Score | 7545 points | |
| 3DMark Time Spy Score | 3373 points | |
Help | ||
| Shadow of the Tomb Raider - 1920x1080 Highest Preset AA:T | |
| MSI RTX 2060 Gaming Z 6G | |
| HP Pavilion Gaming 17-cd0085cl | |
| MSI GF65 9SD | |
| Asus TUF FX705GM | |
| Gainward GeForce GTX 1650 4 GB | |
| Lenovo IdeaPad S740-15IRH | |
| Asus G752VY | |
| Average NVIDIA GeForce GTX 1650 Max-Q (33 - 45, n=6) | |
| Asus TUF FX705GE-EW096T | |
| Xiaomi Mi Notebook Pro i7 | |
| The Witcher 3 - 1920x1080 Ultra Graphics & Postprocessing (HBAO+) | |
| MSI RTX 2060 Gaming Z 6G | |
| MSI GF65 9SD | |
| HP Pavilion Gaming 17-cd0085cl | |
| Gainward GeForce GTX 1650 4 GB | |
| Asus TUF FX705GM | |
| Dell G3 3590 | |
| Lenovo IdeaPad S740-15IRH | |
| Average NVIDIA GeForce GTX 1650 Max-Q (27.5 - 36.5, n=11) | |
| Asus TUF FX705GE-EW096T | |
| Xiaomi Mi Notebook Pro i7 | |
| low | med. | high | ultra | |
|---|---|---|---|---|
| BioShock Infinite (2013) | 323.6 | 238.3 | 206.8 | 81.7 |
| The Witcher 3 (2015) | 188 | 114.8 | 60.4 | 34.4 |
| Shadow of the Tomb Raider (2018) | 117 | 56 | 47 | 41 |
| Lenovo IdeaPad S740-15IRH GeForce GTX 1650 Max-Q, i7-9750H, Samsung SSD PM981 MZVLB512HAJQ | Dell XPS 15 7590 9980HK GTX 1650 GeForce GTX 1650 Mobile, i9-9980HK, Toshiba XG6 KXG60ZNV1T02 | HP Spectre X360 15-5ZV31AV GeForce MX250, i7-10510U, Intel SSD 660p 2TB SSDPEKNW020T8 | Lenovo Yoga 730-15IKB GeForce GTX 1050 Mobile, i5-8550U, SK Hynix PC401 512GB M.2 (HFS512GD9TNG) | Asus ZenBook 15 UX534FT-DB77 GeForce GTX 1650 Max-Q, i7-8565U, Samsung SSD PM981 MZVLB1T0HALR | MSI Prestige 15 A10SC GeForce GTX 1650 Max-Q, i7-10710U, Samsung SSD PM981 MZVLB1T0HALR | |
|---|---|---|---|---|---|---|
| Noise | -2% | 4% | 1% | 6% | 3% | |
| off / environment * (dB) | 28.5 | 28.2 1% | 30.1 -6% | 30.5 -7% | 28.4 -0% | 29.3 -3% |
| Idle Minimum * (dB) | 28.5 | 28.2 1% | 30.1 -6% | 30.5 -7% | 28.4 -0% | 30.1 -6% |
| Idle Average * (dB) | 28.5 | 28.2 1% | 30.1 -6% | 30.5 -7% | 28.4 -0% | 30.2 -6% |
| Idle Maximum * (dB) | 28.5 | 30.4 -7% | 30.1 -6% | 30.5 -7% | 28.4 -0% | 30.2 -6% |
| Load Average * (dB) | 45 | 43.8 3% | 30.1 33% | 37.5 17% | 33.9 25% | 31.5 30% |
| Witcher 3 ultra * (dB) | 43.9 | 47.2 -8% | 39.7 10% | 39.8 9% | 37 16% | |
| Load Maximum * (dB) | 44.7 | 47.2 -6% | 42 6% | 37.5 16% | 40.2 10% | 47 -5% |
* ... smaller is better
Noise level
| Idle |
| 28.5 / 28.5 / 28.5 dB(A) |
| Load |
| 45 / 44.7 dB(A) |
 | ||
30 dB silent 40 dB(A) audible 50 dB(A) loud |
||
min: | ||
(-) The maximum temperature on the upper side is 46.2 °C / 115 F, compared to the average of 36.8 °C / 98 F, ranging from 21 to 71 °C for the class Multimedia.
(-) The bottom heats up to a maximum of 50 °C / 122 F, compared to the average of 39.1 °C / 102 F
(+) In idle usage, the average temperature for the upper side is 31.2 °C / 88 F, compared to the device average of 31.3 °C / 88 F.
(±) Playing The Witcher 3, the average temperature for the upper side is 32.8 °C / 91 F, compared to the device average of 31.3 °C / 88 F.
(+) The palmrests and touchpad are cooler than skin temperature with a maximum of 30.2 °C / 86.4 F and are therefore cool to the touch.
(±) The average temperature of the palmrest area of similar devices was 28.7 °C / 83.7 F (-1.5 °C / -2.7 F).
Lenovo IdeaPad S740-15IRH audio analysis
(±) | speaker loudness is average but good (78.8 dB)
Bass 100 - 315 Hz
(±) | reduced bass - on average 10.8% lower than median
(-) | bass is not linear (15.2% delta to prev. frequency)
Mids 400 - 2000 Hz
(±) | higher mids - on average 5.1% higher than median
(±) | linearity of mids is average (7.2% delta to prev. frequency)
Highs 2 - 16 kHz
(+) | balanced highs - only 2.1% away from median
(±) | linearity of highs is average (11.3% delta to prev. frequency)
Overall 100 - 16.000 Hz
(±) | linearity of overall sound is average (18.5% difference to median)
Compared to same class
» 57% of all tested devices in this class were better, 7% similar, 36% worse
» The best had a delta of 5%, average was 17%, worst was 45%
Compared to all devices tested
» 42% of all tested devices were better, 8% similar, 51% worse
» The best had a delta of 4%, average was 23%, worst was 134%
Apple MacBook 12 (Early 2016) 1.1 GHz audio analysis
(+) | speakers can play relatively loud (83.6 dB)
Bass 100 - 315 Hz
(±) | reduced bass - on average 11.3% lower than median
(±) | linearity of bass is average (14.2% delta to prev. frequency)
Mids 400 - 2000 Hz
(+) | balanced mids - only 2.4% away from median
(+) | mids are linear (5.5% delta to prev. frequency)
Highs 2 - 16 kHz
(+) | balanced highs - only 2% away from median
(+) | highs are linear (4.5% delta to prev. frequency)
Overall 100 - 16.000 Hz
(+) | overall sound is linear (10.2% difference to median)
Compared to same class
» 7% of all tested devices in this class were better, 2% similar, 90% worse
» The best had a delta of 5%, average was 18%, worst was 53%
Compared to all devices tested
» 5% of all tested devices were better, 1% similar, 94% worse
» The best had a delta of 4%, average was 23%, worst was 134%
| Off / Standby | |
| Idle | |
| Load |
|
Key:
min: | |
| Lenovo IdeaPad S740-15IRH i7-9750H, GeForce GTX 1650 Max-Q, Samsung SSD PM981 MZVLB512HAJQ, IPS, 3840x2160, 15.6" | Dell XPS 15 7590 9980HK GTX 1650 i9-9980HK, GeForce GTX 1650 Mobile, Toshiba XG6 KXG60ZNV1T02, OLED, 3840x2160, 15.6" | HP Spectre X360 15-5ZV31AV i7-10510U, GeForce MX250, Intel SSD 660p 2TB SSDPEKNW020T8, IPS, 3840x2160, 15.6" | Lenovo Yoga 730-15IKB i5-8550U, GeForce GTX 1050 Mobile, SK Hynix PC401 512GB M.2 (HFS512GD9TNG), IPS, 3840x2160, 15.6" | Asus ZenBook 15 UX534FT-DB77 i7-8565U, GeForce GTX 1650 Max-Q, Samsung SSD PM981 MZVLB1T0HALR, IPS, 1920x1080, 15.6" | MSI Prestige 15 A10SC i7-10710U, GeForce GTX 1650 Max-Q, Samsung SSD PM981 MZVLB1T0HALR, IPS, 3840x2160, 15.6" | |
|---|---|---|---|---|---|---|
| Power Consumption | 31% | 56% | 61% | 41% | 43% | |
| Idle Minimum * (Watt) | 28.6 | 6.2 78% | 5.2 82% | 4.8 83% | 5 83% | 6.1 79% |
| Idle Average * (Watt) | 26.5 | 9.6 64% | 8.5 68% | 10.1 62% | 13.2 50% | 13.2 50% |
| Idle Maximum * (Watt) | 32.1 | 21.2 34% | 8.7 73% | 10.7 67% | 24 25% | 19.2 40% |
| Load Average * (Watt) | 112.2 | 104.3 7% | 65.6 42% | 44 61% | 70 38% | 75 33% |
| Witcher 3 ultra * (Watt) | 90.1 | 91.7 -2% | 56.5 37% | 63.3 30% | 74 18% | |
| Load Maximum * (Watt) | 138.8 | 135.3 3% | 92.4 33% | 94.7 32% | 114 18% | 89.7 35% |
* ... smaller is better
| Lenovo IdeaPad S740-15IRH i7-9750H, GeForce GTX 1650 Max-Q, 69 Wh | Dell XPS 15 7590 9980HK GTX 1650 i9-9980HK, GeForce GTX 1650 Mobile, 97 Wh | HP Spectre X360 15-5ZV31AV i7-10510U, GeForce MX250, 84 Wh | Lenovo Yoga 730-15IKB i5-8550U, GeForce GTX 1050 Mobile, 51.5 Wh | Asus ZenBook 15 UX534FT-DB77 i7-8565U, GeForce GTX 1650 Max-Q, 71 Wh | MSI Prestige 15 A10SC i7-10710U, GeForce GTX 1650 Max-Q, 82 Wh | |
|---|---|---|---|---|---|---|
| Battery runtime | 127% | 139% | -8% | 127% | 79% | |
| Reader / Idle (h) | 12.4 | 15.2 23% | 22.6 82% | 11.6 -6% | 21.5 73% | 19.1 54% |
| WiFi v1.3 (h) | 9 | 7.8 -13% | 10.8 20% | 6.2 -31% | 8.4 -7% | 7.6 -16% |
| Load (h) | 0.7 | 3.3 371% | 2.9 314% | 0.8 14% | 2.9 314% | 2.1 200% |
Pros
Cons
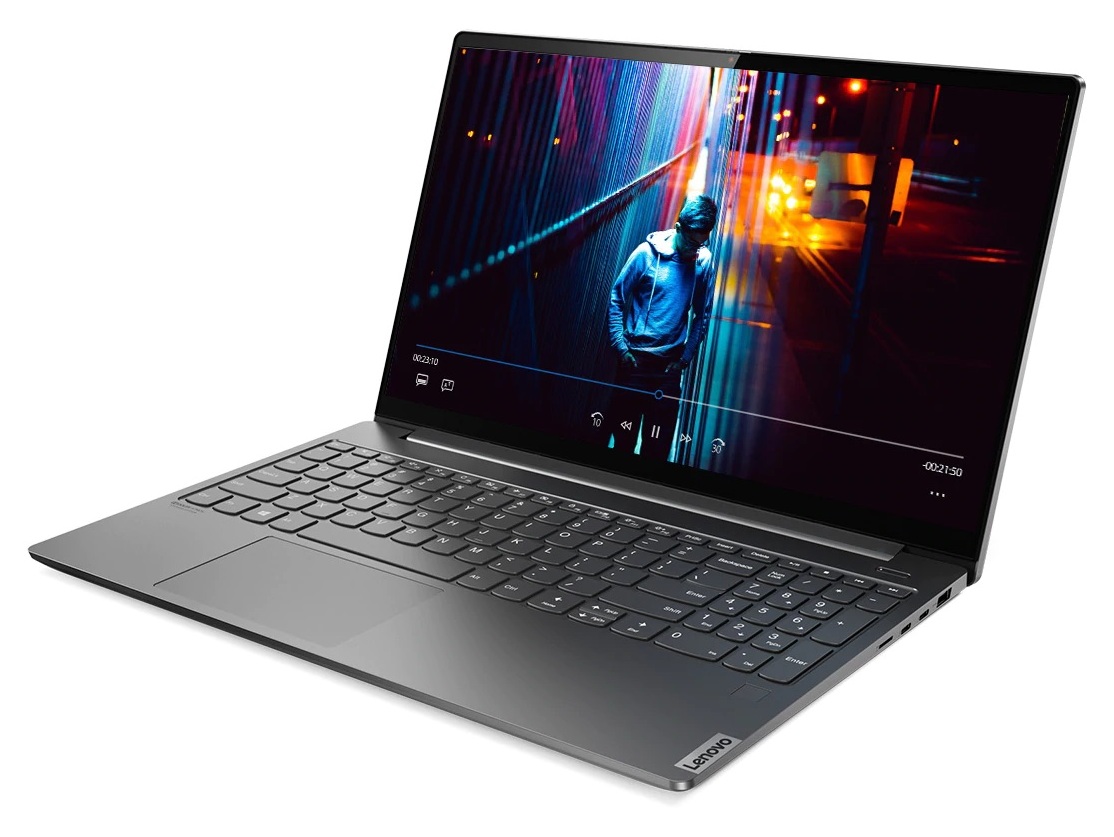
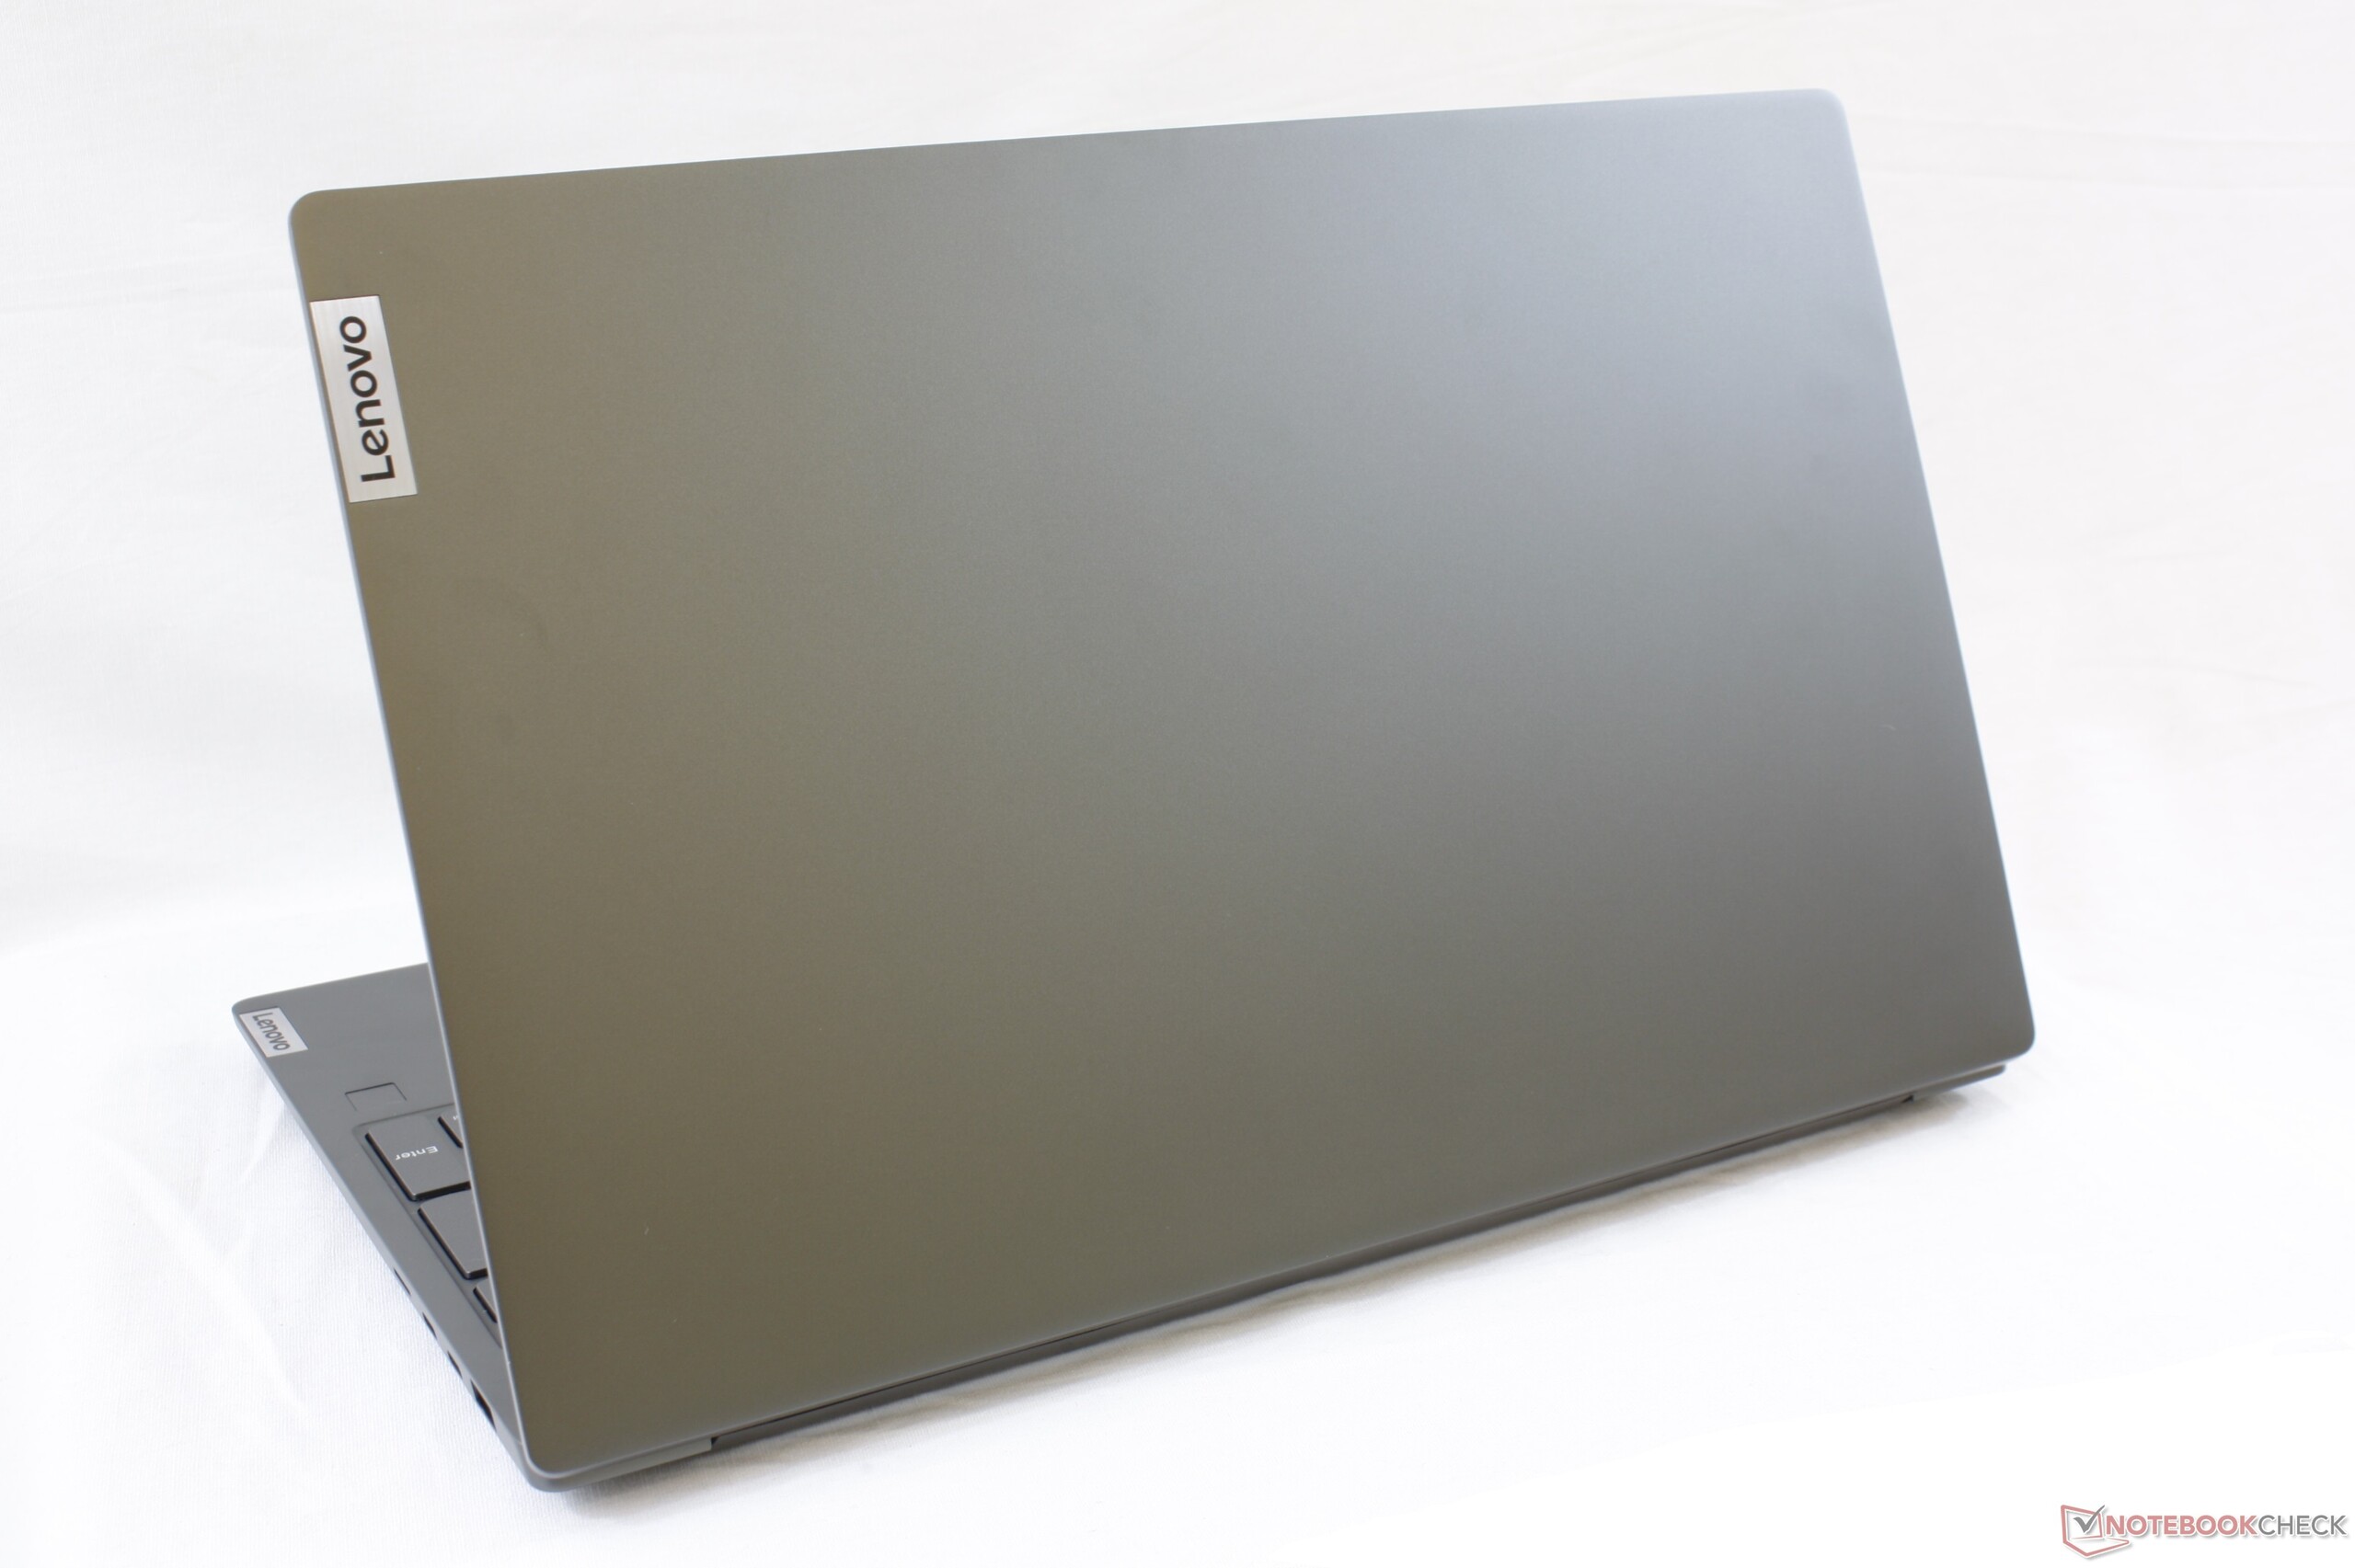
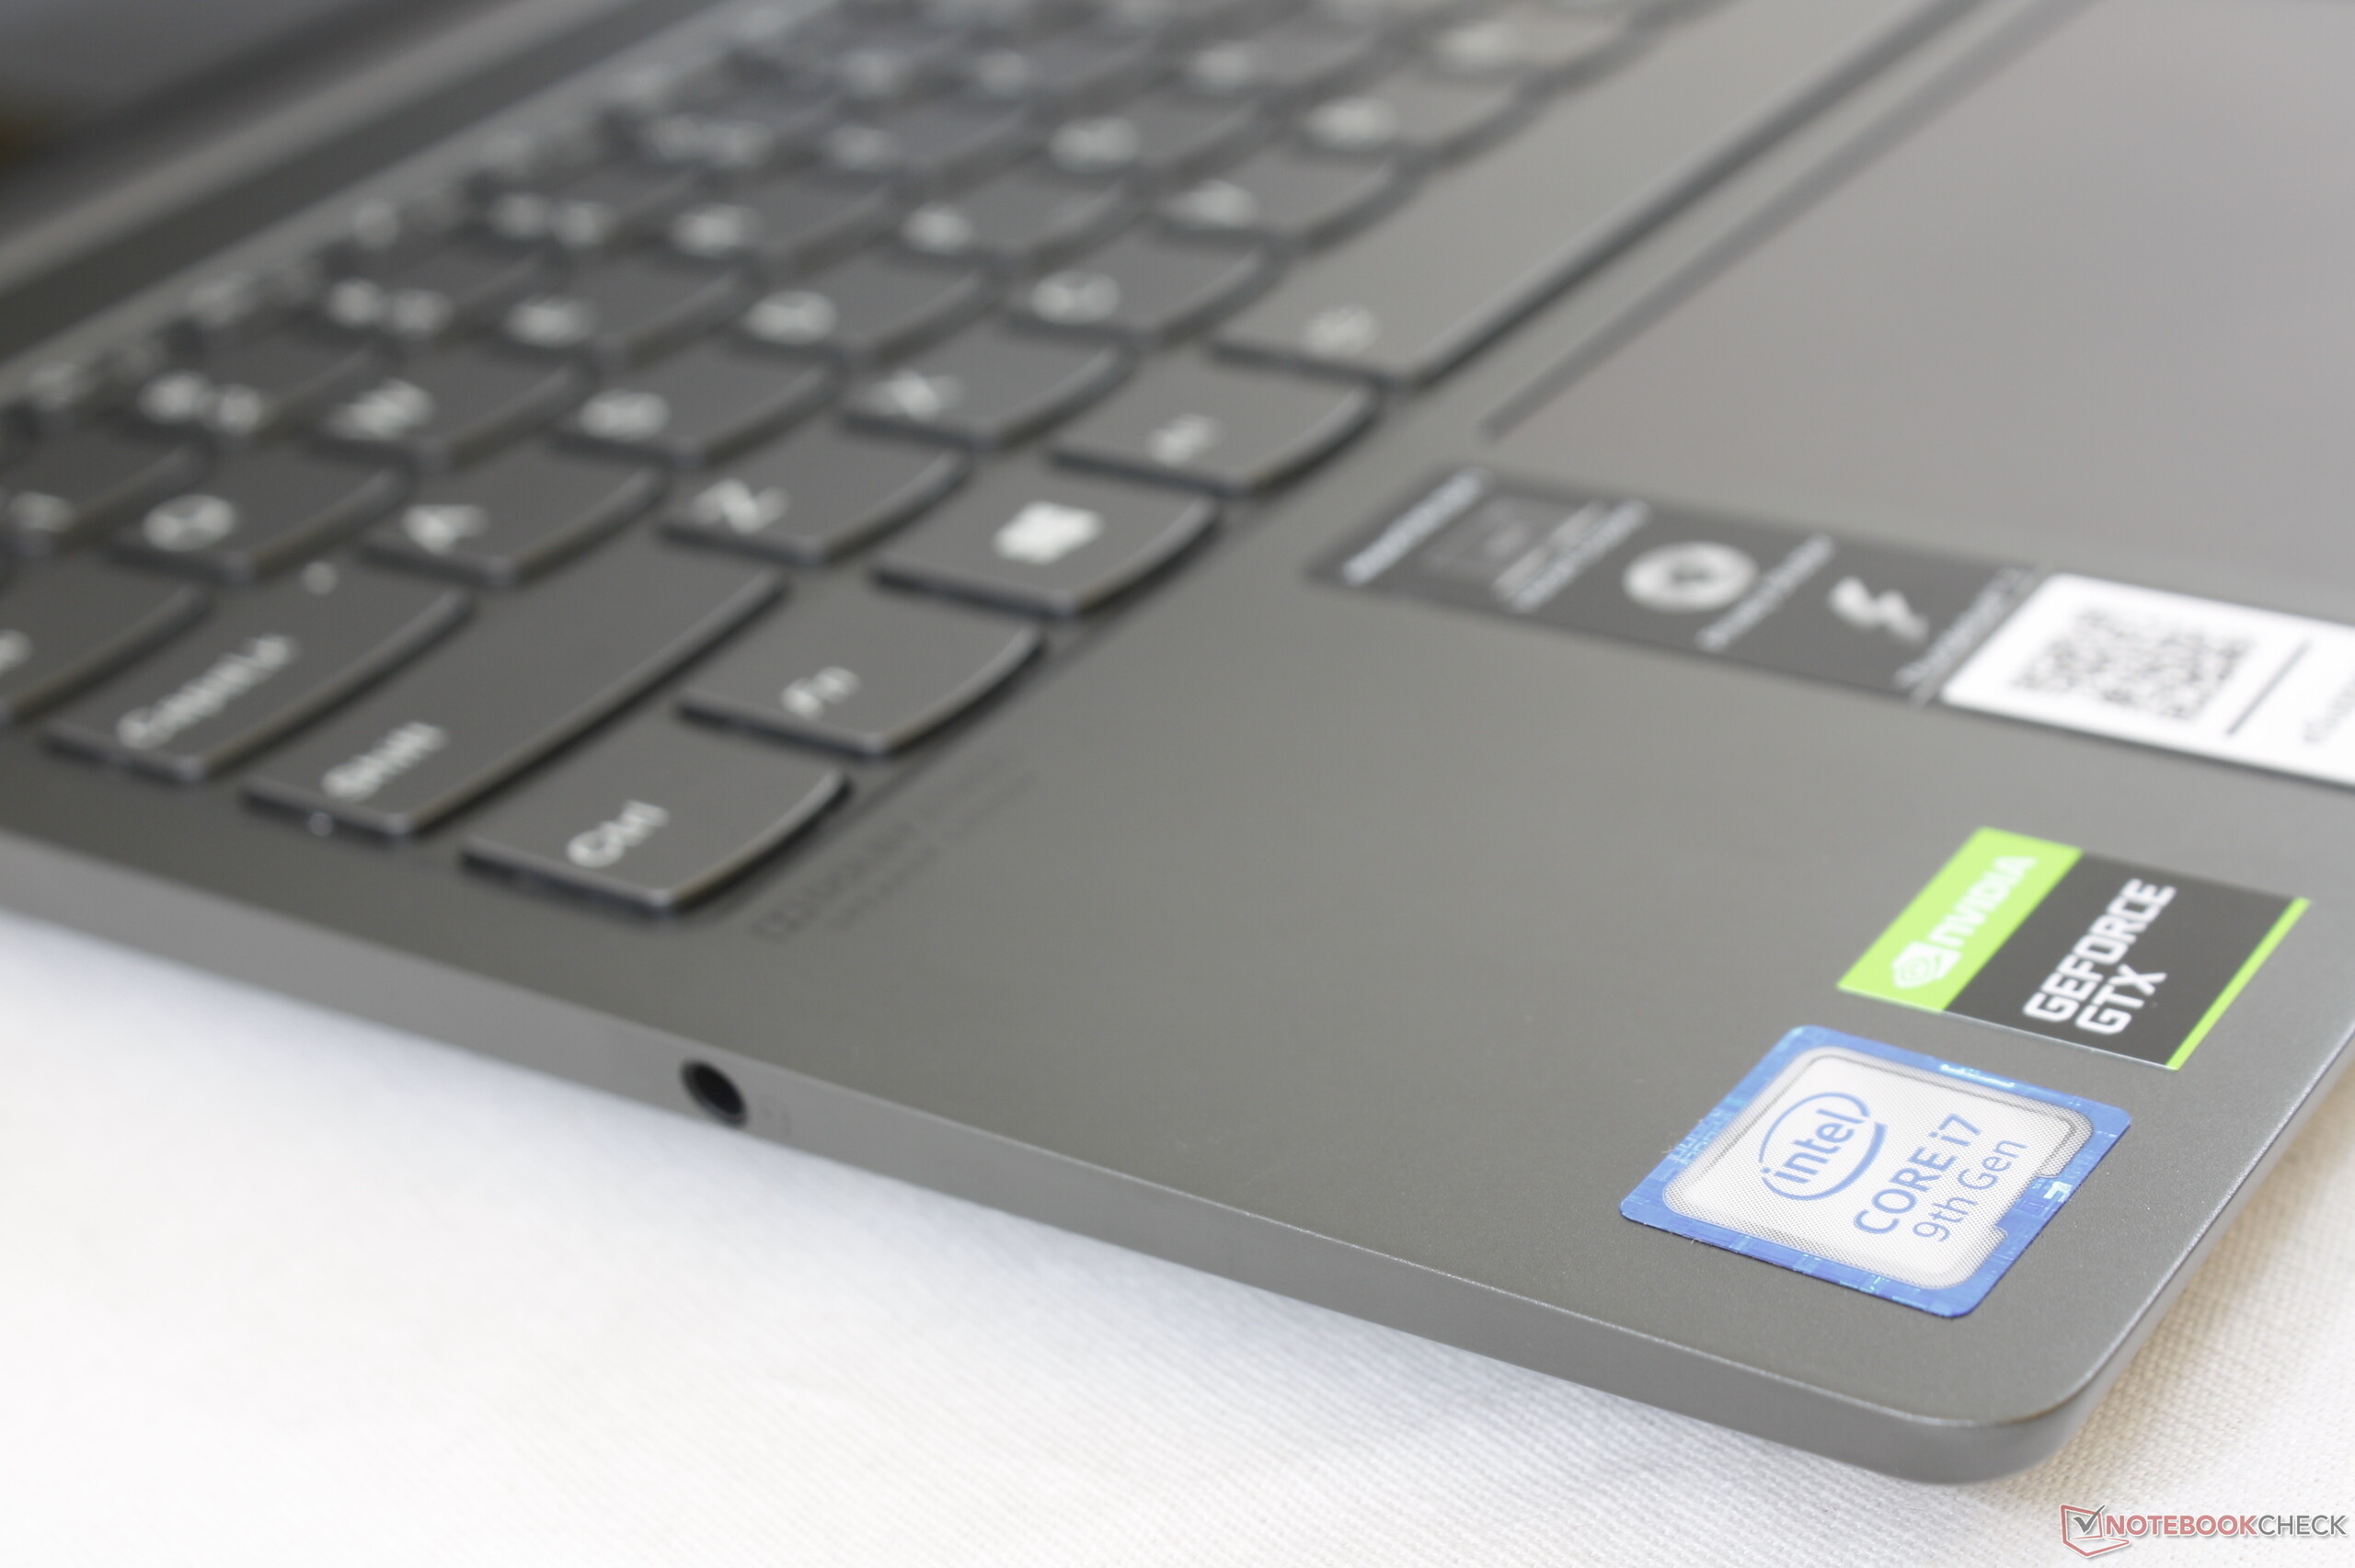
联想IdeaPad S740融合了中端和高端配置。i7 CPU,GeForce GTX GPU,明亮的4K UHD显示屏,三星SSD,双Thunderbolt 3端口和窄边框可与Lenovo试图模仿的Dell XPS 15和HP Spectre x360 15相媲美。同时,较浅的键盘,有限的接口选项和相对不牢的机身更能体现出IdeaPad的廉价属性。相比较配置相同的Core i7-9750H CPU和GTX 1650/1650 Max-Q GPU,Lenovo的价格要比Dell和HP低一些,但打字体验会较差,设计也会较差。
但是,与其他IdeaPad机型相比,S740在视觉和性能方面轻松成为同类产品中的佼佼者。它具有入门级游戏本的性能,而没有游戏本笨拙或花里胡哨的外观。因此,与价格范围内的许多其他替代方案相比,该系统在游戏,办公,便携和价格之间取得了更好的平衡。
比一般的IdeaPad贵,但比Dell XPS或HP Spectre便宜。 IdeaPad S740适用于那些希望在不牺牲外观和便携性和太多性能的情况下买到高端全能本的人。
Lenovo IdeaPad S740-15IRH
- 01/25/2020 v7 (old)
Allen Ngo
Price comparison

