华硕ZenBook 15 UX534FTC笔记本电脑评测:雾面屏续航王者
Rating | Date | Model | Weight | Height | Size | Resolution | Price |
|---|---|---|---|---|---|---|---|
| 85.2 % v7 (old) | 05 / 2020 | Asus ZenBook 15 UX534FTC-A8190T i7-10510U, GeForce GTX 1650 Max-Q | 1.6 kg | 18.9 mm | 15.60" | 1920x1080 | |
| 82.7 % v7 (old) | 07 / 2020 | Acer ConceptD 5 CN515-51-73Z7 i7-8705G, Vega M GL / 870 | 1.5 kg | 17 mm | 15.60" | 3840x2160 | |
| 87.8 % v7 (old) | 10 / 2019 | Dell XPS 15 7590 9980HK GTX 1650 i9-9980HK, GeForce GTX 1650 Mobile | 2 kg | 17 mm | 15.60" | 3840x2160 | |
| 89.7 % v7 (old) | 11 / 2019 | Apple MacBook Pro 16 2019 i9 5500M i9-9880H, Radeon Pro 5500M | 2 kg | 16.2 mm | 16.00" | 3072x1920 |
| SD Card Reader | |
| average JPG Copy Test (av. of 3 runs) | |
| Dell XPS 15 7590 9980HK GTX 1650 (Toshiba Exceria Pro SDXC 64 GB UHS-II) | |
| Average of class Multimedia (23 - 531, n=43, last 2 years) | |
| Asus ZenBook 15 UX534FTC-A8190T (Toshiba Exceria Pro SDXC 64 GB UHS-II) | |
| Asus ZenBook 15 UX534FT-DB77 (Toshiba Exceria Pro SDXC 64 GB UHS-II) | |
| Asus ZenBook 15 UX533FD (Toshiba Exceria Pro SDXC 64 GB UHS-II) | |
| Acer ConceptD 5 CN515-51-73Z7 (Toshiba Exceria Pro SDXC 64 GB UHS-II) | |
| maximum AS SSD Seq Read Test (1GB) | |
| Dell XPS 15 7590 9980HK GTX 1650 (Toshiba Exceria Pro SDXC 64 GB UHS-II) | |
| Average of class Multimedia (27.9 - 1455, n=42, last 2 years) | |
| Asus ZenBook 15 UX534FT-DB77 (Toshiba Exceria Pro SDXC 64 GB UHS-II) | |
| Asus ZenBook 15 UX533FD (Toshiba Exceria Pro SDXC 64 GB UHS-II) | |
| Acer ConceptD 5 CN515-51-73Z7 (Toshiba Exceria Pro SDXC 64 GB UHS-II) | |

| |||||||||||||||||||||||||
Brightness Distribution: 89 %
Center on Battery: 300 cd/m²
Contrast: 1424:1 (Black: 0.21 cd/m²)
ΔE ColorChecker Calman: 4.76 | ∀{0.5-29.43 Ø4.73}
ΔE Greyscale Calman: 3.53 | ∀{0.09-98 Ø4.97}
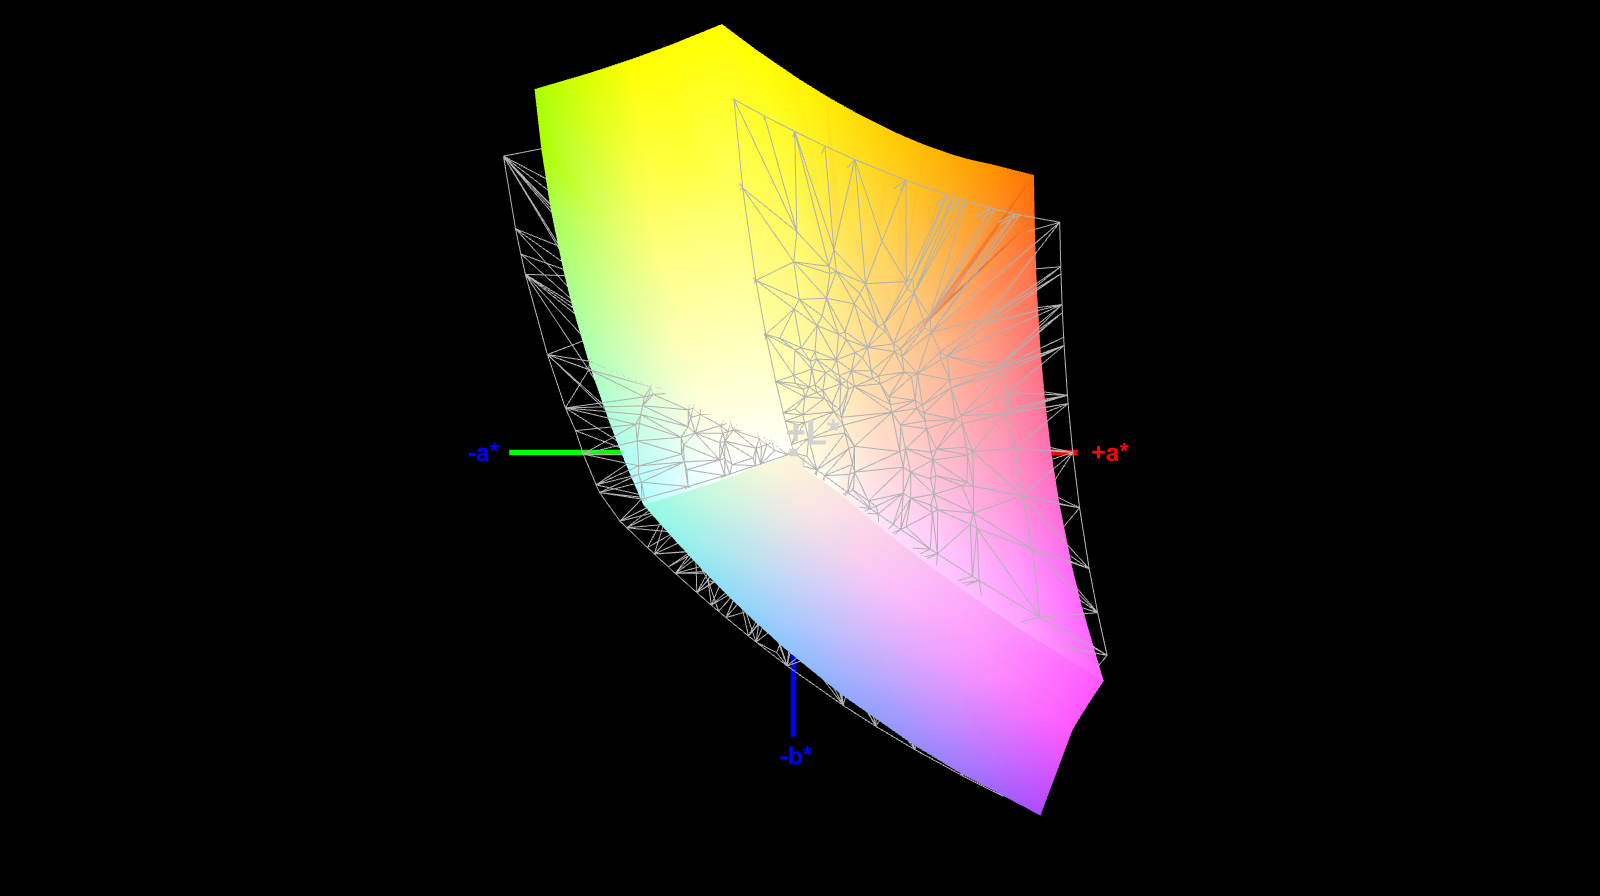
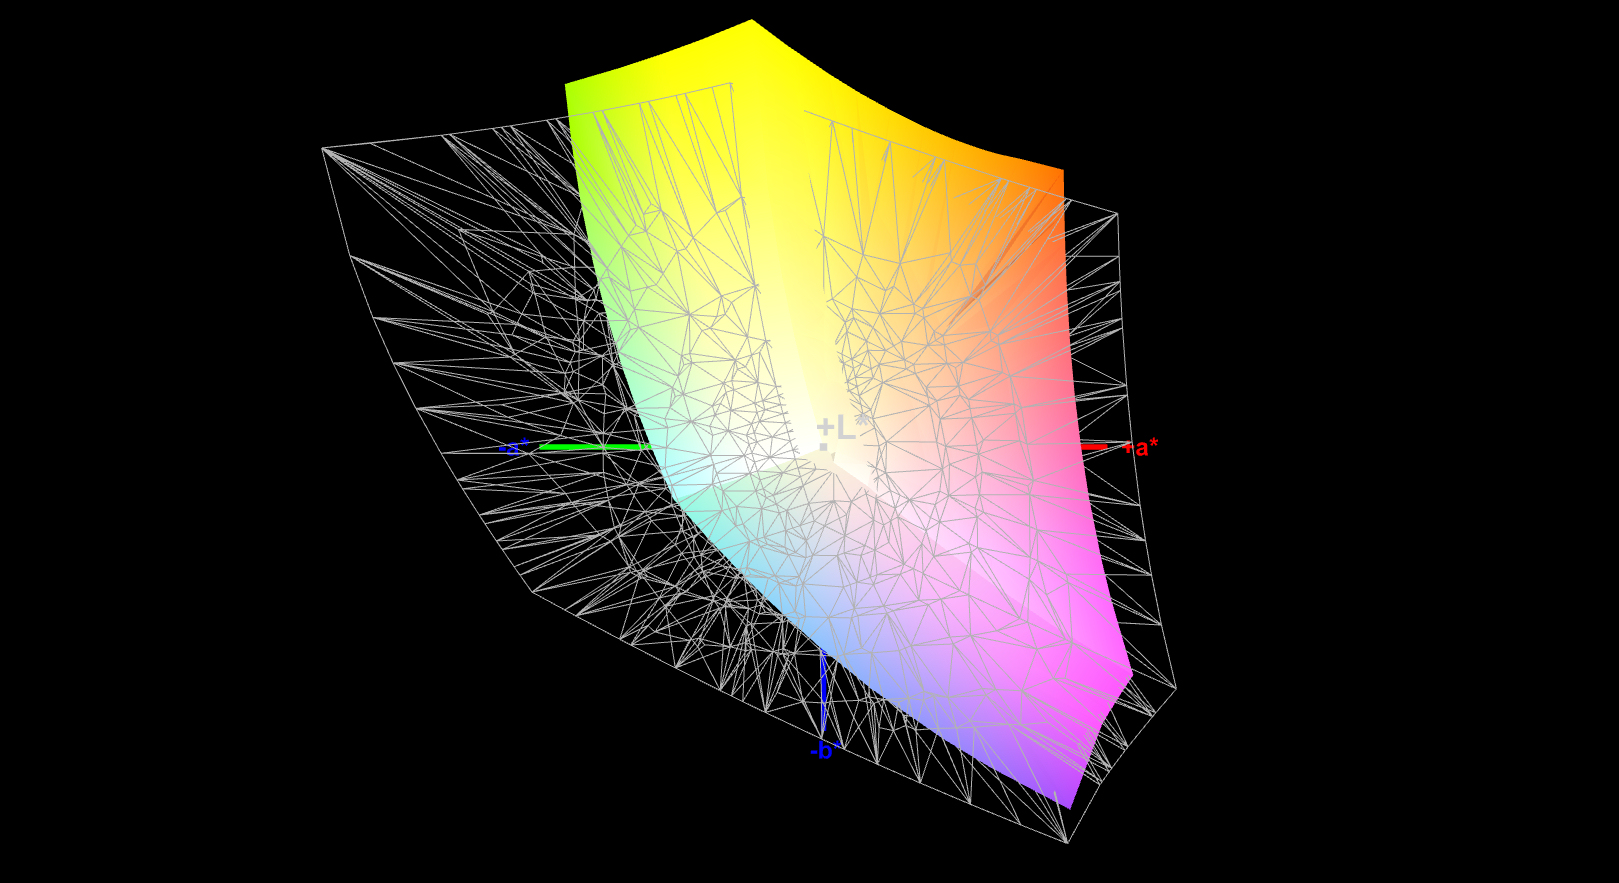
86% sRGB (Argyll 1.6.3 3D)
56% AdobeRGB 1998 (Argyll 1.6.3 3D)
62.9% AdobeRGB 1998 (Argyll 3D)
86.2% sRGB (Argyll 3D)
65% Display P3 (Argyll 3D)
Gamma: 2.3
CCT: 7228 K
| Asus ZenBook 15 UX534FTC-A8190T IPS, 1920x1080, 15.6" | Asus ZenBook 15 UX534FT-DB77 IPS, 1920x1080, 15.6" | Asus ZenBook 15 UX533FD IPS, 1920x1080, 15.6" | Acer ConceptD 5 CN515-51-73Z7 LTPS IPS LED, 3840x2160, 15.6" | Dell XPS 15 7590 9980HK GTX 1650 OLED, 3840x2160, 15.6" | Apple MacBook Pro 16 2019 i9 5500M IPS, 3072x1920, 16" | |
|---|---|---|---|---|---|---|
| Display | 2% | 3% | 35% | 33% | ||
| Display P3 Coverage (%) | 65 | 66.6 2% | 67.2 3% | 86.1 32% | 88.1 36% | |
| sRGB Coverage (%) | 86.2 | 87.7 2% | 88.4 3% | 100 16% | 99.6 16% | |
| AdobeRGB 1998 Coverage (%) | 62.9 | 64.1 2% | 64.6 3% | 99.2 58% | 91.8 46% | |
| Response Times | 2% | -8% | -33% | 94% | -13% | |
| Response Time Grey 50% / Grey 80% * (ms) | 45 ? | 41.2 ? 8% | 45 ? -0% | 63 ? -40% | 2.3 ? 95% | 52.4 ? -16% |
| Response Time Black / White * (ms) | 32 ? | 33.2 ? -4% | 37 ? -16% | 40 ? -25% | 2.4 ? 92% | 34.9 ? -9% |
| PWM Frequency (Hz) | 59.5 ? | 131700 | ||||
| Screen | -14% | -6% | 5% | 15% | 27% | |
| Brightness middle (cd/m²) | 299 | 312.6 5% | 311 4% | 350 17% | 421.2 41% | 519 74% |
| Brightness (cd/m²) | 280 | 290 4% | 303 8% | 329 18% | 417 49% | 477 70% |
| Brightness Distribution (%) | 89 | 85 -4% | 81 -9% | 86 -3% | 94 6% | 86 -3% |
| Black Level * (cd/m²) | 0.21 | 0.31 -48% | 0.24 -14% | 0.265 -26% | 0.39 -86% | |
| Contrast (:1) | 1424 | 1008 -29% | 1296 -9% | 1321 -7% | 1331 -7% | |
| Colorchecker dE 2000 * | 4.76 | 5.78 -21% | 5.1 -7% | 5.08 -7% | 6.06 -27% | 2.28 52% |
| Colorchecker dE 2000 max. * | 9 | 8.86 2% | 8.91 1% | 10.25 -14% | 11.89 -32% | 6.54 27% |
| Greyscale dE 2000 * | 3.53 | 5.4 -53% | 4.93 -40% | 3.62 -3% | 2.8 21% | 0.9 75% |
| Gamma | 2.3 96% | 2.21 100% | 2.44 90% | 2.27 97% | 2.15 102% | 2145 0% |
| CCT | 7228 90% | 7864 83% | 7641 85% | 6389 102% | 6235 104% | 6572 99% |
| Color Space (Percent of AdobeRGB 1998) (%) | 56 | 57.1 2% | 58 4% | 88 57% | 81 45% | 78 39% |
| Color Space (Percent of sRGB) (%) | 86 | 87.4 2% | 88 2% | 100 16% | 99.6 16% | |
| Colorchecker dE 2000 calibrated * | 3.78 | 2.48 | 4.38 | 0.86 | ||
| Total Average (Program / Settings) | -3% /
-9% | -4% /
-4% | 2% /
6% | 47% /
31% | 7% /
20% |
* ... smaller is better
Display Response Times
| ↔ Response Time Black to White | ||
|---|---|---|
| 32 ms ... rise ↗ and fall ↘ combined | ↗ 18 ms rise | 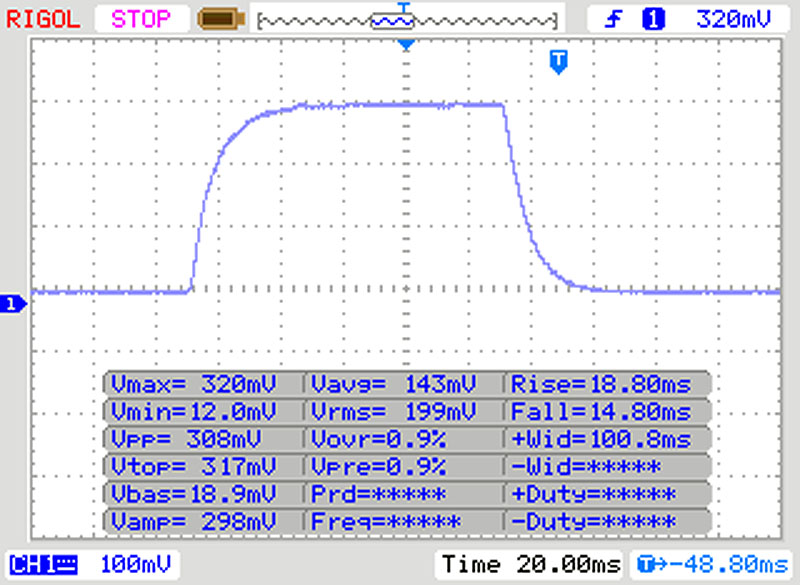 |
| ↘ 14 ms fall | ||
| The screen shows slow response rates in our tests and will be unsatisfactory for gamers. In comparison, all tested devices range from 0.1 (minimum) to 240 (maximum) ms. » 86 % of all devices are better. This means that the measured response time is worse than the average of all tested devices (19.9 ms). | ||
| ↔ Response Time 50% Grey to 80% Grey | ||
| 45 ms ... rise ↗ and fall ↘ combined | ↗ 24 ms rise | 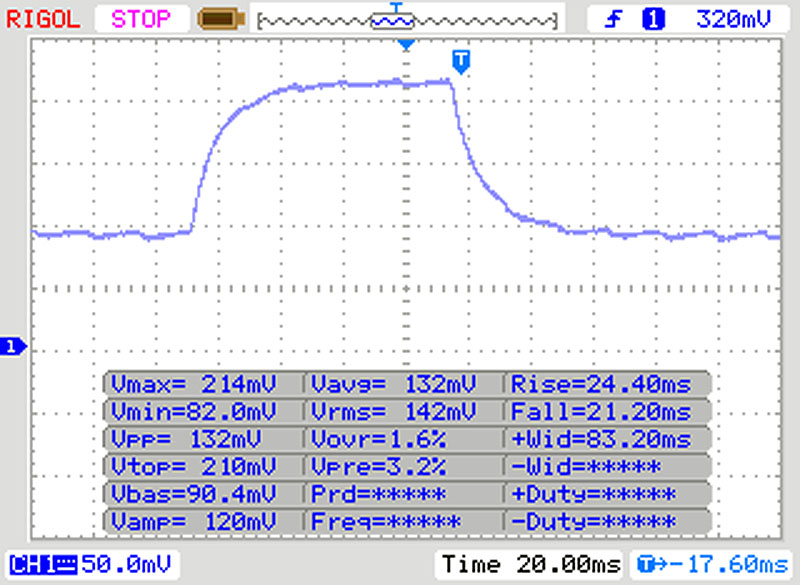 |
| ↘ 21 ms fall | ||
| The screen shows slow response rates in our tests and will be unsatisfactory for gamers. In comparison, all tested devices range from 0.165 (minimum) to 636 (maximum) ms. » 77 % of all devices are better. This means that the measured response time is worse than the average of all tested devices (31.1 ms). | ||
Screen Flickering / PWM (Pulse-Width Modulation)
| Screen flickering / PWM not detected | 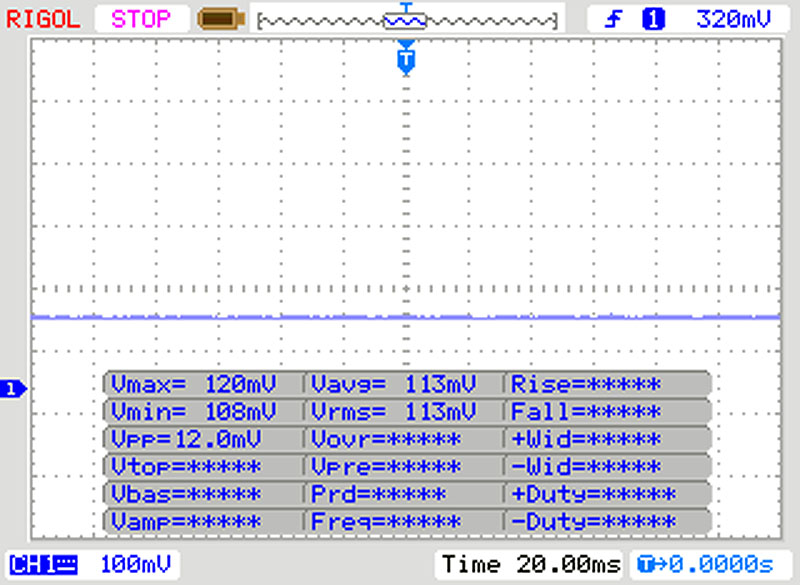 | ||
In comparison: 52 % of all tested devices do not use PWM to dim the display. If PWM was detected, an average of 7791 (minimum: 5 - maximum: 343500) Hz was measured. | |||
| Geekbench 3 | |
| 32 Bit Multi-Core Score | |
| Average Intel Core i7-10510U (16742 - 16838, n=2) | |
| Asus ZenBook 15 UX534FTC-A8190T | |
| 32 Bit Single-Core Score | |
| Average Intel Core i7-10510U (4369 - 4485, n=2) | |
| Asus ZenBook 15 UX534FTC-A8190T | |
| Geekbench 4.4 | |
| 64 Bit Multi-Core Score | |
| Average of class Multimedia (n=1last 2 years) | |
| Apple MacBook Pro 16 2019 i9 5500M (macOS 10.15.1) | |
| Apple MacBook Pro 16 2019 i9 5500M (Win 10) | |
| Asus ZenBook 15 UX534FTC-A8190T | |
| Average Intel Core i7-10510U (13116 - 18364, n=14) | |
| 64 Bit Single-Core Score | |
| Average of class Multimedia (n=1last 2 years) | |
| Apple MacBook Pro 16 2019 i9 5500M (macOS 10.15.1) | |
| Apple MacBook Pro 16 2019 i9 5500M (Win 10) | |
| Average Intel Core i7-10510U (4976 - 5832, n=14) | |
| Asus ZenBook 15 UX534FTC-A8190T | |
| Geekbench 5.0 | |
| 5.0 Multi-Core | |
| Apple MacBook Pro 16 2019 i9 5500M (Win 10) | |
| Apple MacBook Pro 16 2019 i9 5500M (mac OS 15.1.0) | |
| Asus ZenBook 15 UX534FTC-A8190T | |
| Average Intel Core i7-10510U (3143 - 4476, n=12) | |
| 5.0 Single-Core | |
| Apple MacBook Pro 16 2019 i9 5500M (mac OS 15.1.0) | |
| Apple MacBook Pro 16 2019 i9 5500M (Win 10) | |
| Average Intel Core i7-10510U (1118 - 1278, n=12) | |
| Asus ZenBook 15 UX534FTC-A8190T | |
| Mozilla Kraken 1.1 - Total | |
| Acer ConceptD 5 CN515-51-73Z7 (Edge) | |
| Asus ZenBook 15 UX534FT-DB77 (Edge 44.17763.1.0) | |
| Asus ZenBook 15 UX534FTC-A8190T (Edge 44) | |
| Dell XPS 15 7590 9980HK GTX 1650 (Edge 44.18362.267.0) | |
| Apple MacBook Pro 16 2019 i9 5500M (Win 10 Chrome 82) | |
| Average Intel Core i7-10510U (742 - 1184, n=36) | |
| Asus ZenBook 15 UX533FD | |
| Average of class Multimedia (228 - 835, n=74, last 2 years) | |
| Octane V2 - Total Score | |
| Average of class Multimedia (64079 - 153175, n=35, last 2 years) | |
| Asus ZenBook 15 UX533FD | |
| Average Intel Core i7-10510U (31505 - 51741, n=17) | |
| Dell XPS 15 7590 9980HK GTX 1650 (Edge 44.18362.267.0) | |
| Asus ZenBook 15 UX534FTC-A8190T (Edge 44) | |
| Asus ZenBook 15 UX534FT-DB77 (Edge 44.17763.1.0) | |
| Acer ConceptD 5 CN515-51-73Z7 (Edge) | |
| JetStream 1.1 - 1.1 Total | |
| Average of class Multimedia (482 - 711, n=2, last 2 years) | |
| Dell XPS 15 7590 9980HK GTX 1650 (Edge 44.18362.267.0) | |
| Asus ZenBook 15 UX534FTC-A8190T (Edge 44) | |
| Asus ZenBook 15 UX534FT-DB77 (Edge 44.17763.1.0) | |
| Average Intel Core i7-10510U (142.6 - 296, n=15) | |
| Asus ZenBook 15 UX533FD | |
* ... smaller is better
| PCMark 8 Home Score Accelerated v2 | 3761 points | |
| PCMark 8 Creative Score Accelerated v2 | 3959 points | |
| PCMark 8 Work Score Accelerated v2 | 5265 points | |
| PCMark 10 Score | 4490 points | |
Help | ||

| Asus ZenBook 15 UX534FTC-A8190T Samsung SSD PM981 MZVLB1T0HALR | Asus ZenBook 15 UX534FT-DB77 Samsung SSD PM981 MZVLB1T0HALR | Acer ConceptD 5 CN515-51-73Z7 WDC PC SN720 SDAPNTW-512G | Dell XPS 15 7590 9980HK GTX 1650 Toshiba XG6 KXG60ZNV1T02 | Asus ZenBook 15 UX533FD WDC PC SN520 SDAPNUW-512G | Apple MacBook Pro 16 2019 i9 5500M Apple SSD AP1024 7171 | Average Samsung SSD PM981 MZVLB1T0HALR | |
|---|---|---|---|---|---|---|---|
| CrystalDiskMark 5.2 / 6 | 0% | -6% | -5% | -29% | -12% | -2% | |
| Write 4K (MB/s) | 138.1 | 141.6 3% | 120.6 -13% | 104.3 -24% | 126.2 -9% | 55.5 -60% | 165.7 ? 20% |
| Read 4K (MB/s) | 45.89 | 45.28 -1% | 41.43 -10% | 45.23 -1% | 41.2 -10% | 16.21 -65% | 44.6 ? -3% |
| Write Seq (MB/s) | 2147 | 1975 -8% | 2402 12% | 1729 -19% | 1055 -51% | 1959 -9% | 1982 ? -8% |
| Read Seq (MB/s) | 2188 | 2272 4% | 1997 -9% | 1861 -15% | 884 -60% | 1763 -19% | 1764 ? -19% |
| Write 4K Q32T1 (MB/s) | 427.8 | 458.6 7% | 335.2 -22% | 509 19% | 445.5 4% | 398.5 -7% | 395 ? -8% |
| Read 4K Q32T1 (MB/s) | 404 | 391.4 -3% | 381.7 -6% | 388.5 -4% | 338.8 -16% | 648 60% | 434 ? 7% |
| Write Seq Q32T1 (MB/s) | 2396 | 2393 0% | 2553 7% | 2813 17% | 1453 -39% | 2727 14% | 2351 ? -2% |
| Read Seq Q32T1 (MB/s) | 3454 | 3464 0% | 3356 -3% | 2906 -16% | 1734 -50% | 3242 -6% | 3234 ? -6% |
| 3DMark 06 Standard Score | 32594 points | |
| 3DMark 11 Performance | 10585 points | |
| 3DMark Ice Storm Standard Score | 88439 points | |
| 3DMark Cloud Gate Standard Score | 22796 points | |
| 3DMark Fire Strike Score | 6906 points | |
| 3DMark Time Spy Score | 2945 points | |
Help | ||
| BioShock Infinite - 1920x1080 Ultra Preset, DX11 (DDOF) | |
| Average NVIDIA GeForce GTX 1650 Max-Q (70.2 - 84.3, n=7) | |
| Asus ZenBook 15 UX534FTC-A8190T | |
| Asus ZenBook 15 UX534FT-DB77 | |
| Dell XPS 15 7590 9980HK GTX 1650 | |
| Acer ConceptD 5 CN515-51-73Z7 | |
| Asus ZenBook 15 UX533FD | |
| The Witcher 3 - 1920x1080 Ultra Graphics & Postprocessing (HBAO+) | |
| Average of class Multimedia (11 - 121, n=13, last 2 years) | |
| Apple MacBook Pro 16 2019 i9 5500M | |
| Dell XPS 15 7590 9980HK GTX 1650 | |
| Average NVIDIA GeForce GTX 1650 Max-Q (27.5 - 36.5, n=11) | |
| Asus ZenBook 15 UX534FT-DB77 | |
| Asus ZenBook 15 UX533FD | |
| Asus ZenBook 15 UX534FTC-A8190T | |
| Acer ConceptD 5 CN515-51-73Z7 | |
| Apex Legends - 1920x1080 Maximum Settings AA:TS AF:16x | |
| Apple MacBook Pro 16 2019 i9 5500M | |
| Asus ZenBook 15 UX534FTC-A8190T | |
| Average NVIDIA GeForce GTX 1650 Max-Q (54.3 - 59.1, n=3) | |
| Need for Speed Heat - 1920x1080 High Preset | |
| Apple MacBook Pro 16 2019 i9 5500M | |
| Average NVIDIA GeForce GTX 1650 Max-Q (44 - 46.8, n=2) | |
| Asus ZenBook 15 UX534FTC-A8190T | |
| low | med. | high | ultra | |
|---|---|---|---|---|
| Counter-Strike: GO (2012) | 309.6 | 294.4 | 258.6 | 166.6 |
| Tomb Raider (2013) | 367.2 | 253.9 | 191.5 | 92.7 |
| BioShock Infinite (2013) | 286.7 | 208.1 | 182 | 72.7 |
| GTA V (2015) | 162.7 | 142.8 | 76.5 | 36 |
| The Witcher 3 (2015) | 144.6 | 87.2 | 48.7 | 28.1 |
| Batman: Arkham Knight (2015) | 121 | 75 | 64 | 38 |
| Dota 2 Reborn (2015) | 158.2 | 130.9 | 128 | 101.7 |
| World of Warships (2015) | 179 | 144.1 | 117.7 | 104.2 |
| Ashes of the Singularity (2016) | 60.3 | 42.5 | 36.9 | |
| Rocket League (2017) | 249.4 | 193.9 | 131 | |
| World of Tanks enCore (2018) | 414.6 | 160.1 | 59.4 | |
| Far Cry 5 (2018) | 91 | 52 | 48 | 45 |
| Forza Horizon 4 (2018) | 112 | 74 | 69 | 55 |
| Apex Legends (2019) | 143.9 | 78.7 | 59.4 | 59.1 |
| Anthem (2019) | 51.3 | 44.6 | 40.9 | 30.3 |
| Total War: Three Kingdoms (2019) | 150.1 | 52.4 | 31.9 | 23 |
| Control (2019) | 102.8 | 36.1 | 26.3 | |
| Borderlands 3 (2019) | 103.1 | 50.5 | 33.2 | 25.1 |
| FIFA 20 (2019) | 198.6 | 127.9 | 121.5 | 117.7 |
| Ghost Recon Breakpoint (2019) | 75 | 43 | 41 | 24 |
| GRID 2019 (2019) | 121.5 | 60 | 47.6 | 35.2 |
| Call of Duty Modern Warfare 2019 (2019) | 85 | 54.8 | 44.1 | 38.4 |
| Need for Speed Heat (2019) | 68.9 | 50.6 | 44 | 40.6 |
| Red Dead Redemption 2 (2019) | 54.4 | 40.1 | 26.5 | 16.2 |
| Hunt Showdown (2020) | 114.8 | 45.6 | 35.3 |
Noise level
| Idle |
| 30.3 / 30.3 / 30.9 dB(A) |
| Load |
| 31.3 / 38.2 dB(A) |
 | ||
30 dB silent 40 dB(A) audible 50 dB(A) loud |
||
min: | ||
| Asus ZenBook 15 UX534FTC-A8190T i7-10510U, GeForce GTX 1650 Max-Q | Asus ZenBook 15 UX534FT-DB77 i7-8565U, GeForce GTX 1650 Max-Q | Acer ConceptD 5 CN515-51-73Z7 i7-8705G, Vega M GL / 870 | Dell XPS 15 7590 9980HK GTX 1650 i9-9980HK, GeForce GTX 1650 Mobile | Asus ZenBook 15 UX533FD i7-8565U, GeForce GTX 1050 Max-Q | Apple MacBook Pro 16 2019 i9 5500M i9-9880H, Radeon Pro 5500M | Average NVIDIA GeForce GTX 1650 Max-Q | Average of class Multimedia | |
|---|---|---|---|---|---|---|---|---|
| Noise | 1% | -1% | -9% | -7% | -10% | -5% | 5% | |
| off / environment * (dB) | 30.3 | 28.4 6% | 30.3 -0% | 28.2 7% | 30.5 -1% | 29.8 2% | 29.6 ? 2% | 24.2 ? 20% |
| Idle Minimum * (dB) | 30.3 | 28.4 6% | 30.3 -0% | 28.2 7% | 30.5 -1% | 29.9 1% | 30.2 ? -0% | 24.4 ? 19% |
| Idle Average * (dB) | 30.3 | 28.4 6% | 30.3 -0% | 28.2 7% | 30.5 -1% | 29.9 1% | 30.4 ? -0% | 24.8 ? 18% |
| Idle Maximum * (dB) | 30.9 | 28.4 8% | 30.3 2% | 30.4 2% | 30.5 1% | 29.9 3% | 30.9 ? -0% | 26.5 ? 14% |
| Load Average * (dB) | 31.3 | 33.9 -8% | 32.6 -4% | 43.8 -40% | 40.8 -30% | 43 -37% | 38.2 ? -22% | 37.6 ? -20% |
| Witcher 3 ultra * (dB) | 38.1 | 39.8 -4% | 47.2 -24% | 45.4 -19% | ||||
| Load Maximum * (dB) | 38.2 | 40.2 -5% | 40.2 -5% | 47.2 -24% | 41.8 -9% | 46.1 -21% | 41.2 ? -8% | 45.9 ? -20% |
* ... smaller is better
(±) The maximum temperature on the upper side is 41.4 °C / 107 F, compared to the average of 36.8 °C / 98 F, ranging from 21 to 71 °C for the class Multimedia.
(±) The bottom heats up to a maximum of 40.3 °C / 105 F, compared to the average of 39.1 °C / 102 F
(+) In idle usage, the average temperature for the upper side is 24.3 °C / 76 F, compared to the device average of 31.3 °C / 88 F.
(±) Playing The Witcher 3, the average temperature for the upper side is 34.3 °C / 94 F, compared to the device average of 31.3 °C / 88 F.
(+) The palmrests and touchpad are cooler than skin temperature with a maximum of 30.2 °C / 86.4 F and are therefore cool to the touch.
(±) The average temperature of the palmrest area of similar devices was 28.7 °C / 83.7 F (-1.5 °C / -2.7 F).
| Asus ZenBook 15 UX534FTC-A8190T i7-10510U, GeForce GTX 1650 Max-Q | Asus ZenBook 15 UX534FT-DB77 i7-8565U, GeForce GTX 1650 Max-Q | Acer ConceptD 5 CN515-51-73Z7 i7-8705G, Vega M GL / 870 | Dell XPS 15 7590 9980HK GTX 1650 i9-9980HK, GeForce GTX 1650 Mobile | Asus ZenBook 15 UX533FD i7-8565U, GeForce GTX 1050 Max-Q | Apple MacBook Pro 16 2019 i9 5500M i9-9880H, Radeon Pro 5500M | Average NVIDIA GeForce GTX 1650 Max-Q | Average of class Multimedia | |
|---|---|---|---|---|---|---|---|---|
| Heat | -33% | -6% | -30% | -7% | 3% | -18% | -6% | |
| Maximum Upper Side * (°C) | 41.4 | 45.4 -10% | 44.6 -8% | 50.4 -22% | 47.2 -14% | 42 -1% | 47.4 ? -14% | 41.5 ? -0% |
| Maximum Bottom * (°C) | 40.3 | 51.6 -28% | 45.4 -13% | 49.2 -22% | 43.2 -7% | 38 6% | 49.4 ? -23% | 44.1 ? -9% |
| Idle Upper Side * (°C) | 25.7 | 35.4 -38% | 26.1 -2% | 34.8 -35% | 27.7 -8% | 25 3% | 29.9 ? -16% | 27.1 ? -5% |
| Idle Bottom * (°C) | 25.8 | 40 -55% | 26.4 -2% | 36.4 -41% | 25.6 1% | 25 3% | 30.8 ? -19% | 28 ? -9% |
* ... smaller is better
Asus ZenBook 15 UX534FTC-A8190T audio analysis
(-) | not very loud speakers (63.8 dB)
Bass 100 - 315 Hz
(-) | nearly no bass - on average 16.8% lower than median
(±) | linearity of bass is average (13.7% delta to prev. frequency)
Mids 400 - 2000 Hz
(+) | balanced mids - only 4.9% away from median
(+) | mids are linear (6.1% delta to prev. frequency)
Highs 2 - 16 kHz
(+) | balanced highs - only 1.5% away from median
(+) | highs are linear (4.7% delta to prev. frequency)
Overall 100 - 16.000 Hz
(±) | linearity of overall sound is average (22.2% difference to median)
Compared to same class
» 79% of all tested devices in this class were better, 4% similar, 17% worse
» The best had a delta of 5%, average was 17%, worst was 45%
Compared to all devices tested
» 64% of all tested devices were better, 6% similar, 29% worse
» The best had a delta of 4%, average was 24%, worst was 134%
| Off / Standby | |
| Idle | |
| Load |
|
Key:
min: | |
| Asus ZenBook 15 UX534FTC-A8190T i7-10510U, GeForce GTX 1650 Max-Q | Asus ZenBook 15 UX534FT-DB77 i7-8565U, GeForce GTX 1650 Max-Q | Acer ConceptD 5 CN515-51-73Z7 i7-8705G, Vega M GL / 870 | Dell XPS 15 7590 9980HK GTX 1650 i9-9980HK, GeForce GTX 1650 Mobile | Asus ZenBook 15 UX533FD i7-8565U, GeForce GTX 1050 Max-Q | Apple MacBook Pro 16 2019 i9 5500M i9-9880H, Radeon Pro 5500M | Average NVIDIA GeForce GTX 1650 Max-Q | Average of class Multimedia | |
|---|---|---|---|---|---|---|---|---|
| Power Consumption | -55% | -110% | -70% | -4% | -48% | -66% | -36% | |
| Idle Minimum * (Watt) | 2.8 | 5 -79% | 12 -329% | 6.2 -121% | 2.7 4% | 3.7 -32% | 7.75 ? -177% | 5.71 ? -104% |
| Idle Average * (Watt) | 7.7 | 13.2 -71% | 17.8 -131% | 9.6 -25% | 8 -4% | 12.1 -57% | 11.8 ? -53% | 10.1 ? -31% |
| Idle Maximum * (Watt) | 9.4 | 24 -155% | 19.7 -110% | 21.2 -126% | 10.6 -13% | 17 -81% | 16.6 ? -77% | 12.4 ? -32% |
| Load Average * (Watt) | 57 | 70 -23% | 59 -4% | 104.3 -83% | 74 -30% | 91.5 -61% | 75.2 ? -32% | 65 ? -14% |
| Witcher 3 ultra * (Watt) | 62 | 63.3 -2% | 91.7 -48% | 103 -66% | ||||
| Load Maximum * (Watt) | 116 | 114 2% | 87 25% | 135.3 -17% | 89 23% | 102.3 12% | 105.5 ? 9% | 112.2 ? 3% |
* ... smaller is better
| Asus ZenBook 15 UX534FTC-A8190T i7-10510U, GeForce GTX 1650 Max-Q, 71 Wh | Asus ZenBook 15 UX533FD i7-8565U, GeForce GTX 1050 Max-Q, 73 Wh | Acer ConceptD 5 CN515-51-73Z7 i7-8705G, Vega M GL / 870, 48 Wh | Dell XPS 15 7590 9980HK GTX 1650 i9-9980HK, GeForce GTX 1650 Mobile, 97 Wh | Asus ZenBook 15 UX534FT-DB77 i7-8565U, GeForce GTX 1650 Max-Q, 71 Wh | Apple MacBook Pro 16 2019 i9 5500M i9-9880H, Radeon Pro 5500M, 99.8 Wh | Average of class Multimedia | |
|---|---|---|---|---|---|---|---|
| Battery runtime | -4% | -55% | -14% | -11% | -26% | -1% | |
| Reader / Idle (h) | 27.2 | 26.5 -3% | 7.7 -72% | 15.2 -44% | 21.5 -21% | 25.2 ? -7% | |
| H.264 (h) | 11.9 | 6.9 -42% | 9.7 -18% | 16.4 ? 38% | |||
| WiFi v1.3 (h) | 12.4 | 8.7 -30% | 4.6 -63% | 7.8 -37% | 8.4 -32% | 12 -3% | 12 ? -3% |
| Load (h) | 2.4 | 2.9 21% | 1.4 -42% | 3.3 38% | 2.9 21% | 1 -58% | 1.675 ? -30% |
| Witcher 3 ultra (h) | 0.9 |
Pros
Cons
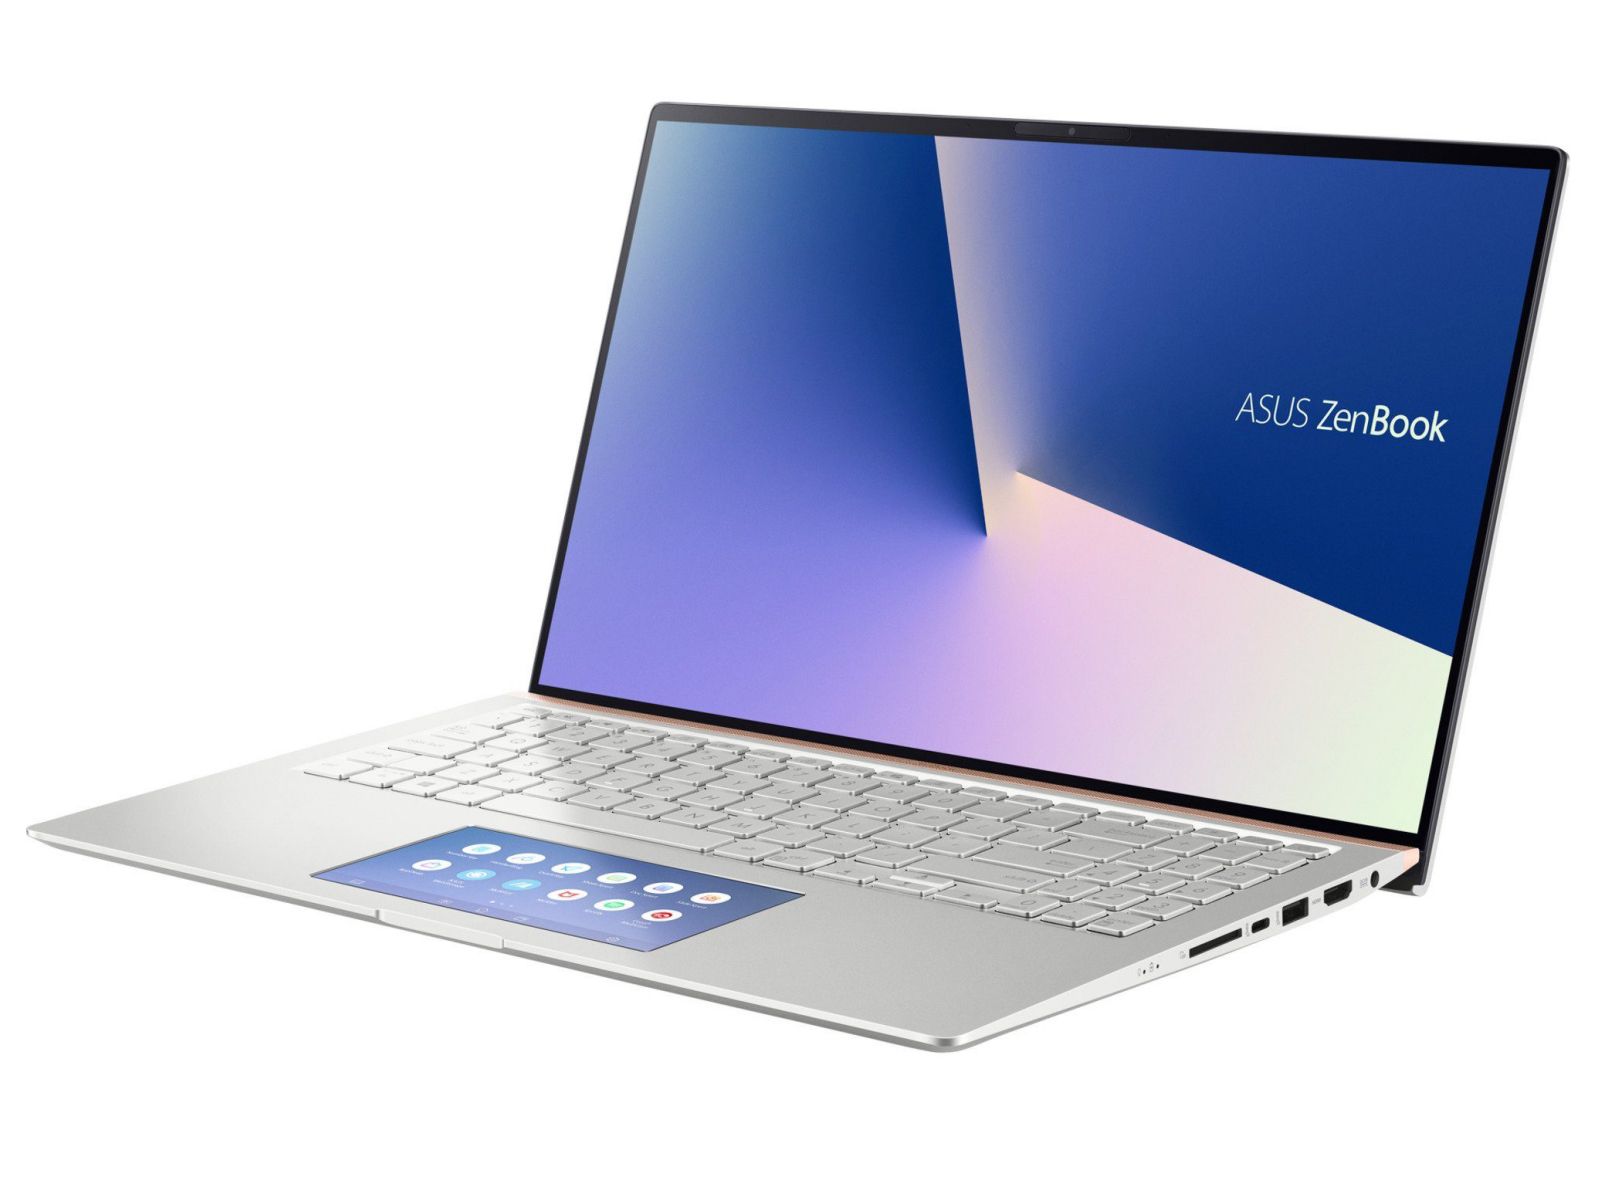
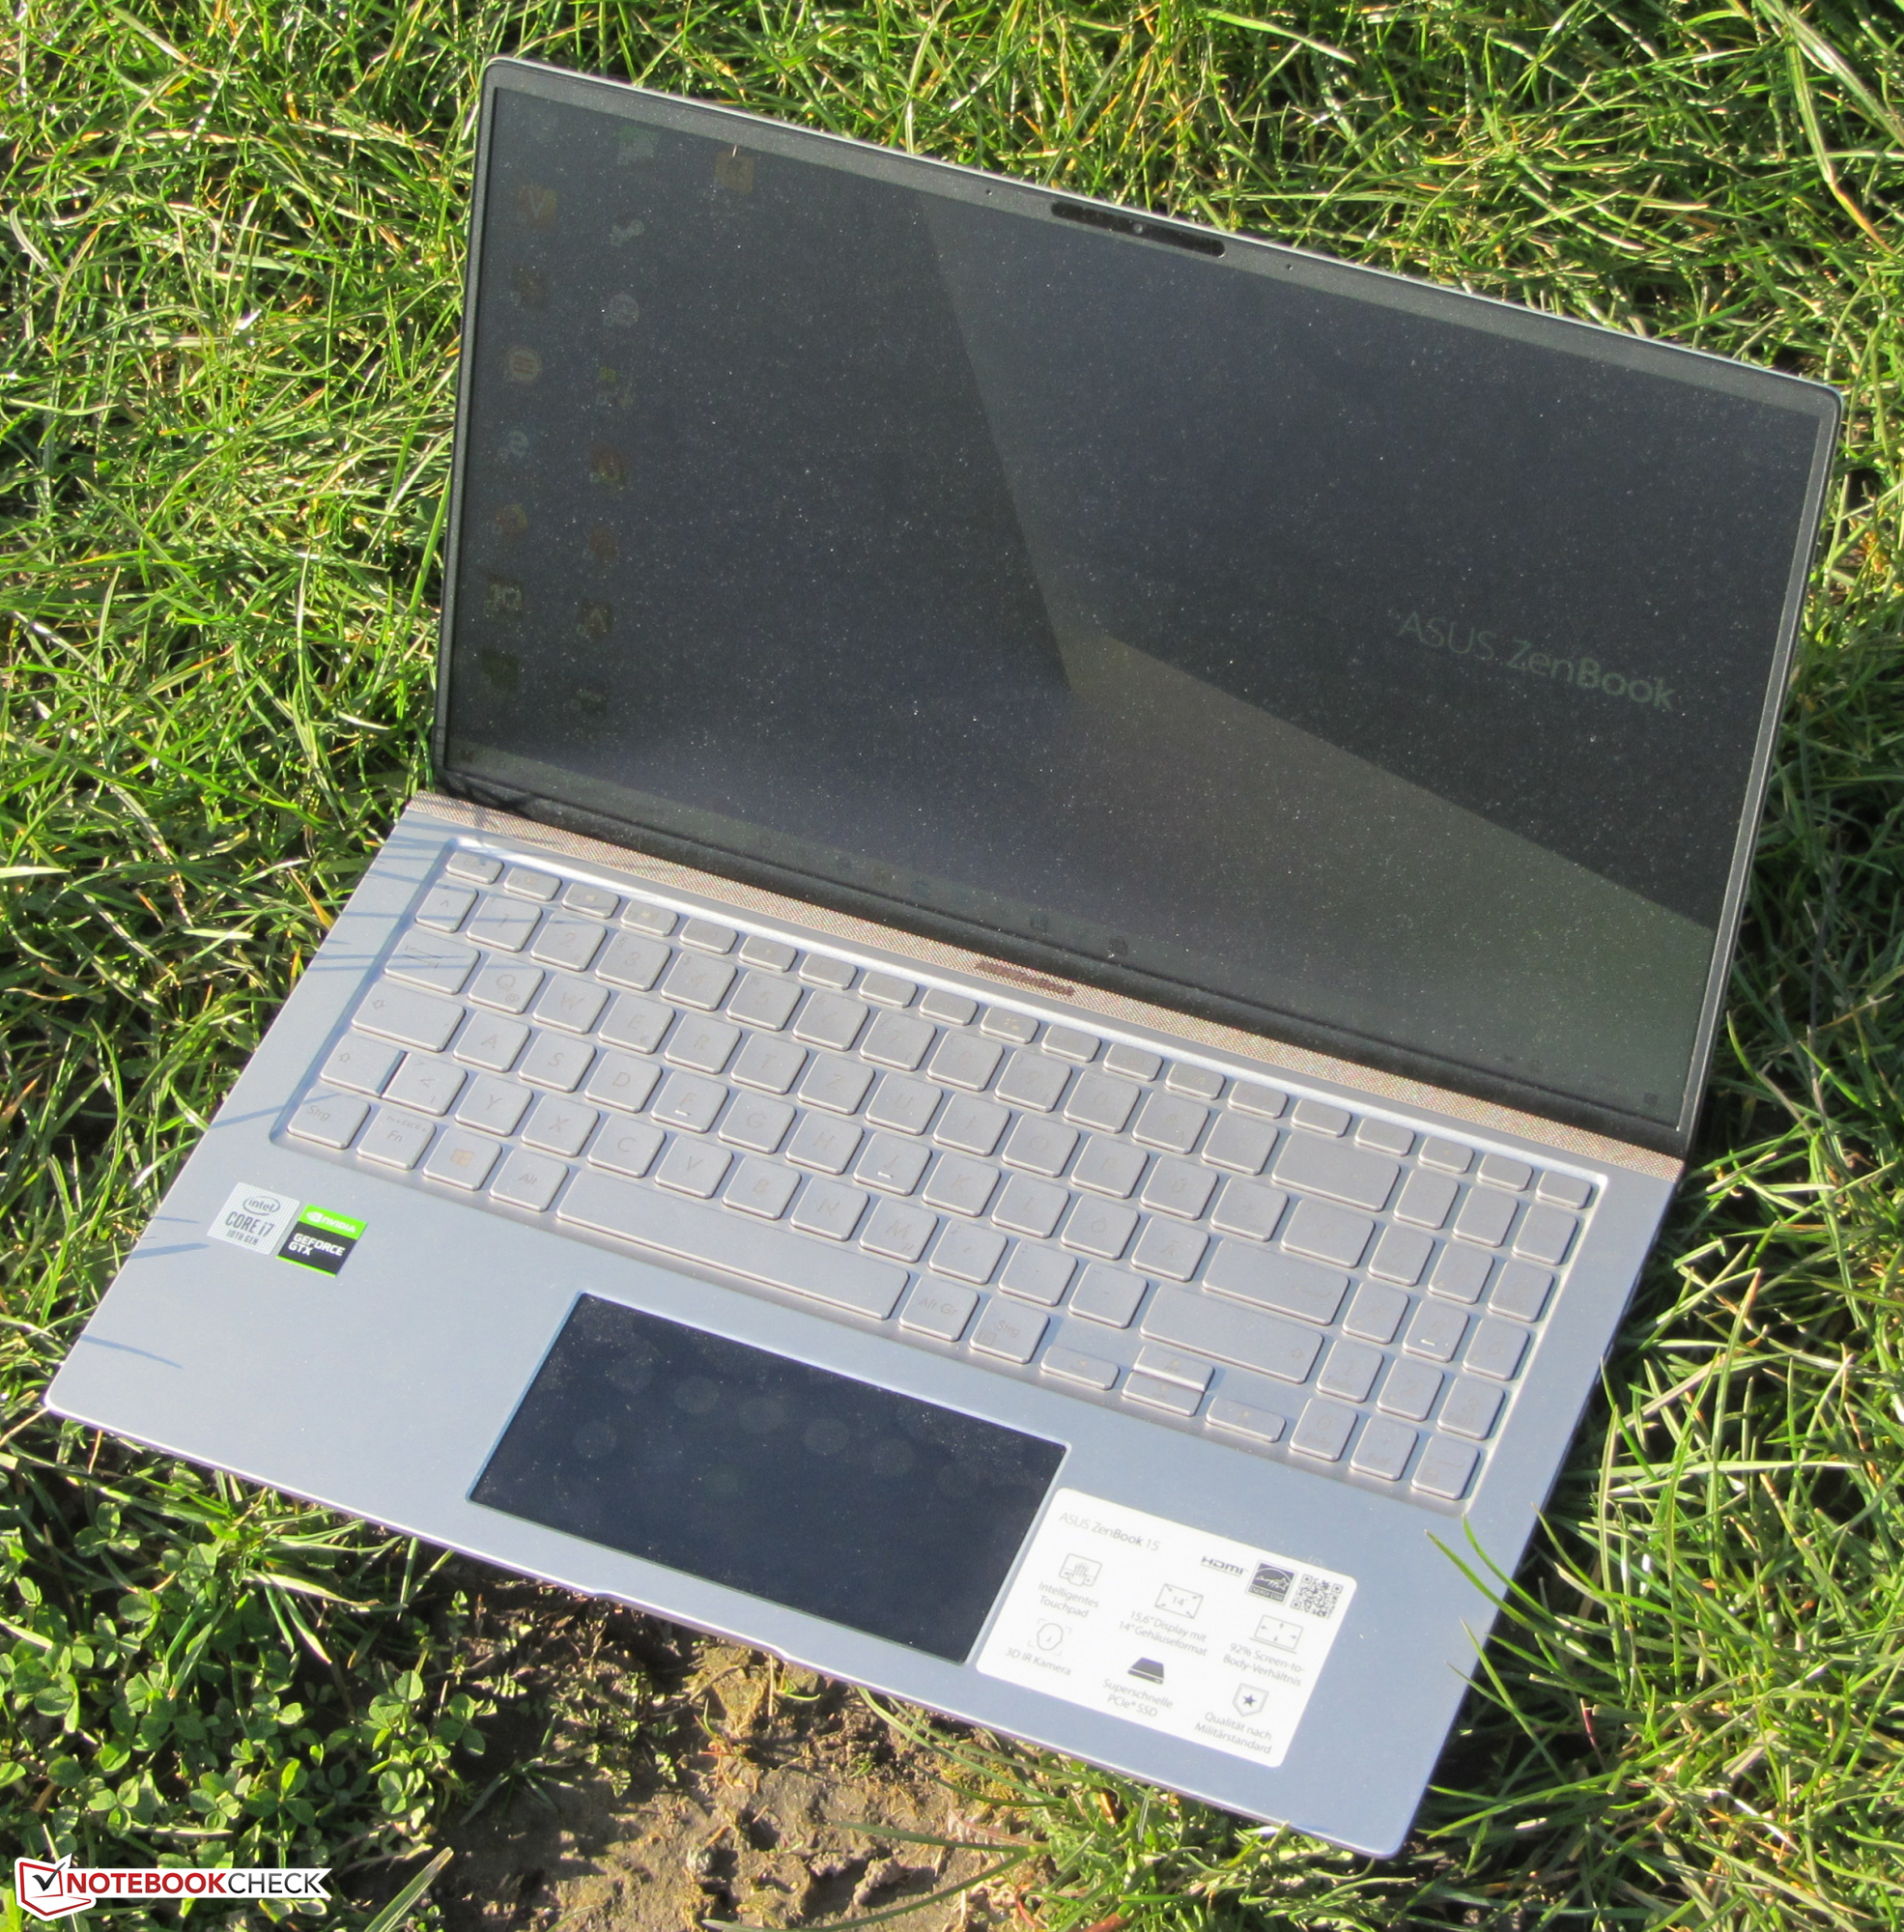
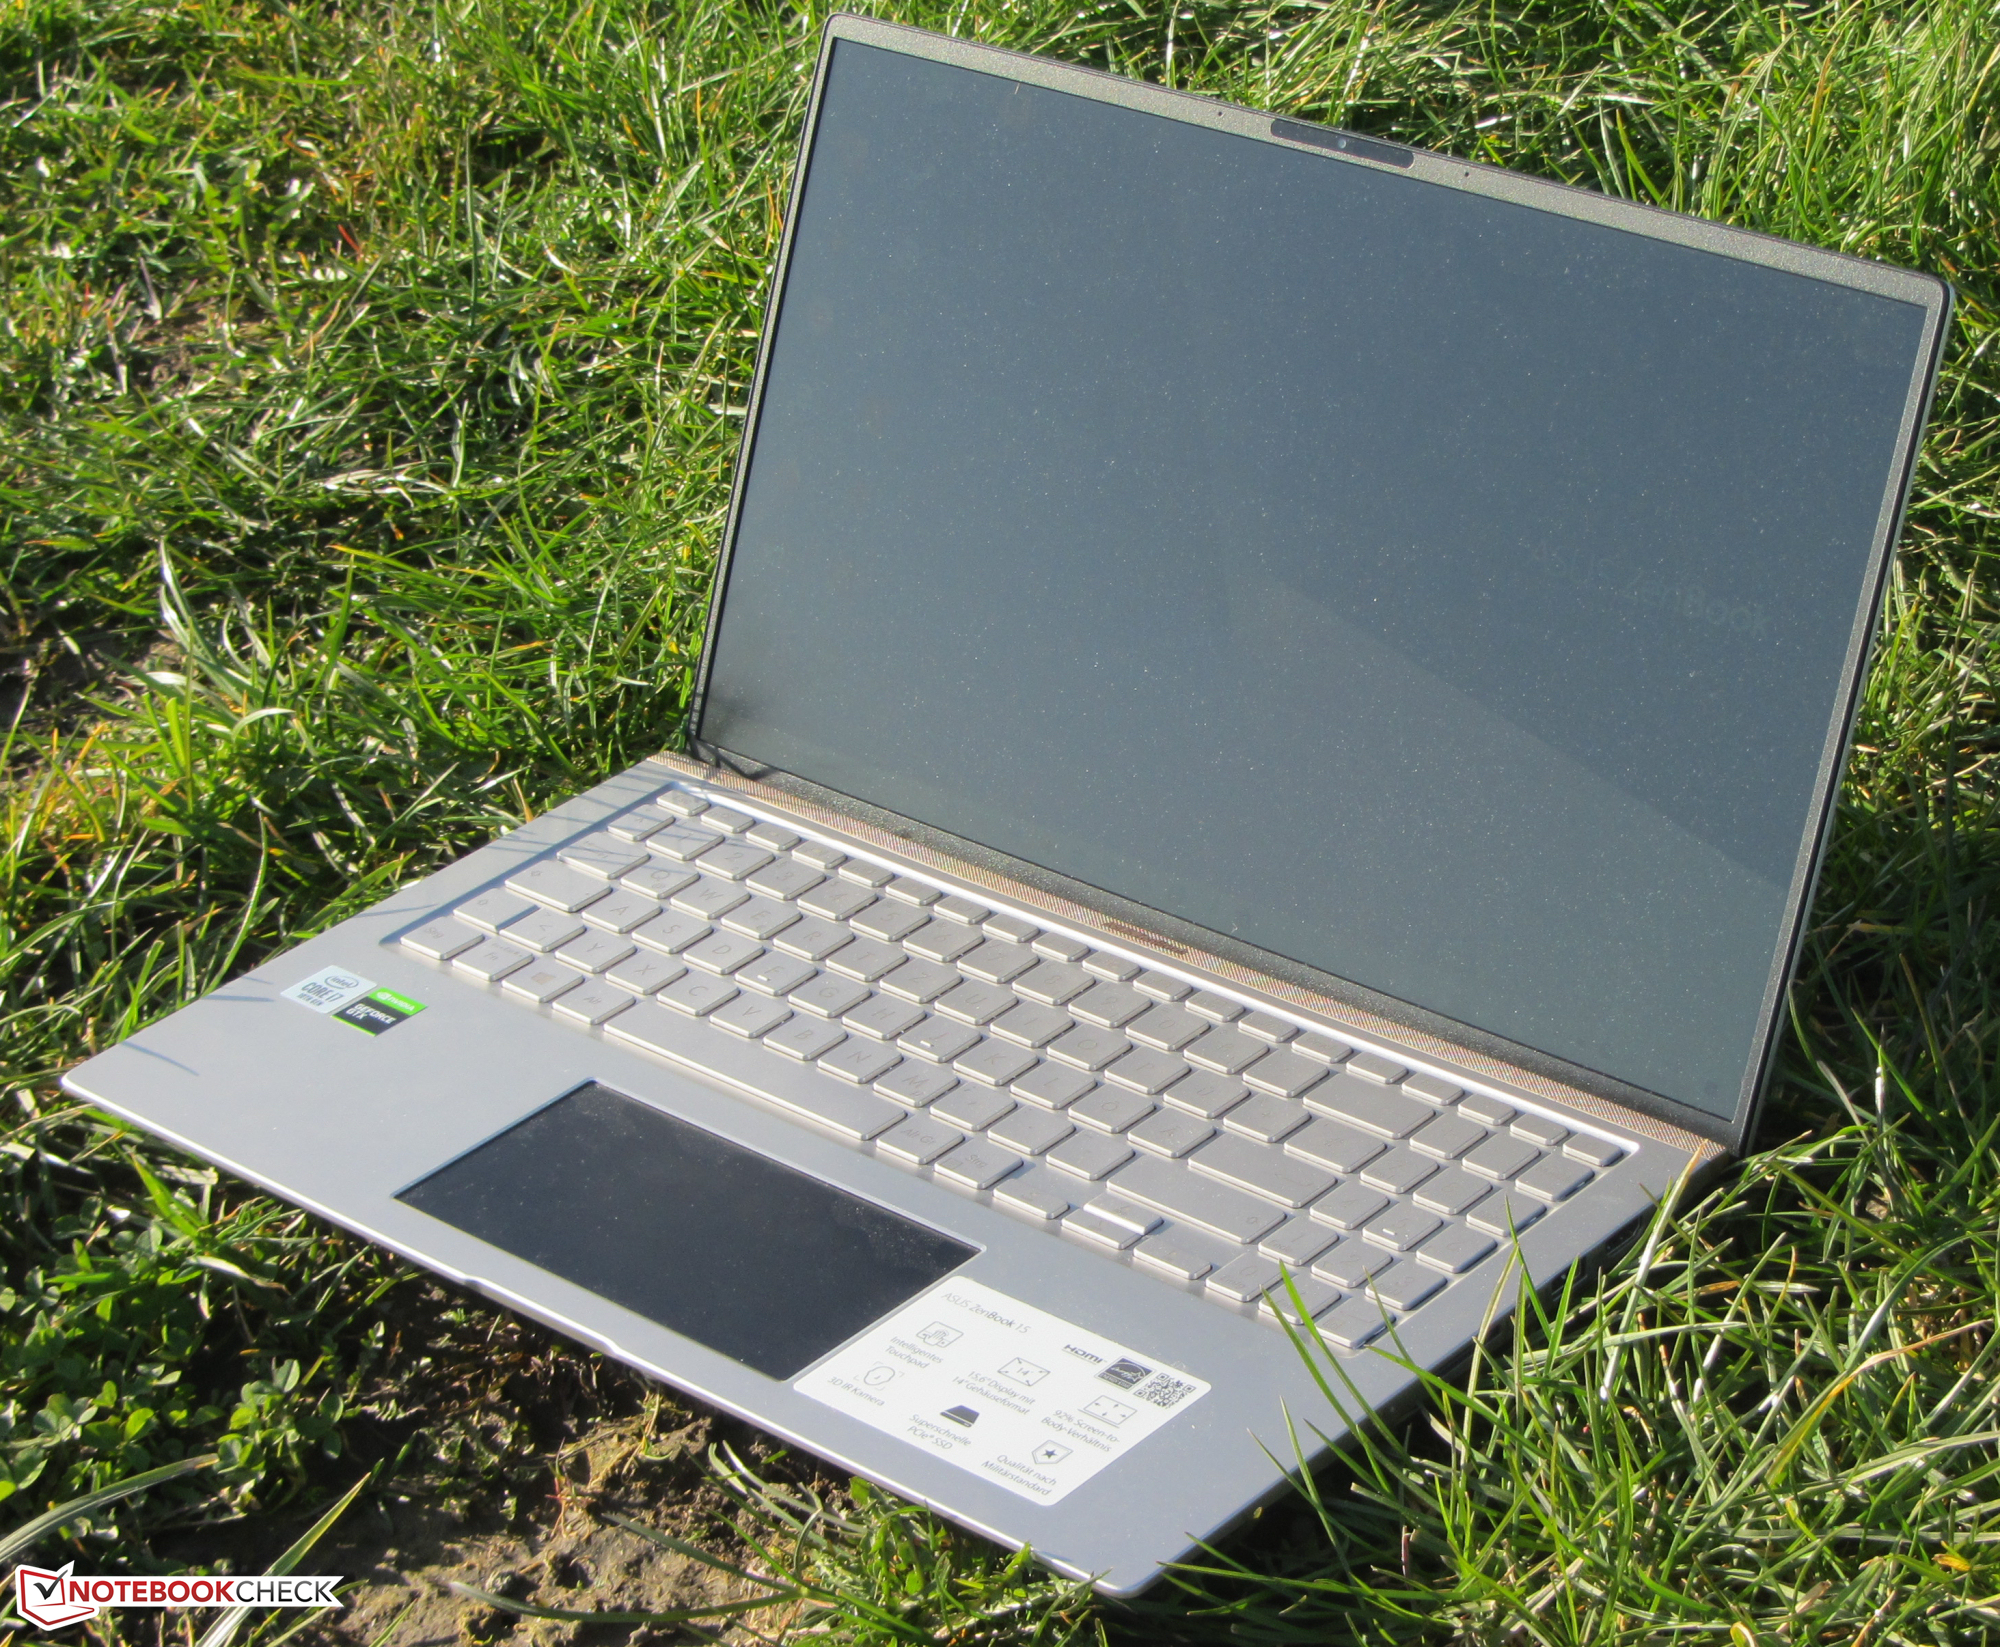
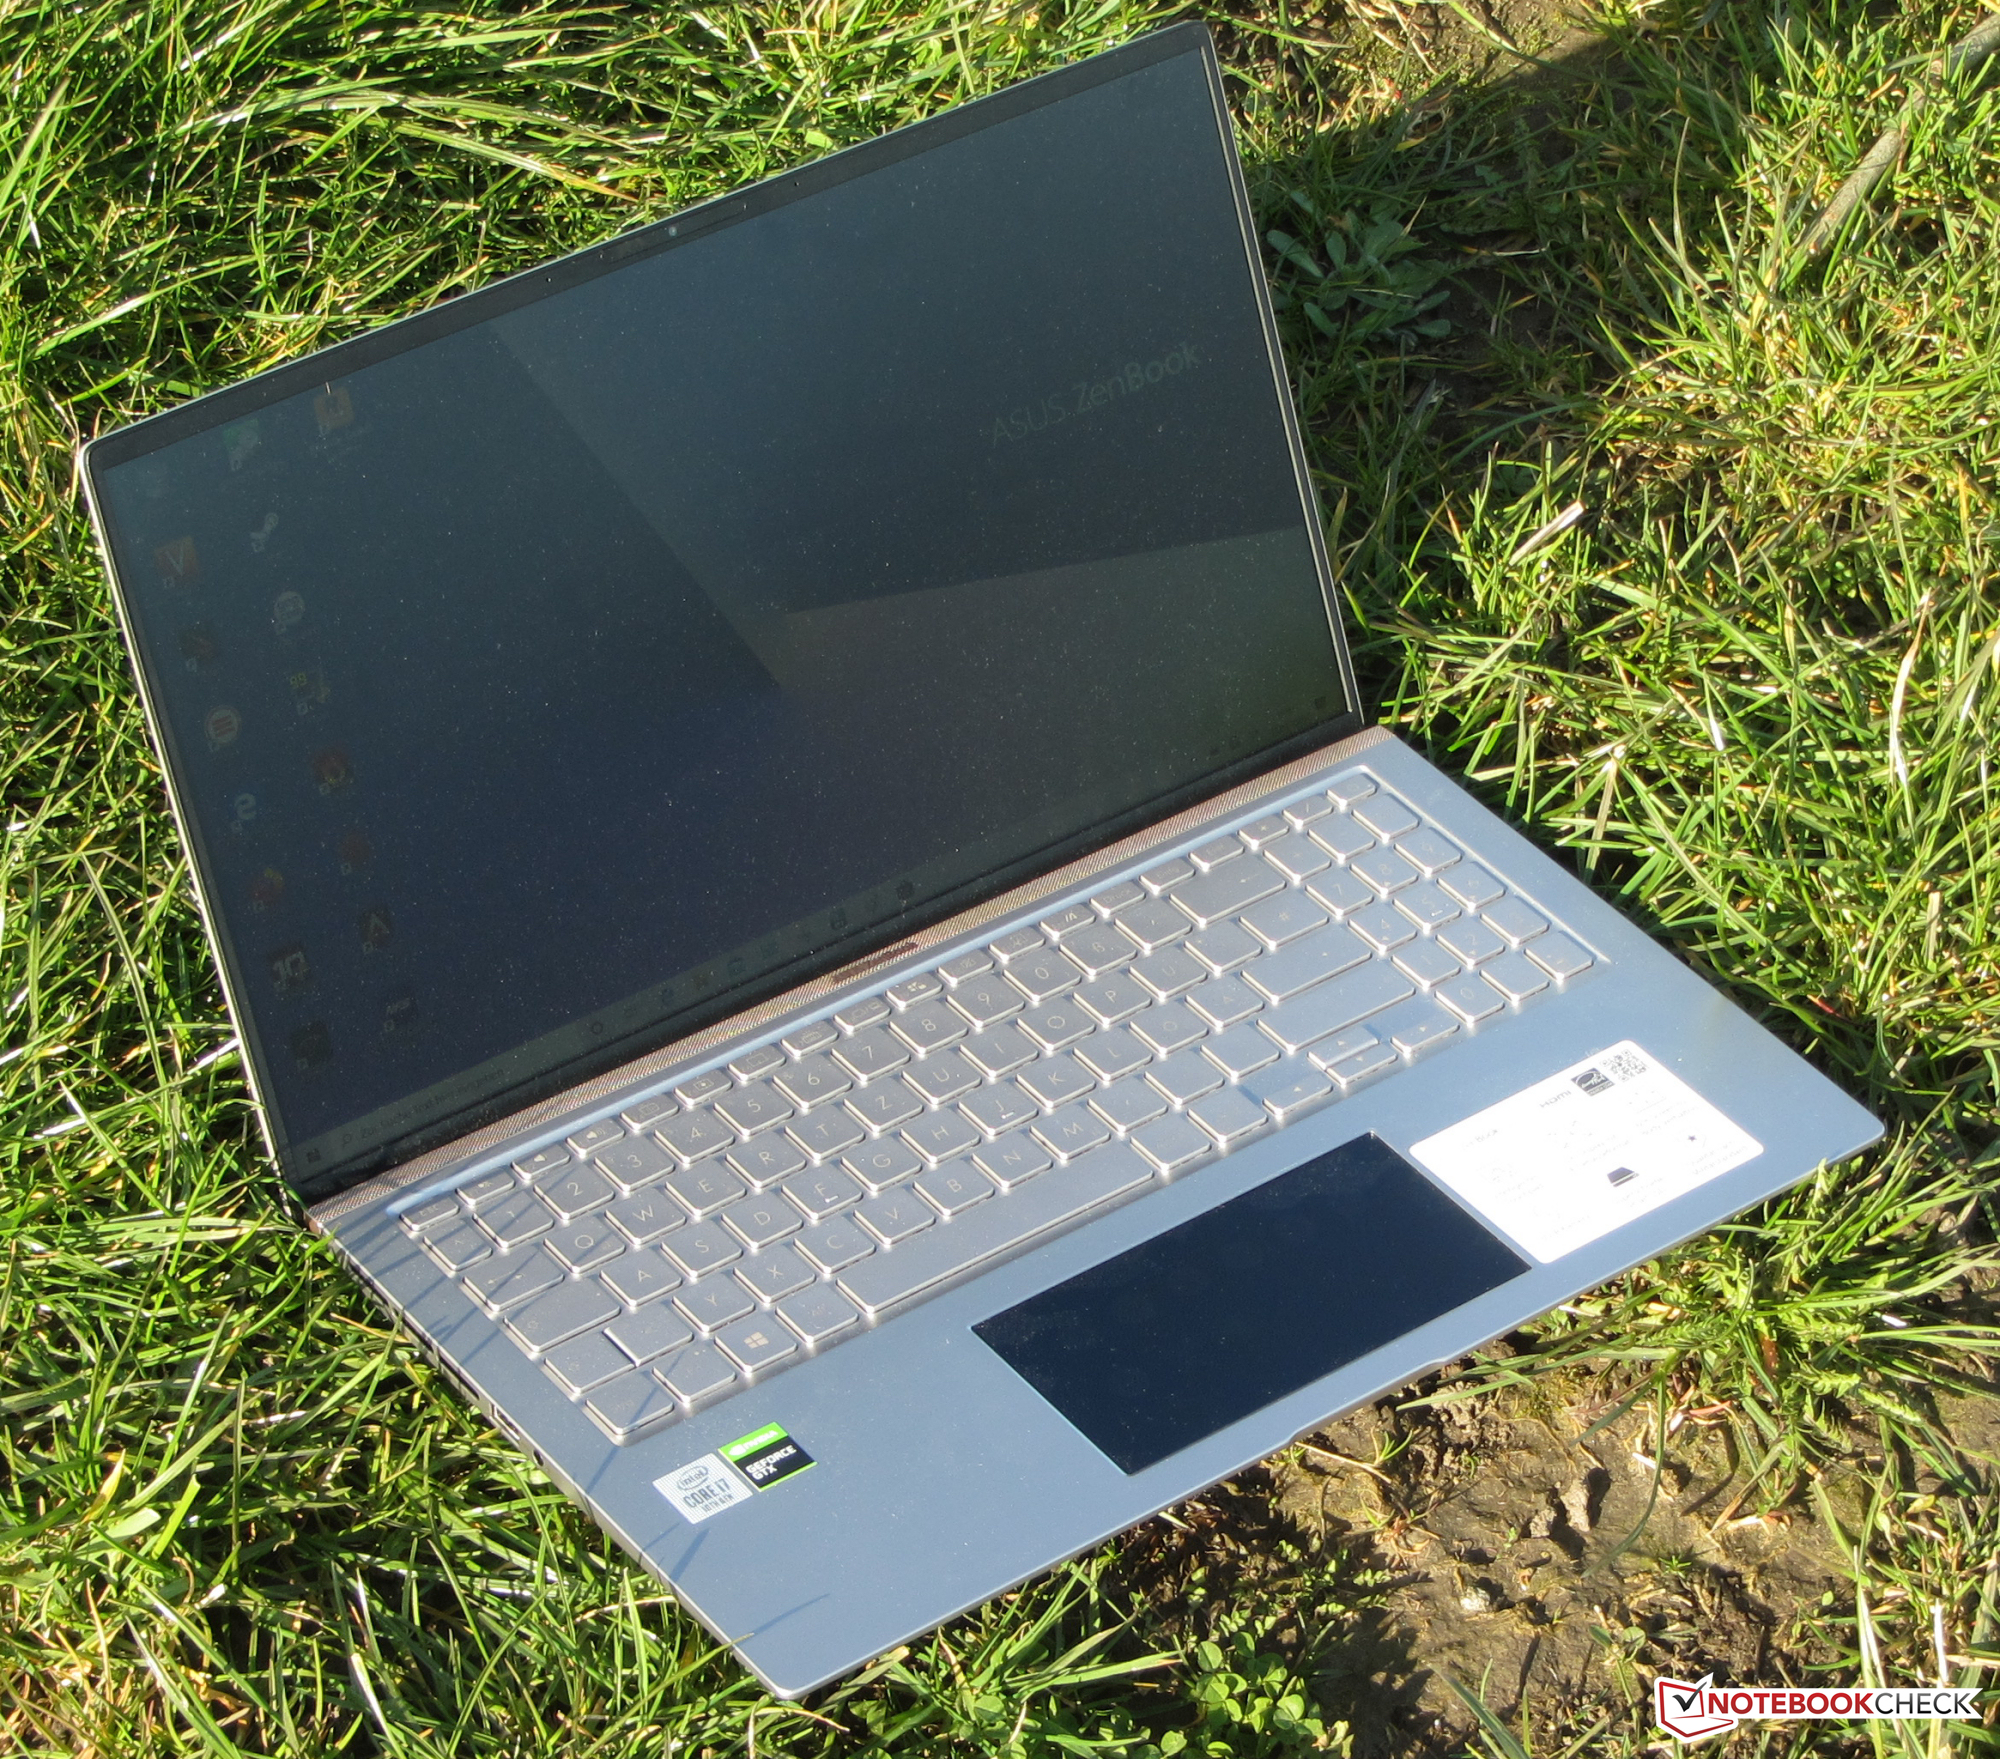
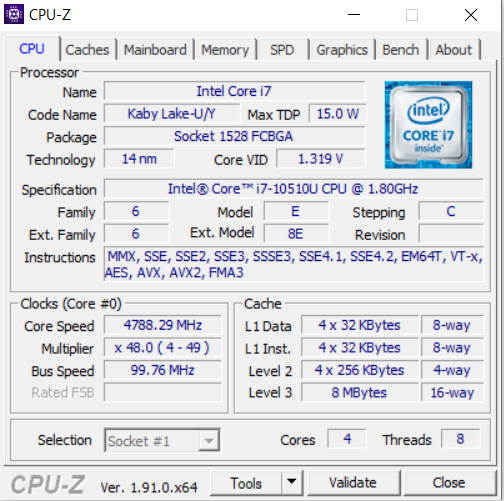
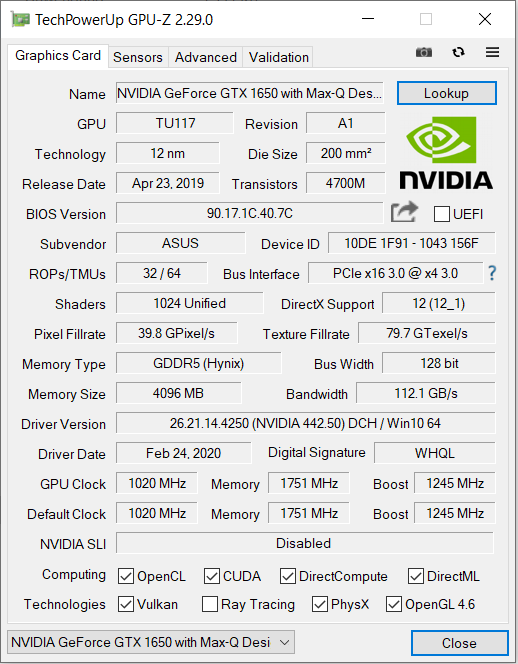
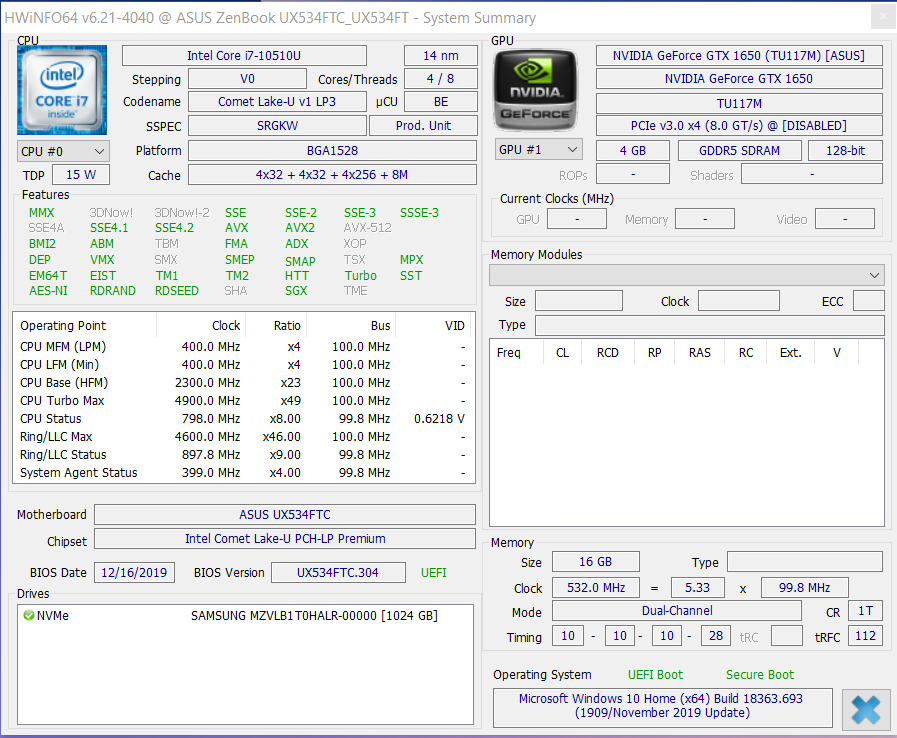
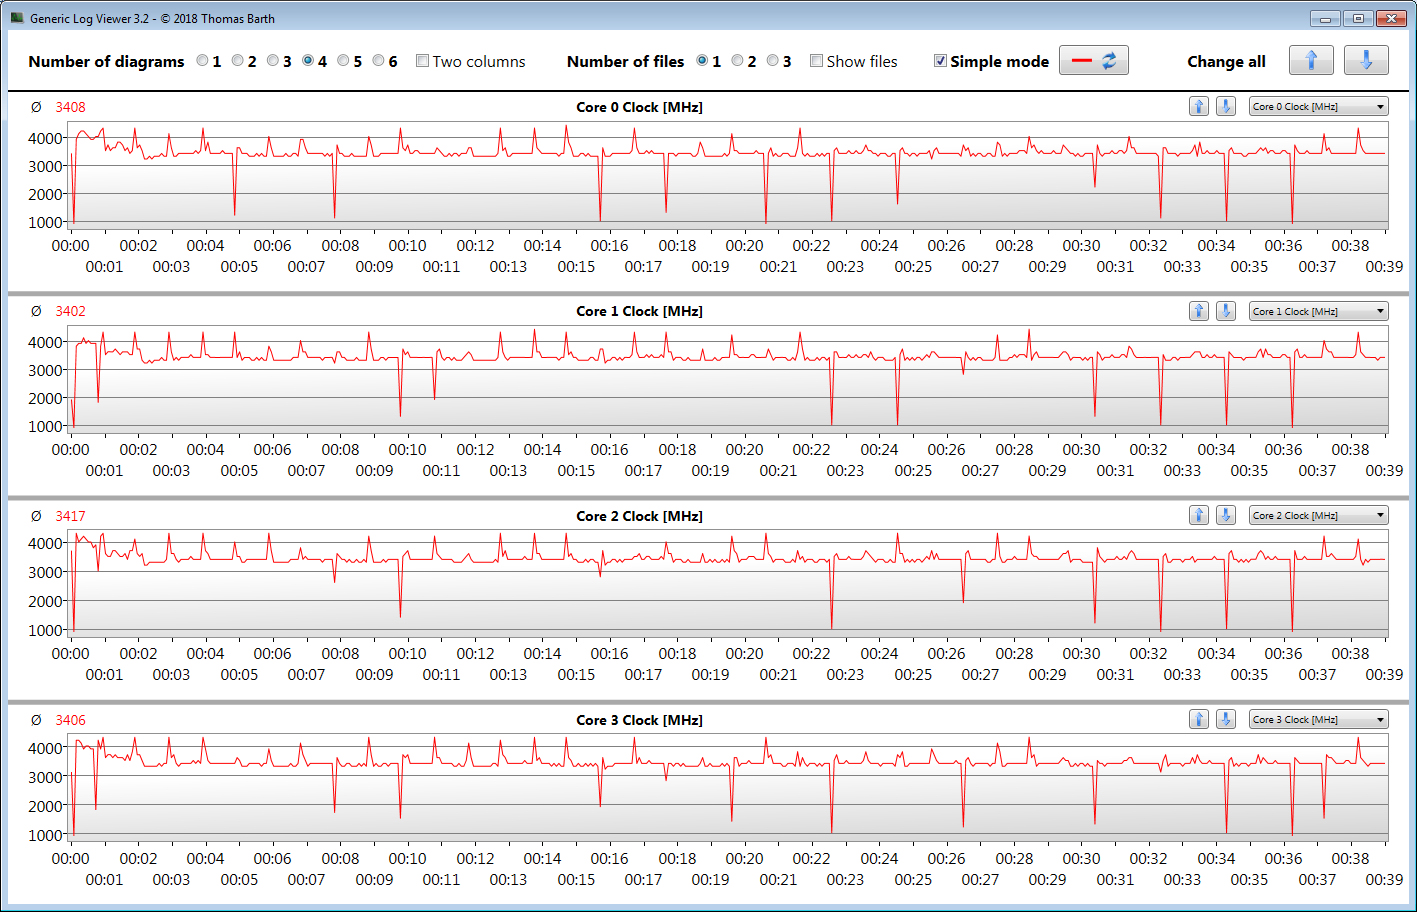
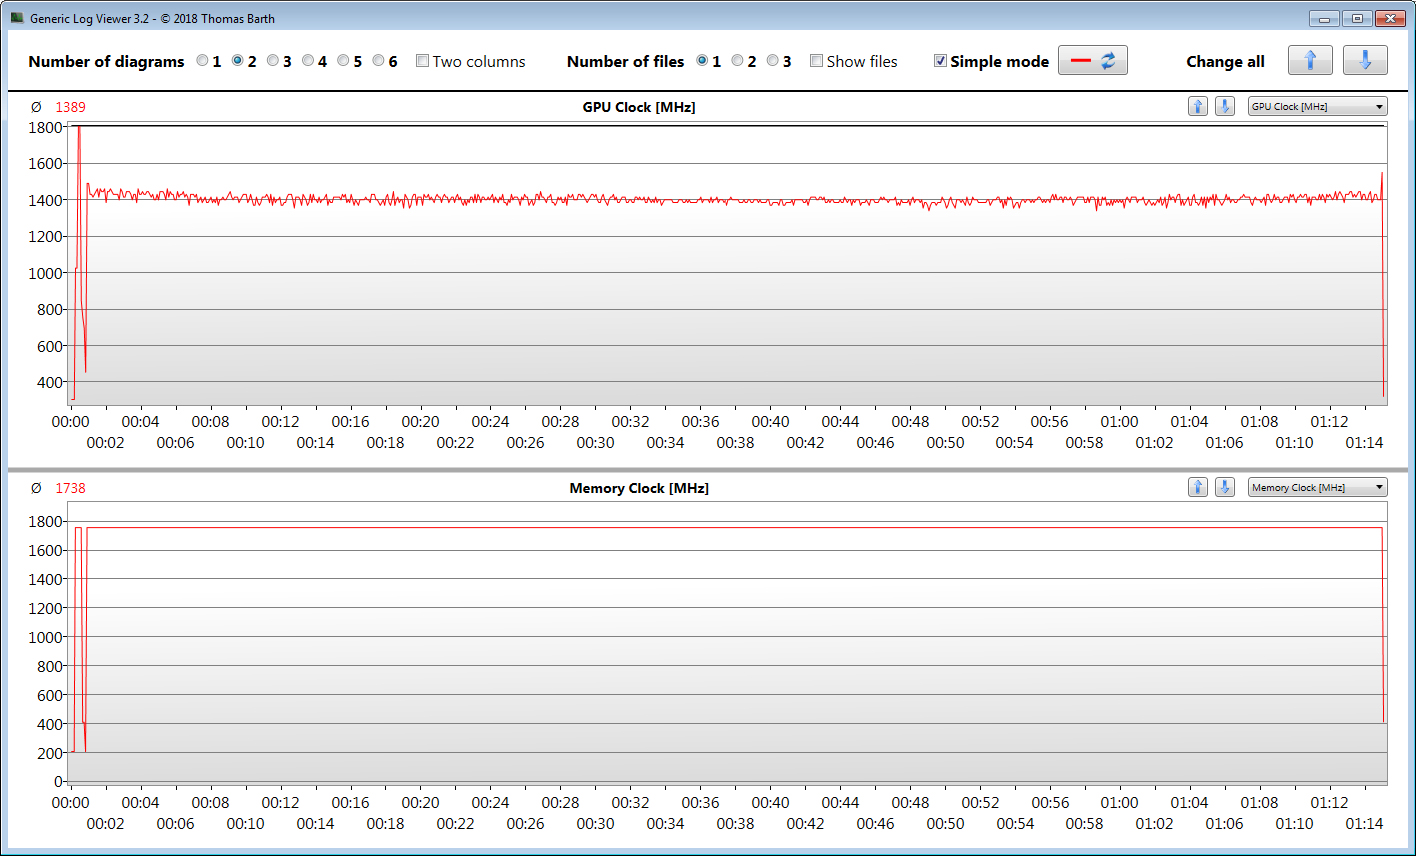
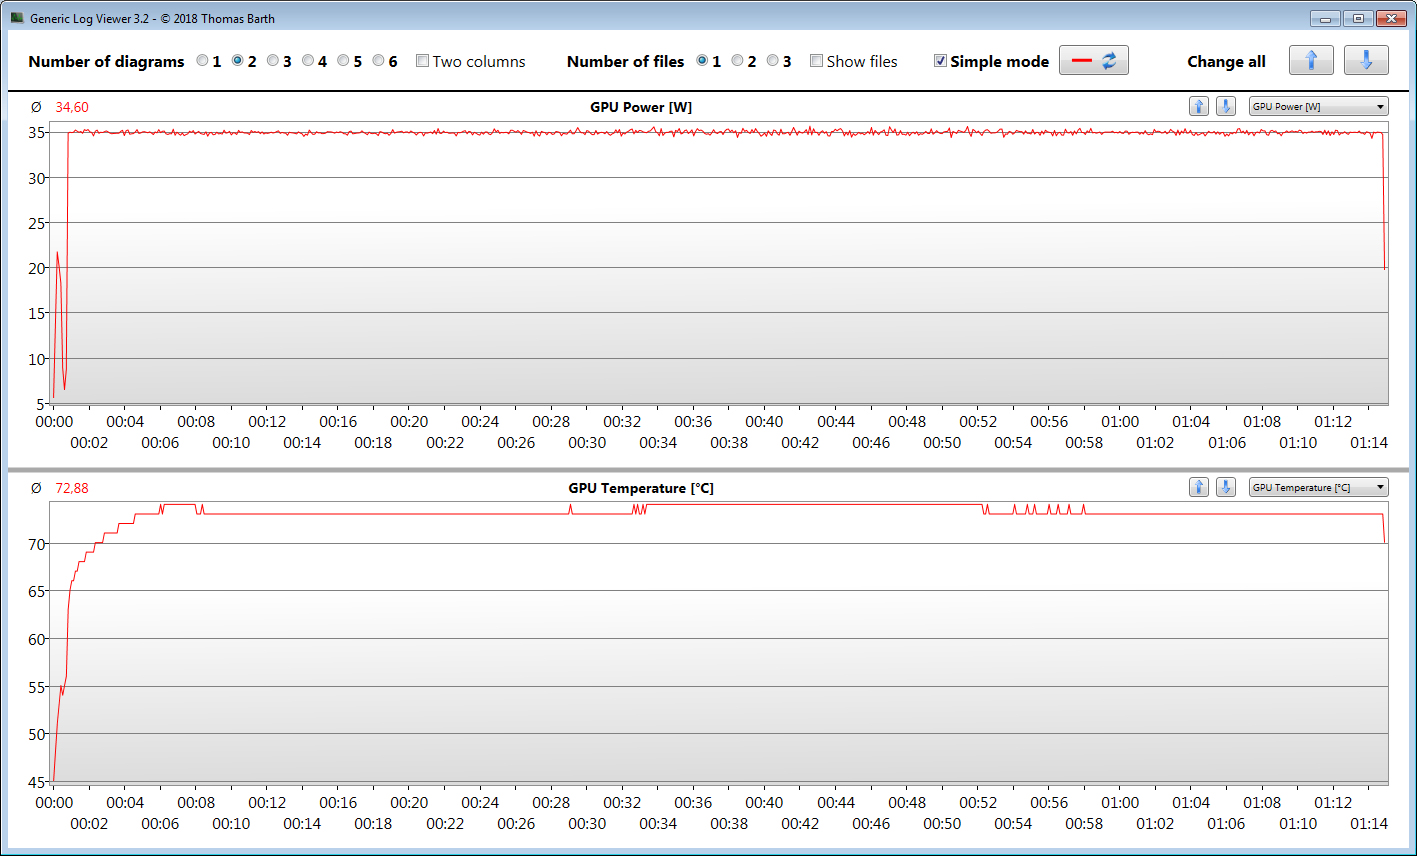
华硕的ZenBook 15 UX534FTC是一款纤巧,纤薄的15.6英寸笔记本电脑,几乎具有14英寸设备的尺寸。尽管结构紧凑,但它并不缺乏性能。四核Core i7-10510U和GeForce GTX 1650 Max-Q都能够始终保持全速运行。
对于CPU,这句话仅在插电运行的环境下成立。在电池模式下,CPU Turbo Boost的频率很低甚至不存在。显然,这是笔记本电脑出色续航时间的代价。好处:最坏的情况下发热量仍然适中,噪音水平也可以接受。
华硕ZenBook 15 UX534FTC结合了高性能和出色的续航时间。
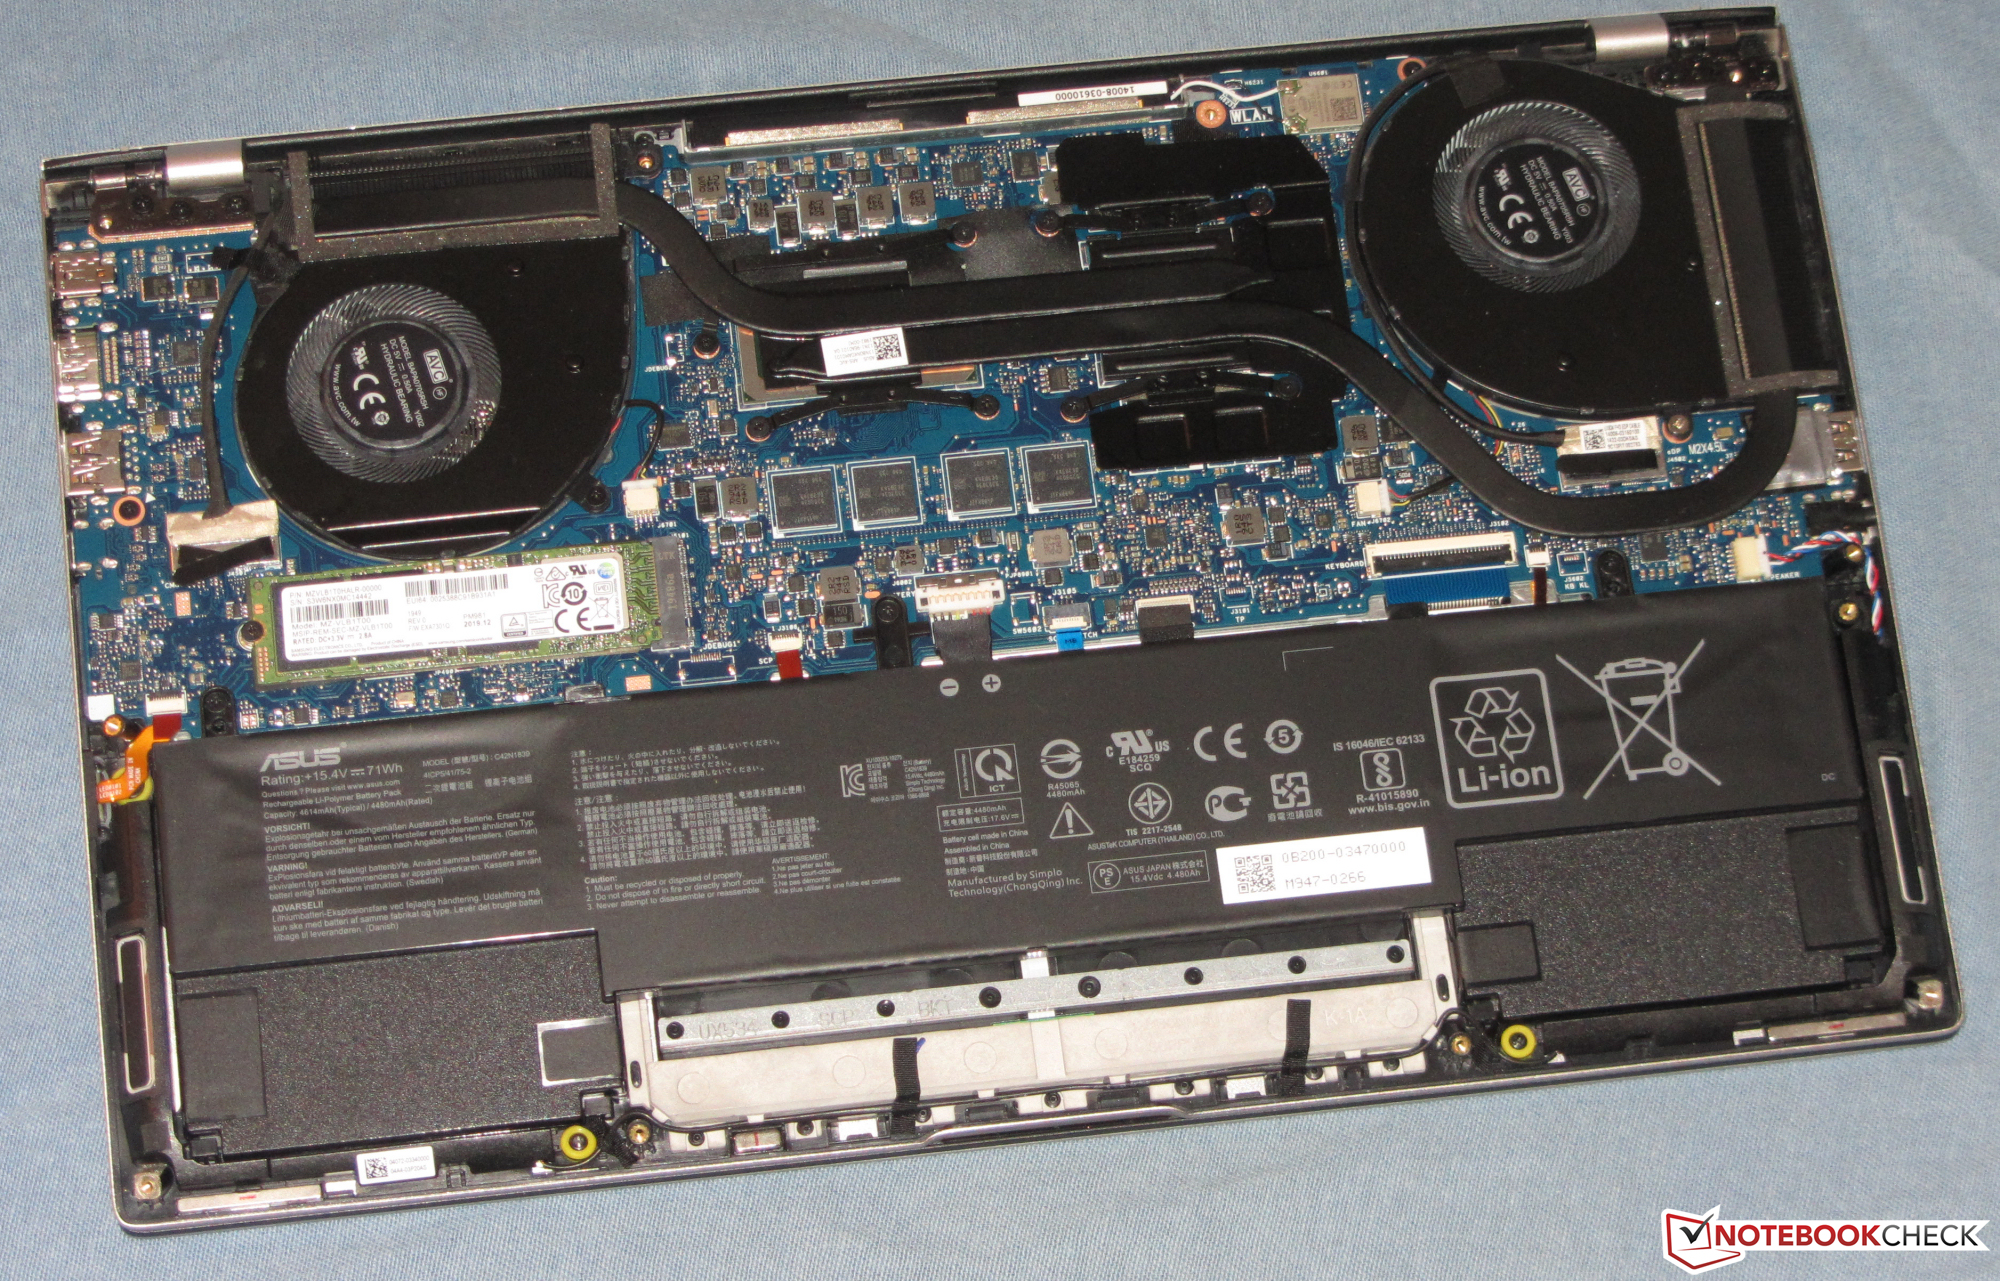
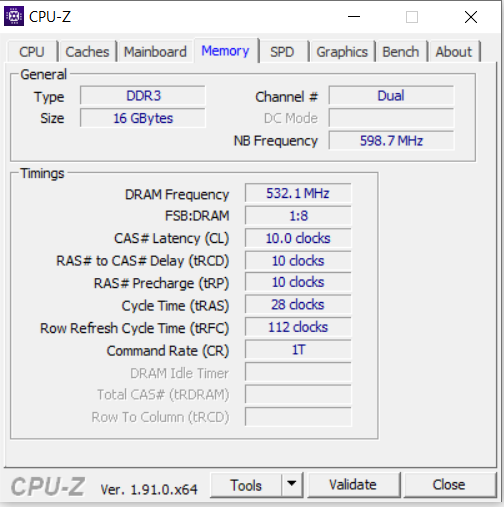
NVMe SSD可提供足够的存储空间和快速的传输速率。更换固态硬盘需要用户打开机壳,这并不是一项特别复杂的任务。相比之下,由于RAM是板载的,因此无法升级(最大16 GB)。我们希望拥有32 GB RAM的可选ZenBook型号,为正在寻求更符合未来需求的用户提供帮助。
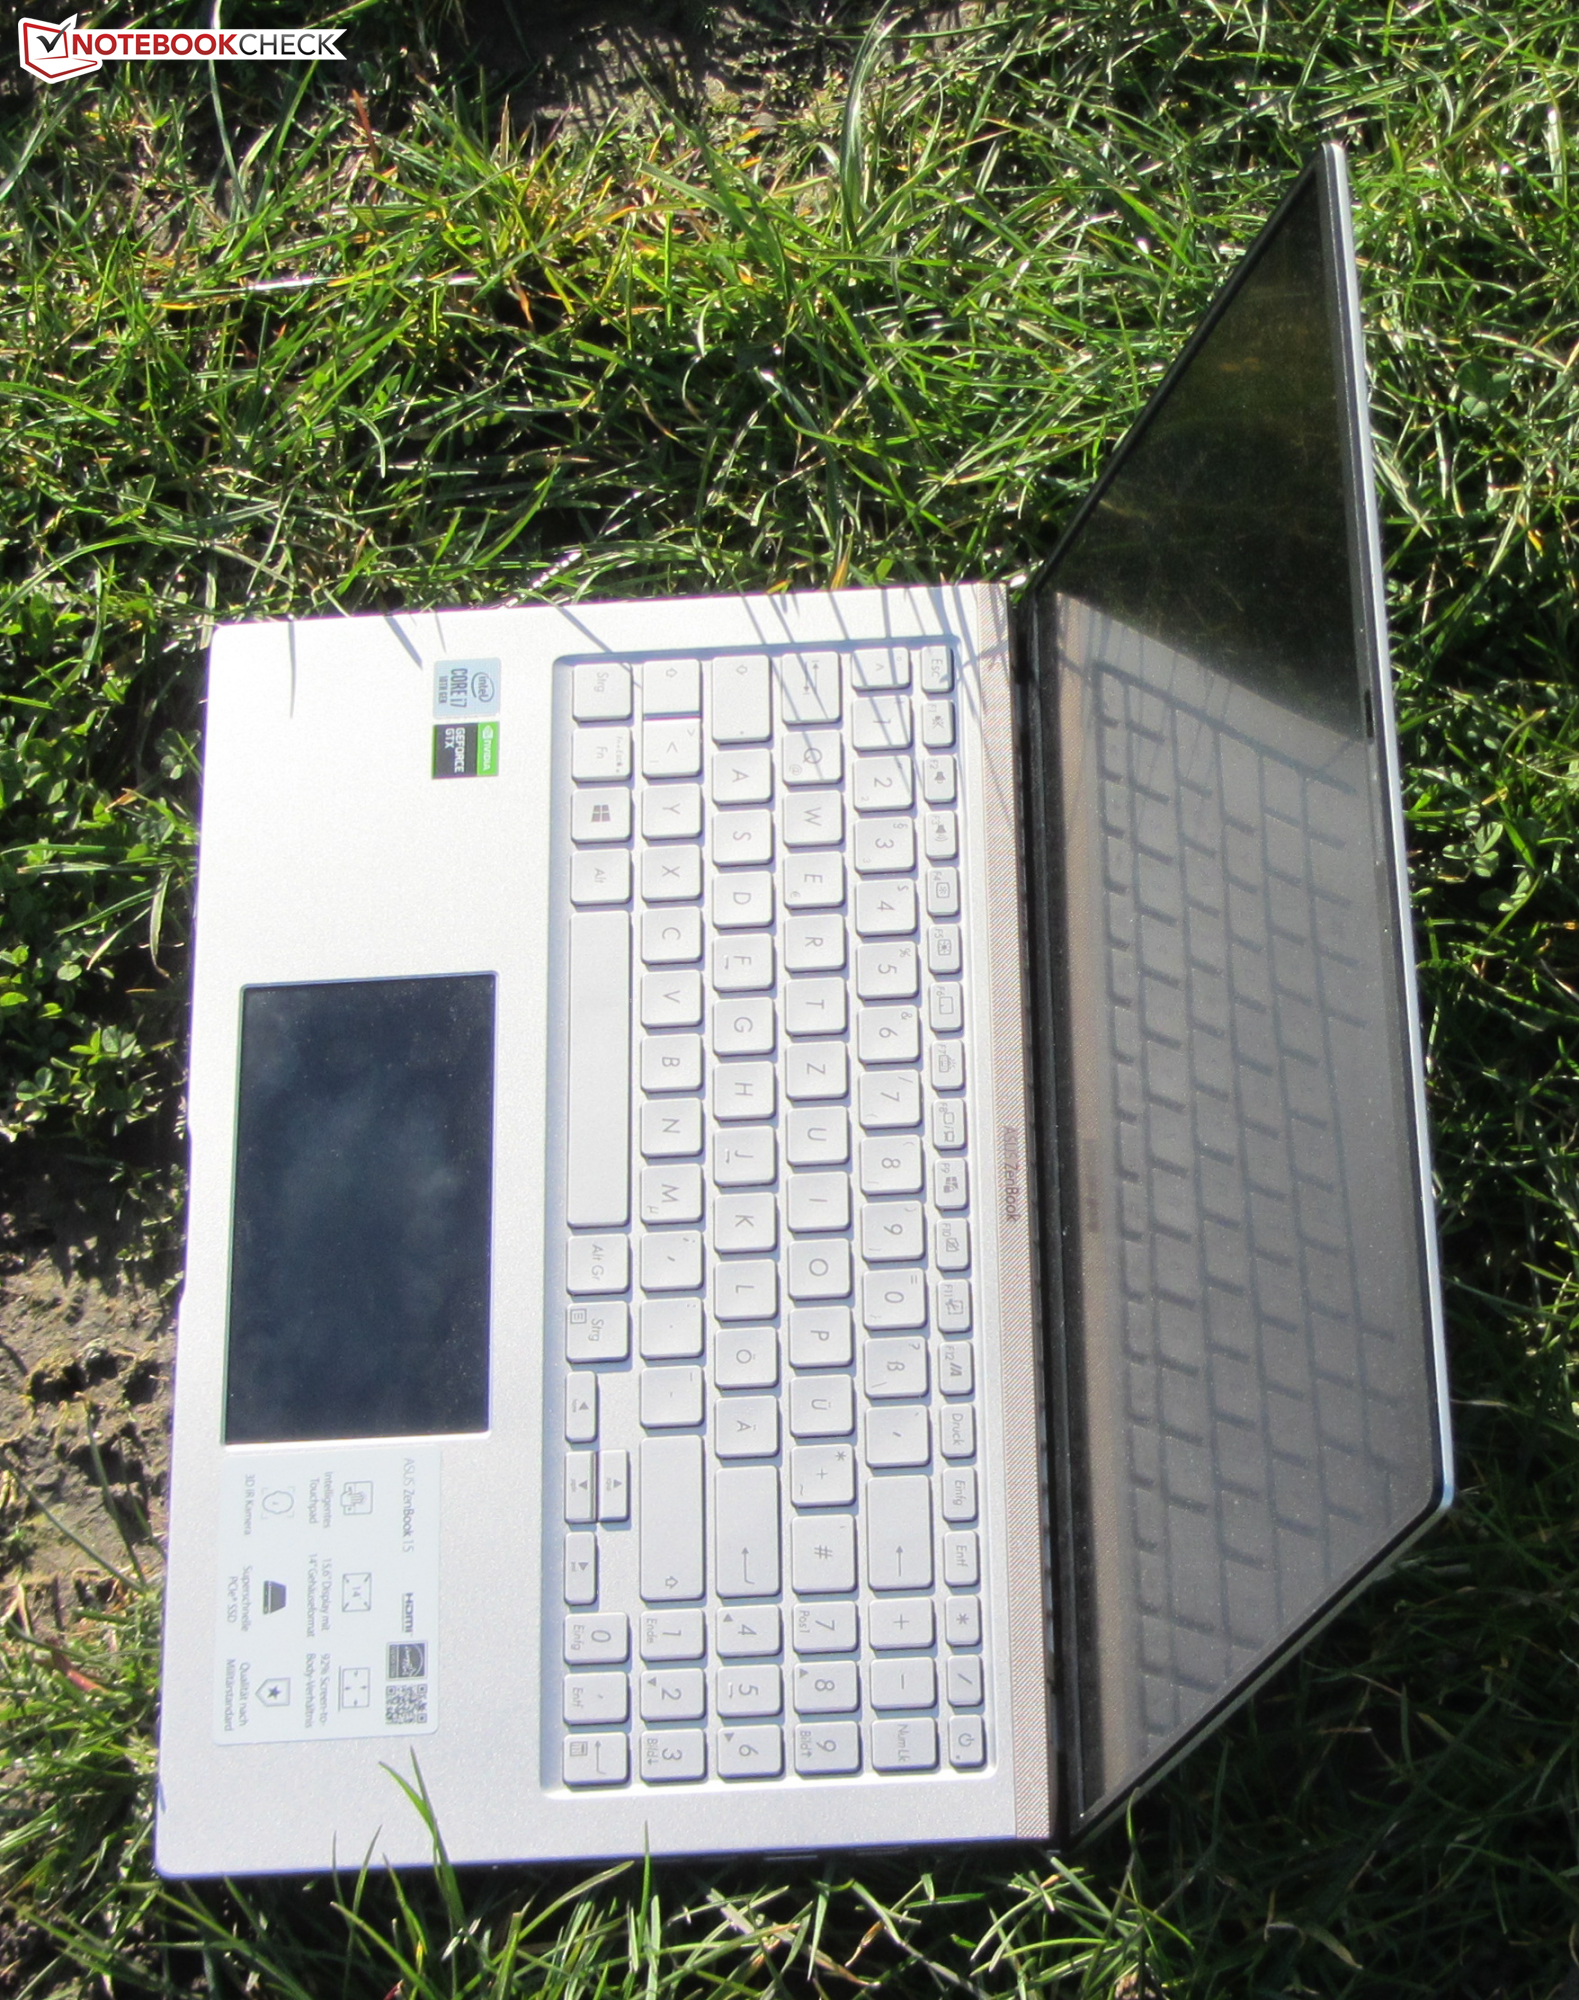
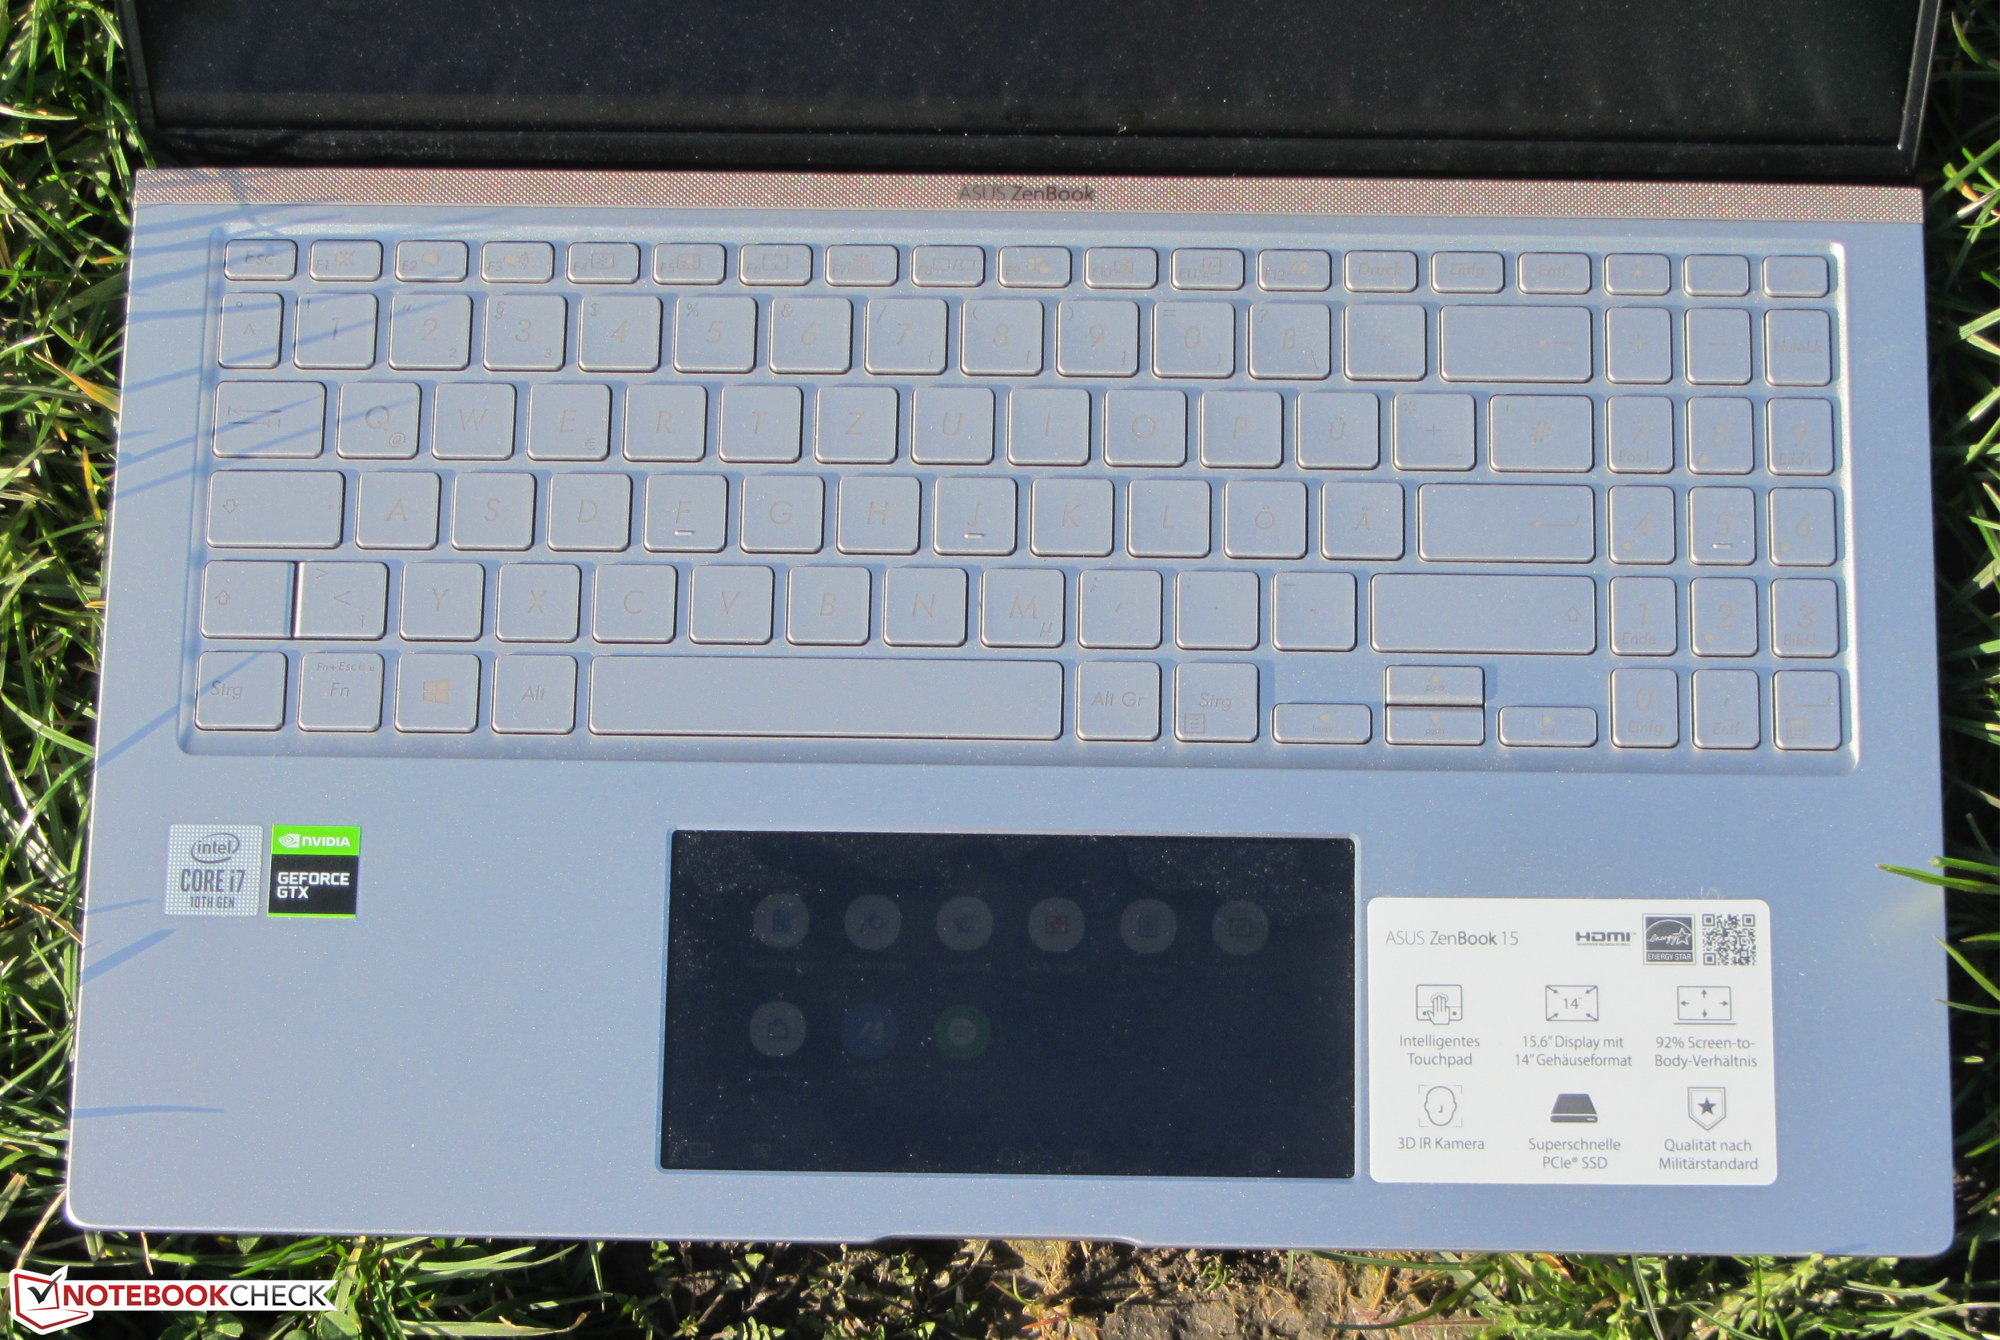
雾面IPS显示屏具有稳定的视角,良好的对比度和良好的色彩表现。不过在此价格范围内,屏幕的亮度不足。事实证明,键盘背光在日常使用中非常方便。
此外,我们希望能有Thunderbolt 3端口。在紧凑型移动1600欧元(约合13000元)的笔记本电脑上,默认情况下应包括在内。该连接器将允许使用功能丰富的扩展坞和功能更强大的外部GPU。就目前而言,华硕仅为ZenBook配备了两个USB 3.2 Gen 2端口(1x A型,1x C型)。在此,Type-C端口只能用于外接设备。它不支持通过USB C的DisplayPort。
Asus ZenBook 15 UX534FTC-A8190T
- 03/16/2020 v7 (old)
Sascha Mölck
Price comparison

