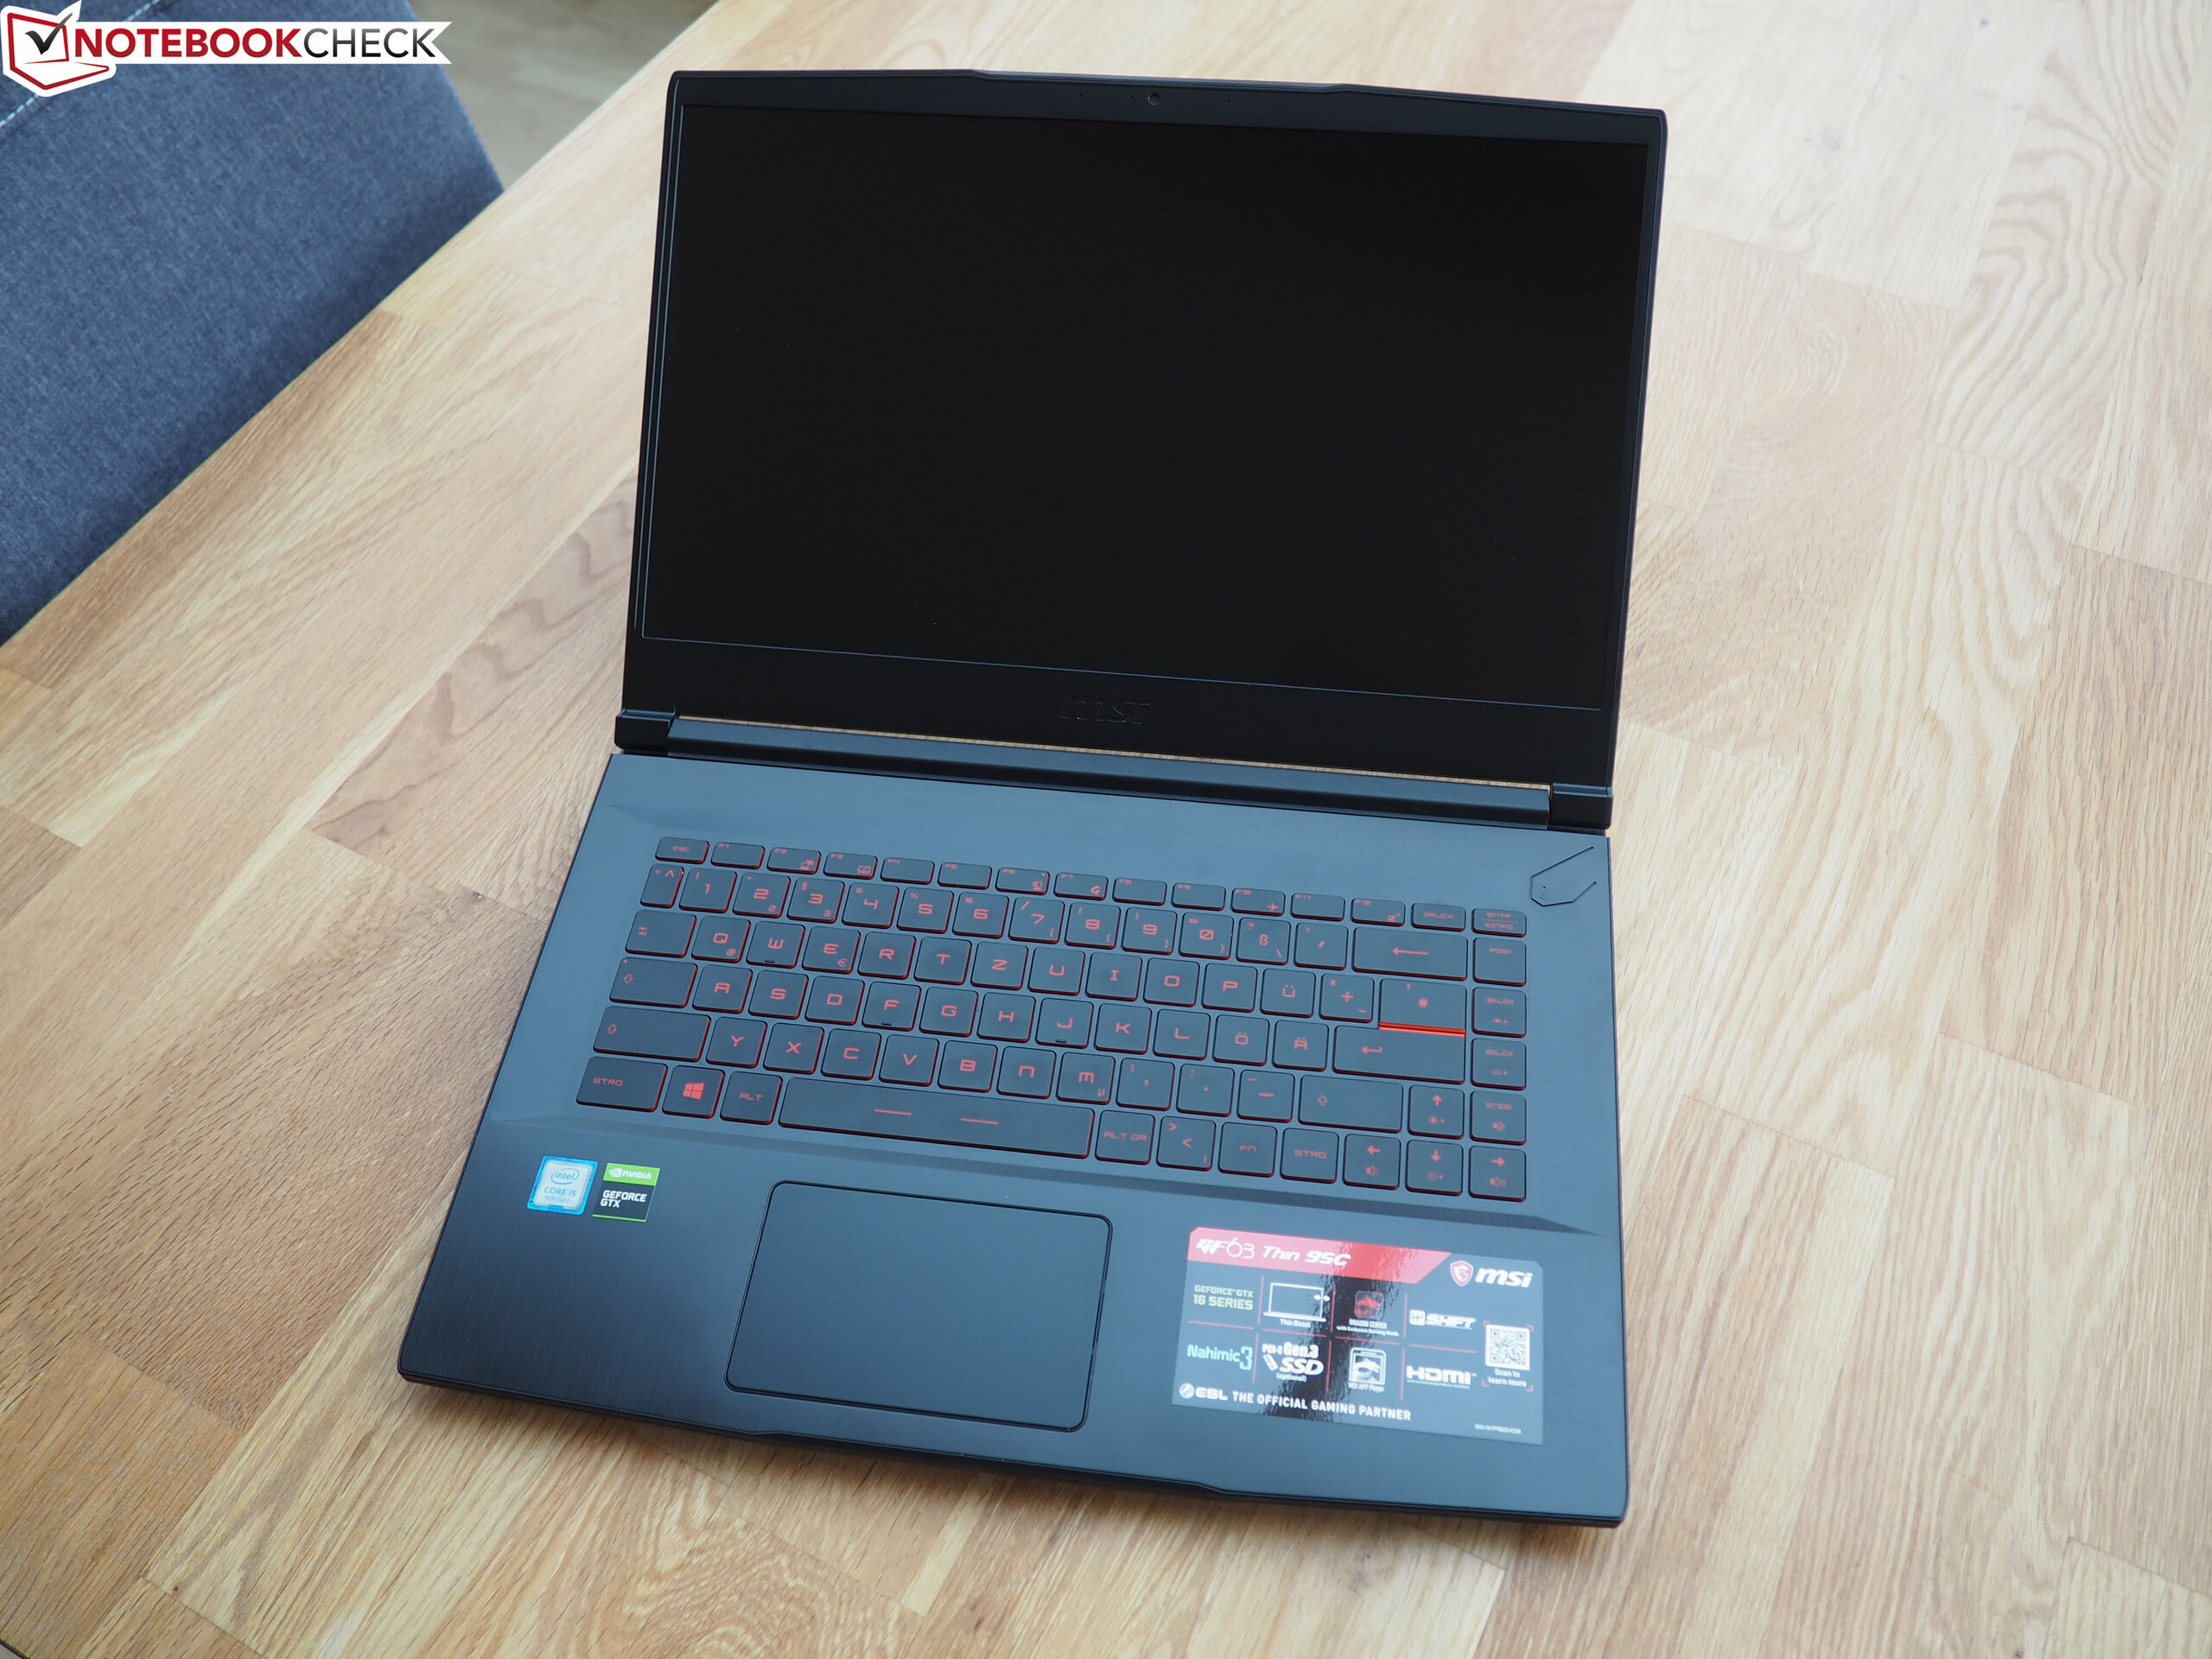
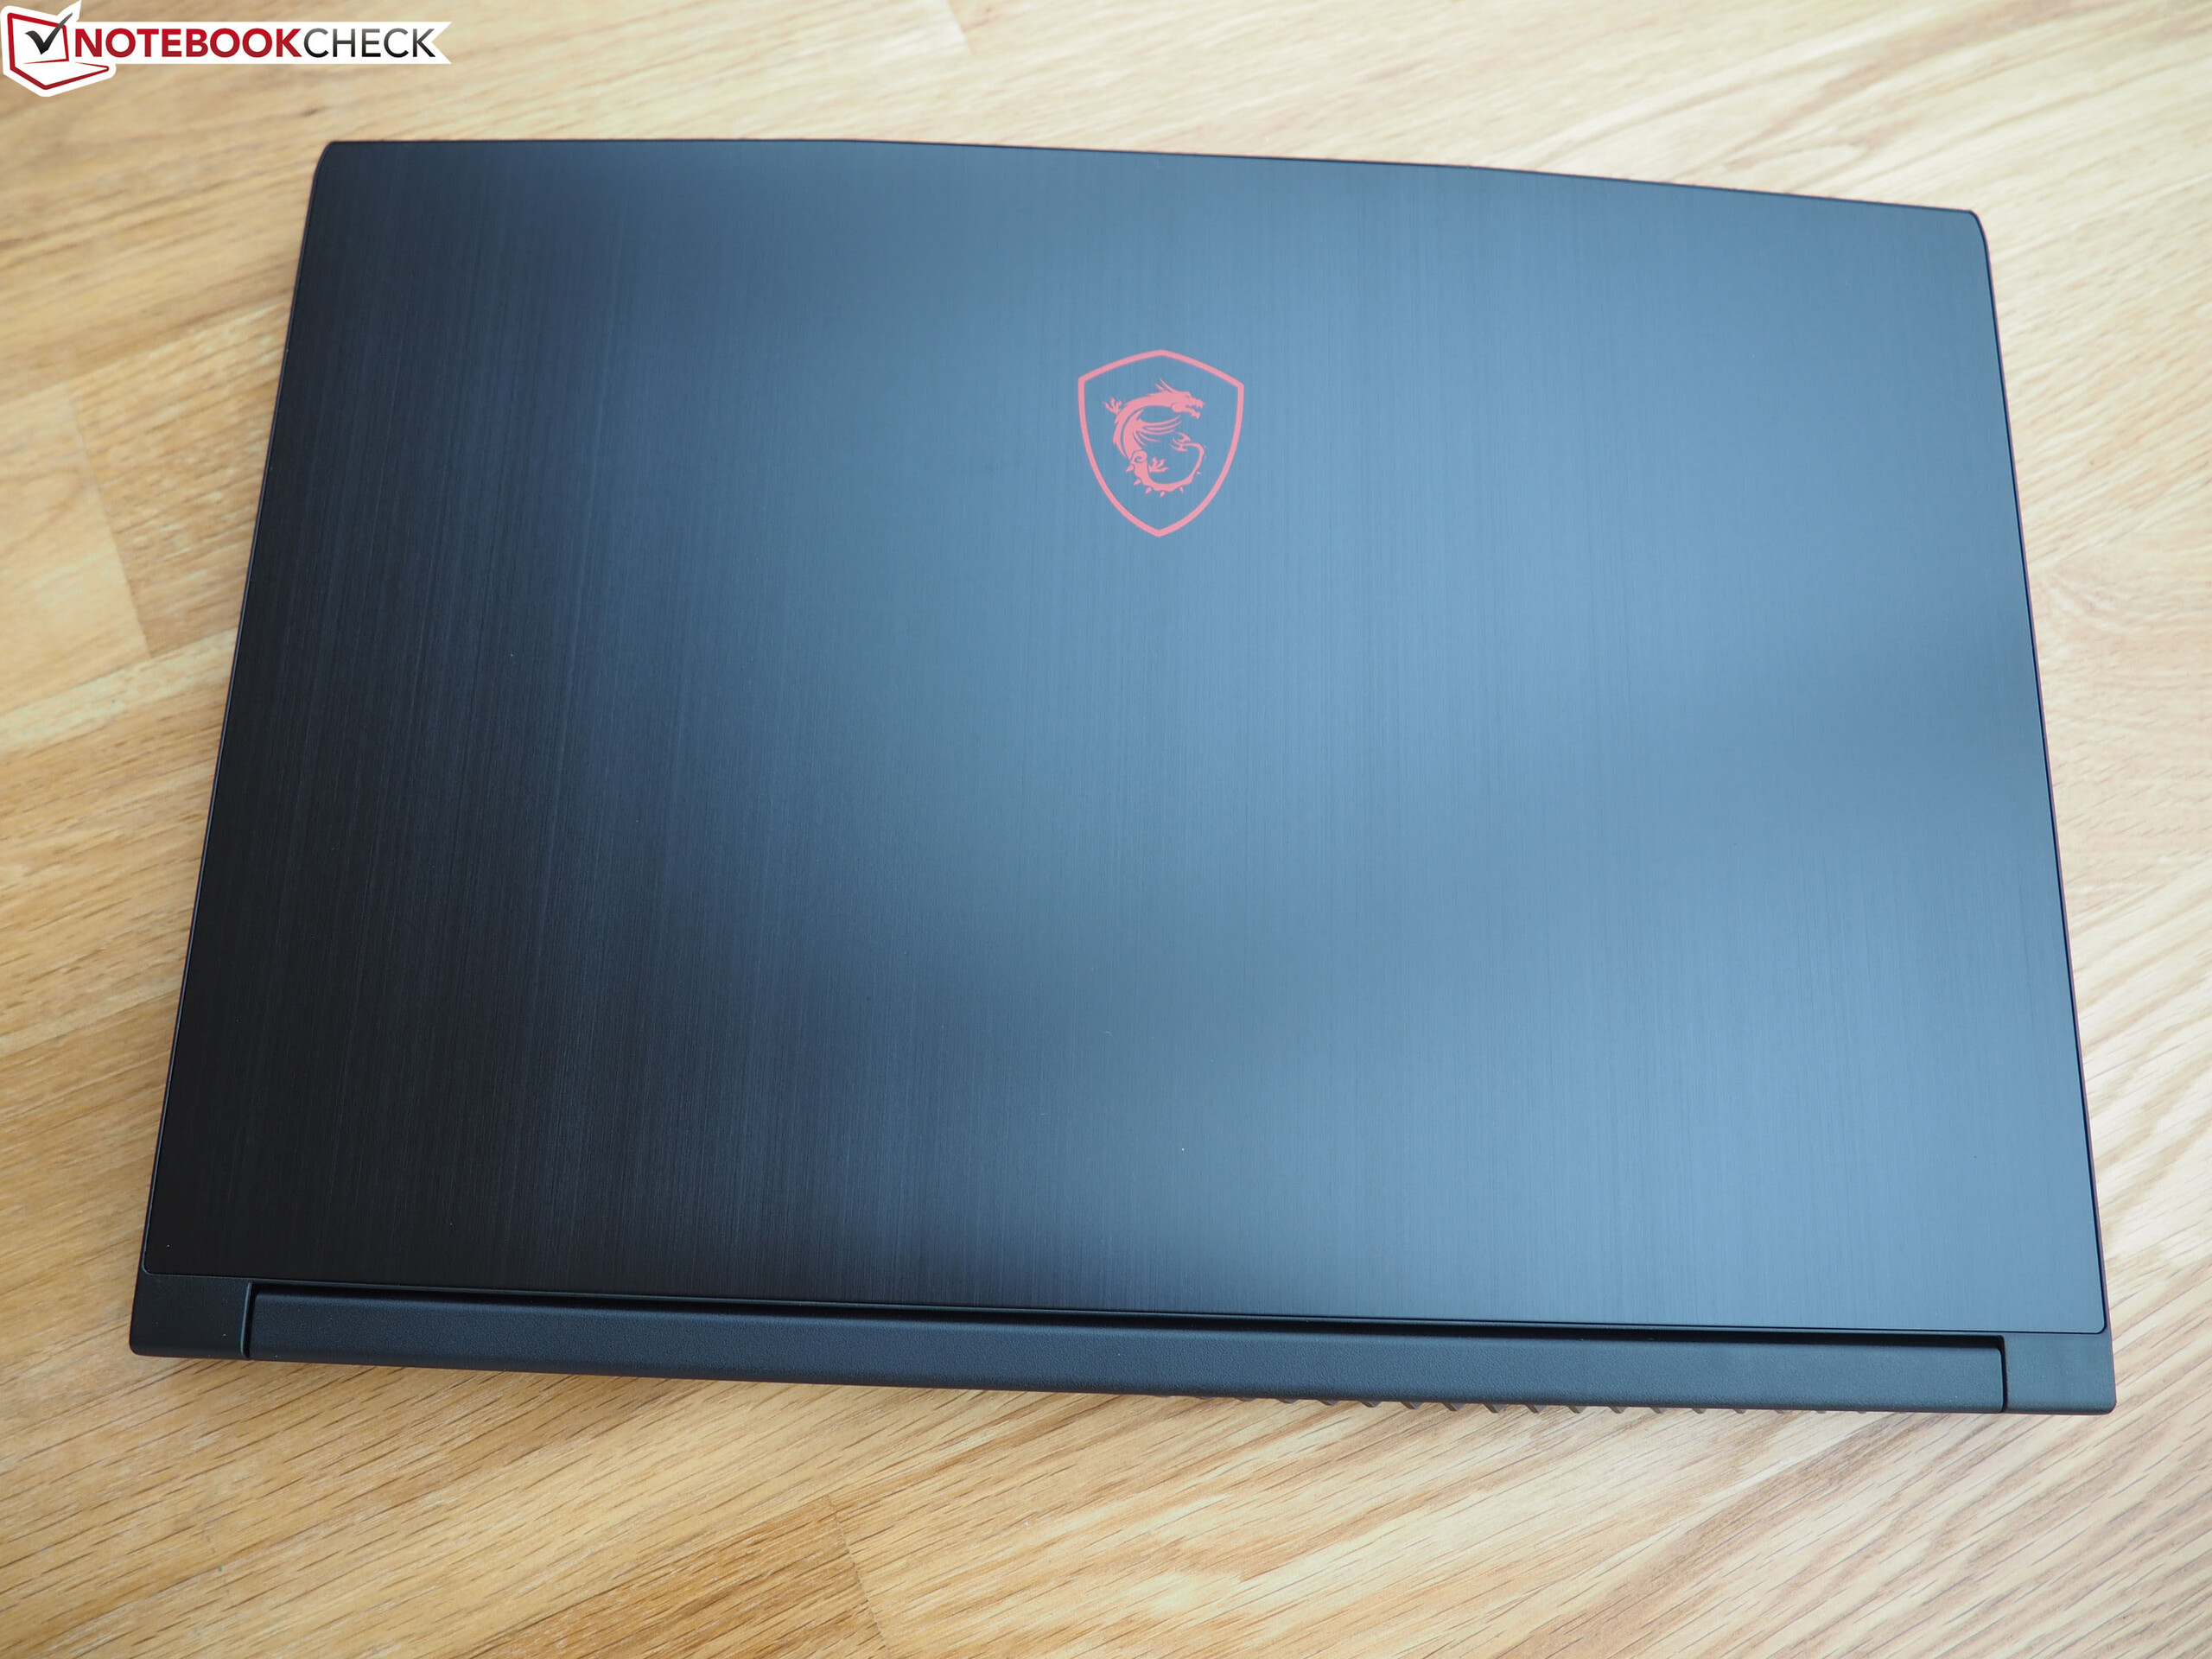
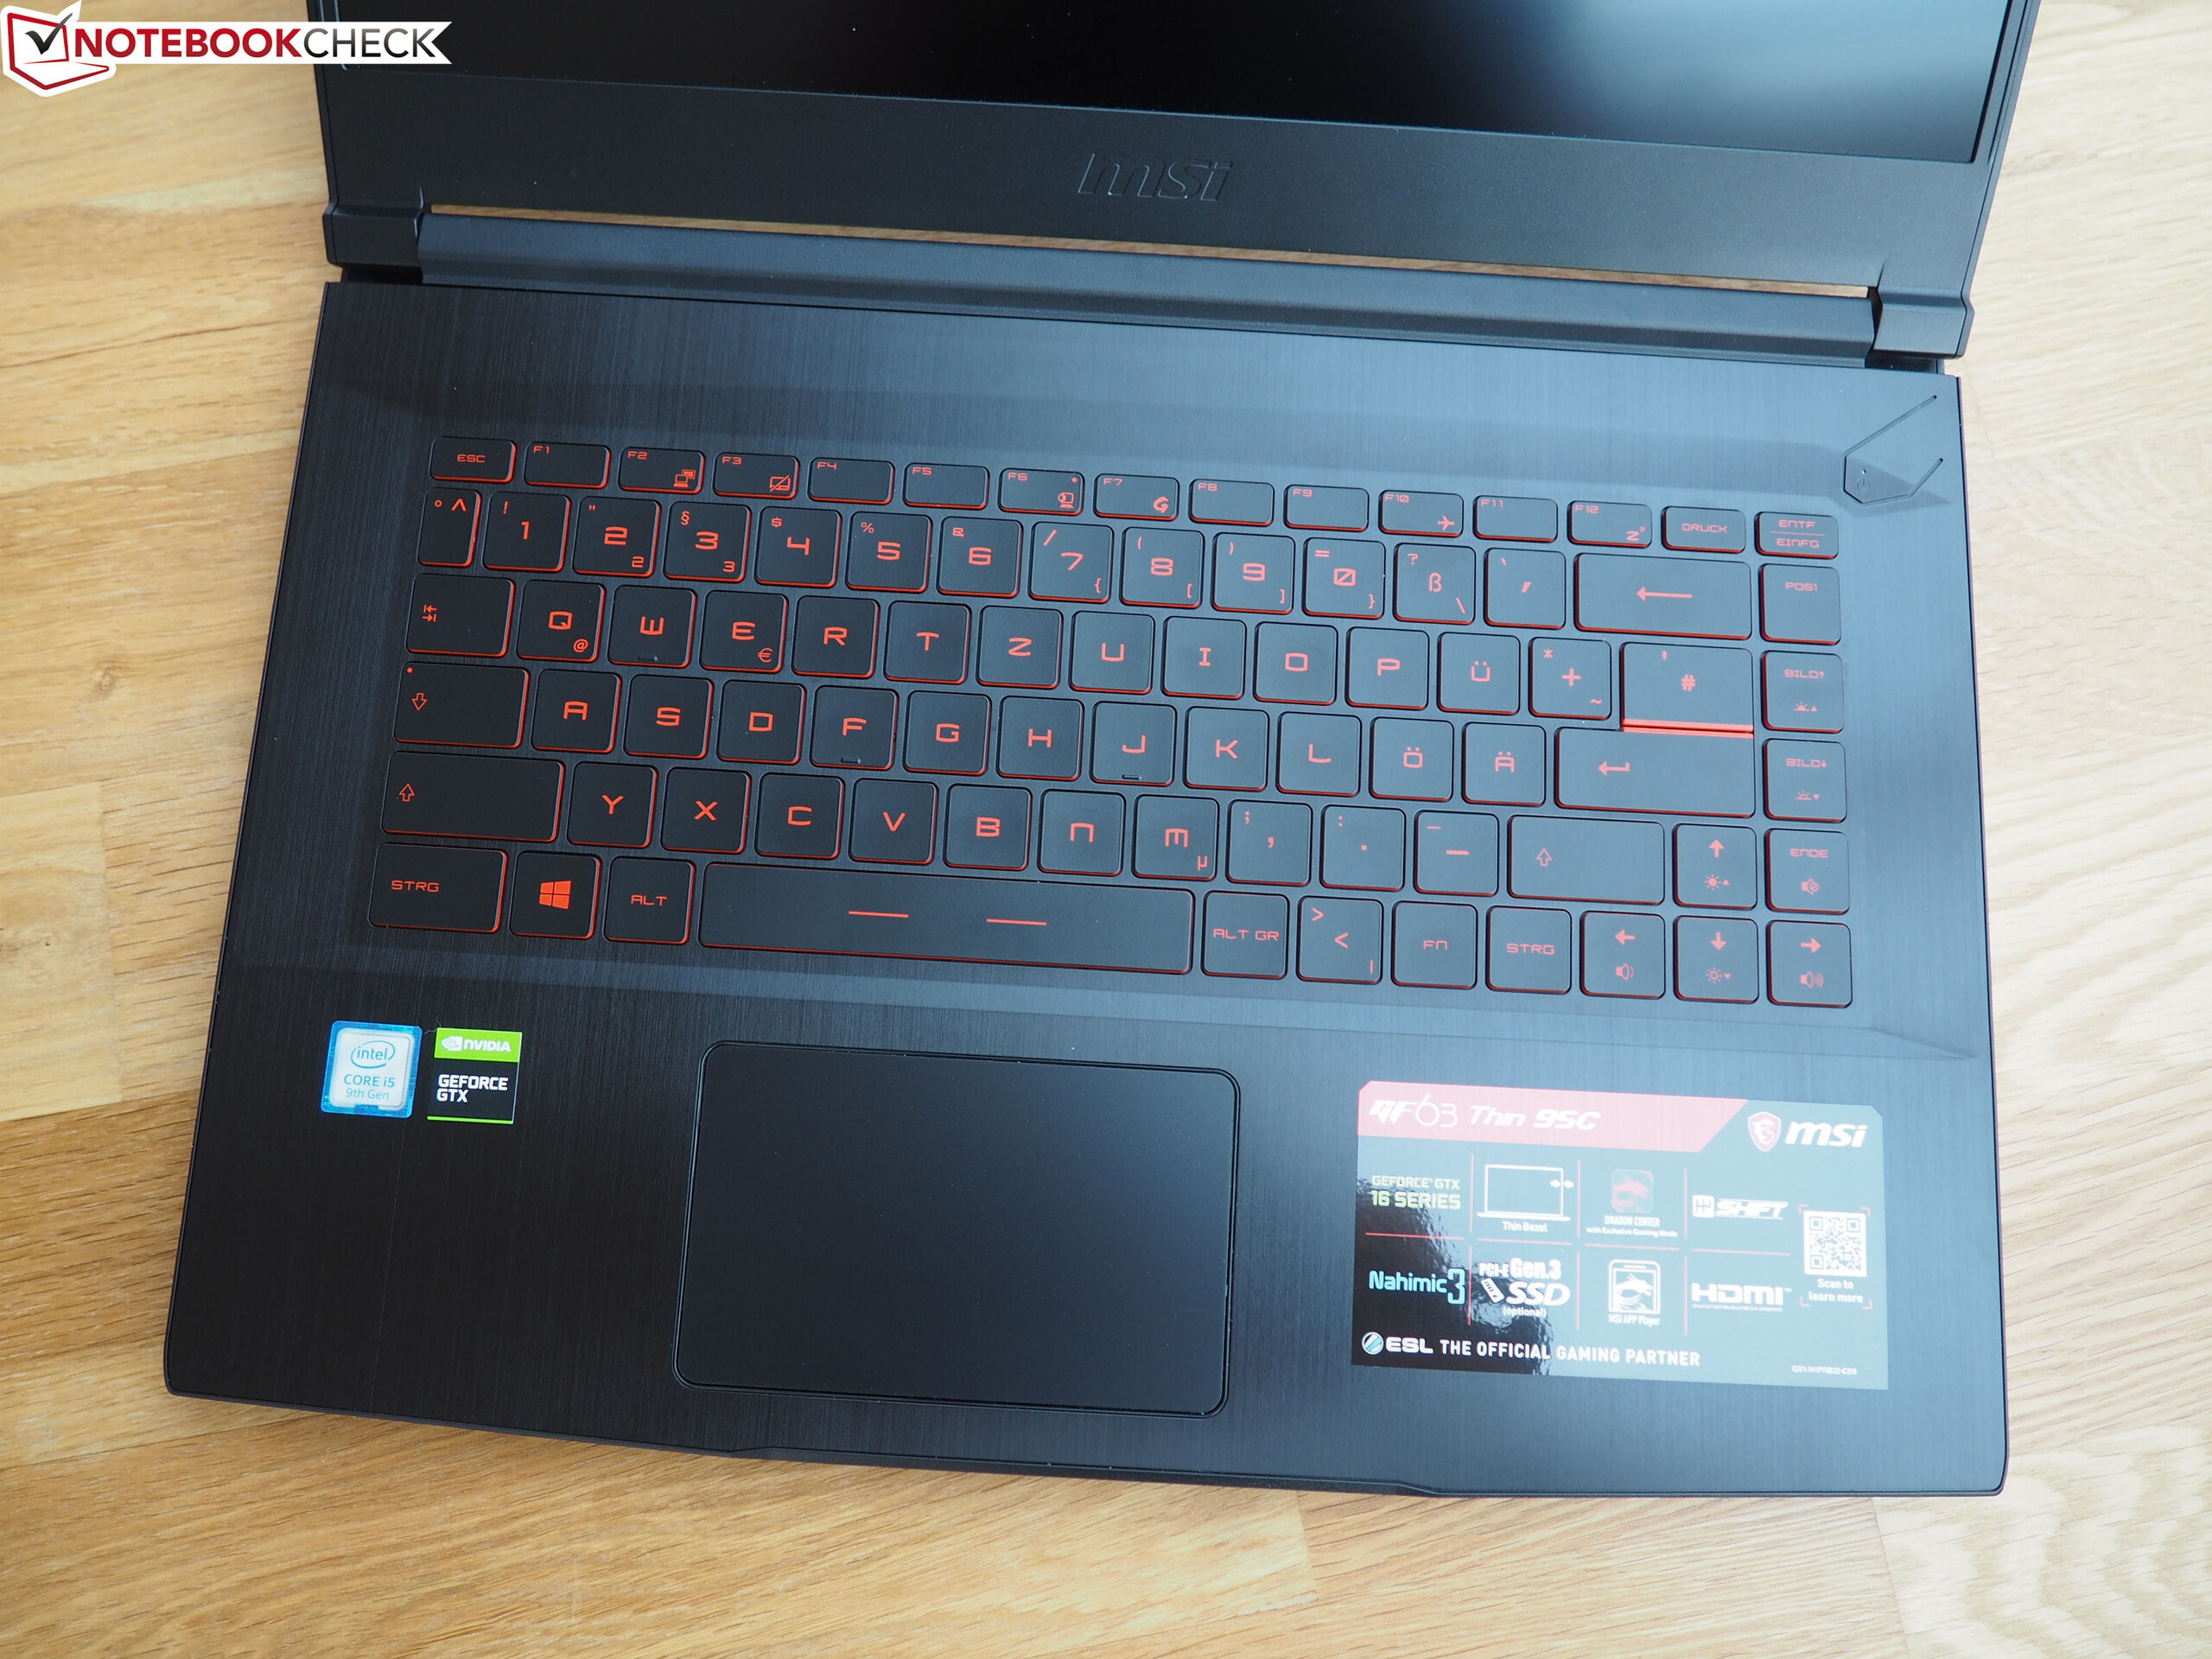
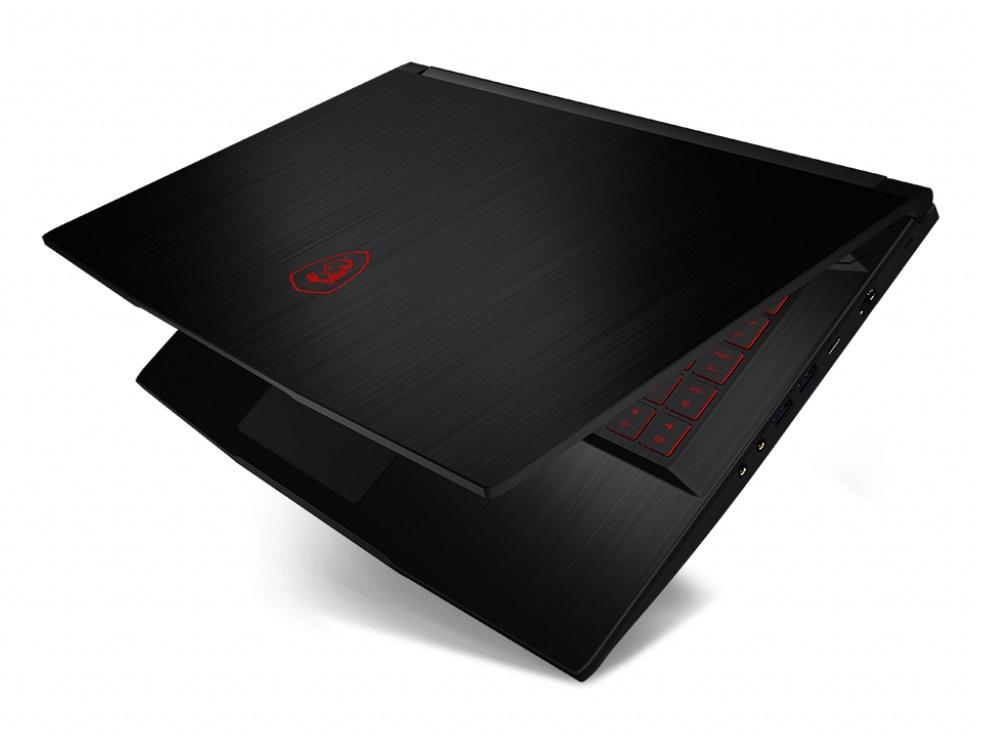
MSI GF63 Thin 9SC笔记本电脑评测:不到1000刀的轻薄游戏本
Rating | Date | Model | Weight | Height | Size | Resolution | Price |
|---|---|---|---|---|---|---|---|
| 77.6 % v7 (old) | 03 / 2020 | MSI GF63 Thin 9SC i5-9300H, GeForce GTX 1650 Max-Q | 1.8 kg | 22 mm | 15.60" | 1920x1080 | |
| 79.6 % v7 (old) | 08 / 2019 | Dell G5 15 5590-PCNJJ i5-9300H, GeForce GTX 1650 Mobile | 2.7 kg | 23.7 mm | 15.60" | 1920x1080 | |
| 82.5 % v6 (old) | 07 / 2019 | Acer Aspire Nitro 5 AN515-54-53Z2 i5-9300H, GeForce GTX 1650 Mobile | 2.2 kg | 27 mm | 15.60" | 1920x1080 | |
| 81.5 % v7 (old) | HP Omen 15-dc1020ng i5-9300H, GeForce GTX 1650 Mobile | 2.3 kg | 25 mm | 15.60" | 1920x1080 | ||
| 77 % v7 (old) | 12 / 2019 | Lenovo IdeaPad L340-15IRH 81LK00BMGE i5-9300H, GeForce GTX 1650 Mobile | 2.1 kg | 23.9 mm | 15.60" | 1920x1080 |
| Networking | |
| iperf3 transmit AX12 | |
| MSI GF63 Thin 9SC | |
| iperf3 receive AX12 | |
| MSI GF63 Thin 9SC | |
| |||||||||||||||||||||||||
Brightness Distribution: 92 %
Center on Battery: 260 cd/m²
Contrast: 1130:1 (Black: 0.23 cd/m²)
ΔE ColorChecker Calman: 4.1 | ∀{0.5-29.43 Ø4.71}
calibrated: 3.56
ΔE Greyscale Calman: 2.83 | ∀{0.09-98 Ø4.96}
56% sRGB (Argyll 1.6.3 3D)
36% AdobeRGB 1998 (Argyll 1.6.3 3D)
39.01% AdobeRGB 1998 (Argyll 3D)
56.5% sRGB (Argyll 3D)
37.76% Display P3 (Argyll 3D)
Gamma: 2.53
CCT: 6158 K
| MSI GF63 Thin 9SC AU Optronics B156HAN02.1 (AUO21ED), IPS, 1920x1080 | Dell G5 15 5590-PCNJJ AU Optronics B156HAN (AUO23ED), IPS, 1920x1080 | Acer Aspire Nitro 5 AN515-54-53Z2 LG LP156WFC-SPD1 (LGD0563), IPS, 1920x1080 | HP Omen 15-dc1020ng LGD05CE, IPS, 1920x1080 | Lenovo IdeaPad L340-15IRH 81LK00BMGE CMN 156HCA-EAB, IPS, 1920x1080 | |
|---|---|---|---|---|---|
| Display | 115% | 1% | 2% | 13% | |
| Display P3 Coverage (%) | 37.76 | 83.1 120% | 37.97 1% | 38.37 2% | 42.81 13% |
| sRGB Coverage (%) | 56.5 | 99.9 77% | 57 1% | 57.6 2% | 63.8 13% |
| AdobeRGB 1998 Coverage (%) | 39.01 | 96.8 148% | 39.23 1% | 39.69 2% | 44.31 14% |
| Response Times | -1% | 11% | 9% | 1% | |
| Response Time Grey 50% / Grey 80% * (ms) | 44.8 ? | 48 ? -7% | 42 ? 6% | 40 ? 11% | 45.6 ? -2% |
| Response Time Black / White * (ms) | 31.6 ? | 30 ? 5% | 26.8 ? 15% | 29.6 ? 6% | 30.8 ? 3% |
| PWM Frequency (Hz) | 25910 ? | ||||
| Screen | -19% | -2% | -21% | -16% | |
| Brightness middle (cd/m²) | 260 | 234 -10% | 238 -8% | 251 -3% | 275 6% |
| Brightness (cd/m²) | 249 | 216 -13% | 226 -9% | 232 -7% | 253 2% |
| Brightness Distribution (%) | 92 | 87 -5% | 83 -10% | 76 -17% | 83 -10% |
| Black Level * (cd/m²) | 0.23 | 0.22 4% | 0.27 -17% | 0.17 26% | 0.18 22% |
| Contrast (:1) | 1130 | 1064 -6% | 881 -22% | 1476 31% | 1528 35% |
| Colorchecker dE 2000 * | 4.1 | 6.52 -59% | 4.11 -0% | 6.2 -51% | 5.4 -32% |
| Colorchecker dE 2000 max. * | 7.93 | 10.58 -33% | 6.89 13% | 18.6 -135% | 21.3 -169% |
| Colorchecker dE 2000 calibrated * | 3.56 | 3.56 -0% | 3.76 -6% | 4.8 -35% | 4.4 -24% |
| Greyscale dE 2000 * | 2.83 | 5.33 -88% | 1.78 37% | 4.2 -48% | 3.7 -31% |
| Gamma | 2.53 87% | 2.86 77% | 2.41 91% | 2.32 95% | 2.12 104% |
| CCT | 6158 106% | 5983 109% | 6311 103% | 7454 87% | 6376 102% |
| Color Space (Percent of AdobeRGB 1998) (%) | 36 | 36 0% | 36 0% | 36.5 1% | 40.8 13% |
| Color Space (Percent of sRGB) (%) | 56 | 57 2% | 57 2% | 57.4 2% | 63.6 14% |
| Total Average (Program / Settings) | 32% /
8% | 3% /
0% | -3% /
-13% | -1% /
-8% |
* ... smaller is better
Display Response Times
| ↔ Response Time Black to White | ||
|---|---|---|
| 31.6 ms ... rise ↗ and fall ↘ combined | ↗ 17.2 ms rise | 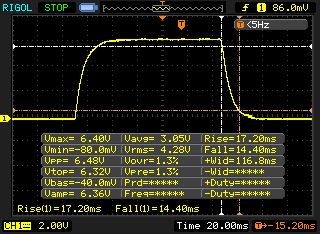 |
| ↘ 14.4 ms fall | ||
| The screen shows slow response rates in our tests and will be unsatisfactory for gamers. In comparison, all tested devices range from 0.1 (minimum) to 240 (maximum) ms. » 85 % of all devices are better. This means that the measured response time is worse than the average of all tested devices (19.8 ms). | ||
| ↔ Response Time 50% Grey to 80% Grey | ||
| 44.8 ms ... rise ↗ and fall ↘ combined | ↗ 22 ms rise | 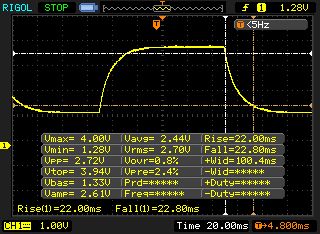 |
| ↘ 22.8 ms fall | ||
| The screen shows slow response rates in our tests and will be unsatisfactory for gamers. In comparison, all tested devices range from 0.165 (minimum) to 636 (maximum) ms. » 76 % of all devices are better. This means that the measured response time is worse than the average of all tested devices (31 ms). | ||
Screen Flickering / PWM (Pulse-Width Modulation)
| Screen flickering / PWM not detected | 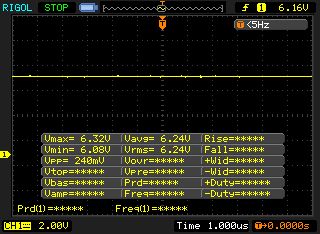 | ||
In comparison: 52 % of all tested devices do not use PWM to dim the display. If PWM was detected, an average of 7754 (minimum: 5 - maximum: 343500) Hz was measured. | |||
| Cinebench R20 | |
| CPU (Single Core) | |
| Average of class Gaming (442 - 913, n=106, last 2 years) | |
| HP Omen 15-dc1020ng | |
| MSI GF63 Thin 9SC | |
| Dell G5 15 5590-PCNJJ | |
| Lenovo IdeaPad L340-15IRH 81LK00BMGE | |
| CPU (Multi Core) | |
| Average of class Gaming (4029 - 16433, n=106, last 2 years) | |
| Dell G5 15 5590-PCNJJ | |
| MSI GF63 Thin 9SC | |
| HP Omen 15-dc1020ng | |
| Lenovo IdeaPad L340-15IRH 81LK00BMGE | |
| Cinebench R15 | |
| CPU Single 64Bit | |
| Average of class Gaming (188.8 - 350, n=106, last 2 years) | |
| Acer Aspire Nitro 5 AN515-54-53Z2 | |
| Lenovo IdeaPad L340-15IRH 81LK00BMGE | |
| MSI GF63 Thin 9SC | |
| HP Omen 15-dc1020ng | |
| Dell G5 15 5590-PCNJJ | |
| CPU Multi 64Bit | |
| Average of class Gaming (1578 - 6330, n=105, last 2 years) | |
| Dell G5 15 5590-PCNJJ | |
| Lenovo IdeaPad L340-15IRH 81LK00BMGE | |
| MSI GF63 Thin 9SC | |
| HP Omen 15-dc1020ng | |
| Acer Aspire Nitro 5 AN515-54-53Z2 | |
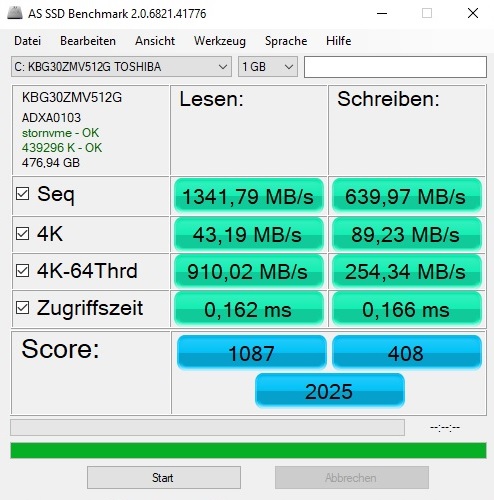
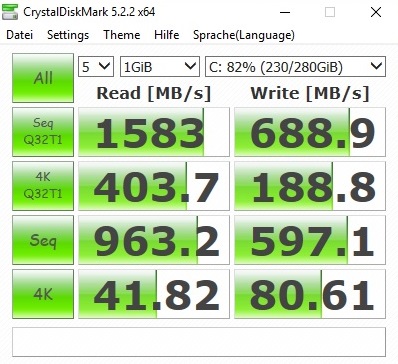
| MSI GF63 Thin 9SC Toshiba KBG30ZMV512G | Dell G5 15 5590-PCNJJ KBG30ZMS128G | Acer Aspire Nitro 5 AN515-54-53Z2 WDC PC SN520 SDAPNUW-512G | HP Omen 15-dc1020ng WDC PC SN720 SDAQNTW-512G | Lenovo IdeaPad L340-15IRH 81LK00BMGE WDC PC SN520 SDAPMUW-512 | |
|---|---|---|---|---|---|
| CrystalDiskMark 5.2 / 6 | -43% | 48% | 105% | 34% | |
| Write 4K (MB/s) | 80.6 | 65.3 -19% | 109.1 35% | 112.1 39% | 103.6 29% |
| Read 4K (MB/s) | 41.82 | 29.71 -29% | 42.05 1% | 42.01 0% | 39.91 -5% |
| Write Seq (MB/s) | 597 | 128.8 -78% | 1457 144% | 1964 229% | 1160 94% |
| Read Seq (MB/s) | 963 | 859 -11% | 1421 48% | 2065 114% | 990 3% |
| Write 4K Q32T1 (MB/s) | 188.8 | 95.8 -49% | 287.8 52% | 318.2 69% | 283.4 50% |
| Read 4K Q32T1 (MB/s) | 403.7 | 197.6 -51% | 317.9 -21% | 406.7 1% | 344.5 -15% |
| Write Seq Q32T1 (MB/s) | 689 | 132.5 -81% | 1455 111% | 2534 268% | 1455 111% |
| Read Seq Q32T1 (MB/s) | 1583 | 1208 -24% | 1739 10% | 3438 117% | 1690 7% |

| 3DMark 11 Performance | 10378 points | |
| 3DMark Cloud Gate Standard Score | 17713 points | |
| 3DMark Fire Strike Score | 7177 points | |
| 3DMark Time Spy Score | 3136 points | |
Help | ||
| 3DMark | |
| 1920x1080 Fire Strike Graphics | |
| Average of class Gaming (12242 - 62849, n=115, last 2 years) | |
| HP Omen 15-dc1020ng | |
| Acer Aspire Nitro 5 AN515-54-53Z2 | |
| Dell G5 15 5590-PCNJJ | |
| Lenovo IdeaPad L340-15IRH 81LK00BMGE | |
| MSI GF63 Thin 9SC | |
| 2560x1440 Time Spy Graphics | |
| Average of class Gaming (5012 - 26212, n=115, last 2 years) | |
| HP Omen 15-dc1020ng | |
| Lenovo IdeaPad L340-15IRH 81LK00BMGE | |
| Dell G5 15 5590-PCNJJ | |
| MSI GF63 Thin 9SC | |
| 3DMark 11 - 1280x720 Performance GPU | |
| Average of class Gaming (21841 - 80022, n=104, last 2 years) | |
| HP Omen 15-dc1020ng | |
| Lenovo IdeaPad L340-15IRH 81LK00BMGE | |
| Dell G5 15 5590-PCNJJ | |
| Acer Aspire Nitro 5 AN515-54-53Z2 | |
| MSI GF63 Thin 9SC | |
| The Witcher 3 | |
| 1920x1080 High Graphics & Postprocessing (Nvidia HairWorks Off) | |
| Average of class Gaming (341 - 404, n=2, last 2 years) | |
| HP Omen 15-dc1020ng | |
| Acer Aspire Nitro 5 AN515-54-53Z2 | |
| Dell G5 15 5590-PCNJJ | |
| MSI GF63 Thin 9SC | |
| 1920x1080 Ultra Graphics & Postprocessing (HBAO+) | |
| Average of class Gaming (104.7 - 240, n=7, last 2 years) | |
| HP Omen 15-dc1020ng | |
| Acer Aspire Nitro 5 AN515-54-53Z2 | |
| Lenovo IdeaPad L340-15IRH 81LK00BMGE | |
| Dell G5 15 5590-PCNJJ | |
| MSI GF63 Thin 9SC | |
| low | med. | high | ultra | |
|---|---|---|---|---|
| The Witcher 3 (2015) | 146 | 99 | 53.2 | 30.4 |
| Apex Legends (2019) | 144 | 71.1 | 58.4 | 57 |
| Far Cry New Dawn (2019) | 72 | 52 | 49 | 46 |
| Metro Exodus (2019) | 73.3 | 36.9 | 27.5 | 22.6 |
| Dirt Rally 2.0 (2019) | 154 | 81.6 | 68.8 | 38.7 |
| The Division 2 (2019) | 82 | 56 | 45 | 32 |
| Anno 1800 (2019) | 60.4 | 52.2 | 34.7 | 18 |
| Rage 2 (2019) | 103 | 46.5 | 39.7 | 38.9 |
| F1 2019 (2019) | 127 | 83 | 69 | 46 |
| Control (2019) | 120 | 39.9 | 29.1 | |
| Borderlands 3 (2019) | 86 | 53.6 | 34.9 | 26 |
| FIFA 20 (2019) | 150 | 118 | 115 | 114 |
| Ghost Recon Breakpoint (2019) | 63 | 41 | 39 | 26 |
| GRID 2019 (2019) | 92.4 | 65.9 | 53.4 | 36.7 |
| Call of Duty Modern Warfare 2019 (2019) | 94.1 | 59 | 49.8 | 40.6 |
| Need for Speed Heat (2019) | 67.6 | 52.2 | 46.8 | 37.2 |
| Star Wars Jedi Fallen Order (2019) | 57.2 | 49.7 | 44.4 | |
| Red Dead Redemption 2 (2019) | 56.3 | 43.5 | 29.3 | 18.6 |
Noise level
| Idle |
| 35 / 36 / 37 dB(A) |
| Load |
| 44 / 43 dB(A) |
 | ||
30 dB silent 40 dB(A) audible 50 dB(A) loud |
||
min: | ||
| MSI GF63 Thin 9SC i5-9300H, GeForce GTX 1650 Max-Q | Dell G5 15 5590-PCNJJ i5-9300H, GeForce GTX 1650 Mobile | Acer Aspire Nitro 5 AN515-54-53Z2 i5-9300H, GeForce GTX 1650 Mobile | HP Omen 15-dc1020ng i5-9300H, GeForce GTX 1650 Mobile | Lenovo IdeaPad L340-15IRH 81LK00BMGE i5-9300H, GeForce GTX 1650 Mobile | Average of class Gaming | |
|---|---|---|---|---|---|---|
| Noise | -3% | 1% | 14% | 16% | 11% | |
| off / environment * (dB) | 30 | 30 -0% | 30 -0% | 28.8 4% | 28.4 5% | 24.1 ? 20% |
| Idle Minimum * (dB) | 35 | 31 11% | 30 14% | 28.8 18% | 28.4 19% | 26 ? 26% |
| Idle Average * (dB) | 36 | 32 11% | 31 14% | 29.5 18% | 28.4 21% | 27.4 ? 24% |
| Idle Maximum * (dB) | 37 | 35 5% | 33 11% | 31.1 16% | 28.4 23% | 30.1 ? 19% |
| Load Average * (dB) | 44 | 49 -11% | 46 -5% | 35.2 20% | 30.1 32% | 43.6 ? 1% |
| Witcher 3 ultra * (dB) | 41 | 47 -15% | 46 -12% | 35.2 14% | 40.2 2% | |
| Load Maximum * (dB) | 43 | 53 -23% | 49 -14% | 41 5% | 40.2 7% | 54.2 ? -26% |
* ... smaller is better
(-) The maximum temperature on the upper side is 47 °C / 117 F, compared to the average of 40.4 °C / 105 F, ranging from 21.2 to 68.8 °C for the class Gaming.
(-) The bottom heats up to a maximum of 47 °C / 117 F, compared to the average of 43.2 °C / 110 F
(+) In idle usage, the average temperature for the upper side is 23.8 °C / 75 F, compared to the device average of 33.9 °C / 93 F.
(-) Playing The Witcher 3, the average temperature for the upper side is 38.8 °C / 102 F, compared to the device average of 33.9 °C / 93 F.
(+) The palmrests and touchpad are reaching skin temperature as a maximum (32 °C / 89.6 F) and are therefore not hot.
(-) The average temperature of the palmrest area of similar devices was 28.8 °C / 83.8 F (-3.2 °C / -5.8 F).
| MSI GF63 Thin 9SC i5-9300H, GeForce GTX 1650 Max-Q | Dell G5 15 5590-PCNJJ i5-9300H, GeForce GTX 1650 Mobile | Acer Aspire Nitro 5 AN515-54-53Z2 i5-9300H, GeForce GTX 1650 Mobile | HP Omen 15-dc1020ng i5-9300H, GeForce GTX 1650 Mobile | Lenovo IdeaPad L340-15IRH 81LK00BMGE i5-9300H, GeForce GTX 1650 Mobile | Average of class Gaming | |
|---|---|---|---|---|---|---|
| Heat | -4% | 2% | 6% | -8% | -12% | |
| Maximum Upper Side * (°C) | 47 | 49 -4% | 47 -0% | 40.3 14% | 44.8 5% | 45.2 ? 4% |
| Maximum Bottom * (°C) | 47 | 55 -17% | 50 -6% | 48.5 -3% | 58.1 -24% | 48.1 ? -2% |
| Idle Upper Side * (°C) | 26 | 25 4% | 24 8% | 23.9 8% | 27.9 -7% | 31 ? -19% |
| Idle Bottom * (°C) | 26 | 26 -0% | 25 4% | 24.6 5% | 27.9 -7% | 34.2 ? -32% |
* ... smaller is better
MSI GF63 Thin 9SC audio analysis
(+) | speakers can play relatively loud (86 dB)
Bass 100 - 315 Hz
(-) | nearly no bass - on average 19.5% lower than median
(±) | linearity of bass is average (10.9% delta to prev. frequency)
Mids 400 - 2000 Hz
(±) | higher mids - on average 7.7% higher than median
(±) | linearity of mids is average (9.9% delta to prev. frequency)
Highs 2 - 16 kHz
(+) | balanced highs - only 1.8% away from median
(+) | highs are linear (6.3% delta to prev. frequency)
Overall 100 - 16.000 Hz
(±) | linearity of overall sound is average (18.9% difference to median)
Compared to same class
» 63% of all tested devices in this class were better, 8% similar, 29% worse
» The best had a delta of 6%, average was 18%, worst was 132%
Compared to all devices tested
» 44% of all tested devices were better, 8% similar, 48% worse
» The best had a delta of 4%, average was 23%, worst was 134%
Dell G5 15 5590-PCNJJ audio analysis
(+) | speakers can play relatively loud (87 dB)
Bass 100 - 315 Hz
(-) | nearly no bass - on average 19.7% lower than median
(±) | linearity of bass is average (11.9% delta to prev. frequency)
Mids 400 - 2000 Hz
(±) | higher mids - on average 5.7% higher than median
(+) | mids are linear (4.9% delta to prev. frequency)
Highs 2 - 16 kHz
(±) | reduced highs - on average 6.5% lower than median
(±) | linearity of highs is average (9.6% delta to prev. frequency)
Overall 100 - 16.000 Hz
(±) | linearity of overall sound is average (17.4% difference to median)
Compared to same class
» 48% of all tested devices in this class were better, 12% similar, 40% worse
» The best had a delta of 6%, average was 18%, worst was 132%
Compared to all devices tested
» 33% of all tested devices were better, 8% similar, 58% worse
» The best had a delta of 4%, average was 23%, worst was 134%
| Off / Standby | |
| Idle | |
| Load |
|
Key:
min: | |
| MSI GF63 Thin 9SC i5-9300H, GeForce GTX 1650 Max-Q | Dell G5 15 5590-PCNJJ i5-9300H, GeForce GTX 1650 Mobile | Acer Aspire Nitro 5 AN515-54-53Z2 i5-9300H, GeForce GTX 1650 Mobile | HP Omen 15-dc1020ng i5-9300H, GeForce GTX 1650 Mobile | Lenovo IdeaPad L340-15IRH 81LK00BMGE i5-9300H, GeForce GTX 1650 Mobile | Average of class Gaming | |
|---|---|---|---|---|---|---|
| Power Consumption | 9% | 8% | 9% | 20% | -77% | |
| Idle Minimum * (Watt) | 7 | 4 43% | 5 29% | 4.04 42% | 3.8 46% | 13 ? -86% |
| Idle Average * (Watt) | 9 | 7 22% | 7 22% | 7.2 20% | 6.6 27% | 19 ? -111% |
| Idle Maximum * (Watt) | 13 | 12 8% | 11 15% | 11.4 12% | 8.9 32% | 24.6 ? -89% |
| Load Average * (Watt) | 79 | 95 -20% | 89 -13% | 80.8 -2% | 78.4 1% | 110.7 ? -40% |
| Witcher 3 ultra * (Watt) | 73 | 86 -18% | 90 -23% | 93.6 -28% | 82 -12% | |
| Load Maximum * (Watt) | 164 | 135 18% | 132 20% | 144.5 12% | 124 24% | 259 ? -58% |
* ... smaller is better
| MSI GF63 Thin 9SC i5-9300H, GeForce GTX 1650 Max-Q, 51 Wh | Dell G5 15 5590-PCNJJ i5-9300H, GeForce GTX 1650 Mobile, 60 Wh | Acer Aspire Nitro 5 AN515-54-53Z2 i5-9300H, GeForce GTX 1650 Mobile, 57 Wh | HP Omen 15-dc1020ng i5-9300H, GeForce GTX 1650 Mobile, 52.5 Wh | Lenovo IdeaPad L340-15IRH 81LK00BMGE i5-9300H, GeForce GTX 1650 Mobile, 45 Wh | Average of class Gaming | |
|---|---|---|---|---|---|---|
| Battery runtime | 79% | 71% | 44% | 5% | 28% | |
| Reader / Idle (h) | 8.5 | 14.5 71% | 17.4 105% | 15.9 87% | 7.8 -8% | 8.27 ? -3% |
| WiFi v1.3 (h) | 4.4 | 8 82% | 8.1 84% | 6.4 45% | 6.1 39% | 7.11 ? 62% |
| Load (h) | 1.2 | 2.2 83% | 1.5 25% | 1.2 0% | 1 -17% | 1.502 ? 25% |
| H.264 (h) | 8 | 8.32 ? | ||||
| Witcher 3 ultra (h) | 1 |
Pros
Cons
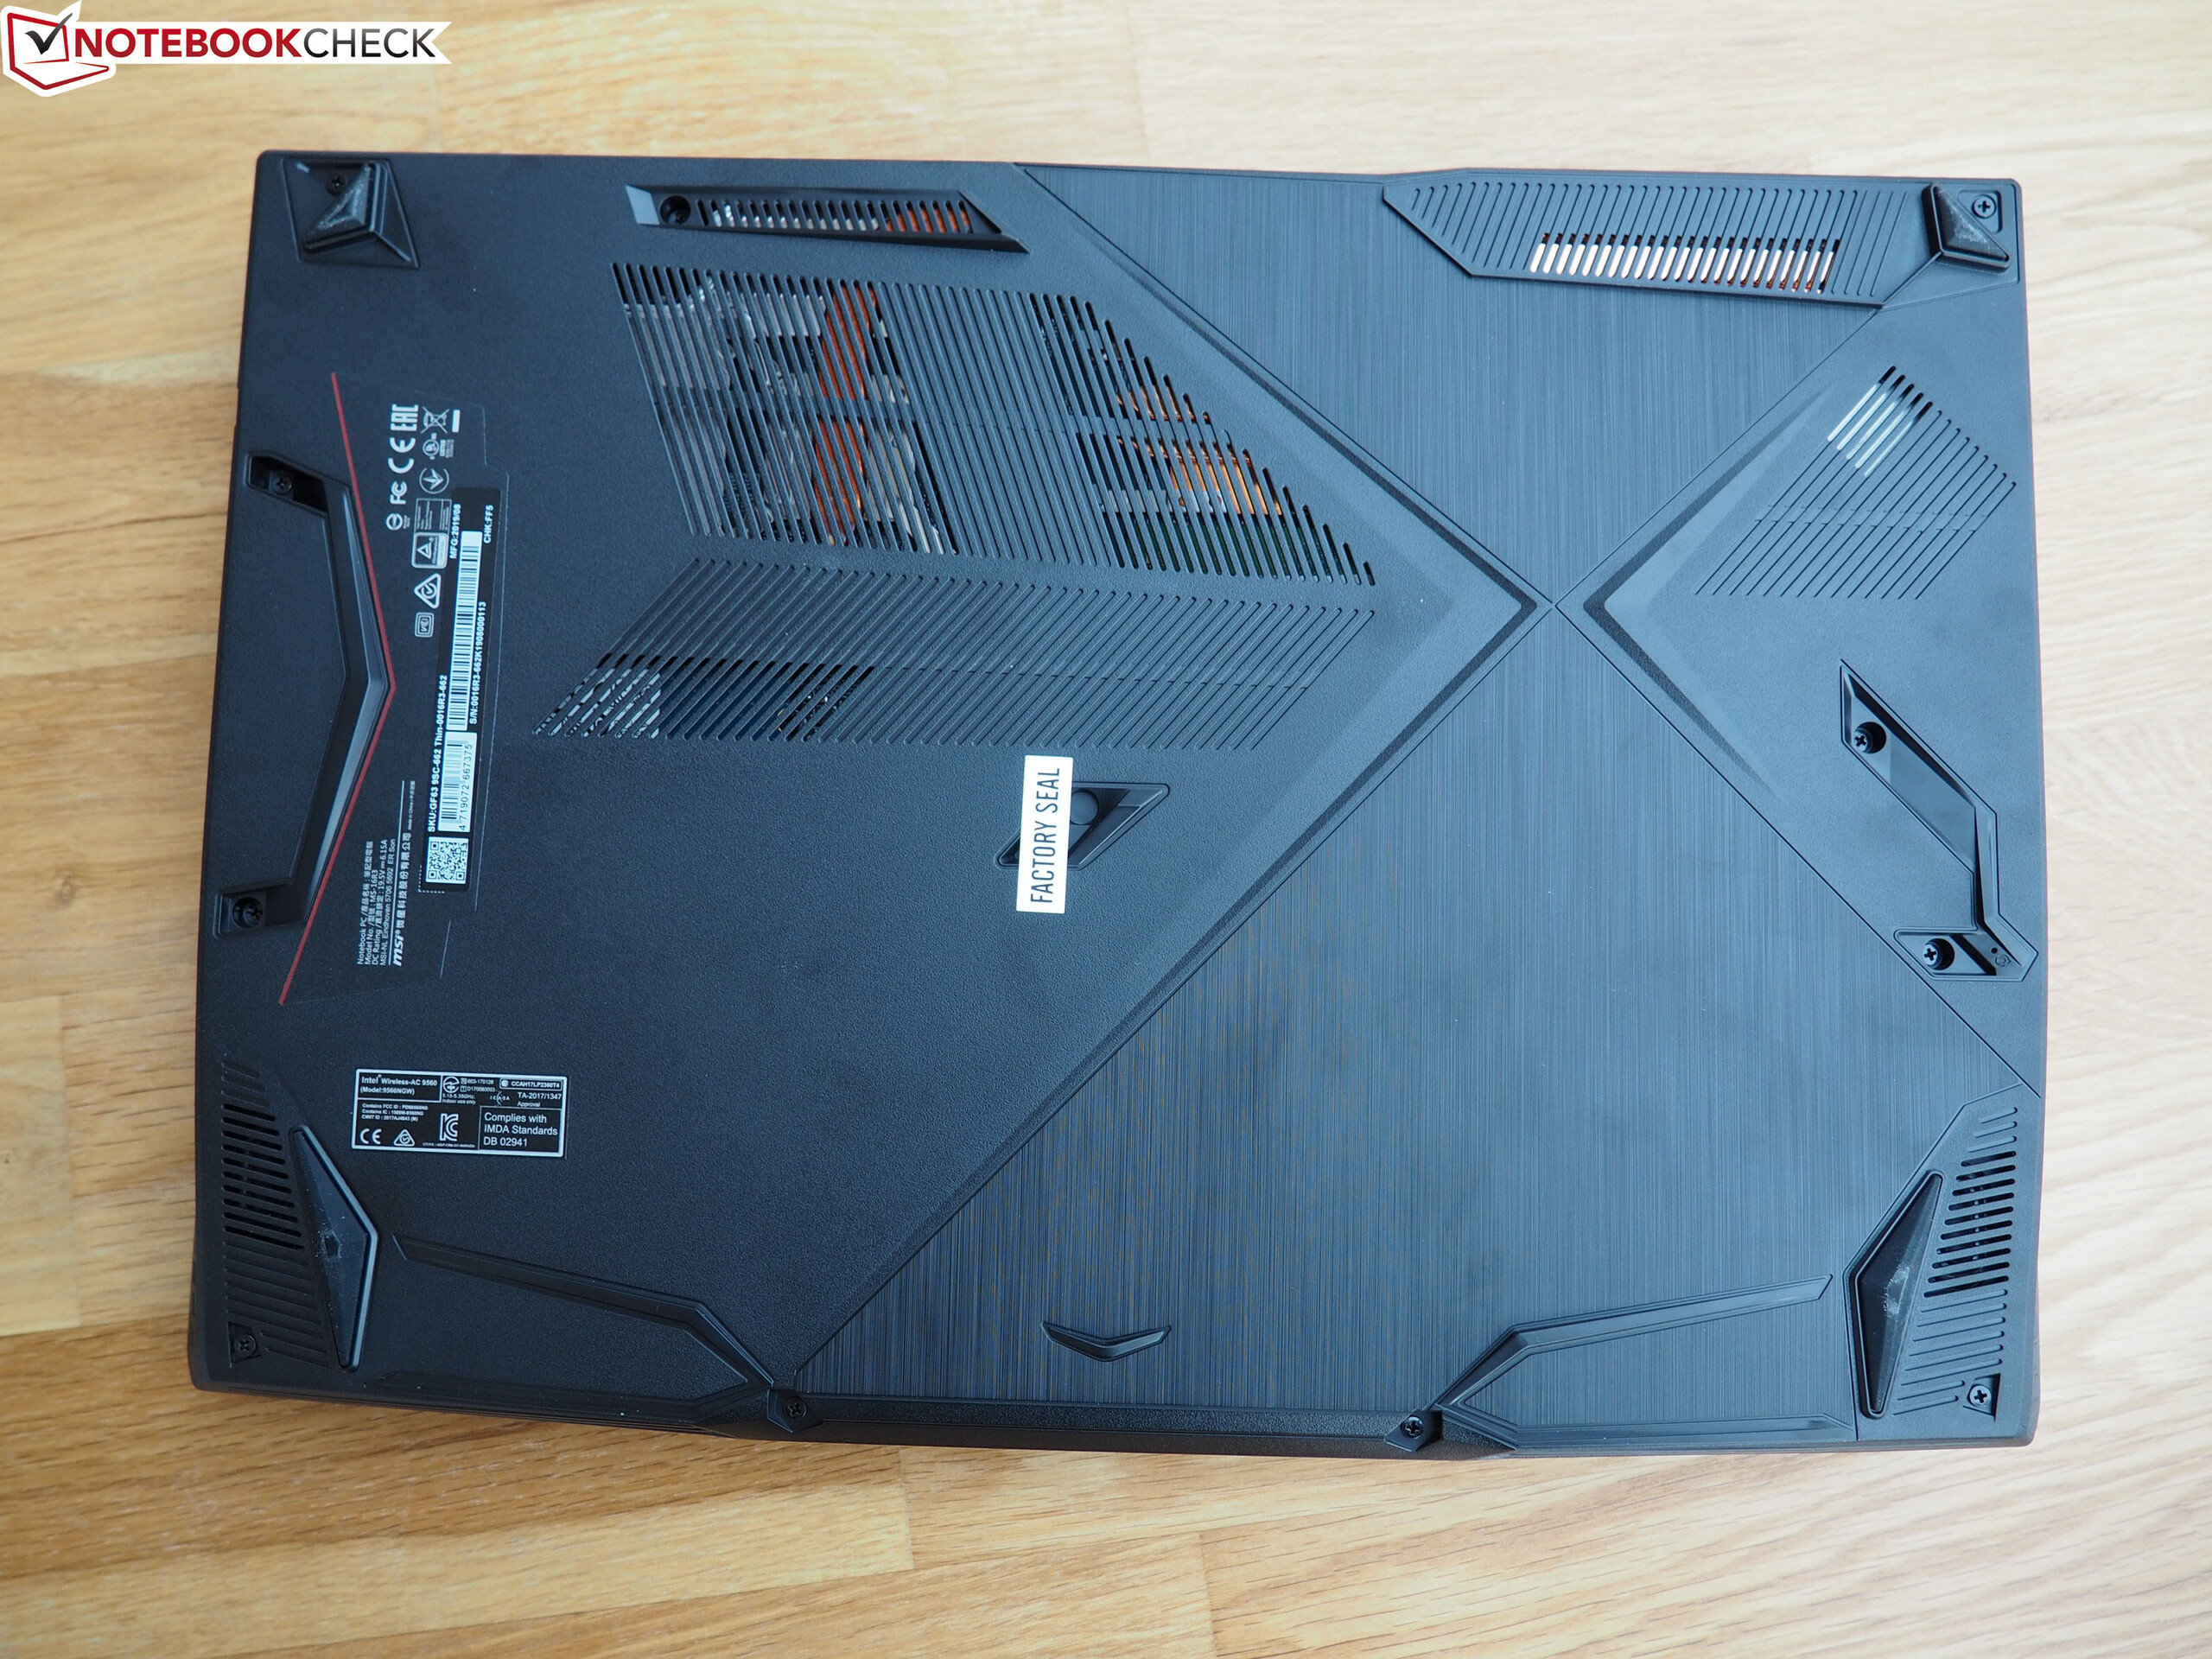
如果您忽略较差的接口选择(没有读卡器,没有DisplayPort,没有Thunderbolt 3或USB 3.1 Gen2),有改进空间的风扇控制(空转模式!)以及相对较暗和反应速度较慢的显示,那么MSI GF63 Thin 9SC 没有任何主要弱点。
这台15英寸游戏本体积紧凑,重量轻且具有良好的性价比,这对于正在寻求便携廉价的游戏笔记本电脑的玩家来说应该很合适。 输入设备,续航时间,外壳质量和性能都适合此价格。
但这是一个竞争激烈的领域,其他制造商(例如,戴尔,宏碁,惠普和联想)可以提供许多类似甚至更好的选择。
MSI GF63 Thin 9SC
- 05/14/2020 v7 (old)
Florian Glaser
Price comparison