结论:节省办公室空间的好帮手
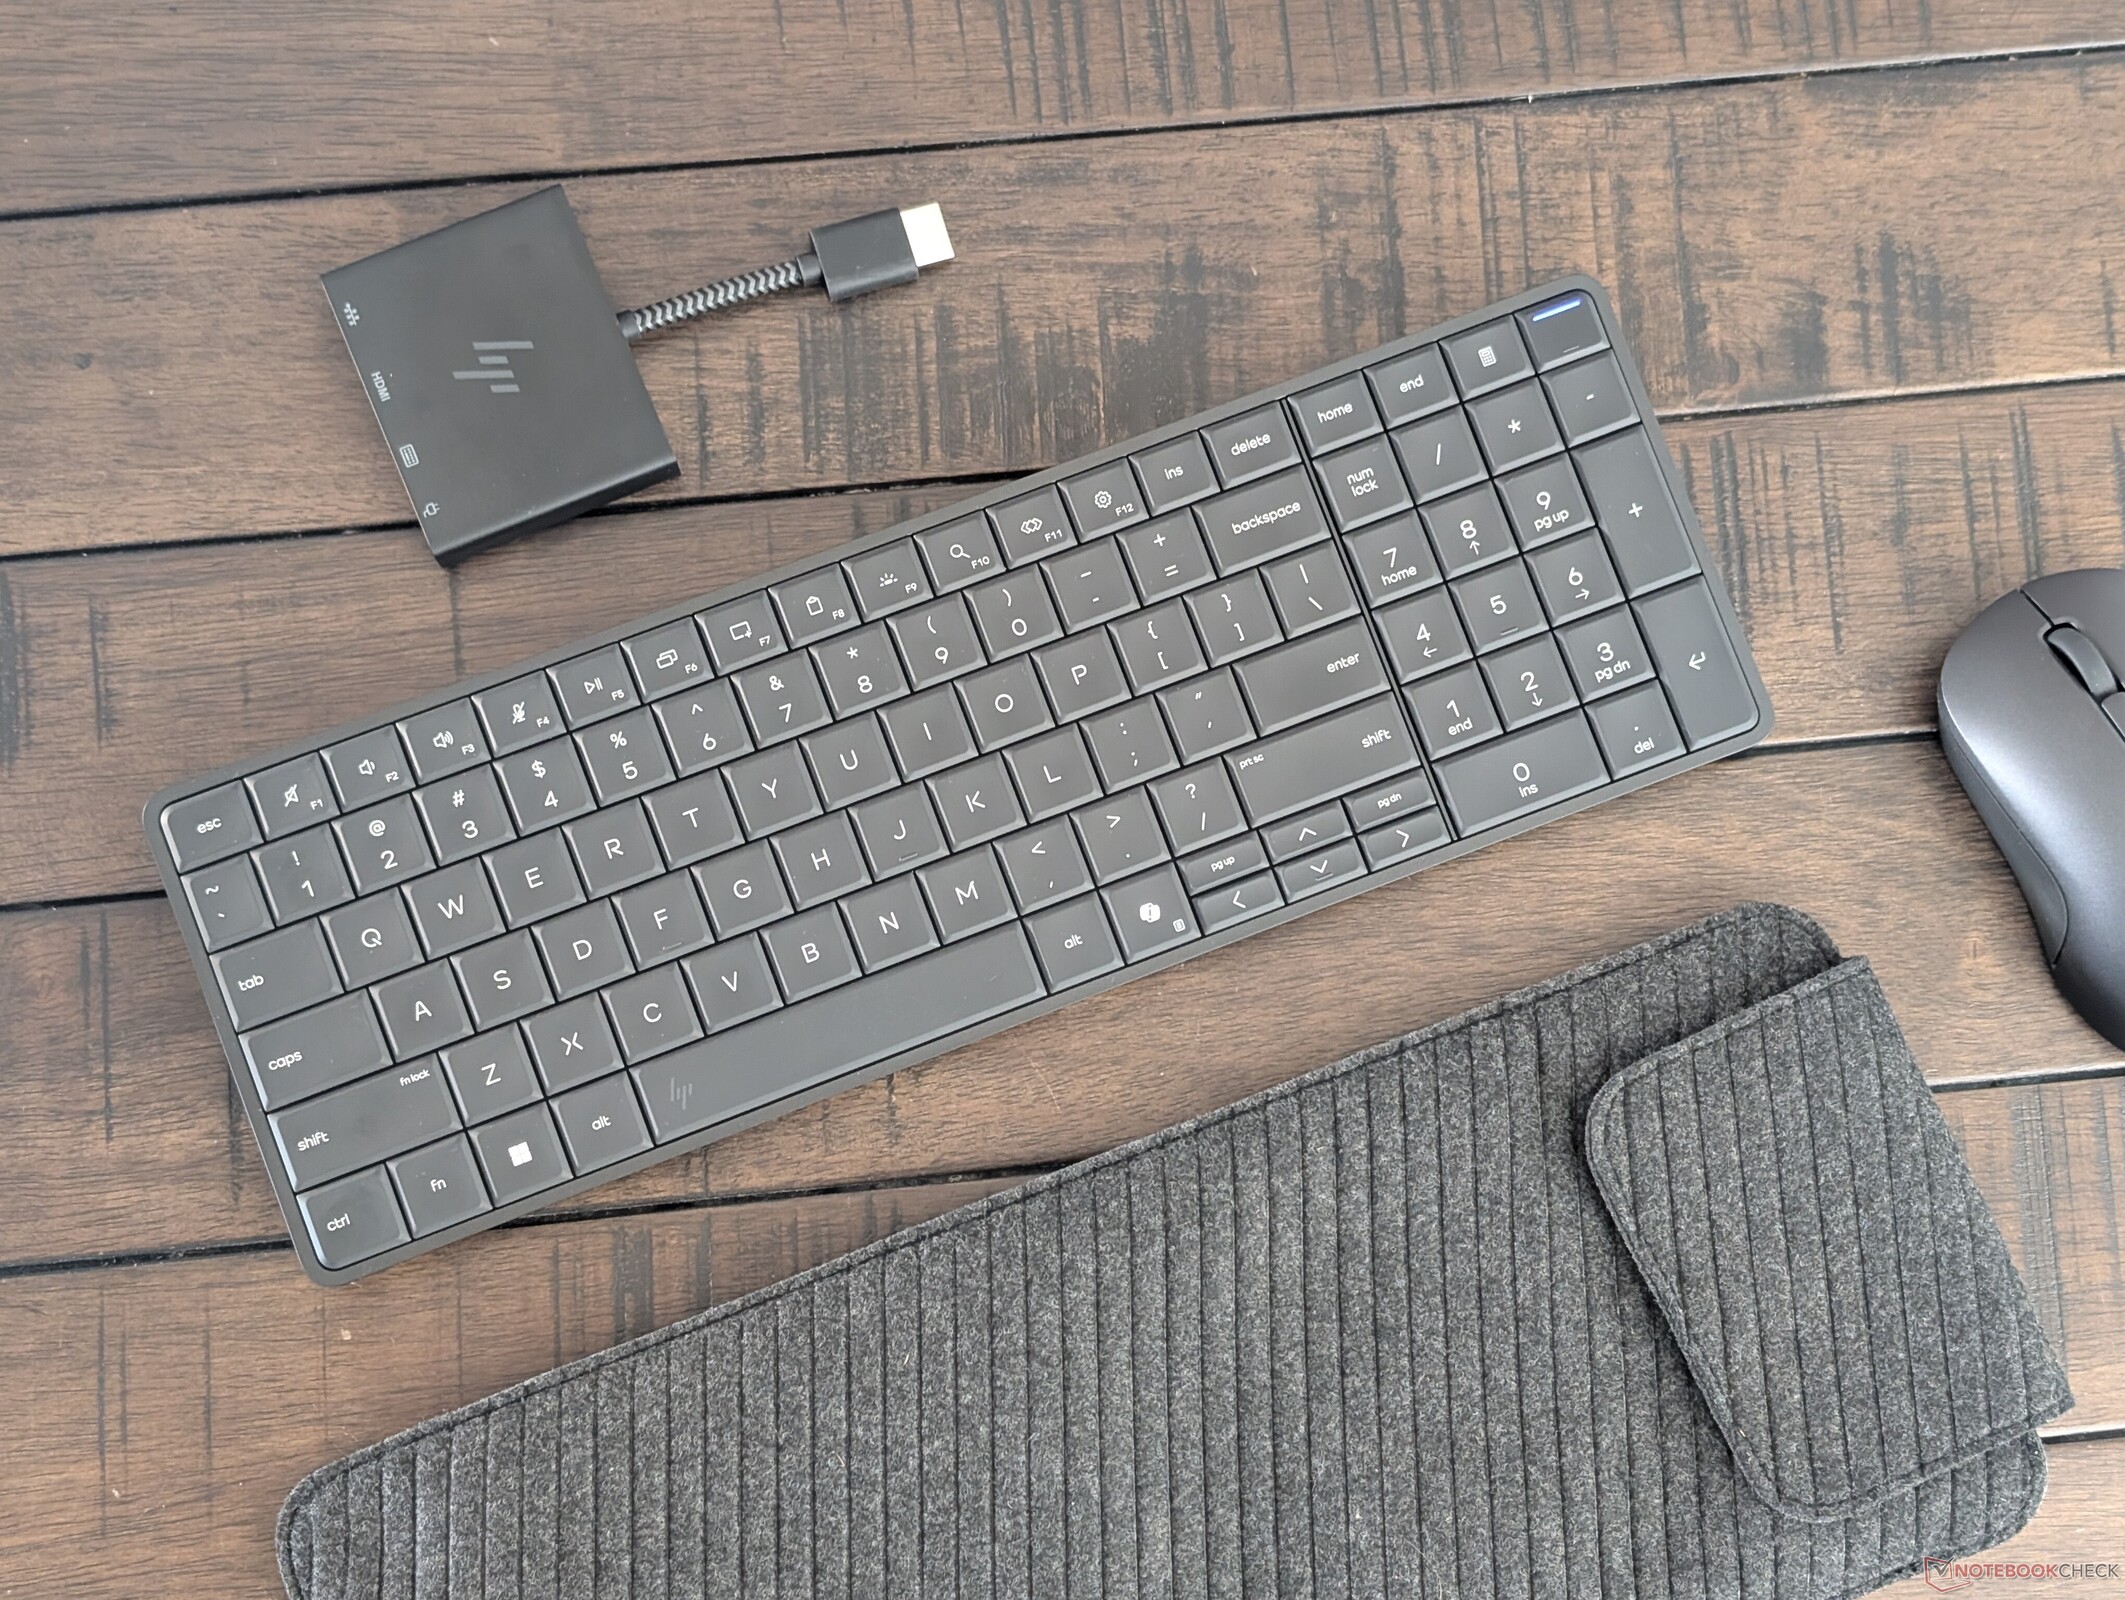
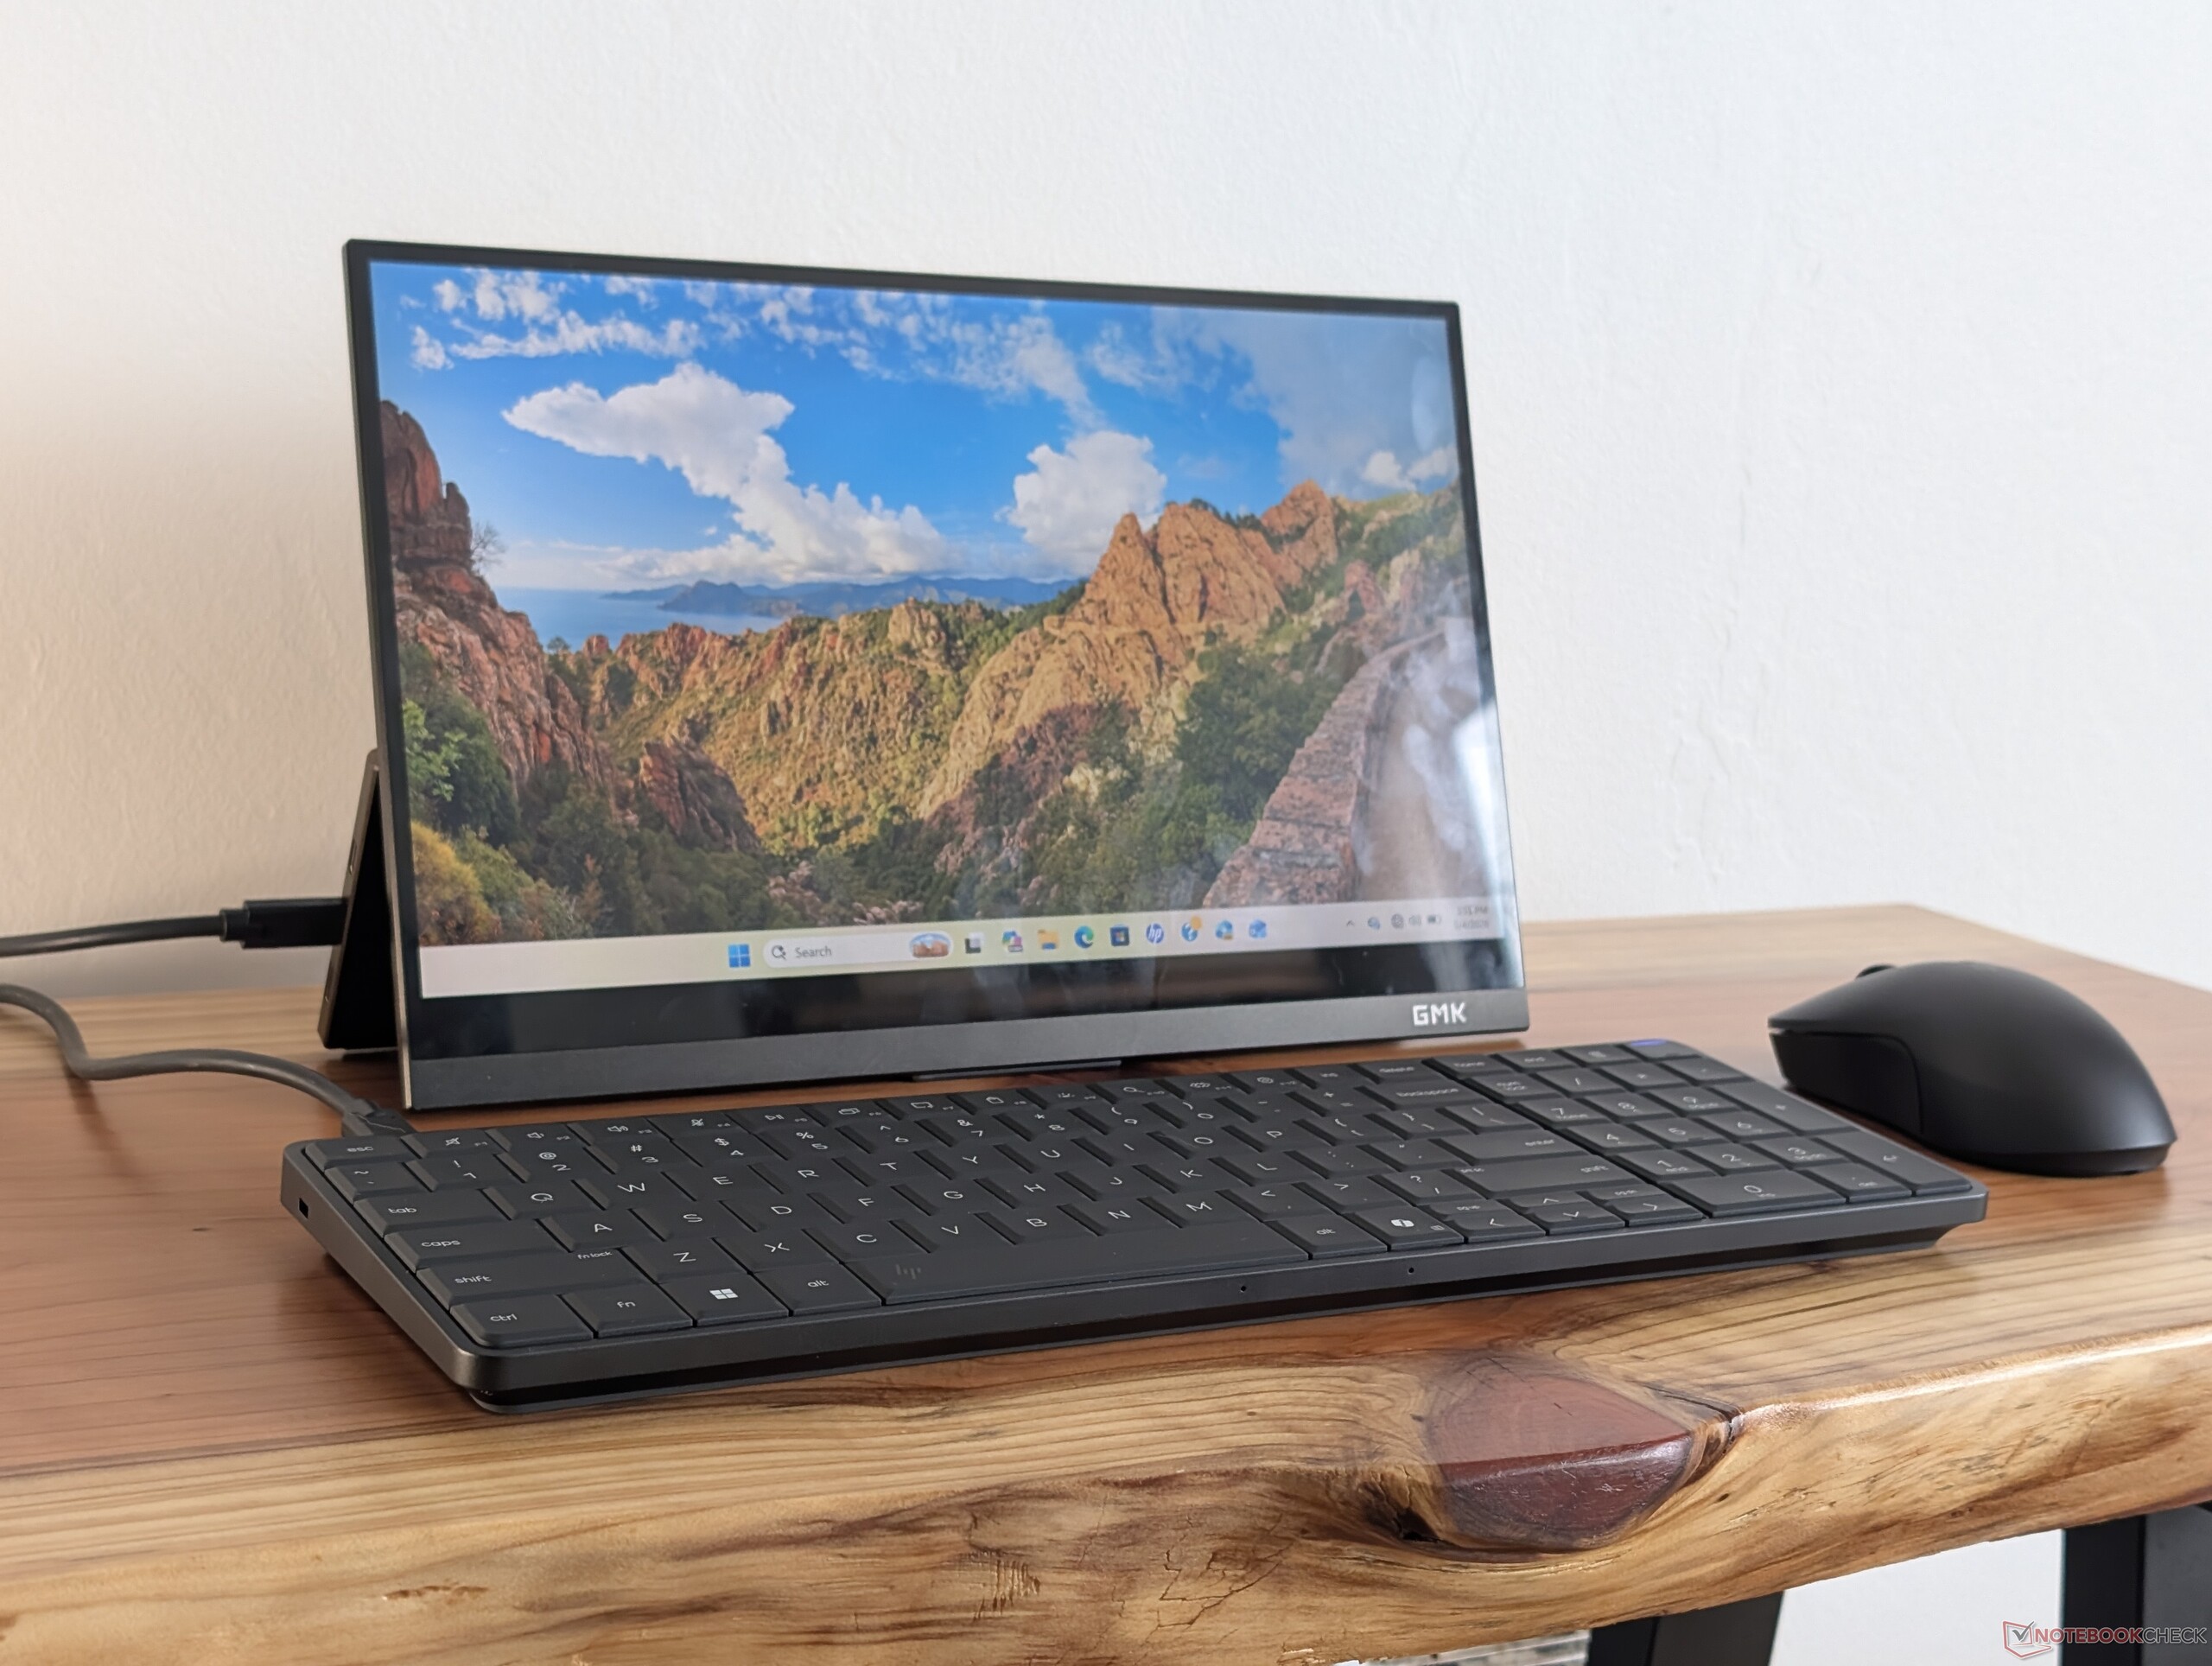
体验 EliteBoard G1a 的最佳方式是使用现有的 USB-C 显示器,以减少有限桌面空间中线缆的杂乱。与传统的迷你 PC 或 AIO 相比,简洁的单电缆即插即用设计可以说是 EliteBoard 最吸引人的地方。
对于经常在不同工作空间或终端之间穿梭的用户来说,EliteBoard 可以配置一个小型电池,这样在旅行时就不必在每个地点之间都先关机。普通笔记本电脑当然也能实现类似的目标,但却没有更符合人体工程学的键盘。
EliteBoard 最糟糕的两个方面是其有限的端口选项和狭窄的方向键。与许多笔记本电脑相比,EliteBoard 的设计更厚更宽,但与流行的机型(如 Yoga Pro 9 16或 LG Gram.一旦涉及到 USB-C 适配器和 HDMI,极简设置就会消失。传统的迷你电脑,如 微星 Cubi NUC或 GMK NucBox等传统迷你电脑在这方面具有优势,因为它们原生支持绝大多数企业仍在使用的老式 HDMI 显示器。换句话说,如果 EliteBoard 的设计意味着更大的按键、更多的辅助功能和更多的集成端口,我们并不介意它稍微大一点。
Pros
Cons
EliteBoard G1a AI 是专为混合型员工和简化工作空间设计的电脑键盘。它本质上是一个内置微型 PC 的键盘,就像最初的 Commodore 64 一样。对于这款第一代机型,惠普为其配置了 Ryzen AI 300 PRO 系列 CPU,以吸引企业和专业应用,而不是典型的家庭用户。
我们的测试机配备了 Ryzen AI 5 Pro 340 和 32 GB 内存,售价约为 1600 美元。其他配置的最高价格为 Ryzen AI 7 Pro 350,配备 24 GB 内存和 2 TB 存储空间。
EliteBoard 的独特之处在于,它是同类产品中首款配备运行 Windows 11 的现代 CPU 的产品。尽管如此,它还是与传统的企业迷你 PC 竞争,包括 微星 Cubi NUC, 华硕 ExpertCenter或 GMK EVO-X1.
更多惠普评论:
规格
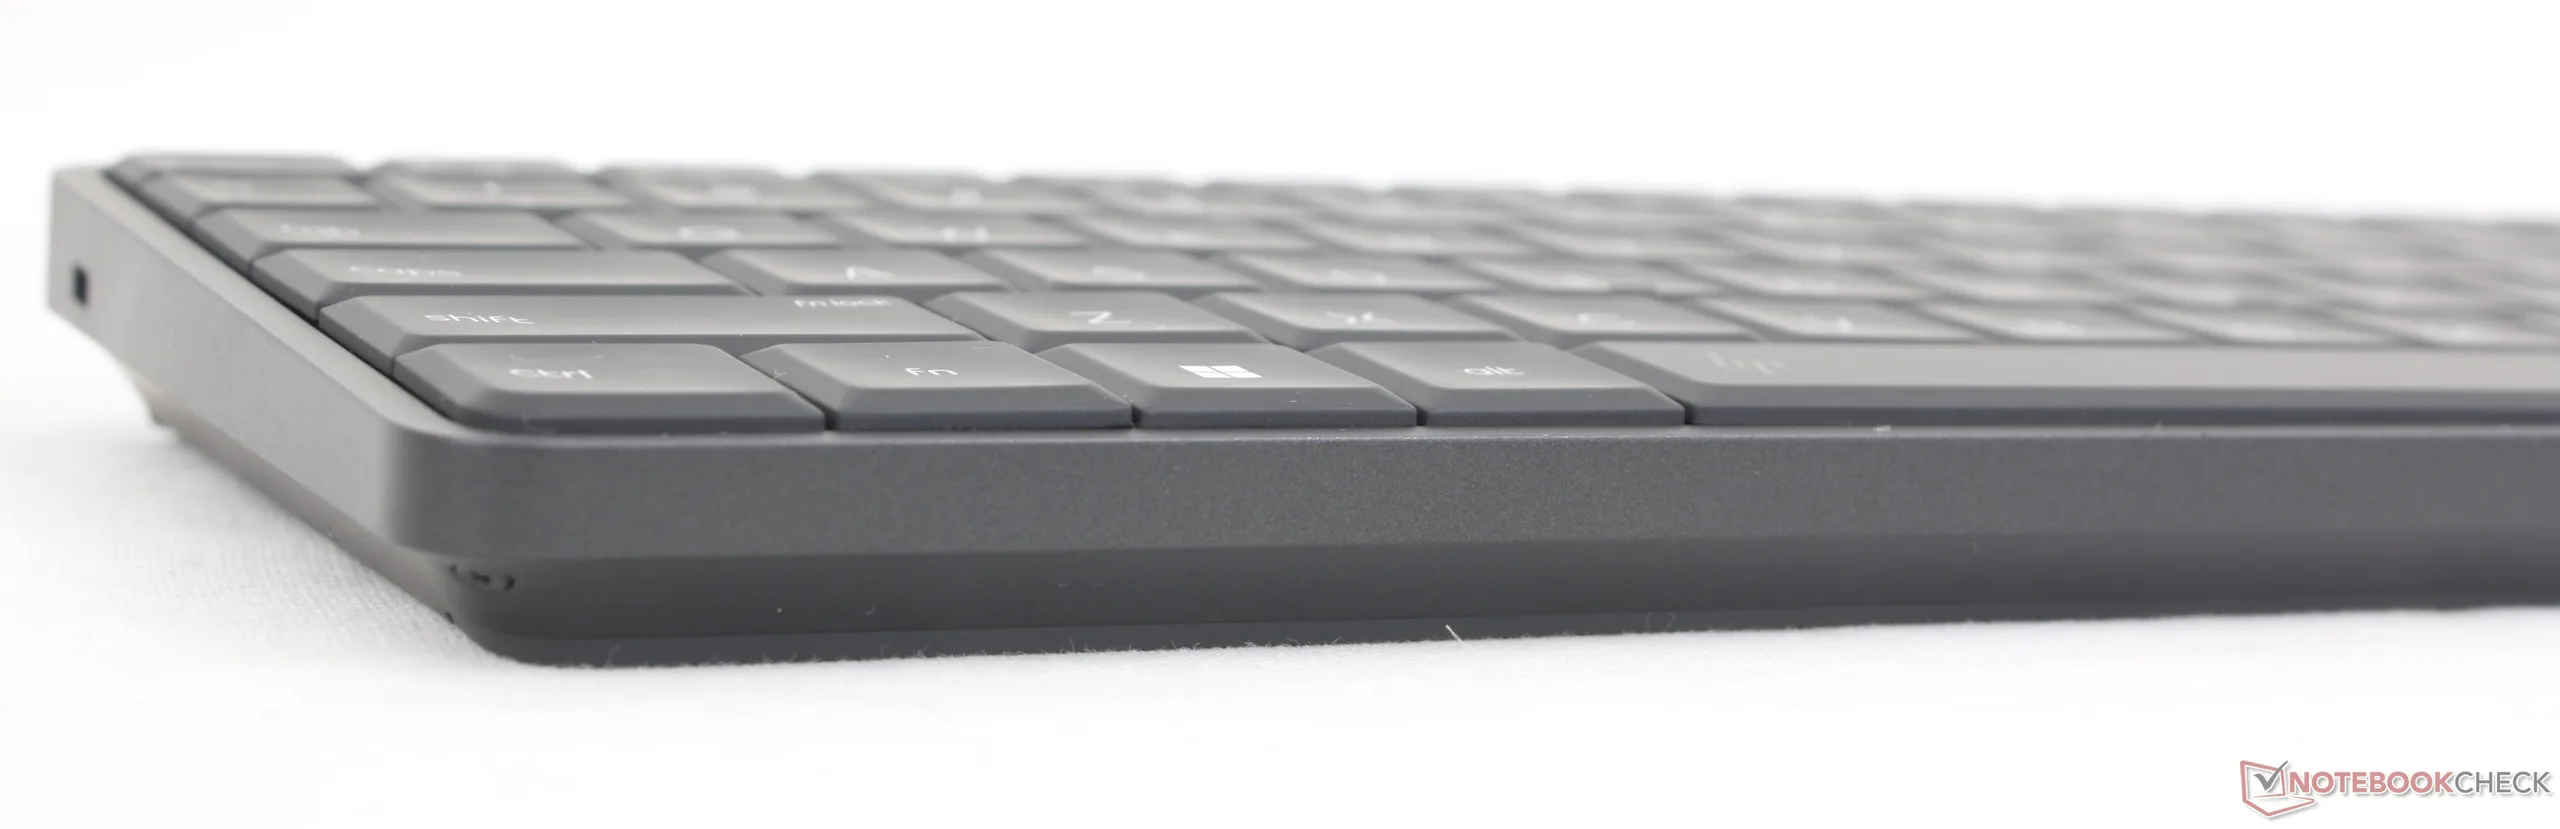
案例
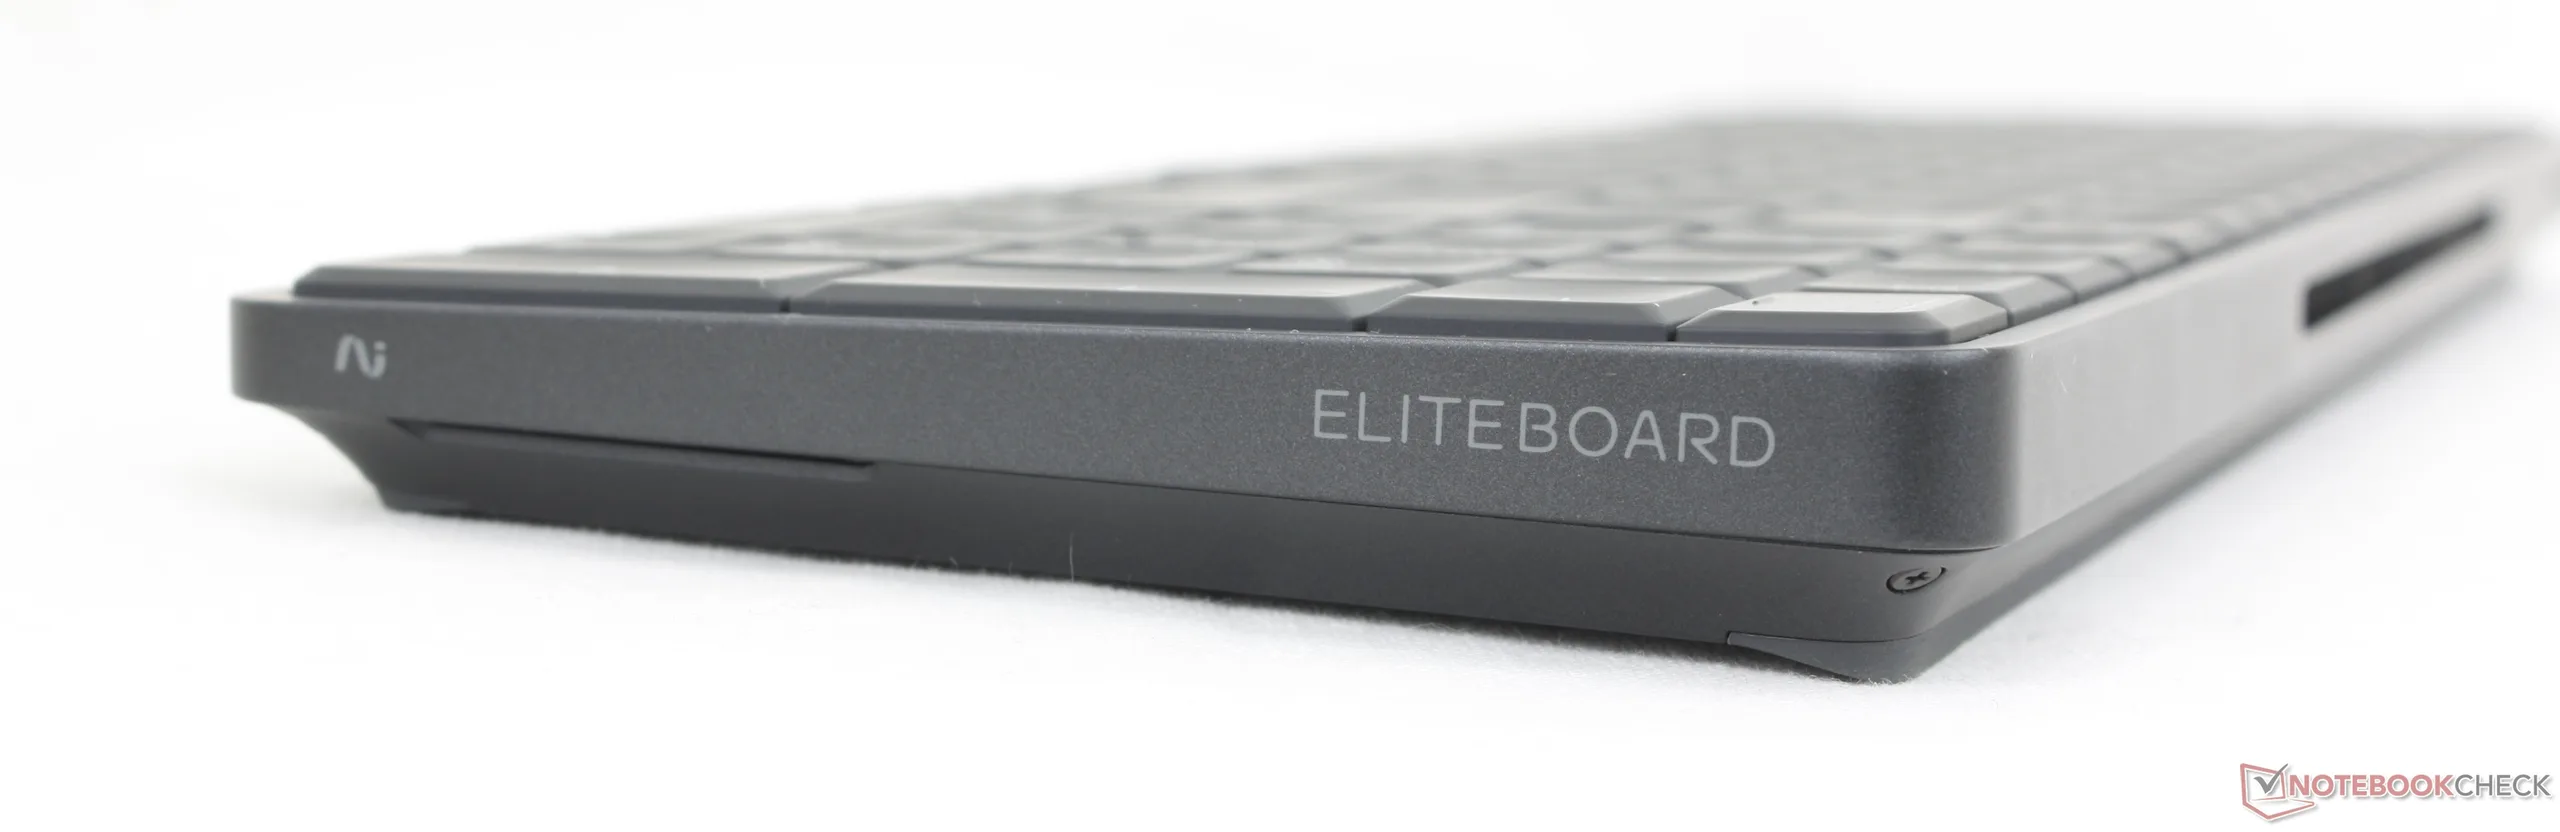
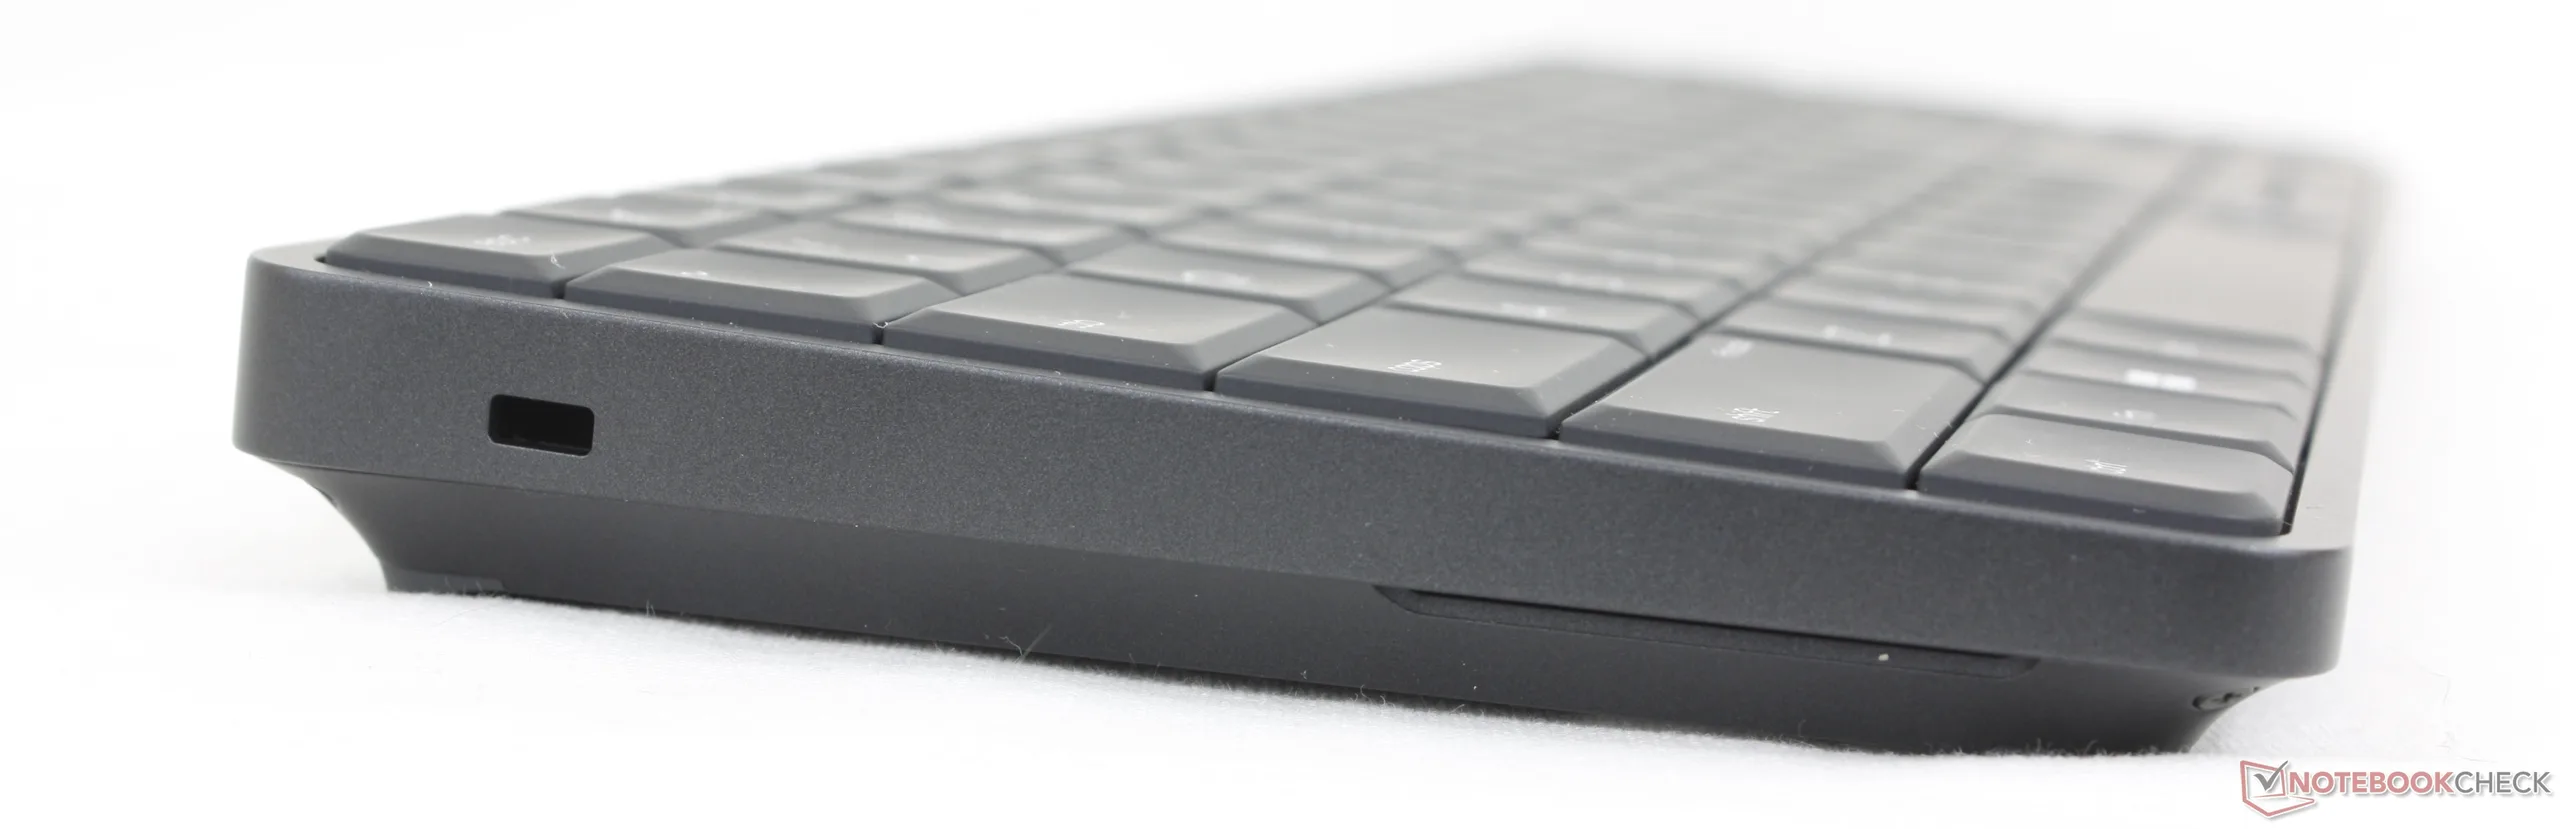
厚实的塑料框架和致密的 PC 内部结构有助于强化 EliteBoard,使其比传统键盘更坚固、更硬朗。它的设计毫不起眼,看起来甚至不像是内部装有 PC,这有助于实现极简风格。
连接性
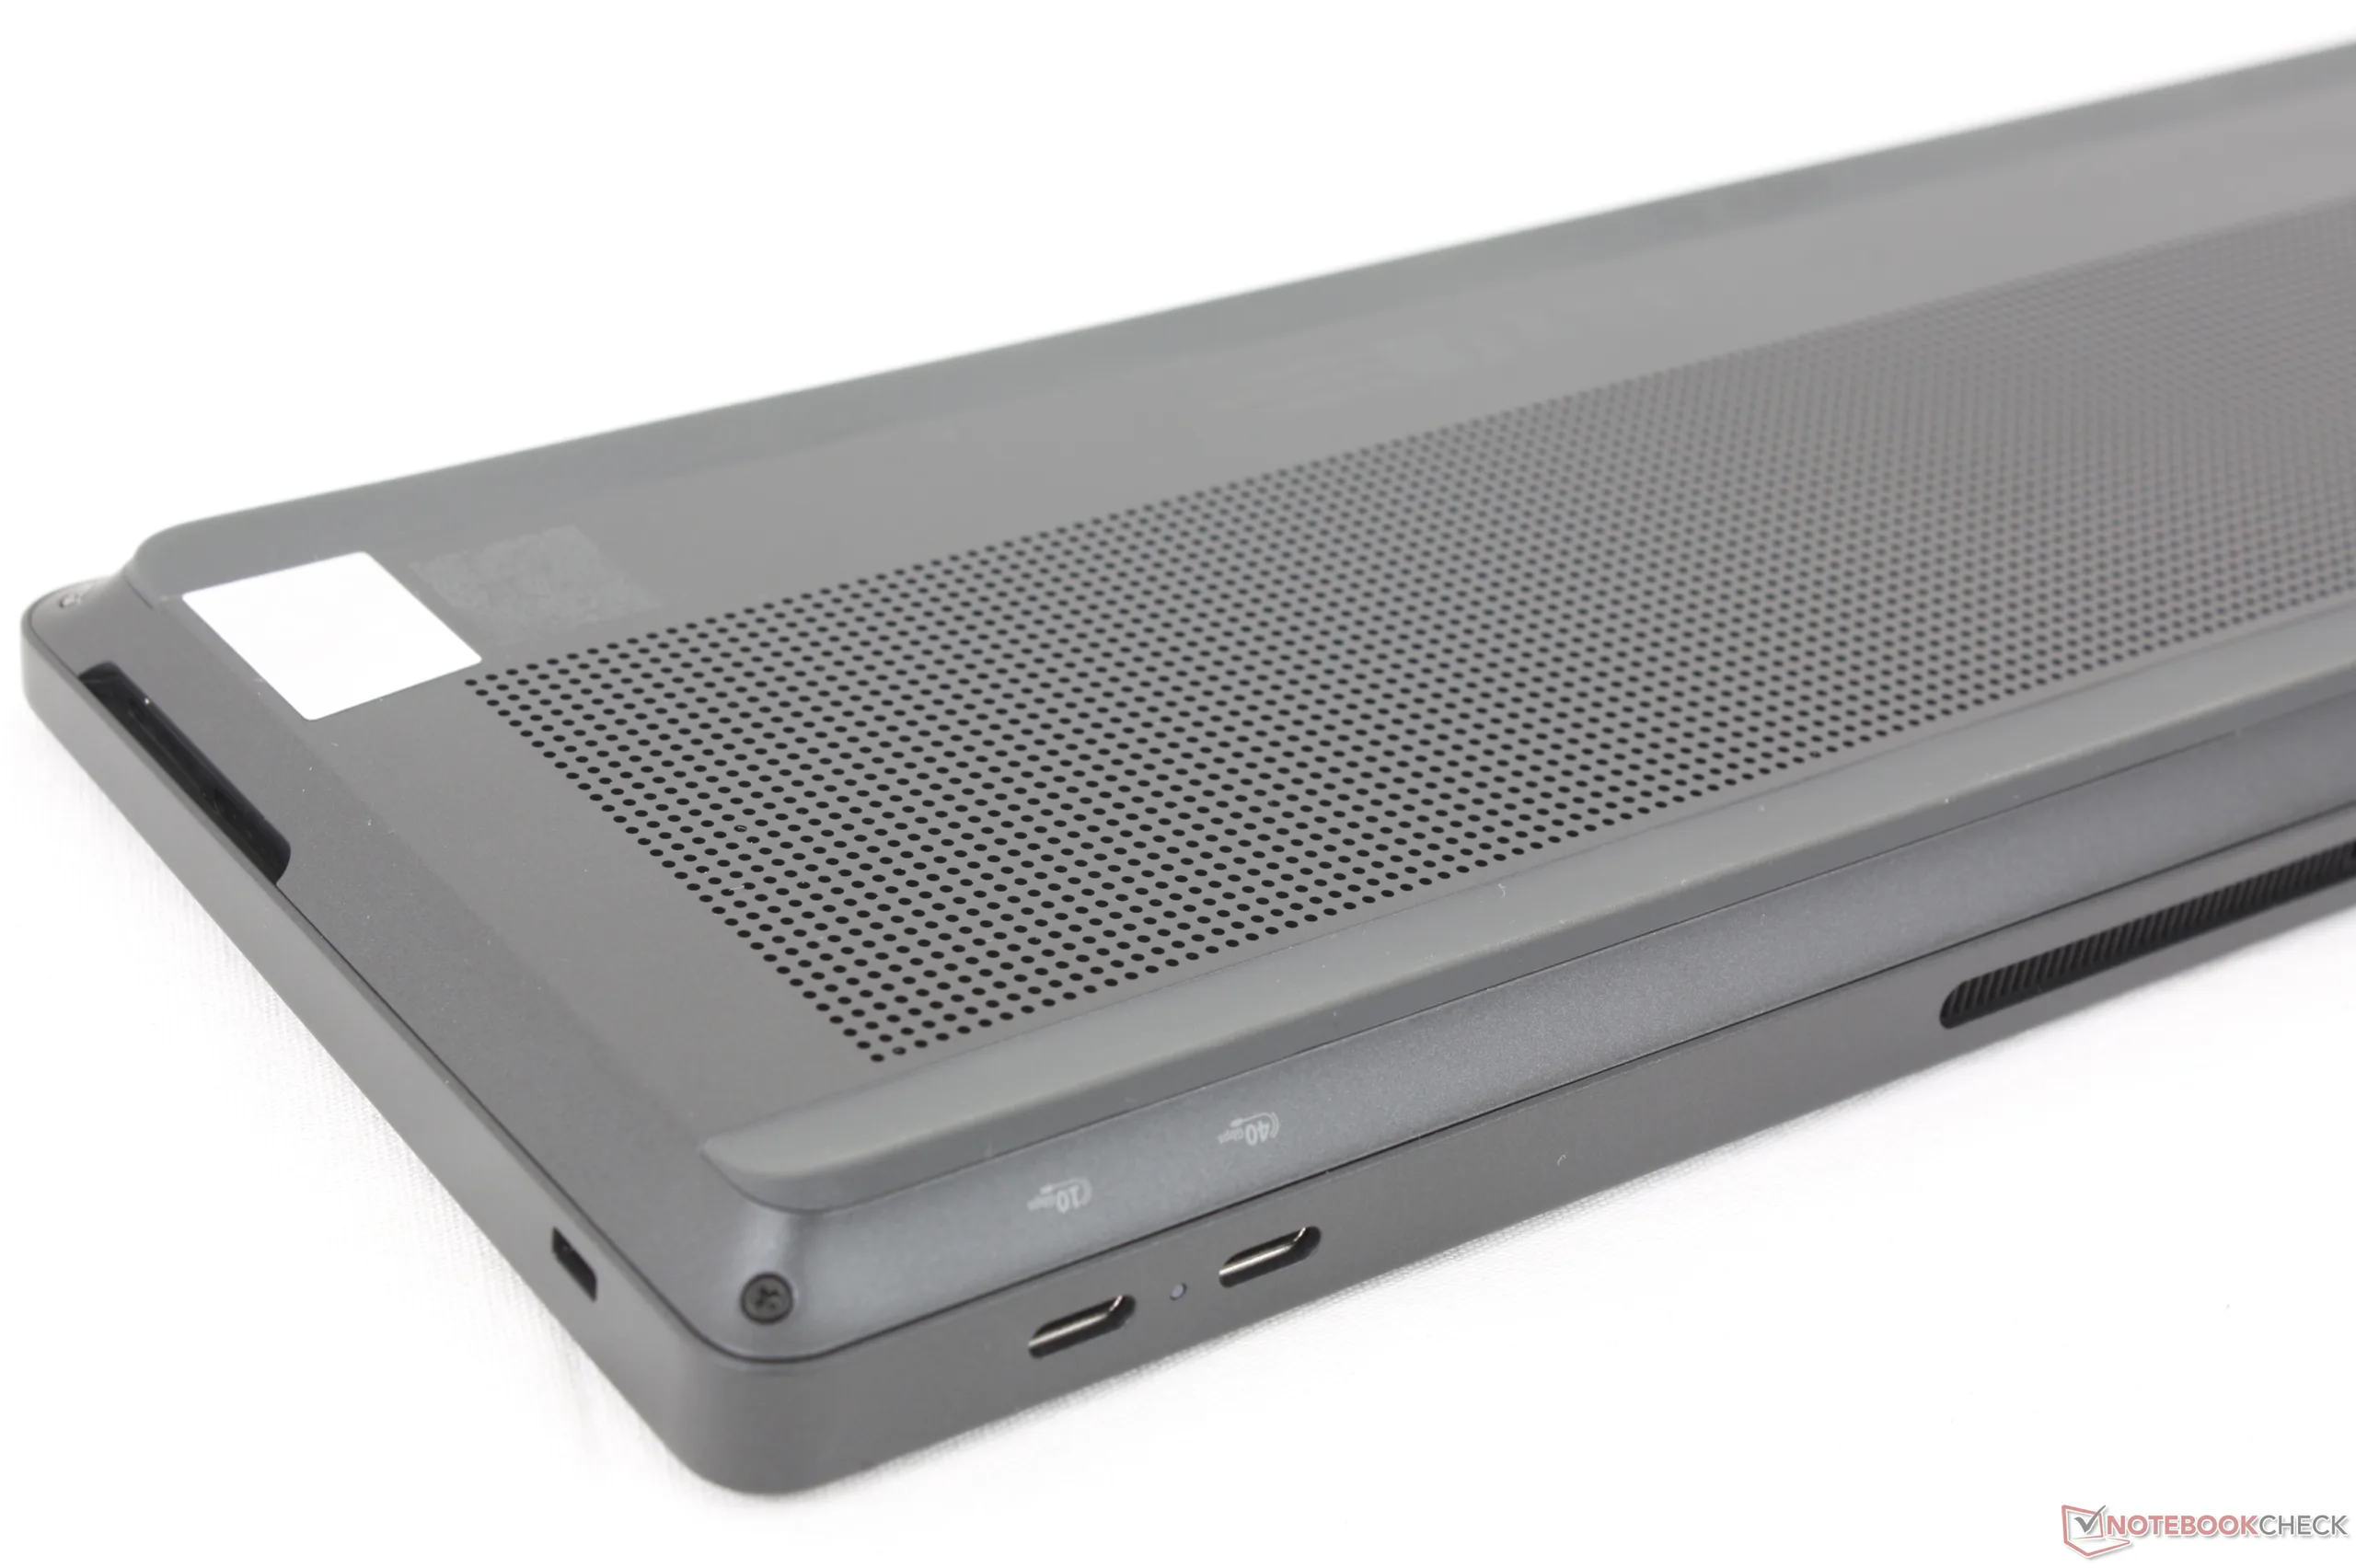
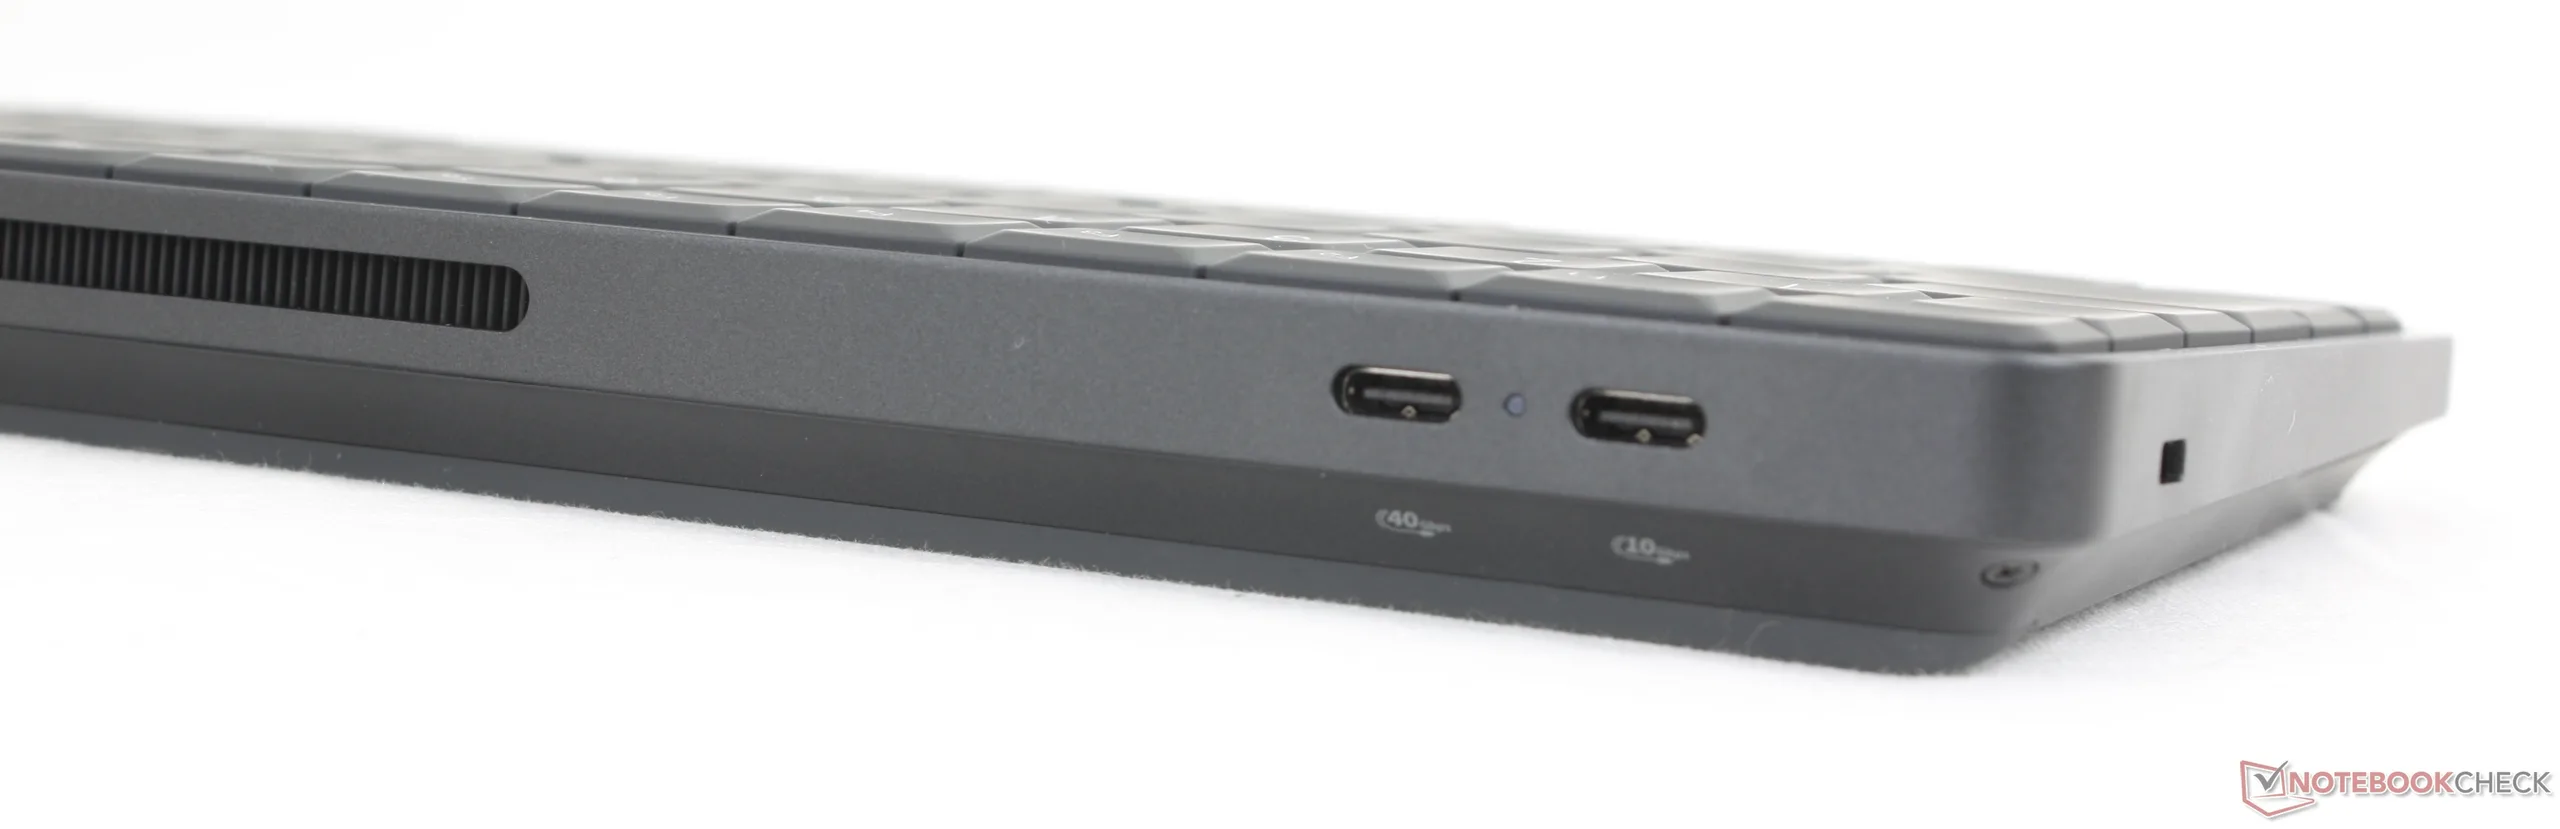
只有两个 USB-C 端口,给人一种简陋的感觉。最理想的情况是,用户已经拥有一台带有 USB-C 视频和 Power Delivery 直通功能的显示器,以获得即插即用的体验。否则,为了正确设置 EliteBoard,你得准备好凌乱的加密狗和扩展坞。
令人讨厌的是,两个 USB-C 端口是不对称的,这意味着只有一个端口支持 USB4 或 40 Gbps,而另一个端口仅支持 USB 3.2 Gen.
每个 USB-C 端口还可用于为便携式外接显示器或智能手机等连接设备充电或供电,尽管功率最高只有 7.5 W。
交流
| Networking | |
| iperf3 transmit AXE11000 | |
| Asus NUC 15 Pro+ | |
| HP EliteBoard G1a AI | |
| MSI Cubi NUC AI+ 2MG | |
| HP Pro Mini 400 G9-937U0EA | |
| Geekom A5 Pro | |
| GMK NucBox K13 | |
| iperf3 receive AXE11000 | |
| Asus NUC 15 Pro+ | |
| HP EliteBoard G1a AI | |
| MSI Cubi NUC AI+ 2MG | |
| HP Pro Mini 400 G9-937U0EA | |
| Geekom A5 Pro | |
| GMK NucBox K13 | |
| iperf3 transmit AXE11000 6GHz | |
| HP EliteBoard G1a AI | |
| Asus NUC 15 Pro+ | |
| HP Pro Mini 400 G9-937U0EA | |
| MSI Cubi NUC AI+ 2MG | |
| GMK NucBox K13 | |
| iperf3 receive AXE11000 6GHz | |
| HP EliteBoard G1a AI | |
| GMK NucBox K13 | |
| MSI Cubi NUC AI+ 2MG | |
| Asus NUC 15 Pro+ | |
| HP Pro Mini 400 G9-937U0EA | |
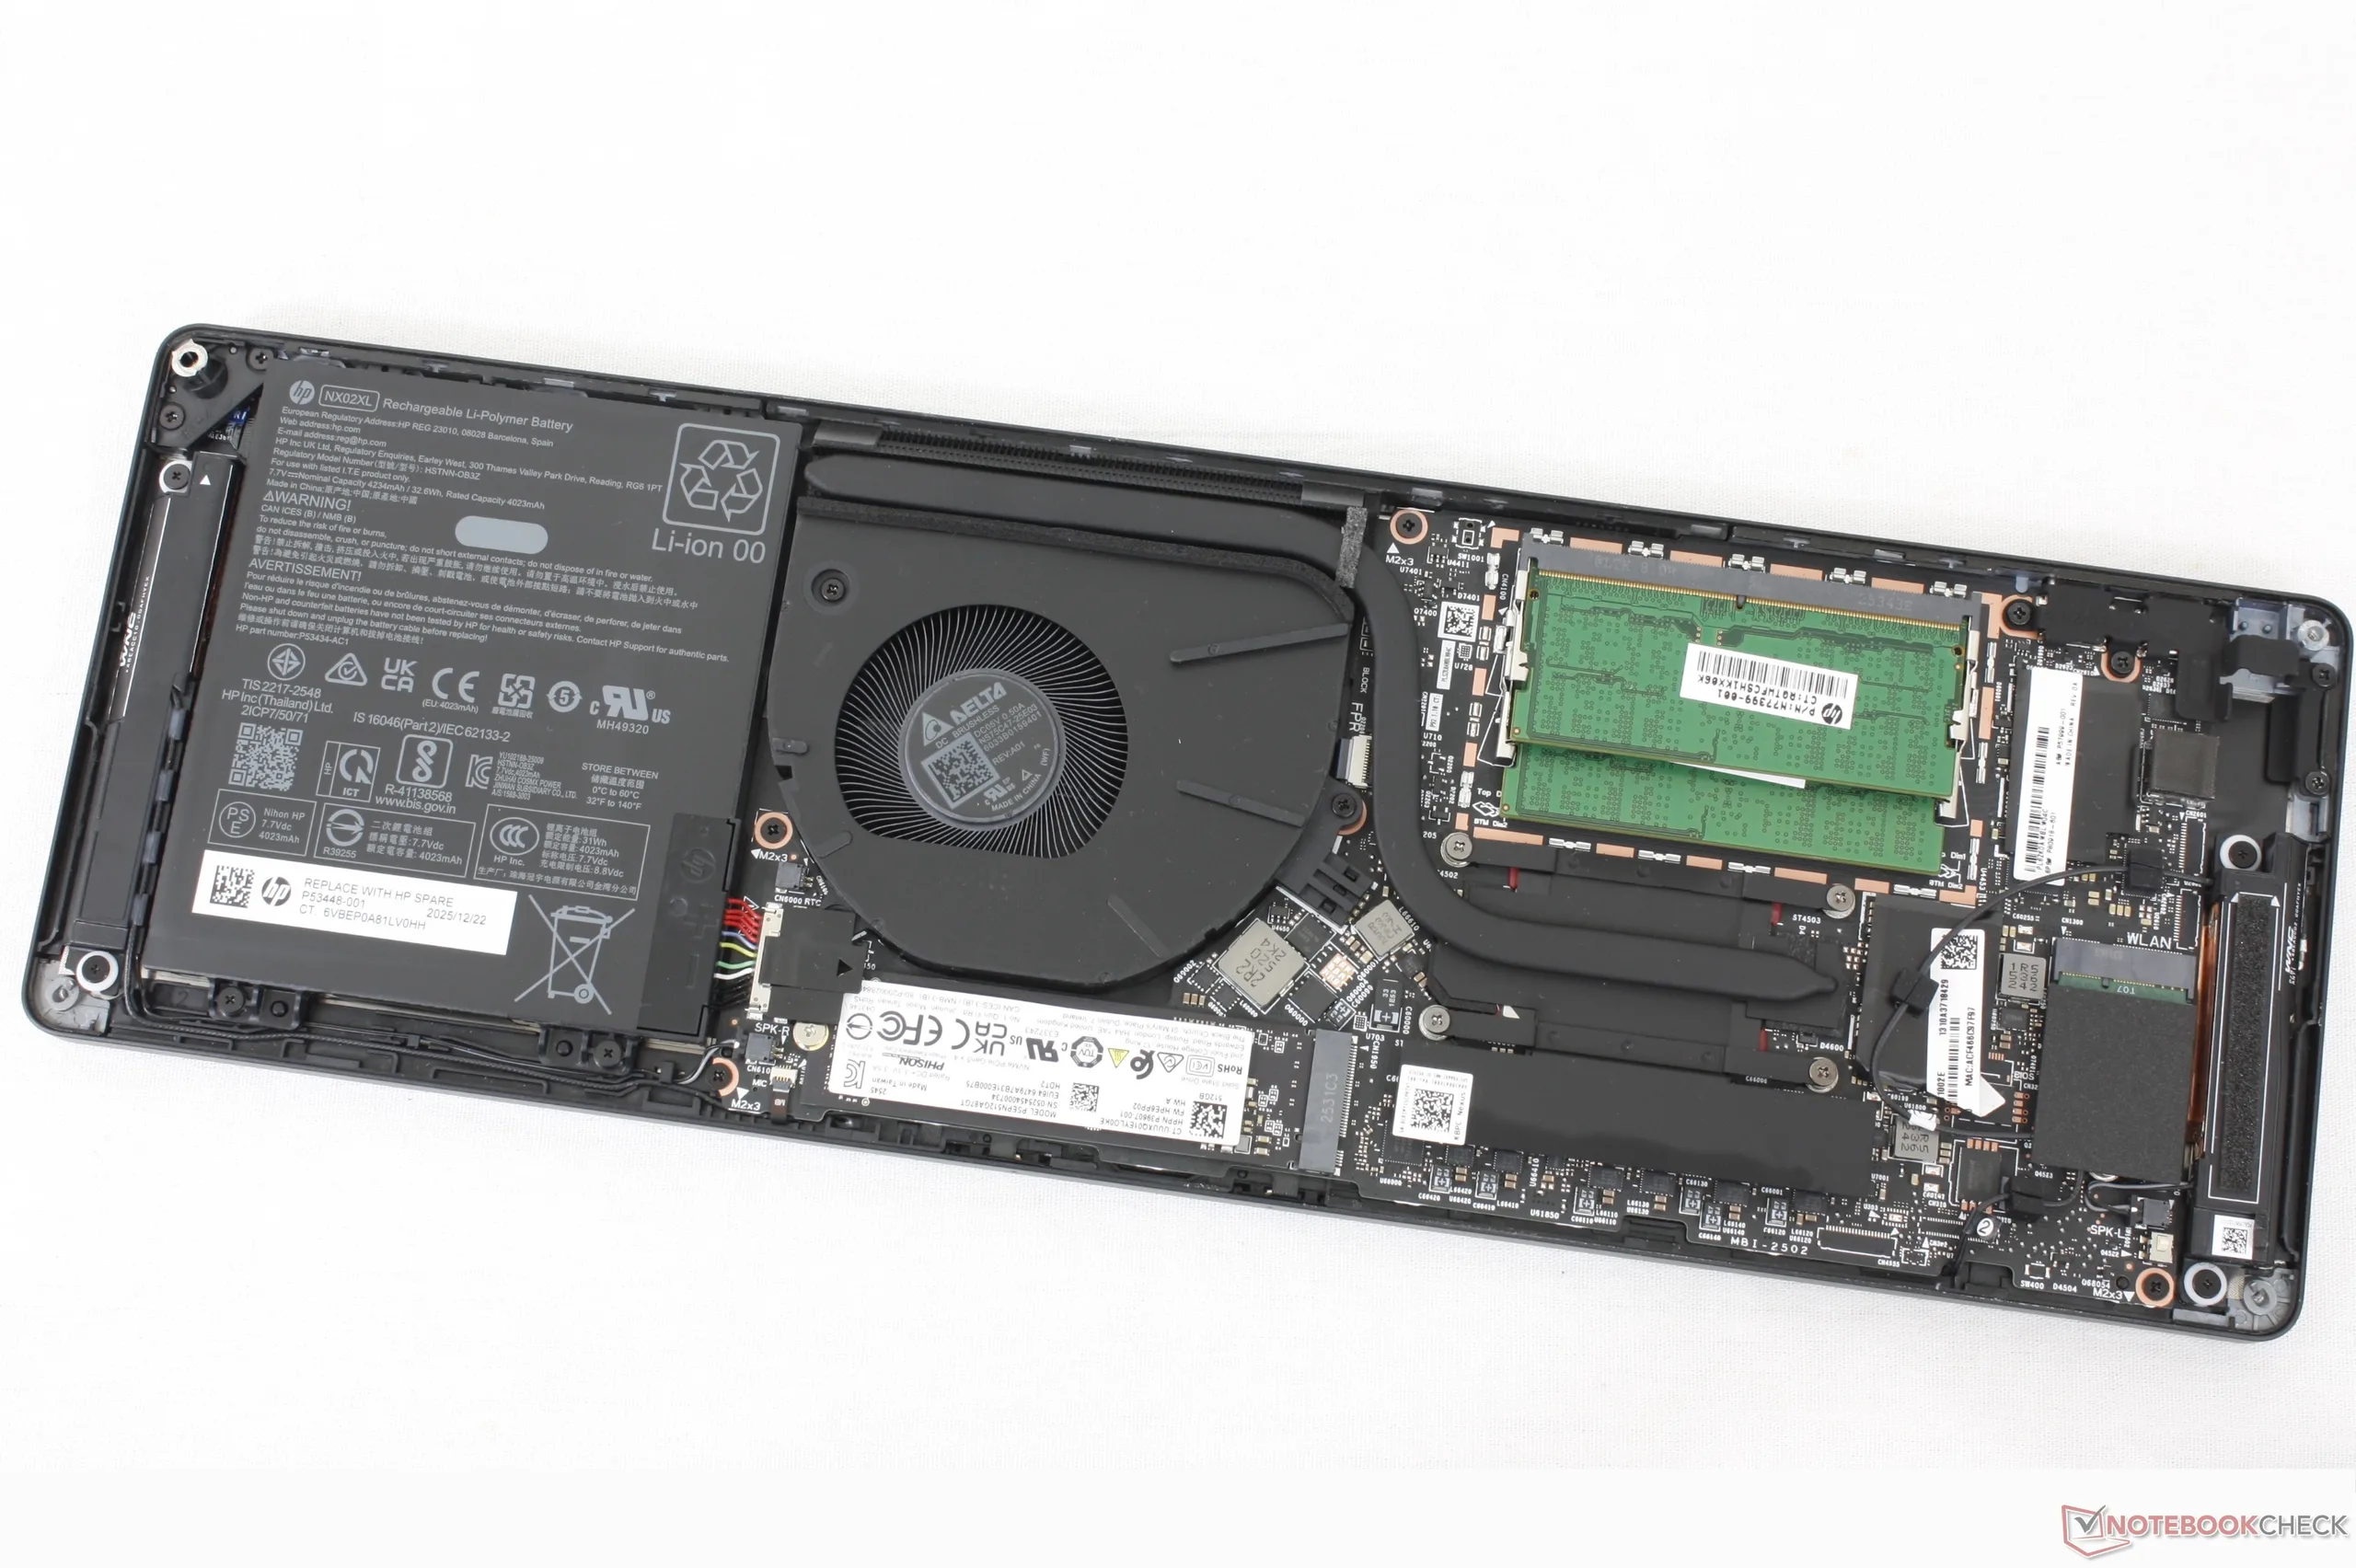
维护
秉承 Elite 系列的传统,EliteBoard 具有两个可访问的 DDR5 SODIMM 插槽、可拆卸的 M.2 WLAN 模块和一个 M.2 2280 SSD 插槽,易于维护。
可持续性
该系统采用回收率分别高达 75% 和 45% 的塑料和铜制造。同时,包装不含塑料,完全可回收。
虽然单个键帽是可以更换的,但其下面的甲板或膜层却不是为了方便更换而设计的。
配件
零售包装盒包括一个 65 W USB-C GaN 交流适配器、USB-C 数据线和一个带电池的 HP 675M 蓝牙鼠标。只有在配置电池组的情况下,才标配软触旅行套。
需要注意的是,现有显示器支持 USB-C 视频和 Power Delivery 的用户不需要交流适配器。
可选配件包括扩展坞和适配器,适用于使用 HDMI 视频而非 USB-C 的旧款外接显示器。
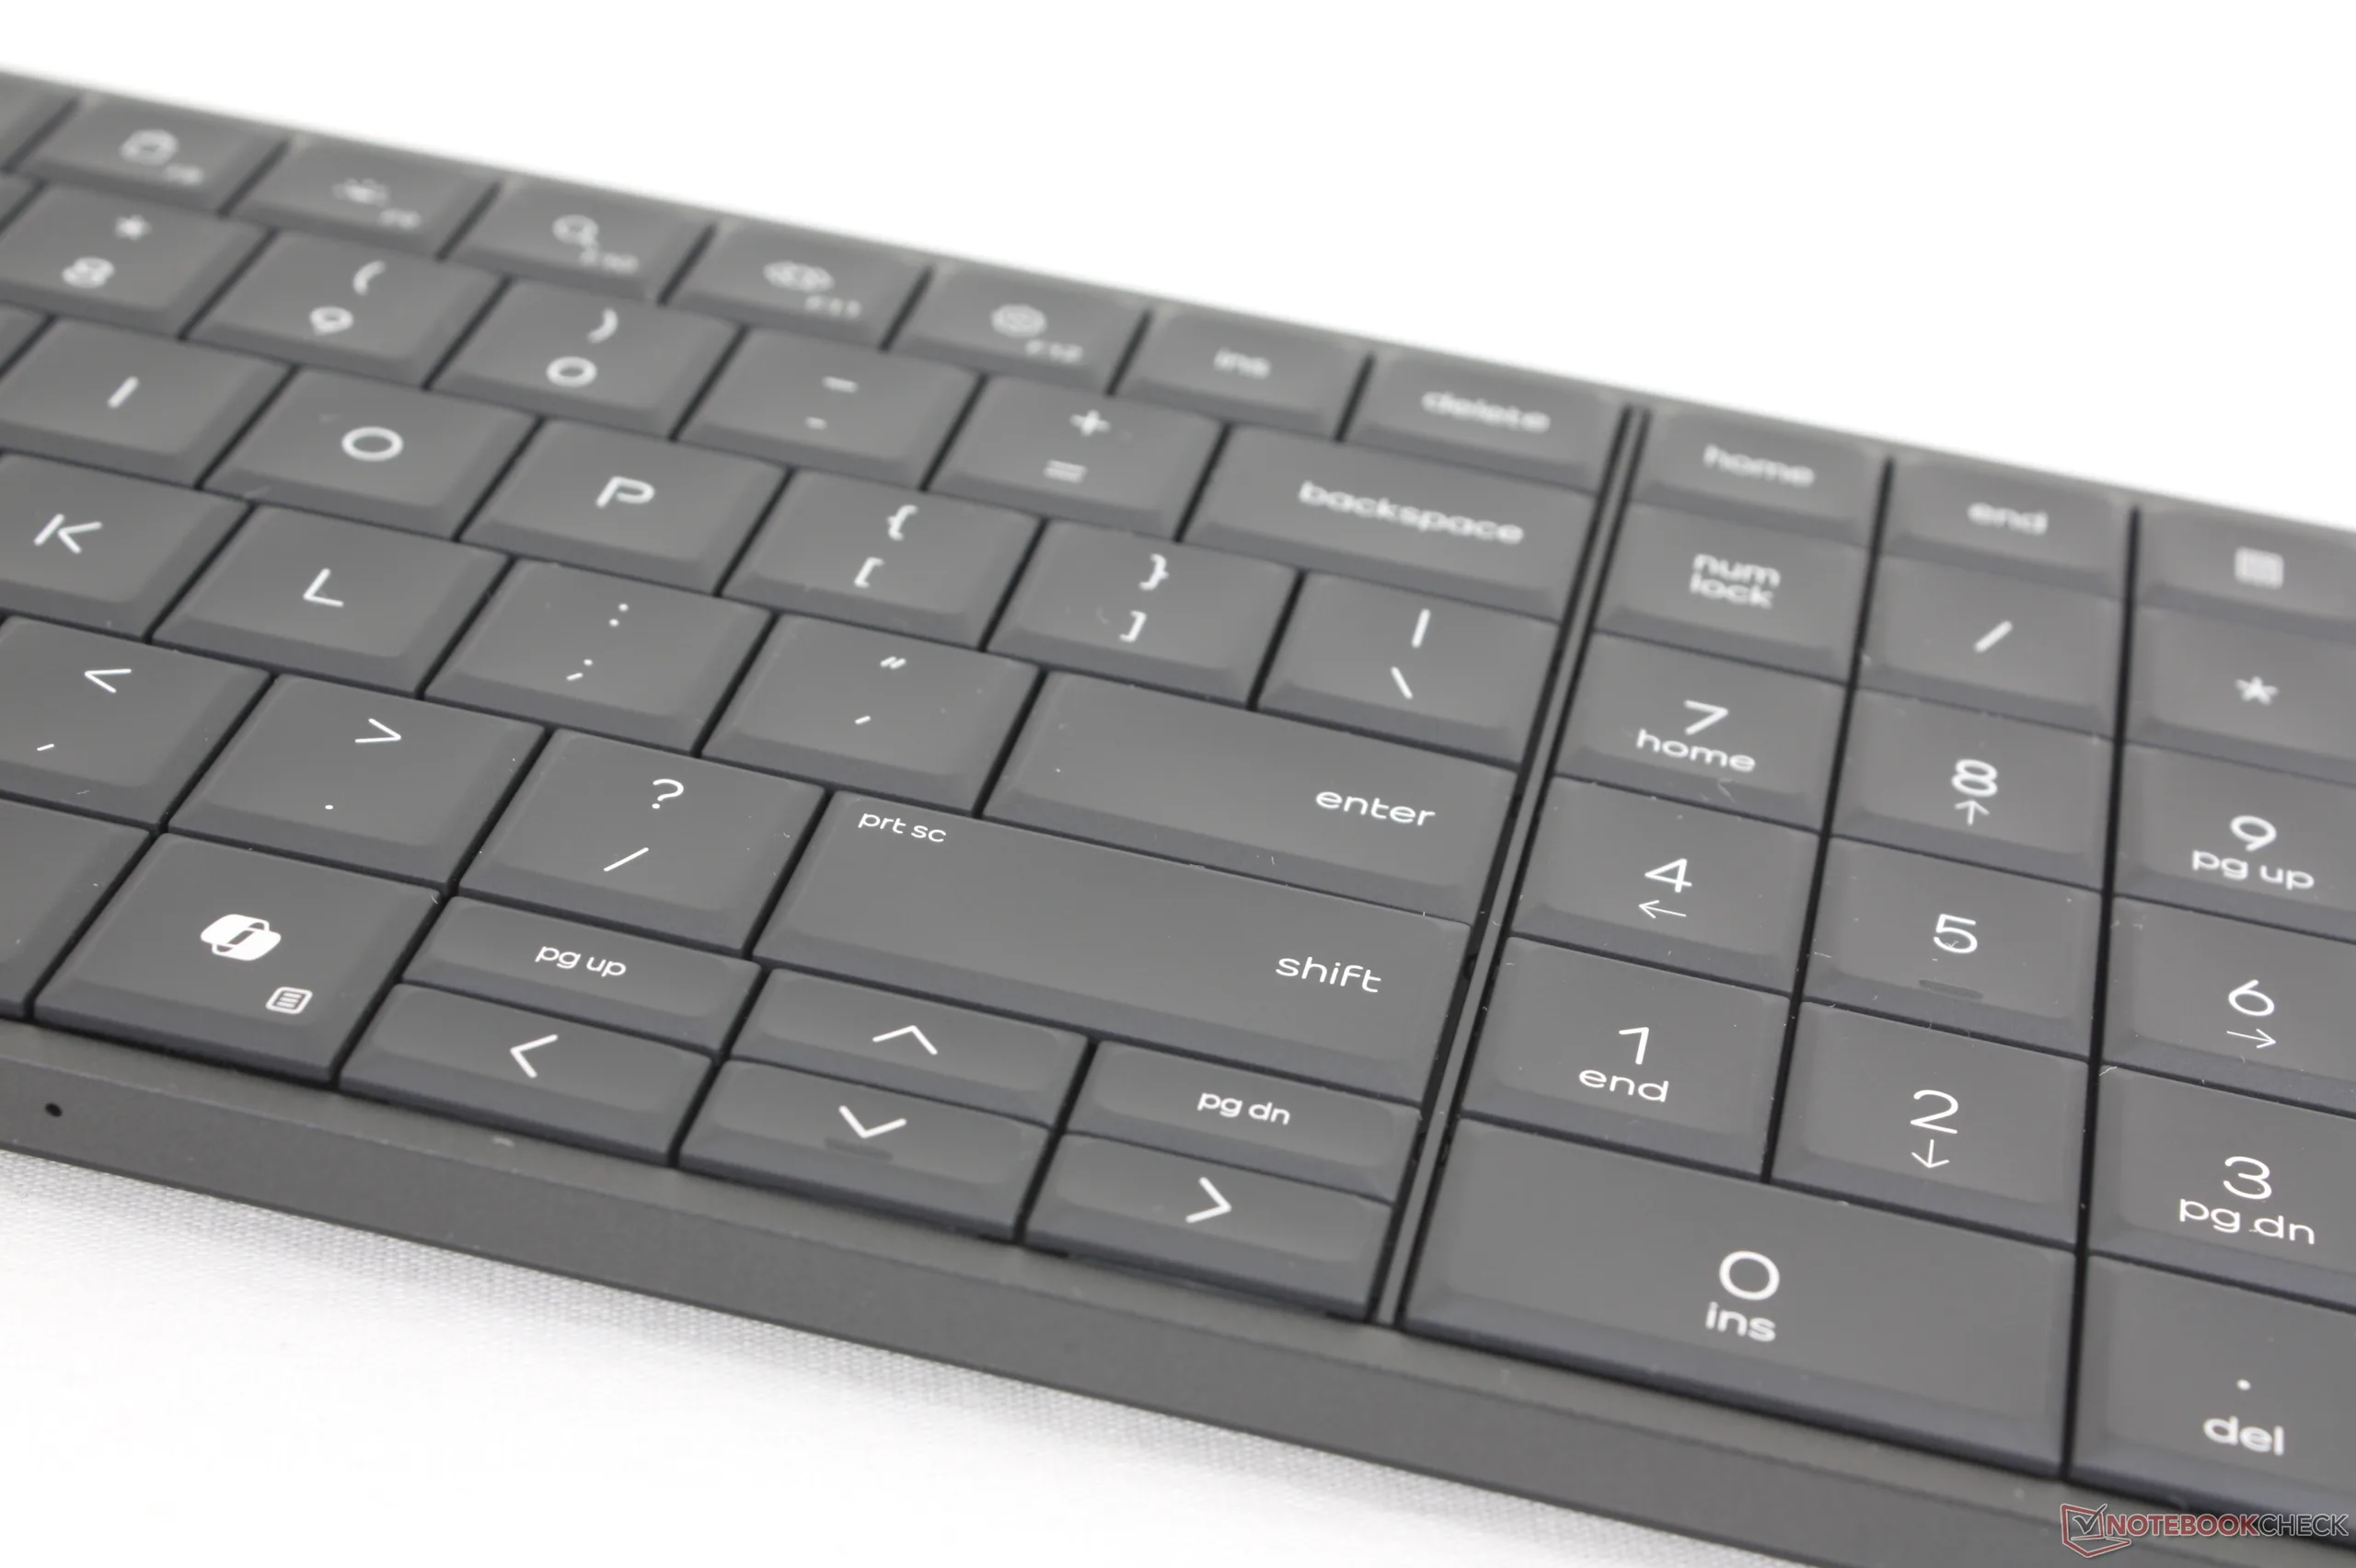
输入设备
键盘
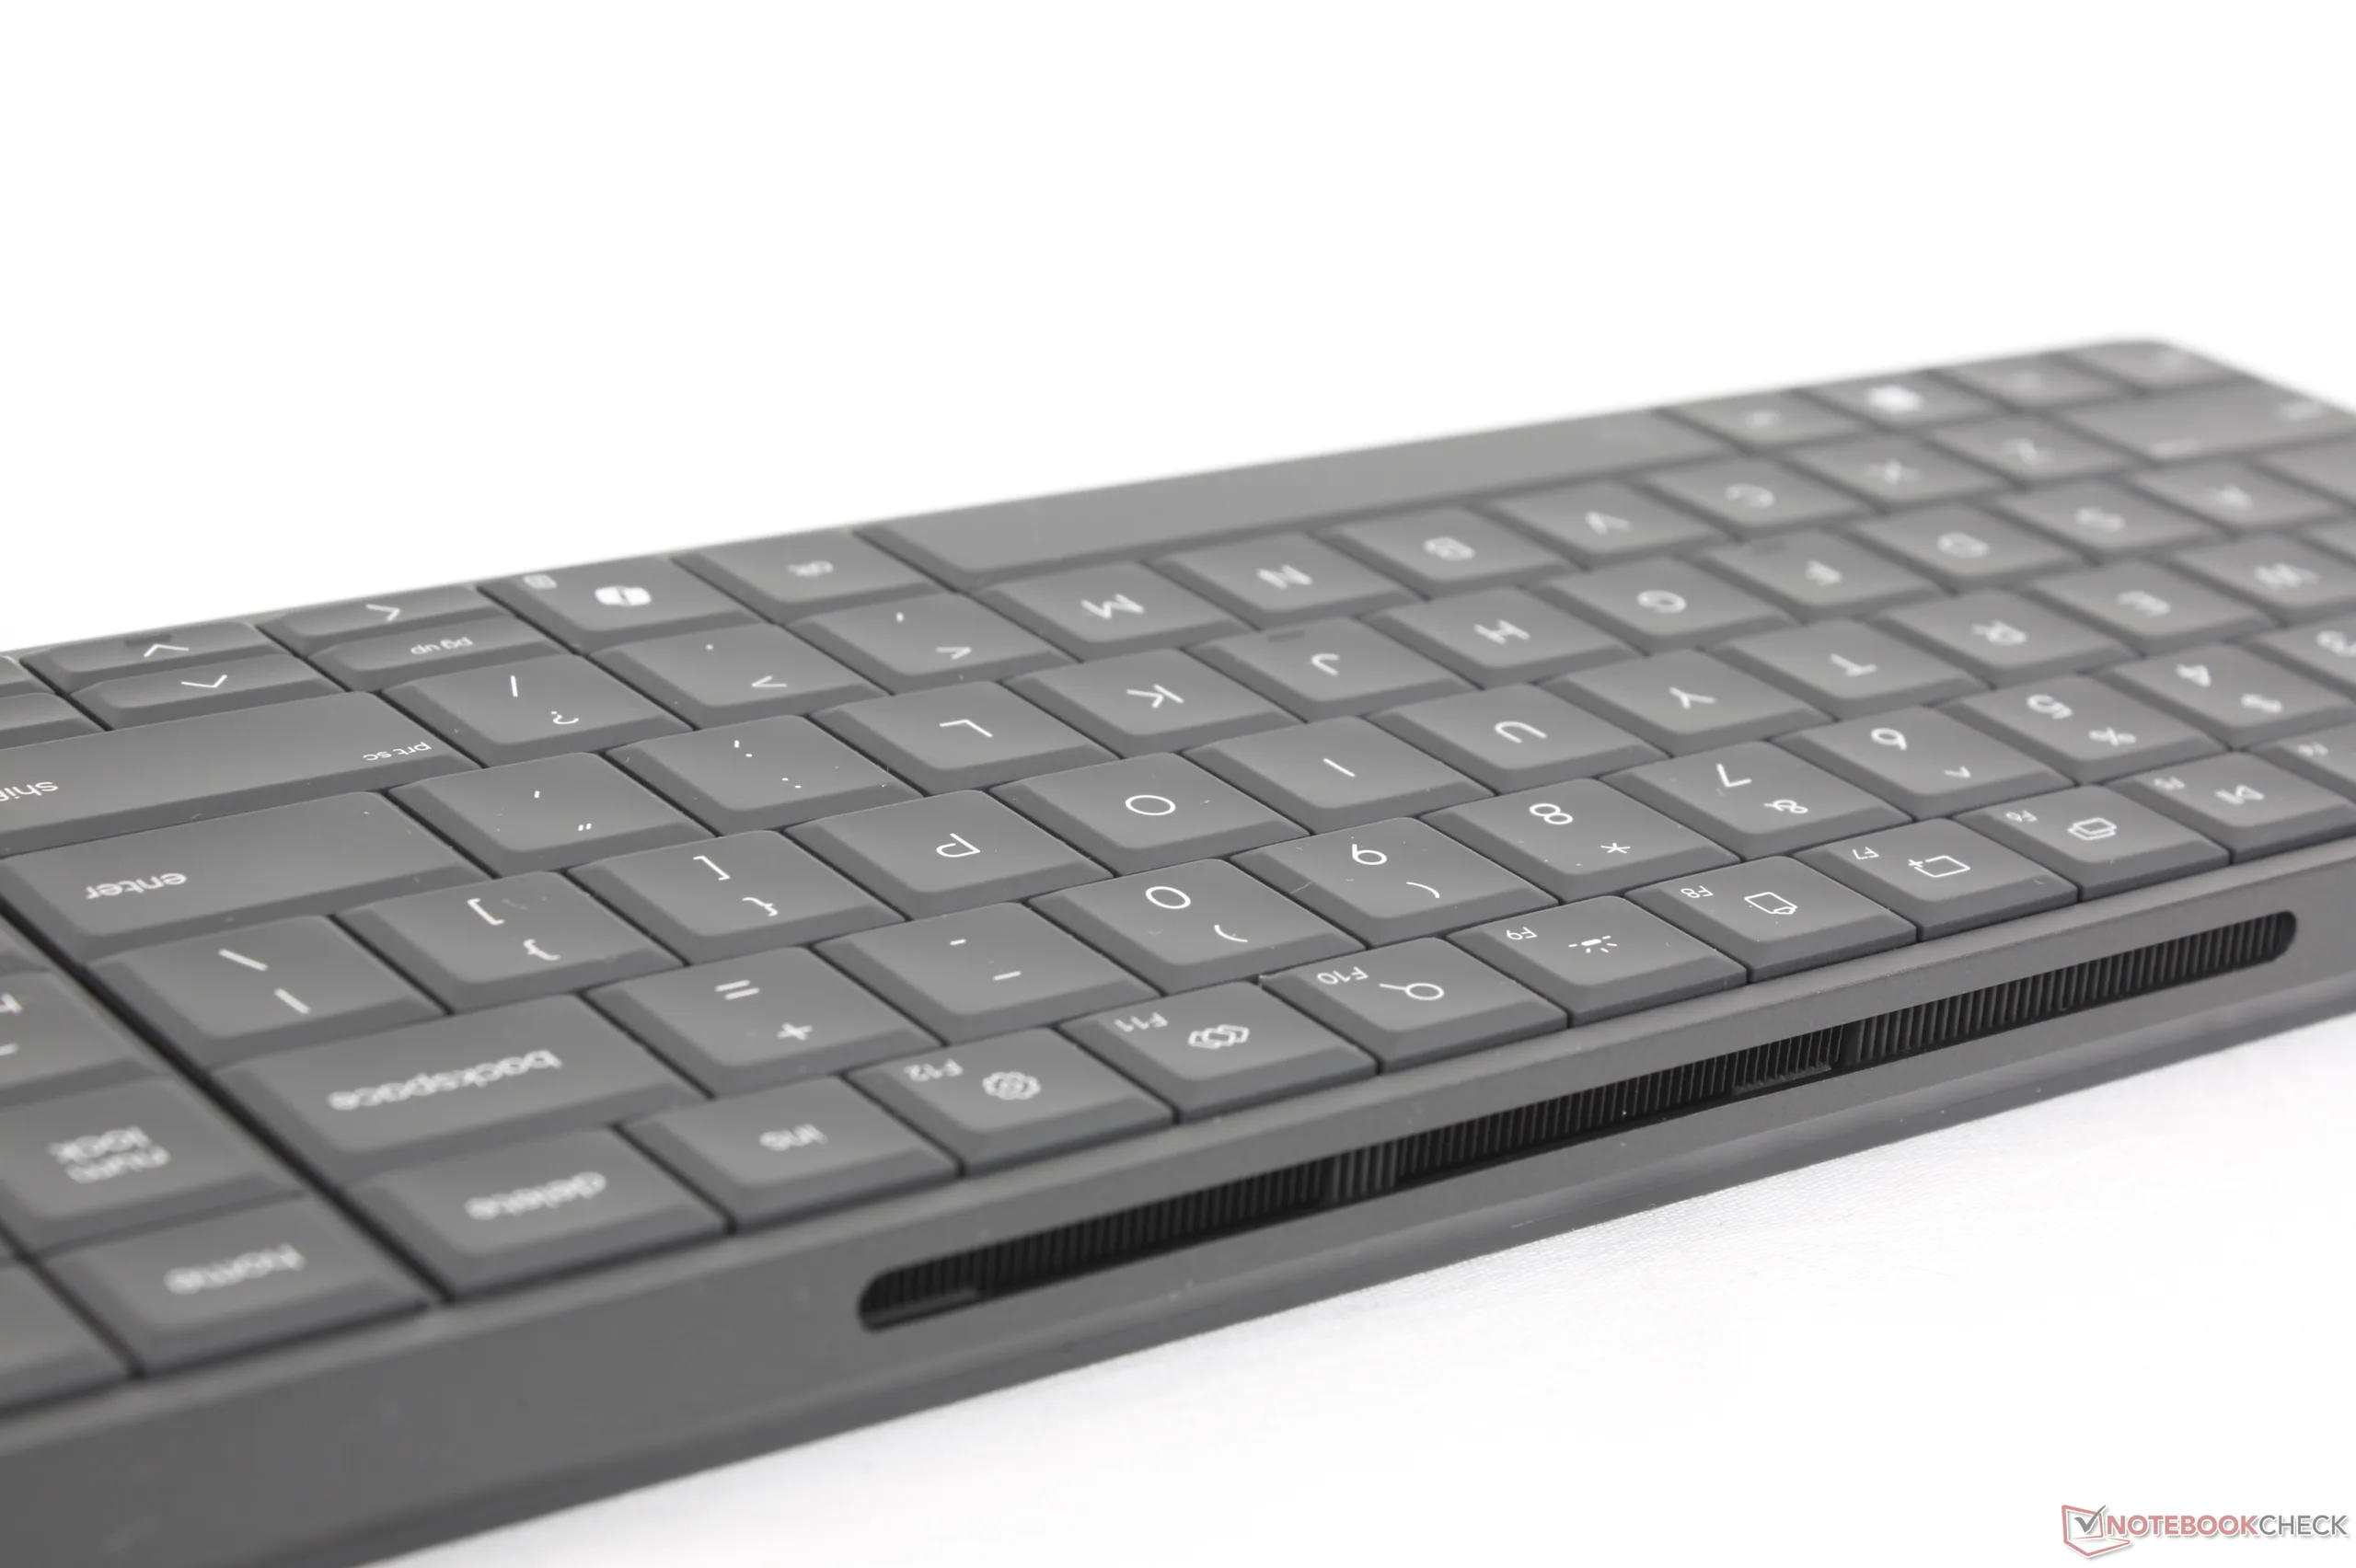
2 毫米的键程比大多数笔记本键盘都要深,打字体验更接近典型的台式机键盘。虽然我们喜欢坚固的反馈、全尺寸的数字键盘,尤其是安静的按键碰撞声,但方向键比许多笔记本电脑上的方向键要小。惠普表示,这样做是为了遵守严格的设计规范。
此外,键盘与 EliteBoard 电脑 "连锁",这意味着它不能像基本的台式机键盘那样用来控制其他电脑。
性能
测试条件
在运行以下基准测试之前,我们将 Windows 设置为性能模式。
处理器
......(英文 Ryzen AI 5 PRO 340性能与 Lunar Lake 酷睿至尊 7 256V的原始性能。虽然速度不是特别快,但与较早的 U 系列 CPU(如 Ryzen 5 7530U或 酷睿 i7-1335U.
升级到 Ryzen AI 7 PRO 350的多线程性能预计将提高约 50%。 华硕专家中心由于物理内核数量更多,多线程性能有望提高 50%左右。
Cinebench R15 多回路运行
Cinebench R23: Multi Core | Single Core
Cinebench R20: CPU (Multi Core) | CPU (Single Core)
Cinebench R15: CPU Multi 64Bit | CPU Single 64Bit
Blender: v2.79 BMW27 CPU
7-Zip 18.03: 7z b 4 | 7z b 4 -mmt1
Geekbench 6.7: Multi-Core | Single-Core
Geekbench 5.5: Multi-Core | Single-Core
HWBOT x265 Benchmark v2.2: 4k Preset
LibreOffice : 20 Documents To PDF
R Benchmark 2.5: Overall mean
| CPU Performance rating | |
| Asus NUC 15 Pro+ | |
| Khadas Mind Pro | |
| Beelink GTI15 Ultra | |
| Asus ExpertCenter PN54-S70012NN | |
| Average AMD Ryzen AI 5 PRO 340 | |
| HP EliteBoard G1a AI | |
| GMK NucBox K13 | |
| HP Pro Mini 400 G9-937U0EA | |
| MSI Cubi NUC AI+ 2MG | |
| Geekom A5 Pro | |
| Aoostar WTR Pro, N150 | |
| Cinebench R23 / Multi Core | |
| Asus NUC 15 Pro+ | |
| Khadas Mind Pro | |
| Beelink GTI15 Ultra | |
| Asus ExpertCenter PN54-S70012NN | |
| HP Pro Mini 400 G9-937U0EA | |
| HP EliteBoard G1a AI | |
| Average AMD Ryzen AI 5 PRO 340 (n=1) | |
| GMK NucBox K13 | |
| MSI Cubi NUC AI+ 2MG | |
| Geekom A5 Pro | |
| Aoostar WTR Pro, N150 | |
| Cinebench R23 / Single Core | |
| Asus NUC 15 Pro+ | |
| Khadas Mind Pro | |
| Beelink GTI15 Ultra | |
| Asus ExpertCenter PN54-S70012NN | |
| MSI Cubi NUC AI+ 2MG | |
| GMK NucBox K13 | |
| HP Pro Mini 400 G9-937U0EA | |
| HP EliteBoard G1a AI | |
| Average AMD Ryzen AI 5 PRO 340 (n=1) | |
| Geekom A5 Pro | |
| Aoostar WTR Pro, N150 | |
| Cinebench R20 / CPU (Multi Core) | |
| Asus NUC 15 Pro+ | |
| Khadas Mind Pro | |
| Beelink GTI15 Ultra | |
| Asus ExpertCenter PN54-S70012NN | |
| HP EliteBoard G1a AI | |
| Average AMD Ryzen AI 5 PRO 340 (n=1) | |
| HP Pro Mini 400 G9-937U0EA | |
| GMK NucBox K13 | |
| MSI Cubi NUC AI+ 2MG | |
| Geekom A5 Pro | |
| Aoostar WTR Pro, N150 | |
| Cinebench R20 / CPU (Single Core) | |
| Asus NUC 15 Pro+ | |
| Beelink GTI15 Ultra | |
| Khadas Mind Pro | |
| Asus ExpertCenter PN54-S70012NN | |
| MSI Cubi NUC AI+ 2MG | |
| GMK NucBox K13 | |
| HP Pro Mini 400 G9-937U0EA | |
| HP EliteBoard G1a AI | |
| Average AMD Ryzen AI 5 PRO 340 (n=1) | |
| Geekom A5 Pro | |
| Aoostar WTR Pro, N150 | |
| Cinebench R15 / CPU Multi 64Bit | |
| Asus NUC 15 Pro+ | |
| Khadas Mind Pro | |
| Asus ExpertCenter PN54-S70012NN | |
| Beelink GTI15 Ultra | |
| HP Pro Mini 400 G9-937U0EA | |
| HP EliteBoard G1a AI | |
| Average AMD Ryzen AI 5 PRO 340 (n=1) | |
| GMK NucBox K13 | |
| MSI Cubi NUC AI+ 2MG | |
| Geekom A5 Pro | |
| Aoostar WTR Pro, N150 | |
| Cinebench R15 / CPU Single 64Bit | |
| Asus NUC 15 Pro+ | |
| Khadas Mind Pro | |
| Beelink GTI15 Ultra | |
| Asus ExpertCenter PN54-S70012NN | |
| MSI Cubi NUC AI+ 2MG | |
| GMK NucBox K13 | |
| HP EliteBoard G1a AI | |
| Average AMD Ryzen AI 5 PRO 340 (n=1) | |
| HP Pro Mini 400 G9-937U0EA | |
| Geekom A5 Pro | |
| Aoostar WTR Pro, N150 | |
| Blender / v2.79 BMW27 CPU | |
| Aoostar WTR Pro, N150 | |
| Geekom A5 Pro | |
| MSI Cubi NUC AI+ 2MG | |
| GMK NucBox K13 | |
| HP Pro Mini 400 G9-937U0EA | |
| HP EliteBoard G1a AI | |
| Average AMD Ryzen AI 5 PRO 340 (n=1) | |
| Asus ExpertCenter PN54-S70012NN | |
| Beelink GTI15 Ultra | |
| Khadas Mind Pro | |
| Asus NUC 15 Pro+ | |
| 7-Zip 18.03 / 7z b 4 | |
| Asus NUC 15 Pro+ | |
| Khadas Mind Pro | |
| Beelink GTI15 Ultra | |
| Asus ExpertCenter PN54-S70012NN | |
| HP Pro Mini 400 G9-937U0EA | |
| HP EliteBoard G1a AI | |
| Average AMD Ryzen AI 5 PRO 340 (n=1) | |
| GMK NucBox K13 | |
| Geekom A5 Pro | |
| MSI Cubi NUC AI+ 2MG | |
| Aoostar WTR Pro, N150 | |
| 7-Zip 18.03 / 7z b 4 -mmt1 | |
| Khadas Mind Pro | |
| Beelink GTI15 Ultra | |
| Asus NUC 15 Pro+ | |
| HP Pro Mini 400 G9-937U0EA | |
| MSI Cubi NUC AI+ 2MG | |
| GMK NucBox K13 | |
| HP EliteBoard G1a AI | |
| Average AMD Ryzen AI 5 PRO 340 (n=1) | |
| Asus ExpertCenter PN54-S70012NN | |
| Geekom A5 Pro | |
| Aoostar WTR Pro, N150 | |
| Geekbench 6.7 / Multi-Core | |
| Asus NUC 15 Pro+ | |
| Khadas Mind Pro | |
| Beelink GTI15 Ultra | |
| Asus ExpertCenter PN54-S70012NN | |
| Average AMD Ryzen AI 5 PRO 340 (11409 - 11455, n=2) | |
| HP EliteBoard G1a AI | |
| GMK NucBox K13 | |
| HP Pro Mini 400 G9-937U0EA | |
| MSI Cubi NUC AI+ 2MG | |
| Geekom A5 Pro | |
| Aoostar WTR Pro, N150 | |
| Geekbench 6.7 / Single-Core | |
| Beelink GTI15 Ultra | |
| Asus ExpertCenter PN54-S70012NN | |
| Khadas Mind Pro | |
| GMK NucBox K13 | |
| MSI Cubi NUC AI+ 2MG | |
| Average AMD Ryzen AI 5 PRO 340 (2640 - 2771, n=2) | |
| Asus NUC 15 Pro+ | |
| HP EliteBoard G1a AI | |
| HP Pro Mini 400 G9-937U0EA | |
| Geekom A5 Pro | |
| Aoostar WTR Pro, N150 | |
| Geekbench 5.5 / Multi-Core | |
| Khadas Mind Pro | |
| Asus NUC 15 Pro+ | |
| Beelink GTI15 Ultra | |
| Asus ExpertCenter PN54-S70012NN | |
| HP EliteBoard G1a AI | |
| Average AMD Ryzen AI 5 PRO 340 (n=1) | |
| HP Pro Mini 400 G9-937U0EA | |
| GMK NucBox K13 | |
| MSI Cubi NUC AI+ 2MG | |
| Geekom A5 Pro | |
| Aoostar WTR Pro, N150 | |
| Geekbench 5.5 / Single-Core | |
| Beelink GTI15 Ultra | |
| Khadas Mind Pro | |
| Asus ExpertCenter PN54-S70012NN | |
| MSI Cubi NUC AI+ 2MG | |
| GMK NucBox K13 | |
| HP EliteBoard G1a AI | |
| Average AMD Ryzen AI 5 PRO 340 (n=1) | |
| HP Pro Mini 400 G9-937U0EA | |
| Asus NUC 15 Pro+ | |
| Geekom A5 Pro | |
| Aoostar WTR Pro, N150 | |
| HWBOT x265 Benchmark v2.2 / 4k Preset | |
| Asus NUC 15 Pro+ | |
| Khadas Mind Pro | |
| Beelink GTI15 Ultra | |
| Asus ExpertCenter PN54-S70012NN | |
| HP EliteBoard G1a AI | |
| Average AMD Ryzen AI 5 PRO 340 (n=1) | |
| GMK NucBox K13 | |
| MSI Cubi NUC AI+ 2MG | |
| HP Pro Mini 400 G9-937U0EA | |
| Geekom A5 Pro | |
| Aoostar WTR Pro, N150 | |
| LibreOffice / 20 Documents To PDF | |
| Aoostar WTR Pro, N150 | |
| HP EliteBoard G1a AI | |
| Average AMD Ryzen AI 5 PRO 340 (n=1) | |
| Geekom A5 Pro | |
| Asus NUC 15 Pro+ | |
| GMK NucBox K13 | |
| Asus ExpertCenter PN54-S70012NN | |
| HP Pro Mini 400 G9-937U0EA | |
| Khadas Mind Pro | |
| MSI Cubi NUC AI+ 2MG | |
| Beelink GTI15 Ultra | |
| R Benchmark 2.5 / Overall mean | |
| Aoostar WTR Pro, N150 | |
| Geekom A5 Pro | |
| MSI Cubi NUC AI+ 2MG | |
| HP EliteBoard G1a AI | |
| Average AMD Ryzen AI 5 PRO 340 (n=1) | |
| GMK NucBox K13 | |
| HP Pro Mini 400 G9-937U0EA | |
| Asus NUC 15 Pro+ | |
| Beelink GTI15 Ultra | |
| Khadas Mind Pro | |
| Khadas Mind Pro | |
| Asus ExpertCenter PN54-S70012NN | |
* ... smaller is better
AIDA64: FP32 Ray-Trace | FPU Julia | CPU SHA3 | CPU Queen | FPU SinJulia | FPU Mandel | CPU AES | CPU ZLib | FP64 Ray-Trace | CPU PhotoWorxx | CPU CheckMate
| Performance rating | |
| Asus NUC 15 Pro+ -1! | |
| HP EliteBoard G1a AI -1! | |
| Average AMD Ryzen AI 5 PRO 340 -1! | |
| GMK NucBox K13 -1! | |
| HP Pro Mini 400 G9-937U0EA -1! | |
| MSI Cubi NUC AI+ 2MG -1! | |
| Geekom A5 Pro | |
| AIDA64 / FP32 Ray-Trace | |
| Asus NUC 15 Pro+ (v6.92.6600) | |
| HP EliteBoard G1a AI (v8.20.8100) | |
| Average AMD Ryzen AI 5 PRO 340 (n=1) | |
| GMK NucBox K13 (v8.20.8100) | |
| MSI Cubi NUC AI+ 2MG (v6.92.6600) | |
| HP Pro Mini 400 G9-937U0EA (v6.92.6600) | |
| Geekom A5 Pro (v8.20.8100) | |
| Geekom A5 Pro (v6.92.6600) | |
| AIDA64 / FPU Julia | |
| Asus NUC 15 Pro+ (v6.92.6600) | |
| HP EliteBoard G1a AI (v8.20.8100) | |
| Average AMD Ryzen AI 5 PRO 340 (n=1) | |
| GMK NucBox K13 (v8.20.8100) | |
| MSI Cubi NUC AI+ 2MG (v6.92.6600) | |
| HP Pro Mini 400 G9-937U0EA (v6.92.6600) | |
| Geekom A5 Pro (v8.20.8100) | |
| Geekom A5 Pro (v6.92.6600) | |
| AIDA64 / CPU SHA3 | |
| Asus NUC 15 Pro+ (v6.92.6600) | |
| GMK NucBox K13 (v8.20.8100) | |
| MSI Cubi NUC AI+ 2MG (v6.92.6600) | |
| HP Pro Mini 400 G9-937U0EA (v6.92.6600) | |
| HP EliteBoard G1a AI (v8.20.8100) | |
| Average AMD Ryzen AI 5 PRO 340 (n=1) | |
| Geekom A5 Pro (v6.92.6600) | |
| Geekom A5 Pro (v8.20.8100) | |
| AIDA64 / CPU Queen | |
| HP Pro Mini 400 G9-937U0EA (v6.92.6600) | |
| Asus NUC 15 Pro+ (v6.92.6600) | |
| Geekom A5 Pro (v6.92.6600) | |
| MSI Cubi NUC AI+ 2MG (v6.92.6600) | |
| AIDA64 / FPU SinJulia | |
| HP EliteBoard G1a AI (v8.20.8100) | |
| Average AMD Ryzen AI 5 PRO 340 (n=1) | |
| Asus NUC 15 Pro+ (v6.92.6600) | |
| Geekom A5 Pro (v6.92.6600) | |
| Geekom A5 Pro (v8.20.8100) | |
| HP Pro Mini 400 G9-937U0EA (v6.92.6600) | |
| GMK NucBox K13 (v8.20.8100) | |
| MSI Cubi NUC AI+ 2MG (v6.92.6600) | |
| AIDA64 / FPU Mandel | |
| Asus NUC 15 Pro+ (v6.92.6600) | |
| HP EliteBoard G1a AI (v8.20.8100) | |
| Average AMD Ryzen AI 5 PRO 340 (n=1) | |
| GMK NucBox K13 (v8.20.8100) | |
| MSI Cubi NUC AI+ 2MG (v6.92.6600) | |
| Geekom A5 Pro (v6.92.6600) | |
| Geekom A5 Pro (v8.20.8100) | |
| HP Pro Mini 400 G9-937U0EA (v6.92.6600) | |
| AIDA64 / CPU AES | |
| Asus NUC 15 Pro+ (v6.92.6600) | |
| GMK NucBox K13 (v8.20.8100) | |
| HP Pro Mini 400 G9-937U0EA (v6.92.6600) | |
| HP EliteBoard G1a AI (v8.20.8100) | |
| Average AMD Ryzen AI 5 PRO 340 (n=1) | |
| MSI Cubi NUC AI+ 2MG (v6.92.6600) | |
| Geekom A5 Pro (v6.92.6600) | |
| Geekom A5 Pro (v8.20.8100) | |
| AIDA64 / CPU ZLib | |
| Asus NUC 15 Pro+ (v6.92.6600) | |
| HP Pro Mini 400 G9-937U0EA (v6.92.6600) | |
| HP EliteBoard G1a AI (v8.20.8100) | |
| Average AMD Ryzen AI 5 PRO 340 (n=1) | |
| GMK NucBox K13 (v8.20.8100) | |
| MSI Cubi NUC AI+ 2MG (v6.92.6600) | |
| Geekom A5 Pro (v6.92.6600) | |
| Geekom A5 Pro (v8.20.8100) | |
| AIDA64 / FP64 Ray-Trace | |
| Asus NUC 15 Pro+ (v6.92.6600) | |
| HP EliteBoard G1a AI (v8.20.8100) | |
| Average AMD Ryzen AI 5 PRO 340 (n=1) | |
| GMK NucBox K13 (v8.20.8100) | |
| MSI Cubi NUC AI+ 2MG (v6.92.6600) | |
| HP Pro Mini 400 G9-937U0EA (v6.92.6600) | |
| Geekom A5 Pro (v8.20.8100) | |
| Geekom A5 Pro (v6.92.6600) | |
| AIDA64 / CPU PhotoWorxx | |
| GMK NucBox K13 (v8.20.8100) | |
| Asus NUC 15 Pro+ (v6.92.6600) | |
| MSI Cubi NUC AI+ 2MG (v6.92.6600) | |
| HP EliteBoard G1a AI (v8.20.8100) | |
| Average AMD Ryzen AI 5 PRO 340 (n=1) | |
| HP Pro Mini 400 G9-937U0EA (v6.92.6600) | |
| Geekom A5 Pro (v6.92.6600) | |
| Geekom A5 Pro (v8.20.8100) | |
| AIDA64 / CPU CheckMate | |
| HP EliteBoard G1a AI (v8.20.8100) | |
| Average AMD Ryzen AI 5 PRO 340 (n=1) | |
| GMK NucBox K13 (v8.20.8100) | |
| Geekom A5 Pro (v8.20.8100) | |
系统性能
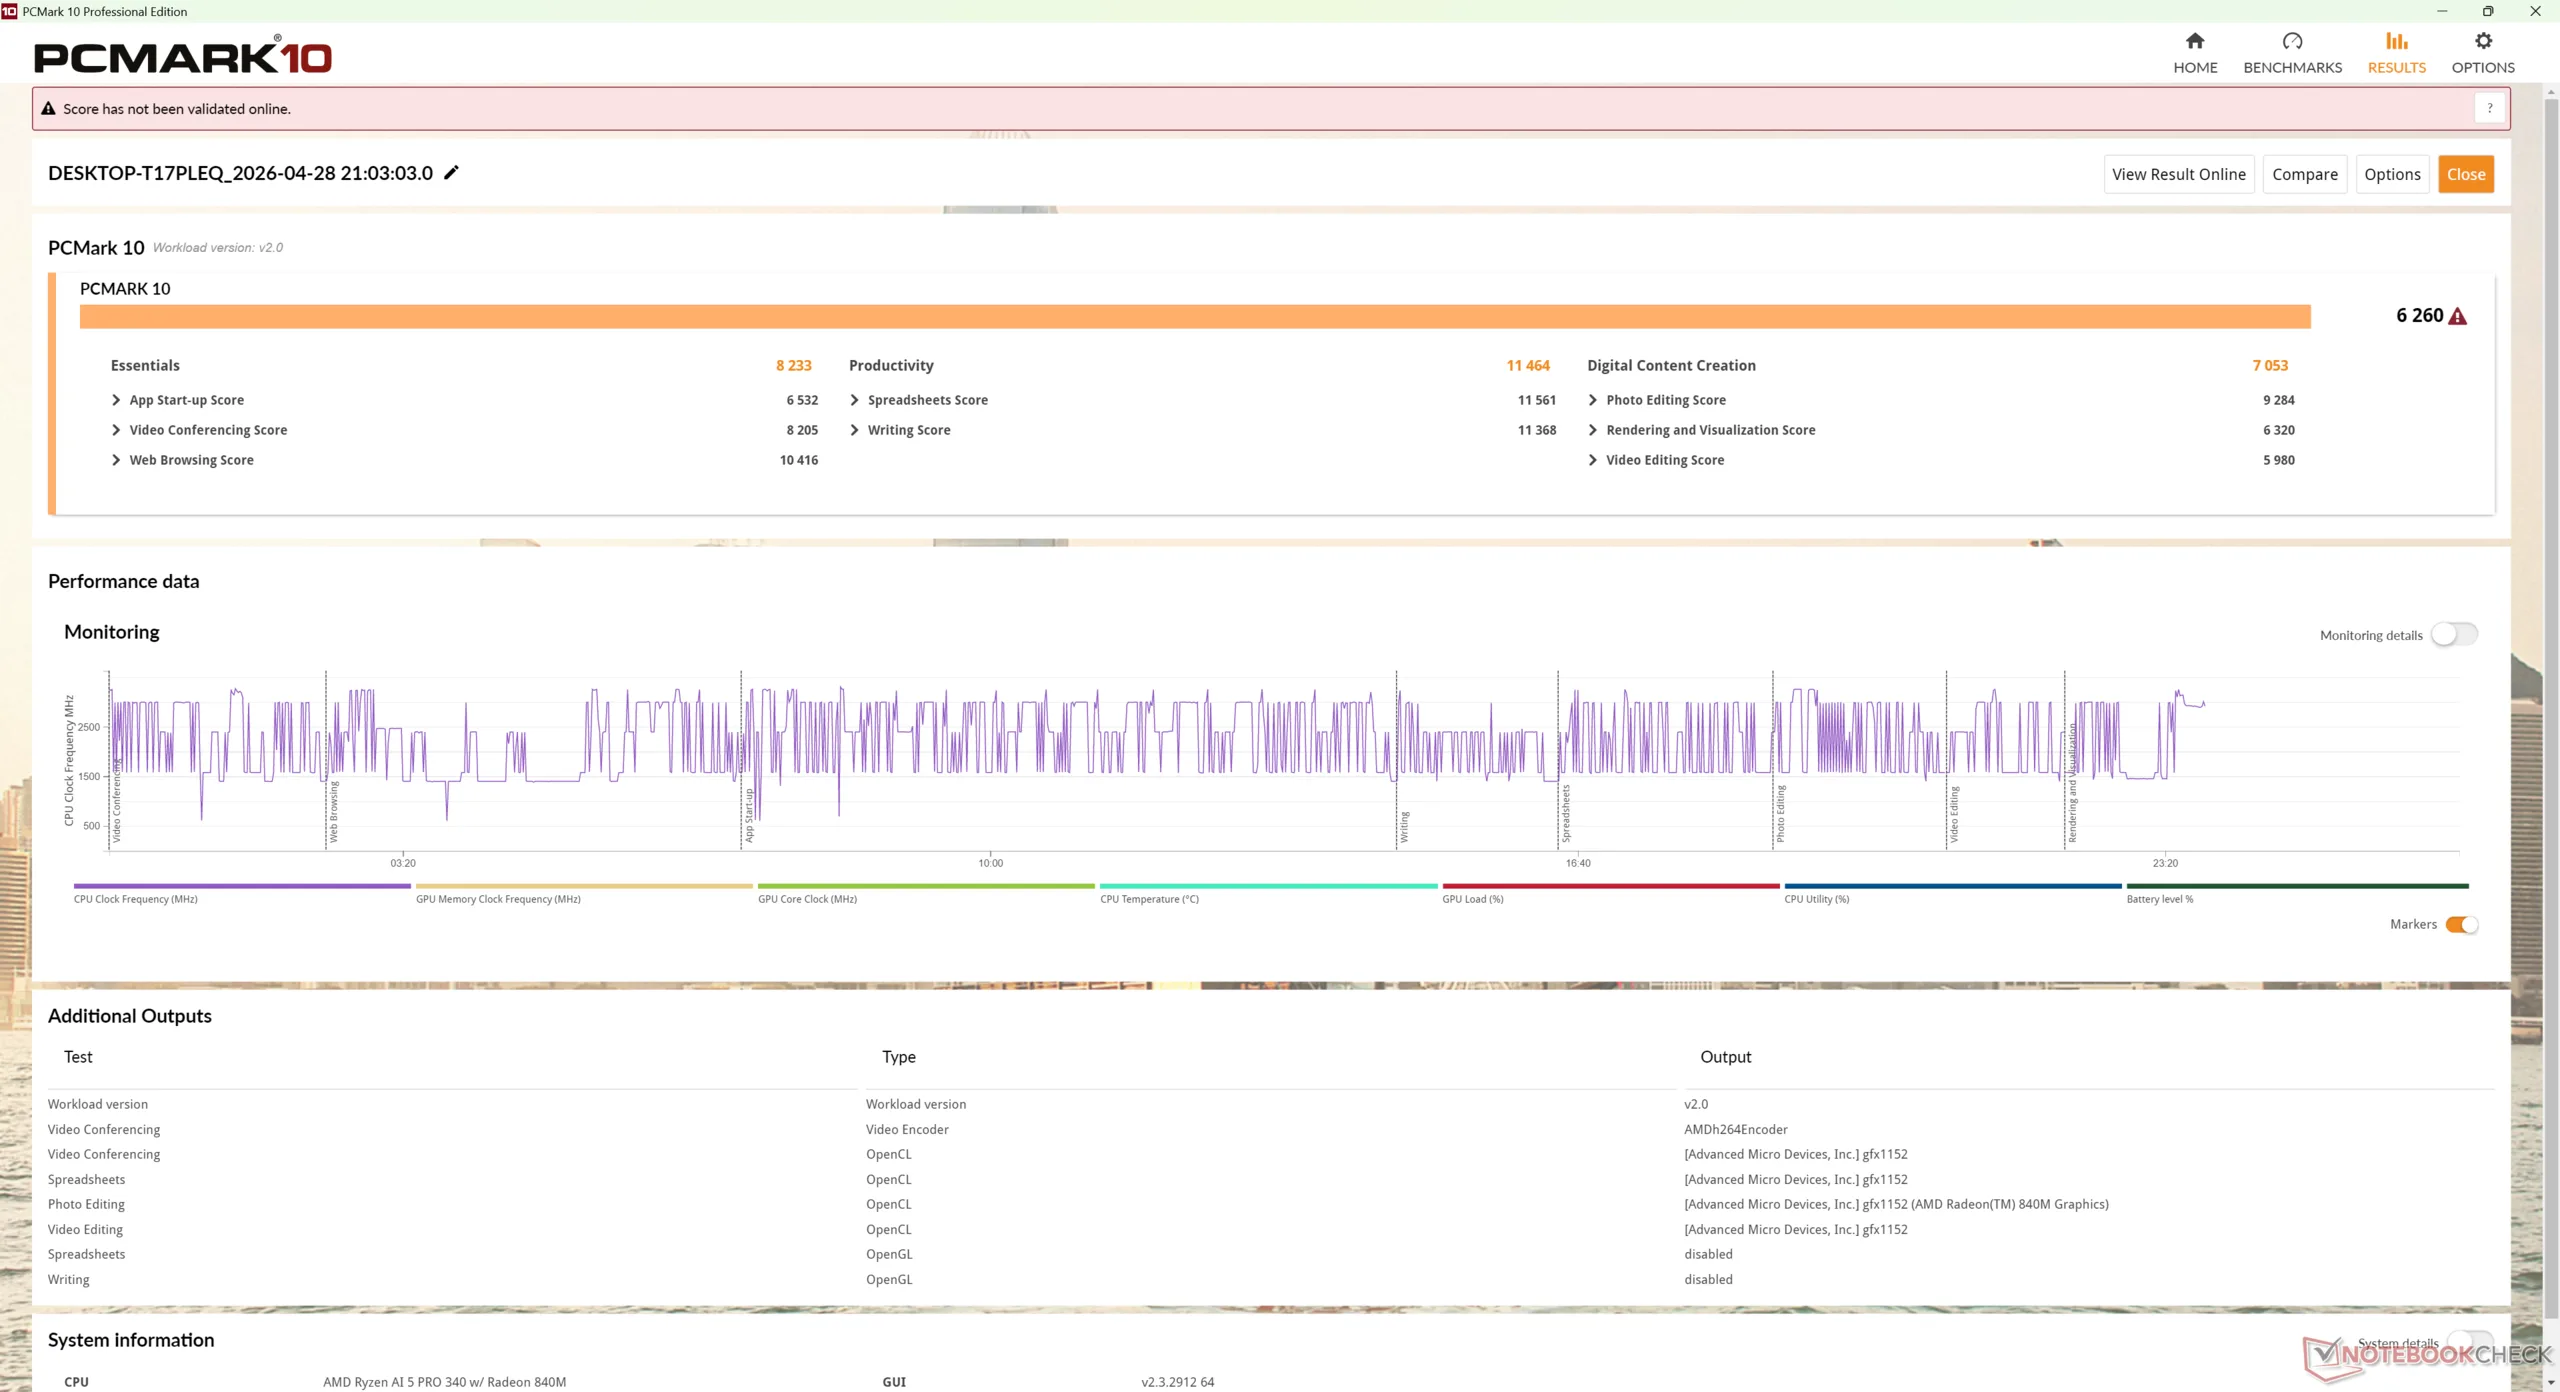
PCMark 10: Score | Essentials | Productivity | Digital Content Creation
CrossMark: Overall | Productivity | Creativity | Responsiveness
WebXPRT 3: Overall
WebXPRT 4: Overall
Mozilla Kraken 1.1: Total
Geekbench AI: Quantized GPU 1.7 | Half Precision GPU 1.7 | Single Precision GPU 1.7
| Performance rating | |
| MSI Cubi NUC AI+ 2MG | |
| GMK NucBox K13 | |
| Asus NUC 15 Pro+ | |
| HP EliteBoard G1a AI | |
| Average AMD Ryzen AI 5 PRO 340, AMD Radeon 840M | |
| HP Pro Mini 400 G9-937U0EA -3! | |
| Geekom A5 Pro | |
| PCMark 10 / Score | |
| GMK NucBox K13 | |
| Asus NUC 15 Pro+ | |
| MSI Cubi NUC AI+ 2MG | |
| HP EliteBoard G1a AI | |
| Average AMD Ryzen AI 5 PRO 340, AMD Radeon 840M (n=1) | |
| Geekom A5 Pro | |
| HP Pro Mini 400 G9-937U0EA | |
| PCMark 10 / Essentials | |
| MSI Cubi NUC AI+ 2MG | |
| GMK NucBox K13 | |
| Asus NUC 15 Pro+ | |
| HP Pro Mini 400 G9-937U0EA | |
| Geekom A5 Pro | |
| HP EliteBoard G1a AI | |
| Average AMD Ryzen AI 5 PRO 340, AMD Radeon 840M (n=1) | |
| PCMark 10 / Productivity | |
| Geekom A5 Pro | |
| GMK NucBox K13 | |
| HP EliteBoard G1a AI | |
| Average AMD Ryzen AI 5 PRO 340, AMD Radeon 840M (n=1) | |
| MSI Cubi NUC AI+ 2MG | |
| Asus NUC 15 Pro+ | |
| HP Pro Mini 400 G9-937U0EA | |
| PCMark 10 / Digital Content Creation | |
| Asus NUC 15 Pro+ | |
| GMK NucBox K13 | |
| MSI Cubi NUC AI+ 2MG | |
| HP EliteBoard G1a AI | |
| Average AMD Ryzen AI 5 PRO 340, AMD Radeon 840M (n=1) | |
| HP Pro Mini 400 G9-937U0EA | |
| Geekom A5 Pro | |
| CrossMark / Overall | |
| Asus NUC 15 Pro+ | |
| GMK NucBox K13 | |
| HP EliteBoard G1a AI | |
| Average AMD Ryzen AI 5 PRO 340, AMD Radeon 840M (n=1) | |
| MSI Cubi NUC AI+ 2MG | |
| HP Pro Mini 400 G9-937U0EA | |
| Geekom A5 Pro | |
| CrossMark / Productivity | |
| GMK NucBox K13 | |
| Asus NUC 15 Pro+ | |
| HP EliteBoard G1a AI | |
| Average AMD Ryzen AI 5 PRO 340, AMD Radeon 840M (n=1) | |
| MSI Cubi NUC AI+ 2MG | |
| HP Pro Mini 400 G9-937U0EA | |
| Geekom A5 Pro | |
| CrossMark / Creativity | |
| Asus NUC 15 Pro+ | |
| HP EliteBoard G1a AI | |
| Average AMD Ryzen AI 5 PRO 340, AMD Radeon 840M (n=1) | |
| GMK NucBox K13 | |
| MSI Cubi NUC AI+ 2MG | |
| HP Pro Mini 400 G9-937U0EA | |
| Geekom A5 Pro | |
| CrossMark / Responsiveness | |
| GMK NucBox K13 | |
| Asus NUC 15 Pro+ | |
| HP EliteBoard G1a AI | |
| Average AMD Ryzen AI 5 PRO 340, AMD Radeon 840M (n=1) | |
| MSI Cubi NUC AI+ 2MG | |
| HP Pro Mini 400 G9-937U0EA | |
| Geekom A5 Pro | |
| WebXPRT 3 / Overall | |
| HP EliteBoard G1a AI | |
| Average AMD Ryzen AI 5 PRO 340, AMD Radeon 840M (n=1) | |
| MSI Cubi NUC AI+ 2MG | |
| GMK NucBox K13 | |
| HP Pro Mini 400 G9-937U0EA | |
| Geekom A5 Pro | |
| Asus NUC 15 Pro+ | |
| WebXPRT 4 / Overall | |
| GMK NucBox K13 | |
| MSI Cubi NUC AI+ 2MG | |
| HP EliteBoard G1a AI | |
| Average AMD Ryzen AI 5 PRO 340, AMD Radeon 840M (n=1) | |
| HP Pro Mini 400 G9-937U0EA | |
| Asus NUC 15 Pro+ | |
| Geekom A5 Pro | |
| Mozilla Kraken 1.1 / Total | |
| Geekom A5 Pro | |
| HP Pro Mini 400 G9-937U0EA | |
| MSI Cubi NUC AI+ 2MG | |
| HP EliteBoard G1a AI | |
| Average AMD Ryzen AI 5 PRO 340, AMD Radeon 840M (n=1) | |
| Asus NUC 15 Pro+ | |
| GMK NucBox K13 | |
| Geekbench AI / Quantized GPU 1.7 | |
| MSI Cubi NUC AI+ 2MG | |
| Asus NUC 15 Pro+ | |
| GMK NucBox K13 | |
| HP EliteBoard G1a AI | |
| Average AMD Ryzen AI 5 PRO 340, AMD Radeon 840M (n=1) | |
| Geekom A5 Pro | |
| Geekbench AI / Half Precision GPU 1.7 | |
| MSI Cubi NUC AI+ 2MG | |
| Asus NUC 15 Pro+ | |
| GMK NucBox K13 | |
| HP EliteBoard G1a AI | |
| Average AMD Ryzen AI 5 PRO 340, AMD Radeon 840M (n=1) | |
| Geekom A5 Pro | |
| Geekbench AI / Single Precision GPU 1.7 | |
| MSI Cubi NUC AI+ 2MG | |
| Asus NUC 15 Pro+ | |
| GMK NucBox K13 | |
| HP EliteBoard G1a AI | |
| Average AMD Ryzen AI 5 PRO 340, AMD Radeon 840M (n=1) | |
| Geekom A5 Pro | |
* ... smaller is better
| PCMark 10 Score | 6260 points | |
Help | ||
| AIDA64 / Memory Copy | |
| MSI Cubi NUC AI+ 2MG | |
| GMK NucBox K13 | |
| Asus NUC 15 Pro+ | |
| HP EliteBoard G1a AI | |
| Average AMD Ryzen AI 5 PRO 340 (n=1) | |
| Geekom A5 Pro | |
| Geekom A5 Pro | |
| HP Pro Mini 400 G9-937U0EA | |
| AIDA64 / Memory Read | |
| GMK NucBox K13 | |
| Asus NUC 15 Pro+ | |
| MSI Cubi NUC AI+ 2MG | |
| HP EliteBoard G1a AI | |
| Average AMD Ryzen AI 5 PRO 340 (n=1) | |
| Geekom A5 Pro | |
| Geekom A5 Pro | |
| HP Pro Mini 400 G9-937U0EA | |
| AIDA64 / Memory Write | |
| MSI Cubi NUC AI+ 2MG | |
| GMK NucBox K13 | |
| HP EliteBoard G1a AI | |
| Average AMD Ryzen AI 5 PRO 340 (n=1) | |
| Asus NUC 15 Pro+ | |
| Geekom A5 Pro | |
| Geekom A5 Pro | |
| HP Pro Mini 400 G9-937U0EA | |
| AIDA64 / Memory Latency | |
| HP EliteBoard G1a AI | |
| Average AMD Ryzen AI 5 PRO 340 (n=1) | |
| Asus NUC 15 Pro+ | |
| GMK NucBox K13 | |
| Geekom A5 Pro | |
| Geekom A5 Pro | |
| MSI Cubi NUC AI+ 2MG | |
| HP Pro Mini 400 G9-937U0EA | |
* ... smaller is better
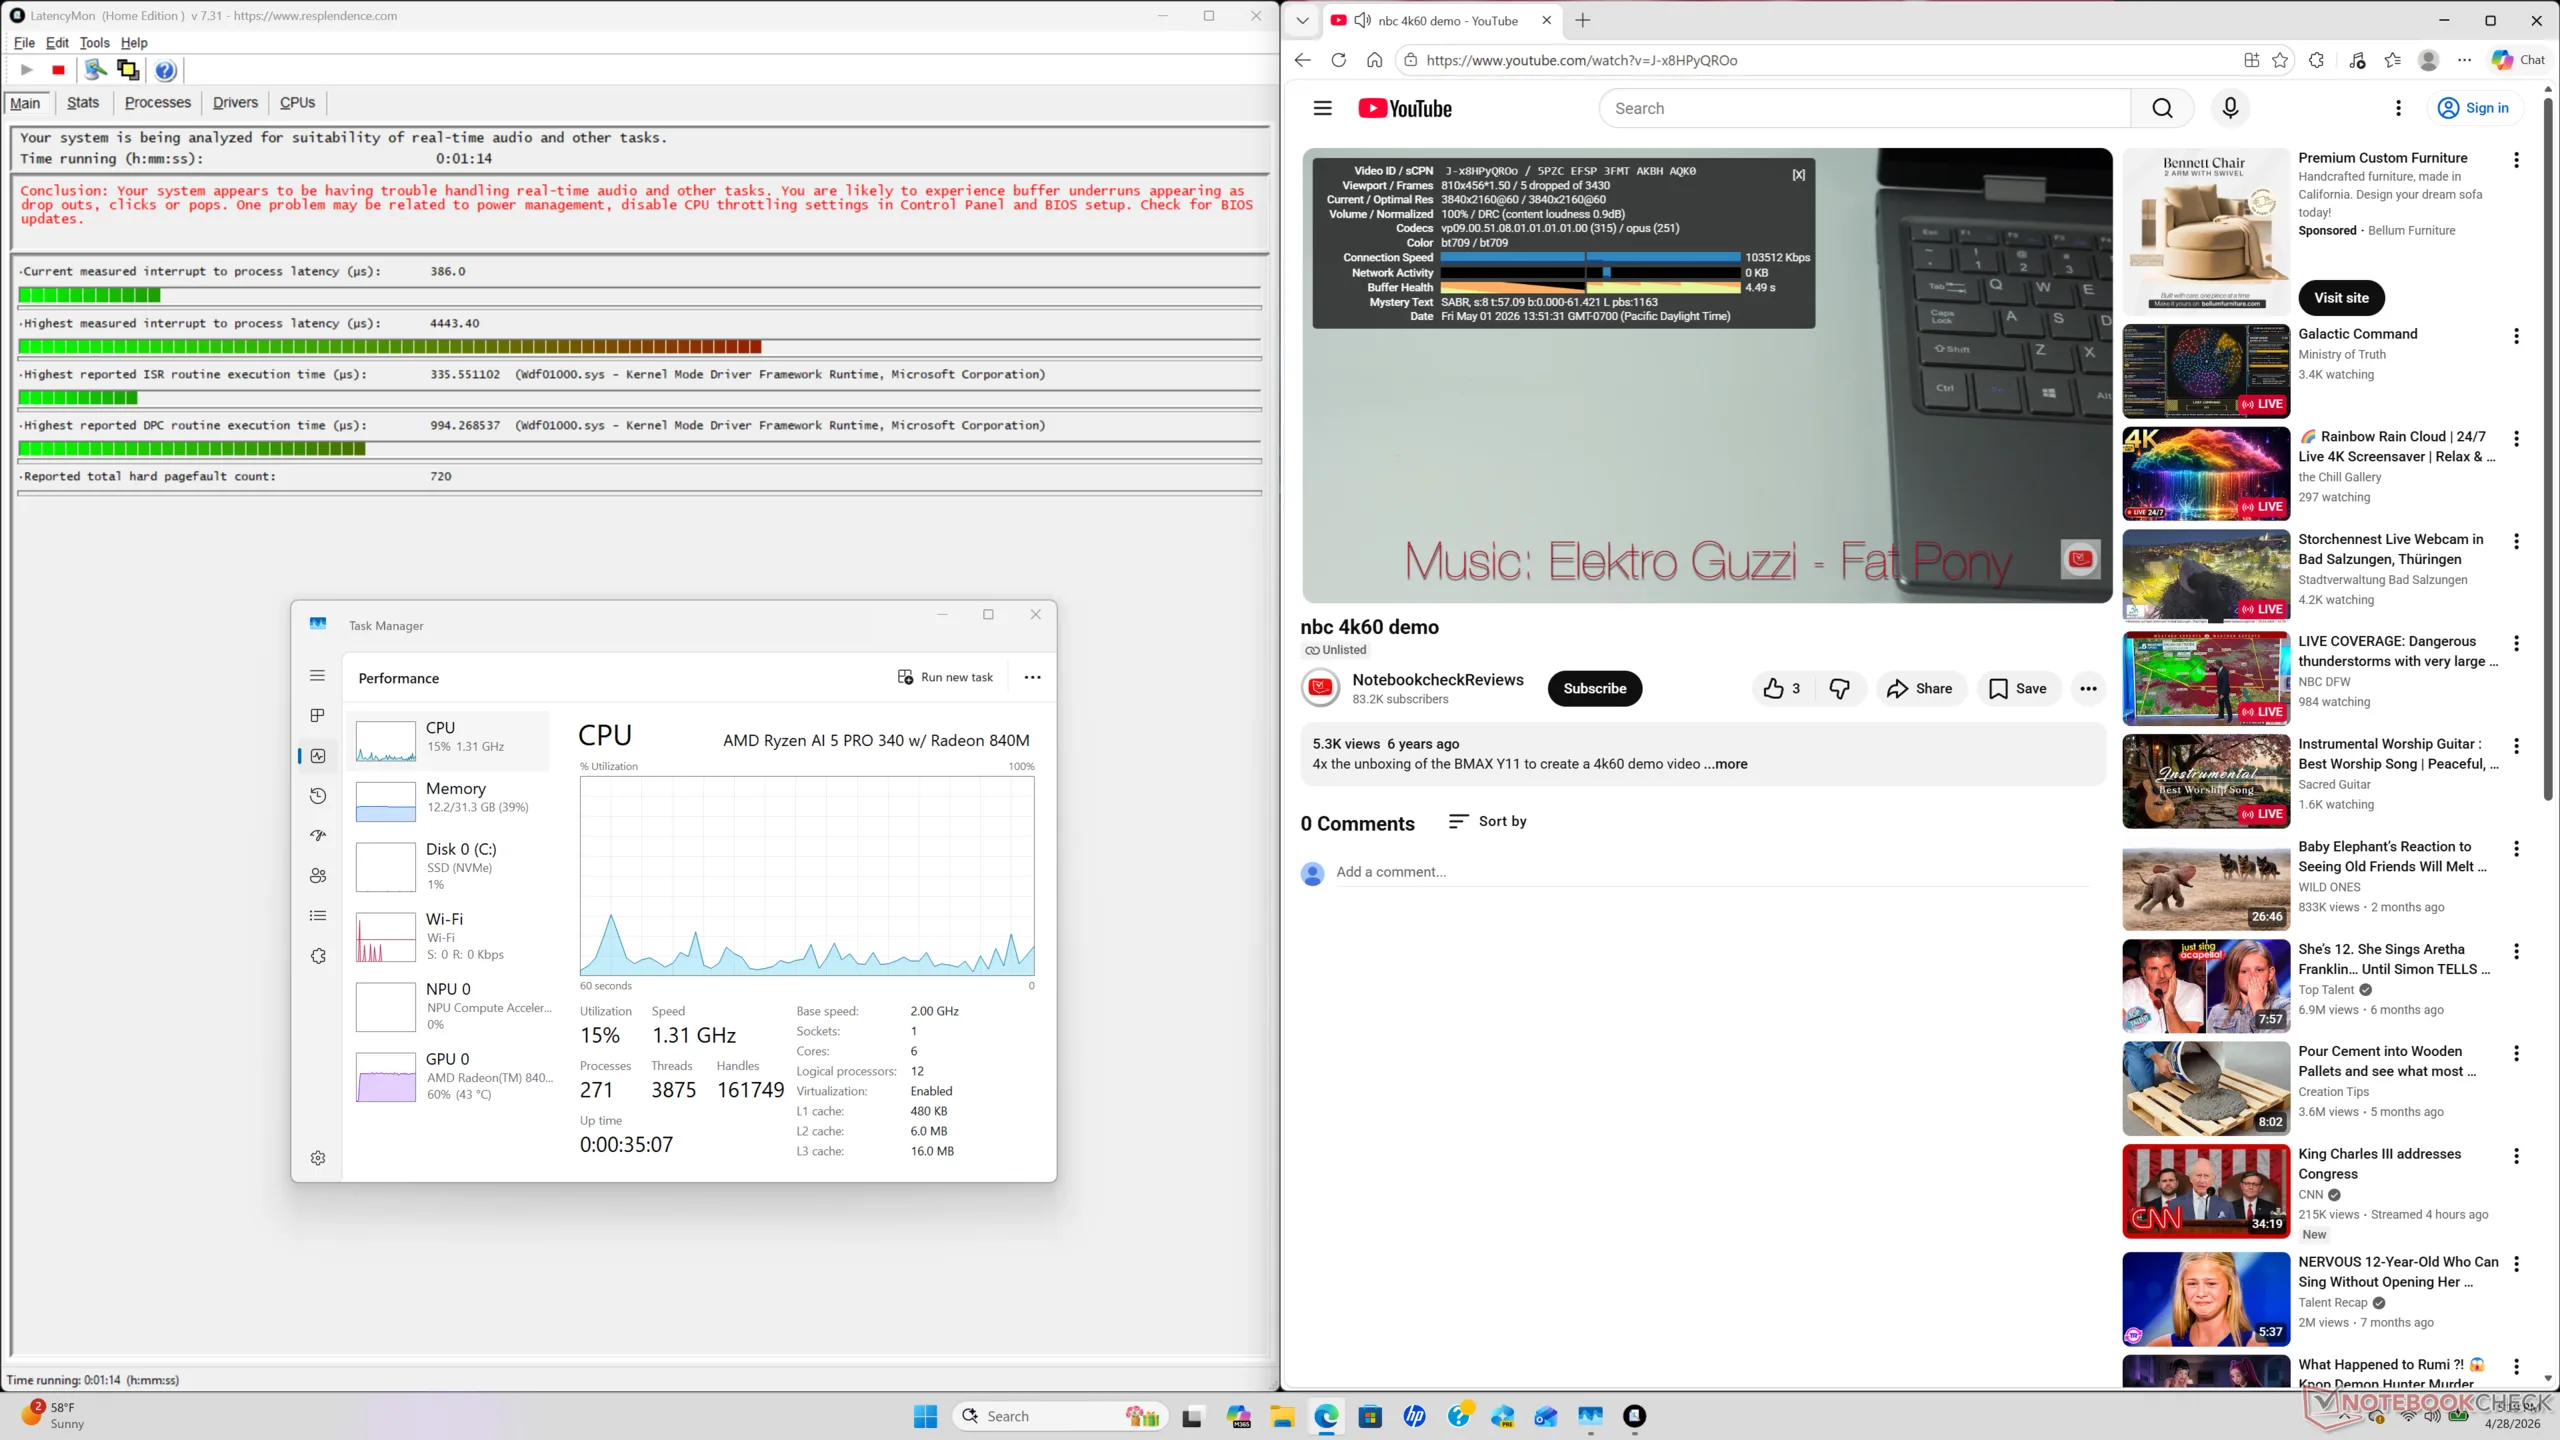
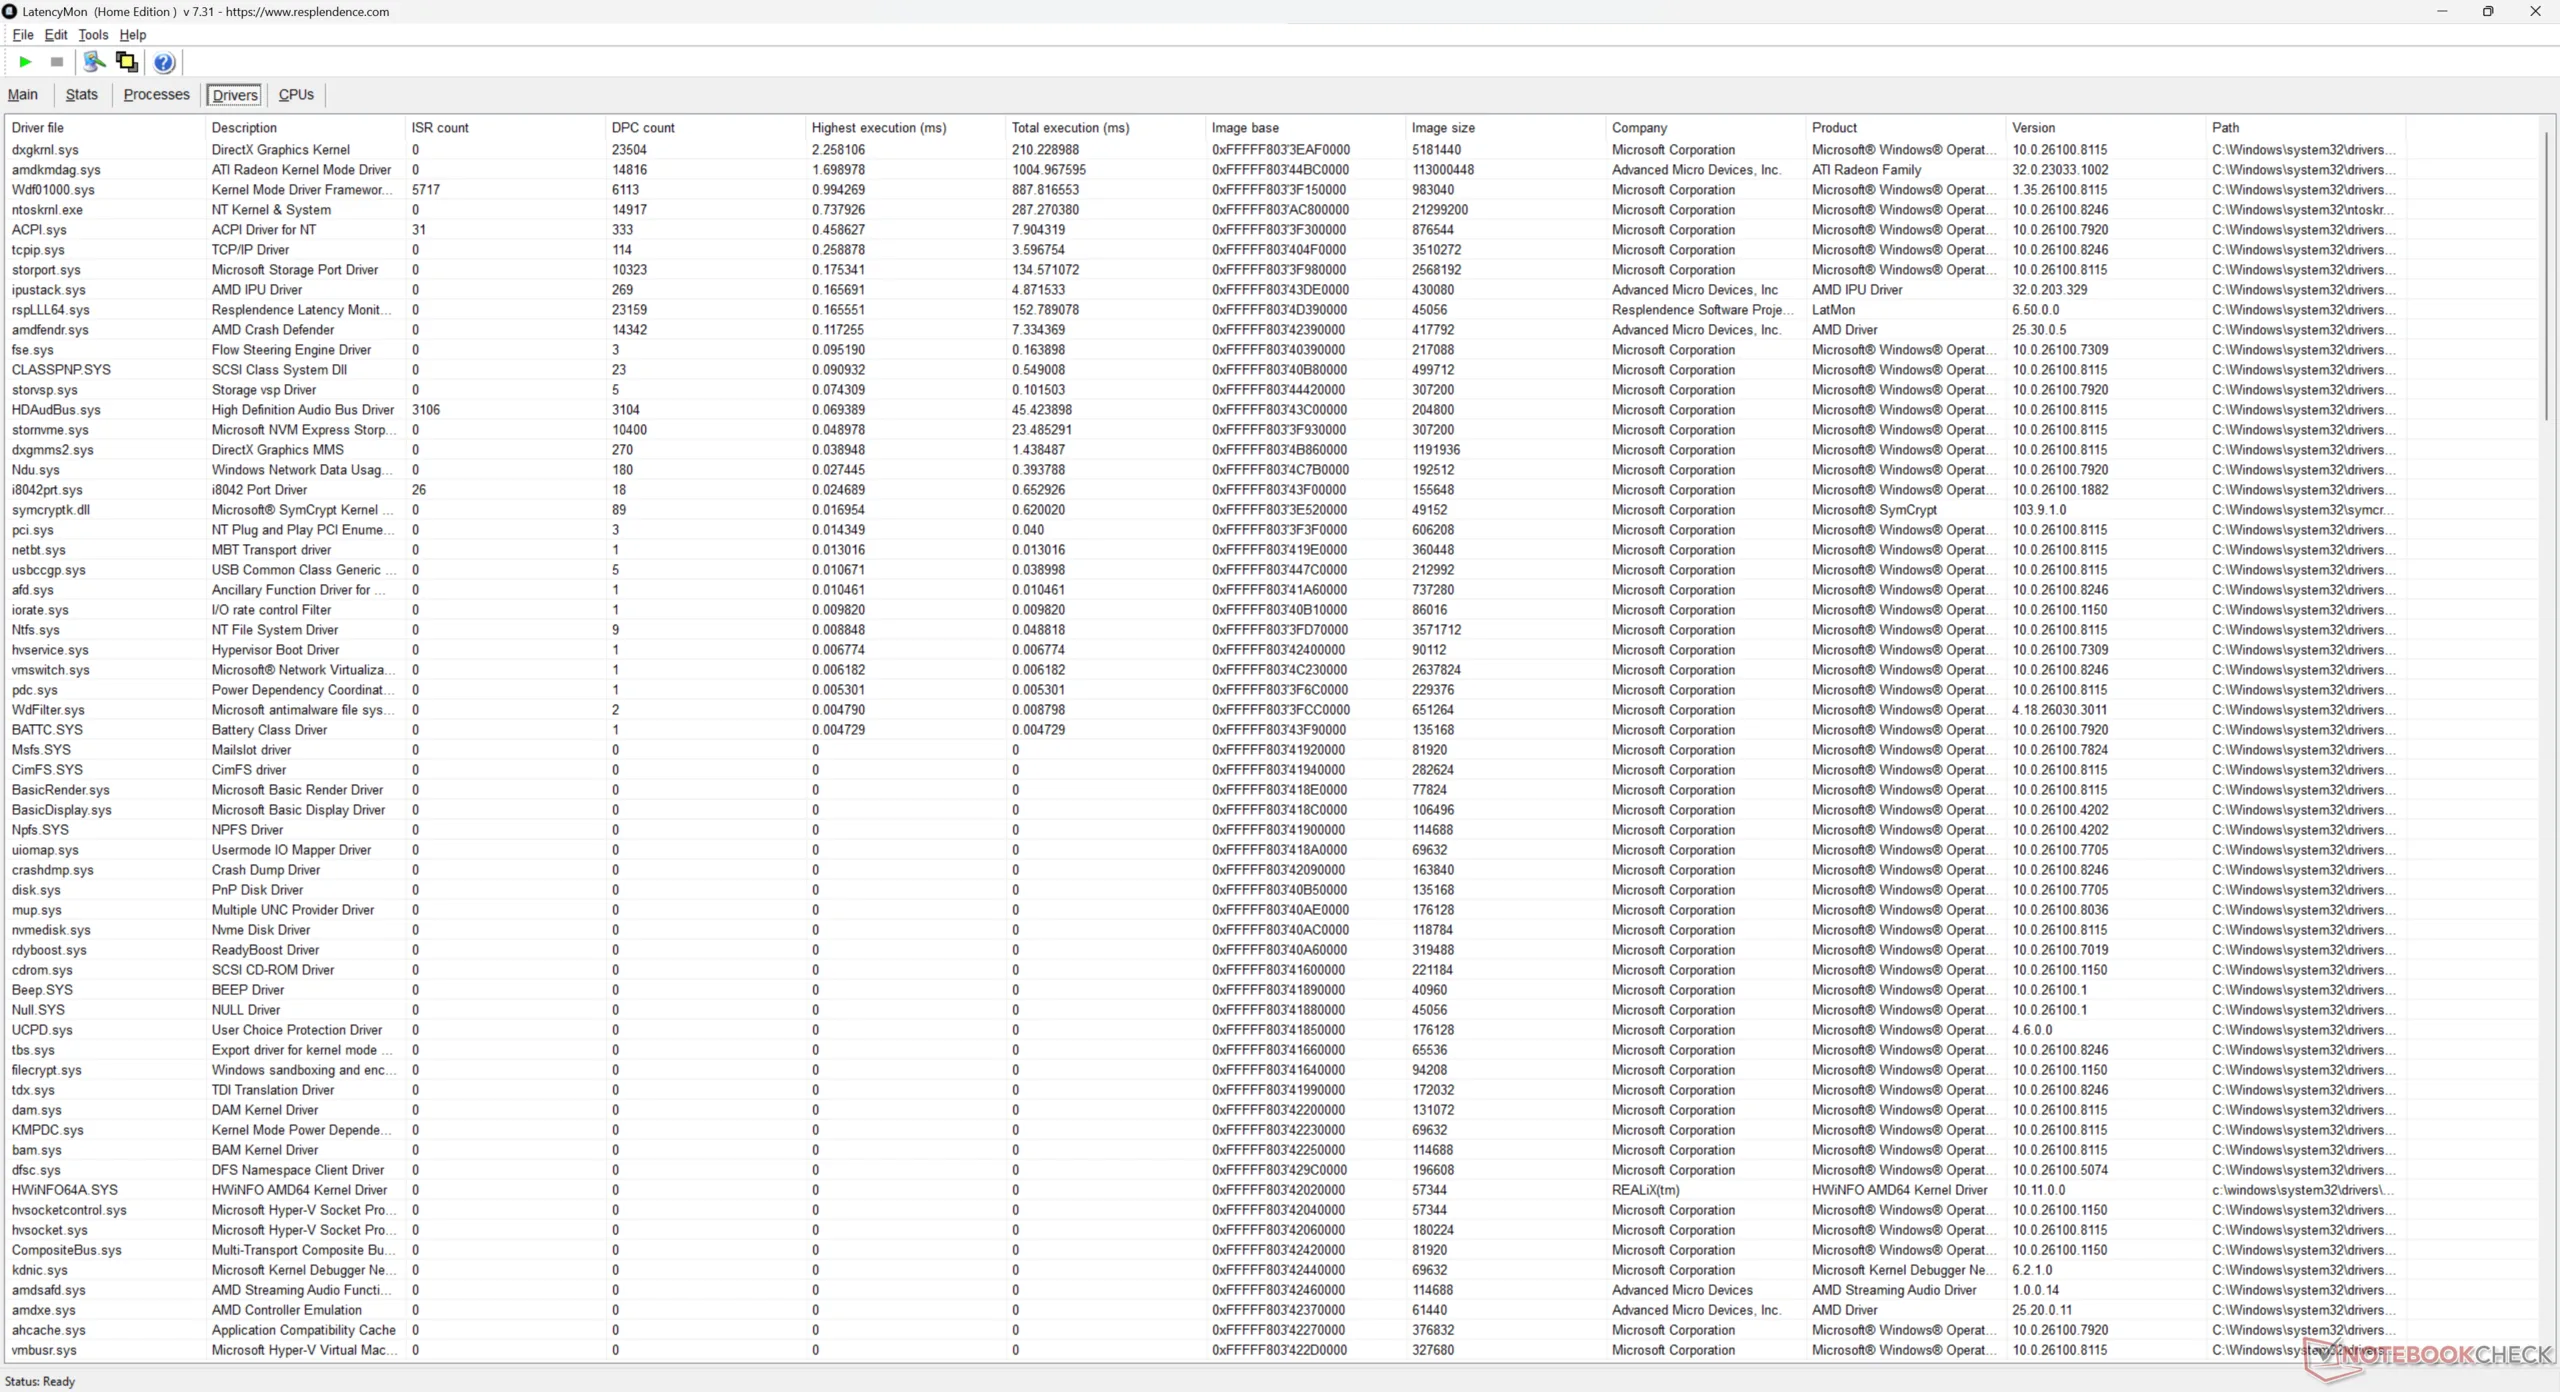
DPC 延迟
LatencyMon 显示在播放 4K60 视频内容时存在 DPC 问题和少量丢帧现象。即使在发布时使用最新的图形驱动程序和 Edge 版本重复测试,结果也不会改变。虽然视频流时的少量掉帧几乎无法察觉,但完全没有掉帧才是最理想的。
| DPC Latencies / LatencyMon - interrupt to process latency (max), Web, Youtube, Prime95 | |
| HP EliteBoard G1a AI | |
| GMK NucBox K13 | |
| Geekom A5 Pro | |
| HP Pro Mini 400 G9-937U0EA | |
| Asus NUC 15 Pro+ | |
| MSI Cubi NUC AI+ 2MG | |
* ... smaller is better
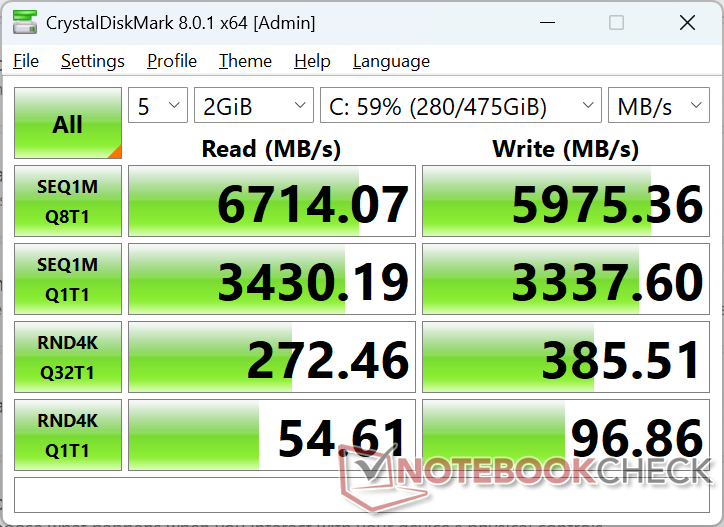
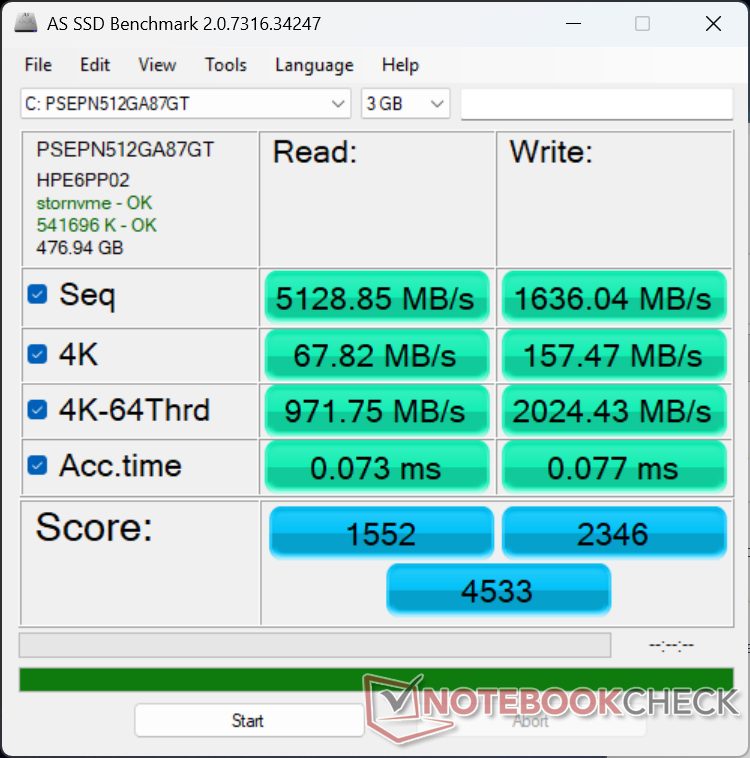
存储设备
我们的配置采用 512 GB PSEPN512GA87GTPCIe4 x4 NVMe 2280 SSD,传输速率高达 7000 MB/s,即使在压力下也不会出现节流。对于 EliteBoard 所设计的工作负载类型而言,这样的速度可以说是矫枉过正,但快速的性能还是值得欢迎的。

| Drive Performance rating - Percent | |
| HP EliteBoard G1a AI | |
| Asus NUC 15 Pro+ | |
| Geekom A5 Pro | |
| MSI Cubi NUC AI+ 2MG | |
| GMK NucBox K13 | |
| HP Pro Mini 400 G9-937U0EA | |
* ... smaller is better
磁盘节流DiskSpd 读取循环,队列深度 8
图形处理器性能
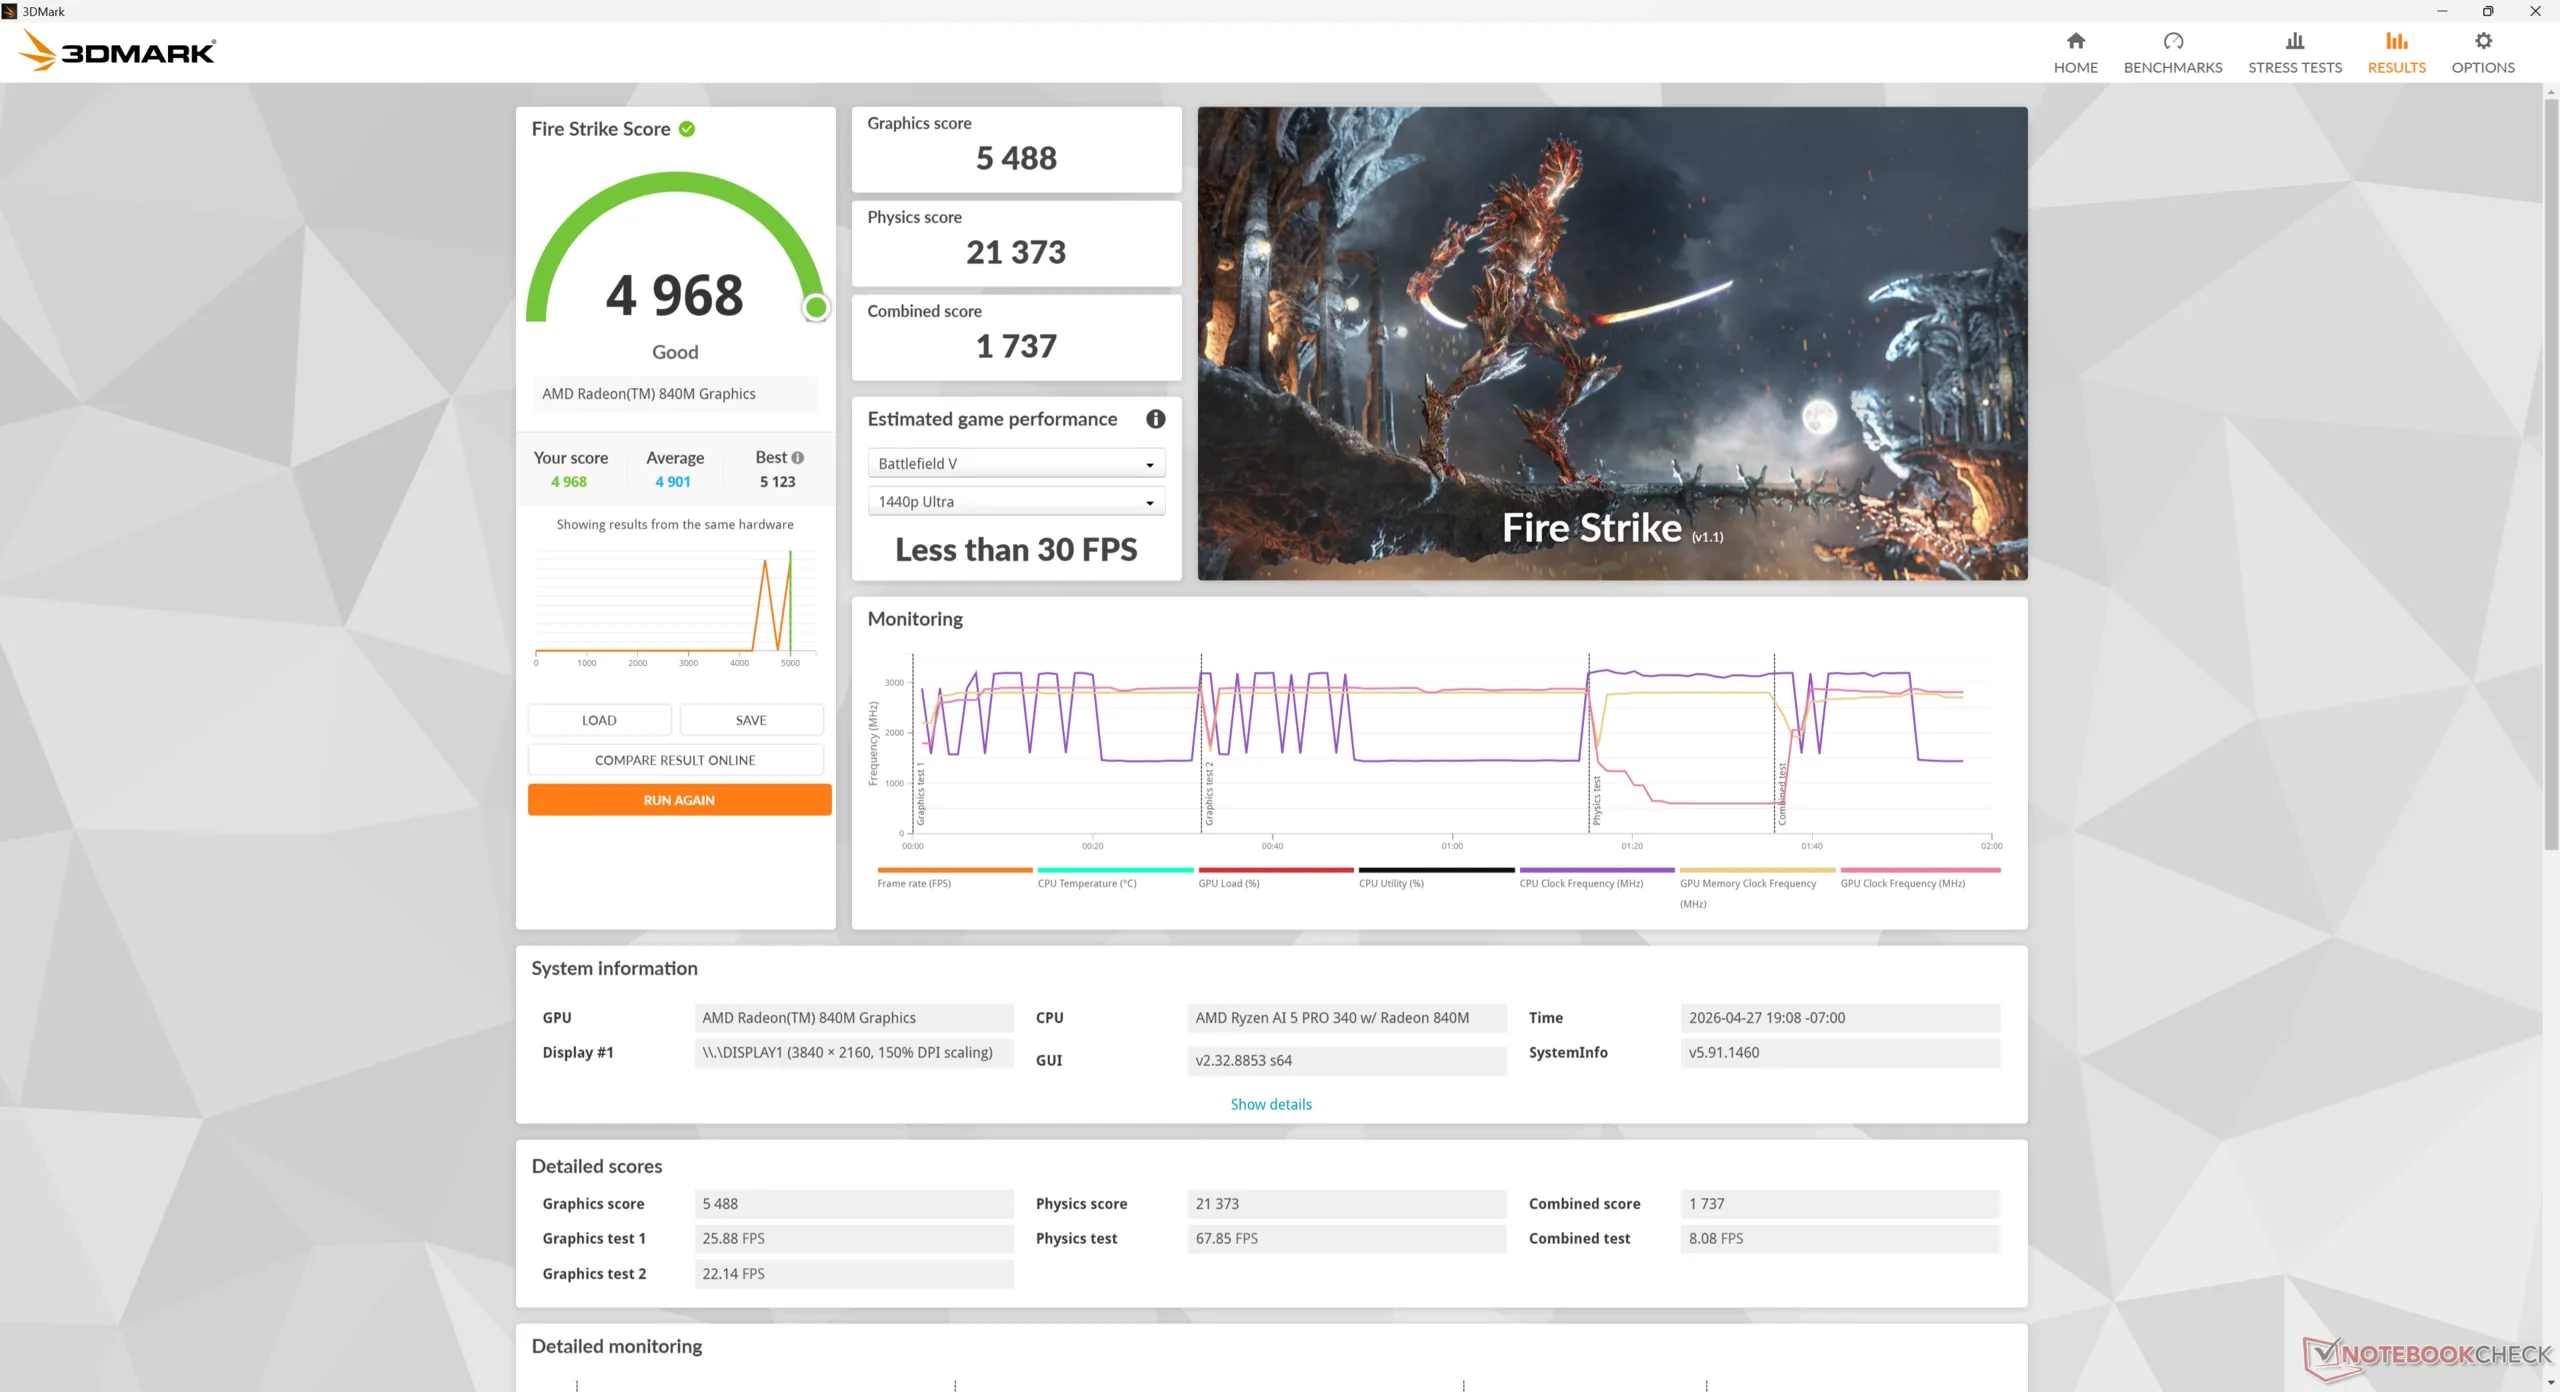
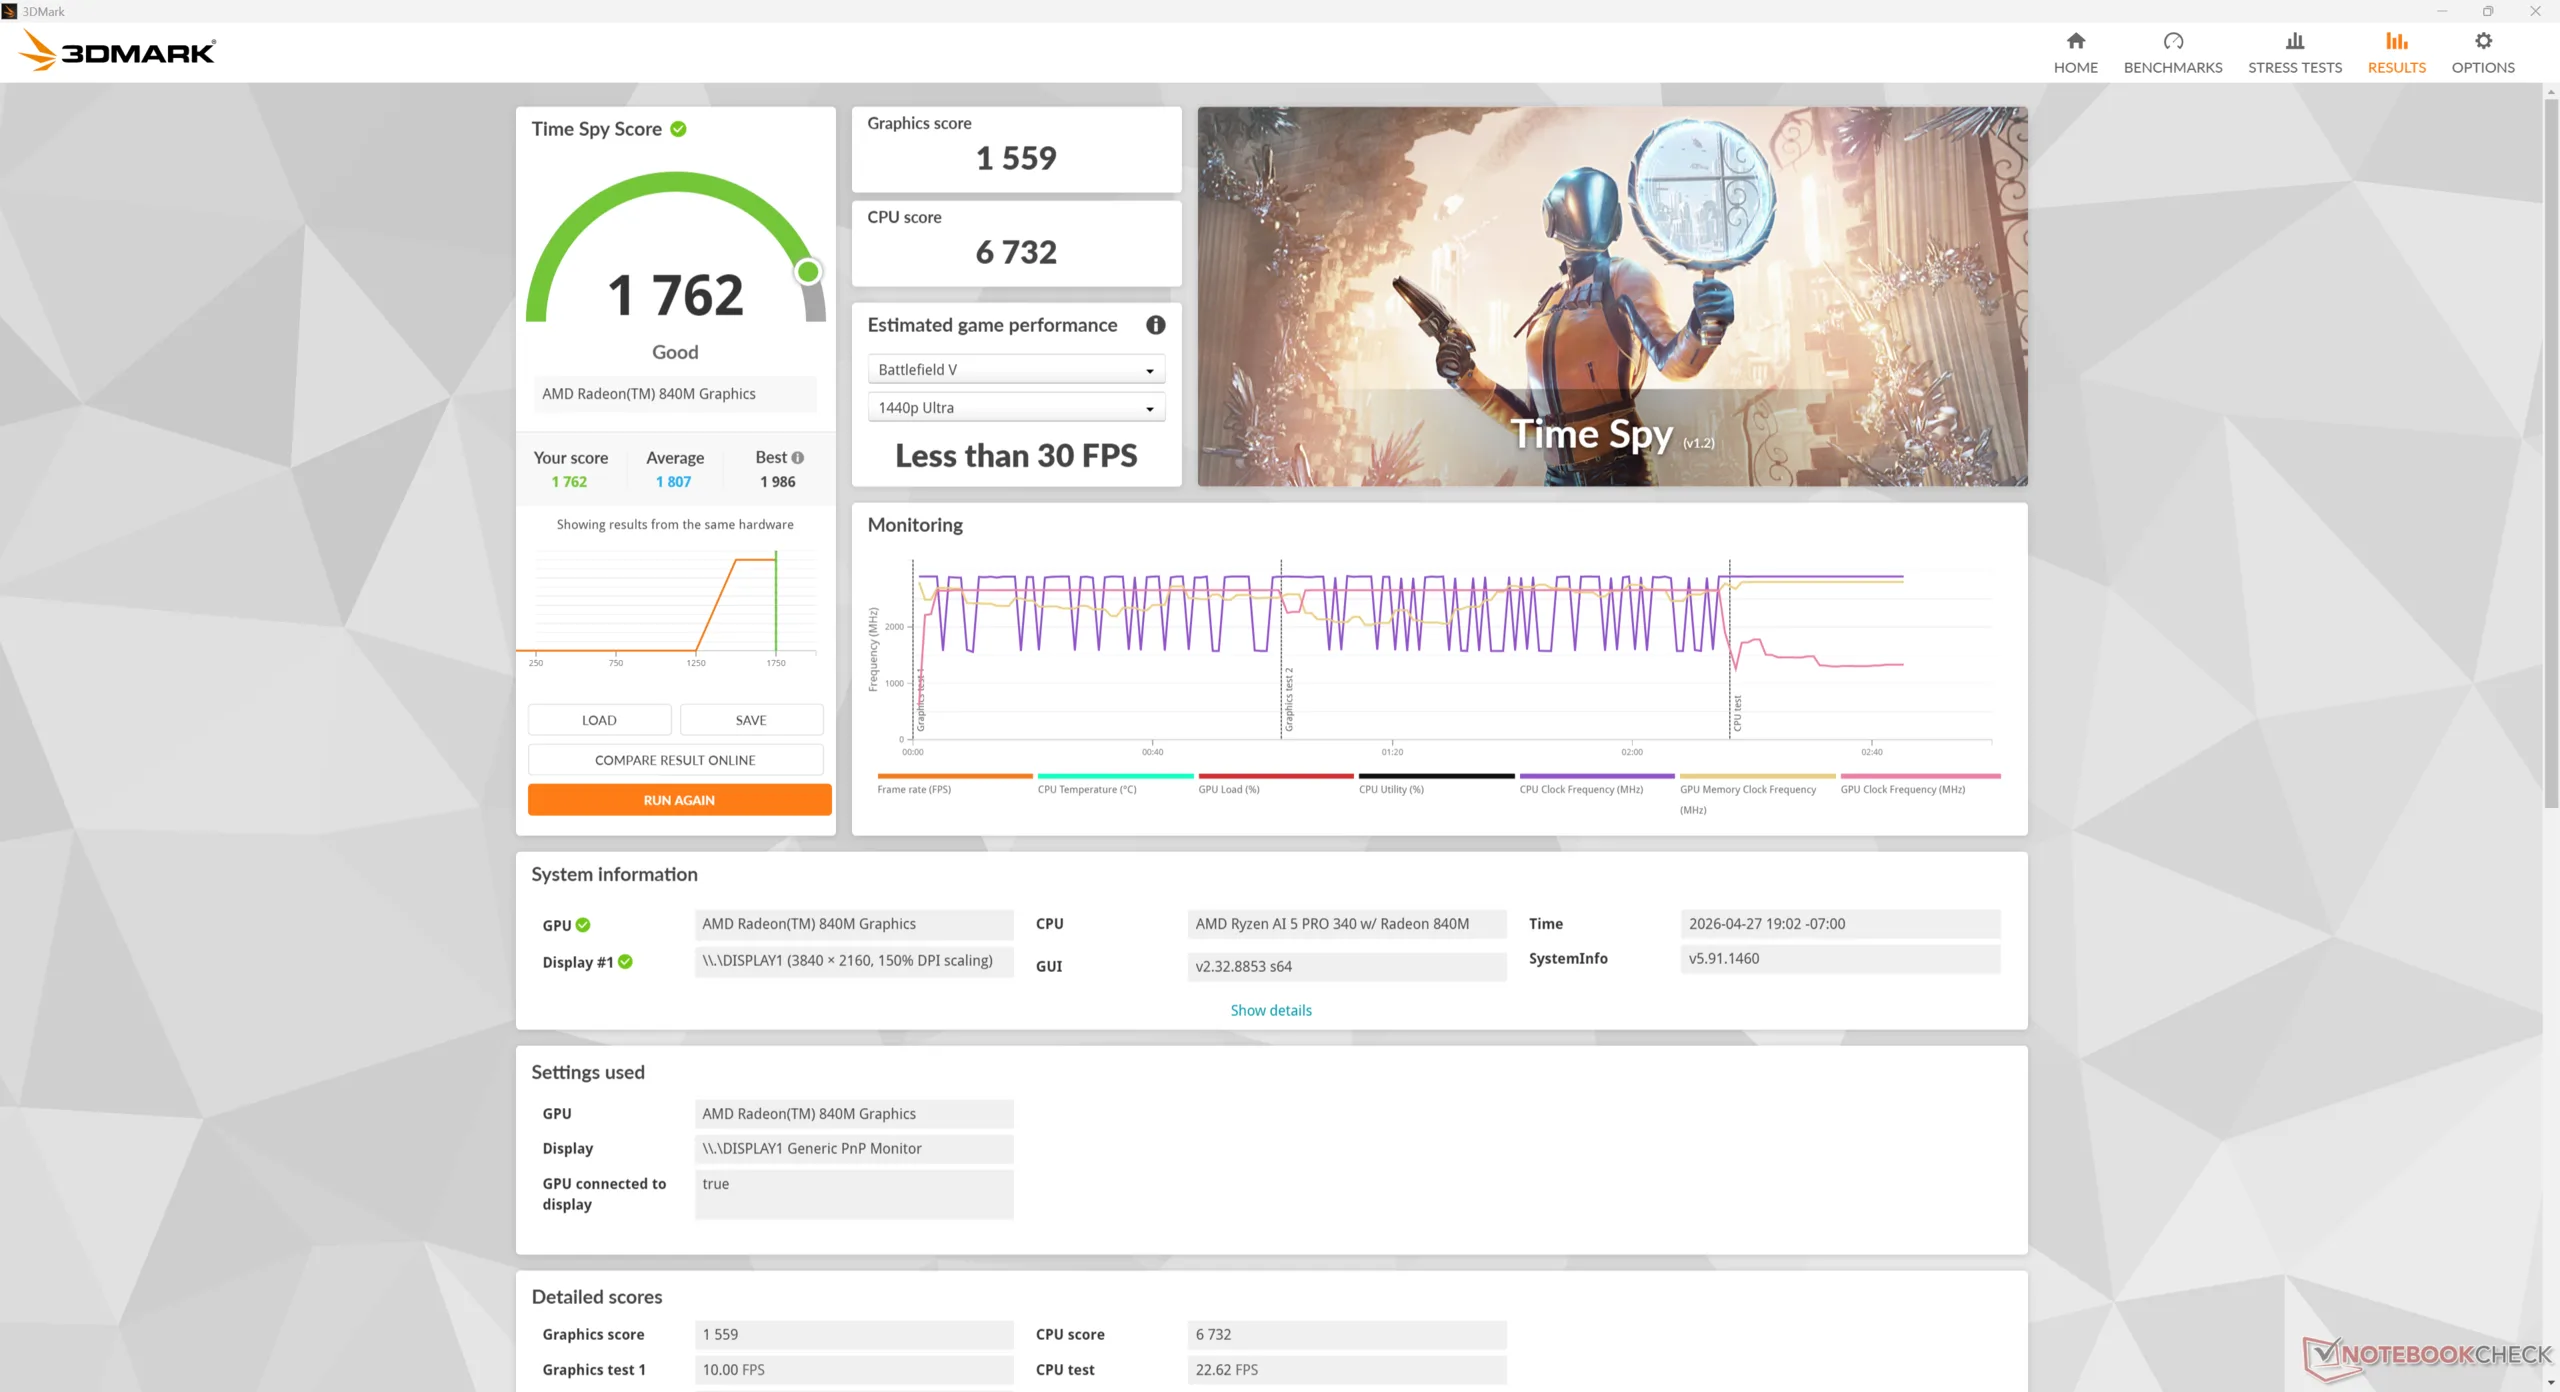
集成 Radeon 840M与老化的 Iris Xe 96EUs不相上下。升级到 Ryzen AI 7 PRO 350 时 Radeon 860MSKU 也能将图形性能提高 70%,但整体性能仍然无法满足大多数 GPU 密集型任务的需求。遗憾的是,惠普没有提供支持游戏的 Radeon 880M或 890M。
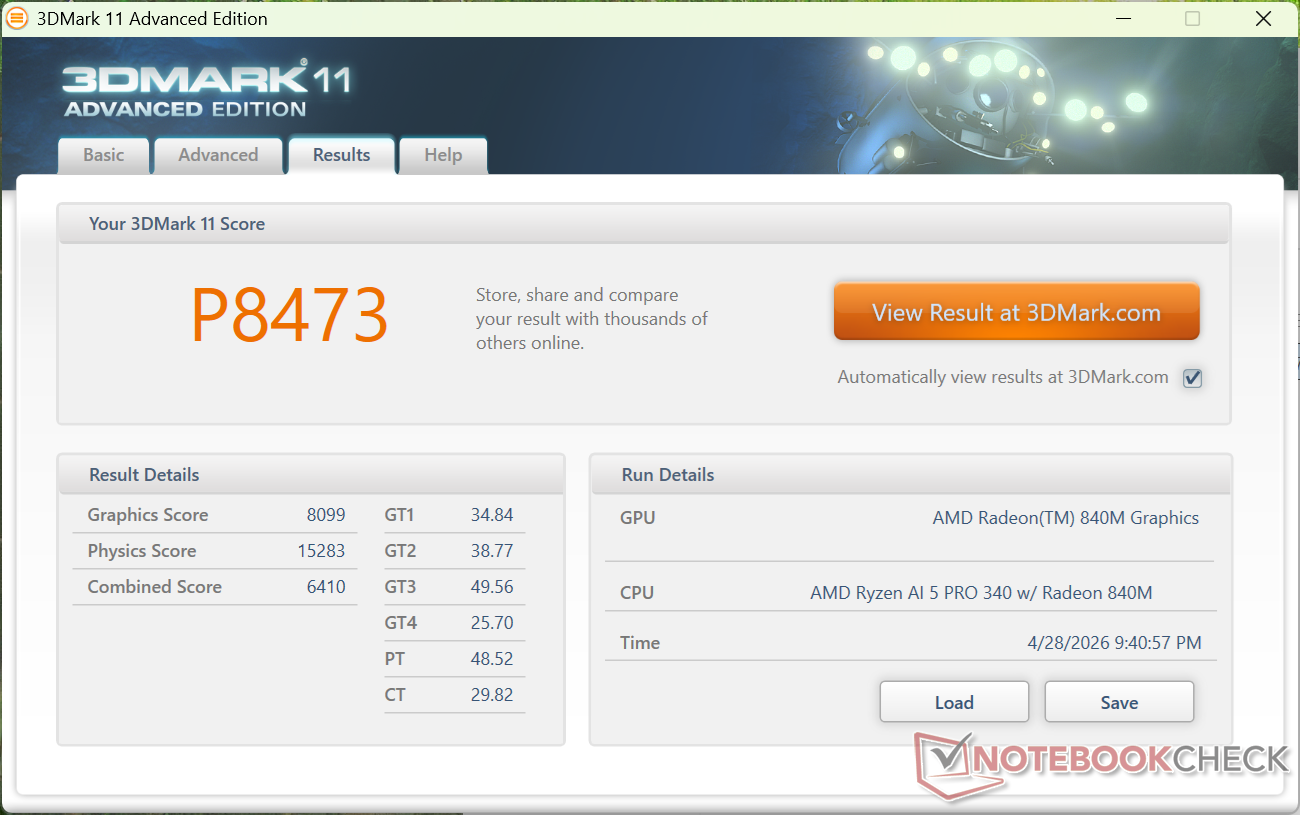
| 3DMark 11 Performance | 8473 points | |
| 3DMark Cloud Gate Standard Score | 25064 points | |
| 3DMark Fire Strike Score | 4968 points | |
| 3DMark Time Spy Score | 1762 points | |
Help | ||
* ... smaller is better
| Performance rating - Percent | |
| Asus NUC 15 Pro+ | |
| MSI Cubi NUC AI+ 2MG | |
| GMK NucBox K13 | |
| HP EliteBoard G1a AI | |
| Geekom A5 Pro -2! | |
| HP Pro Mini 400 G9-937U0EA -3! | |
| Cyberpunk 2077 - 1920x1080 Ultra Preset (FSR off) | |
| Asus NUC 15 Pro+ | |
| GMK NucBox K13 | |
| MSI Cubi NUC AI+ 2MG | |
| HP EliteBoard G1a AI | |
| Geekom A5 Pro | |
| HP Pro Mini 400 G9-937U0EA | |
| Baldur's Gate 3 - 1920x1080 Ultra Preset AA:T | |
| MSI Cubi NUC AI+ 2MG | |
| Asus NUC 15 Pro+ | |
| GMK NucBox K13 | |
| HP EliteBoard G1a AI | |
| GTA V - 1920x1080 Highest AA:4xMSAA + FX AF:16x | |
| MSI Cubi NUC AI+ 2MG | |
| GMK NucBox K13 | |
| HP EliteBoard G1a AI | |
| Asus NUC 15 Pro+ | |
| Geekom A5 Pro | |
| Final Fantasy XV Benchmark - 1920x1080 High Quality | |
| Asus NUC 15 Pro+ | |
| MSI Cubi NUC AI+ 2MG | |
| GMK NucBox K13 | |
| HP EliteBoard G1a AI | |
| Geekom A5 Pro | |
| HP Pro Mini 400 G9-937U0EA | |
| Strange Brigade - 1920x1080 ultra AA:ultra AF:16 | |
| MSI Cubi NUC AI+ 2MG | |
| Asus NUC 15 Pro+ | |
| GMK NucBox K13 | |
| HP EliteBoard G1a AI | |
| Dota 2 Reborn - 1920x1080 ultra (3/3) best looking | |
| Asus NUC 15 Pro+ | |
| GMK NucBox K13 | |
| HP EliteBoard G1a AI | |
| MSI Cubi NUC AI+ 2MG | |
| Geekom A5 Pro | |
| HP Pro Mini 400 G9-937U0EA | |
| X-Plane 11.11 - 1920x1080 high (fps_test=3) | |
| Asus NUC 15 Pro+ | |
| HP EliteBoard G1a AI | |
| MSI Cubi NUC AI+ 2MG | |
| Geekom A5 Pro | |
| GMK NucBox K13 | |
| HP Pro Mini 400 G9-937U0EA | |
赛博朋克 2077》超 FPS 图表
| low | med. | high | ultra | |
|---|---|---|---|---|
| GTA V (2015) | 164.1 | 115.1 | 52.4 | 22.7 |
| Dota 2 Reborn (2015) | 160.6 | 127.2 | 80.1 | 67.7 |
| Final Fantasy XV Benchmark (2018) | 57.3 | 27 | 20.4 | |
| X-Plane 11.11 (2018) | 63.1 | 46.7 | 39.1 | |
| Strange Brigade (2018) | 128.8 | 48.1 | 40.1 | 34.5 |
| Baldur's Gate 3 (2023) | 22.7 | 18.7 | 14.3 | 14.3 |
| Cyberpunk 2077 (2023) | 26.3 | 19.7 | 15.8 | 12.6 |
| F1 24 (2024) | 48.4 | 45 | 32.4 | 6.83 |
排放量
系统噪音
风扇噪音通常更明显,因为用户坐在离键盘更近的地方,而不是台式机或迷你 PC。如果运行要求很高的负载,EliteBoard 在类似条件下的噪音可能不亚于某些笔记本电脑。除此之外,风扇的噪音并不明显,在浏览网页或闲置时也不会出现严重的脉动问题。
Noise level
| Idle |
| 24.1 / 24.1 / 25.8 dB(A) |
| Load |
| 40.5 / 45.2 dB(A) |
 | ||
30 dB silent 40 dB(A) audible 50 dB(A) loud |
||
min: | ||
| HP EliteBoard G1a AI Ryzen AI 5 340, Radeon 840M | Geekom A5 Pro R5 7530U, Vega 7 | GMK NucBox K13 Core Ultra 7 256V, Arc 140V | Asus NUC 15 Pro+ Ultra 9 285H, Arc 140T | MSI Cubi NUC AI+ 2MG Core Ultra 7 258V, Arc 140V | HP Pro Mini 400 G9-937U0EA i5-14500T, UHD Graphics 770 | |
|---|---|---|---|---|---|---|
| Noise | 6% | -1% | -14% | -15% | 2% | |
| off / environment * (dB) | 23.6 | 25 -6% | 23.3 1% | 25.3 -7% | 24.8 -5% | 24.8 -5% |
| Idle Minimum * (dB) | 24.1 | 26.6 -10% | 24.5 -2% | 25.4 -5% | 28 -16% | 26.9 -12% |
| Idle Average * (dB) | 24.1 | 26.6 -10% | 25 -4% | 25.5 -6% | 36.1 -50% | 26.9 -12% |
| Idle Maximum * (dB) | 25.8 | 26.7 -3% | 25.1 3% | 37.3 -45% | 36.1 -40% | 26.9 -4% |
| Load Average * (dB) | 40.5 | 33.5 17% | 40.1 1% | 44.4 -10% | 38.9 4% | 32.5 20% |
| Cyberpunk 2077 ultra * (dB) | 42.2 | 31.2 26% | 44.2 -5% | 46.2 -9% | 37 12% | 37.2 12% |
| Load Maximum * (dB) | 45.2 | 33.8 25% | 45.1 -0% | 52.7 -17% | 49.2 -9% | 37.2 18% |
| Witcher 3 ultra * (dB) | 31.2 | 47.7 |
* ... smaller is better
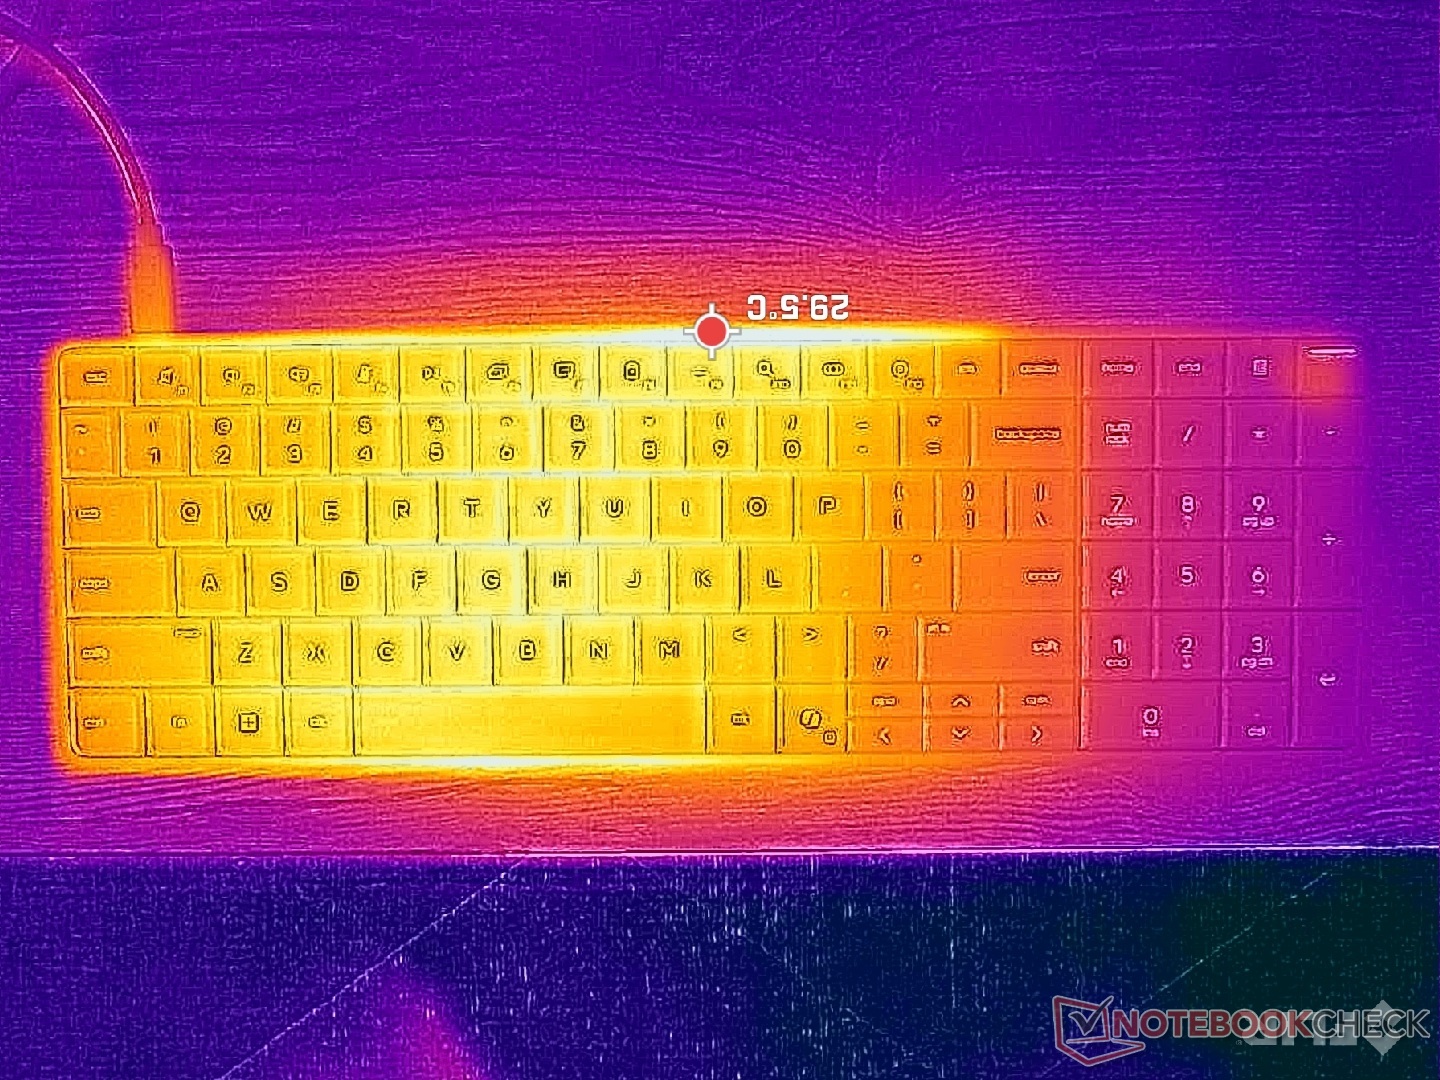
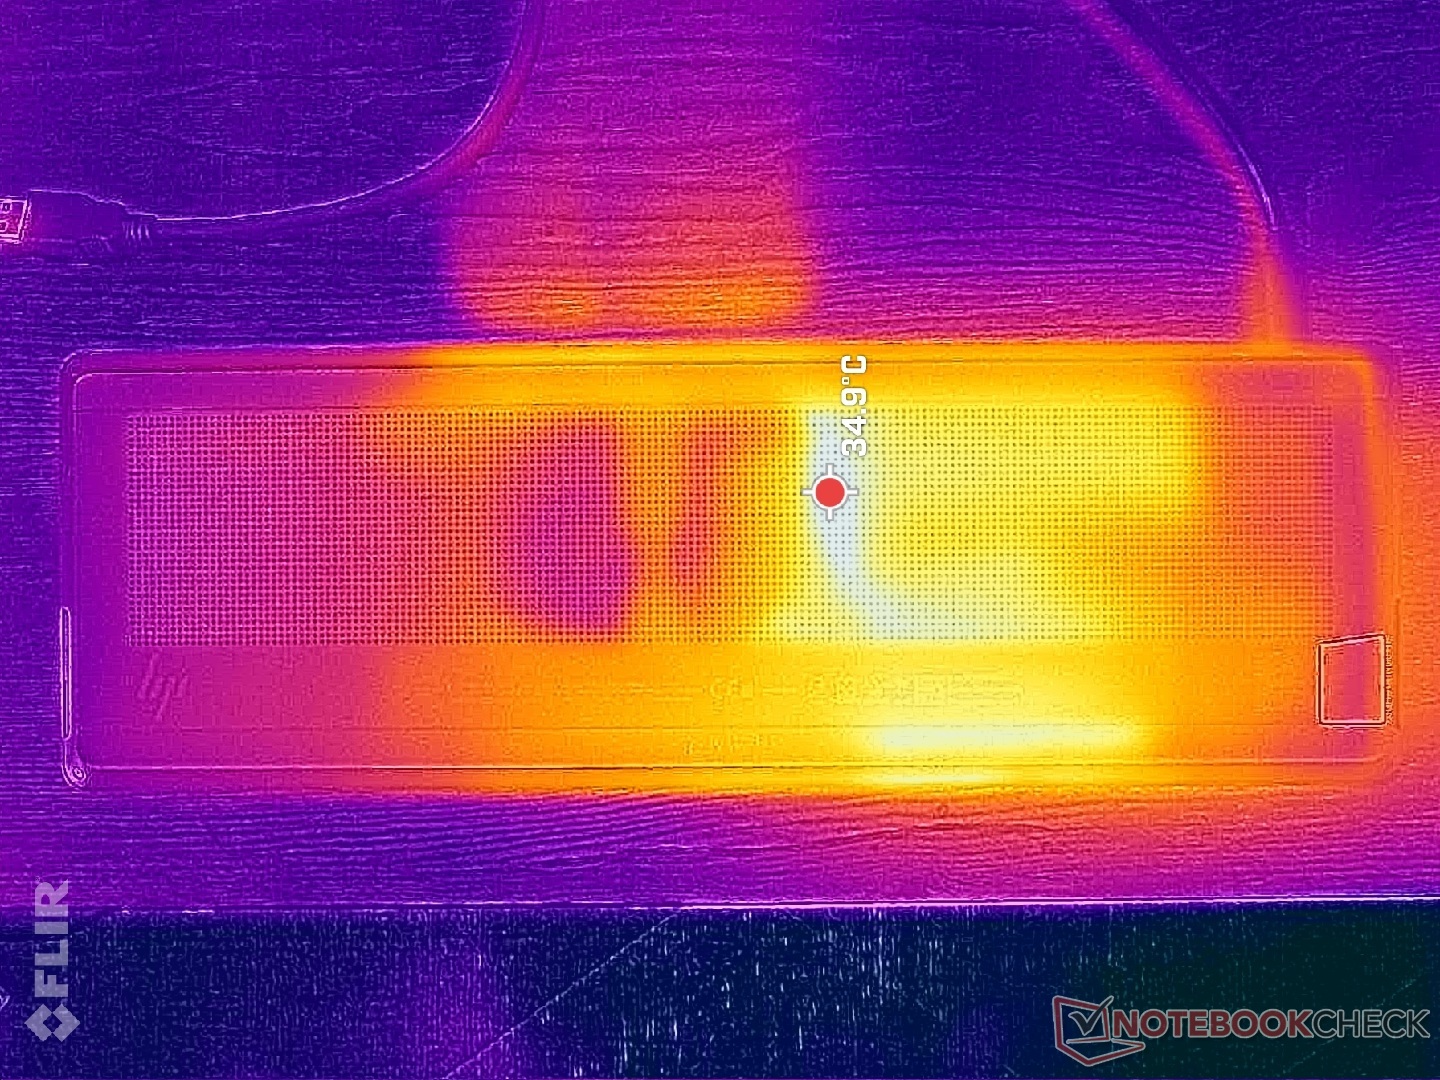
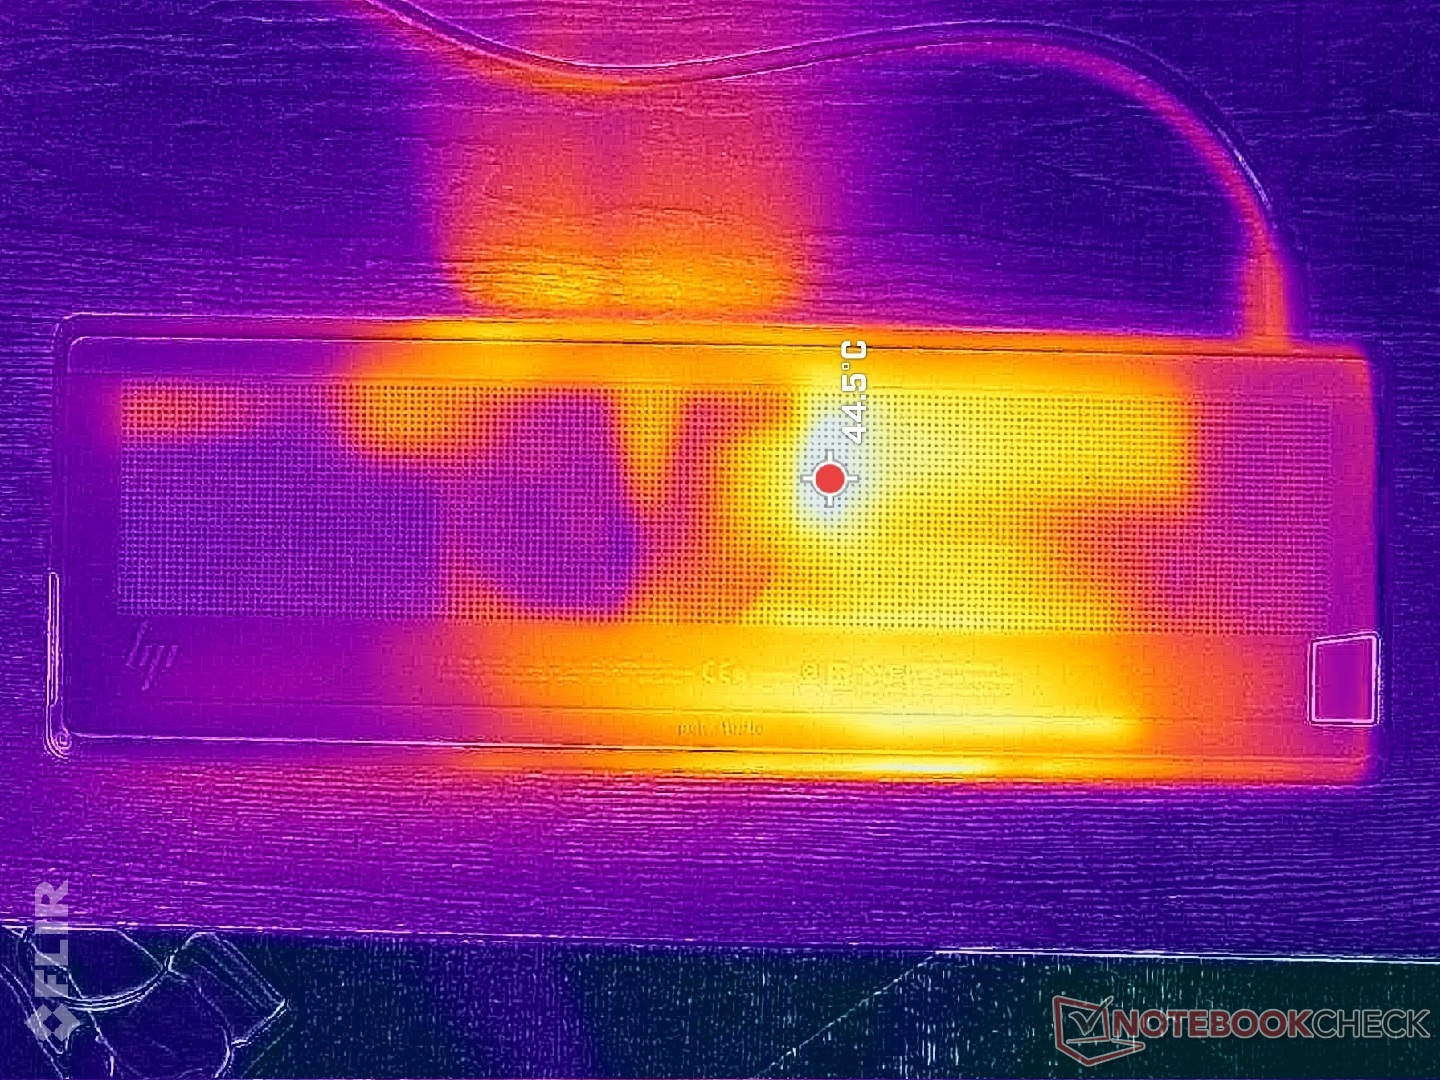
温度
当长时间运行高负荷负载时,键盘中心的发热点可能会达到 39 摄氏度以上,底部可能会达到 43 摄氏度以上。虽然键入时发热很明显,但我们从未发现键盘发热让人不舒服,因为在正常使用过程中,指尖与键盘的接触极少。
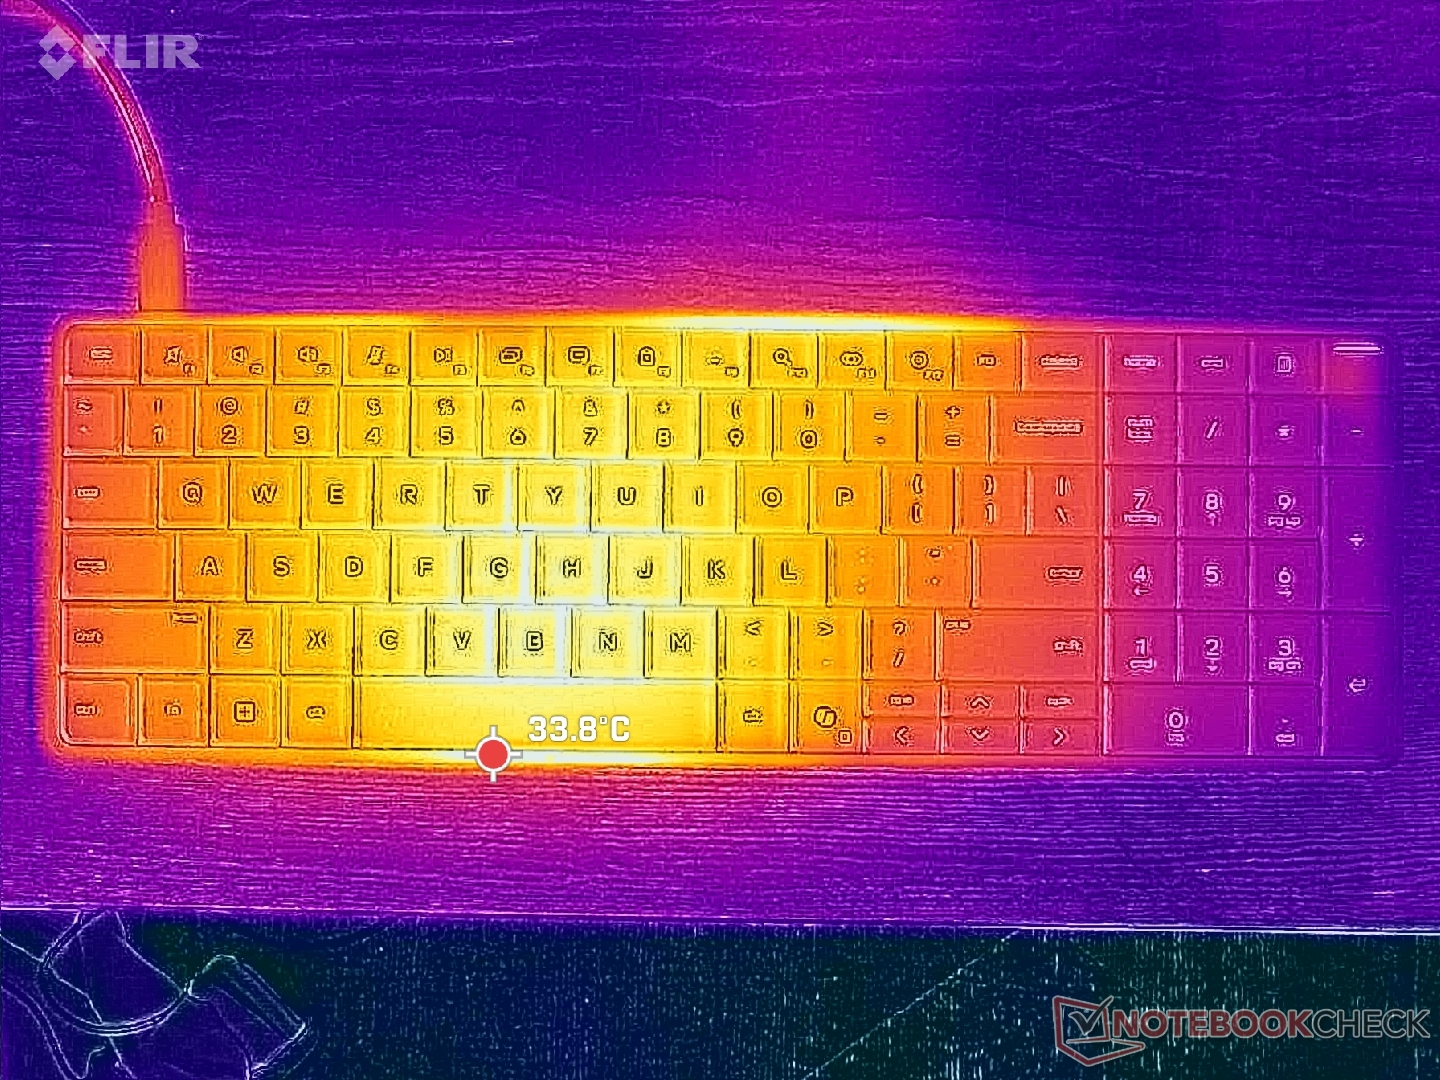
(+) The maximum temperature on the upper side is 38.4 °C / 101 F, compared to the average of 35.4 °C / 96 F, ranging from 20.6 to 69.5 °C for the class Mini PC.
(±) The bottom heats up to a maximum of 42.6 °C / 109 F, compared to the average of 36.1 °C / 97 F
(+) In idle usage, the average temperature for the upper side is 30.4 °C / 87 F, compared to the device average of 32.1 °C / 90 F.
| HP EliteBoard G1a AI Ryzen AI 5 340, Radeon 840M | Geekom A5 Pro R5 7530U, Vega 7 | GMK NucBox K13 Core Ultra 7 256V, Arc 140V | Asus NUC 15 Pro+ Ultra 9 285H, Arc 140T | MSI Cubi NUC AI+ 2MG Core Ultra 7 258V, Arc 140V | HP Pro Mini 400 G9-937U0EA i5-14500T, UHD Graphics 770 | |
|---|---|---|---|---|---|---|
| Heat | 16% | 7% | 4% | 26% | 11% | |
| Maximum Upper Side * (°C) | 38.4 | 36.7 4% | 31.6 18% | 42.2 -10% | 30.8 20% | 35.7 7% |
| Maximum Bottom * (°C) | 42.6 | 40.5 5% | 50.6 -19% | 31.3 27% | 26.4 38% | 39.6 7% |
| Idle Upper Side * (°C) | 32.4 | 23.1 29% | 27 17% | 34.9 -8% | 26.4 19% | 28.6 12% |
| Idle Bottom * (°C) | 34.6 | 25.1 27% | 31.2 10% | 32.2 7% | 25.4 27% | 29 16% |
* ... smaller is better
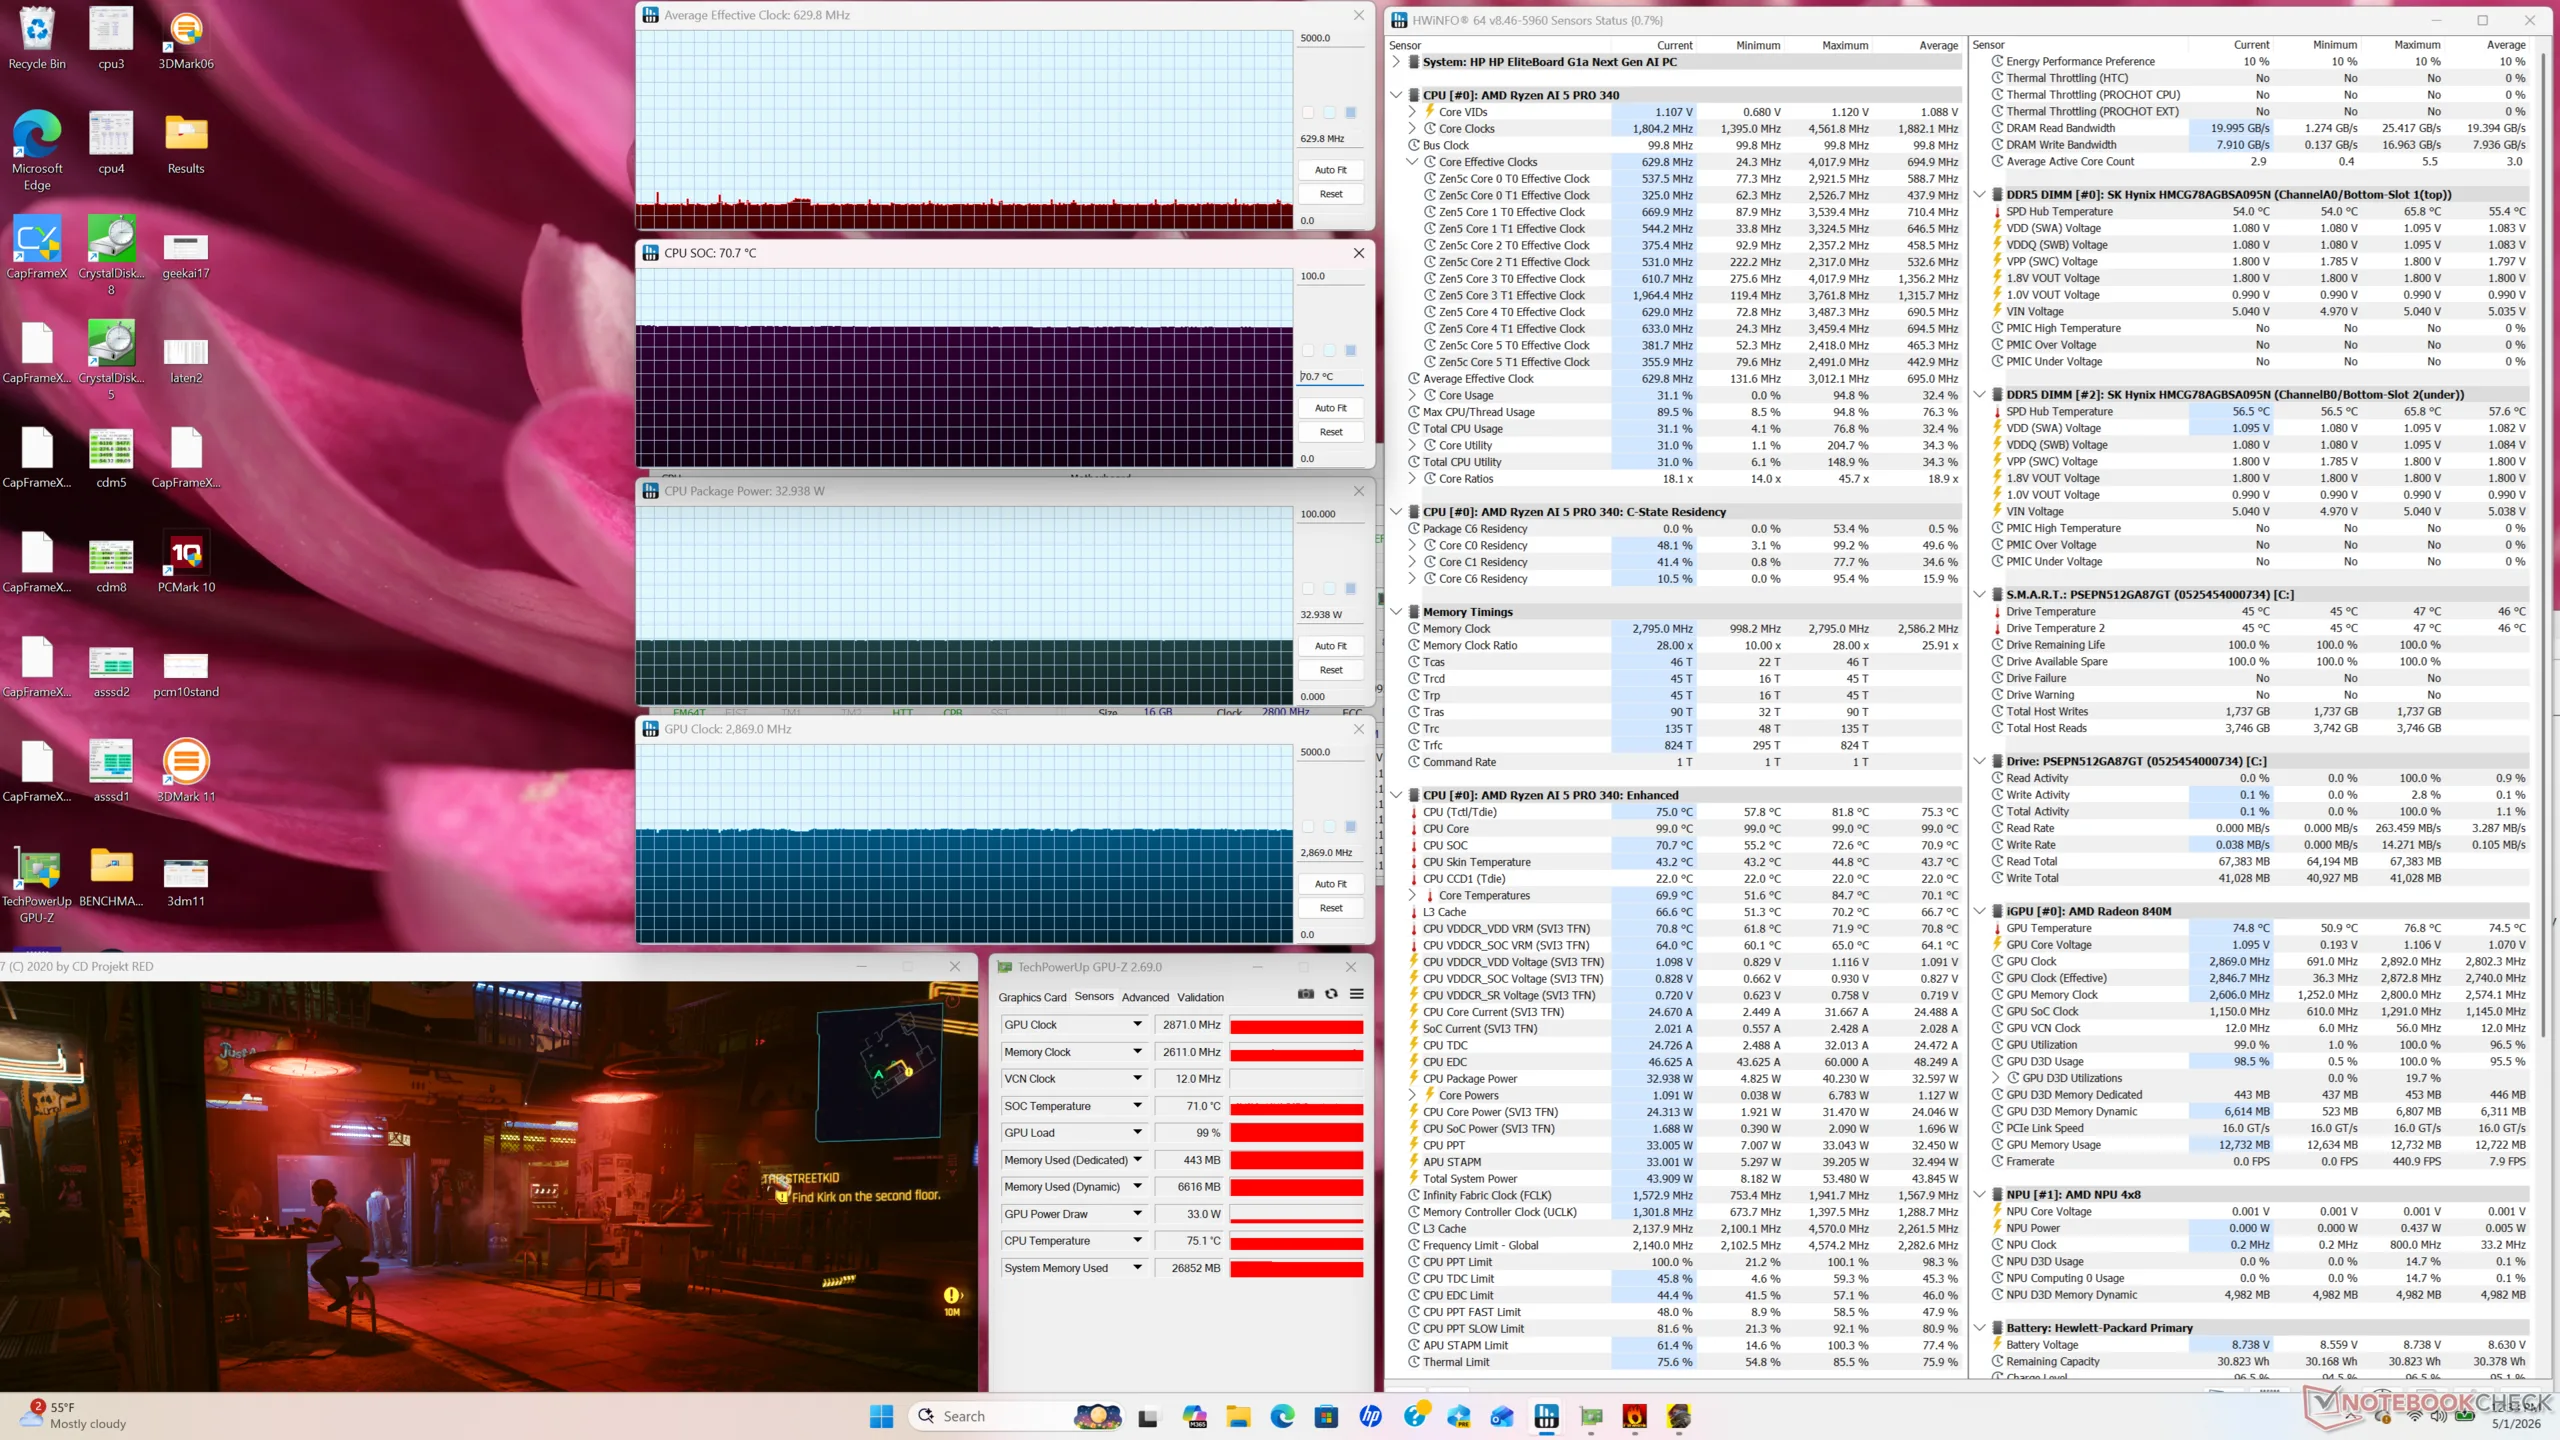
压力测试
CPU 的主频将提升至 3.7 GHz,功耗为 54 W,然后迅速降至 3.3 GHz,功耗为 33 W,核心温度稳定在 72 C。在运行苛刻负载时,70 摄氏度左右的温度即使不比大多数超极本稍低,也很典型。
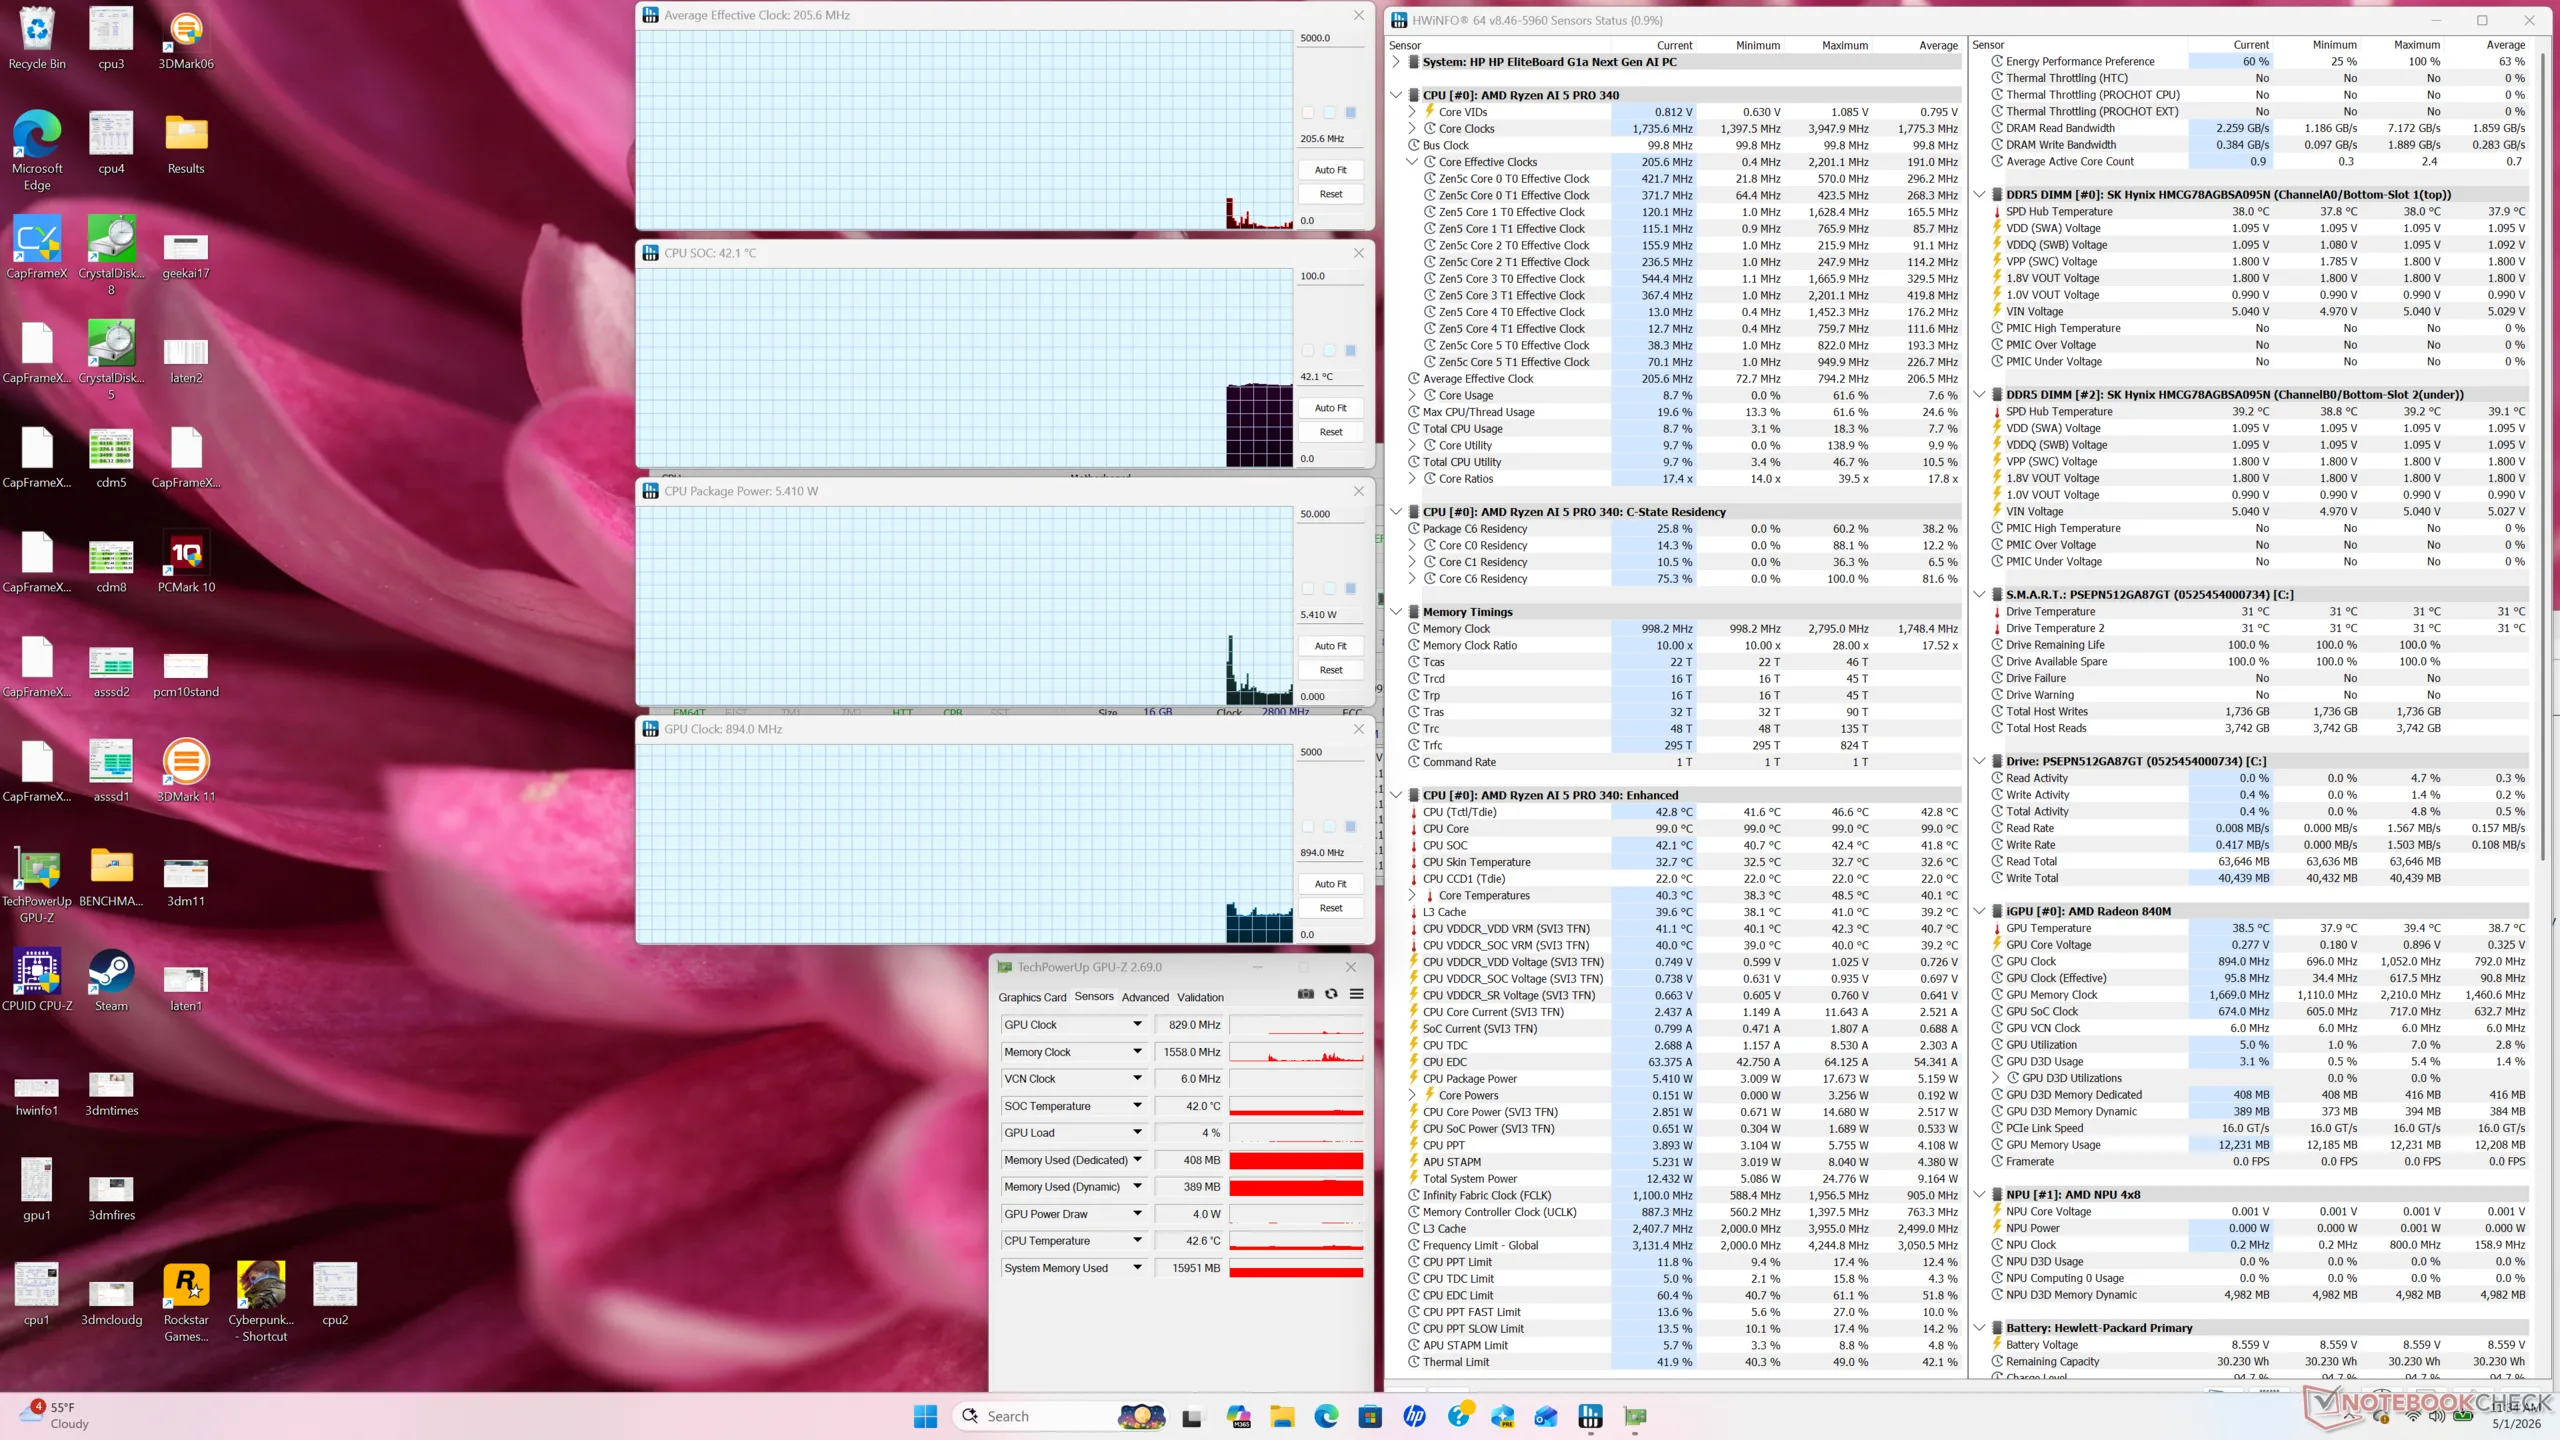
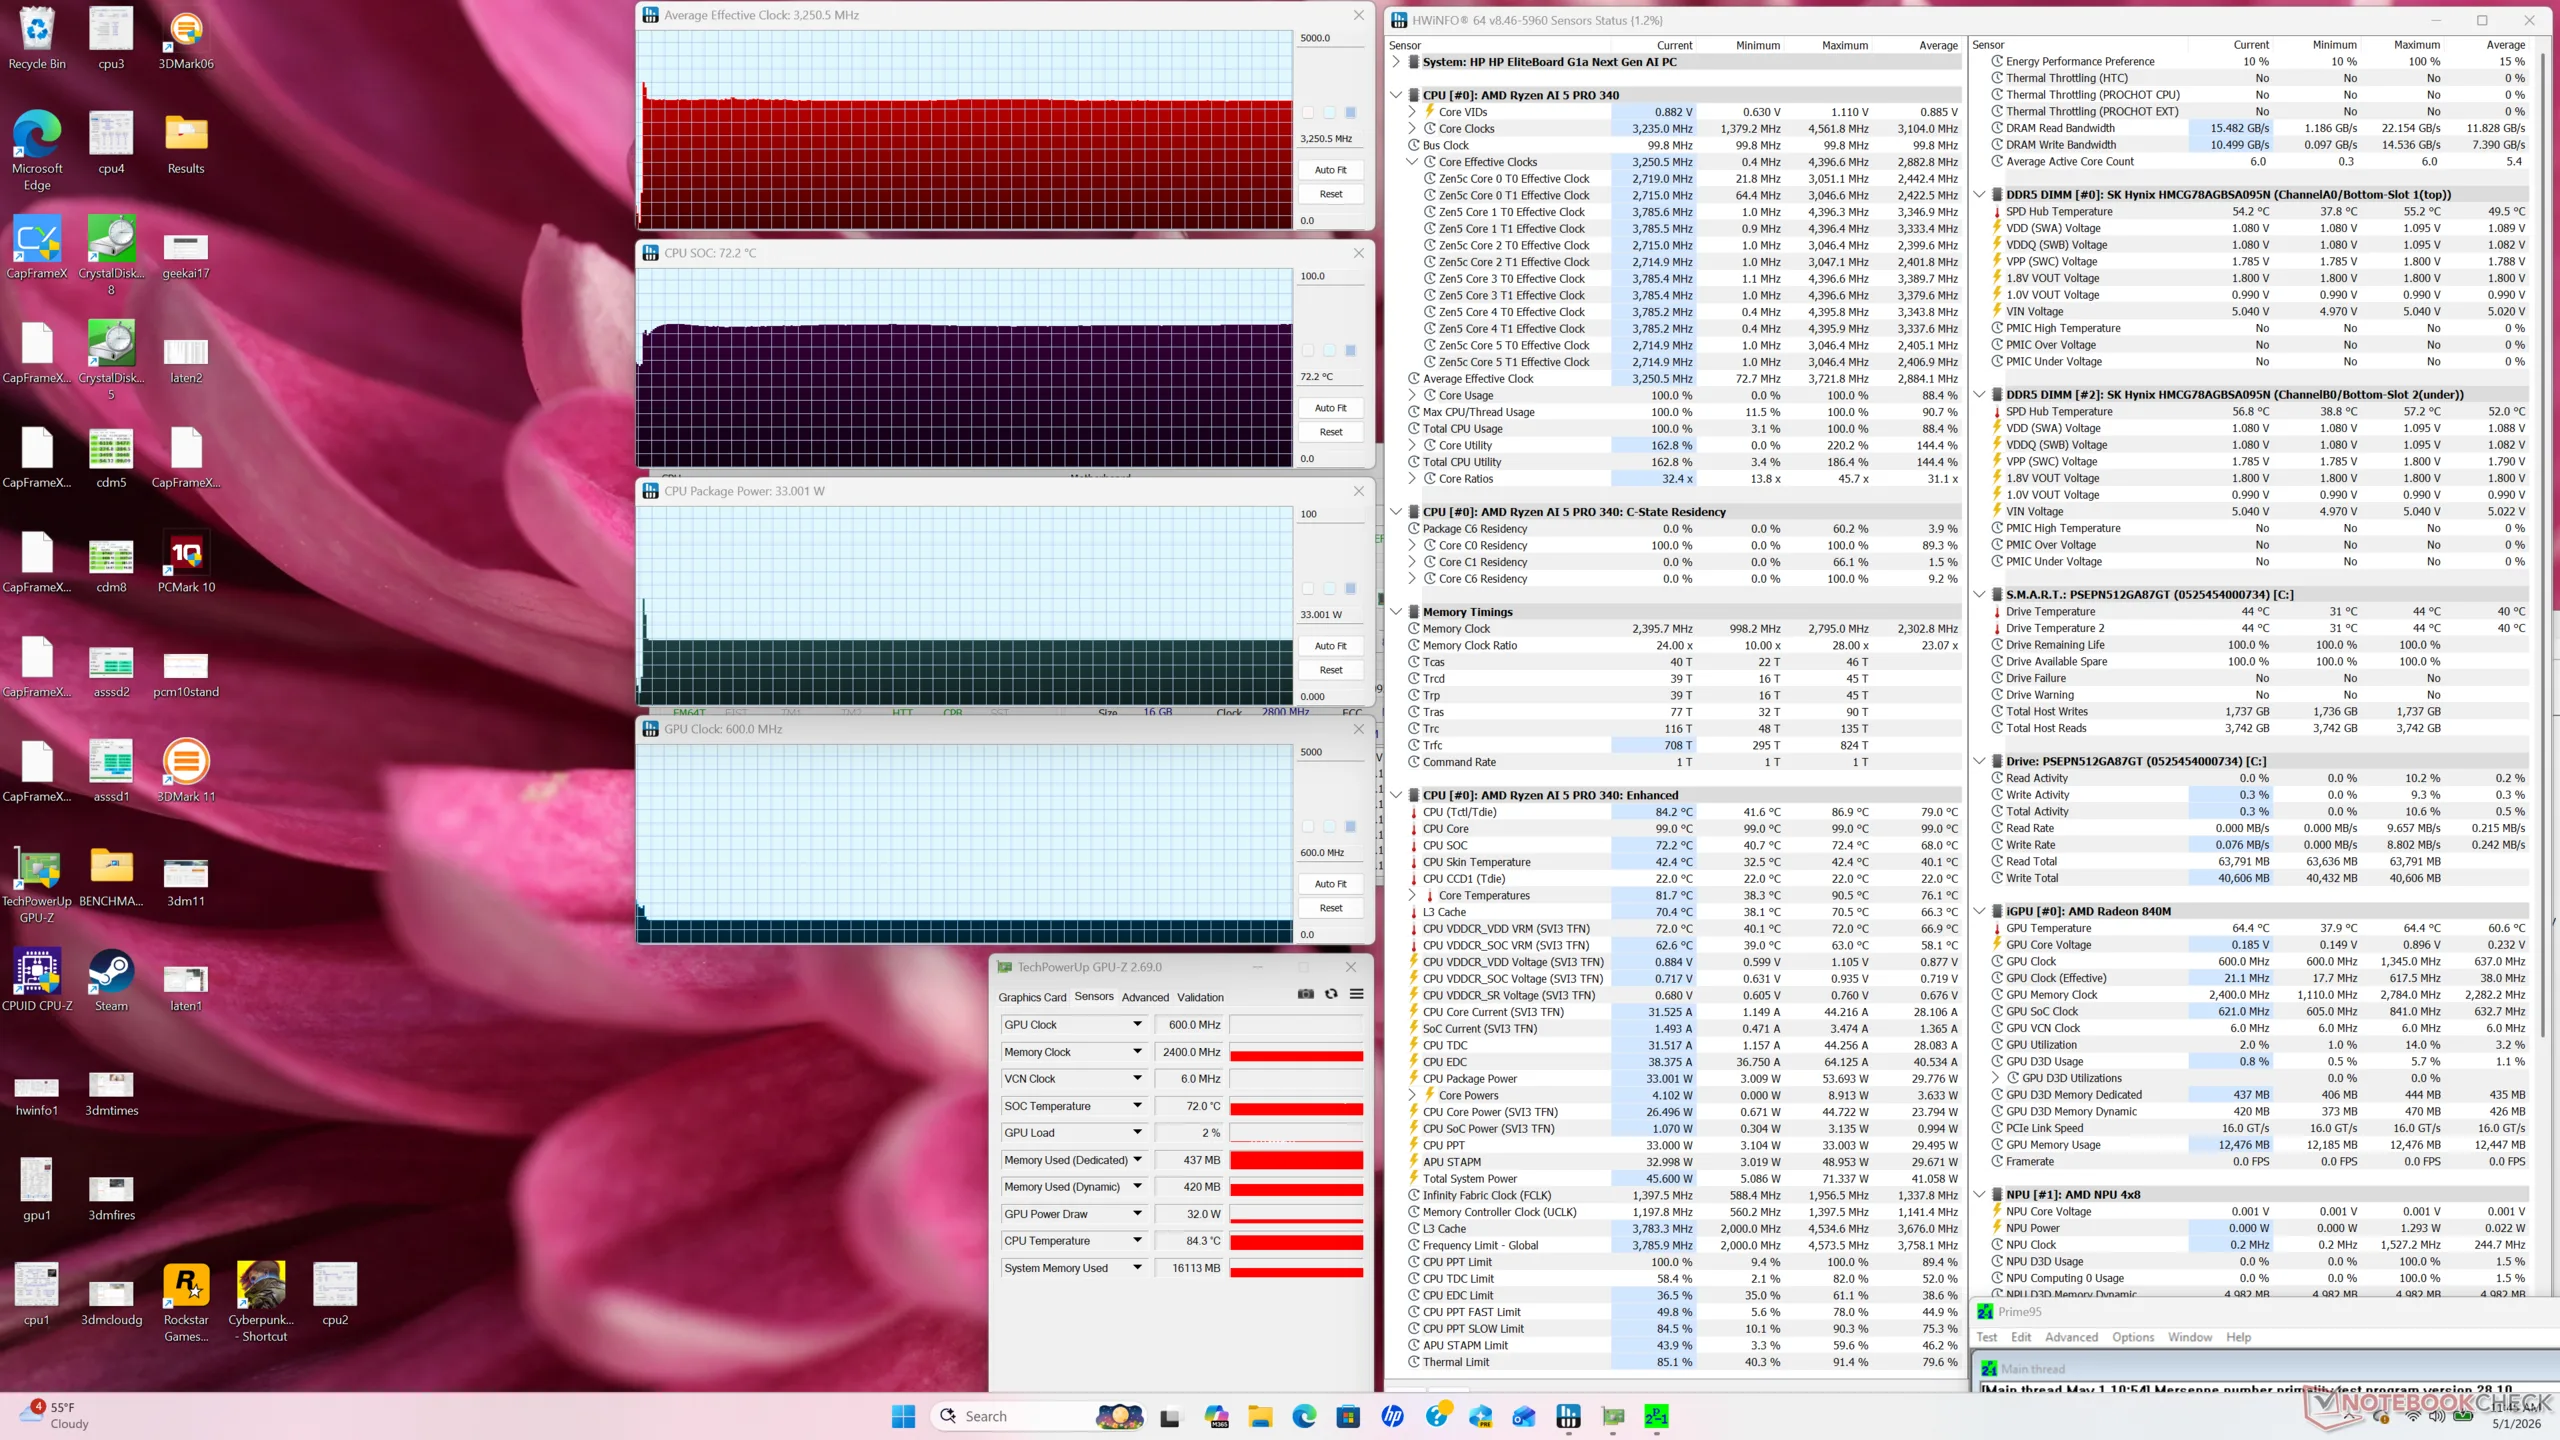
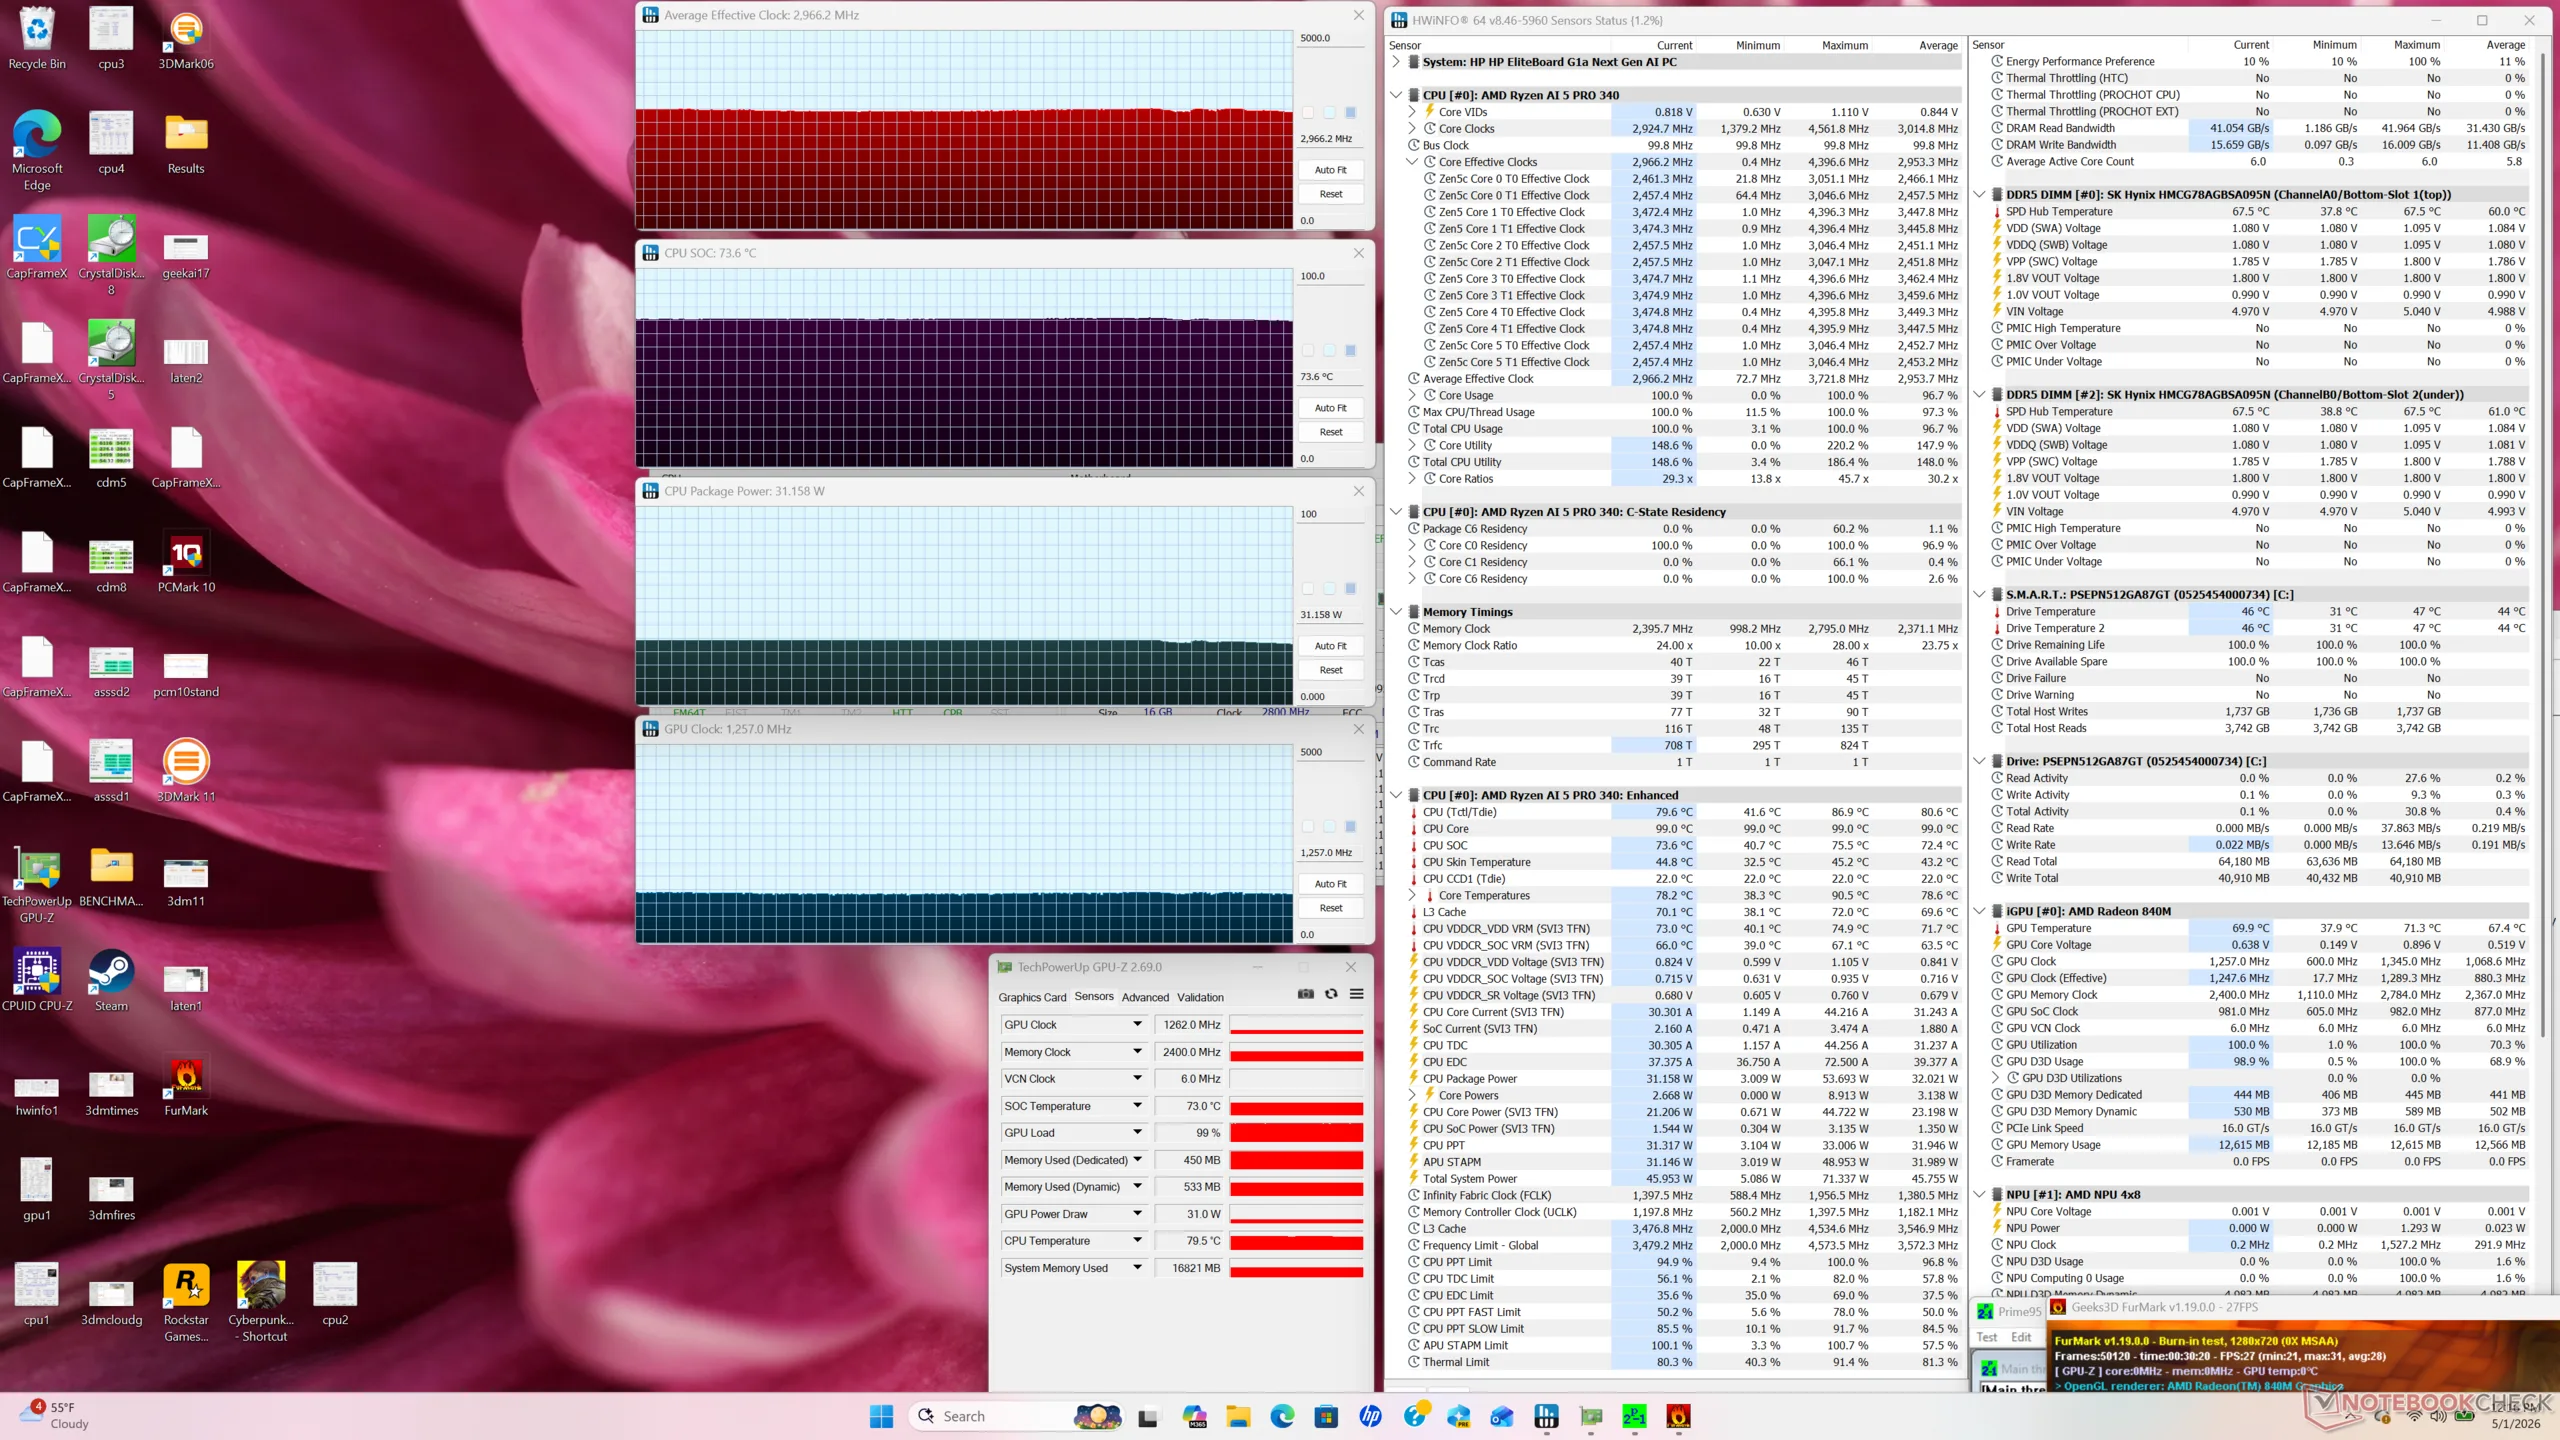
| CPU 平均时钟 (GHz) | GPU 时钟 (MHz) | CPU 平均温度 (°C) | |
| 系统闲置 | -- | 696 | 42 |
| Prime95 压力 | 3.3 | -- | 72 |
| Prime95 + FurMark Stress | 3.0 | 1257 | 74 |
| 赛博朋克 2077》压力 | 0.6 | 2869 | 71 |
发言人
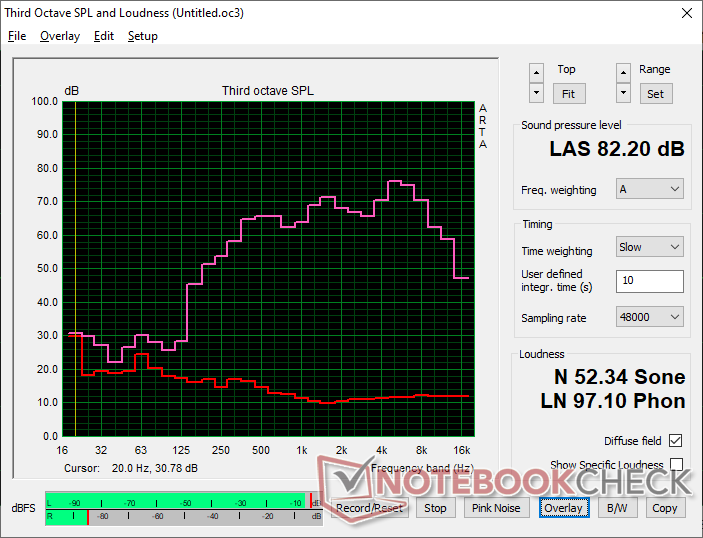
HP EliteBoard G1a AI audio analysis
(+) | speakers can play relatively loud (82.2 dB)
Bass 100 - 315 Hz
(-) | nearly no bass - on average 21% lower than median
(±) | linearity of bass is average (11% delta to prev. frequency)
Mids 400 - 2000 Hz
(+) | balanced mids - only 2.4% away from median
(+) | mids are linear (5.4% delta to prev. frequency)
Highs 2 - 16 kHz
(±) | higher highs - on average 5.5% higher than median
(±) | linearity of highs is average (7.2% delta to prev. frequency)
Overall 100 - 16.000 Hz
(±) | linearity of overall sound is average (17.9% difference to median)
Compared to same class
» 21% of all tested devices in this class were better, 7% similar, 71% worse
» The best had a delta of 13%, average was 24%, worst was 64%
Compared to all devices tested
» 37% of all tested devices were better, 8% similar, 55% worse
» The best had a delta of 4%, average was 24%, worst was 134%
Apple MacBook Pro 16 2021 M1 Pro audio analysis
(+) | speakers can play relatively loud (84.7 dB)
Bass 100 - 315 Hz
(+) | good bass - only 3.8% away from median
(+) | bass is linear (5.2% delta to prev. frequency)
Mids 400 - 2000 Hz
(+) | balanced mids - only 1.3% away from median
(+) | mids are linear (2.1% delta to prev. frequency)
Highs 2 - 16 kHz
(+) | balanced highs - only 1.9% away from median
(+) | highs are linear (2.7% delta to prev. frequency)
Overall 100 - 16.000 Hz
(+) | overall sound is linear (4.6% difference to median)
Compared to same class
» 0% of all tested devices in this class were better, 0% similar, 100% worse
» The best had a delta of 5%, average was 17%, worst was 45%
Compared to all devices tested
» 0% of all tested devices were better, 0% similar, 100% worse
» The best had a delta of 4%, average was 24%, worst was 134%
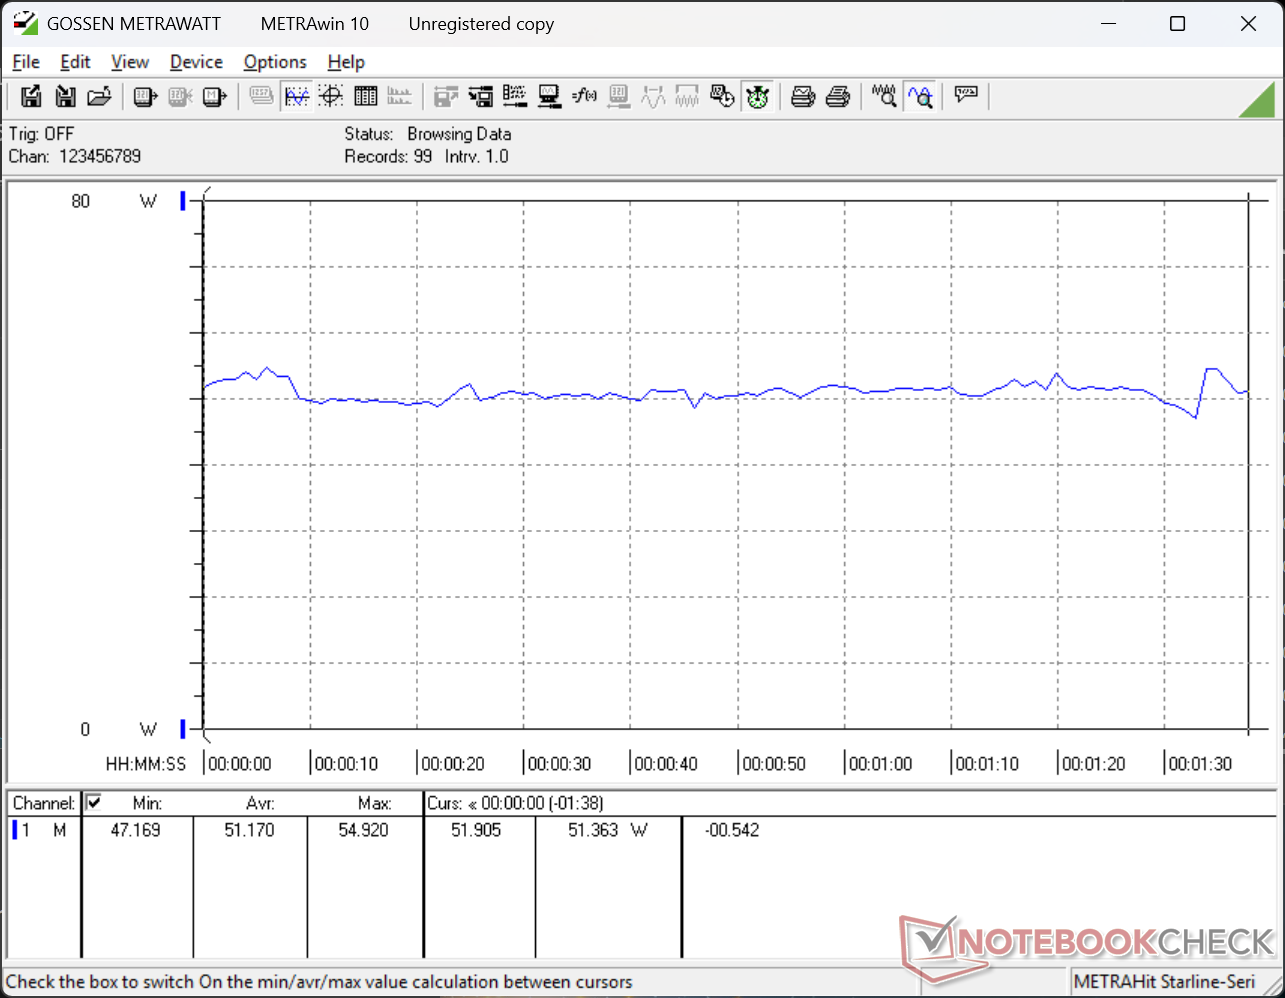
能源管理
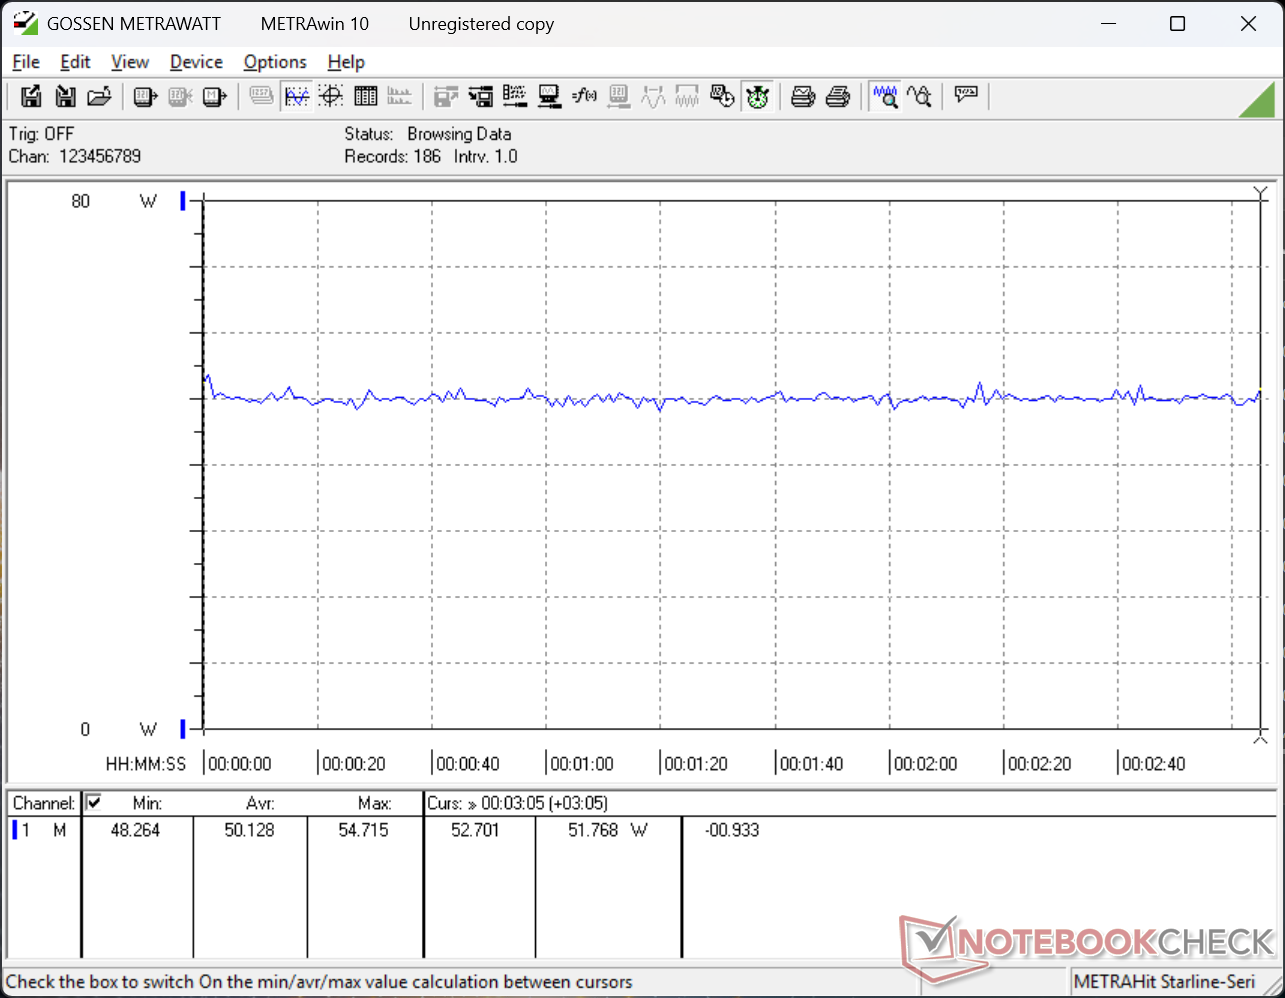
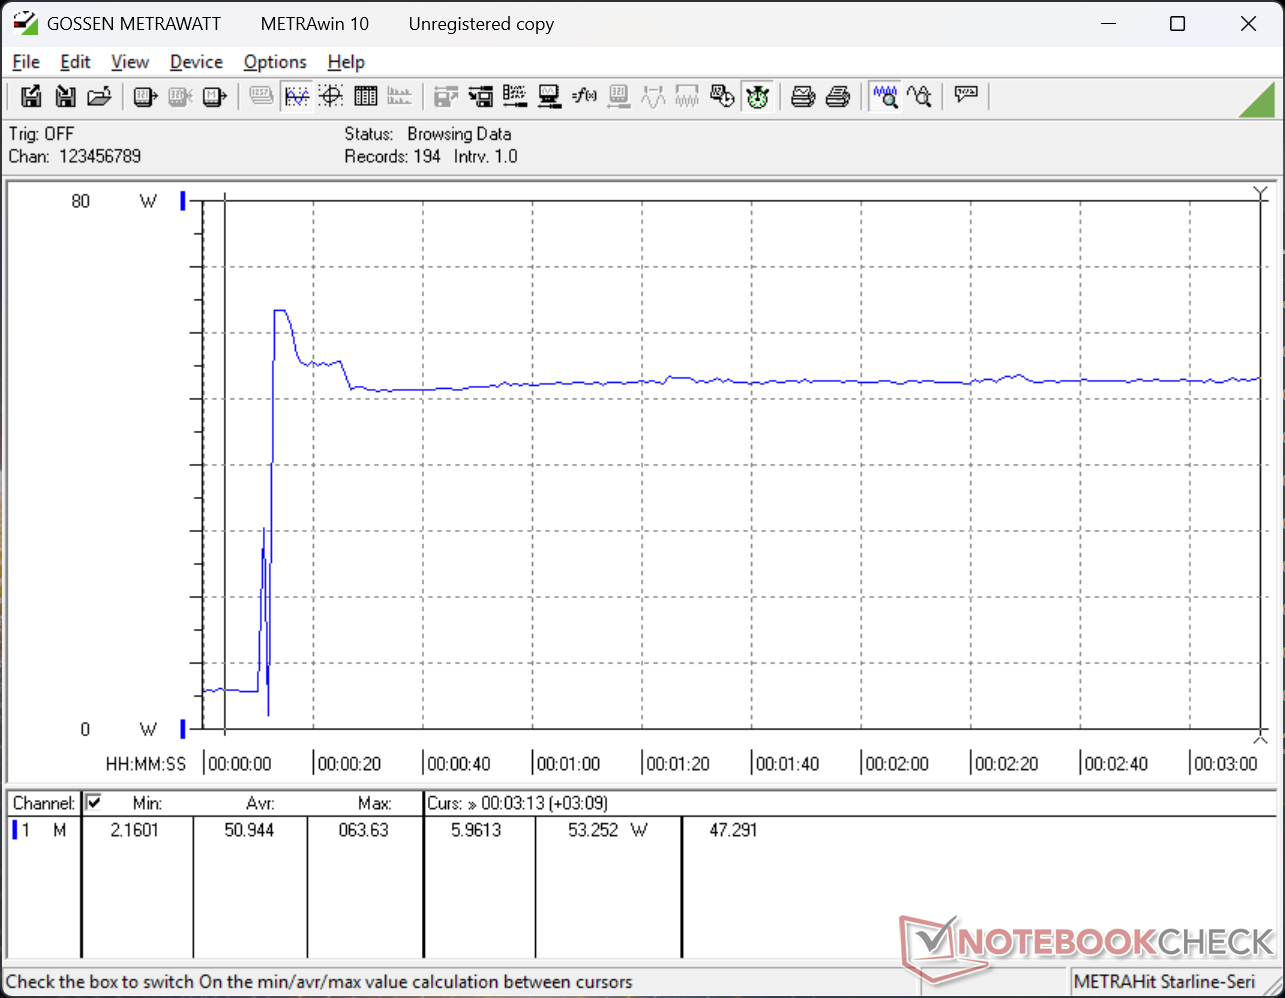
耗电量
与 NucBox K13 等 Lunar Lake 迷你电脑相比,在负载情况下的功耗可高达 50 W 以上。不过,在简单浏览网页或闲置时,低功耗更为常见。
| Off / Standby | |
| Idle | |
| Load |
|
Key:
min: | |
| HP EliteBoard G1a AI Ryzen AI 5 340, Radeon 840M, , , x, | Geekom A5 Pro R5 7530U, Vega 7, Wodposit WPBSN4M8-1TGP, , x, | GMK NucBox K13 Core Ultra 7 256V, Arc 140V, Huawei eKitStor Xtreme 200e 1 TB, , x, | Asus NUC 15 Pro+ Ultra 9 285H, Arc 140T, Micron 3500 1TB MTFDKBA1T0TGD, , x, | MSI Cubi NUC AI+ 2MG Core Ultra 7 258V, Arc 140V, Phison 1 TB ESR01TBTCCZ-27J, , x, | HP Pro Mini 400 G9-937U0EA i5-14500T, UHD Graphics 770, HP PSEJN512GA87EC0, , x, | |
|---|---|---|---|---|---|---|
| Power Consumption | 33% | 39% | -32% | 9% | -22% | |
| Idle Minimum * (Watt) | 4.7 | 3.2 32% | 2.3 51% | 3.9 17% | 2.9 38% | 4.9 -4% |
| Idle Average * (Watt) | 5.4 | 4.3 20% | 3.6 33% | 6.1 -13% | 5.7 -6% | 8 -48% |
| Idle Maximum * (Watt) | 7.9 | 5.1 35% | 5.8 27% | 8.2 -4% | 10.2 -29% | 13.3 -68% |
| Load Average * (Watt) | 51.2 | 32.1 37% | 27.3 47% | 56.1 -10% | 38.7 24% | 44.6 13% |
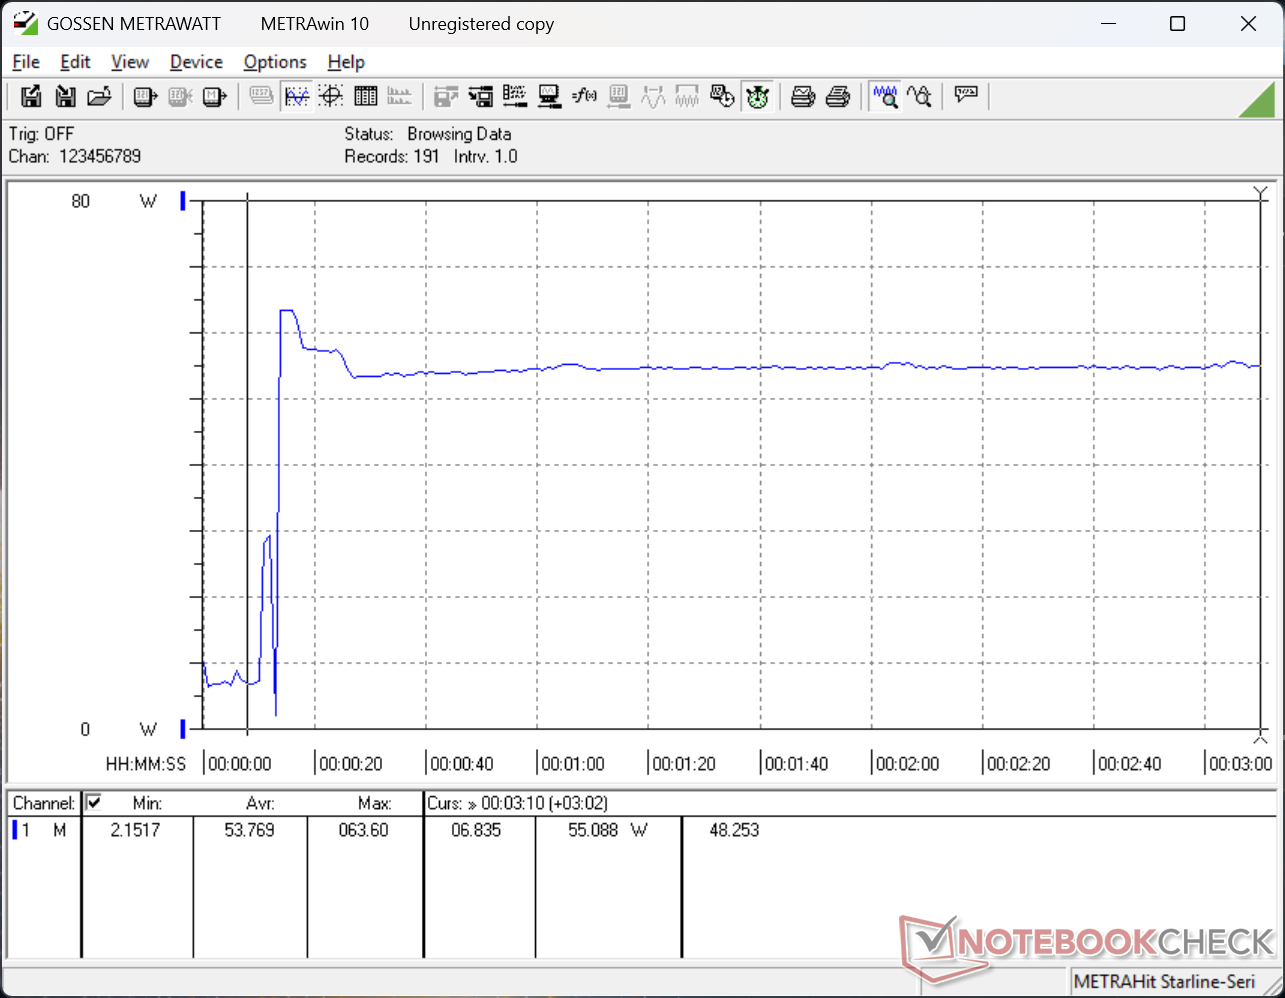
| Cyberpunk 2077 ultra external monitor * (Watt) | 50.1 | 29.4 41% | 31.6 37% | 63.9 -28% | 41.1 18% | 49 2% |
| Load Maximum * (Watt) | 63.6 | 43.5 32% | 39.6 38% | 160.6 -153% | 60 6% | 81.3 -28% |
* ... smaller is better
功耗 赛博朋克/压力测试
外部显示器功耗
电池寿命
当连接到 HDMI 显示器时,可选的 32 Wh 小电池可持续 WLAN 浏览约 8 小时。通过带 PD 的 USB-C 接口连接时,电池续航时间不成问题。
笔记本检查评级
电脑键盘一体机非常适合狭小的工作空间或终端,传统的塔式电脑可能会显得过于笨重。不过,仅限 USB-C 的系统在很大程度上依赖于适配器。
HP EliteBoard G1a AI
- 05/05/2026 v8
Allen Ngo
 Total Sustainability Score:
 潜在竞争对手比较
Image | Model / Review | Price | Weight | Height | Display |
|---|---|---|---|---|---|
1. 75.6%  | HP EliteBoard G1a AI AMD Ryzen AI 5 PRO 340 ⎘ AMD Radeon 840M ⎘ 32 GB Memory | Amazon: 1. $1,593.78 HP EliteBoard G1a Next Gen A... 2. HP EliteBoard G1a Next Gen A... 3. $1,964.80 HP EliteBook 6 G1a 16" Noteb... List Price: 1800 USD | 771 g | 17.9 mm | x |
2. 72.6%  | Geekom A5 Pro AMD Ryzen 5 7530U ⎘ AMD Radeon RX Vega 7 ⎘ 16 GB Memory, 1024 GB SSD | Amazon: List Price: 619€ | 423 g | 37 mm | x |
3. 77.4% 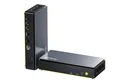 | GMK NucBox K13 Intel Core Ultra 7 256V ⎘ Intel Arc Graphics 140V ⎘ 16 GB Memory, 1000 GB SSD | Amazon: List Price: 670 USD | 506 g | 36.6 mm | x |
4. 77.5% 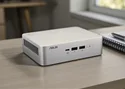 | Asus NUC 15 Pro+ Intel Core Ultra 9 285H ⎘ Intel Arc Graphics 140T ⎘ 32 GB Memory, 1024 GB SSD | Amazon: $1,642.00 List Price: 991€ | 690 g | 42 mm | x |
5. 75.2% 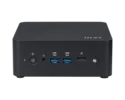 | MSI Cubi NUC AI+ 2MG Intel Core Ultra 7 258V ⎘ Intel Arc Graphics 140V ⎘ 32 GB Memory, 1000 GB SSD | Amazon: List Price: 900 USD | 669 g | 50.1 mm | x |
6. 70.8%  | HP Pro Mini 400 G9-937U0EA Intel Core i5-14500T ⎘ Intel UHD Graphics 770 ⎘ 16 GB Memory, 512 GB SSD | Amazon: 1. $399.99 HP Pro 400 G9 Mini PC Deskto... 2. $699.00 HP Pro Mini 400 G9 Tiny Desk... 3. $499.99 HP Pro 400 G9 Mini PC Deskto... List Price: 870€ | 1.2 kg | 34 mm | x |
Transparency
The selection of devices to be reviewed is made by our editorial team. The test sample was provided to the author as a loan by the manufacturer or retailer for the purpose of this review. The lender had no influence on this review, nor did the manufacturer receive a copy of this review before publication. There was no obligation to publish this review. As an independent media company, Notebookcheck is not subjected to the authority of manufacturers, retailers or publishers.
This is how Notebookcheck is testing
Every year, Notebookcheck independently reviews hundreds of laptops and smartphones using standardized procedures to ensure that all results are comparable. We have continuously developed our test methods for around 20 years and set industry standards in the process. In our test labs, high-quality measuring equipment is utilized by experienced technicians and editors. These tests involve a multi-stage validation process. Our complex rating system is based on hundreds of well-founded measurements and benchmarks, which maintains objectivity. Further information on our test methods can be found here.

