联想ThinkPad P1 2019笔记本电脑评测:GPU变强CPU变弱的超薄工作站

| SD Card Reader | |
| average JPG Copy Test (av. of 3 runs) | |
| Lenovo ThinkPad P1 2019-20QT000RGE (Toshiba Exceria Pro SDXC 64 GB UHS-II) | |
| HP ZBook Studio G5-4QH10EA (Toshiba Exceria Pro SDXC 64 GB UHS-II) | |
| Dell XPS 15 7590 9980HK GTX 1650 (Toshiba Exceria Pro SDXC 64 GB UHS-II) | |
| Dell Precision 5530 Xeon E-2176M (Toshiba Exceria Pro SDXC 64 GB UHS-II) | |
| Average of class Workstation (49.6 - 681, n=14, last 2 years) | |
| maximum AS SSD Seq Read Test (1GB) | |
| Average of class Workstation (87.6 - 1455, n=14, last 2 years) | |
| HP ZBook Studio G5-4QH10EA (Toshiba Exceria Pro SDXC 64 GB UHS-II) | |
| Lenovo ThinkPad P1 2019-20QT000RGE (Toshiba Exceria Pro SDXC 64 GB UHS-II) | |
| Dell XPS 15 7590 9980HK GTX 1650 (Toshiba Exceria Pro SDXC 64 GB UHS-II) | |
| Dell Precision 5530 Xeon E-2176M (Toshiba Exceria Pro SDXC 64 GB UHS-II) | |
| |||||||||||||||||||||||||
Brightness Distribution: 84 %
Center on Battery: 521 cd/m²
Contrast: 1322:1 (Black: 0.41 cd/m²)
ΔE ColorChecker Calman: 3.5 | ∀{0.5-29.43 Ø4.72}
calibrated: 1.3
ΔE Greyscale Calman: 4.8 | ∀{0.09-98 Ø4.97}
91.1% sRGB (Argyll 1.6.3 3D)
58.8% AdobeRGB 1998 (Argyll 1.6.3 3D)
63.4% AdobeRGB 1998 (Argyll 3D)
91.5% sRGB (Argyll 3D)
62.4% Display P3 (Argyll 3D)
Gamma: 2.33
CCT: 7690 K
| Lenovo ThinkPad P1 2019-20QT000RGE N156HCE-GN1, , 1920x1080, 15.6" | Lenovo ThinkPad X1 Extreme-20MF000RGE NV156FHM-N61, , 1920x1080, 15.6" | Dell XPS 15 7590 i5 iGPU FHD LQ156M1, , 1920x1080, 15.6" | Dell Precision 5530 Xeon E-2176M Sharp SHP148D / LQ156D1, , 3840x2160, 15.6" | HP ZBook Studio G5-4QH10EA AUO30EB, , 3840x2160, 15.6" | Dell XPS 15 7590 9980HK GTX 1650 Samsung 156WR04, SDCA029, , 3840x2160, 15.6" | |
|---|---|---|---|---|---|---|
| Display | 3% | 7% | 17% | 8% | 32% | |
| Display P3 Coverage (%) | 62.4 | 68.6 10% | 66.5 7% | 76.5 23% | 68.2 9% | 88.1 41% |
| sRGB Coverage (%) | 91.5 | 88.7 -3% | 98 7% | 98.4 8% | 96.2 5% | 99.6 9% |
| AdobeRGB 1998 Coverage (%) | 63.4 | 64.8 2% | 68.4 8% | 76.4 21% | 68.8 9% | 91.8 45% |
| Response Times | -105% | -91% | -90% | -106% | 88% | |
| Response Time Grey 50% / Grey 80% * (ms) | 34.4 ? | 52.8 ? -53% | 52.8 ? -53% | 48 ? -40% | 60.8 ? -77% | 2.3 ? 93% |
| Response Time Black / White * (ms) | 14 ? | 36 ? -157% | 32 ? -129% | 33.6 ? -140% | 32.8 ? -134% | 2.4 ? 83% |
| PWM Frequency (Hz) | 26040 ? | 21370 ? | 1020 ? | 1000 | 59.5 ? | |
| Screen | -26% | 14% | -12% | -5% | -8% | |
| Brightness middle (cd/m²) | 542 | 331 -39% | 588 8% | 451.7 -17% | 417 -23% | 421.2 -22% |
| Brightness (cd/m²) | 528 | 305 -42% | 555 5% | 440 -17% | 412 -22% | 417 -21% |
| Brightness Distribution (%) | 84 | 84 0% | 89 6% | 90 7% | 85 1% | 94 12% |
| Black Level * (cd/m²) | 0.41 | 0.24 41% | 0.4 2% | 0.4 2% | 0.29 29% | |
| Contrast (:1) | 1322 | 1379 4% | 1470 11% | 1129 -15% | 1438 9% | |
| Colorchecker dE 2000 * | 3.5 | 5.6 -60% | 2.5 29% | 3.11 11% | 4.4 -26% | 6.06 -73% |
| Colorchecker dE 2000 max. * | 7.8 | 9.9 -27% | 6.3 19% | 8.62 -11% | 6.7 14% | 11.89 -52% |
| Colorchecker dE 2000 calibrated * | 1.3 | 3 -131% | 0.6 54% | 3.07 -136% | 1.9 -46% | |
| Greyscale dE 2000 * | 4.8 | 6.3 -31% | 4.5 6% | 3.7 23% | 5 -4% | 2.8 42% |
| Gamma | 2.33 94% | 2.33 94% | 2.2 100% | 2.11 104% | 2.28 96% | 2.15 102% |
| CCT | 7690 85% | 7152 91% | 6836 95% | 6492 100% | 7575 86% | 6235 104% |
| Color Space (Percent of AdobeRGB 1998) (%) | 58.8 | 58 -1% | 63.2 7% | 69 17% | 62.3 6% | 81 38% |
| Color Space (Percent of sRGB) (%) | 91.1 | 88.6 -3% | 98 8% | 98 8% | 96 5% | 99.6 9% |
| Total Average (Program / Settings) | -43% /
-31% | -23% /
-0% | -28% /
-16% | -34% /
-15% | 37% /
16% |
* ... smaller is better
Display Response Times
| ↔ Response Time Black to White | ||
|---|---|---|
| 14 ms ... rise ↗ and fall ↘ combined | ↗ 4.4 ms rise | 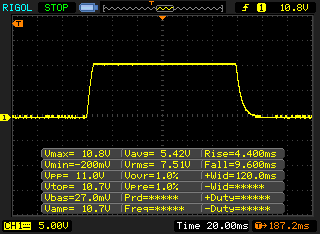 |
| ↘ 9.6 ms fall | ||
| The screen shows good response rates in our tests, but may be too slow for competitive gamers. In comparison, all tested devices range from 0.1 (minimum) to 240 (maximum) ms. » 34 % of all devices are better. This means that the measured response time is better than the average of all tested devices (19.8 ms). | ||
| ↔ Response Time 50% Grey to 80% Grey | ||
| 34.4 ms ... rise ↗ and fall ↘ combined | ↗ 17.2 ms rise | 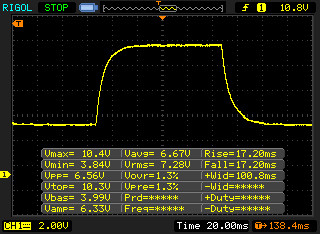 |
| ↘ 17.2 ms fall | ||
| The screen shows slow response rates in our tests and will be unsatisfactory for gamers. In comparison, all tested devices range from 0.165 (minimum) to 636 (maximum) ms. » 48 % of all devices are better. This means that the measured response time is worse than the average of all tested devices (31 ms). | ||
Screen Flickering / PWM (Pulse-Width Modulation)
| Screen flickering / PWM detected | 26040 Hz | ≤ 70 % brightness setting | 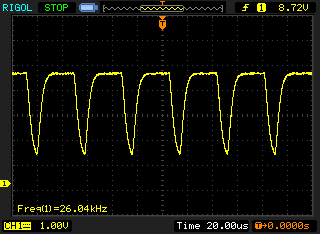 |
The display backlight flickers at 26040 Hz (worst case, e.g., utilizing PWM) Flickering detected at a brightness setting of 70 % and below. There should be no flickering or PWM above this brightness setting. The frequency of 26040 Hz is quite high, so most users sensitive to PWM should not notice any flickering. In comparison: 52 % of all tested devices do not use PWM to dim the display. If PWM was detected, an average of 7763 (minimum: 5 - maximum: 343500) Hz was measured. | |||
| PCMark 8 Home Score Accelerated v2 | 3986 points | |
| PCMark 8 Creative Score Accelerated v2 | 3897 points | |
| PCMark 8 Work Score Accelerated v2 | 5332 points | |
| PCMark 10 Score | 5046 points | |
Help | ||
| Lenovo ThinkPad P1 2019-20QT000RGE WDC PC SN720 SDAQNTW-512G | Lenovo ThinkPad P1-20MD002LUS Samsung SSD PM981 MZVLB2T0HMLB | Dell Precision 5530 Xeon E-2176M SK hynix PC400 512 GB | HP ZBook Studio G5-4QH10EA Samsung SSD PM981 MZVLB512HAJQ | Dell XPS 15 7590 9980HK GTX 1650 Toshiba XG6 KXG60ZNV1T02 | Average WDC PC SN720 SDAQNTW-512G | |
|---|---|---|---|---|---|---|
| CrystalDiskMark 5.2 / 6 | -21% | -23% | -26% | -7% | 8% | |
| Write 4K (MB/s) | 162.2 | 108 -33% | 97.8 -40% | 102.7 -37% | 104.3 -36% | 183.3 ? 13% |
| Read 4K (MB/s) | 43.71 | 37.24 -15% | 41.21 -6% | 38.32 -12% | 45.23 3% | 48.2 ? 10% |
| Write Seq (MB/s) | 2441 | 1476 -40% | 1312 -46% | 1417 -42% | 1729 -29% | 2135 ? -13% |
| Read Seq (MB/s) | 1753 | 1367 -22% | 1667 -5% | 1289 -26% | 1861 6% | 2102 ? 20% |
| Write 4K Q32T1 (MB/s) | 397.6 | 302.4 -24% | 449.5 13% | 278.9 -30% | 509 28% | 452 ? 14% |
| Read 4K Q32T1 (MB/s) | 520 | 375 -28% | 327.4 -37% | 348.8 -33% | 388.5 -25% | 619 ? 19% |
| Write Seq Q32T1 (MB/s) | 2519 | 2433 -3% | 1385 -45% | 1895 -25% | 2813 12% | 2537 ? 1% |
| Read Seq Q32T1 (MB/s) | 3448 | 3493 1% | 2948 -15% | 3352 -3% | 2906 -16% | 3466 ? 1% |

| 3DMark 06 Standard Score | 33809 points | |
| 3DMark Vantage P Result | 31509 points | |
| 3DMark 11 Performance | 10211 points | |
| 3DMark Ice Storm Standard Score | 76341 points | |
| 3DMark Cloud Gate Standard Score | 23601 points | |
| 3DMark Fire Strike Score | 6812 points | |
| 3DMark Time Spy Score | 3006 points | |
Help | ||
| The Witcher 3 - 1920x1080 High Graphics & Postprocessing (Nvidia HairWorks Off) | |
| Average of class Workstation (91 - 156.4, n=2, last 2 years) | |
| Dell XPS 15 7590 9980HK GTX 1650 | |
| Average NVIDIA Quadro T1000 (Laptop) (52.7 - 62.9, n=3) | |
| Lenovo ThinkPad P1 2019-20QT000RGE | |
| Lenovo ThinkPad X1 Extreme-20MF000RGE | |
| Lenovo ThinkPad P1-20MD002LUS | |
| HP ZBook Studio G5-4QH10EA | |
| low | med. | high | ultra | 4K | |
|---|---|---|---|---|---|
| BioShock Infinite (2013) | 280.4 | 210 | 184.7 | 72.9 | |
| The Witcher 3 (2015) | 156.2 | 94.1 | 52.7 | 30.9 | |
| Dota 2 Reborn (2015) | 134 | 115 | 113 | 106 | 47.9 |
| Rainbow Six Siege (2015) | 190.3 | 159.6 | 111.6 | 97.9 | |
| Rise of the Tomb Raider (2016) | 136.2 | 86 | 53.4 | 43.8 | |
| For Honor (2017) | 163.4 | 66.7 | 63.9 | 48.8 | |
| Ghost Recon Wildlands (2017) | 94 | 47.2 | 43.9 | 24.2 | |
| Rocket League (2017) | 246.4 | 150.7 | 117 | ||
| Final Fantasy XV Benchmark (2018) | 77.4 | 41.9 | 31.1 | ||
| Kingdom Come: Deliverance (2018) | 93.7 | 49.3 | 40.5 | 30.7 | |
| X-Plane 11.11 (2018) | 91 | 78 | 69 | ||
| Shadow of the Tomb Raider (2018) | 88 | 46 | 40 | 35 | |
| FIFA 19 (2018) | 148 | 119.2 | 113.5 | 110.8 | |
| Assassin´s Creed Odyssey (2018) | 57 | 40 | 35 | 29 | |
| Battlefield V (2018) | 61.5 | 43.2 | 37.8 | 35 | |
| Farming Simulator 19 (2018) | 182.4 | 106.7 | 86.3 | 66.5 | |
| Apex Legends (2019) | 143.7 | 73.8 | 57.8 | 55.9 | |
| Far Cry New Dawn (2019) | 77 | 48 | 46 | 43 | |
| Dirt Rally 2.0 (2019) | 185.2 | 80.7 | 63.7 | 36.3 | |
| The Division 2 (2019) | 39 | 36 | 29 | ||
| Anno 1800 (2019) | 69.6 | 52.8 | 37.2 | 20 | |
| F1 2019 (2019) | 118 | 73 | 61 | 49 |
Noise level
| Idle |
| 28.8 / 28.8 / 28.8 dB(A) |
| Load |
| 36.1 / 36.7 dB(A) |
 | ||
30 dB silent 40 dB(A) audible 50 dB(A) loud |
||
min: | ||
(±) The maximum temperature on the upper side is 44.7 °C / 112 F, compared to the average of 38.2 °C / 101 F, ranging from 22.2 to 69.8 °C for the class Workstation.
(-) The bottom heats up to a maximum of 49.4 °C / 121 F, compared to the average of 41.1 °C / 106 F
(+) In idle usage, the average temperature for the upper side is 23.6 °C / 74 F, compared to the device average of 32 °C / 90 F.
(±) Playing The Witcher 3, the average temperature for the upper side is 36.7 °C / 98 F, compared to the device average of 32 °C / 90 F.
(+) The palmrests and touchpad are cooler than skin temperature with a maximum of 30.1 °C / 86.2 F and are therefore cool to the touch.
(-) The average temperature of the palmrest area of similar devices was 27.8 °C / 82 F (-2.3 °C / -4.2 F).
Lenovo ThinkPad P1 2019-20QT000RGE audio analysis
(±) | speaker loudness is average but good (74 dB)
Bass 100 - 315 Hz
(±) | reduced bass - on average 10.6% lower than median
(±) | linearity of bass is average (13% delta to prev. frequency)
Mids 400 - 2000 Hz
(+) | balanced mids - only 4.4% away from median
(+) | mids are linear (5.9% delta to prev. frequency)
Highs 2 - 16 kHz
(+) | balanced highs - only 2.4% away from median
(±) | linearity of highs is average (8.2% delta to prev. frequency)
Overall 100 - 16.000 Hz
(±) | linearity of overall sound is average (16.7% difference to median)
Compared to same class
» 46% of all tested devices in this class were better, 9% similar, 45% worse
» The best had a delta of 7%, average was 17%, worst was 35%
Compared to all devices tested
» 29% of all tested devices were better, 7% similar, 64% worse
» The best had a delta of 4%, average was 24%, worst was 134%
Lenovo ThinkPad P1-20MD002LUS audio analysis
(±) | speaker loudness is average but good (73.7 dB)
Bass 100 - 315 Hz
(±) | reduced bass - on average 10.1% lower than median
(±) | linearity of bass is average (12.3% delta to prev. frequency)
Mids 400 - 2000 Hz
(±) | higher mids - on average 5.9% higher than median
(±) | linearity of mids is average (8.9% delta to prev. frequency)
Highs 2 - 16 kHz
(+) | balanced highs - only 2% away from median
(+) | highs are linear (5.1% delta to prev. frequency)
Overall 100 - 16.000 Hz
(±) | linearity of overall sound is average (21.8% difference to median)
Compared to same class
» 77% of all tested devices in this class were better, 6% similar, 17% worse
» The best had a delta of 7%, average was 17%, worst was 35%
Compared to all devices tested
» 62% of all tested devices were better, 7% similar, 31% worse
» The best had a delta of 4%, average was 24%, worst was 134%
| Off / Standby | |
| Idle | |
| Load |
|
Key:
min: | |
| Lenovo ThinkPad P1 2019-20QT000RGE i7-9850H, Quadro T1000 (Laptop), WDC PC SN720 SDAQNTW-512G, IPS LED, 1920x1080, 15.6" | Lenovo ThinkPad X1 Extreme-20MF000RGE i5-8300H, GeForce GTX 1050 Ti Max-Q, Samsung SSD PM981 MZVLB256HAHQ, IPS LED, 1920x1080, 15.6" | Lenovo ThinkPad P1-20MD002LUS E-2176M, Quadro P2000 Max-Q, Samsung SSD PM981 MZVLB2T0HMLB, IPS, 3840x2160, 15.6" | Dell Precision 5530 Xeon E-2176M E-2176M, Quadro P2000, SK hynix PC400 512 GB, IGZO, 3840x2160, 15.6" | HP ZBook Studio G5-4QH10EA i7-8750H, Quadro P1000, Samsung SSD PM981 MZVLB512HAJQ, IPS LED, 3840x2160, 15.6" | Dell XPS 15 7590 9980HK GTX 1650 i9-9980HK, GeForce GTX 1650 Mobile, Toshiba XG6 KXG60ZNV1T02, OLED, 3840x2160, 15.6" | Average NVIDIA Quadro T1000 (Laptop) | Average of class Workstation | |
|---|---|---|---|---|---|---|---|---|
| Power Consumption | 35% | 21% | 5% | 23% | 11% | 16% | 0% | |
| Idle Minimum * (Watt) | 13.7 | 4.14 70% | 7.1 48% | 9.8 28% | 6.8 50% | 6.2 55% | 8.33 ? 39% | 9.04 ? 34% |
| Idle Average * (Watt) | 17.5 | 7.3 58% | 14.4 18% | 16.8 4% | 11.3 35% | 9.6 45% | 11.8 ? 33% | 13.8 ? 21% |
| Idle Maximum * (Watt) | 20.9 | 11.5 45% | 14.6 30% | 16.9 19% | 14.3 32% | 21.2 -1% | 15.2 ? 27% | 17.7 ? 15% |
| Load Average * (Watt) | 77.2 | 78.8 -2% | 93.9 -22% | 102.3 -33% | 78 -1% | 104.3 -35% | 86.4 ? -12% | 96.2 ? -25% |
| Load Maximum * (Watt) | 123.7 | 118 5% | 88.3 29% | 114.5 7% | 126 -2% | 135.3 -9% | 131.1 ? -6% | 178.5 ? -44% |
| Witcher 3 ultra * (Watt) | 82 | 77.9 | 76.5 | 64 | 91.7 |
* ... smaller is better
| Lenovo ThinkPad P1 2019-20QT000RGE i7-9850H, Quadro T1000 (Laptop), 80 Wh | Lenovo ThinkPad X1 Extreme-20MF000RGE i5-8300H, GeForce GTX 1050 Ti Max-Q, 80 Wh | Dell XPS 15 7590 i5 iGPU FHD i5-9300H, UHD Graphics 630, 97 Wh | Lenovo ThinkPad P1-20MD002LUS E-2176M, Quadro P2000 Max-Q, 80 Wh | Dell Precision 5530 Xeon E-2176M E-2176M, Quadro P2000, 97 Wh | HP ZBook Studio G5-4QH10EA i7-8750H, Quadro P1000, 97 Wh | Average of class Workstation | |
|---|---|---|---|---|---|---|---|
| Battery runtime | 16% | 59% | -40% | 16% | 25% | 3% | |
| H.264 (h) | 9.3 | 9.6 3% | 17.6 89% | 9.1 -2% | 9.51 ? 2% | ||
| WiFi v1.3 (h) | 8.9 | 9.4 6% | 14.1 58% | 5.3 -40% | 8.4 -6% | 9.7 9% | 8.52 ? -4% |
| Load (h) | 1.3 | 1.8 38% | 1.7 31% | 1.8 38% | 2.2 69% | 1.429 ? 10% | |
| Reader / Idle (h) | 21 | 16.5 | 17.3 | 26.1 ? |
Pros
Cons
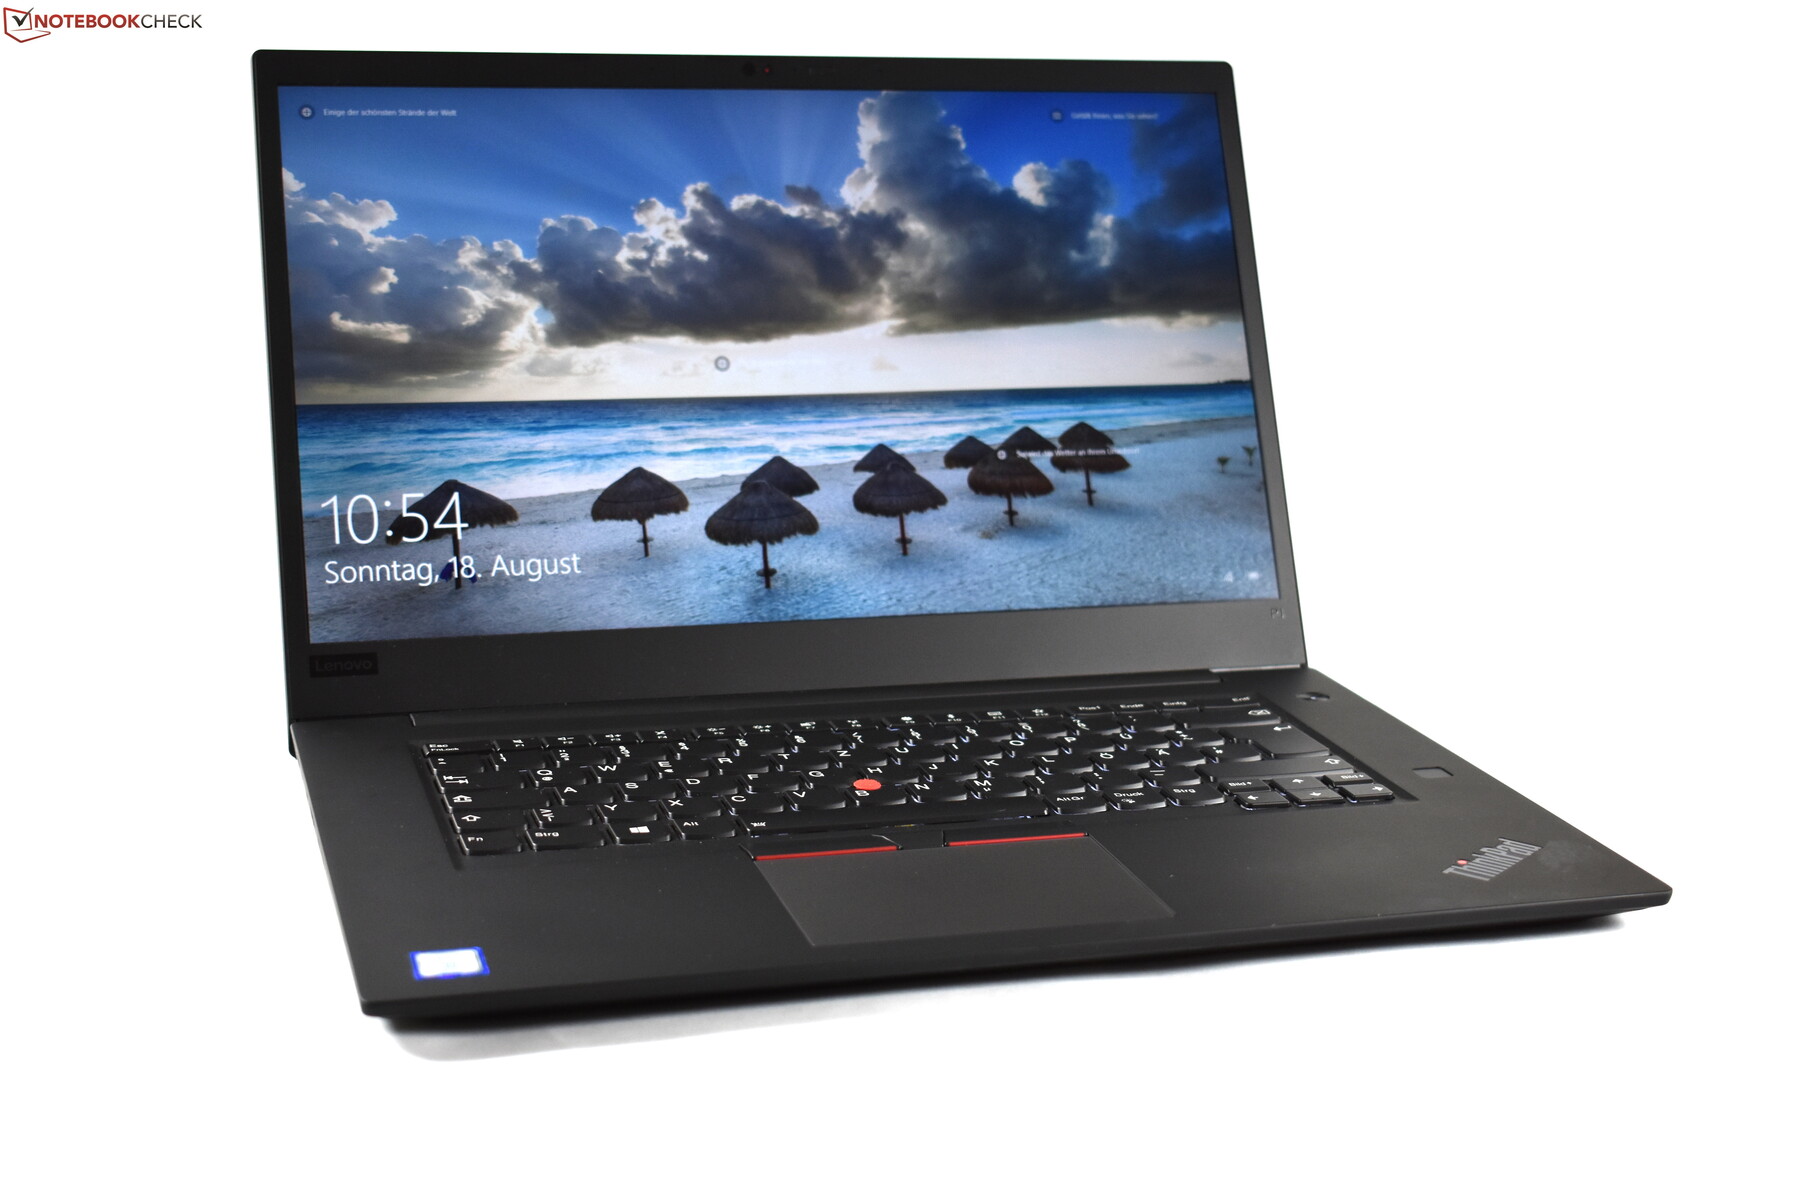
由于Lenovo ThinkPad P1 2019只是其前代机型ThinkPad P1 2018的更新,因此判决在很大程度上与前者非常相似。唯一的区别在于某些细节。
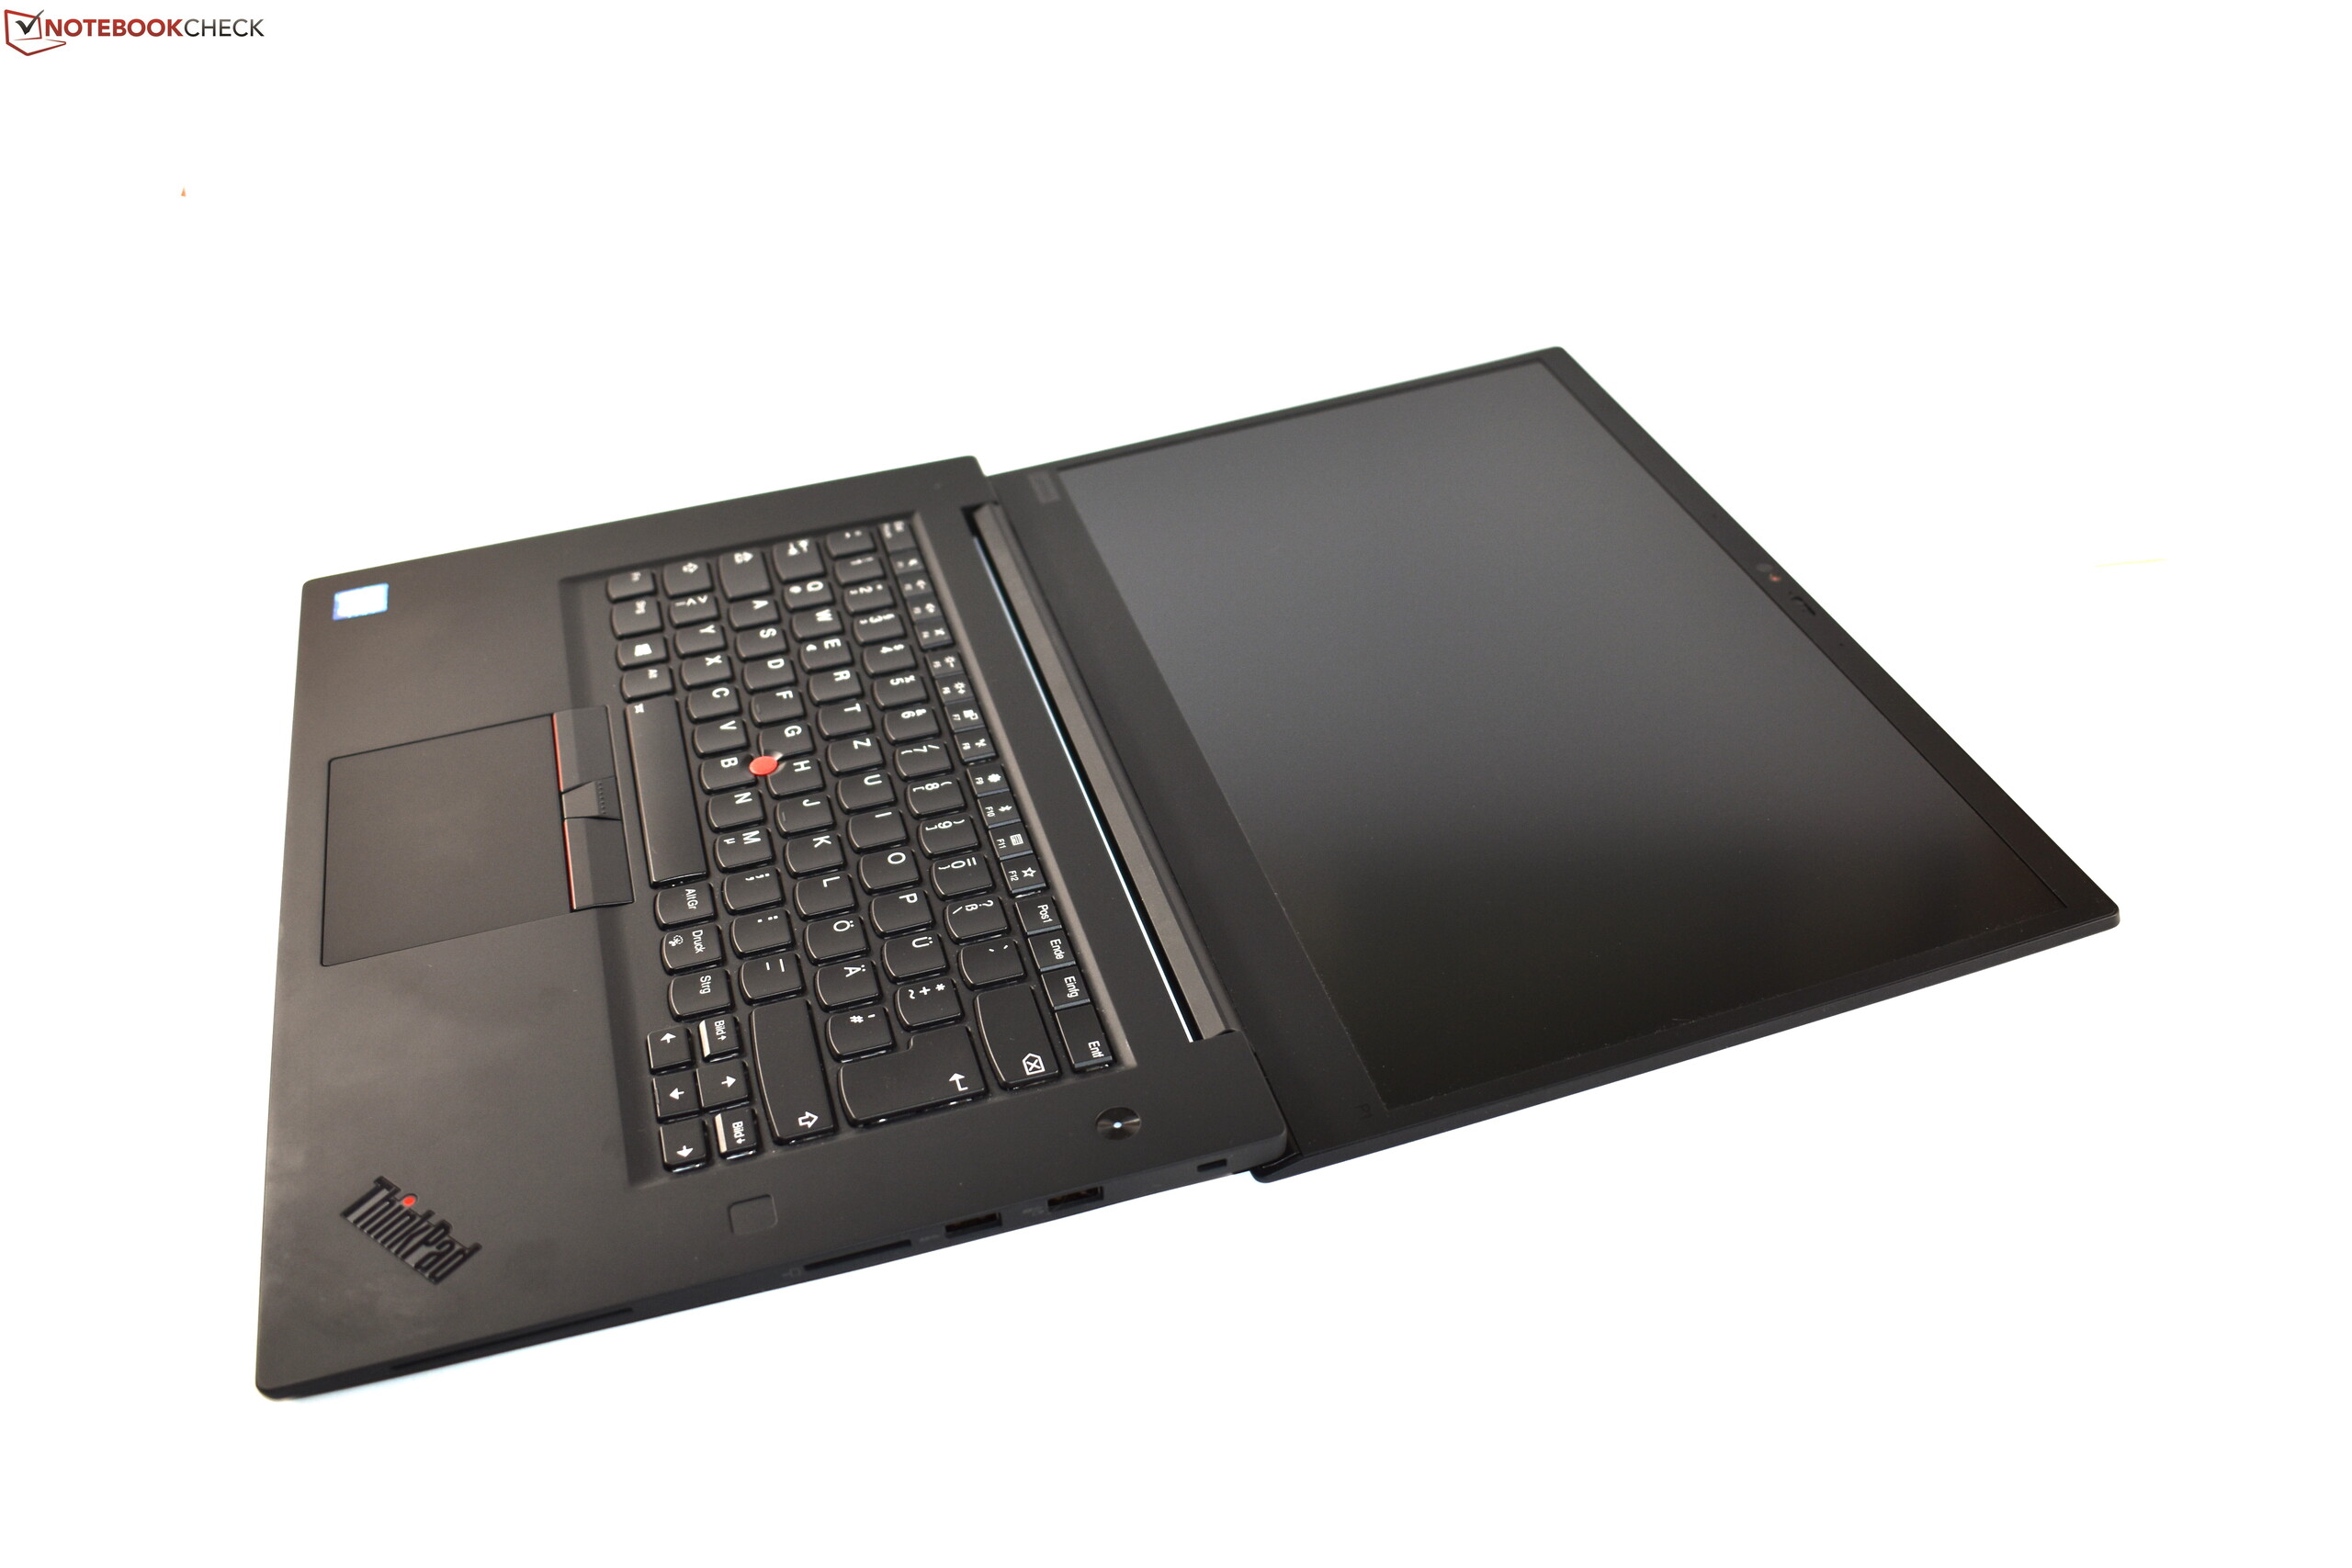
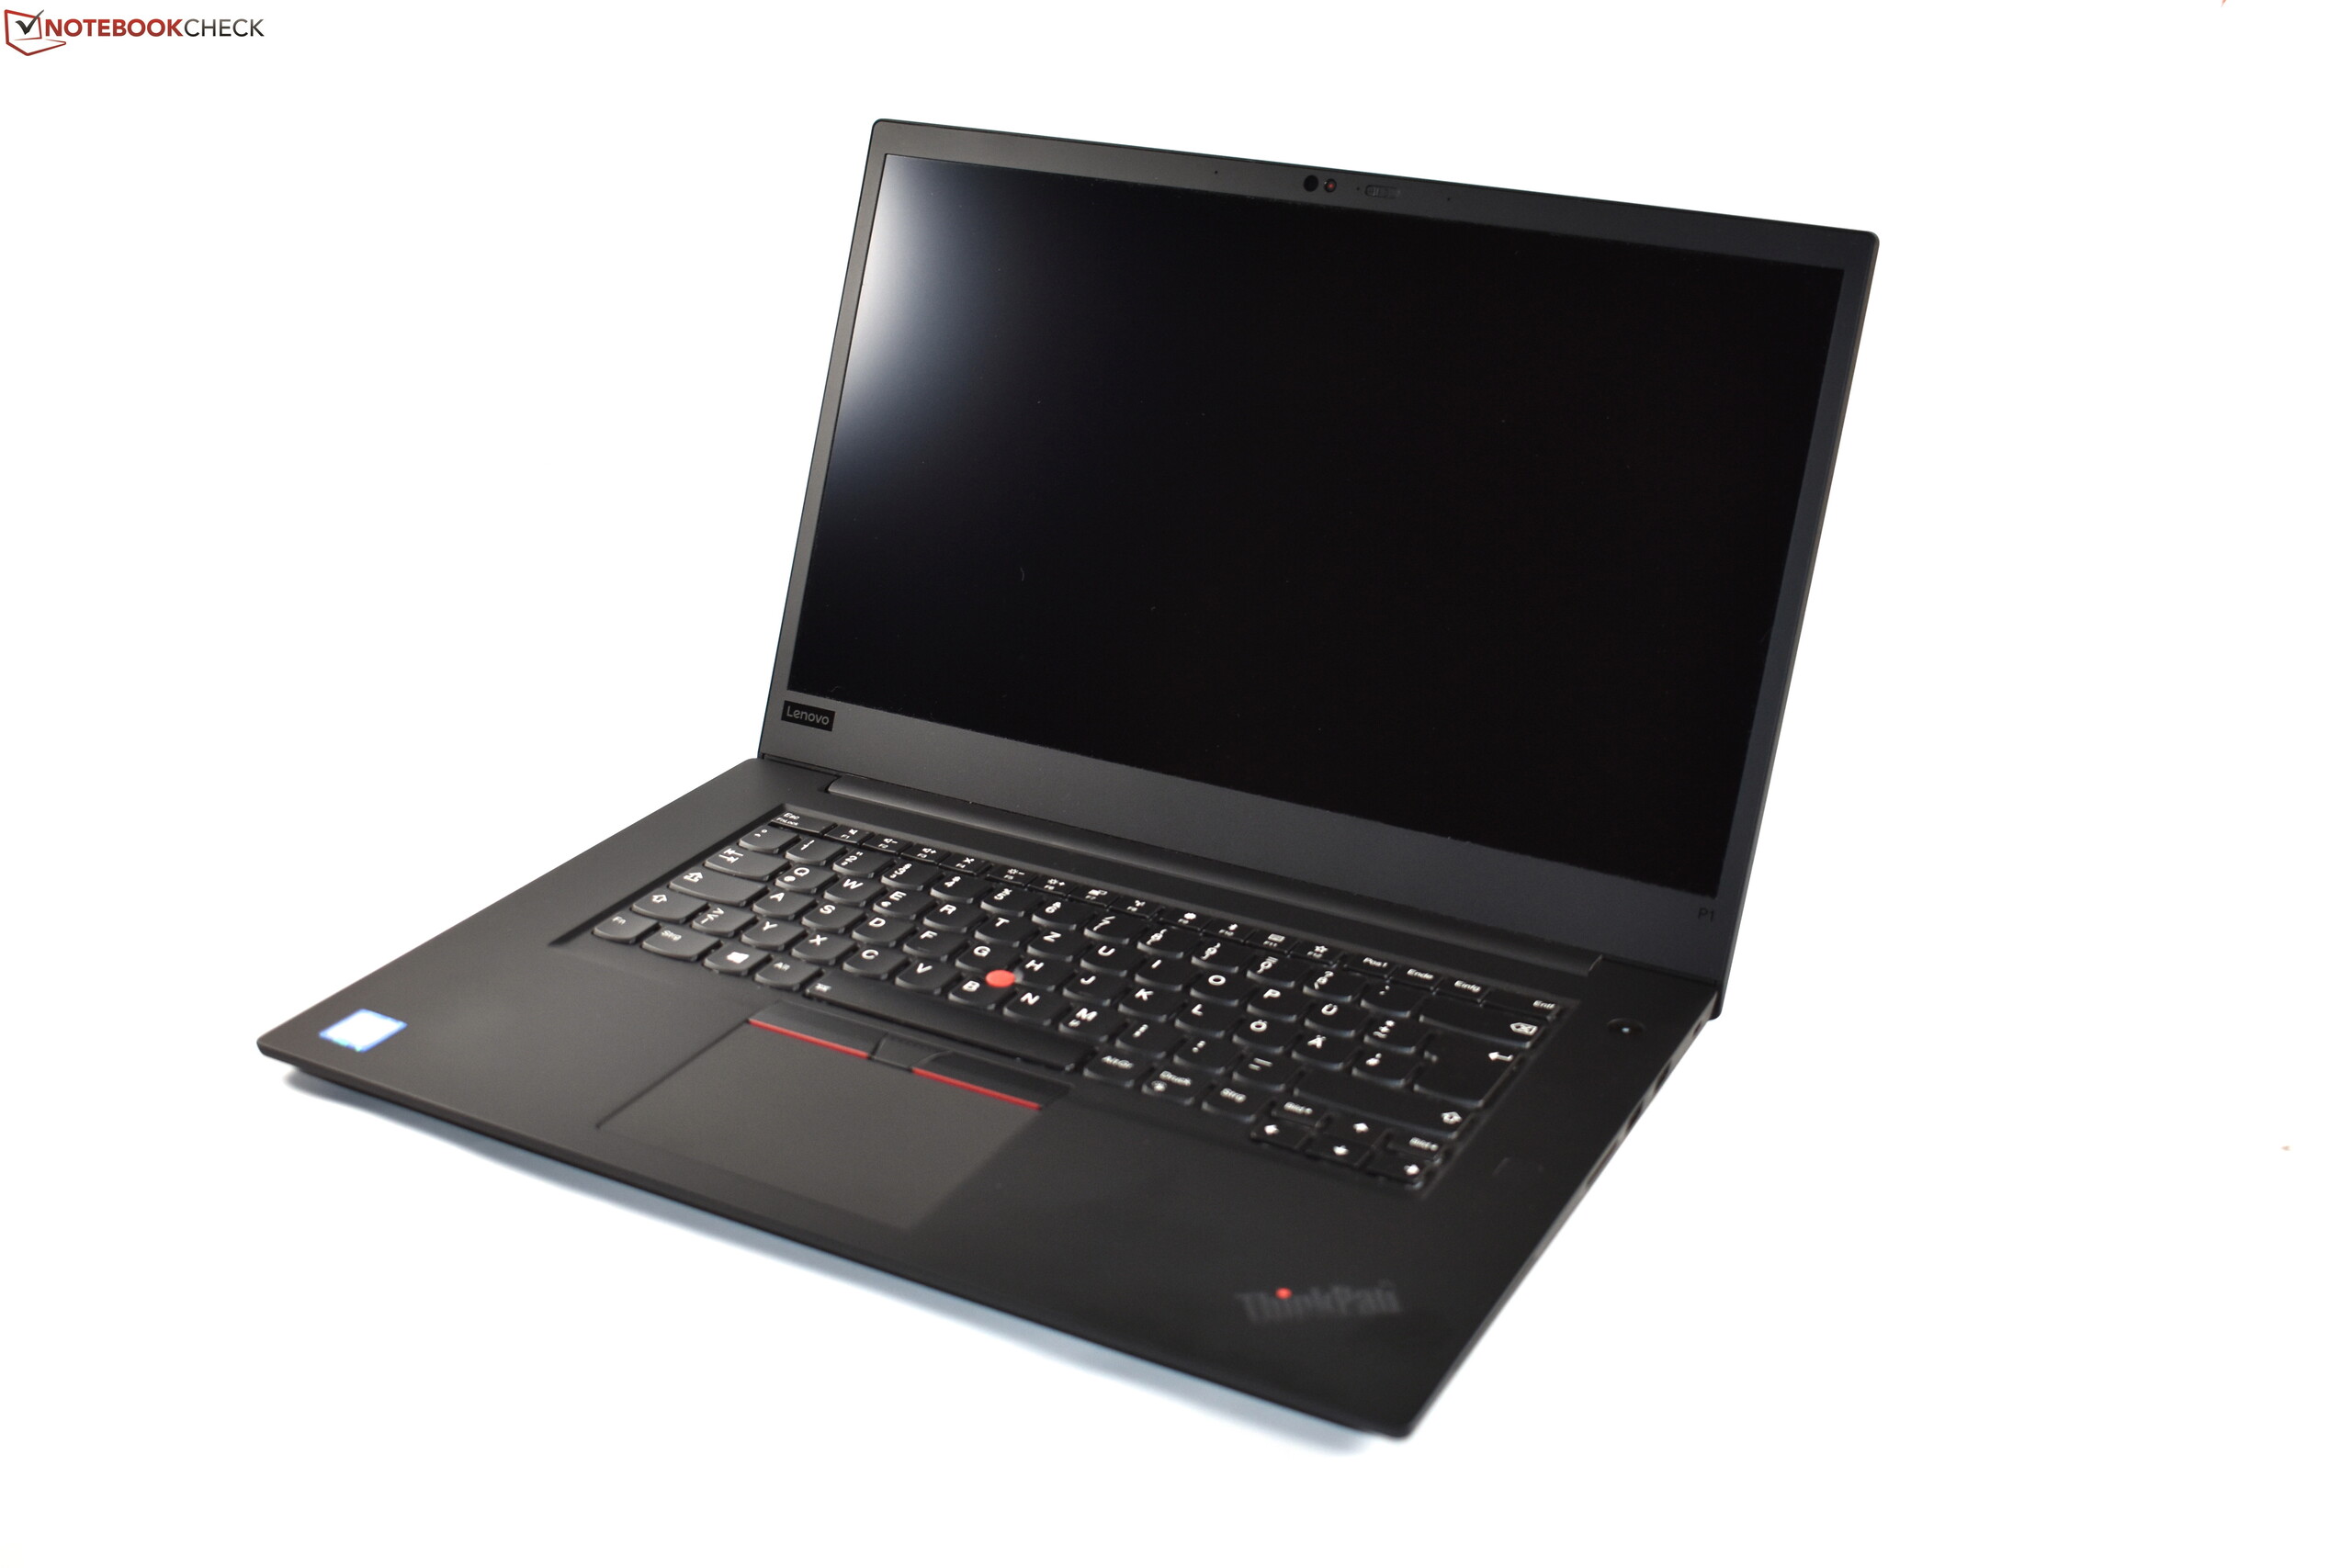
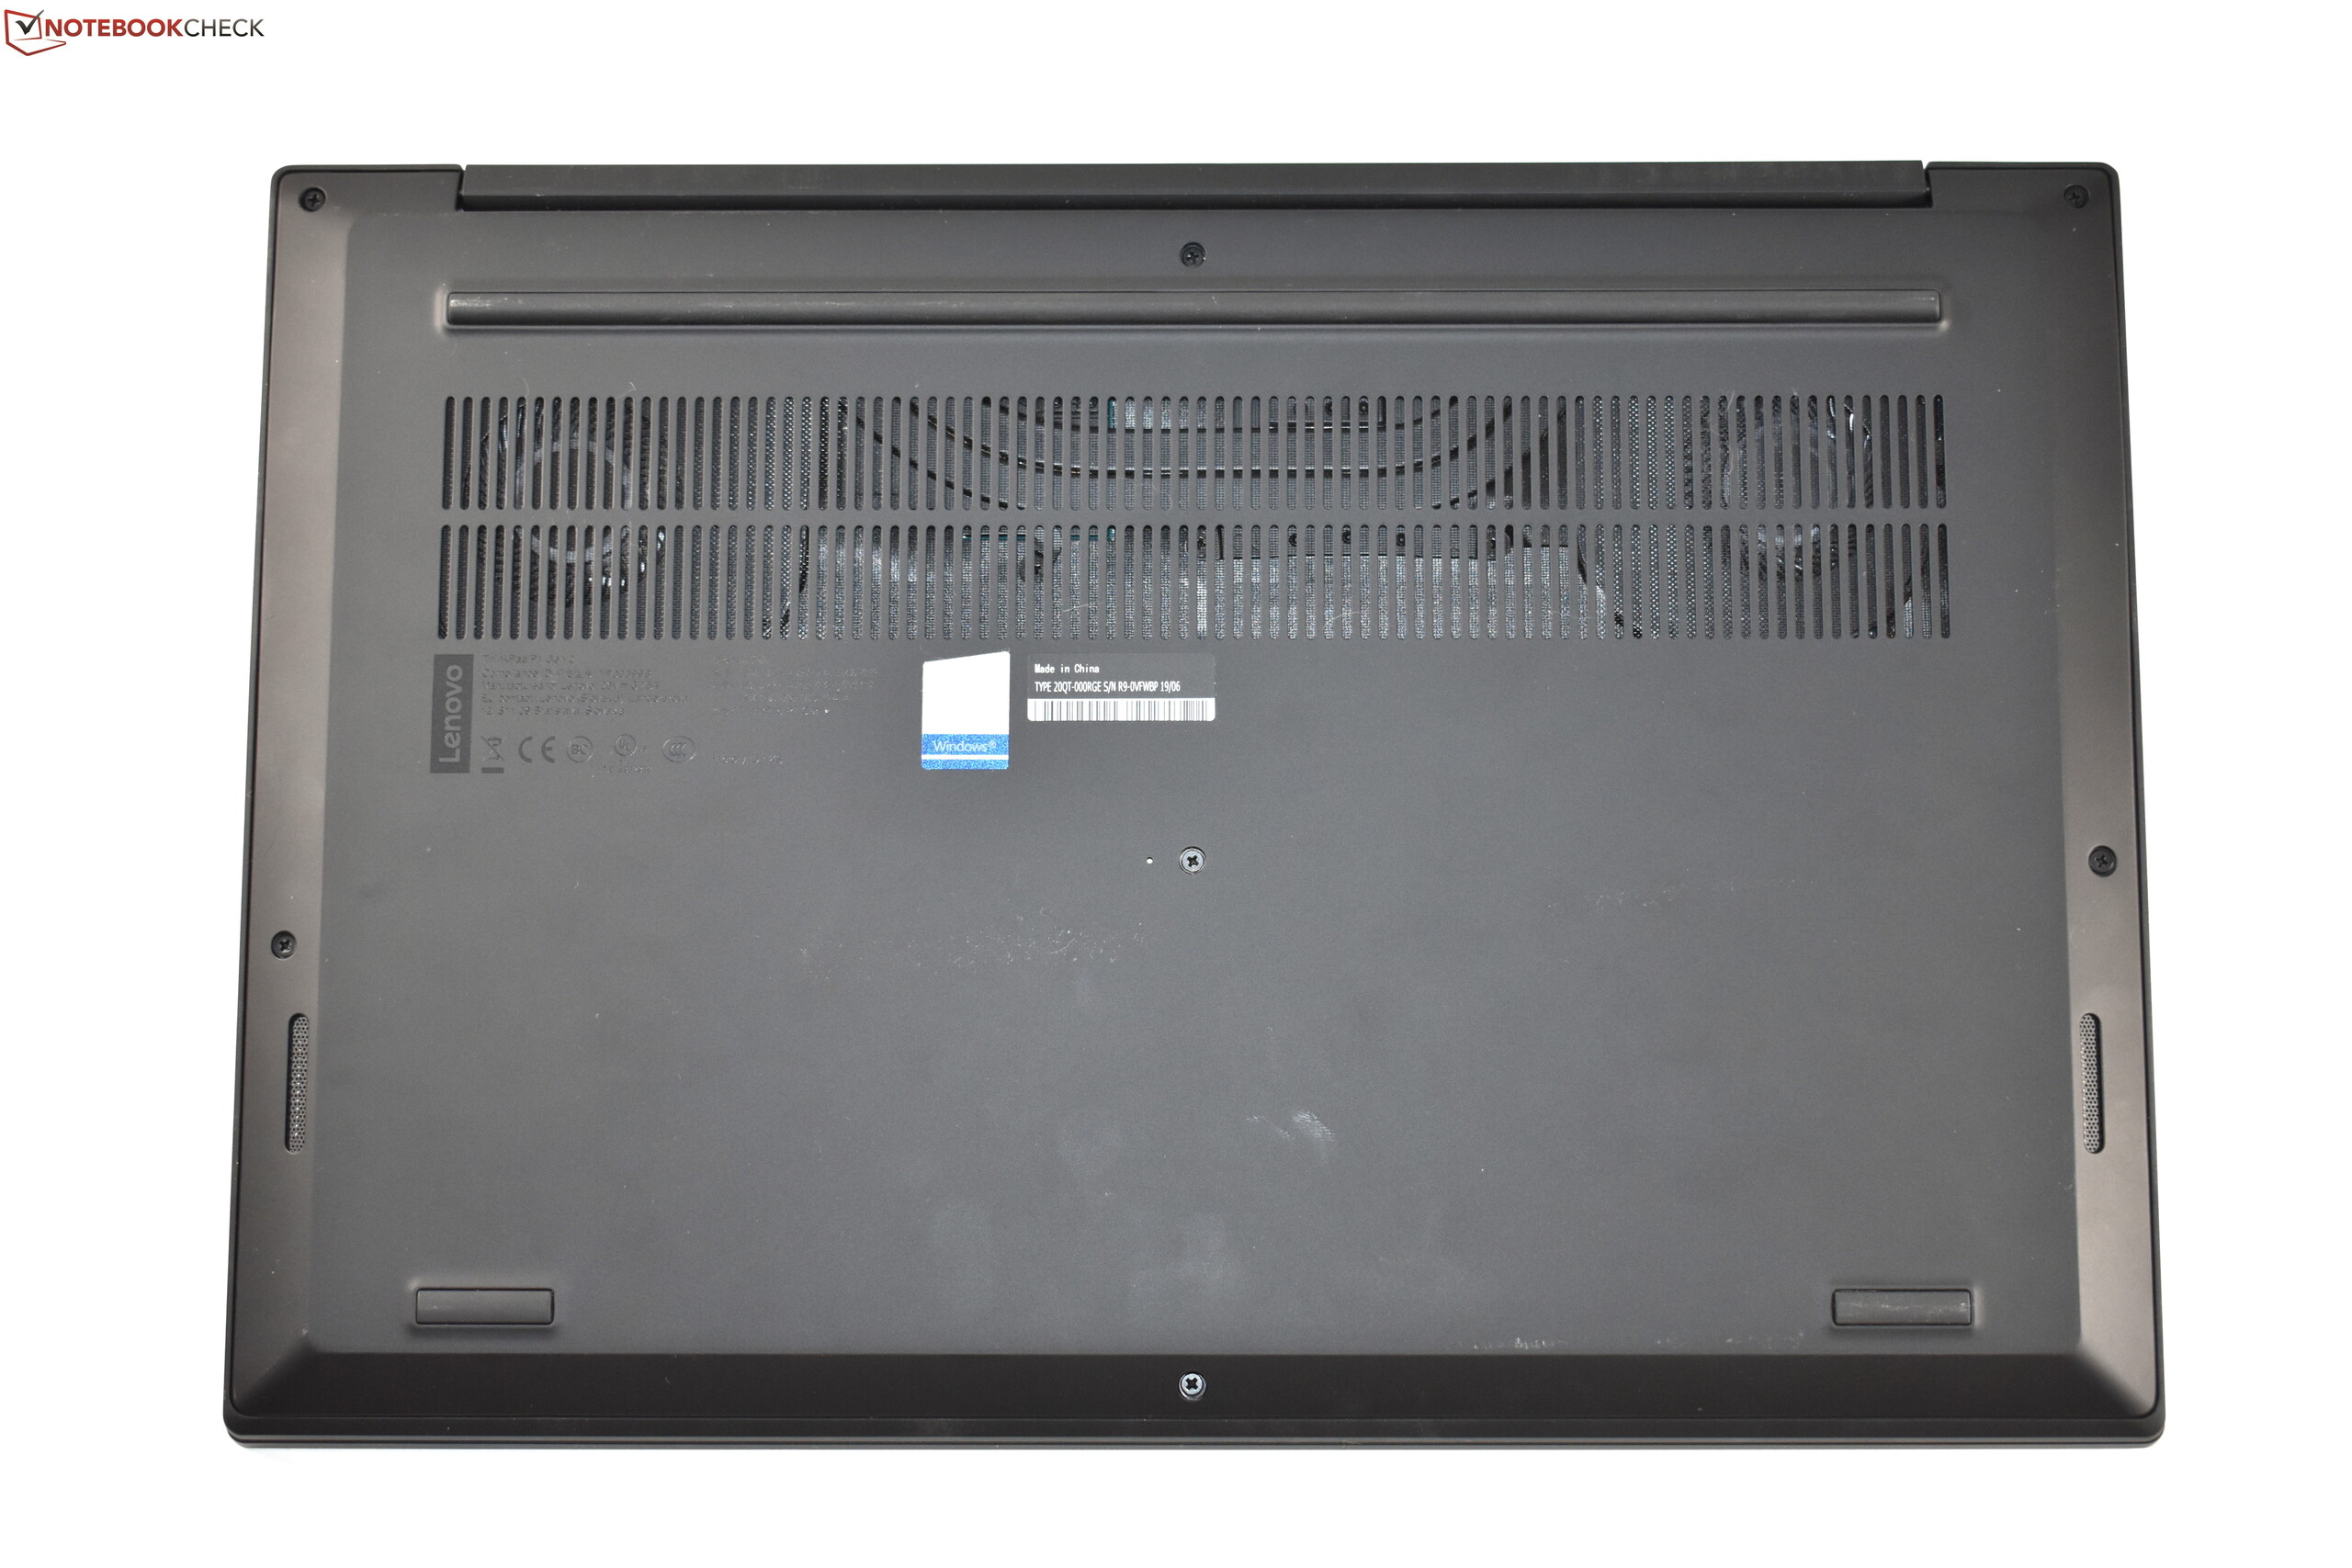
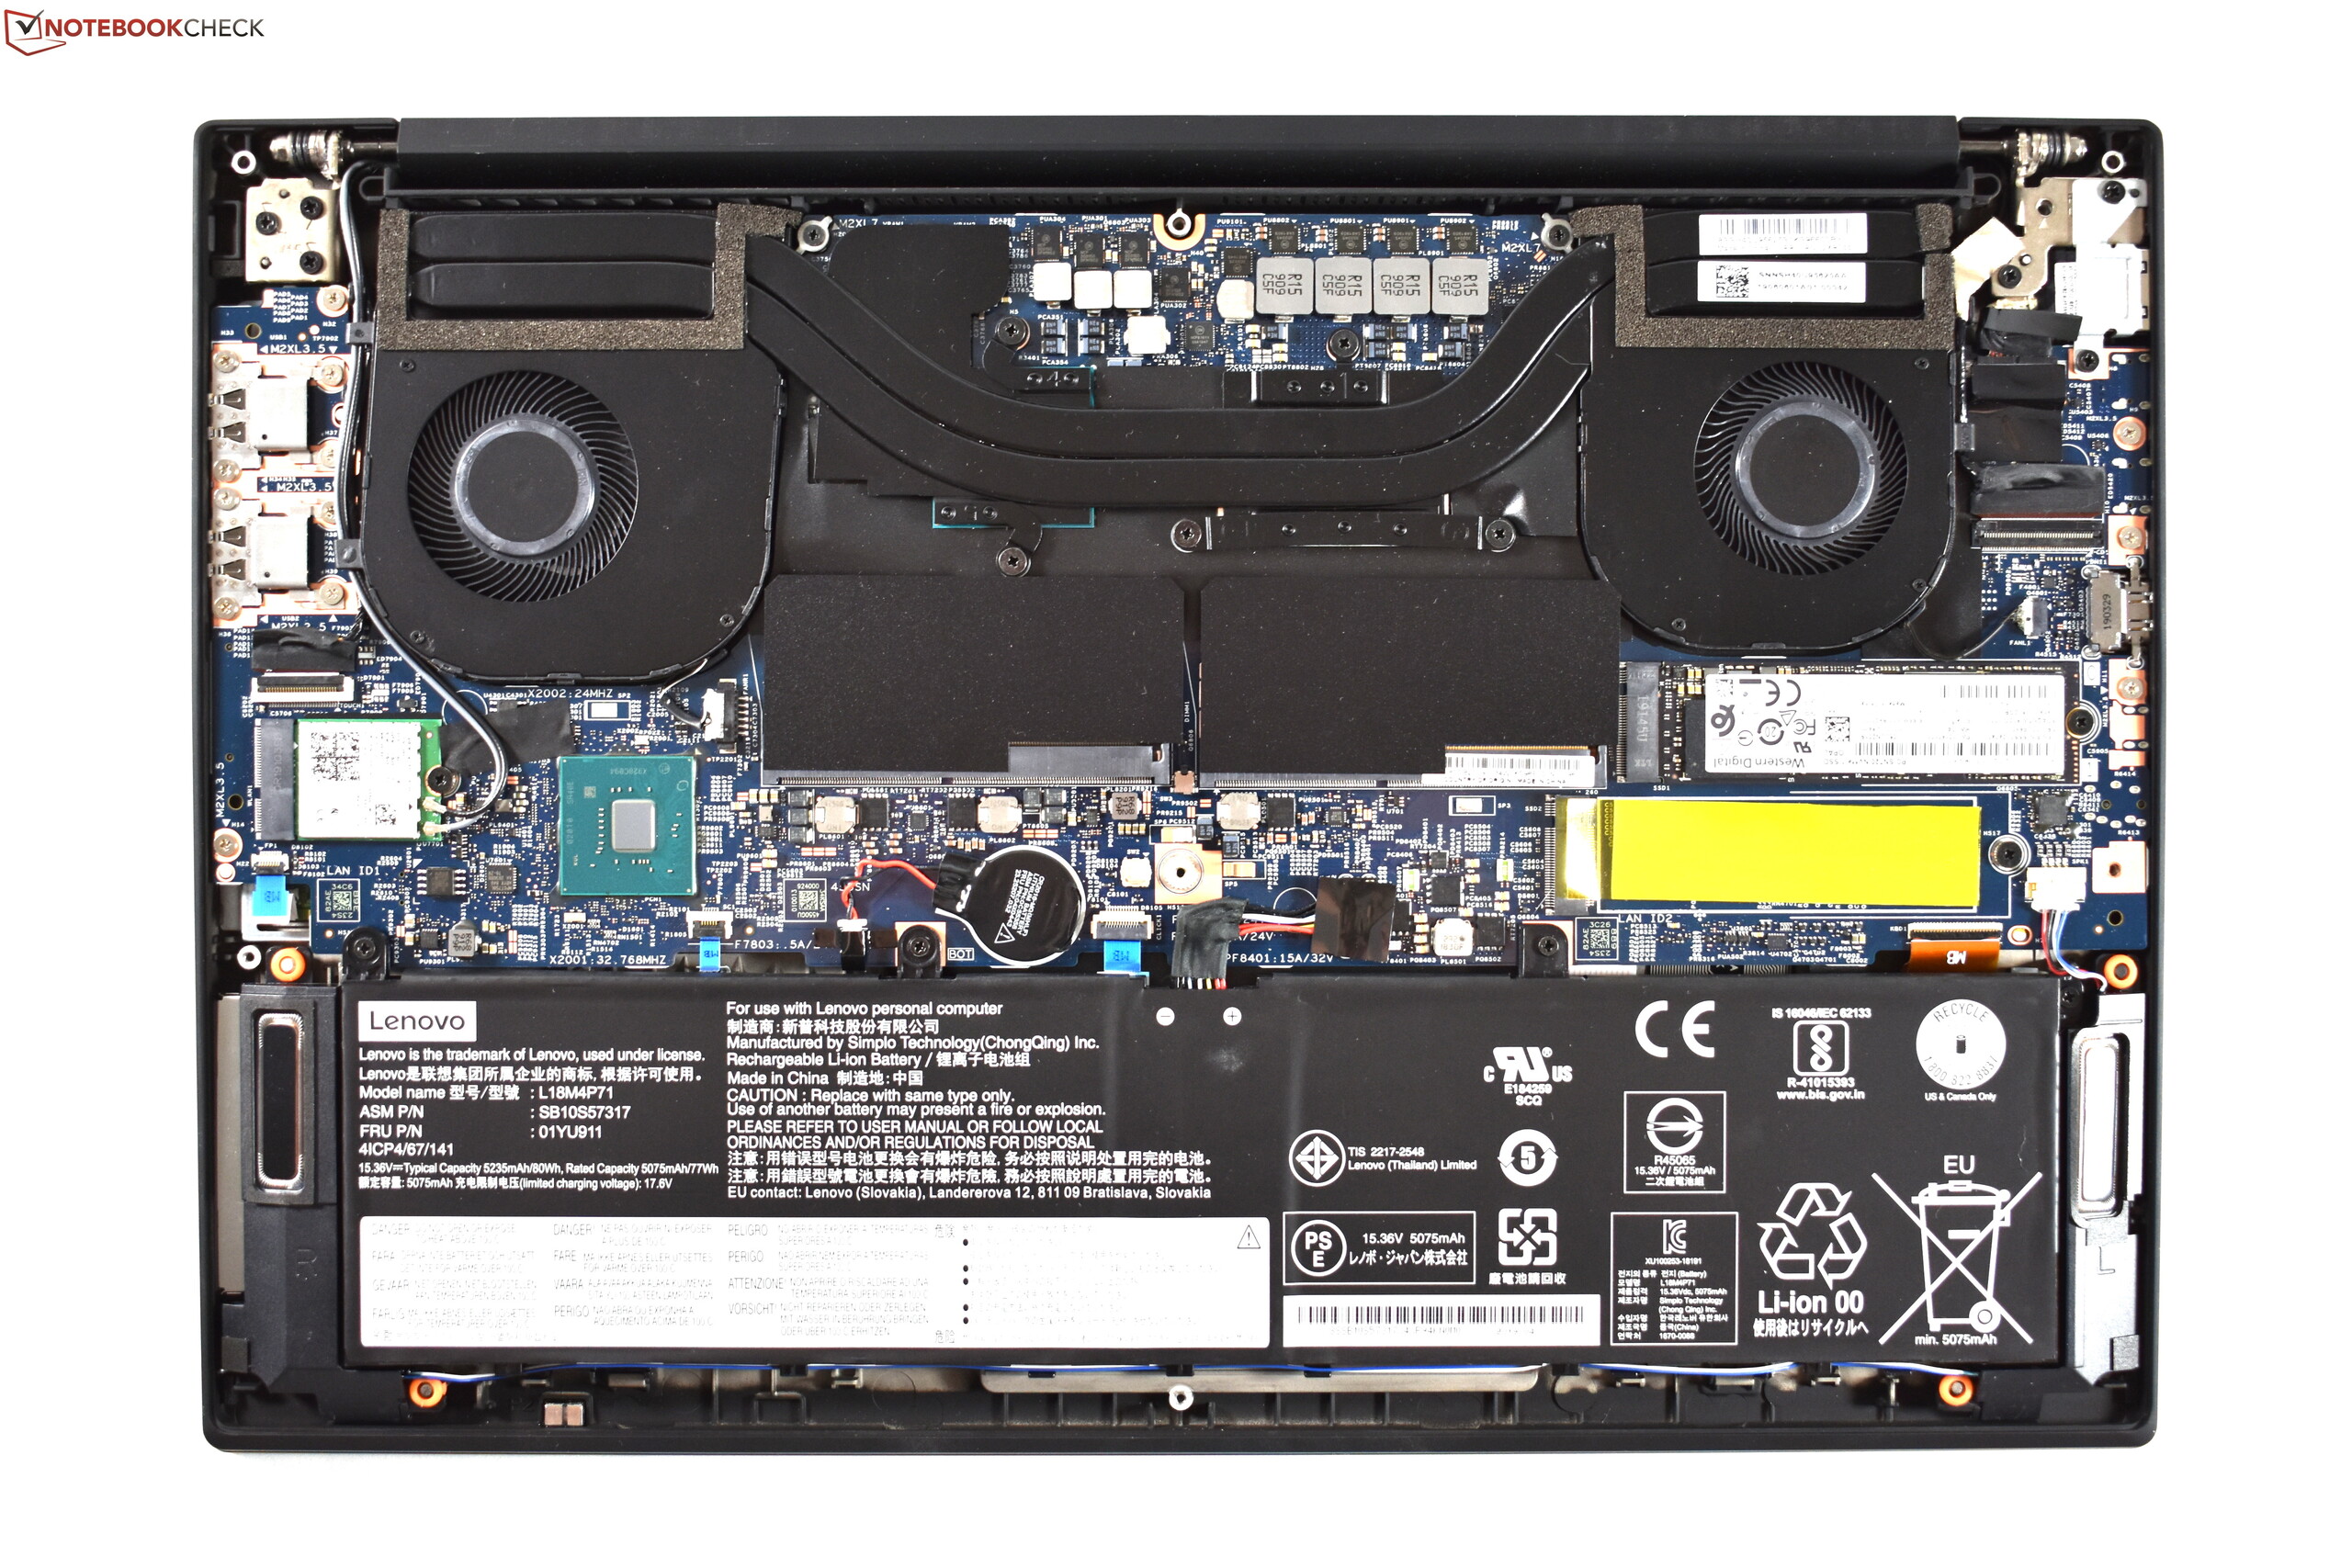
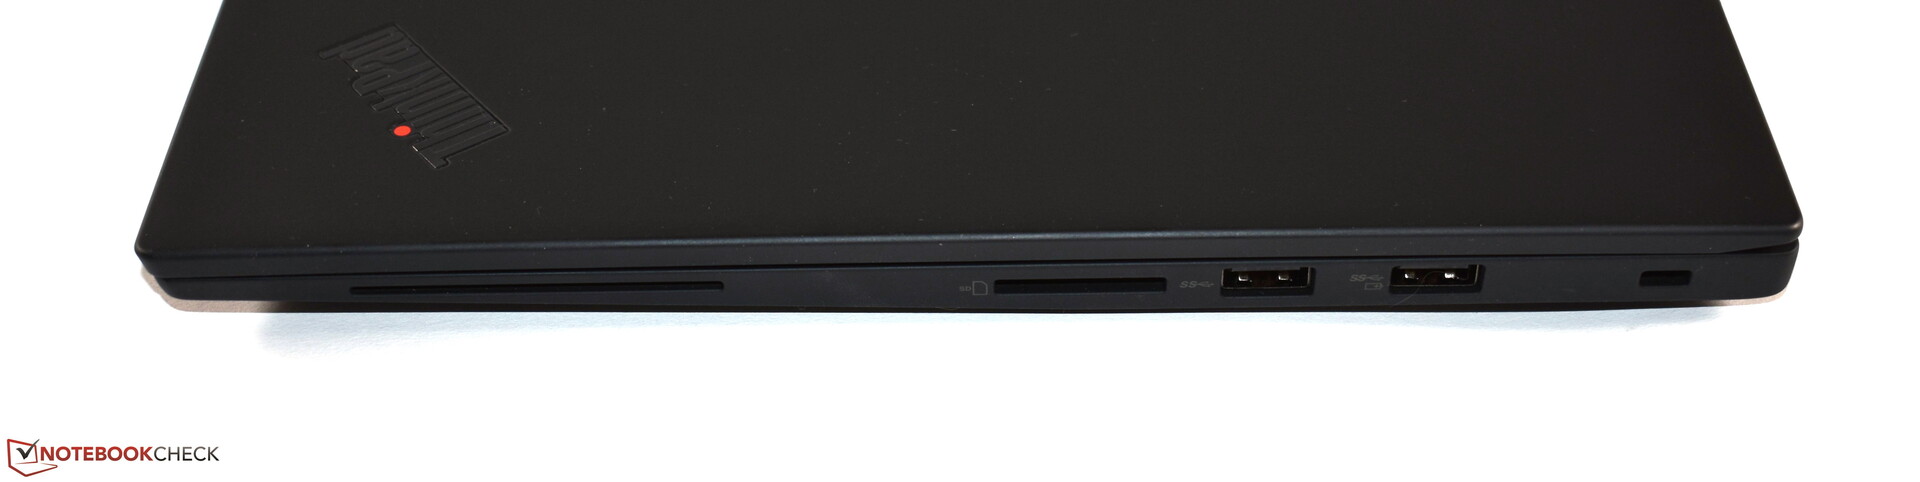
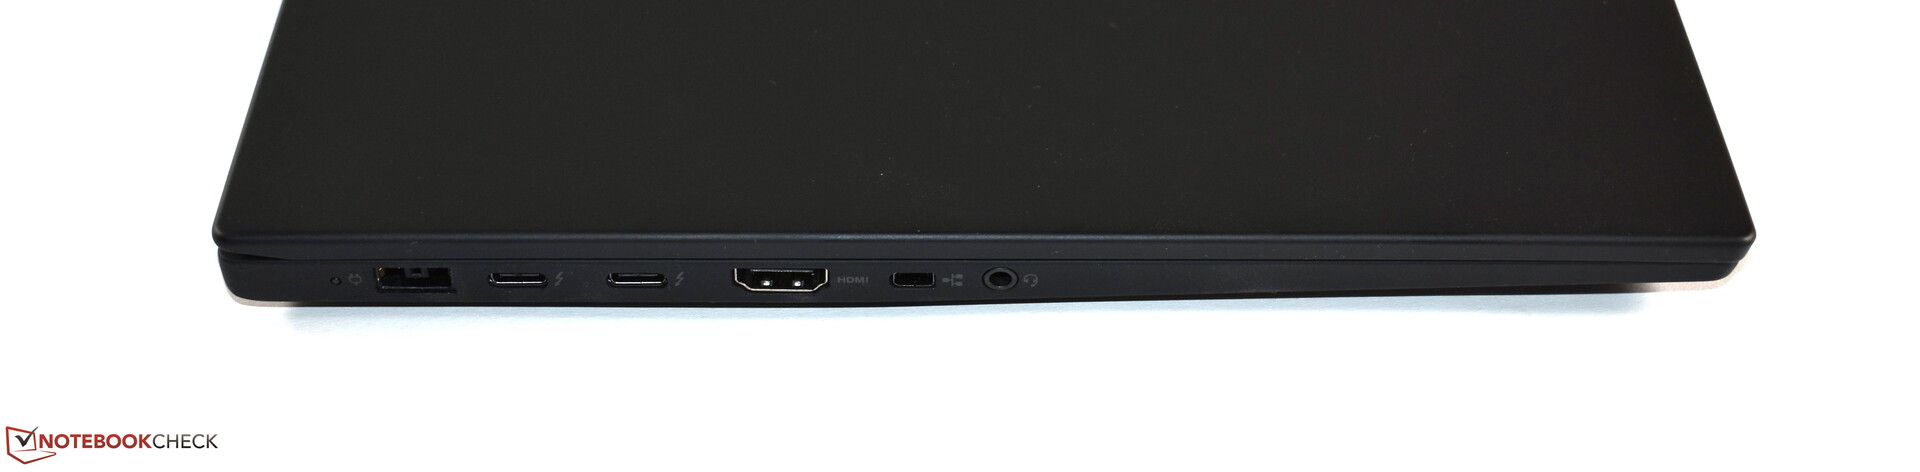
由碳,镁和铝制成的外壳继续保持一贯的高品质,并且与具有触摸屏的前代产品相比,显示屏盖不会发出吱吱作响的声音。黑色磨砂外壳包含出色的输入设备和众多接口。此外,ThinkPad P1 Gen 2仍然易于维护和升级(2个SO-DIMM RAM,2个2280-M.2 SSD)。今年的新增功能包括一些显示选项,例如我们测试装置中的Full HD HDR显示屏,该显示屏具有超过500 cd /m²的超高亮度,令人信服。不幸的是,它不能达到100%的sRGB覆盖。Quadro T1000也是新产品,它作为ThinkPad P1 Gen 2的入门级选项仍比之前的Nvidia Quadro P2000 Max-Q强。其他优点包括安静的散热系统和三年的保修期。
作为ThinkPad P1 Gen 2的主要缺点,CPU性能显而易见。这不是很糟糕,但是恰恰相反:ThinkPad P1 2019是一款非常强大的笔记本电脑。但是,总的来说,我们仍然需要指出,CPU性能居然低于先前的机型。因此,就此而言,新的ThinkPad P1根本不是升级。其他不利因素包括缺少WWAN选项,中等的续航时间,高昂的价格以及令人讨厌的线圈鸣叫声。
更差的CPU但更好的GPU和更亮的屏幕:ThinkPad P1(2019)与之前版本相比的变化可以就这样简单的总结一下
如果您权衡一下利弊,则“利“显然会在ThinkPad P1 Gen 2中脱颖而出。购买者将获得质量极高且配备精良的移动工作站,其显示效果令人难以置信。与ThinkPad P1 2018和许多类似版本的较旧工作站笔记本电脑相比, Nvidia Quadro T1000代表了良好的性能升级,但CPU性能是ThinkPad P1 2019的弱点。
Lenovo ThinkPad P1 2019-20QT000RGE
- 10/22/2019 v7 (old)
Benjamin Herzig
Price comparison

