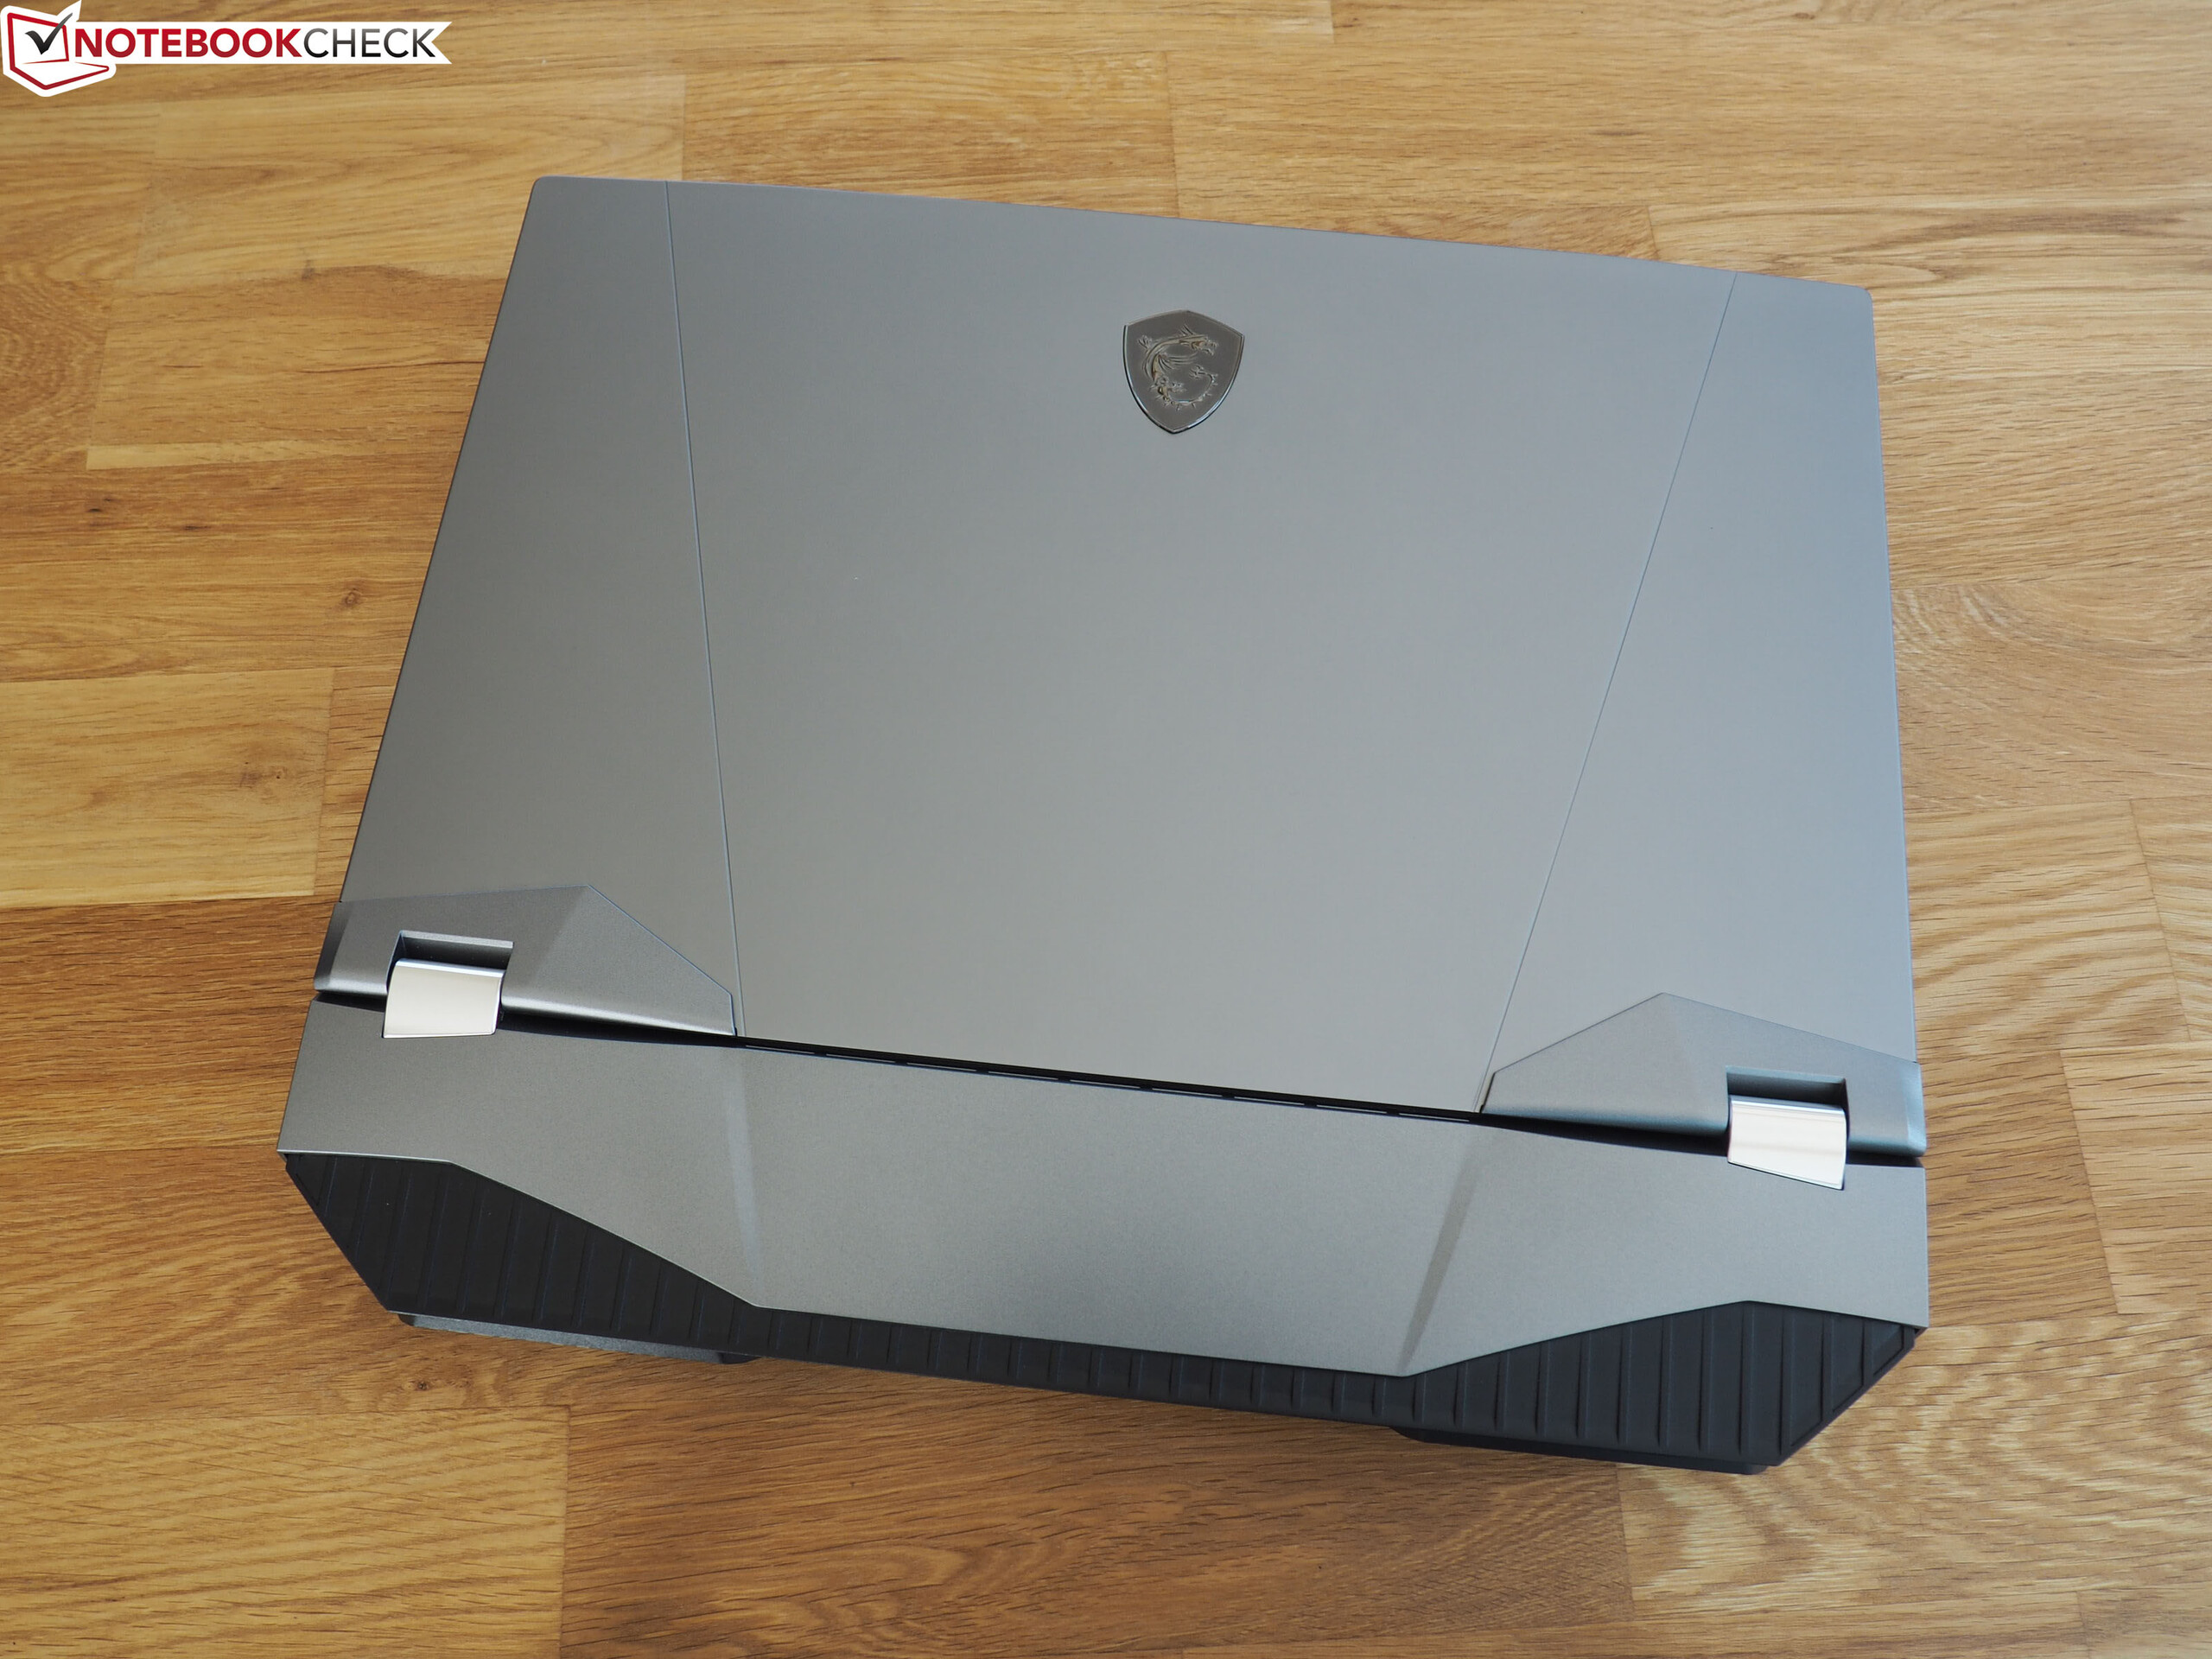
MSI GT76 9SG 笔记本电脑评测:游戏巨人
| |||||||||||||||||||||||||
Brightness Distribution: 89 %
Center on Battery: 396 cd/m²
Contrast: 1200:1 (Black: 0.33 cd/m²)
ΔE ColorChecker Calman: 2.04 | ∀{0.5-29.43 Ø4.73}
calibrated: 0.82
ΔE Greyscale Calman: 2.83 | ∀{0.09-98 Ø4.97}
94% sRGB (Argyll 1.6.3 3D)
59% AdobeRGB 1998 (Argyll 1.6.3 3D)
64.3% AdobeRGB 1998 (Argyll 3D)
93.4% sRGB (Argyll 3D)
62.3% Display P3 (Argyll 3D)
Gamma: 2.49
CCT: 7113 K
| MSI GT76 Titan DT 9SG Chi Mei N173HCE-G33 (CMN175C), IPS, 1920x1080 | Alienware Area-51m i9-9900K RTX 2080 LG Philips 173WFG, IPS, 1920x1080 | Schenker XMG Ultra 17 Turing AU Optronics B173ZAN01.0 (AUO109B), IPS, 3840x2160 | MSI GE75 9SG Chi Mei N173HCE-G33, AHVA, 1920x1080 | Asus ROG G703GX AU Optronics B173HAN03.2 (AUO329D), IPS, 1920x1080 | |
|---|---|---|---|---|---|
| Display | 4% | 33% | -1% | 2% | |
| Display P3 Coverage (%) | 62.3 | 66.3 6% | 86.3 39% | 61.5 -1% | 64.1 3% |
| sRGB Coverage (%) | 93.4 | 96.9 4% | 100 7% | 92 -1% | 93.3 0% |
| AdobeRGB 1998 Coverage (%) | 64.3 | 66.5 3% | 99.1 54% | 63.5 -1% | 65.6 2% |
| Response Times | -37% | -268% | 22% | 7% | |
| Response Time Grey 50% / Grey 80% * (ms) | 8 ? | 13.2 ? -65% | 41.6 ? -420% | 7.2 ? 10% | 7.2 ? 10% |
| Response Time Black / White * (ms) | 10 ? | 10.8 ? -8% | 21.6 ? -116% | 6.6 ? 34% | 9.6 ? 4% |
| PWM Frequency (Hz) | 26040 ? | 26040 ? | |||
| Screen | -31% | -33% | 2% | -44% | |
| Brightness middle (cd/m²) | 396 | 335.2 -15% | 343 -13% | 400.7 1% | 296 -25% |
| Brightness (cd/m²) | 373 | 297 -20% | 328 -12% | 372 0% | 279 -25% |
| Brightness Distribution (%) | 89 | 82 -8% | 82 -8% | 89 0% | 85 -4% |
| Black Level * (cd/m²) | 0.33 | 0.66 -100% | 0.31 6% | 0.34 -3% | 0.25 24% |
| Contrast (:1) | 1200 | 508 -58% | 1106 -8% | 1179 -2% | 1184 -1% |
| Colorchecker dE 2000 * | 2.04 | 2.02 1% | 5.03 -147% | 1.33 35% | 4.77 -134% |
| Colorchecker dE 2000 max. * | 3.85 | 7.23 -88% | 7.91 -105% | 3.51 9% | 9.08 -136% |
| Colorchecker dE 2000 calibrated * | 0.82 | 1.17 -43% | 0.86 -5% | 1.39 -70% | 1.46 -78% |
| Greyscale dE 2000 * | 2.83 | 3.2 -13% | 6.29 -122% | 1.3 54% | 5.83 -106% |
| Gamma | 2.49 88% | 2.16 102% | 2.38 92% | 2.24 98% | 2.47 89% |
| CCT | 7113 91% | 6746 96% | 6389 102% | 6735 97% | 8076 80% |
| Color Space (Percent of AdobeRGB 1998) (%) | 59 | 61.3 4% | 88 49% | 58.2 -1% | 60 2% |
| Color Space (Percent of sRGB) (%) | 94 | 96.9 3% | 100 6% | 92.1 -2% | 93 -1% |
| Total Average (Program / Settings) | -21% /
-25% | -89% /
-50% | 8% /
4% | -12% /
-29% |
* ... smaller is better
Display Response Times
| ↔ Response Time Black to White | ||
|---|---|---|
| 10 ms ... rise ↗ and fall ↘ combined | ↗ 5.2 ms rise | 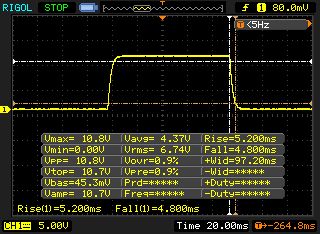 |
| ↘ 4.8 ms fall | ||
| The screen shows good response rates in our tests, but may be too slow for competitive gamers. In comparison, all tested devices range from 0.1 (minimum) to 240 (maximum) ms. » 27 % of all devices are better. This means that the measured response time is better than the average of all tested devices (19.9 ms). | ||
| ↔ Response Time 50% Grey to 80% Grey | ||
| 8 ms ... rise ↗ and fall ↘ combined | ↗ 4.4 ms rise | 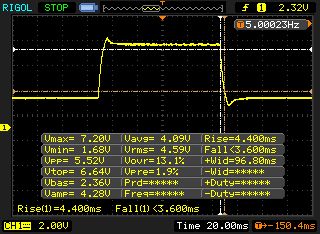 |
| ↘ 3.6 ms fall | ||
| The screen shows fast response rates in our tests and should be suited for gaming. In comparison, all tested devices range from 0.165 (minimum) to 636 (maximum) ms. » 21 % of all devices are better. This means that the measured response time is better than the average of all tested devices (31.1 ms). | ||
Screen Flickering / PWM (Pulse-Width Modulation)
| Screen flickering / PWM detected | 26040 Hz | ≤ 20 % brightness setting | 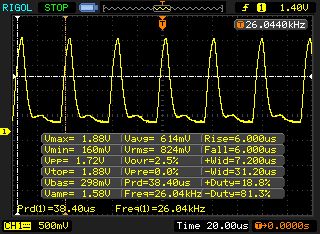 |
The display backlight flickers at 26040 Hz (worst case, e.g., utilizing PWM) Flickering detected at a brightness setting of 20 % and below. There should be no flickering or PWM above this brightness setting. The frequency of 26040 Hz is quite high, so most users sensitive to PWM should not notice any flickering. In comparison: 52 % of all tested devices do not use PWM to dim the display. If PWM was detected, an average of 7791 (minimum: 5 - maximum: 343500) Hz was measured. | |||
| Cinebench R20 | |
| CPU (Single Core) | |
| Average of class Gaming (442 - 895, n=109, last 2 years) | |
| MSI GT76 Titan DT 9SG | |
| MSI GE75 9SG | |
| CPU (Multi Core) | |
| Average of class Gaming (4029 - 16108, n=109, last 2 years) | |
| MSI GT76 Titan DT 9SG | |
| MSI GE75 9SG | |
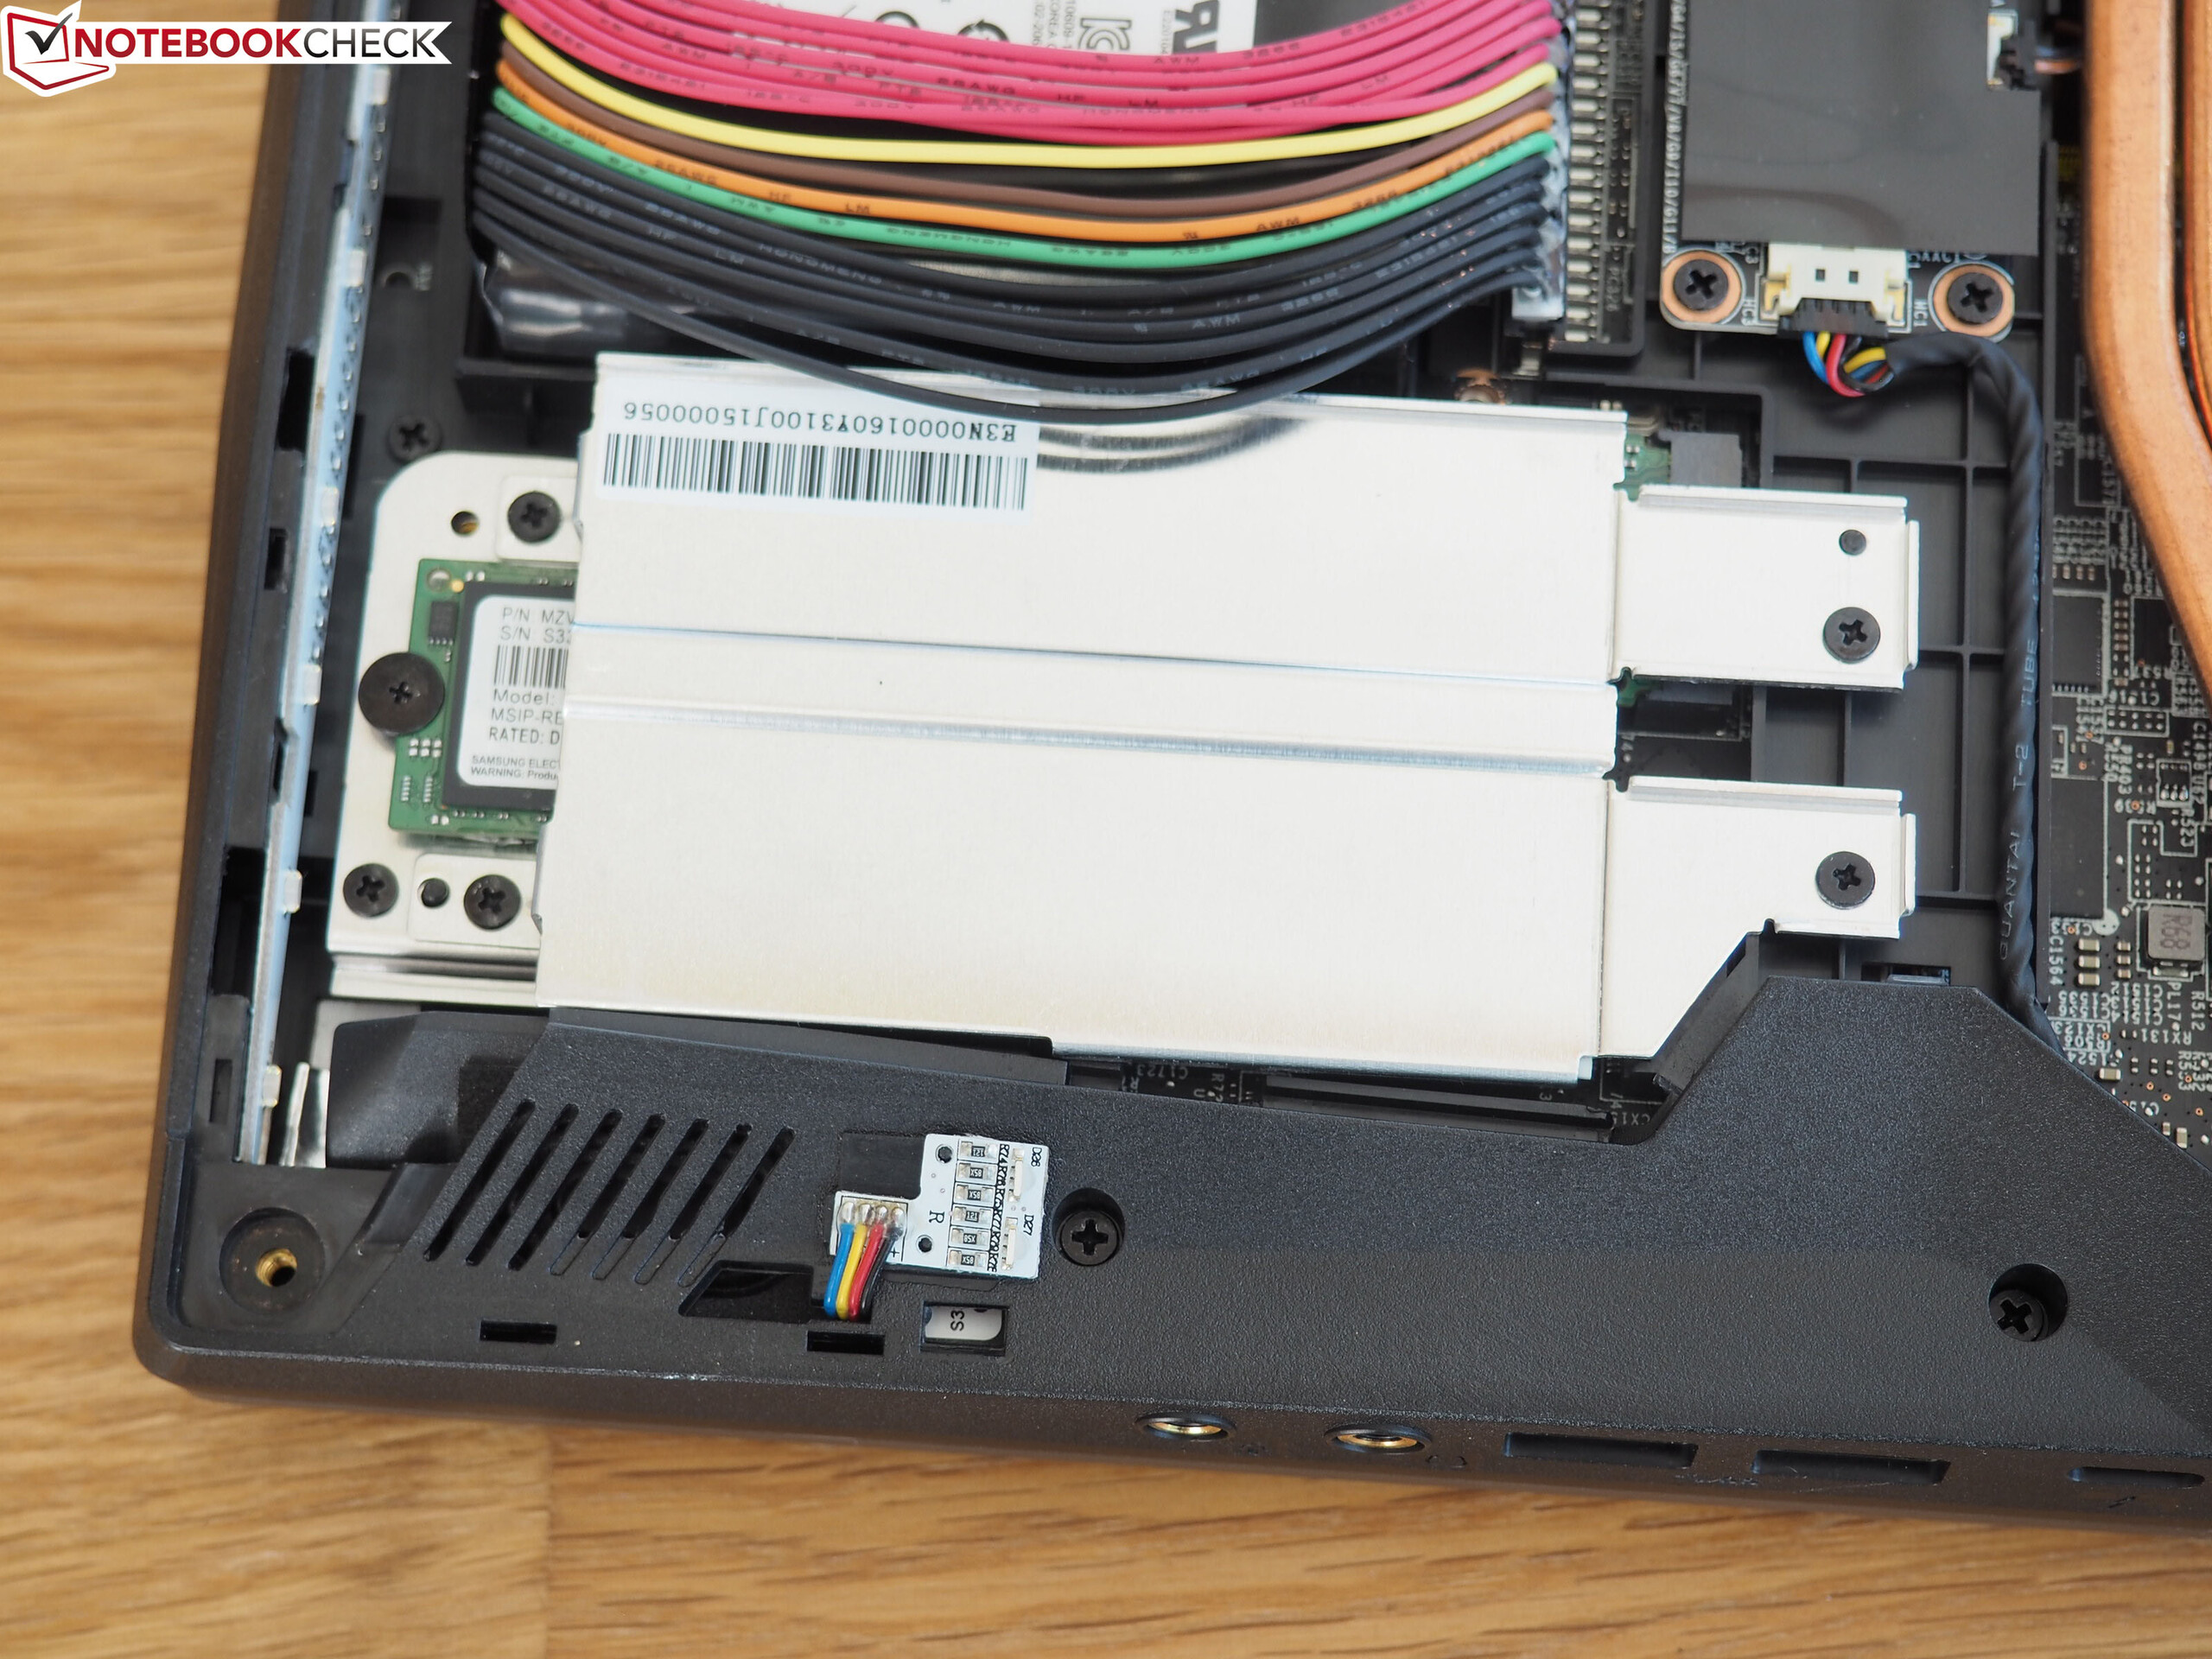
| MSI GT76 Titan DT 9SG 2x Samsung PM961 MZVLW256HEHP (RAID 0) | Alienware Area-51m i9-9900K RTX 2080 2x SK Hynix PC400 512GB (RAID 0) | Schenker XMG Ultra 17 Turing Samsung SSD 970 EVO Plus 500GB | MSI GE75 9SG Samsung SSD PM981 MZVLB1T0HALR | Asus ROG G703GX Samsung SSD PM981 MZVLB512HAJQ | |
|---|---|---|---|---|---|
| CrystalDiskMark 5.2 / 6 | 20% | 25% | -3% | -15% | |
| Write 4K (MB/s) | 101.4 | 111.1 10% | 183.2 81% | 116.1 14% | 90.4 -11% |
| Read 4K (MB/s) | 40.57 | 45.47 12% | 52.4 29% | 44.98 11% | 39.19 -3% |
| Write Seq (MB/s) | 2229 | 2454 10% | 1790 -20% | 2370 6% | 1863 -16% |
| Read Seq (MB/s) | 2528 | 2212 -12% | 1743 -31% | 1465 -42% | 2100 -17% |
| Write 4K Q32T1 (MB/s) | 379.6 | 622 64% | 550 45% | 337.5 -11% | 260.2 -31% |
| Read 4K Q32T1 (MB/s) | 421.9 | 695 65% | 648 54% | 453.6 8% | 297 -30% |
| Write Seq Q32T1 (MB/s) | 2439 | 2675 10% | 3236 33% | 2399 -2% | 1870 -23% |
| Read Seq Q32T1 (MB/s) | 3199 | 3184 0% | 3538 11% | 3087 -4% | 3471 9% |
| 3DMark Cloud Gate Standard Score | 58737 points | |
| 3DMark Fire Strike Score | 21988 points | |
| 3DMark Time Spy Score | 10290 points | |
Help | ||
| The Witcher 3 - 1920x1080 Ultra Graphics & Postprocessing (HBAO+) | |
| Average of class Gaming (95 - 240, n=8, last 2 years) | |
| Alienware Area-51m i9-9900K RTX 2080 | |
| MSI GT76 Titan DT 9SG | |
| Asus ROG G703GX | |
| MSI GE75 9SG | |
| Schenker XMG Ultra 17 Turing | |
| low | med. | high | ultra | QHD | 4K | |
|---|---|---|---|---|---|---|
| The Witcher 3 (2015) | 186 | 100 | 66.9 | |||
| Apex Legends (2019) | 144 | 144 | 144 | 128 | 75 | |
| Far Cry New Dawn (2019) | 128 | 121 | 108 | 96 | 57 | |
| Metro Exodus (2019) | 109 | 82.2 | 68.3 | 54.4 | 35.6 | |
| Anthem (2019) | 130 | 120 | 112 | 83.7 | 48.6 | |
| Dirt Rally 2.0 (2019) | 212 | 171 | 101 | 79.2 | ||
| The Division 2 (2019) | 169 | 136 | 103 | 72 | 40 | |
| Anno 1800 (2019) | 115 | 92.2 | 54.3 | 47.8 | 34.9 | |
| Rage 2 (2019) | 144 | 122 | 119 | 78.1 | 39.1 |
Noise level
| Idle |
| 33 / 34 / 44 dB(A) |
| Load |
| 47 / 59 dB(A) |
 | ||
30 dB silent 40 dB(A) audible 50 dB(A) loud |
||
min: | ||
| MSI GT76 Titan DT 9SG i9-9900K, GeForce RTX 2080 Mobile | Alienware Area-51m i9-9900K RTX 2080 i9-9900K, GeForce RTX 2080 Mobile | Schenker XMG Ultra 17 Turing i9-9900K, GeForce RTX 2080 Mobile | MSI GE75 9SG i9-9880H, GeForce RTX 2080 Mobile | Asus ROG G703GX i7-8750H, GeForce RTX 2080 Mobile | Average of class Gaming | |
|---|---|---|---|---|---|---|
| Noise | 4% | 5% | 10% | 5% | 18% | |
| off / environment * (dB) | 30 | 28.1 6% | 30 -0% | 28.2 6% | 30 -0% | 24.1 ? 20% |
| Idle Minimum * (dB) | 33 | 28.1 15% | 30 9% | 30.4 8% | 30 9% | 25.8 ? 22% |
| Idle Average * (dB) | 34 | 28.6 16% | 33 3% | 30.4 11% | 35 -3% | 27.4 ? 19% |
| Idle Maximum * (dB) | 44 | 51 -16% | 35 20% | 33.4 24% | 41 7% | 29.9 ? 32% |
| Load Average * (dB) | 47 | 51 -9% | 44 6% | 37.1 21% | 44 6% | 43 ? 9% |
| Witcher 3 ultra * (dB) | 53 | 51 4% | 55 -4% | 54.2 -2% | 51 4% | |
| Load Maximum * (dB) | 59 | 51 14% | 58 2% | 56.4 4% | 52 12% | 54 ? 8% |
* ... smaller is better
(-) The maximum temperature on the upper side is 51 °C / 124 F, compared to the average of 40.4 °C / 105 F, ranging from 21.2 to 68.8 °C for the class Gaming.
(-) The bottom heats up to a maximum of 57 °C / 135 F, compared to the average of 43.2 °C / 110 F
(+) In idle usage, the average temperature for the upper side is 25.3 °C / 78 F, compared to the device average of 33.9 °C / 93 F.
(-) Playing The Witcher 3, the average temperature for the upper side is 41.4 °C / 107 F, compared to the device average of 33.9 °C / 93 F.
(±) The palmrests and touchpad can get very hot to the touch with a maximum of 37 °C / 98.6 F.
(-) The average temperature of the palmrest area of similar devices was 28.8 °C / 83.8 F (-8.2 °C / -14.8 F).
| MSI GT76 Titan DT 9SG i9-9900K, GeForce RTX 2080 Mobile | Alienware Area-51m i9-9900K RTX 2080 i9-9900K, GeForce RTX 2080 Mobile | Schenker XMG Ultra 17 Turing i9-9900K, GeForce RTX 2080 Mobile | MSI GE75 9SG i9-9880H, GeForce RTX 2080 Mobile | Asus ROG G703GX i7-8750H, GeForce RTX 2080 Mobile | Average of class Gaming | |
|---|---|---|---|---|---|---|
| Heat | -10% | -6% | -21% | -5% | -4% | |
| Maximum Upper Side * (°C) | 51 | 47 8% | 45 12% | 48.8 4% | 50 2% | 45.2 ? 11% |
| Maximum Bottom * (°C) | 57 | 58.8 -3% | 45 21% | 52 9% | 50 12% | 47.9 ? 16% |
| Idle Upper Side * (°C) | 26 | 31 -19% | 36 -38% | 36.2 -39% | 30 -15% | 31.1 ? -20% |
| Idle Bottom * (°C) | 28 | 35 -25% | 33 -18% | 44.4 -59% | 33 -18% | 34.2 ? -22% |
* ... smaller is better
MSI GT76 Titan DT 9SG audio analysis
(+) | speakers can play relatively loud (90 dB)
Bass 100 - 315 Hz
(±) | reduced bass - on average 7.6% lower than median
(±) | linearity of bass is average (11% delta to prev. frequency)
Mids 400 - 2000 Hz
(±) | higher mids - on average 7% higher than median
(±) | linearity of mids is average (7.2% delta to prev. frequency)
Highs 2 - 16 kHz
(+) | balanced highs - only 3.8% away from median
(+) | highs are linear (4.5% delta to prev. frequency)
Overall 100 - 16.000 Hz
(+) | overall sound is linear (13.1% difference to median)
Compared to same class
» 18% of all tested devices in this class were better, 4% similar, 78% worse
» The best had a delta of 6%, average was 18%, worst was 132%
Compared to all devices tested
» 13% of all tested devices were better, 3% similar, 84% worse
» The best had a delta of 4%, average was 24%, worst was 134%
MSI GT75 8RG-090 Titan audio analysis
(+) | speakers can play relatively loud (94 dB)
Bass 100 - 315 Hz
(±) | reduced bass - on average 9.4% lower than median
(±) | linearity of bass is average (8.7% delta to prev. frequency)
Mids 400 - 2000 Hz
(±) | higher mids - on average 6.8% higher than median
(±) | linearity of mids is average (8.4% delta to prev. frequency)
Highs 2 - 16 kHz
(±) | higher highs - on average 5% higher than median
(±) | linearity of highs is average (7.8% delta to prev. frequency)
Overall 100 - 16.000 Hz
(+) | overall sound is linear (14.4% difference to median)
Compared to same class
» 27% of all tested devices in this class were better, 7% similar, 66% worse
» The best had a delta of 6%, average was 18%, worst was 132%
Compared to all devices tested
» 18% of all tested devices were better, 4% similar, 78% worse
» The best had a delta of 4%, average was 24%, worst was 134%
| Off / Standby | |
| Idle | |
| Load |
|
Key:
min: | |
| MSI GT76 Titan DT 9SG i9-9900K, GeForce RTX 2080 Mobile | Alienware Area-51m i9-9900K RTX 2080 i9-9900K, GeForce RTX 2080 Mobile | Schenker XMG Ultra 17 Turing i9-9900K, GeForce RTX 2080 Mobile | MSI GE75 9SG i9-9880H, GeForce RTX 2080 Mobile | Asus ROG G703GX i7-8750H, GeForce RTX 2080 Mobile | Average of class Gaming | |
|---|---|---|---|---|---|---|
| Power Consumption | -42% | -74% | 8% | -4% | 9% | |
| Idle Minimum * (Watt) | 14 | 23.3 -66% | 39 -179% | 13.9 1% | 5 64% | 13.2 ? 6% |
| Idle Average * (Watt) | 18 | 33.5 -86% | 45 -150% | 18.8 -4% | 24 -33% | 18.9 ? -5% |
| Idle Maximum * (Watt) | 23 | 38.4 -67% | 55 -139% | 23.1 -0% | 42 -83% | 24.3 ? -6% |
| Load Average * (Watt) | 114 | 114.1 -0% | 122 -7% | 112.3 1% | 112 2% | 108.3 ? 5% |
| Witcher 3 ultra * (Watt) | 283 | 339.5 -20% | 259 8% | 231 18% | 284 -0% | |
| Load Maximum * (Watt) | 443 | 485.1 -10% | 346 22% | 291.5 34% | 320 28% | 254 ? 43% |
* ... smaller is better
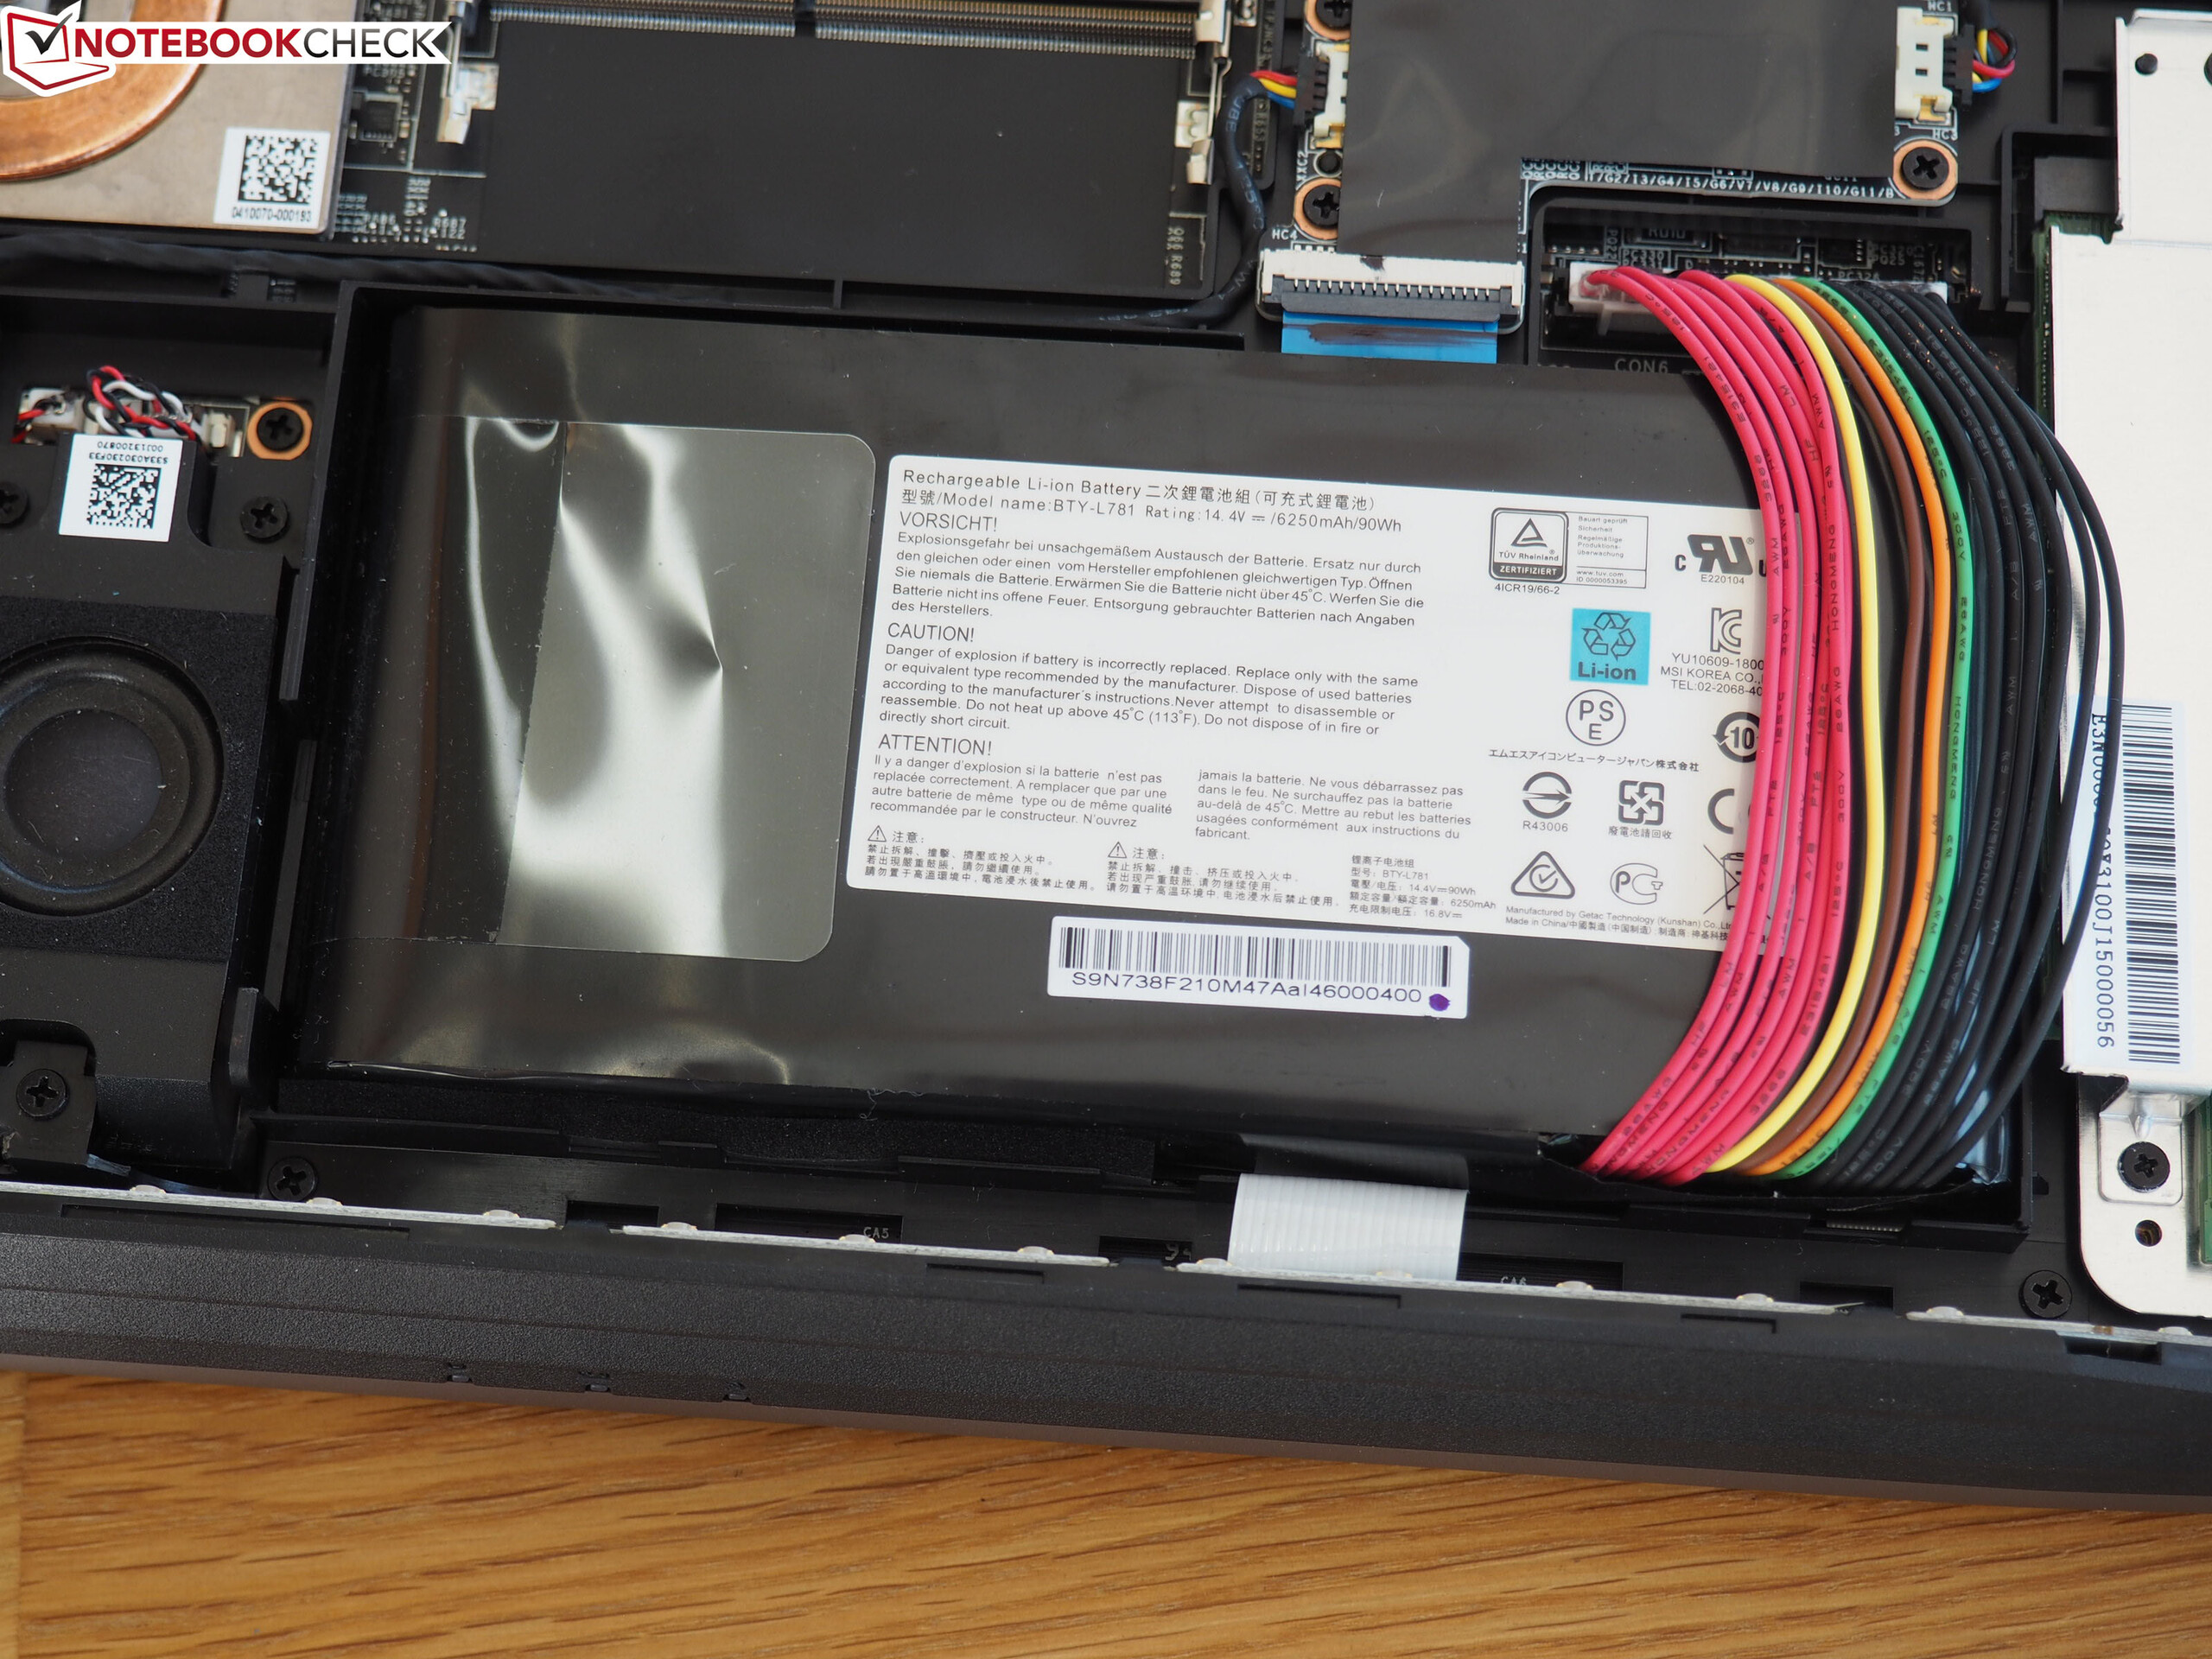
| MSI GT76 Titan DT 9SG i9-9900K, GeForce RTX 2080 Mobile, 90 Wh | Alienware Area-51m i9-9900K RTX 2080 i9-9900K, GeForce RTX 2080 Mobile, 90 Wh | Schenker XMG Ultra 17 Turing i9-9900K, GeForce RTX 2080 Mobile, 82 Wh | MSI GE75 9SG i9-9880H, GeForce RTX 2080 Mobile, 65 Wh | Asus ROG G703GX i7-8750H, GeForce RTX 2080 Mobile, 96 Wh | Average of class Gaming | |
|---|---|---|---|---|---|---|
| Battery runtime | -33% | -30% | -2% | -1% | 44% | |
| Reader / Idle (h) | 6.8 | 2.6 -62% | 2.8 -59% | 5 -26% | 8.71 ? 28% | |
| WiFi v1.3 (h) | 5 | 2.1 -58% | 2.3 -54% | 4.9 -2% | 4 -20% | 7.04 ? 41% |
| Load (h) | 0.9 | 1.1 22% | 1.1 22% | 1.3 44% | 1.47 ? 63% | |
| H.264 (h) | 2.3 | 3.8 | 8.26 ? |
Pros
Cons
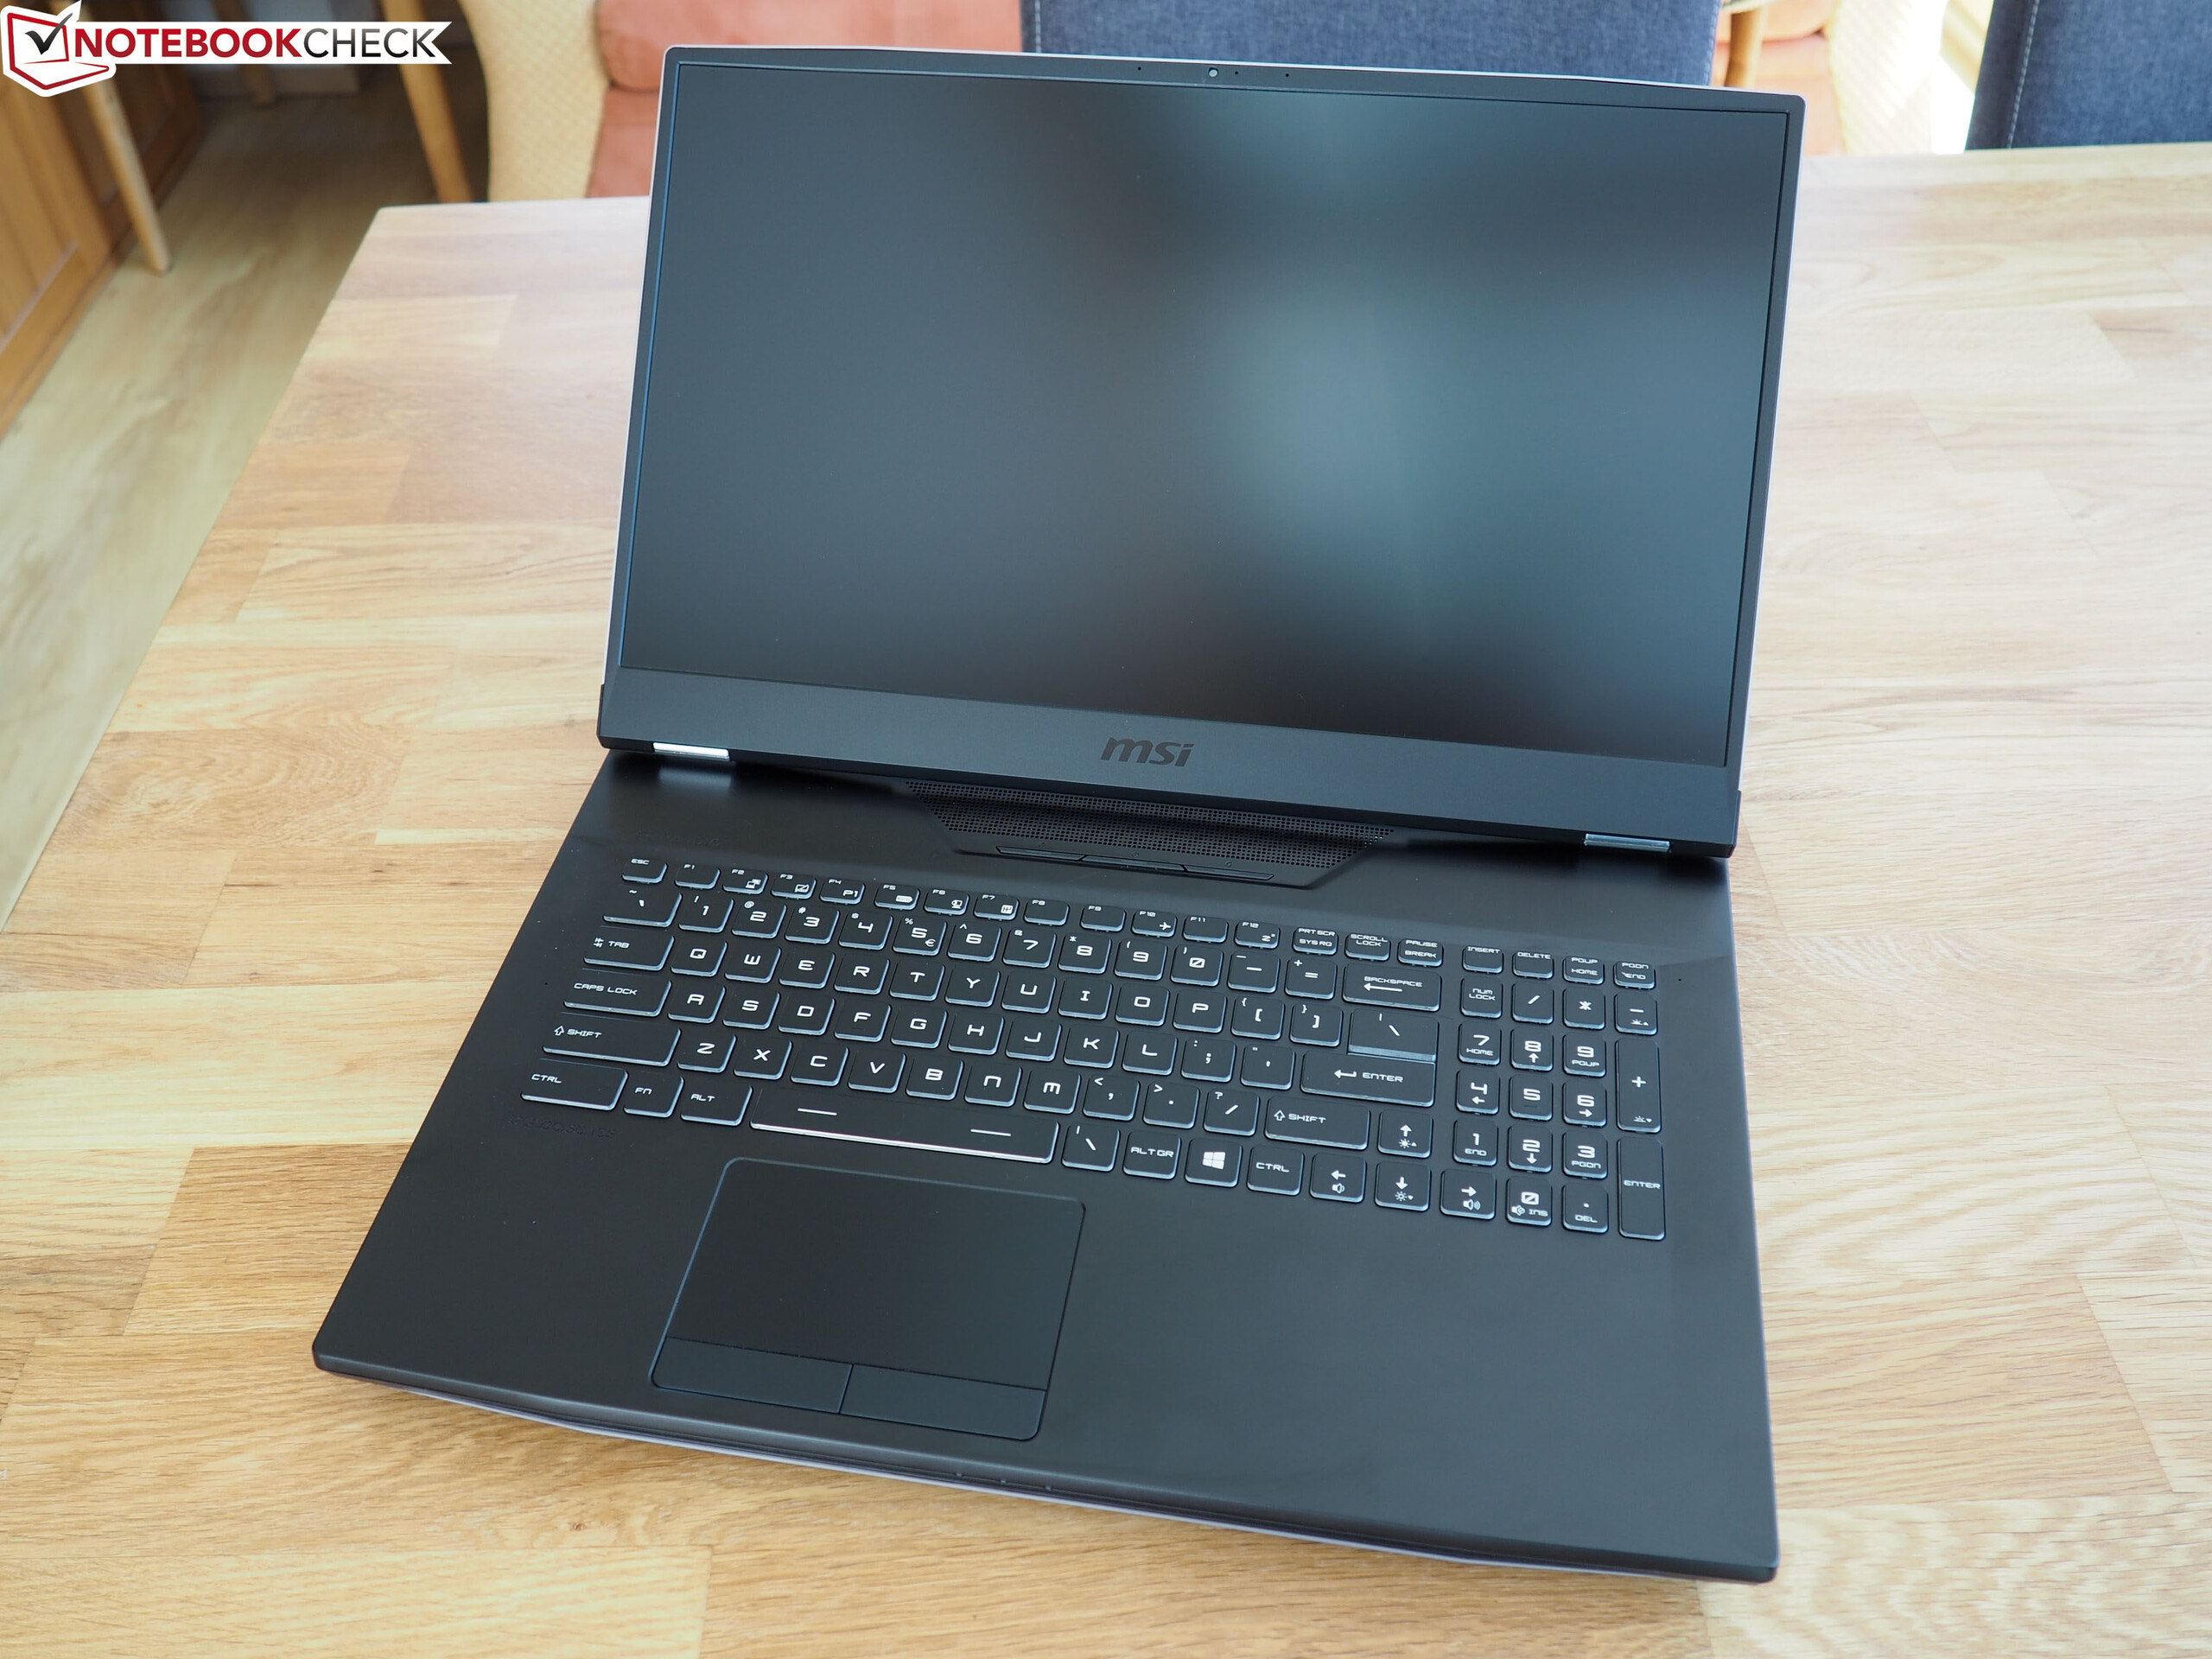
GT76 9SG Titan DT是一款非凡的游戏笔记本,至少就价格和性能而言。即使在要求极高的游戏中,它也可以实现非常高的帧率。
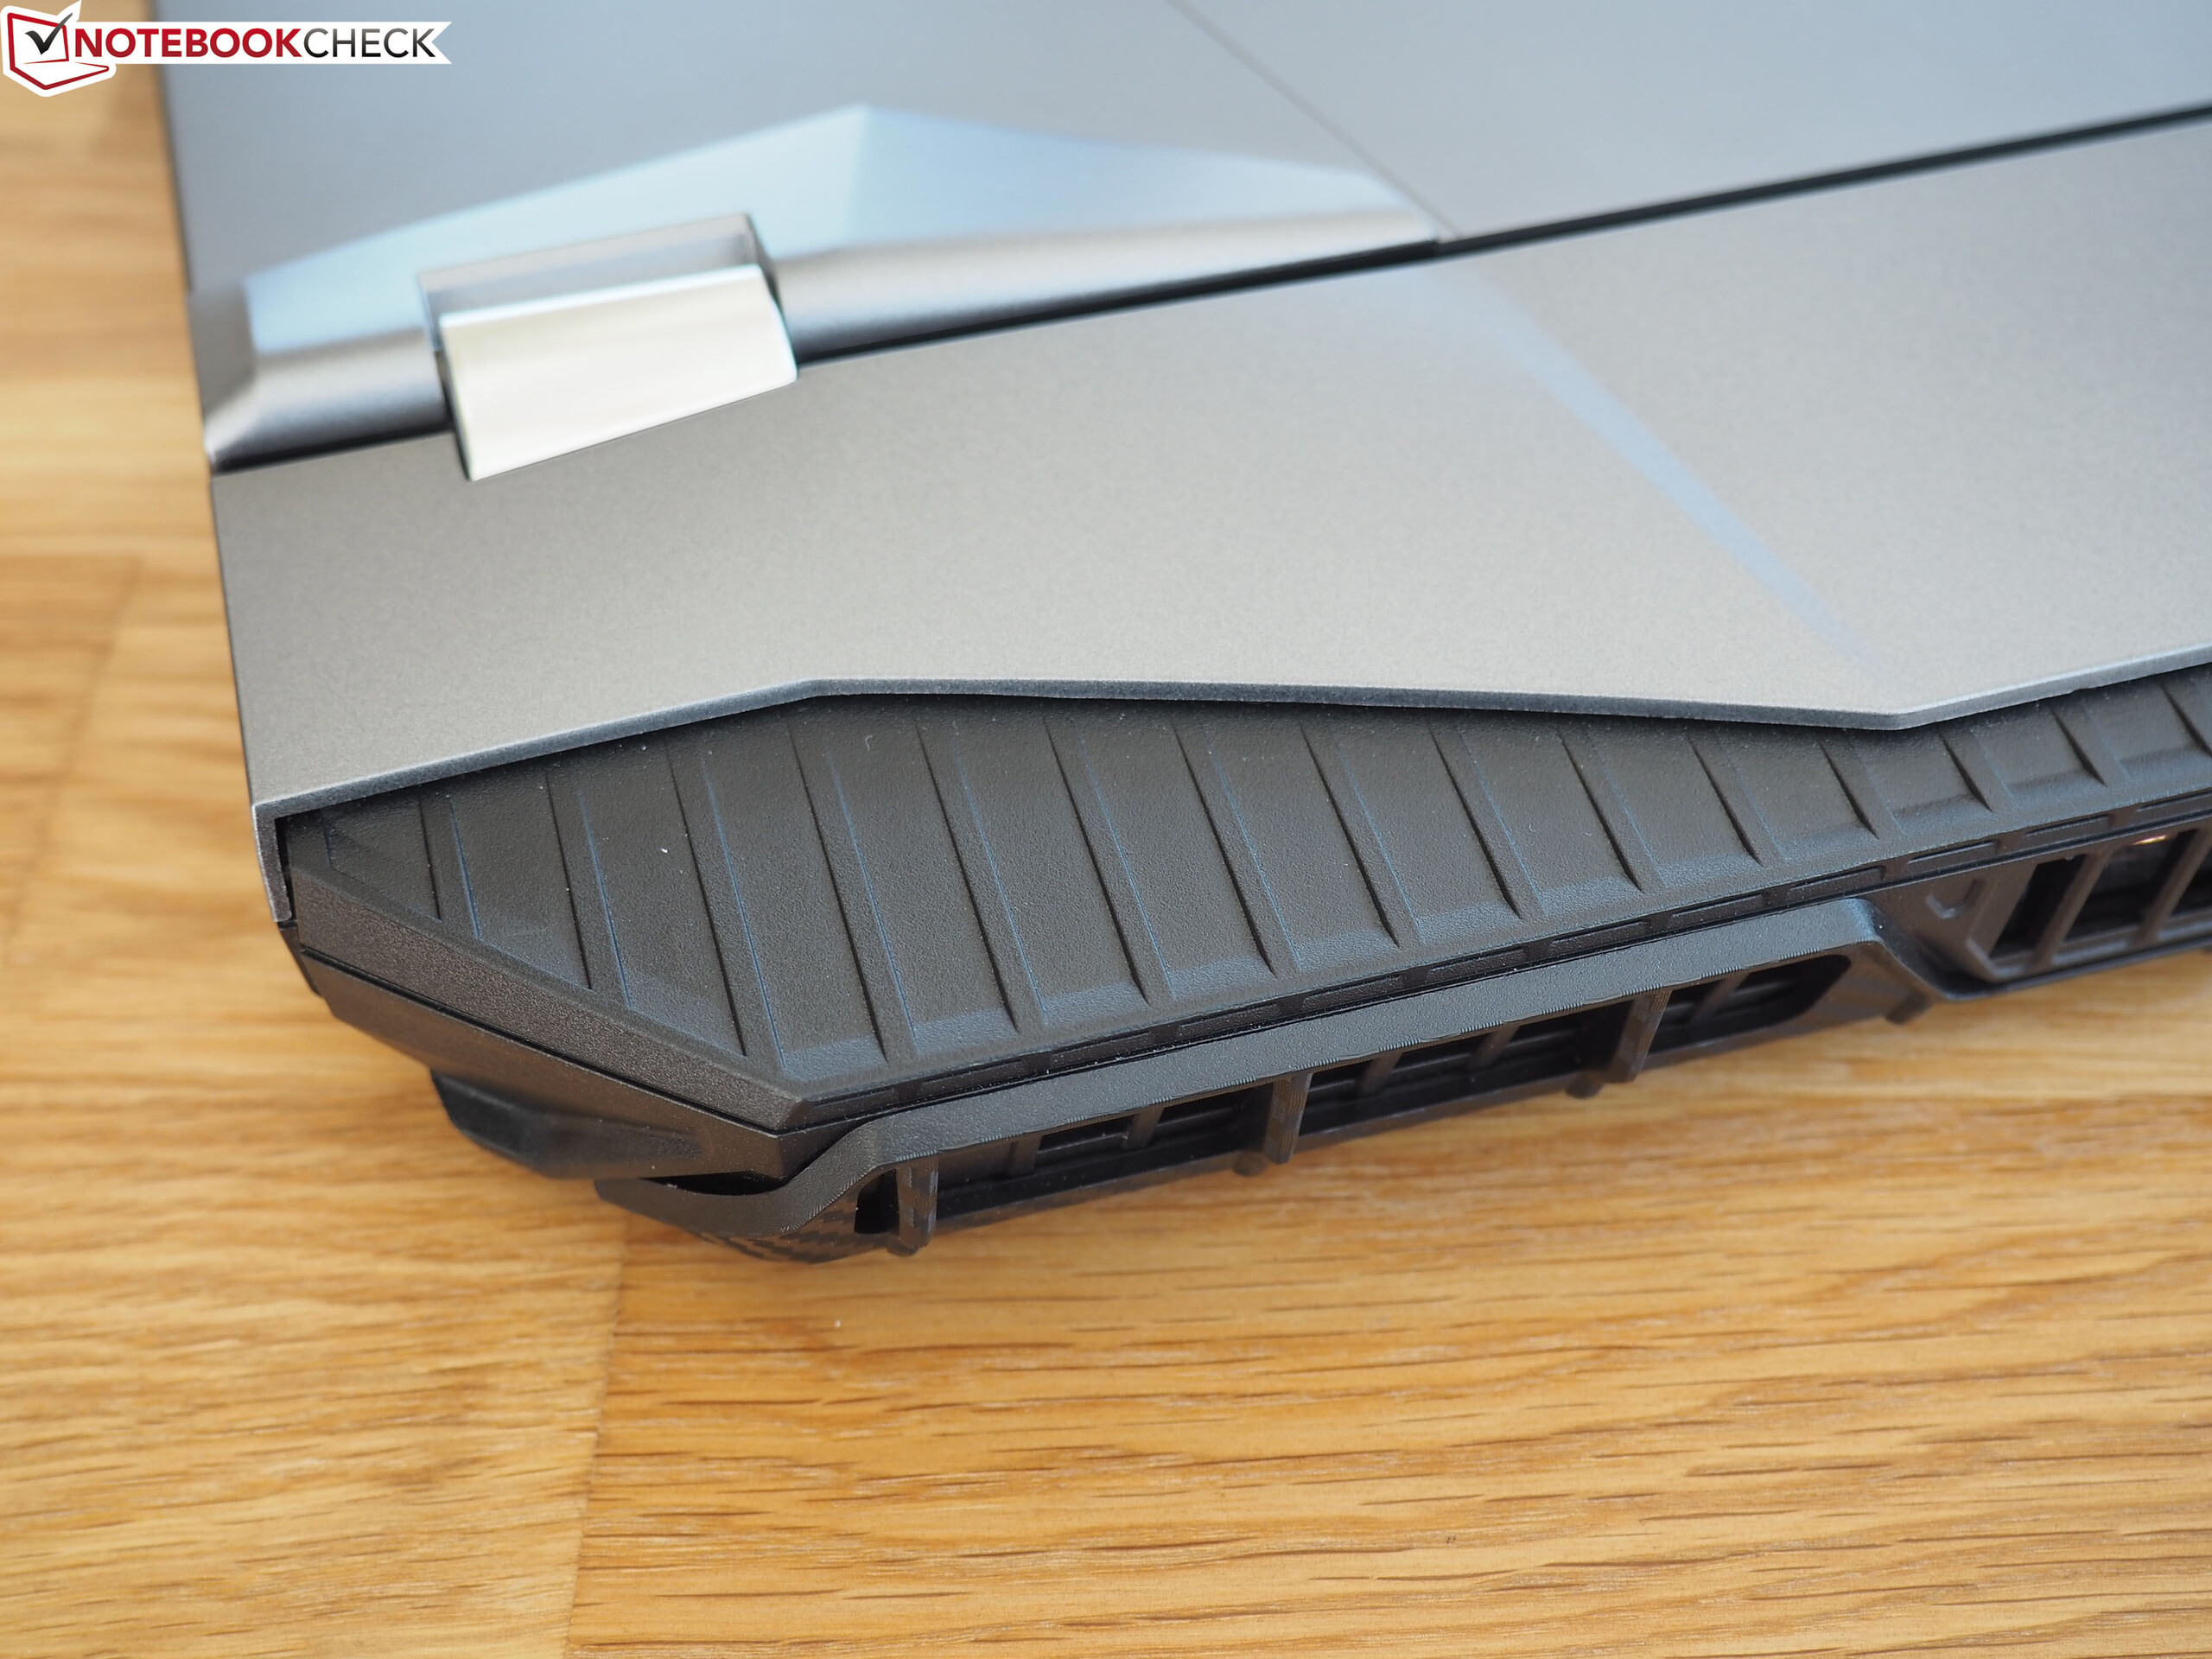
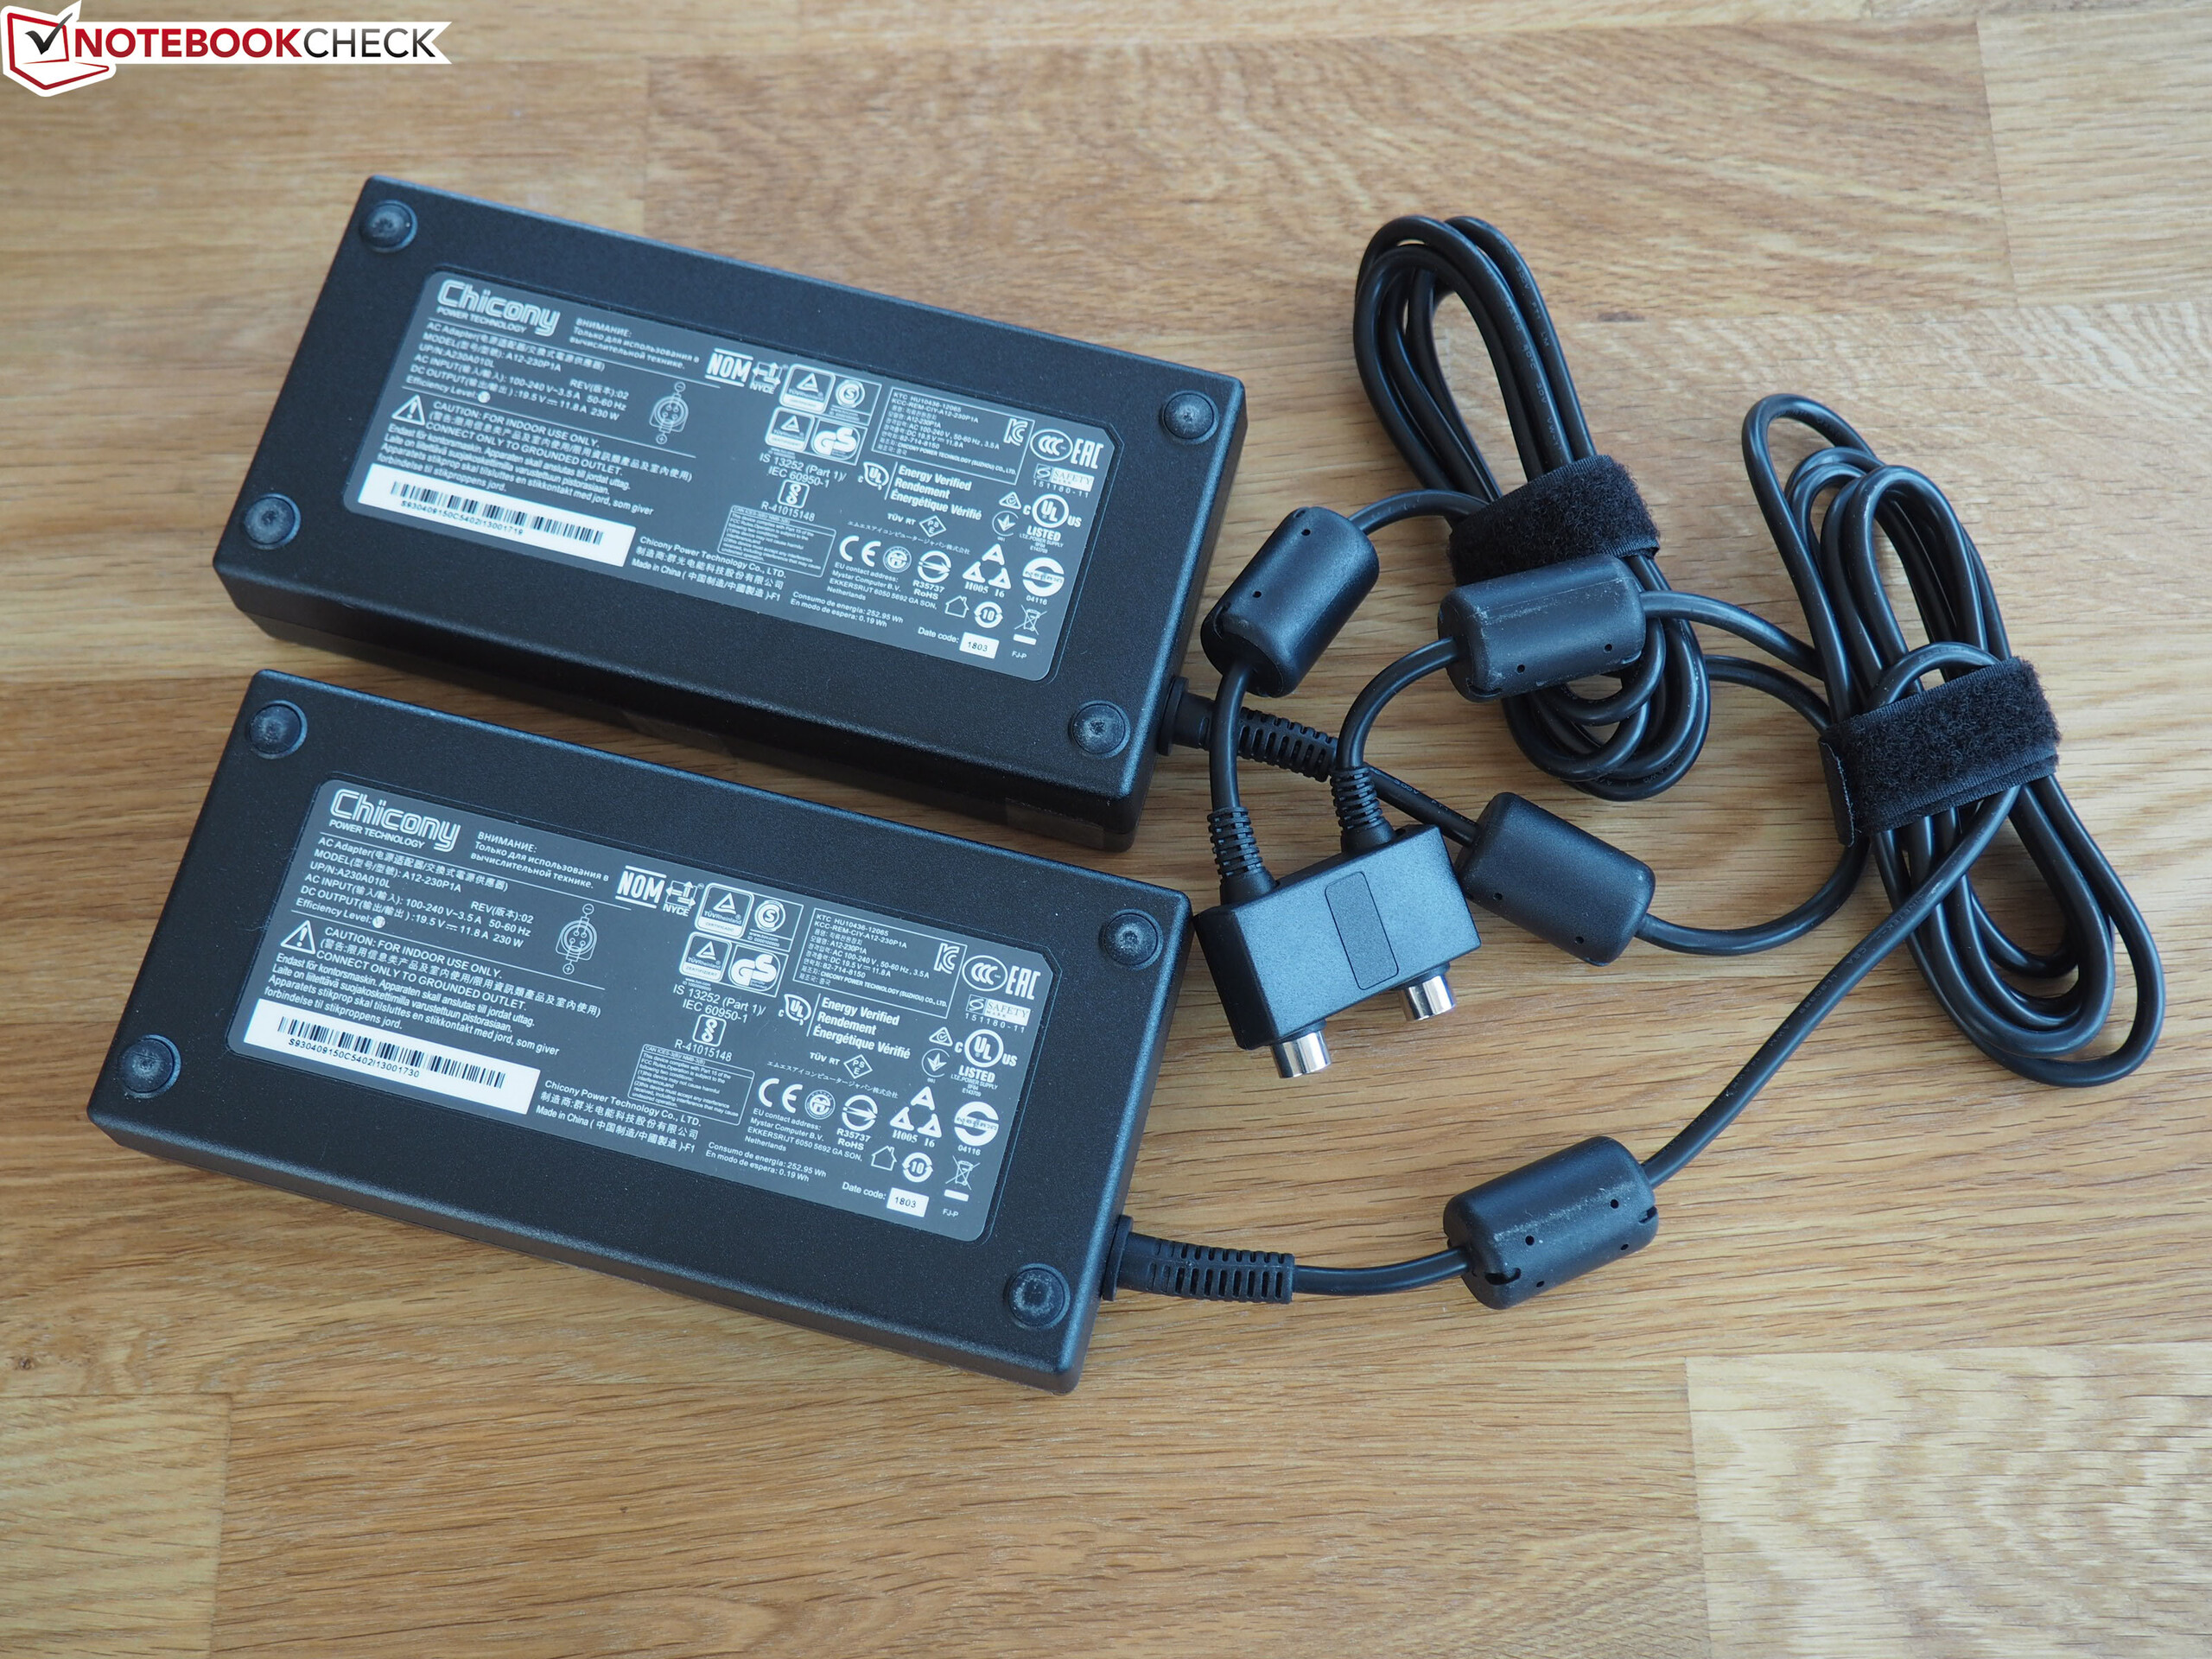
一流的性能是以牺牲安静为代价的,这可能会吓跑一些潜在用户(我们建议在GT76游戏时使用耳机)。 一旦你把沉重的重量,大的机身和两个电源适配器放在一边,真的没什么好抱怨的。
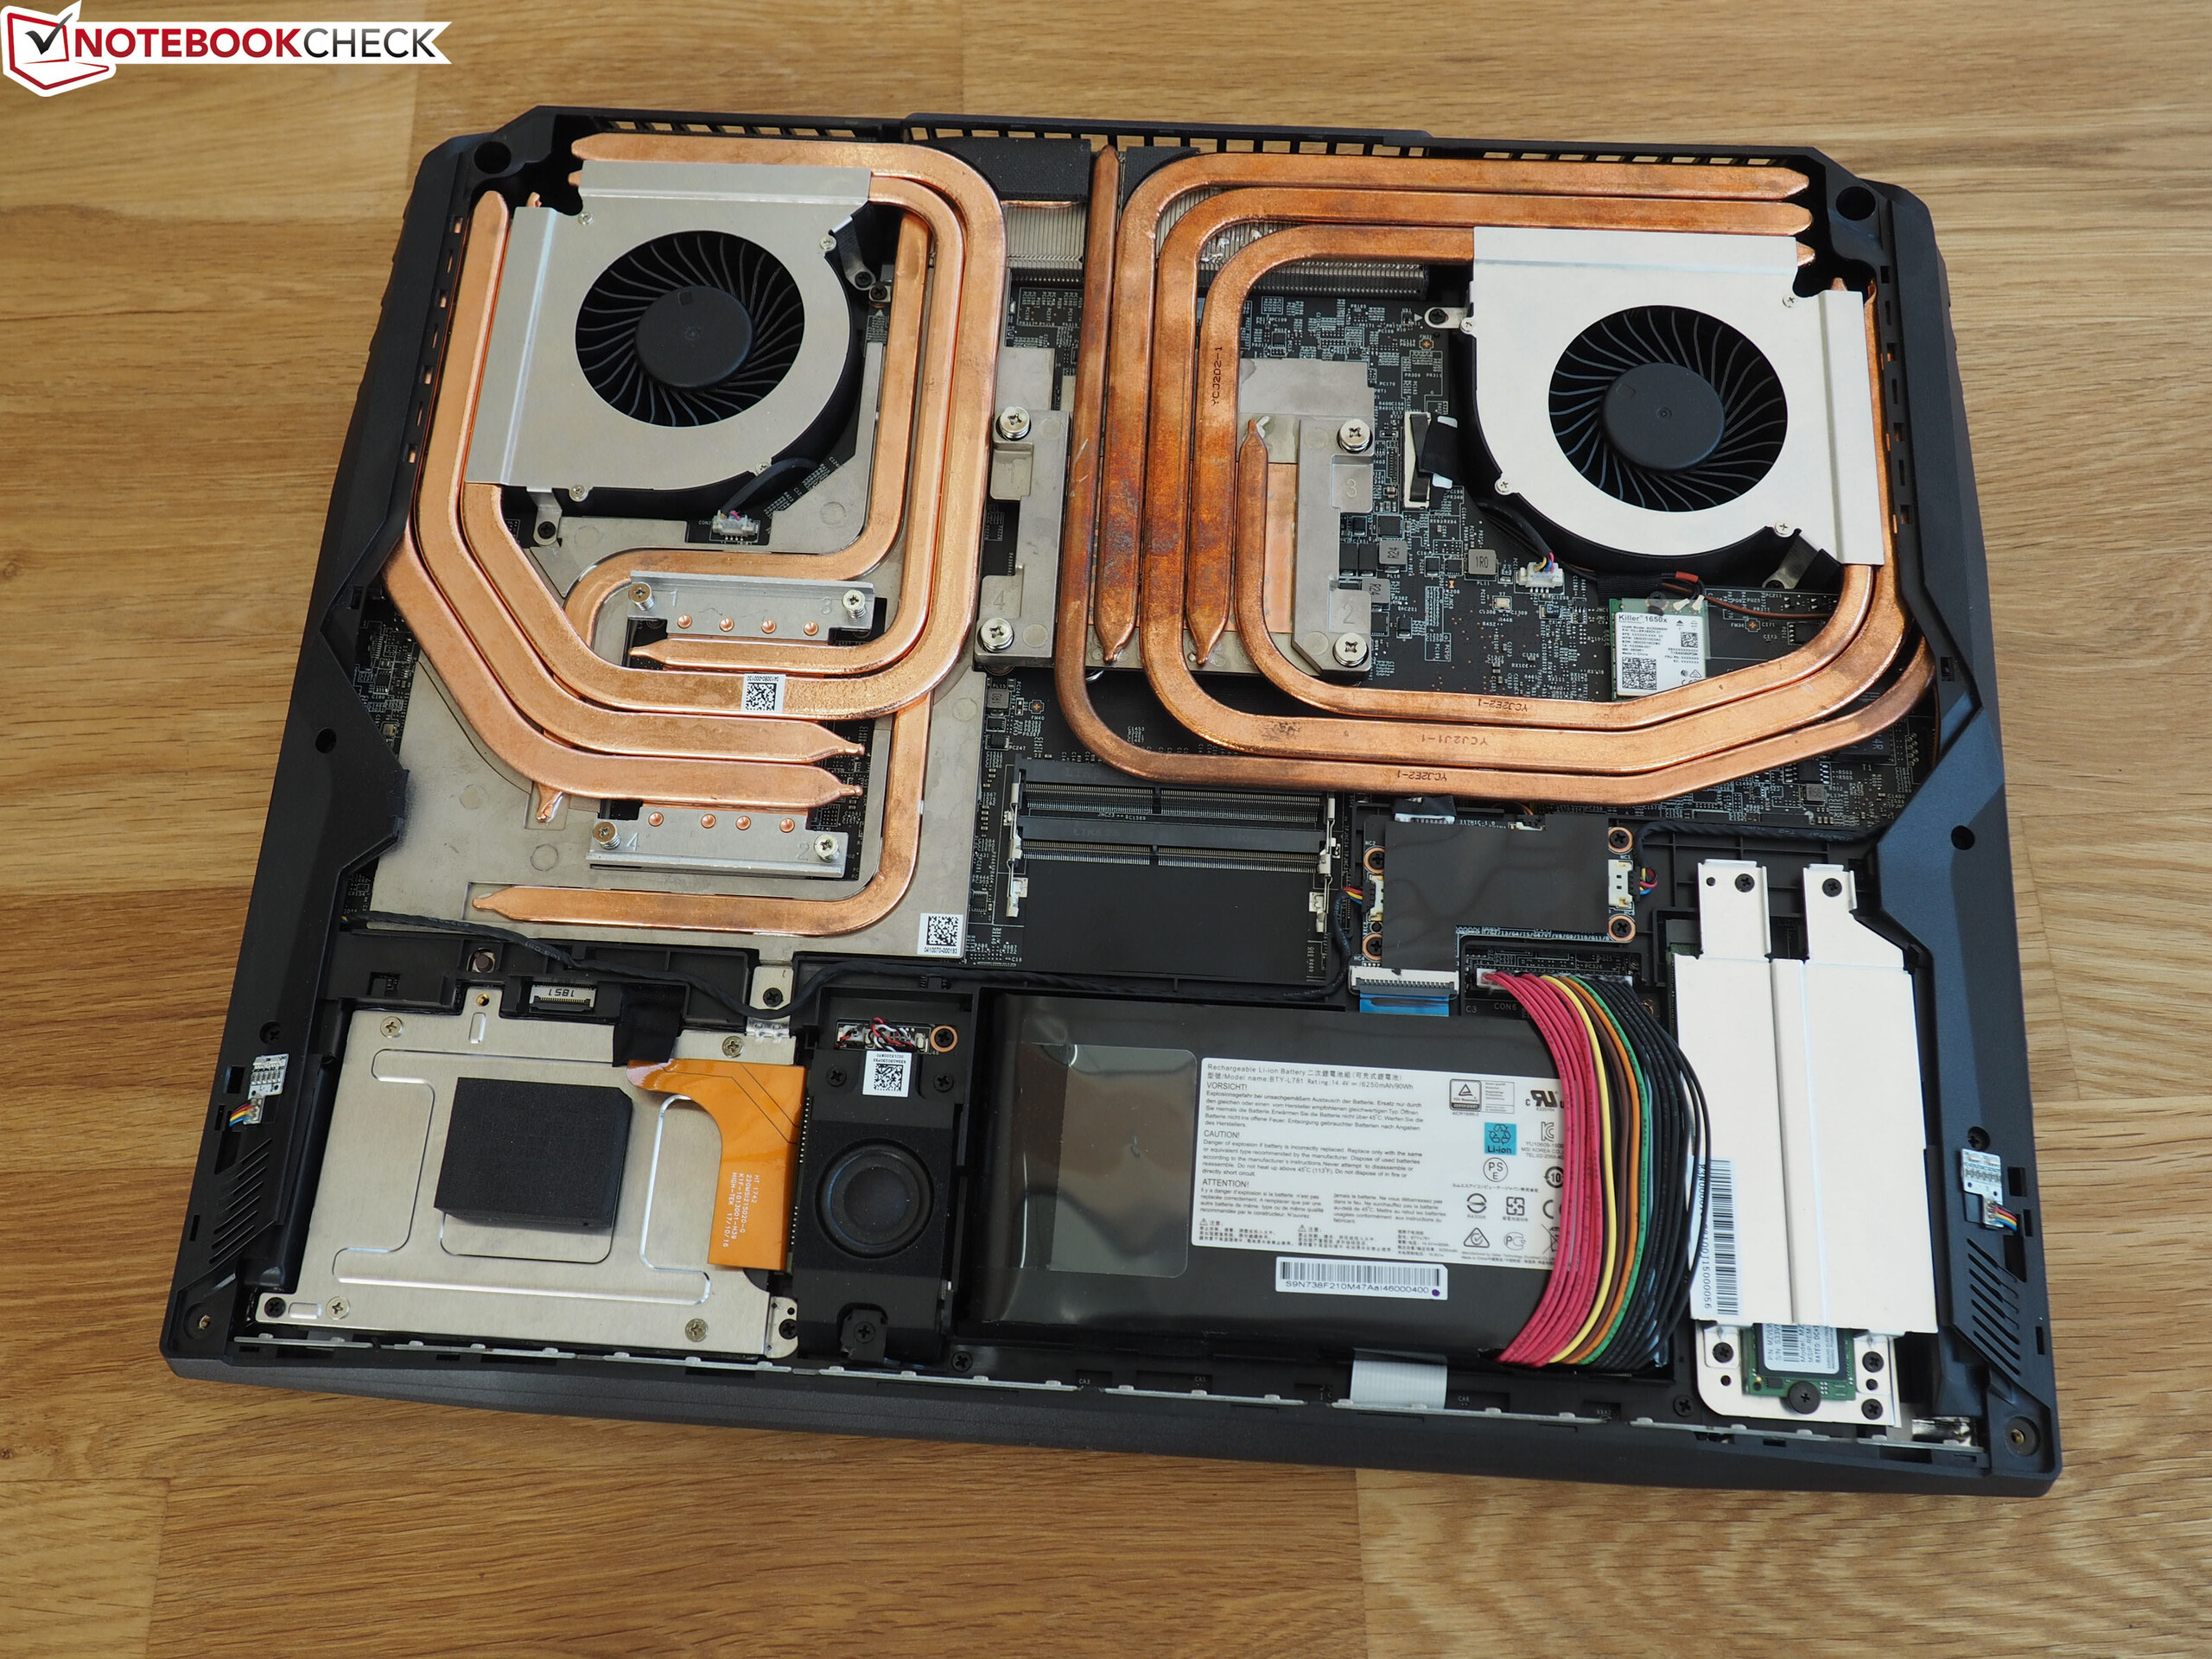
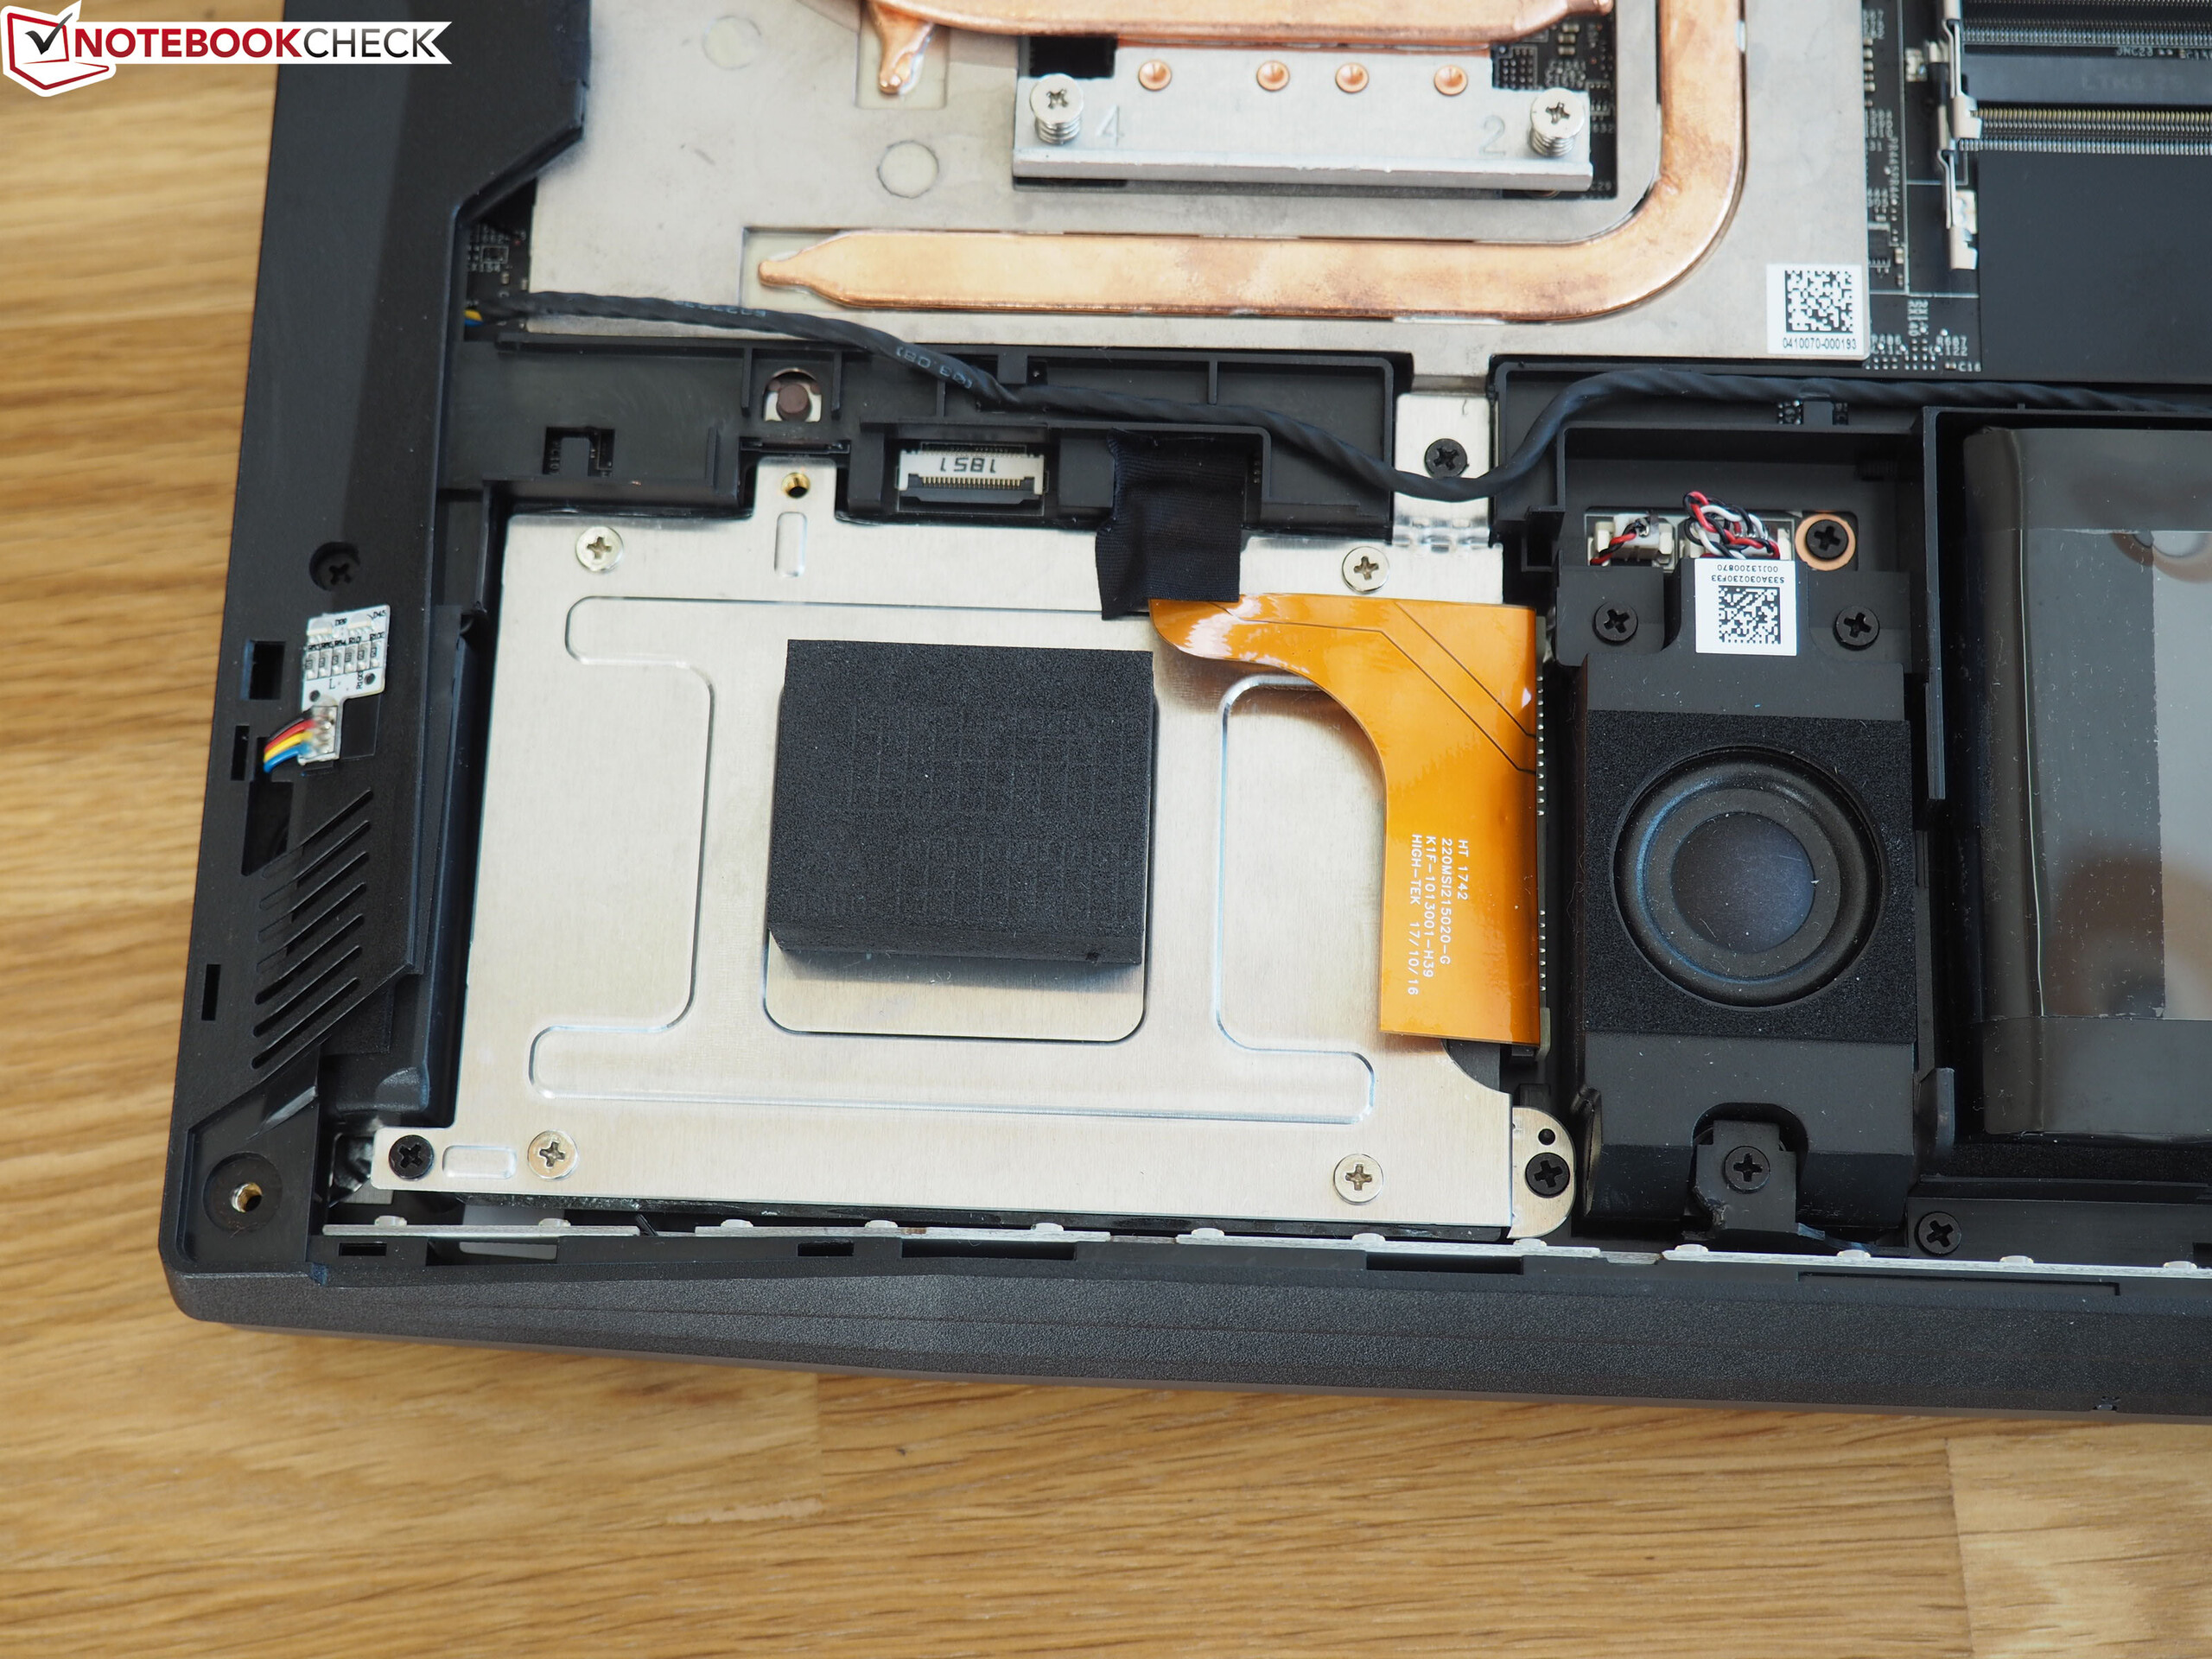
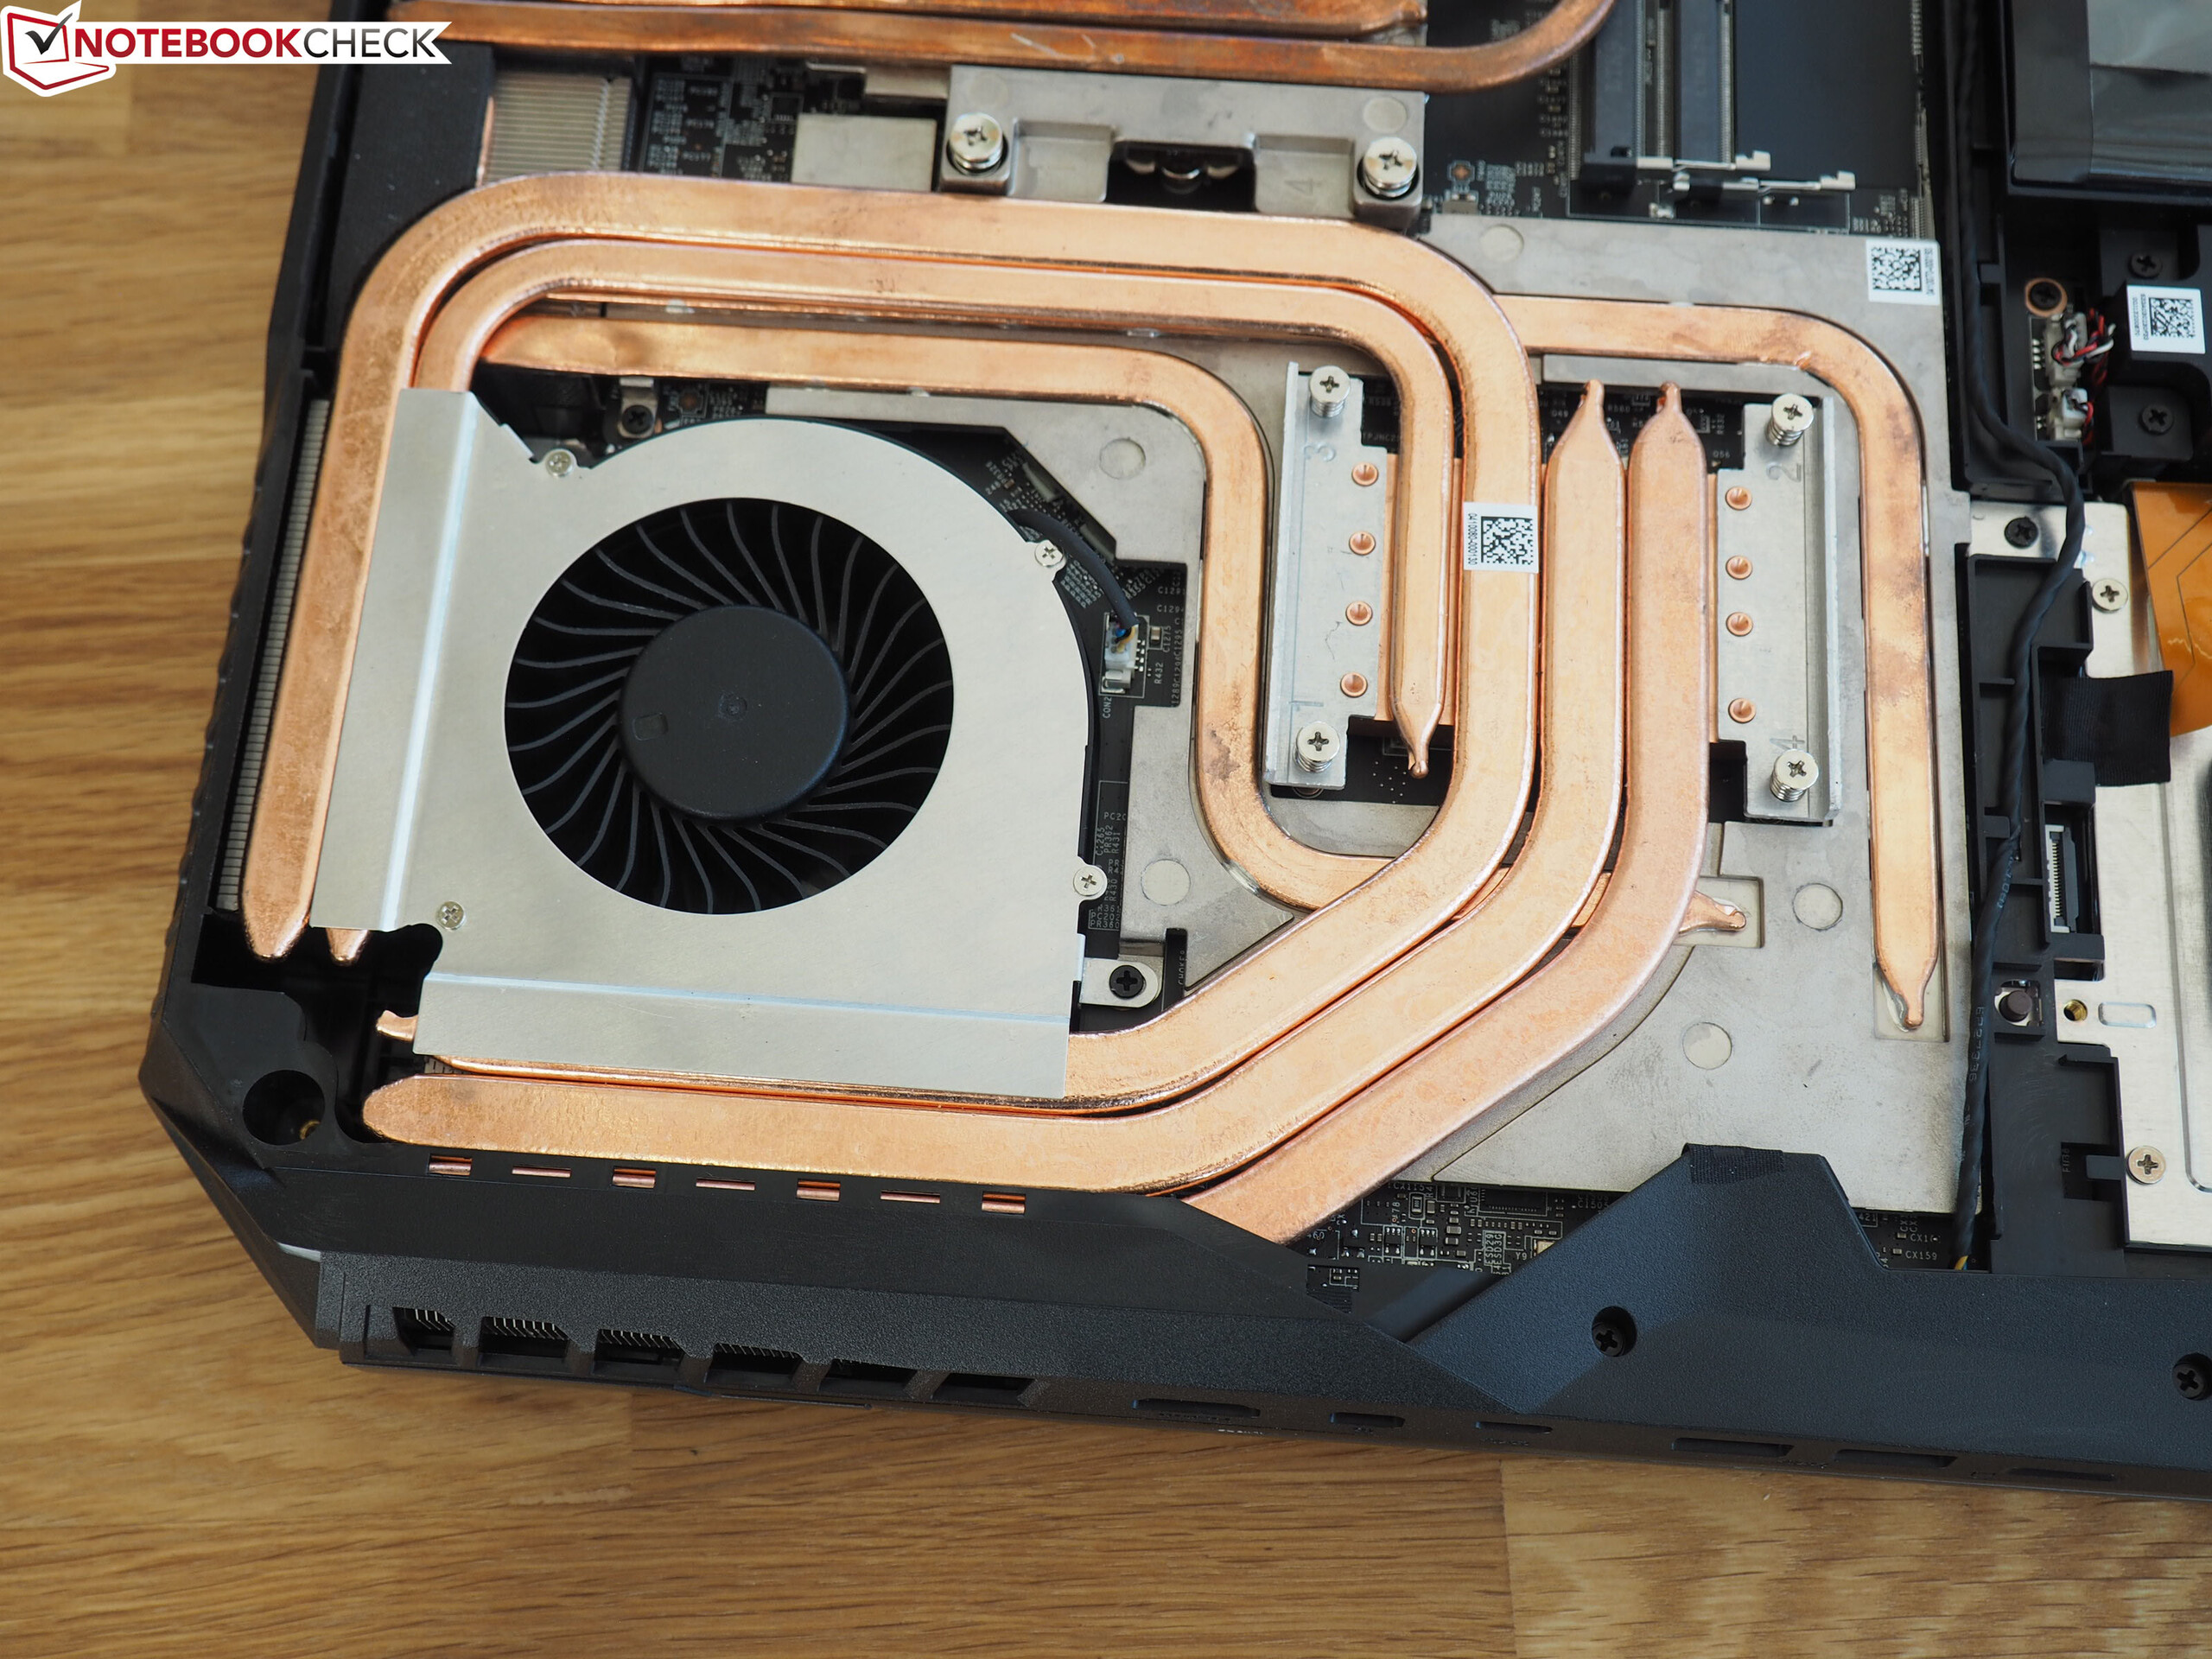
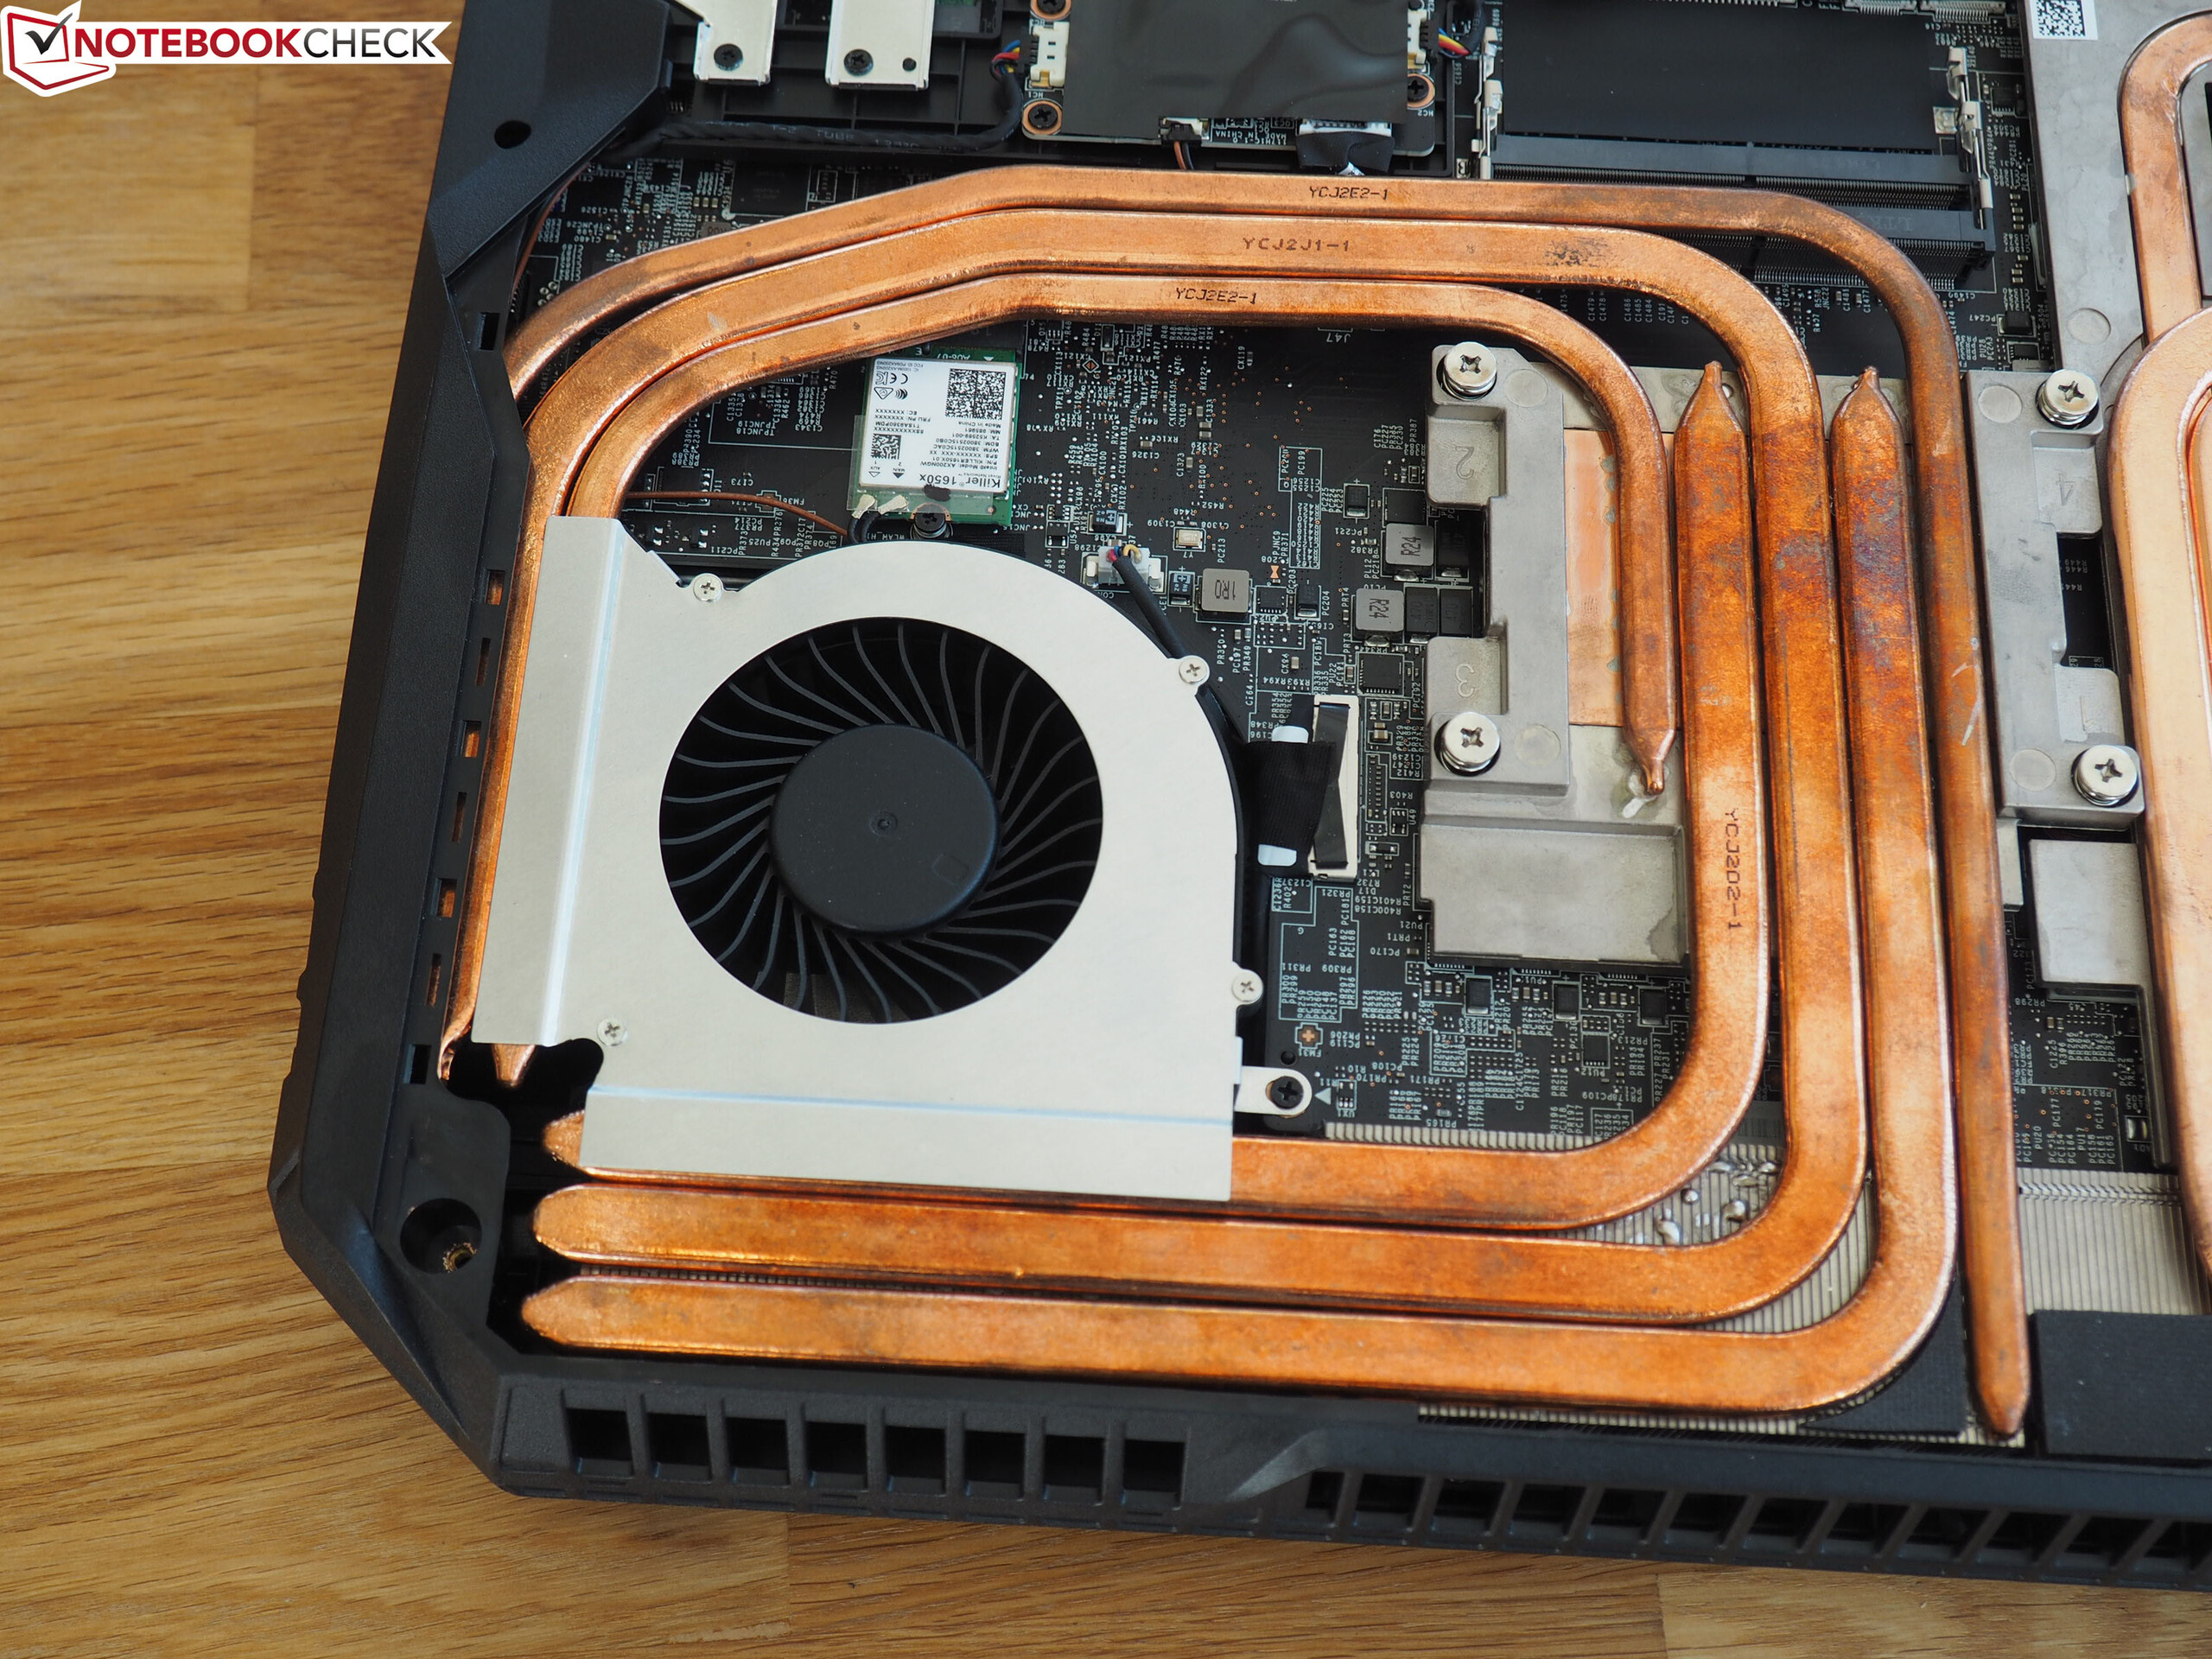
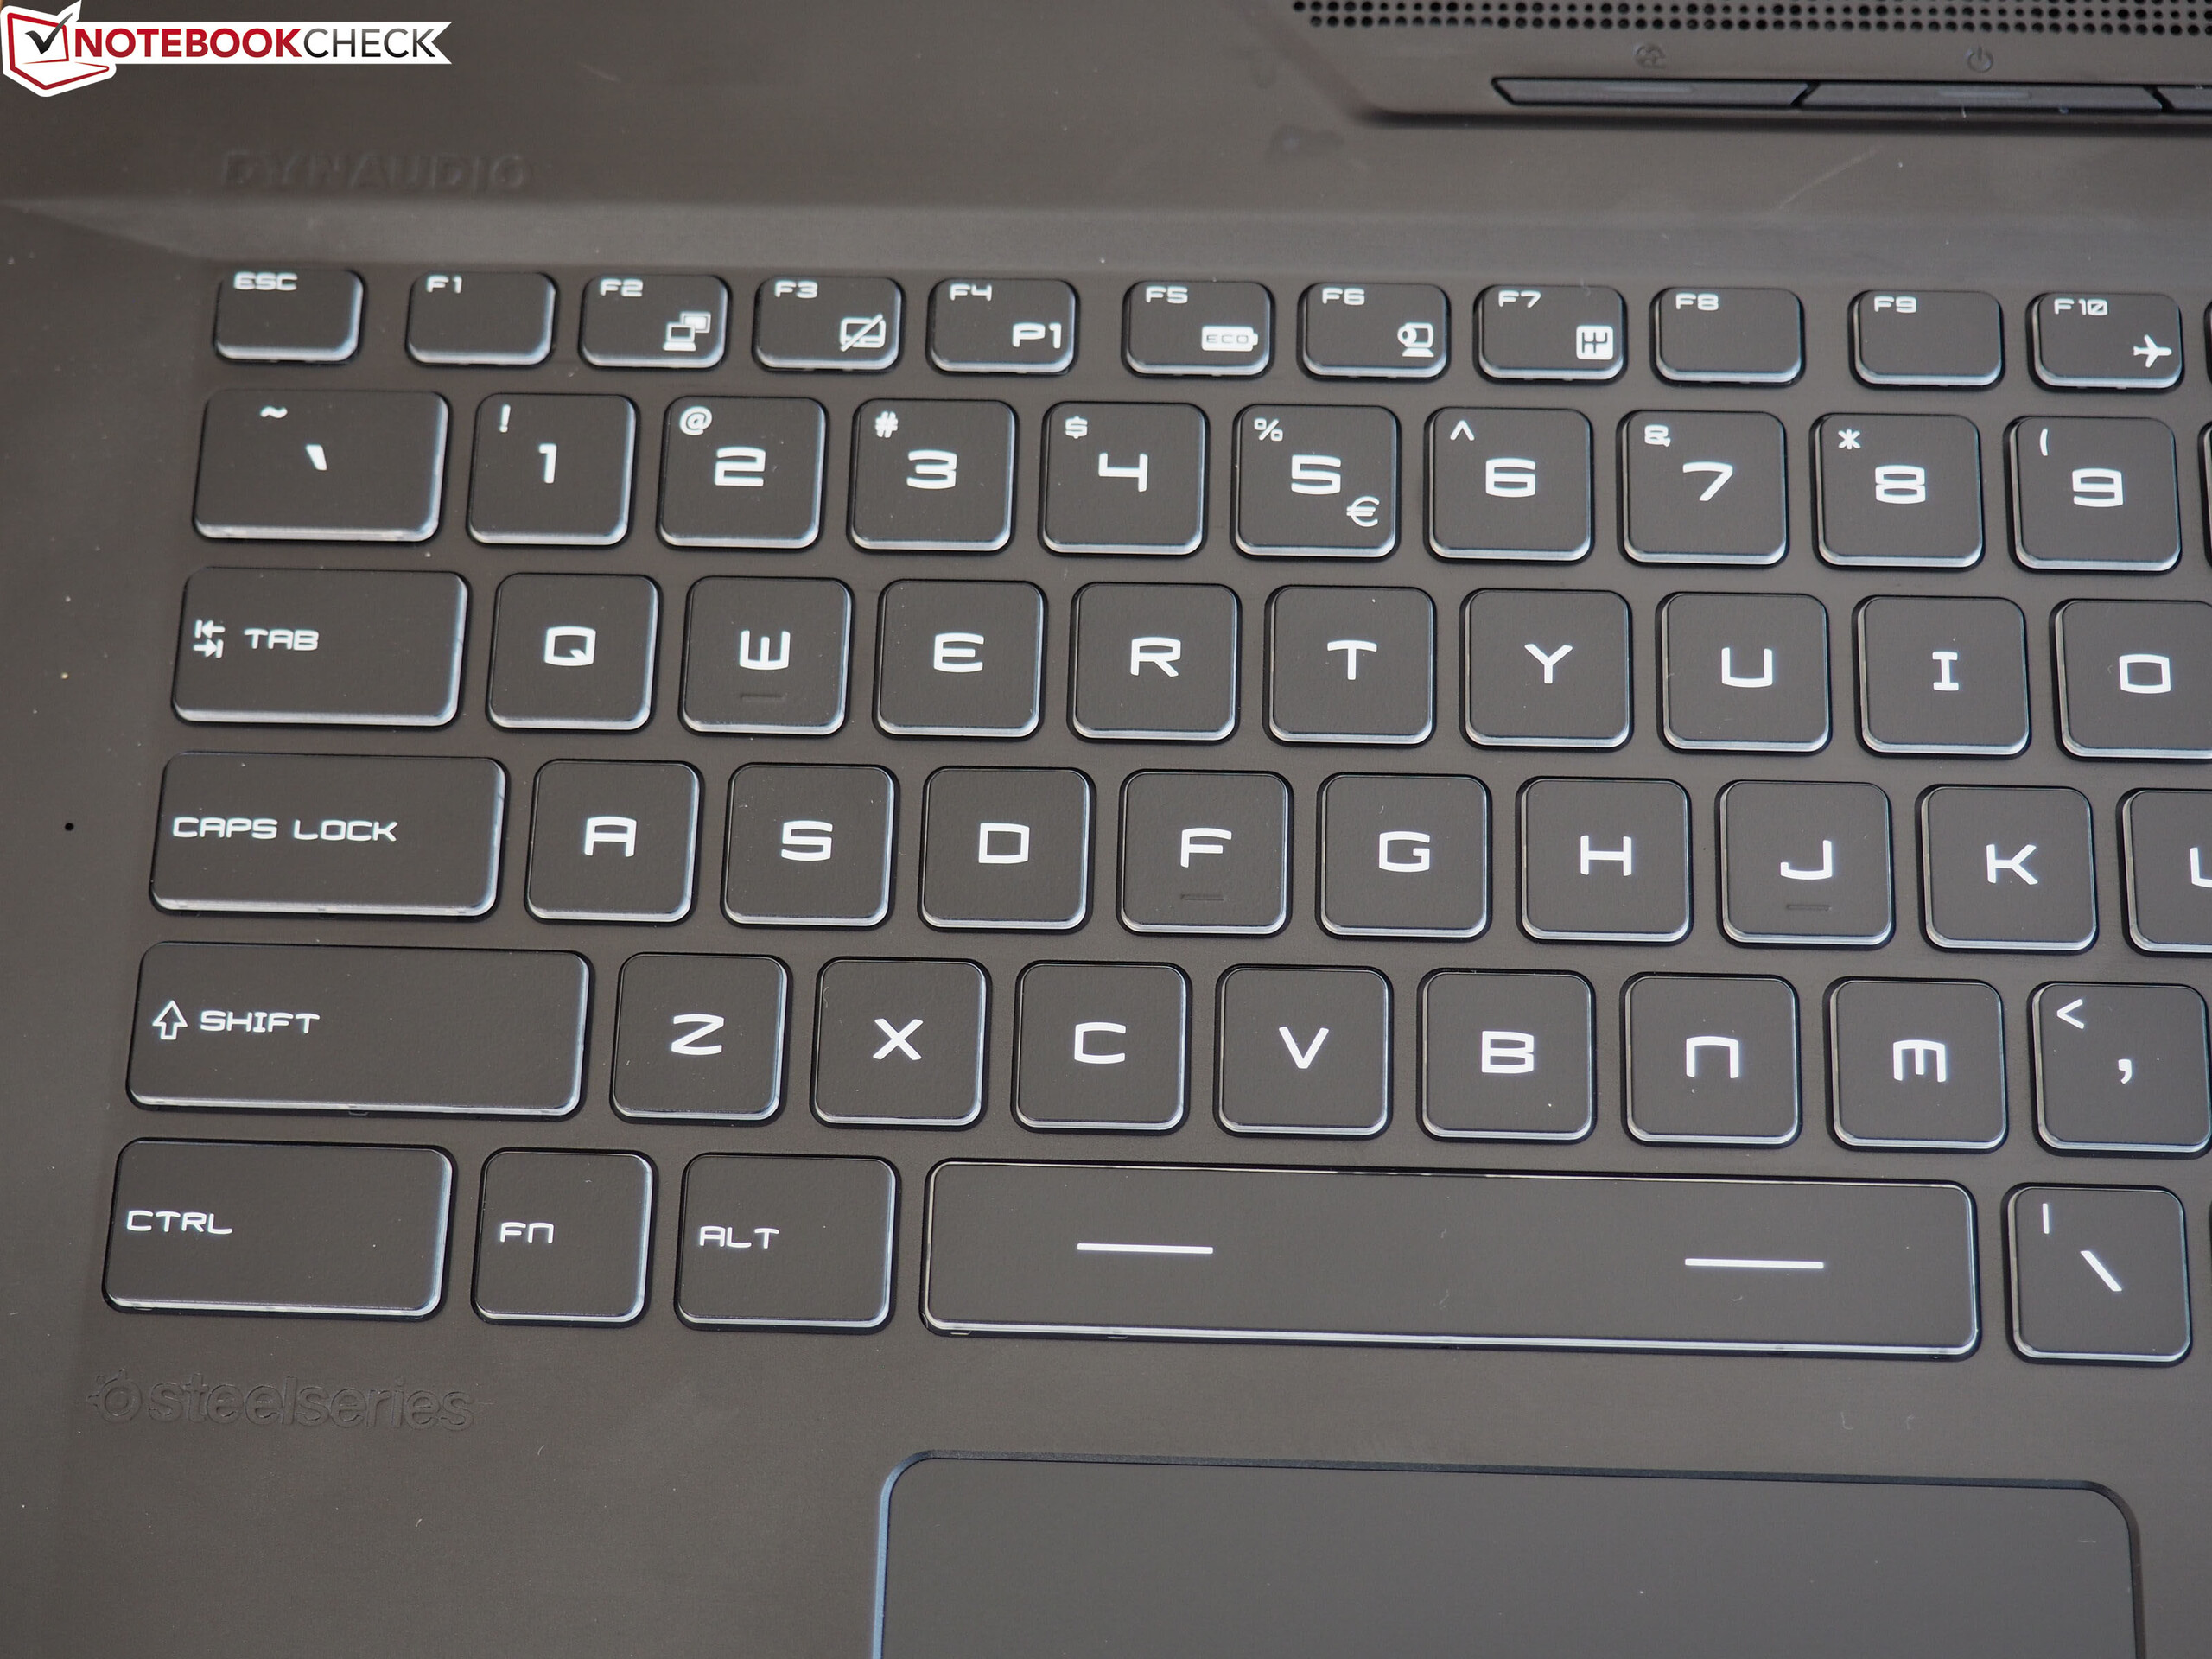
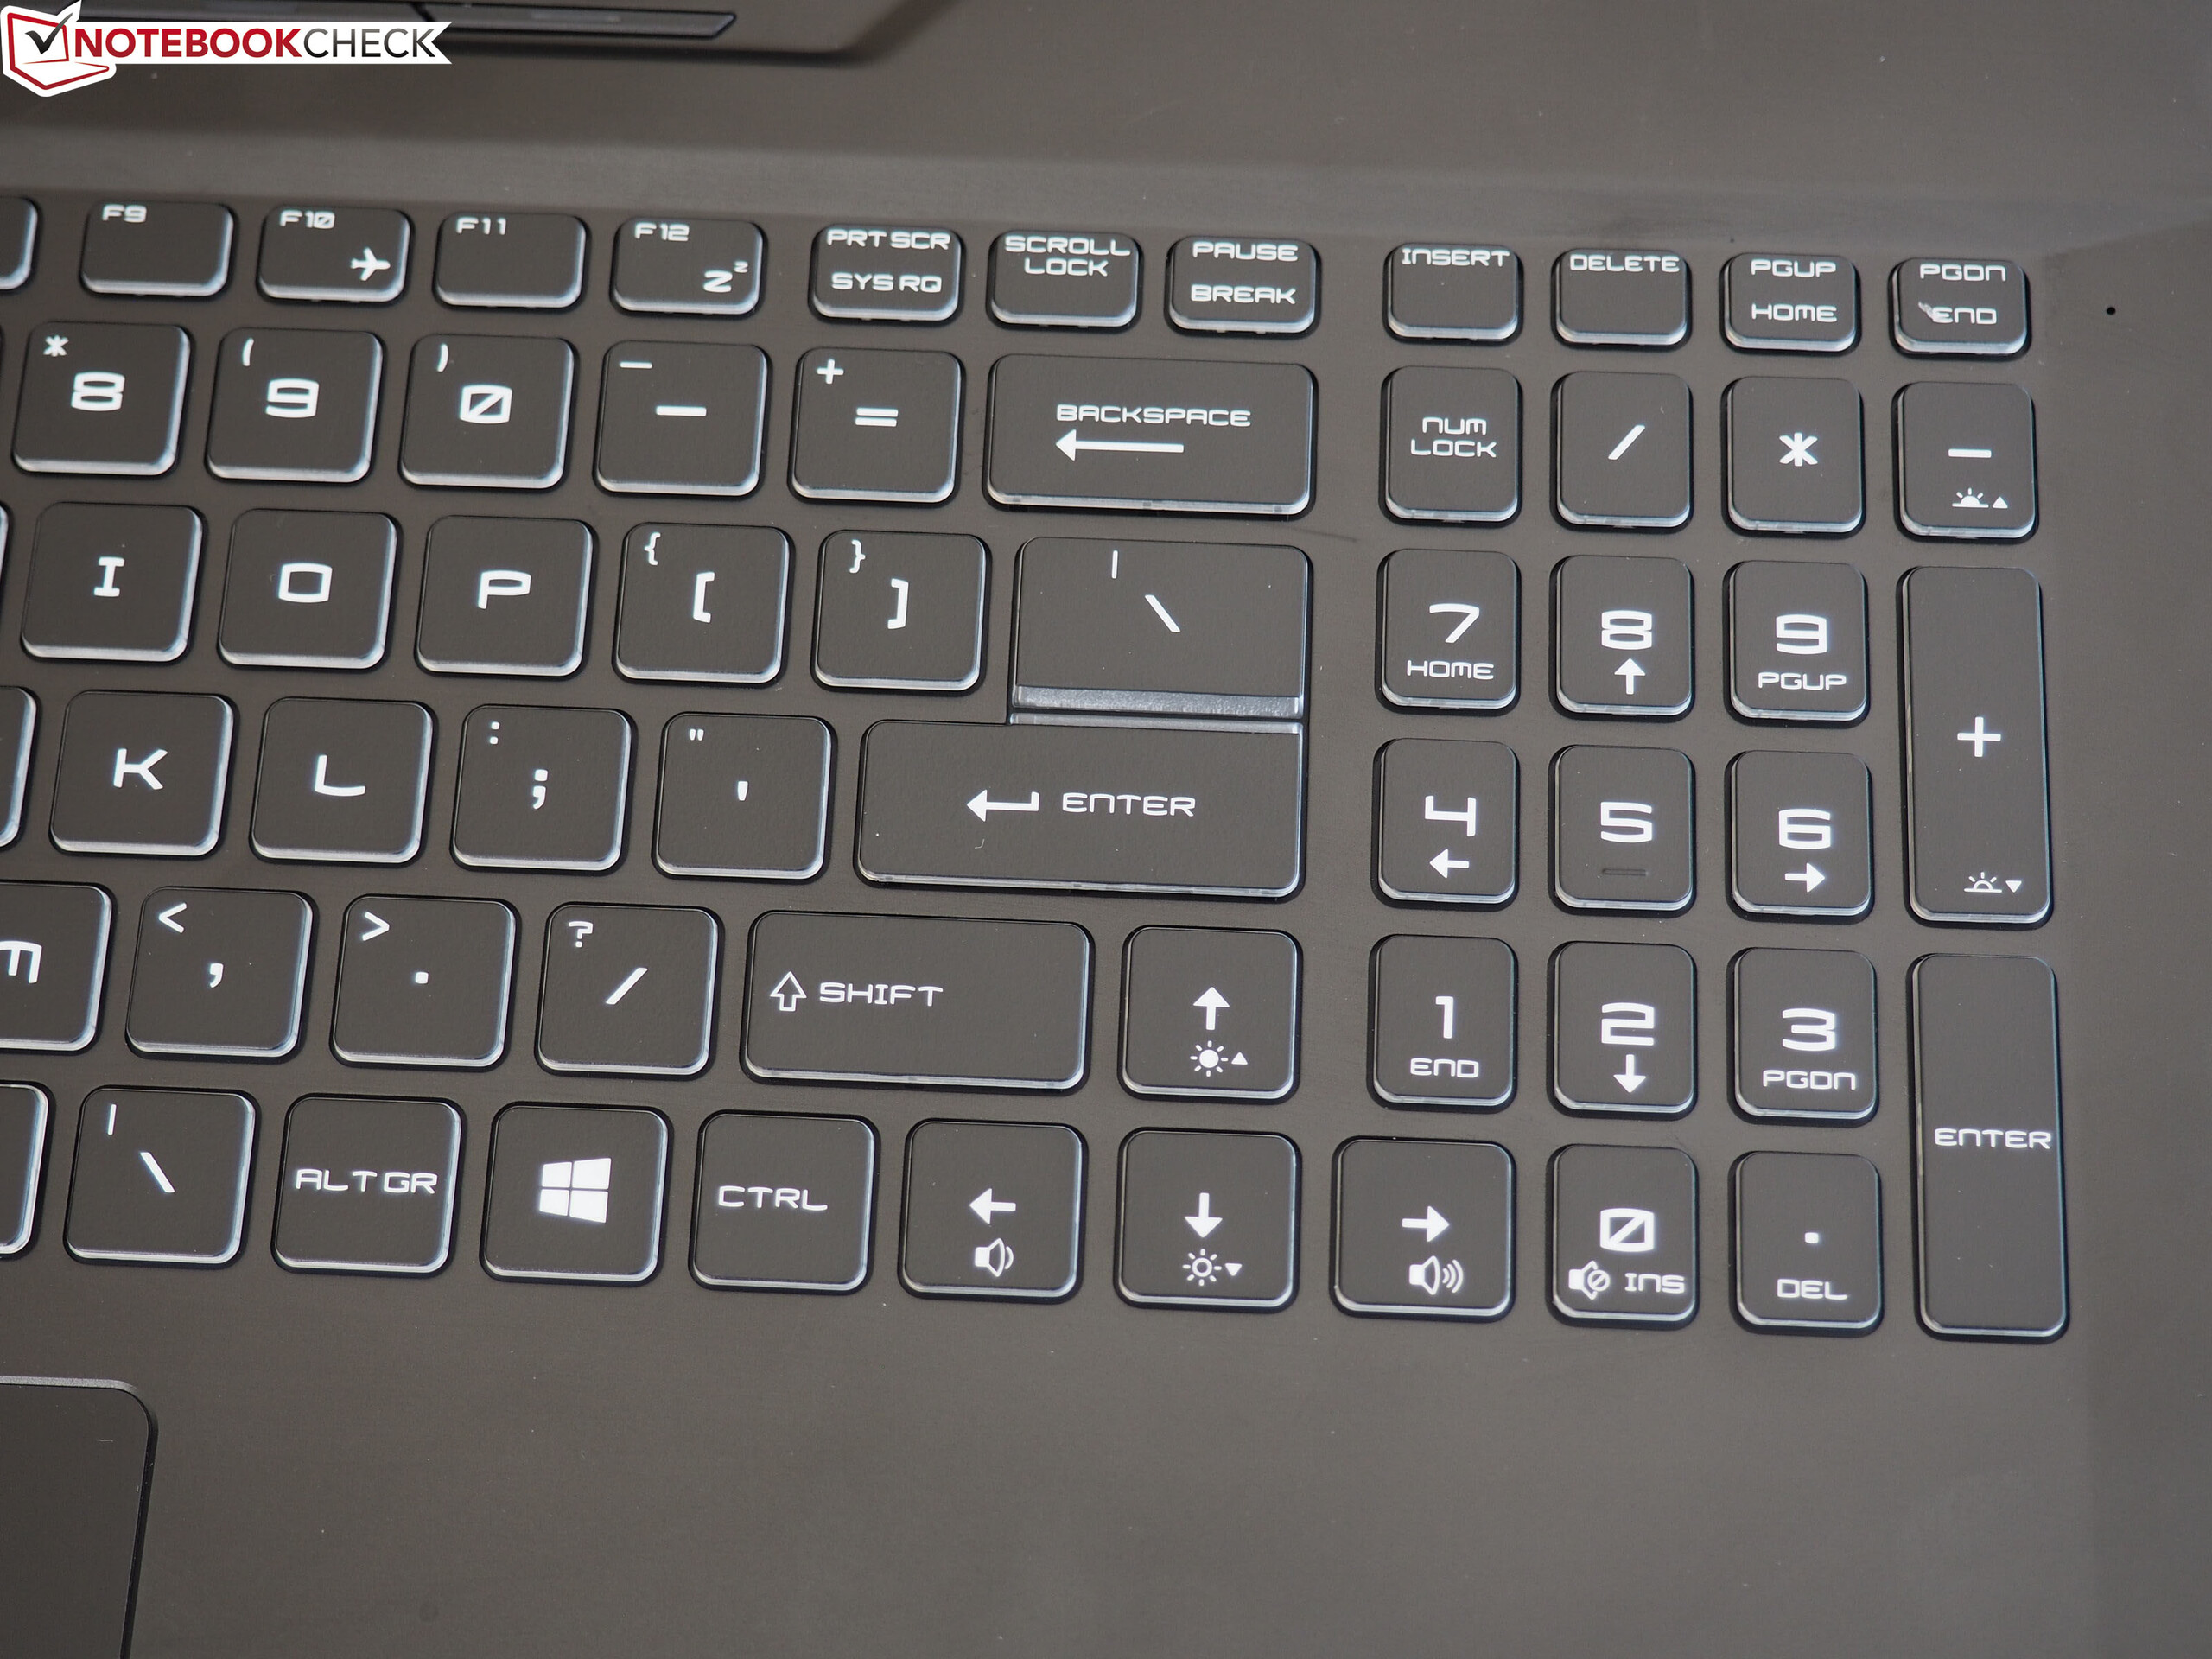
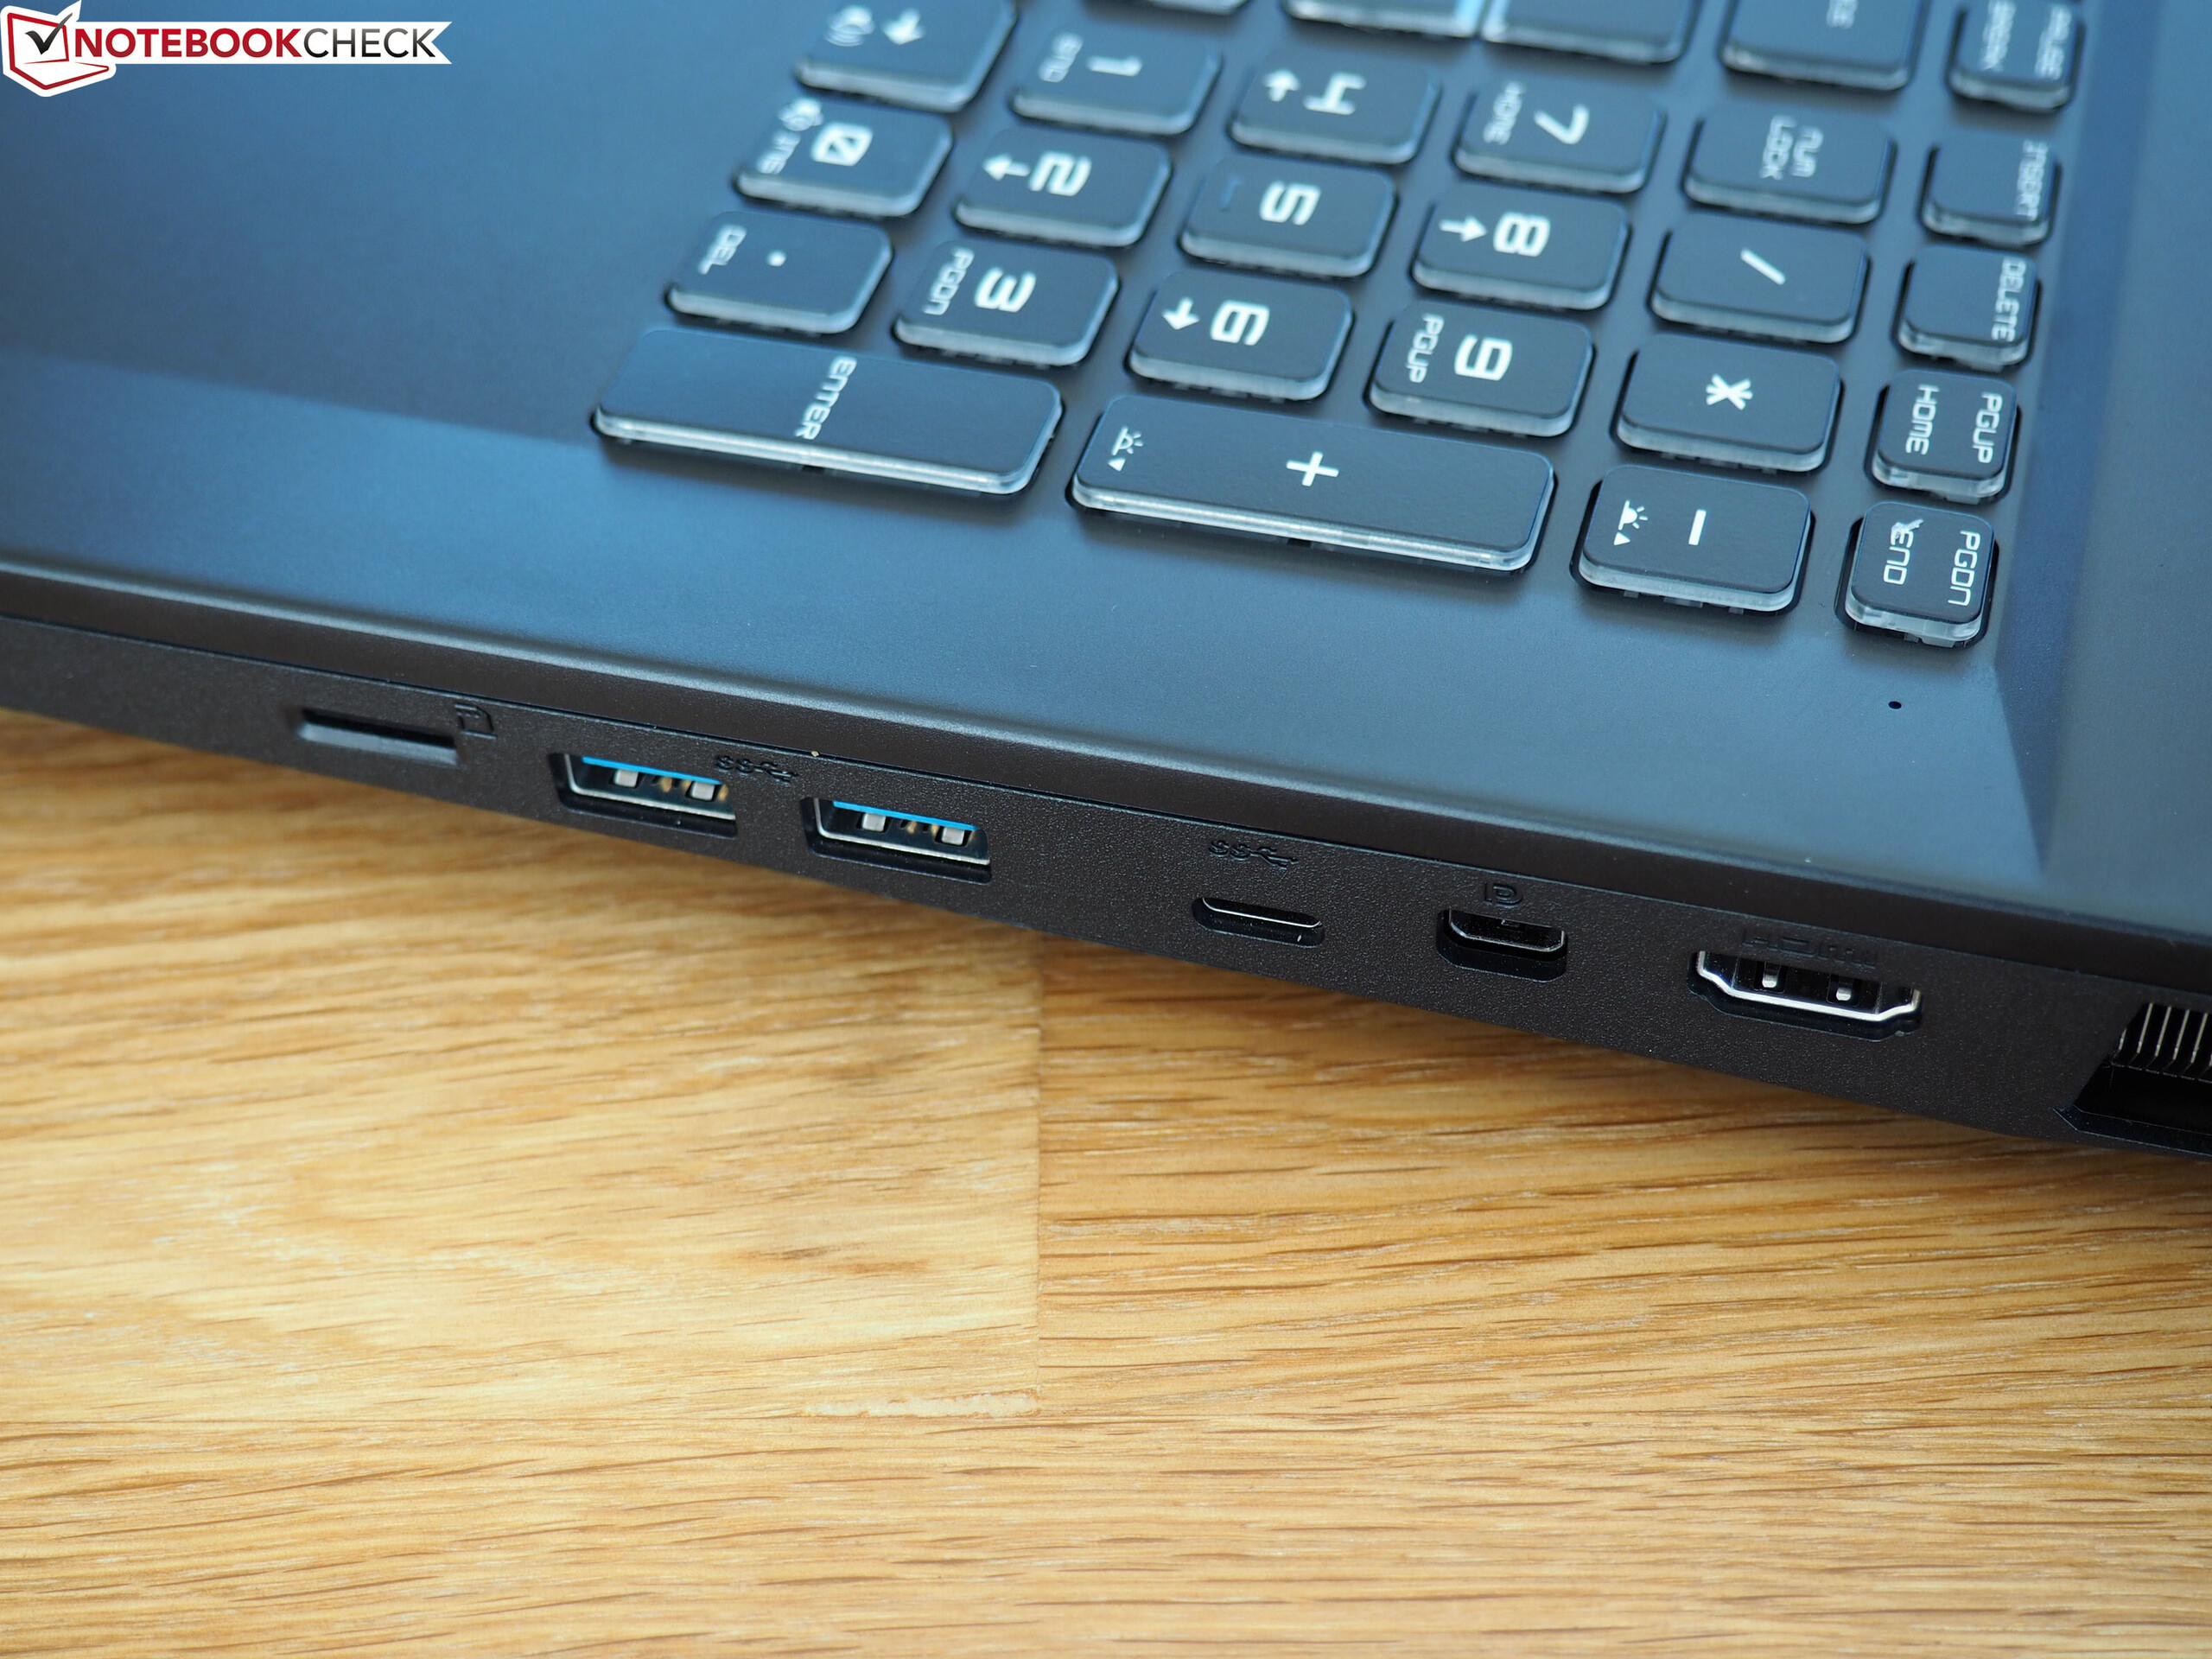
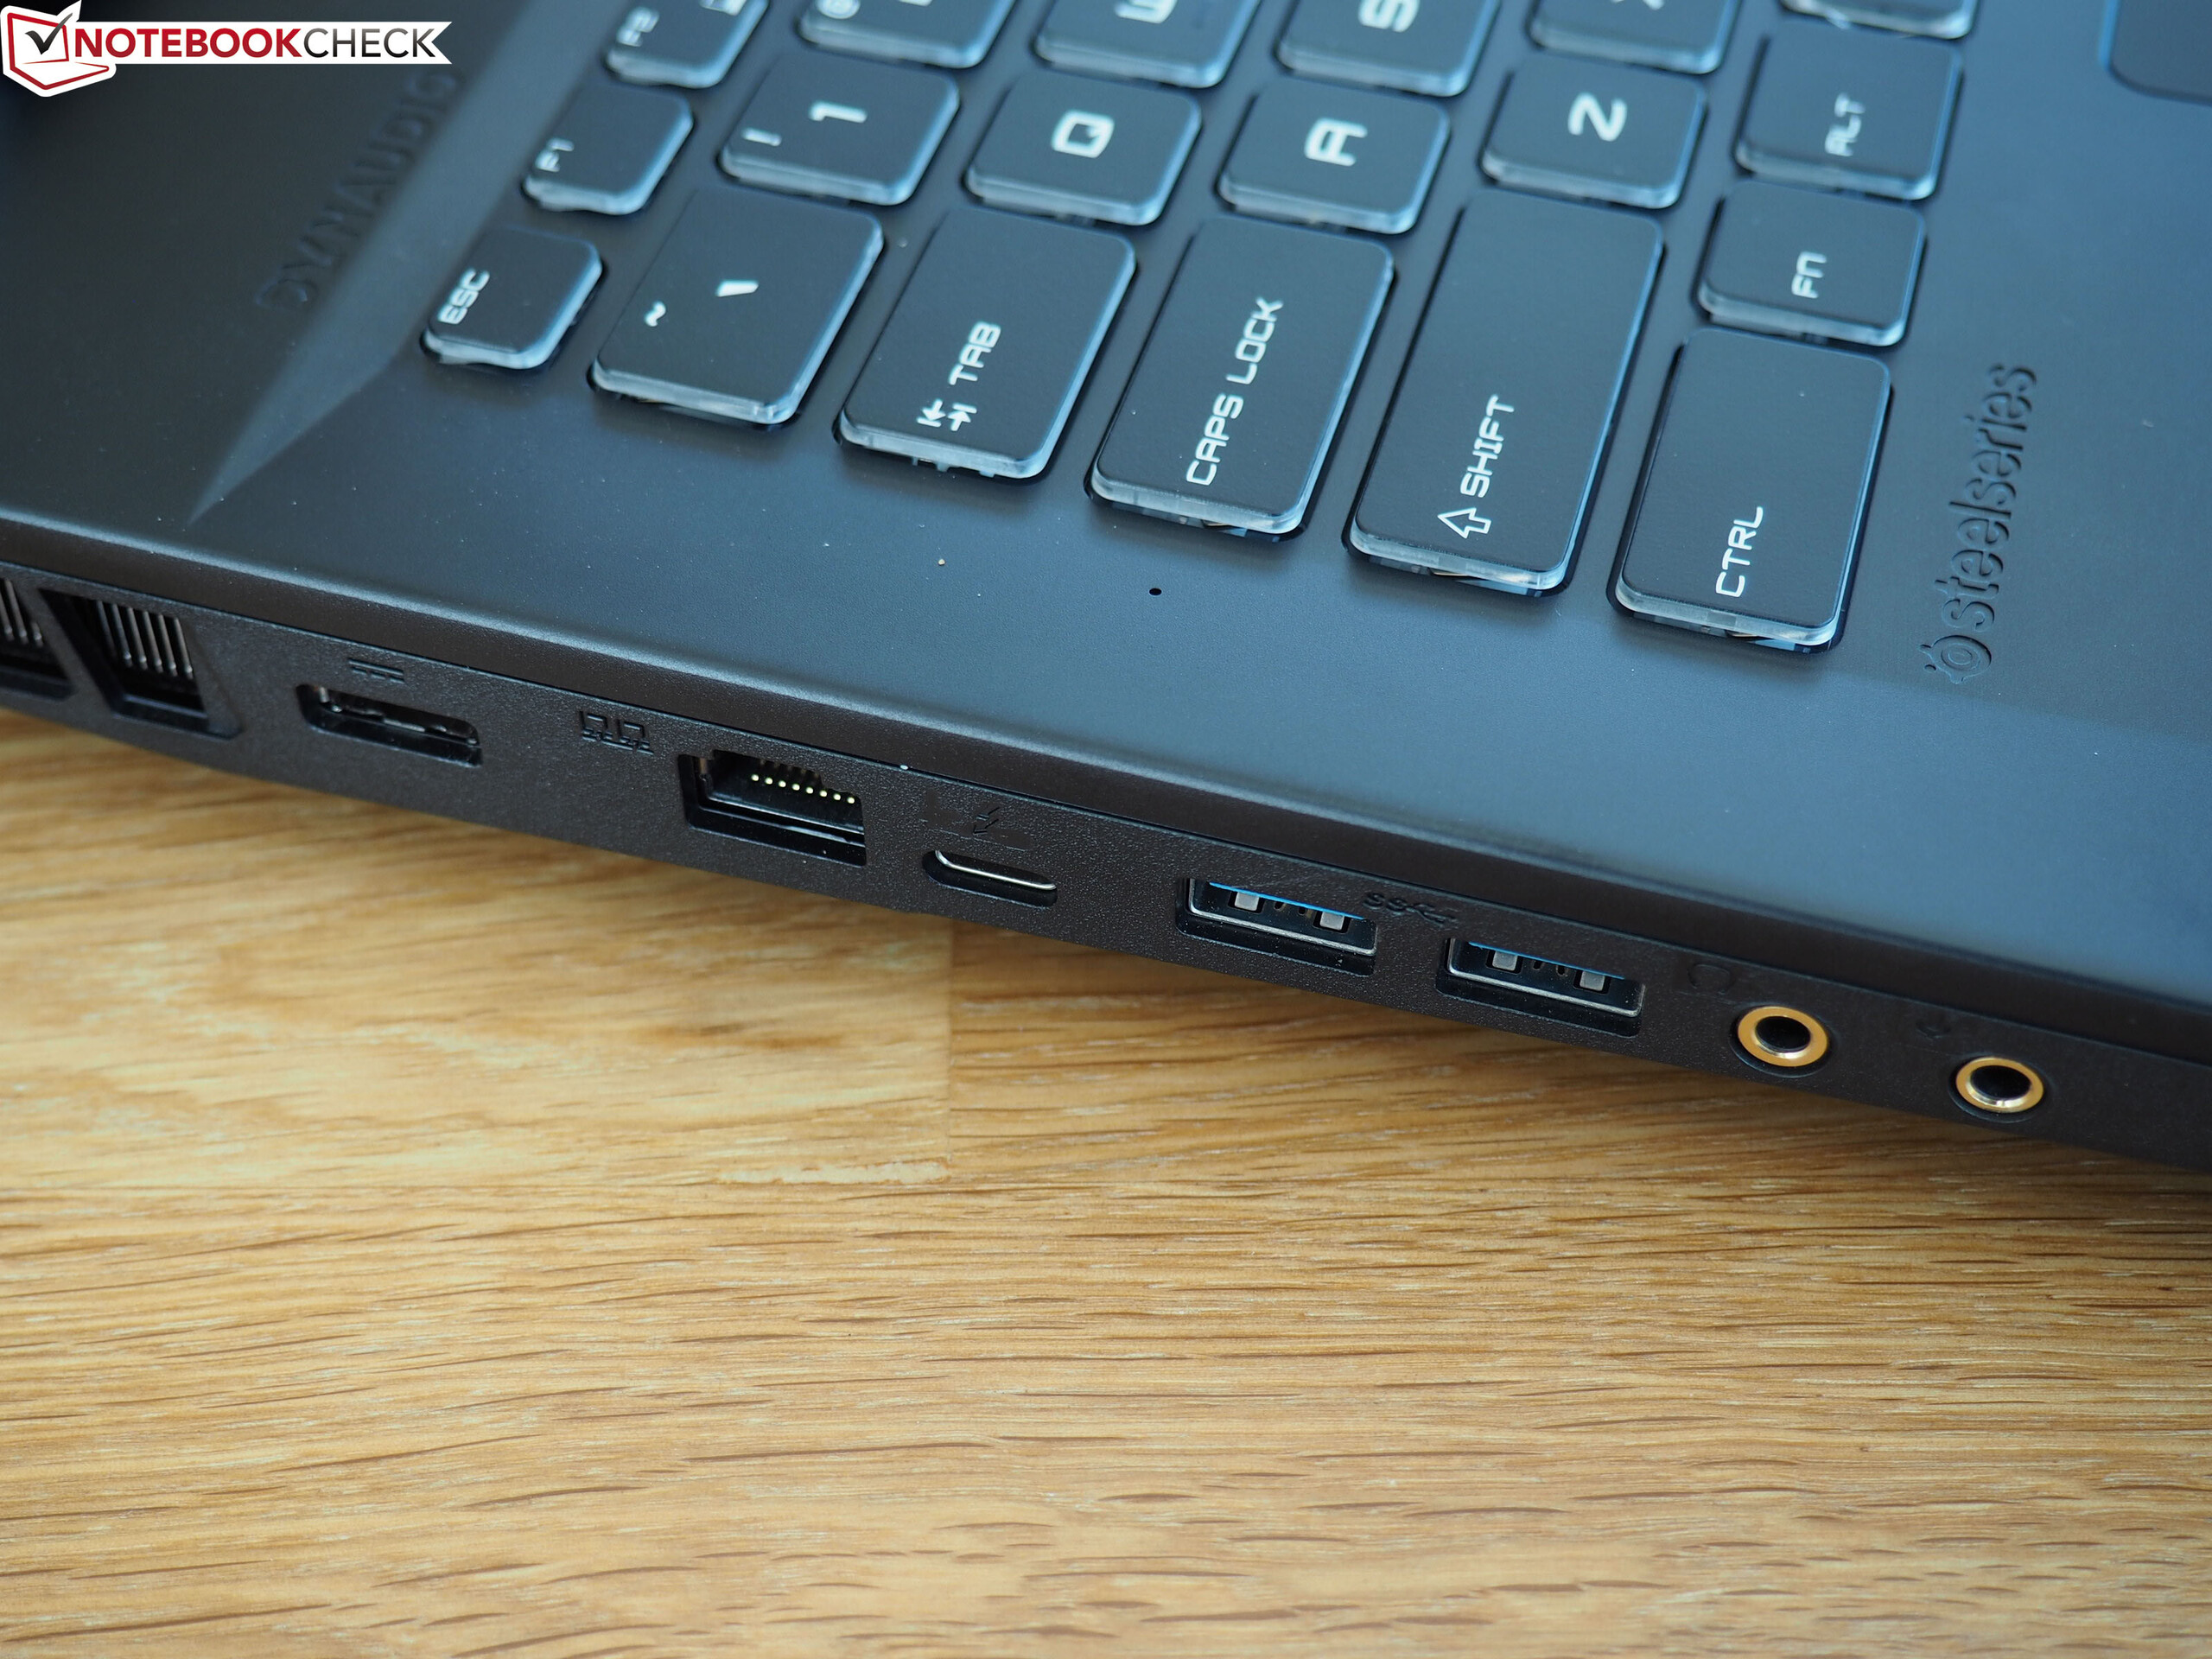
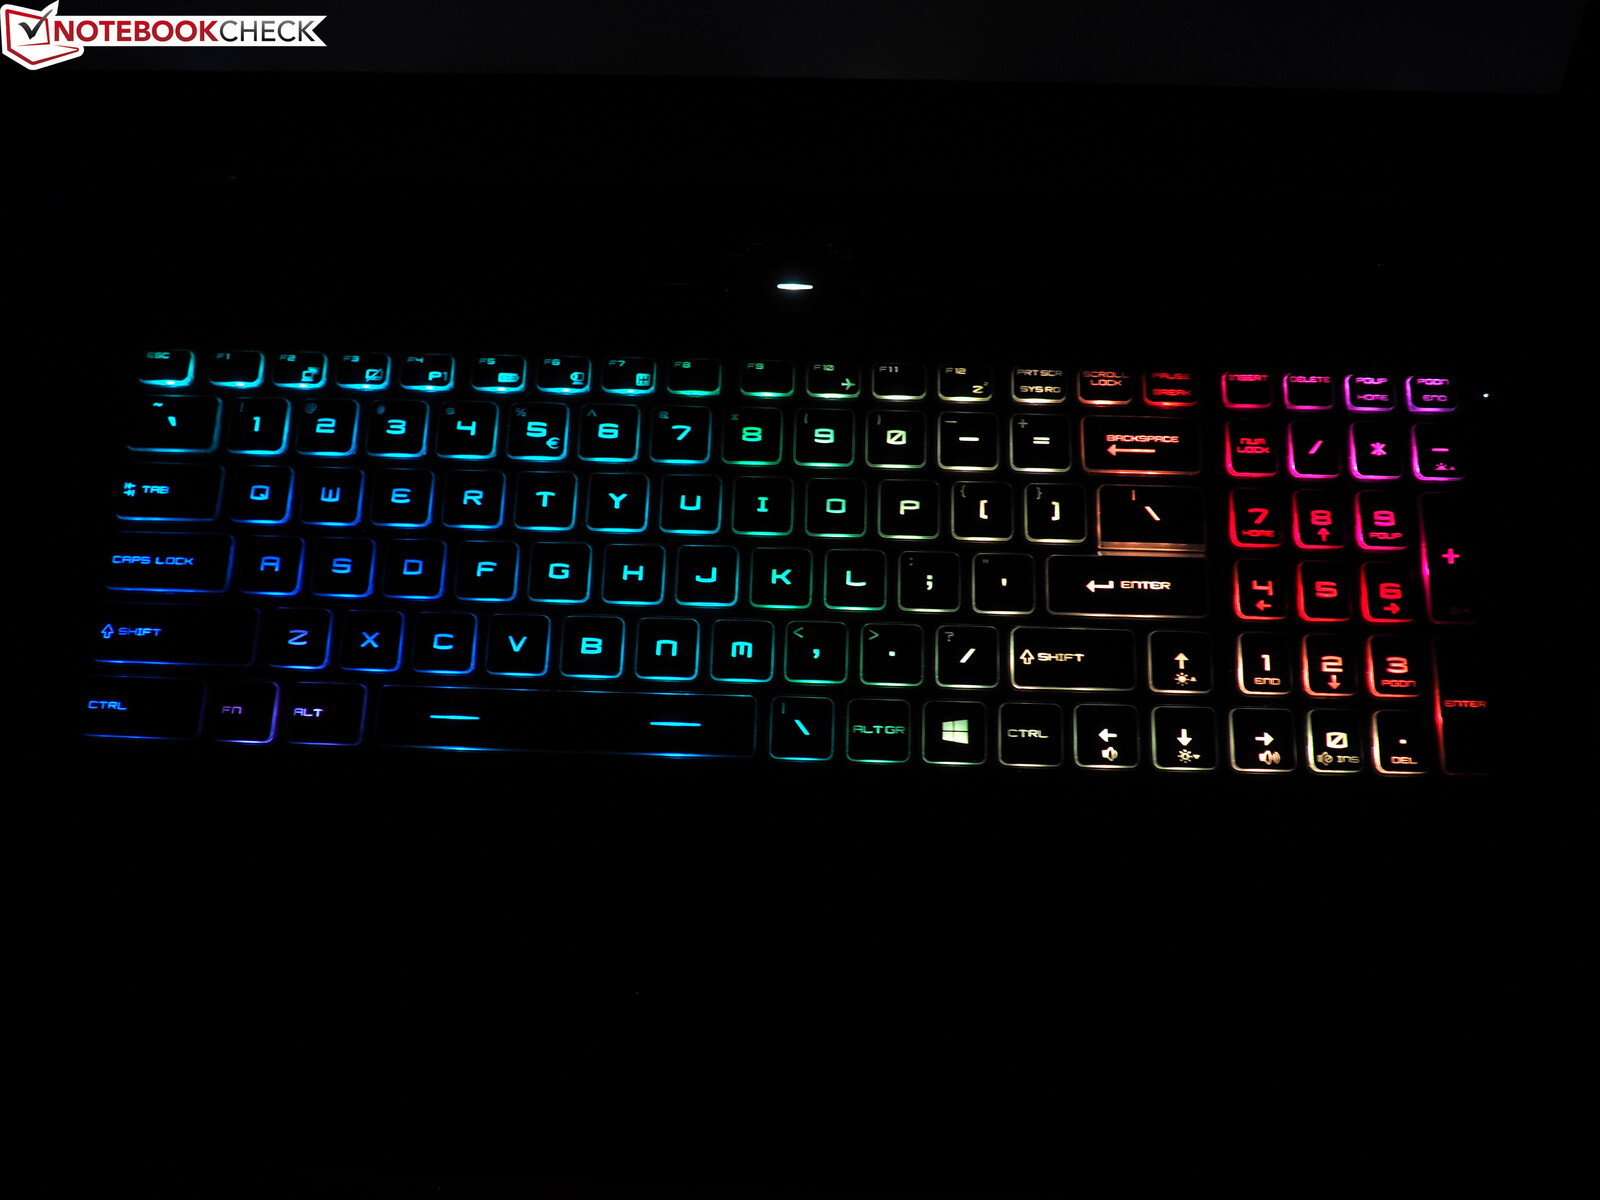
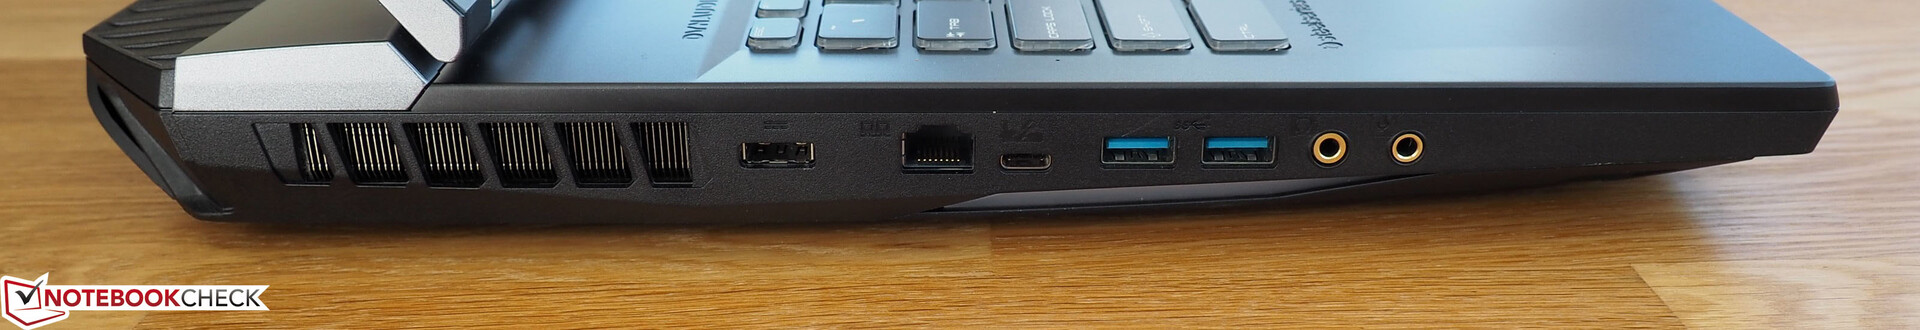
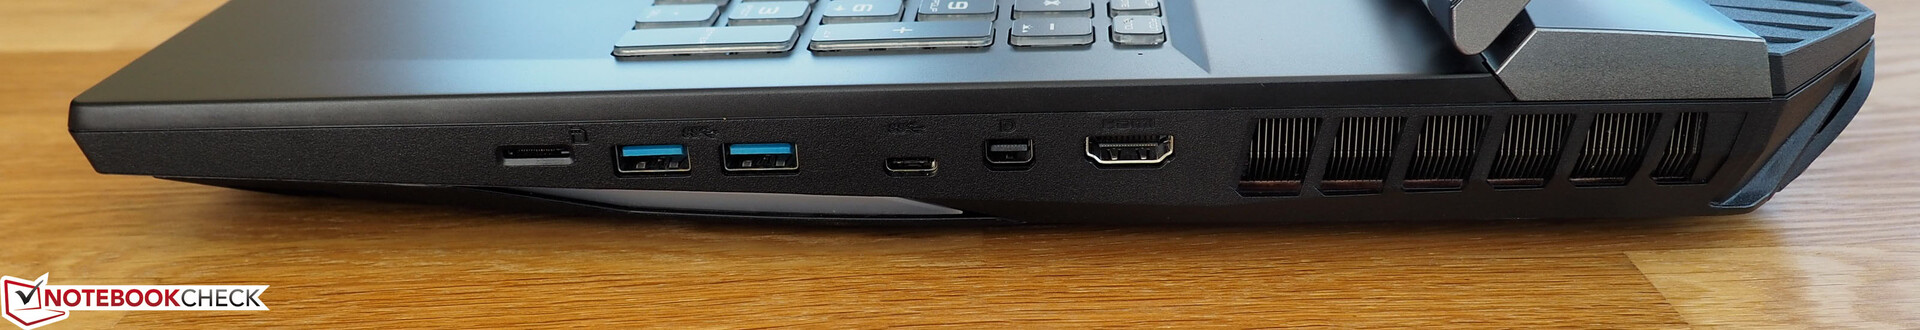
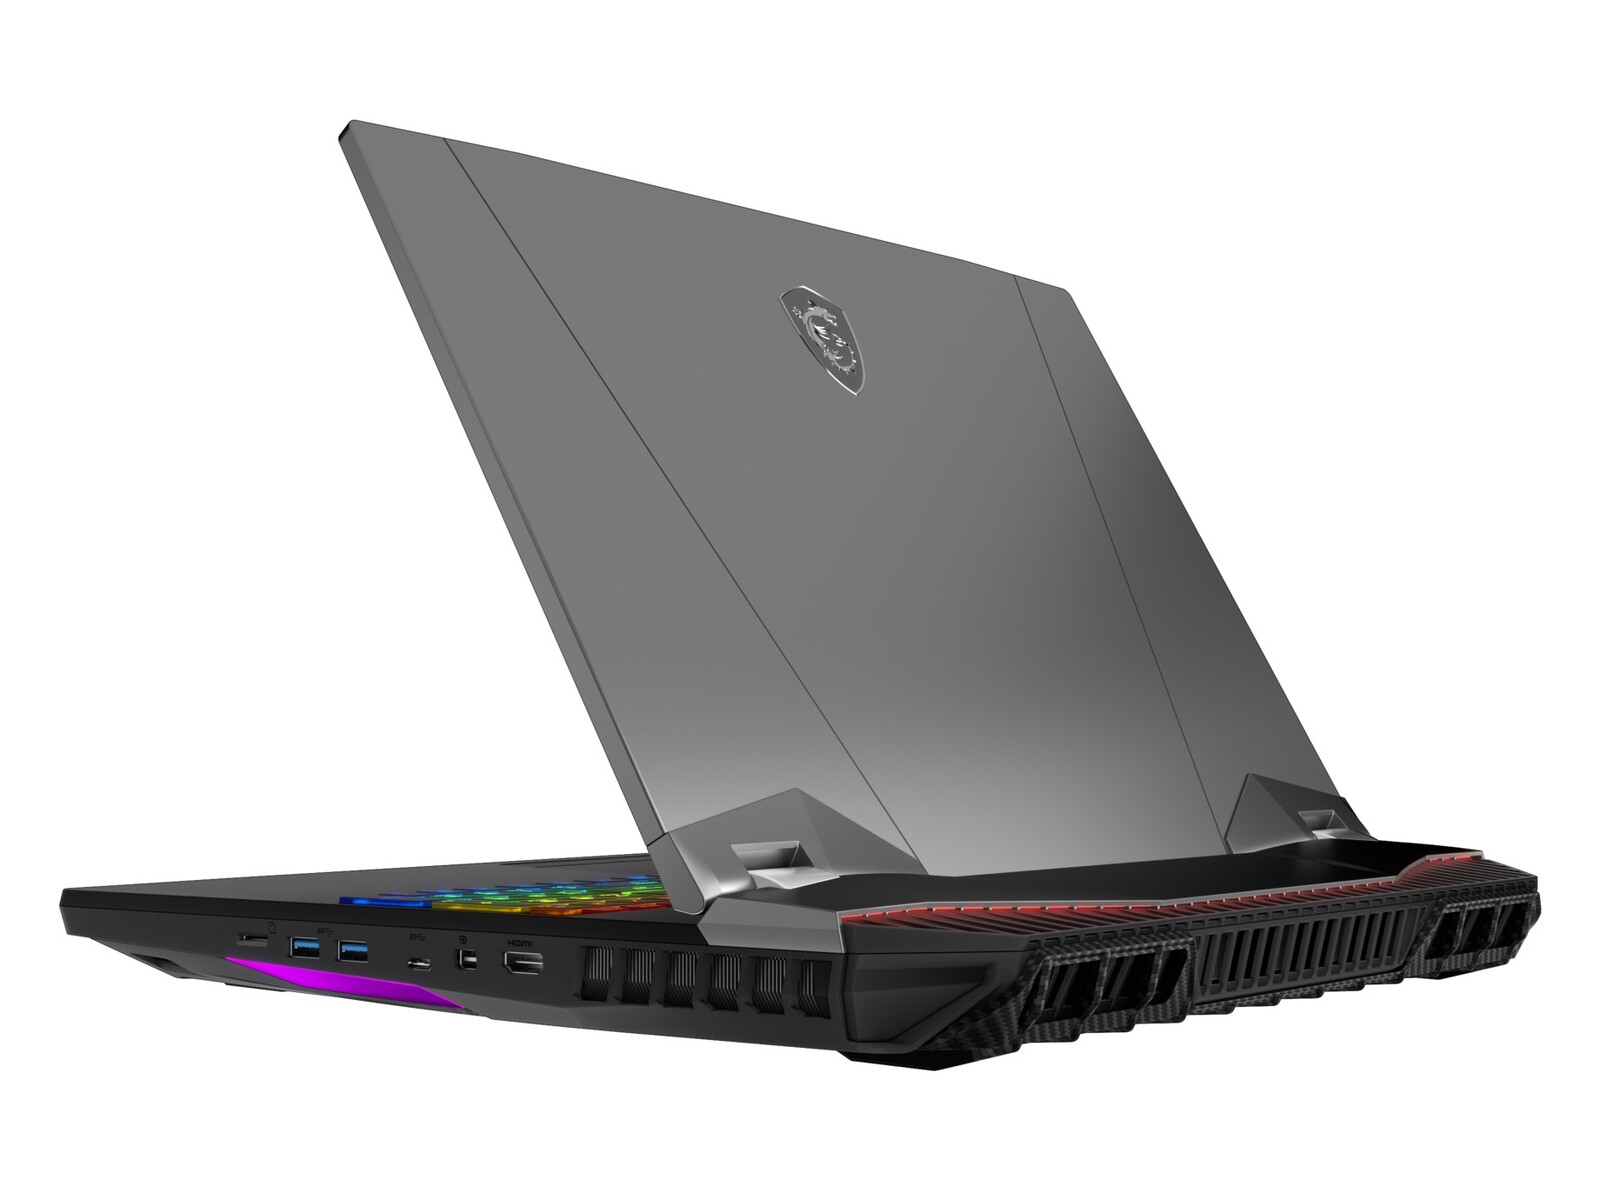
GT76为您提供了许多端口(雷电 3),良好的输入设备和良好的音质。 144 Hz超薄边框显示器的图像质量对于具有这种价格标签的设备来说是可接受的。 此外,扩展的维护和升级选项也很不错。
Price comparison