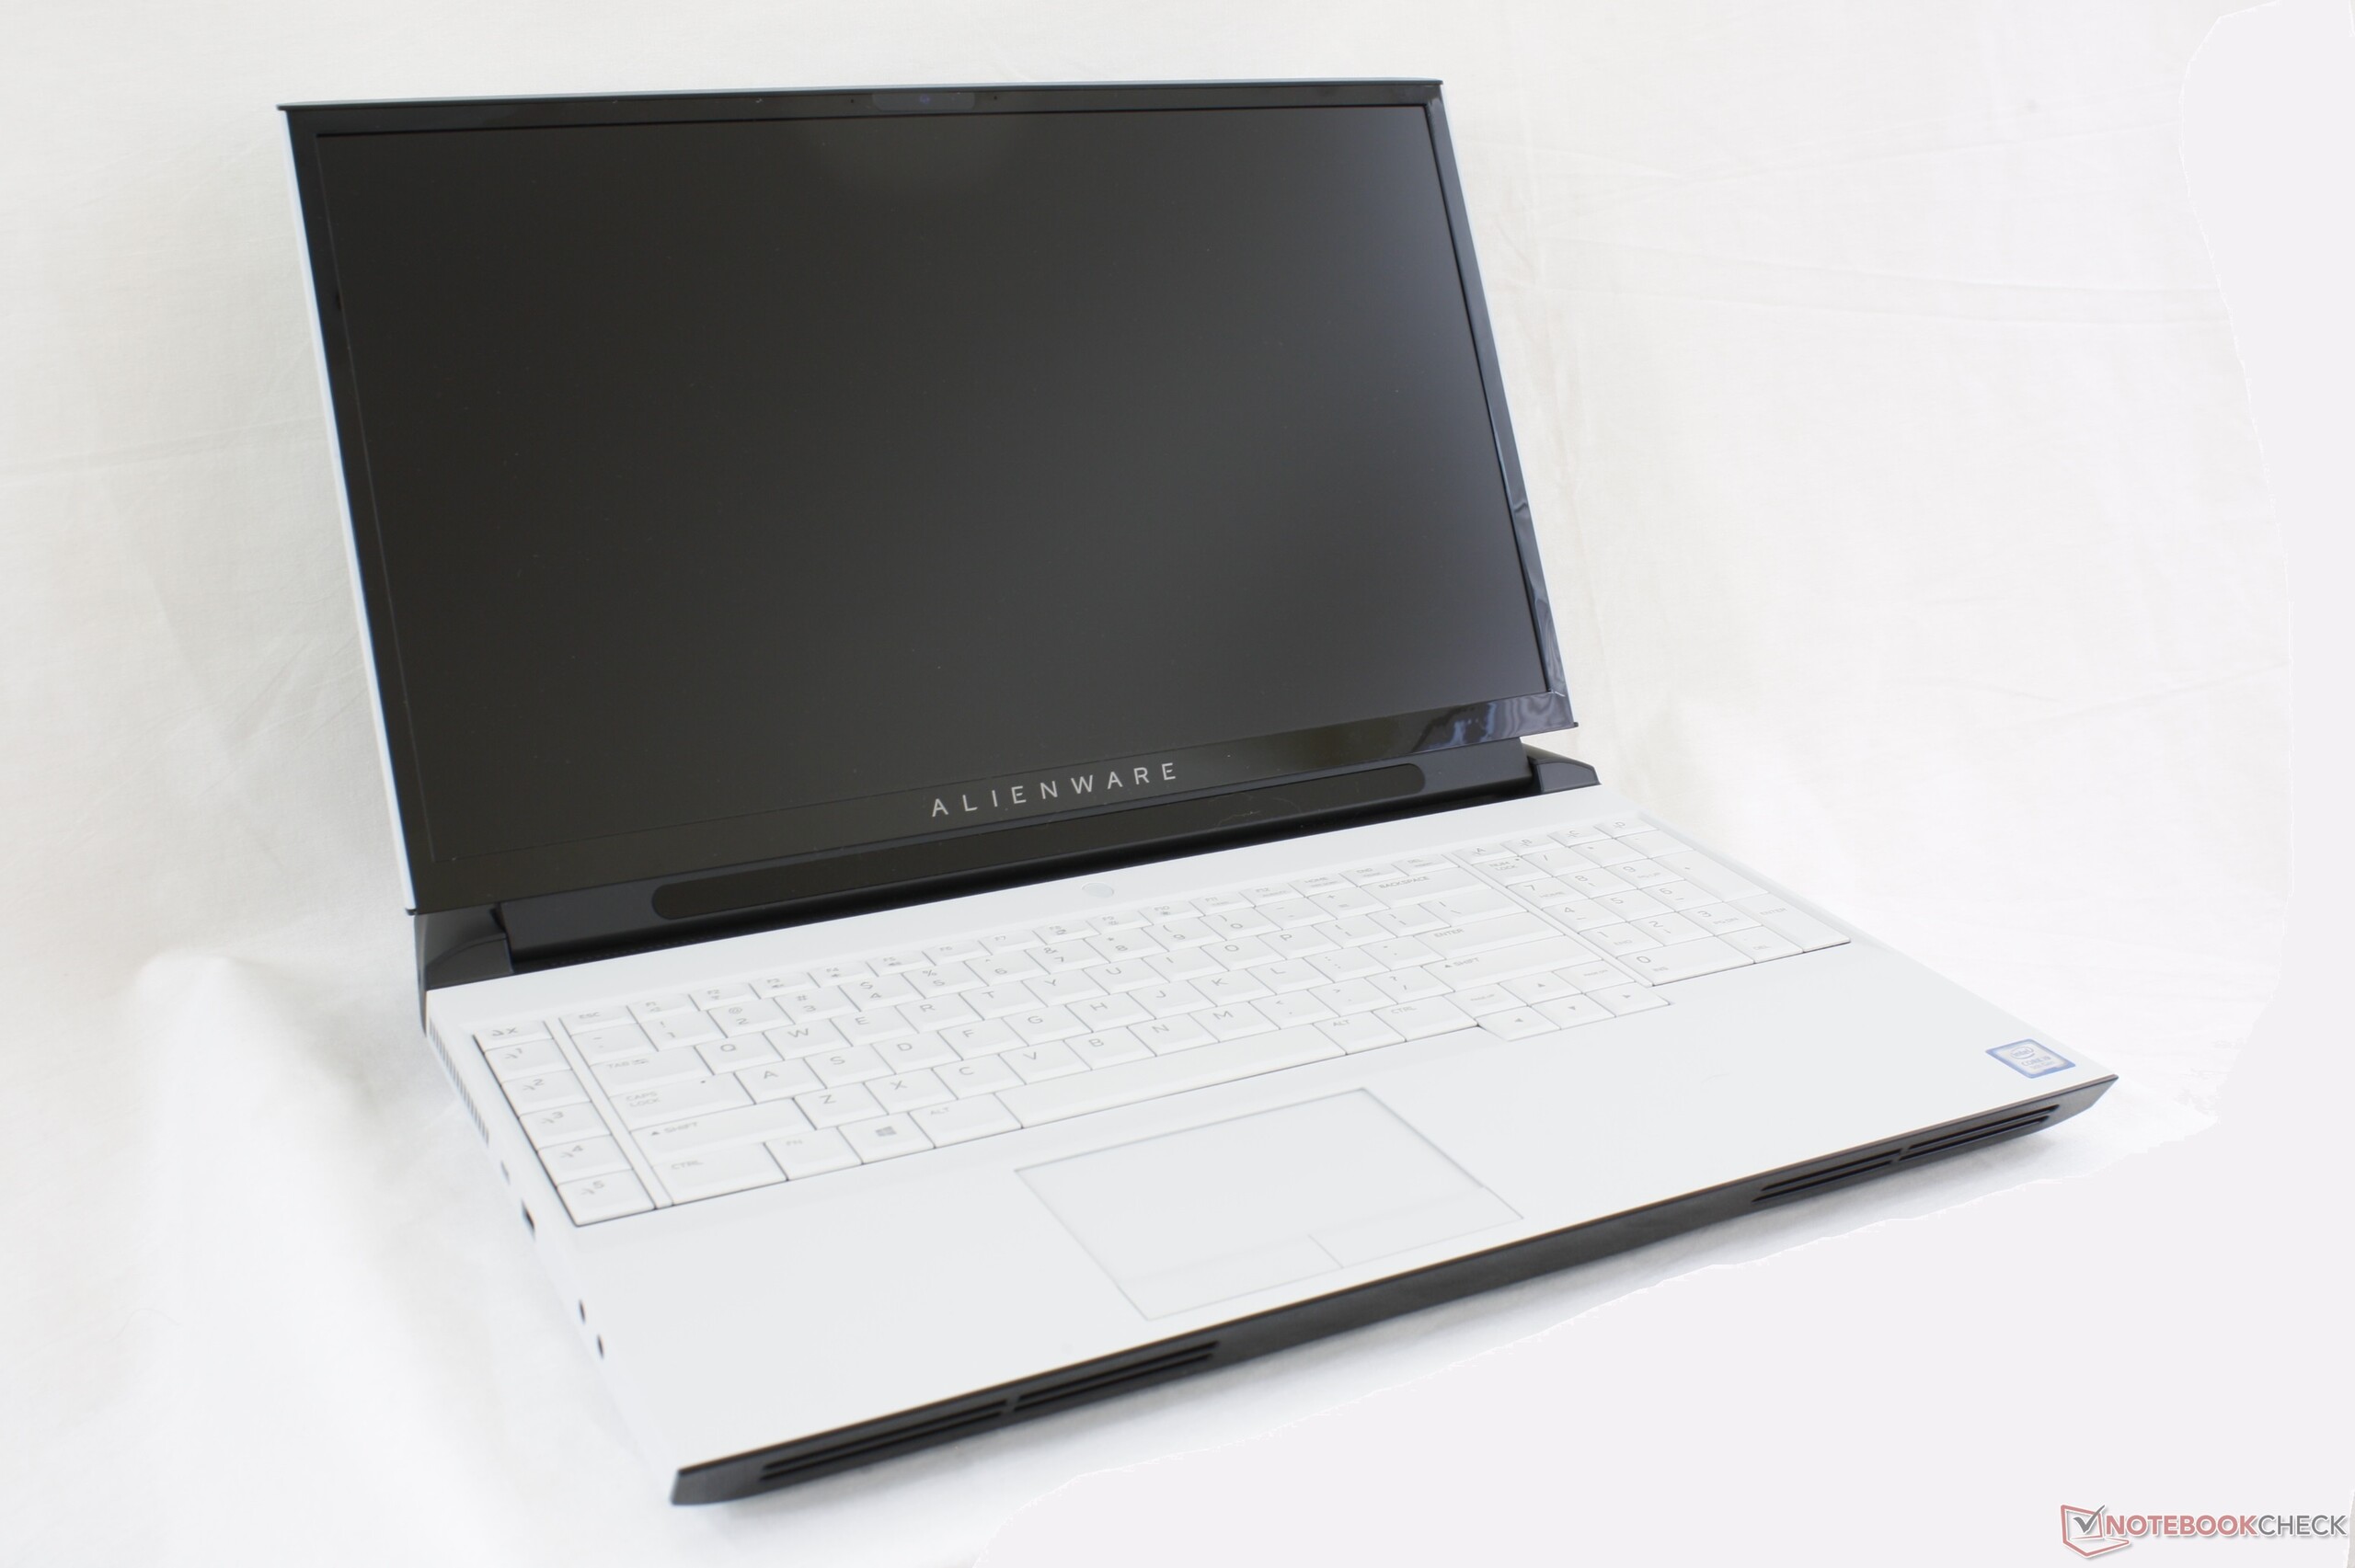
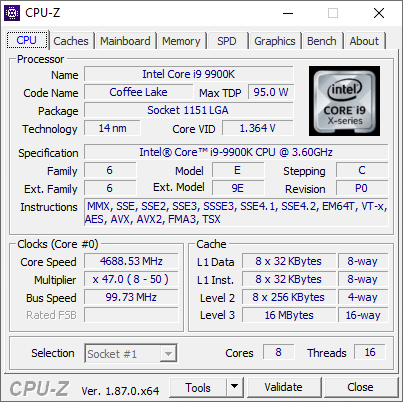
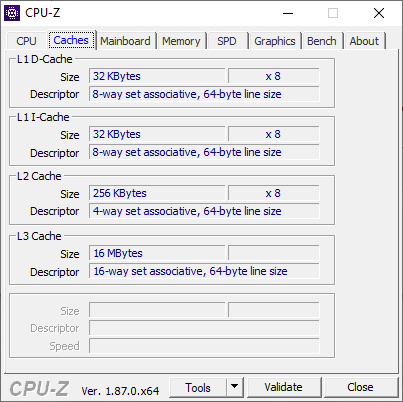
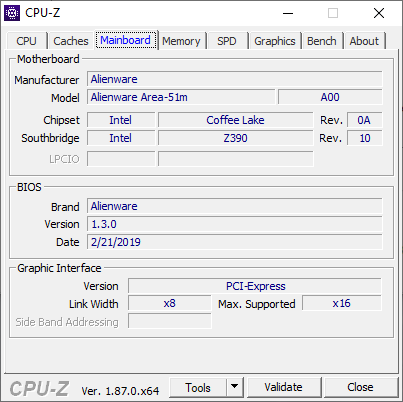
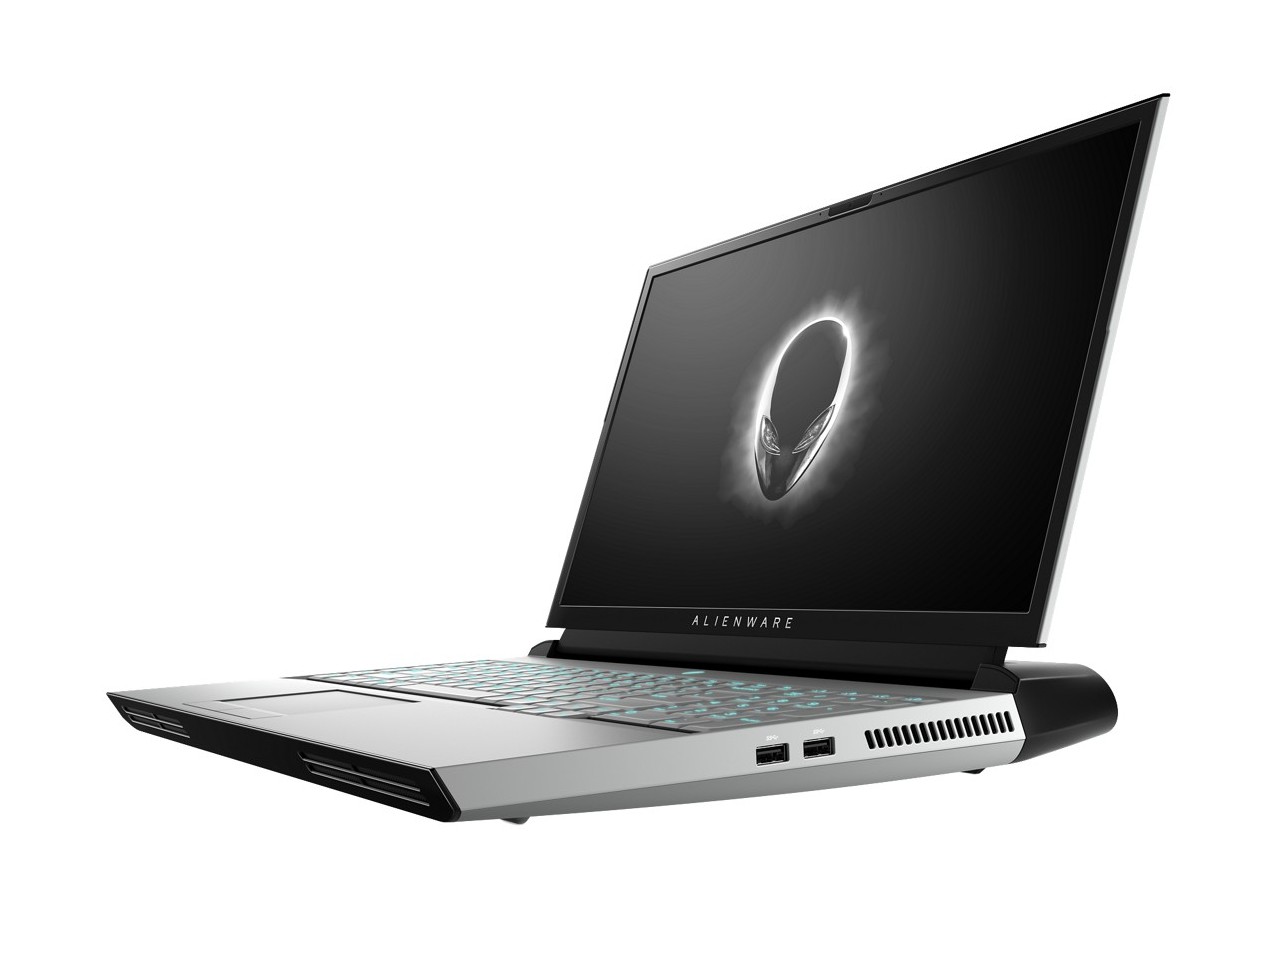
外星人Area-51m (i9-9900K, RTX 2080)笔记本电脑评测
| Networking | |
| iperf3 transmit AX12 | |
| Asus ROG G703GX | |
| MSI GT75 8RG-090 Titan | |
| Alienware Area-51m i9-9900K RTX 2080 | |
| Alienware 17 R5 | |
| iperf3 receive AX12 | |
| MSI GT75 8RG-090 Titan | |
| Asus ROG G703GX | |
| Alienware 17 R5 | |
| Alienware Area-51m i9-9900K RTX 2080 | |
| |||||||||||||||||||||||||
Brightness Distribution: 82 %
Center on Battery: 355.2 cd/m²
Contrast: 508:1 (Black: 0.66 cd/m²)
ΔE ColorChecker Calman: 2.02 | ∀{0.5-29.43 Ø4.73}
calibrated: 1.17
ΔE Greyscale Calman: 3.2 | ∀{0.09-98 Ø4.97}
96.9% sRGB (Argyll 1.6.3 3D)
61.3% AdobeRGB 1998 (Argyll 1.6.3 3D)
66.5% AdobeRGB 1998 (Argyll 3D)
96.9% sRGB (Argyll 3D)
66.3% Display P3 (Argyll 3D)
Gamma: 2.16
CCT: 6746 K
| Alienware Area-51m i9-9900K RTX 2080 LG Philips 173WFG, IPS, 17.3", 1920x1080 | MSI GT75 8RG-090 Titan CMN N173HHE-G32 (CMN1747), TN, 17.3", 1920x1080 | Asus ROG G703GX AU Optronics B173HAN03.2 (AUO329D), IPS, 17.3", 1920x1080 | Eurocom Sky X7C i9-9900K AU Optronics B173HAN03.1, IPS, 17.3", 1920x1080 | Razer Blade Pro 2017 Sharp LQ173D1JW33 (SHP145A), IGZO, 17.3", 3840x2160 | Alienware 17 R5 JYWWF_B173QTN (AUO1496), TN, 17.3", 2560x1440 | |
|---|---|---|---|---|---|---|
| Display | 23% | -3% | -4% | 29% | -7% | |
| Display P3 Coverage (%) | 66.3 | 90.9 37% | 64.1 -3% | 64.7 -2% | 88.9 34% | 63.4 -4% |
| sRGB Coverage (%) | 96.9 | 100 3% | 93.3 -4% | 89.1 -8% | 100 3% | 86.1 -11% |
| AdobeRGB 1998 Coverage (%) | 66.5 | 86.2 30% | 65.6 -1% | 65.2 -2% | 99.7 50% | 62.9 -5% |
| Response Times | 44% | 28% | -18% | -309% | -7% | |
| Response Time Grey 50% / Grey 80% * (ms) | 13.2 ? | 8 ? 39% | 7.2 ? 45% | 18 ? -36% | 60.8 ? -361% | 20.8 ? -58% |
| Response Time Black / White * (ms) | 10.8 ? | 5.6 ? 48% | 9.6 ? 11% | 10.8 ? -0% | 38.4 ? -256% | 6 ? 44% |
| PWM Frequency (Hz) | 26000 ? | 204.9 ? | ||||
| Screen | 19% | -9% | -18% | -8% | -27% | |
| Brightness middle (cd/m²) | 335.2 | 240 -28% | 296 -12% | 276.1 -18% | 230 -31% | 398 19% |
| Brightness (cd/m²) | 297 | 248 -16% | 279 -6% | 260 -12% | 207 -30% | 367 24% |
| Brightness Distribution (%) | 82 | 83 1% | 85 4% | 85 4% | 83 1% | 86 5% |
| Black Level * (cd/m²) | 0.66 | 0.22 67% | 0.25 62% | 0.36 45% | 0.2 70% | 0.51 23% |
| Contrast (:1) | 508 | 1091 115% | 1184 133% | 767 51% | 1150 126% | 780 54% |
| Colorchecker dE 2000 * | 2.02 | 2.14 -6% | 4.77 -136% | 3.51 -74% | 5.62 -178% | 5.45 -170% |
| Colorchecker dE 2000 max. * | 7.23 | 5.04 30% | 9.08 -26% | 6.84 5% | 10.24 -42% | 10.36 -43% |
| Colorchecker dE 2000 calibrated * | 1.17 | 1.54 -32% | 1.46 -25% | 3.56 -204% | 2.56 -119% | |
| Greyscale dE 2000 * | 3.2 | 1.62 49% | 5.83 -82% | 2.7 16% | 4.54 -42% | 5.4 -69% |
| Gamma | 2.16 102% | 2.28 96% | 2.47 89% | 2.28 96% | 2.36 93% | 2.4 92% |
| CCT | 6746 96% | 6846 95% | 8076 80% | 6947 94% | 6625 98% | 7453 87% |
| Color Space (Percent of AdobeRGB 1998) (%) | 61.3 | 77 26% | 60 -2% | 57.8 -6% | 88 44% | 56 -9% |
| Color Space (Percent of sRGB) (%) | 96.9 | 100 3% | 93 -4% | 88.8 -8% | 100 3% | 86 -11% |
| Total Average (Program / Settings) | 29% /
23% | 5% /
-3% | -13% /
-16% | -96% /
-41% | -14% /
-21% |
* ... smaller is better
Display Response Times
| ↔ Response Time Black to White | ||
|---|---|---|
| 10.8 ms ... rise ↗ and fall ↘ combined | ↗ 6 ms rise | 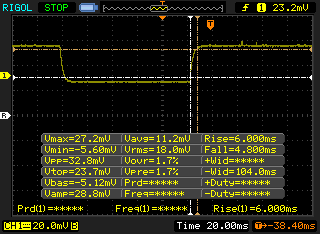 |
| ↘ 4.8 ms fall | ||
| The screen shows good response rates in our tests, but may be too slow for competitive gamers. In comparison, all tested devices range from 0.1 (minimum) to 240 (maximum) ms. » 29 % of all devices are better. This means that the measured response time is better than the average of all tested devices (19.9 ms). | ||
| ↔ Response Time 50% Grey to 80% Grey | ||
| 13.2 ms ... rise ↗ and fall ↘ combined | ↗ 8 ms rise | 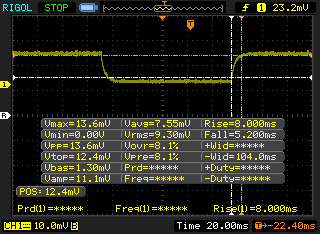 |
| ↘ 5.2 ms fall | ||
| The screen shows good response rates in our tests, but may be too slow for competitive gamers. In comparison, all tested devices range from 0.165 (minimum) to 636 (maximum) ms. » 27 % of all devices are better. This means that the measured response time is better than the average of all tested devices (31.1 ms). | ||
Screen Flickering / PWM (Pulse-Width Modulation)
| Screen flickering / PWM not detected | 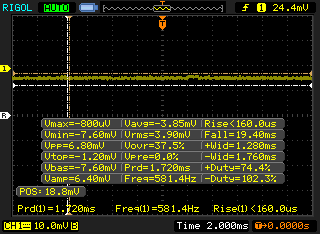 | ||
In comparison: 52 % of all tested devices do not use PWM to dim the display. If PWM was detected, an average of 7794 (minimum: 5 - maximum: 343500) Hz was measured. | |||
| Cinebench R15 | |
| CPU Single 64Bit | |
| Notebookcheck Desktop PC 2018 | |
| Average Intel Core i9-9900K (203 - 218, n=9) | |
| Alienware Area-51m i9-9900K RTX 2080 | |
| MSI GT75 8RG-090 Titan | |
| Eurocom Sky X9C | |
| AMD Threadripper 2970WX, AMD Radeon RX Vega 64 | |
| Alienware 17 R5 | |
| Dell G3 17 3779 | |
| Alienware 15 R3 | |
| Razer Blade Pro 2017 | |
| Asus GL702ZC-GC104T | |
| CPU Multi 64Bit | |
| AMD Threadripper 2970WX, AMD Radeon RX Vega 64 | |
| Notebookcheck Desktop PC 2018 | |
| Alienware Area-51m i9-9900K RTX 2080 | |
| Average Intel Core i9-9900K (1623 - 2040, n=9) | |
| Asus GL702ZC-GC104T | |
| MSI GT75 8RG-090 Titan | |
| Eurocom Sky X9C | |
| Alienware 17 R5 | |
| Dell G3 17 3779 | |
| Razer Blade Pro 2017 | |
| Alienware 15 R3 | |
| Cinebench R11.5 | |
| CPU Single 64Bit | |
| Average Intel Core i9-9900K (2.33 - 2.44, n=5) | |
| MSI GT75 8RG-090 Titan | |
| Eurocom Sky X9C | |
| Alienware 17 R5 | |
| Dell G3 17 3779 | |
| AMD Threadripper 2970WX, AMD Radeon RX Vega 64 | |
| Alienware 15 R3 | |
| Razer Blade Pro 2017 | |
| Asus GL702ZC-GC104T | |
| CPU Multi 64Bit | |
| AMD Threadripper 2970WX, AMD Radeon RX Vega 64 | |
| Average Intel Core i9-9900K (17.4 - 21.8, n=5) | |
| Asus GL702ZC-GC104T | |
| MSI GT75 8RG-090 Titan | |
| Eurocom Sky X9C | |
| Alienware 17 R5 | |
| Dell G3 17 3779 | |
| Razer Blade Pro 2017 | |
| Alienware 15 R3 | |
| Cinebench R10 | |
| Rendering Multiple CPUs 32Bit | |
| Average Intel Core i9-9900K (36683 - 49142, n=4) | |
| Eurocom Sky X9C | |
| AMD Threadripper 2970WX, AMD Radeon RX Vega 64 | |
| Asus GL702ZC-GC104T | |
| Dell G3 17 3779 | |
| Rendering Single 32Bit | |
| Average Intel Core i9-9900K (7786 - 8042, n=4) | |
| Eurocom Sky X9C | |
| Dell G3 17 3779 | |
| AMD Threadripper 2970WX, AMD Radeon RX Vega 64 | |
| Asus GL702ZC-GC104T | |
| wPrime 2.10 - 1024m | |
| Eurocom Sky X9C | |
| Average Intel Core i9-9900K (85.6 - 98.7, n=3) | |
| AMD Threadripper 2970WX, AMD Radeon RX Vega 64 | |
* ... smaller is better
| PCMark 10 | |
| Score | |
| Eurocom Sky X7C i9-9900K | |
| Intel Core i9-9900K, AMD Radeon RX Vega 64 | |
| Alienware Area-51m i9-9900K RTX 2080 | |
| MSI GT75 8RG-090 Titan | |
| Asus ROG G703GX | |
| Alienware 17 R5 | |
| Razer Blade Pro 2017 | |
| Essentials | |
| Eurocom Sky X7C i9-9900K | |
| Alienware Area-51m i9-9900K RTX 2080 | |
| Intel Core i9-9900K, AMD Radeon RX Vega 64 | |
| MSI GT75 8RG-090 Titan | |
| Asus ROG G703GX | |
| Alienware 17 R5 | |
| Razer Blade Pro 2017 | |
| Productivity | |
| Intel Core i9-9900K, AMD Radeon RX Vega 64 | |
| MSI GT75 8RG-090 Titan | |
| Eurocom Sky X7C i9-9900K | |
| Alienware Area-51m i9-9900K RTX 2080 | |
| Asus ROG G703GX | |
| Alienware 17 R5 | |
| Razer Blade Pro 2017 | |
| Digital Content Creation | |
| Eurocom Sky X7C i9-9900K | |
| Alienware Area-51m i9-9900K RTX 2080 | |
| Intel Core i9-9900K, AMD Radeon RX Vega 64 | |
| MSI GT75 8RG-090 Titan | |
| Asus ROG G703GX | |
| Alienware 17 R5 | |
| Razer Blade Pro 2017 | |
| PCMark 8 | |
| Home Score Accelerated v2 | |
| MSI GT75 8RG-090 Titan | |
| Eurocom Sky X7C i9-9900K | |
| Alienware Area-51m i9-9900K RTX 2080 | |
| Intel Core i9-9900K, AMD Radeon RX Vega 64 | |
| Asus ROG G703GX | |
| Razer Blade Pro 2017 | |
| Work Score Accelerated v2 | |
| Eurocom Sky X7C i9-9900K | |
| Alienware Area-51m i9-9900K RTX 2080 | |
| Intel Core i9-9900K, AMD Radeon RX Vega 64 | |
| MSI GT75 8RG-090 Titan | |
| Asus ROG G703GX | |
| Razer Blade Pro 2017 | |
| PCMark 8 Home Score Accelerated v2 | 5607 points | |
| PCMark 8 Work Score Accelerated v2 | 6140 points | |
| PCMark 10 Score | 7006 points | |
Help | ||
| Alienware Area-51m i9-9900K RTX 2080 2x SK Hynix PC400 512GB (RAID 0) | MSI GT75 8RG-090 Titan 2x Samsung PM961 MZVLW256HEHP (RAID 0) | Asus ROG G703GX Samsung SSD PM981 MZVLB512HAJQ | Eurocom Sky X7C i9-9900K 2x Samsung SSD 970 Pro 512GB (RAID 0) | Razer Blade Pro 2017 2x Samsung SSD PM951 MZVLV256HCHP (RAID 0) | |
|---|---|---|---|---|---|
| AS SSD | 11% | 4% | 20% | -11% | |
| Seq Read (MB/s) | 2082 | 3058 47% | 1632 -22% | 2323 12% | 2599 25% |
| Seq Write (MB/s) | 2335 | 2196 -6% | 1767 -24% | 2887 24% | 588 -75% |
| 4K Read (MB/s) | 24.14 | 38.37 59% | 50.4 109% | 30.51 26% | 37.57 56% |
| 4K Write (MB/s) | 91.8 | 97.7 6% | 101.9 11% | 131.8 44% | 104.4 14% |
| 4K-64 Read (MB/s) | 1561 | 1347 -14% | 1196 -23% | 1507 -3% | 1116 -29% |
| 4K-64 Write (MB/s) | 1350 | 1236 -8% | 1631 21% | 1483 10% | 513 -62% |
| Access Time Read * (ms) | 0.121 | 0.056 54% | 0.061 50% | 0.032 74% | 0.051 58% |
| Access Time Write * (ms) | 0.039 | 0.038 3% | 0.037 5% | 0.028 28% | 0.036 8% |
| Score Read (Points) | 1793 | 1691 -6% | 1410 -21% | 1770 -1% | 1414 -21% |
| Score Write (Points) | 1675 | 1553 -7% | 1910 14% | 1904 14% | 676 -60% |
| Score Total (Points) | 4390 | 4066 -7% | 4057 -8% | 4602 5% | 2715 -38% |
| Copy ISO MB/s (MB/s) | 2175 | 2048 -6% | 3044 40% | ||
| Copy Program MB/s (MB/s) | 582 | 428.5 -26% | 574 -1% | ||
| Copy Game MB/s (MB/s) | 1479 | 1173 -21% | 1489 1% |
* ... smaller is better

| 3DMark | |
| 1920x1080 Fire Strike Graphics | |
| Eurocom Sky X9C | |
| 1200 Nvidia GeForce GTX 1080 Ti FE Asus Prime B350-PLUS | |
| Asus ROG Strix RTX 2080 OC | |
| Alienware Area-51m i9-9900K RTX 2080 | |
| Eurocom Sky X7C i9-9900K | |
| Average NVIDIA GeForce RTX 2080 Mobile (22504 - 27319, n=16) | |
| Intel Core i9-9900K, AMD Radeon RX Vega 64 | |
| Notebookcheck Desktop PC 2018 | |
| Asus Zephyrus S GX701GX | |
| MSI GT75 8RG-090 Titan | |
| MSI GE75 8SF | |
| Razer Blade Pro 2017 | |
| Alienware 17 R5 | |
| Asus GL702ZC-GC104T | |
| Dell G3 17 3779 | |
| 2560x1440 Time Spy Graphics | |
| Asus ROG Strix RTX 2080 OC | |
| Alienware Area-51m i9-9900K RTX 2080 | |
| Average NVIDIA GeForce RTX 2080 Mobile (9411 - 10992, n=15) | |
| Eurocom Sky X7C i9-9900K | |
| 1200 Nvidia GeForce GTX 1080 Ti FE Asus Prime B350-PLUS | |
| Asus Zephyrus S GX701GX | |
| MSI GE75 8SF | |
| Notebookcheck Desktop PC 2018 | |
| Intel Core i9-9900K, AMD Radeon RX Vega 64 | |
| Razer Blade Pro 2017 | |
| Alienware 17 R5 | |
| Asus GL702ZC-GC104T | |
| 2560x1440 Port Royal Graphics | |
| Alienware Area-51m i9-9900K RTX 2080 | |
| Average NVIDIA GeForce RTX 2080 Mobile (5377 - 6005, n=14) | |
| Eurocom Sky X7C i9-9900K | |
| Asus Zephyrus S GX701GX | |
| MSI GE75 8SF | |
| 3840x2160 Fire Strike Ultra Graphics | |
| Eurocom Sky X9C | |
| Asus ROG Strix RTX 2080 OC | |
| Alienware Area-51m i9-9900K RTX 2080 | |
| Average NVIDIA GeForce RTX 2080 Mobile (5511 - 6077, n=8) | |
| Eurocom Sky X7C i9-9900K | |
| Intel Core i9-9900K, AMD Radeon RX Vega 64 | |
| MSI GE75 8SF | |
| 3DMark 11 | |
| 1280x720 Performance GPU | |
| Eurocom Sky X9C | |
| Asus ROG Strix RTX 2080 OC | |
| Alienware Area-51m i9-9900K RTX 2080 | |
| 1200 Nvidia GeForce GTX 1080 Ti FE Asus Prime B350-PLUS | |
| Average NVIDIA GeForce RTX 2080 Mobile (31826 - 38809, n=17) | |
| Eurocom Sky X7C i9-9900K | |
| Notebookcheck Desktop PC 2018 | |
| Asus Zephyrus S GX701GX | |
| MSI GT75 8RG-090 Titan | |
| MSI GE75 8SF | |
| Razer Blade Pro 2017 | |
| Alienware 17 R5 | |
| Asus GL702ZC-GC104T | |
| Dell G3 17 3779 | |
| 1280x720 Performance Combined | |
| Eurocom Sky X7C i9-9900K | |
| Alienware Area-51m i9-9900K RTX 2080 | |
| Notebookcheck Desktop PC 2018 | |
| Average NVIDIA GeForce RTX 2080 Mobile (9038 - 18934, n=17) | |
| Eurocom Sky X9C | |
| MSI GT75 8RG-090 Titan | |
| Asus ROG Strix RTX 2080 OC | |
| Asus Zephyrus S GX701GX | |
| Alienware 17 R5 | |
| Razer Blade Pro 2017 | |
| Asus GL702ZC-GC104T | |
| MSI GE75 8SF | |
| Dell G3 17 3779 | |
| 1200 Nvidia GeForce GTX 1080 Ti FE Asus Prime B350-PLUS | |
| 3DMark 11 Performance | 29759 points | |
| 3DMark Cloud Gate Standard Score | 59224 points | |
| 3DMark Fire Strike Score | 23195 points | |
| 3DMark Time Spy Score | 10704 points | |
Help | ||
| Metro Exodus - 1920x1080 Ultra Quality AF:16x | |
| Alienware Area-51m i9-9900K RTX 2080 | |
| MSI RTX 2080 Gaming X Trio | |
| MSI GeForce GTX 1080 | |
| Schenker XMG Neo 17 | |
| MSI RTX 2060 Gaming Z 6G | |
| i7-7740X Asus X299 Prime | |
| Acer Predator Triton 700 | |
| Gigabyte Aero 15-Y9 | |
| Schenker XMG Neo 15 Turing | |
| The Witcher 3 - 1920x1080 Ultra Graphics & Postprocessing (HBAO+) | |
| MSI RTX 2080 Gaming X Trio | |
| Alienware Area-51m i9-9900K RTX 2080 | |
| Schenker XMG Neo 17 | |
| MSI RTX 2060 Gaming Z 6G | |
| Gigabyte Aero 15-Y9 | |
| Schenker XMG Neo 15 Turing | |
| low | med. | high | ultra | |
|---|---|---|---|---|
| BioShock Infinite (2013) | 447.6 | 380.6 | 348 | 213.4 |
| The Witcher 3 (2015) | 382.5 | 273.3 | 194.4 | 101.1 |
| Rise of the Tomb Raider (2016) | 317 | 224.3 | 188.8 | 158.8 |
| Shadow of the Tomb Raider (2018) | 171 | 140 | 134 | 123 |
| Metro Exodus (2019) | 165 | 120.1 | 91.5 | 76.1 |
| Alienware Area-51m i9-9900K RTX 2080 GeForce RTX 2080 Mobile, i9-9900K, 2x SK Hynix PC400 512GB (RAID 0) | MSI GT75 8RG-090 Titan GeForce GTX 1080 Mobile, i9-8950HK, 2x Samsung PM961 MZVLW256HEHP (RAID 0) | Asus ROG G703GX GeForce RTX 2080 Mobile, i7-8750H, Samsung SSD PM981 MZVLB512HAJQ | Eurocom Sky X7C i9-9900K GeForce RTX 2080 Mobile, i9-9900K, 2x Samsung SSD 970 Pro 512GB (RAID 0) | HP Omen X 17-ap002ng GeForce GTX 1080 Mobile, i7-7820HK | Razer Blade Pro 2017 GeForce GTX 1080 Mobile, i7-7820HK, 2x Samsung SSD PM951 MZVLV256HCHP (RAID 0) | |
|---|---|---|---|---|---|---|
| Noise | -4% | -1% | 7% | 7% | 1% | |
| off / environment * (dB) | 28.1 | 30 -7% | 30 -7% | 28.9 -3% | 30 -7% | 30 -7% |
| Idle Minimum * (dB) | 28.1 | 32 -14% | 30 -7% | 29.7 -6% | 31.6 -12% | 30 -7% |
| Idle Average * (dB) | 28.6 | 34 -19% | 35 -22% | 29.7 -4% | 31.6 -10% | 31 -8% |
| Idle Maximum * (dB) | 51 | 37 27% | 41 20% | 30 41% | 31.7 38% | 33 35% |
| Load Average * (dB) | 51 | 43 16% | 44 14% | 36.5 28% | 38.4 25% | 43 16% |
| Witcher 3 ultra * (dB) | 51 | 57 -12% | 51 -0% | 49 4% | 47.2 7% | 55 -8% |
| Load Maximum * (dB) | 51 | 62 -22% | 52 -2% | 57 -12% | 48.1 6% | 58 -14% |
* ... smaller is better
Noise level
| Idle |
| 28.1 / 28.6 / 51 dB(A) |
| Load |
| 51 / 51 dB(A) |
 | ||
30 dB silent 40 dB(A) audible 50 dB(A) loud |
||
min: | ||
(-) The maximum temperature on the upper side is 47 °C / 117 F, compared to the average of 40.4 °C / 105 F, ranging from 21.2 to 68.8 °C for the class Gaming.
(-) The bottom heats up to a maximum of 58.8 °C / 138 F, compared to the average of 43.2 °C / 110 F
(+) In idle usage, the average temperature for the upper side is 27.8 °C / 82 F, compared to the device average of 33.9 °C / 93 F.
(±) Playing The Witcher 3, the average temperature for the upper side is 35.3 °C / 96 F, compared to the device average of 33.9 °C / 93 F.
(+) The palmrests and touchpad are reaching skin temperature as a maximum (32 °C / 89.6 F) and are therefore not hot.
(-) The average temperature of the palmrest area of similar devices was 28.8 °C / 83.8 F (-3.2 °C / -5.8 F).
Alienware Area-51m i9-9900K RTX 2080 audio analysis
(+) | speakers can play relatively loud (82.3 dB)
Bass 100 - 315 Hz
(±) | reduced bass - on average 11% lower than median
(±) | linearity of bass is average (14.5% delta to prev. frequency)
Mids 400 - 2000 Hz
(+) | balanced mids - only 3.4% away from median
(±) | linearity of mids is average (7.8% delta to prev. frequency)
Highs 2 - 16 kHz
(+) | balanced highs - only 2.8% away from median
(±) | linearity of highs is average (9.4% delta to prev. frequency)
Overall 100 - 16.000 Hz
(+) | overall sound is linear (11.9% difference to median)
Compared to same class
» 12% of all tested devices in this class were better, 4% similar, 84% worse
» The best had a delta of 6%, average was 18%, worst was 132%
Compared to all devices tested
» 9% of all tested devices were better, 2% similar, 89% worse
» The best had a delta of 4%, average was 24%, worst was 134%
Apple MacBook 12 (Early 2016) 1.1 GHz audio analysis
(+) | speakers can play relatively loud (83.6 dB)
Bass 100 - 315 Hz
(±) | reduced bass - on average 11.3% lower than median
(±) | linearity of bass is average (14.2% delta to prev. frequency)
Mids 400 - 2000 Hz
(+) | balanced mids - only 2.4% away from median
(+) | mids are linear (5.5% delta to prev. frequency)
Highs 2 - 16 kHz
(+) | balanced highs - only 2% away from median
(+) | highs are linear (4.5% delta to prev. frequency)
Overall 100 - 16.000 Hz
(+) | overall sound is linear (10.2% difference to median)
Compared to same class
» 7% of all tested devices in this class were better, 2% similar, 91% worse
» The best had a delta of 5%, average was 18%, worst was 53%
Compared to all devices tested
» 5% of all tested devices were better, 1% similar, 94% worse
» The best had a delta of 4%, average was 24%, worst was 134%
| Off / Standby | |
| Idle | |
| Load |
|
Key:
min: | |
| Alienware Area-51m i9-9900K RTX 2080 i9-9900K, GeForce RTX 2080 Mobile, 2x SK Hynix PC400 512GB (RAID 0), IPS, 1920x1080, 17.3" | MSI GT75 8RG-090 Titan i9-8950HK, GeForce GTX 1080 Mobile, 2x Samsung PM961 MZVLW256HEHP (RAID 0), TN, 1920x1080, 17.3" | Asus ROG G703GX i7-8750H, GeForce RTX 2080 Mobile, Samsung SSD PM981 MZVLB512HAJQ, IPS, 1920x1080, 17.3" | Eurocom Sky X7C i9-9900K i9-9900K, GeForce RTX 2080 Mobile, 2x Samsung SSD 970 Pro 512GB (RAID 0), IPS, 1920x1080, 17.3" | Razer Blade Pro 2017 i7-7820HK, GeForce GTX 1080 Mobile, 2x Samsung SSD PM951 MZVLV256HCHP (RAID 0), IGZO, 3840x2160, 17.3" | Alienware 17 R5 i7-8750H, GeForce GTX 1070 Mobile, SK hynix PC401 HFS256GD9TNG, TN, 2560x1440, 17.3" | |
|---|---|---|---|---|---|---|
| Power Consumption | -4% | 25% | -12% | 6% | 14% | |
| Idle Minimum * (Watt) | 23.3 | 31 -33% | 5 79% | 41.3 -77% | 31 -33% | 28 -20% |
| Idle Average * (Watt) | 33.5 | 35 -4% | 24 28% | 41.8 -25% | 36 -7% | 32 4% |
| Idle Maximum * (Watt) | 38.4 | 45 -17% | 42 -9% | 46.1 -20% | 44 -15% | 37 4% |
| Load Average * (Watt) | 114.1 | 130 -14% | 112 2% | 116.6 -2% | 107 6% | 112 2% |
| Witcher 3 ultra * (Watt) | 339.5 | 268 21% | 284 16% | 245.9 28% | 212 38% | 192 43% |
| Load Maximum * (Watt) | 485.1 | 374 23% | 320 34% | 352.6 27% | 258 47% | 231 52% |
* ... smaller is better
| Alienware Area-51m i9-9900K RTX 2080 i9-9900K, GeForce RTX 2080 Mobile, 90 Wh | MSI GT75 8RG-090 Titan i9-8950HK, GeForce GTX 1080 Mobile, 75 Wh | Asus ROG G703GX i7-8750H, GeForce RTX 2080 Mobile, 96 Wh | Eurocom Sky X7C i9-9900K i9-9900K, GeForce RTX 2080 Mobile, 82 Wh | Razer Blade Pro 2017 i7-7820HK, GeForce GTX 1080 Mobile, 99 Wh | Alienware 17 R5 i7-8750H, GeForce GTX 1070 Mobile, 99 Wh | |
|---|---|---|---|---|---|---|
| Battery runtime | 23% | 67% | -5% | 49% | 48% | |
| Reader / Idle (h) | 2.6 | 3.8 46% | 5 92% | 4.2 62% | 4.5 73% | |
| WiFi v1.3 (h) | 2.1 | 4 90% | 2 -5% | 3.3 57% | 3.6 71% | |
| Load (h) | 1.1 | 1.1 0% | 1.3 18% | 1.4 27% | 1.1 0% |
Pros
Cons
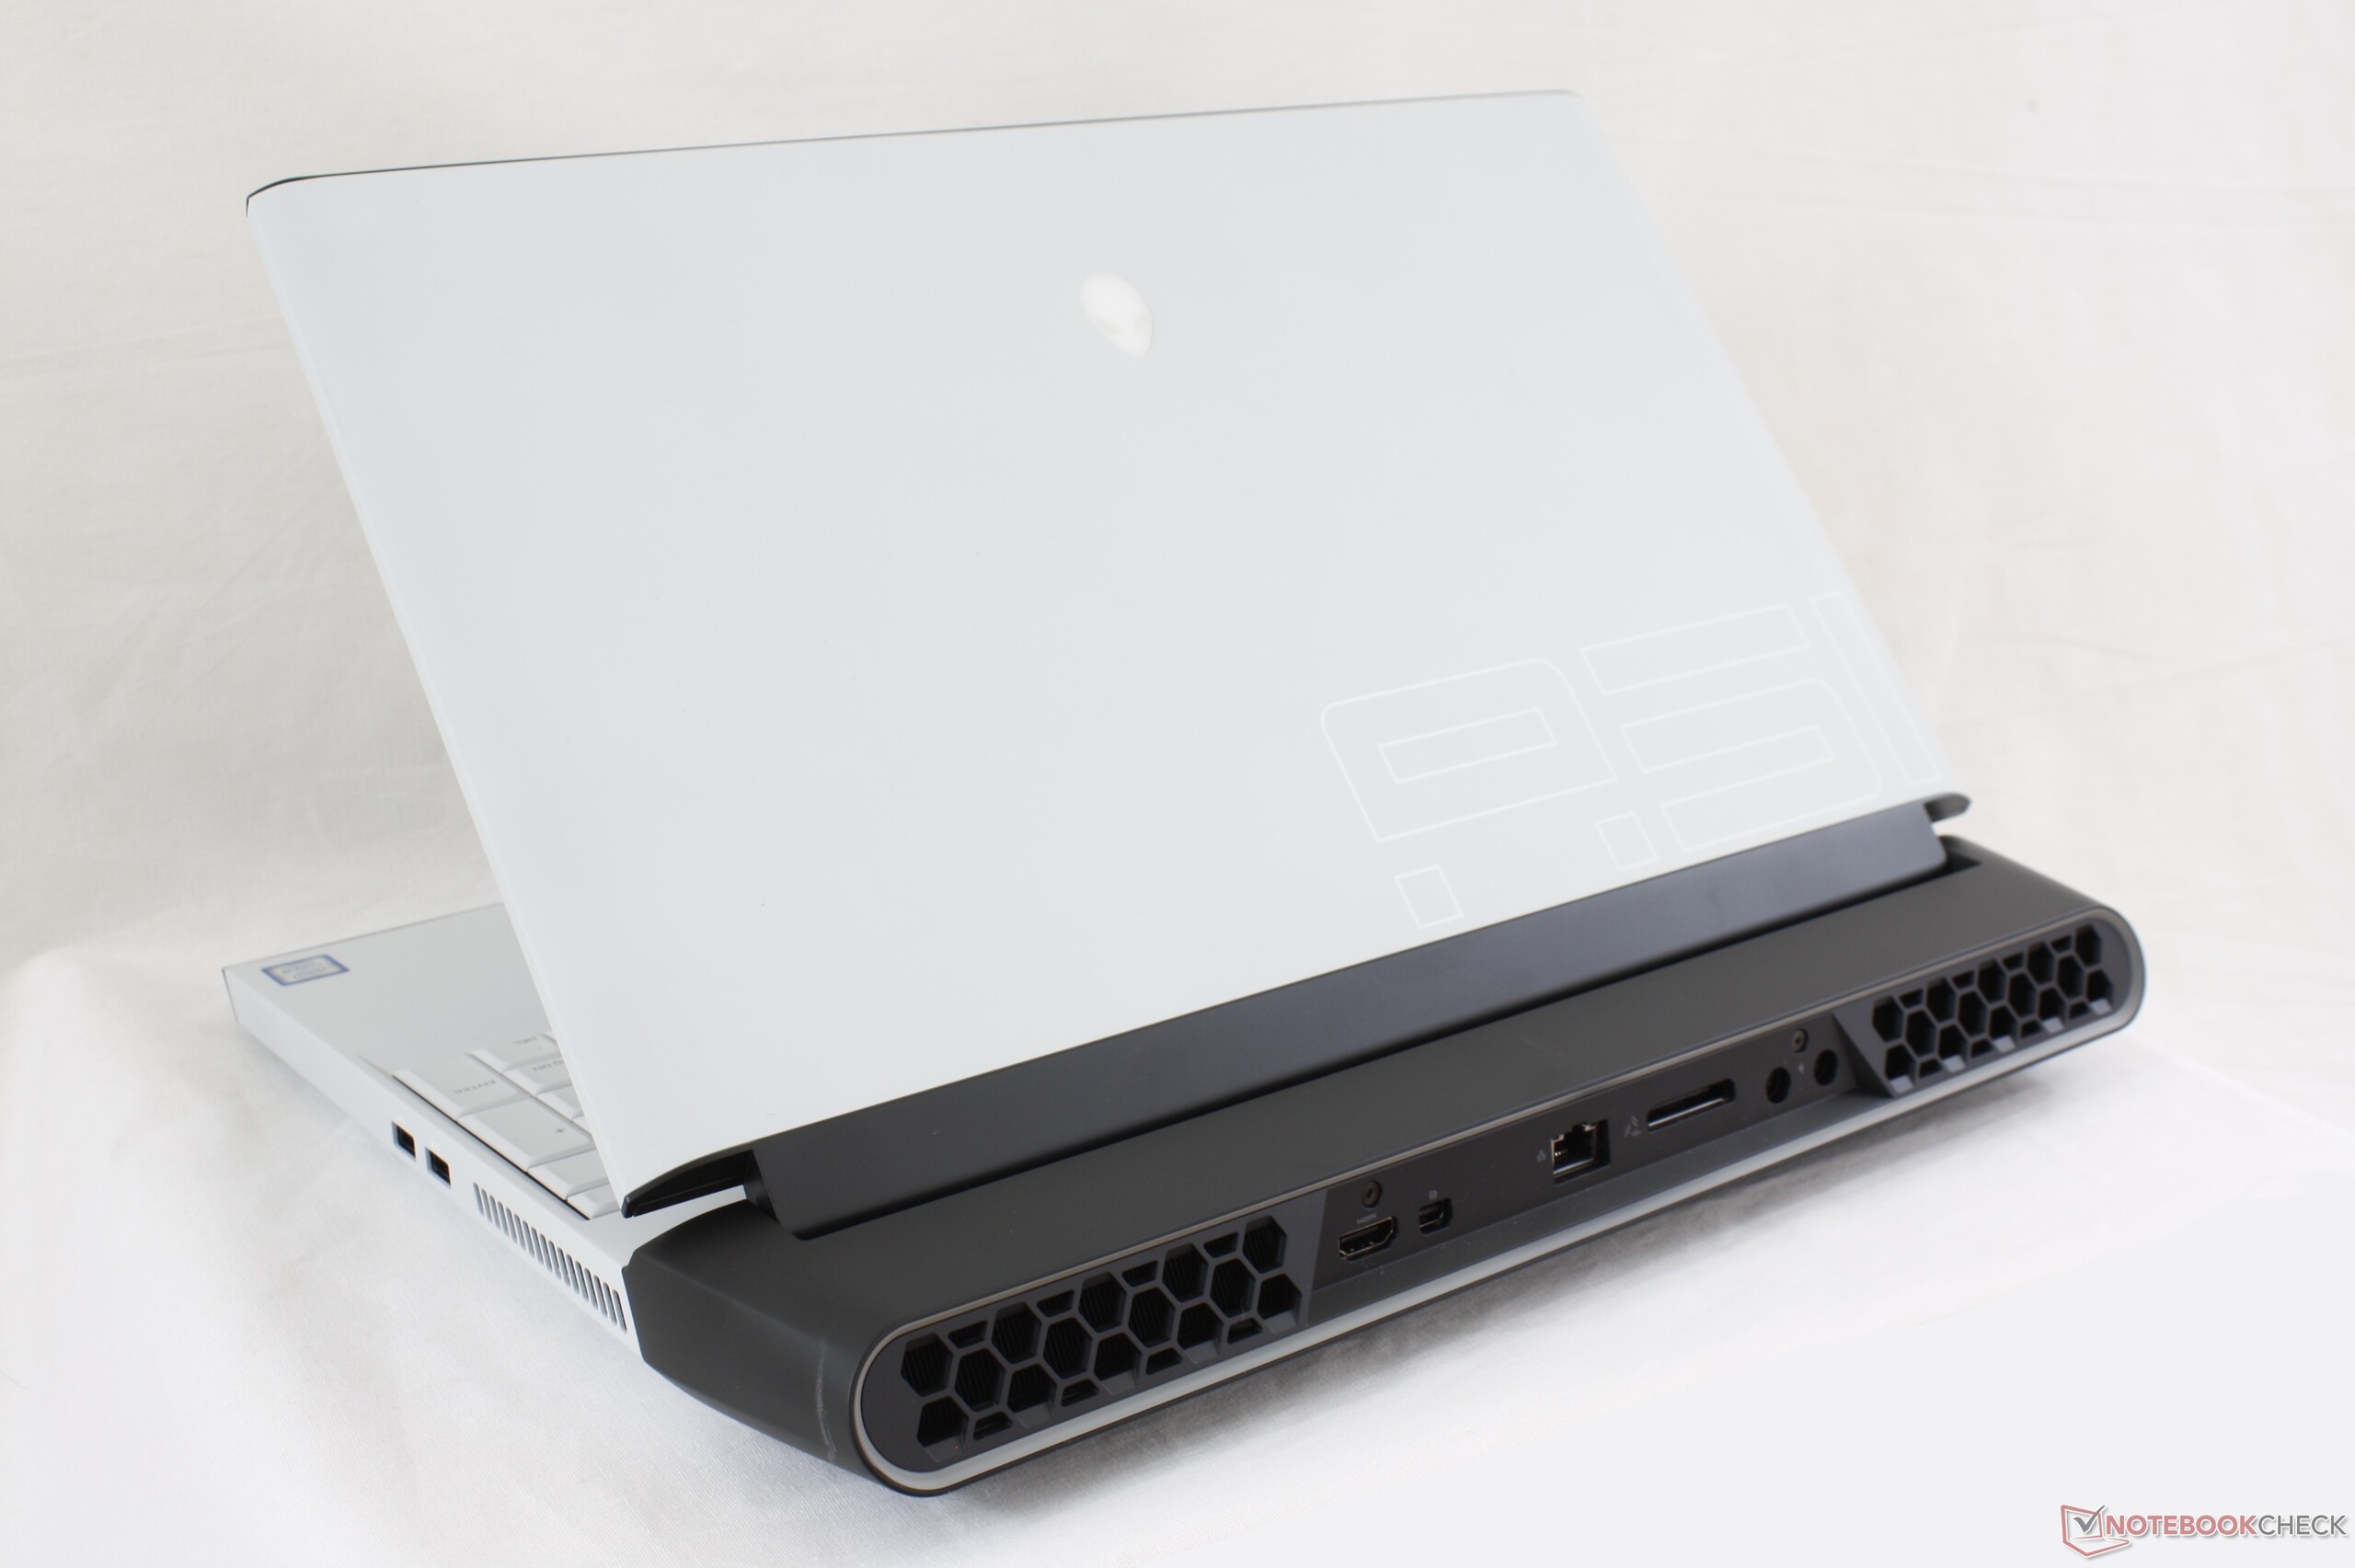
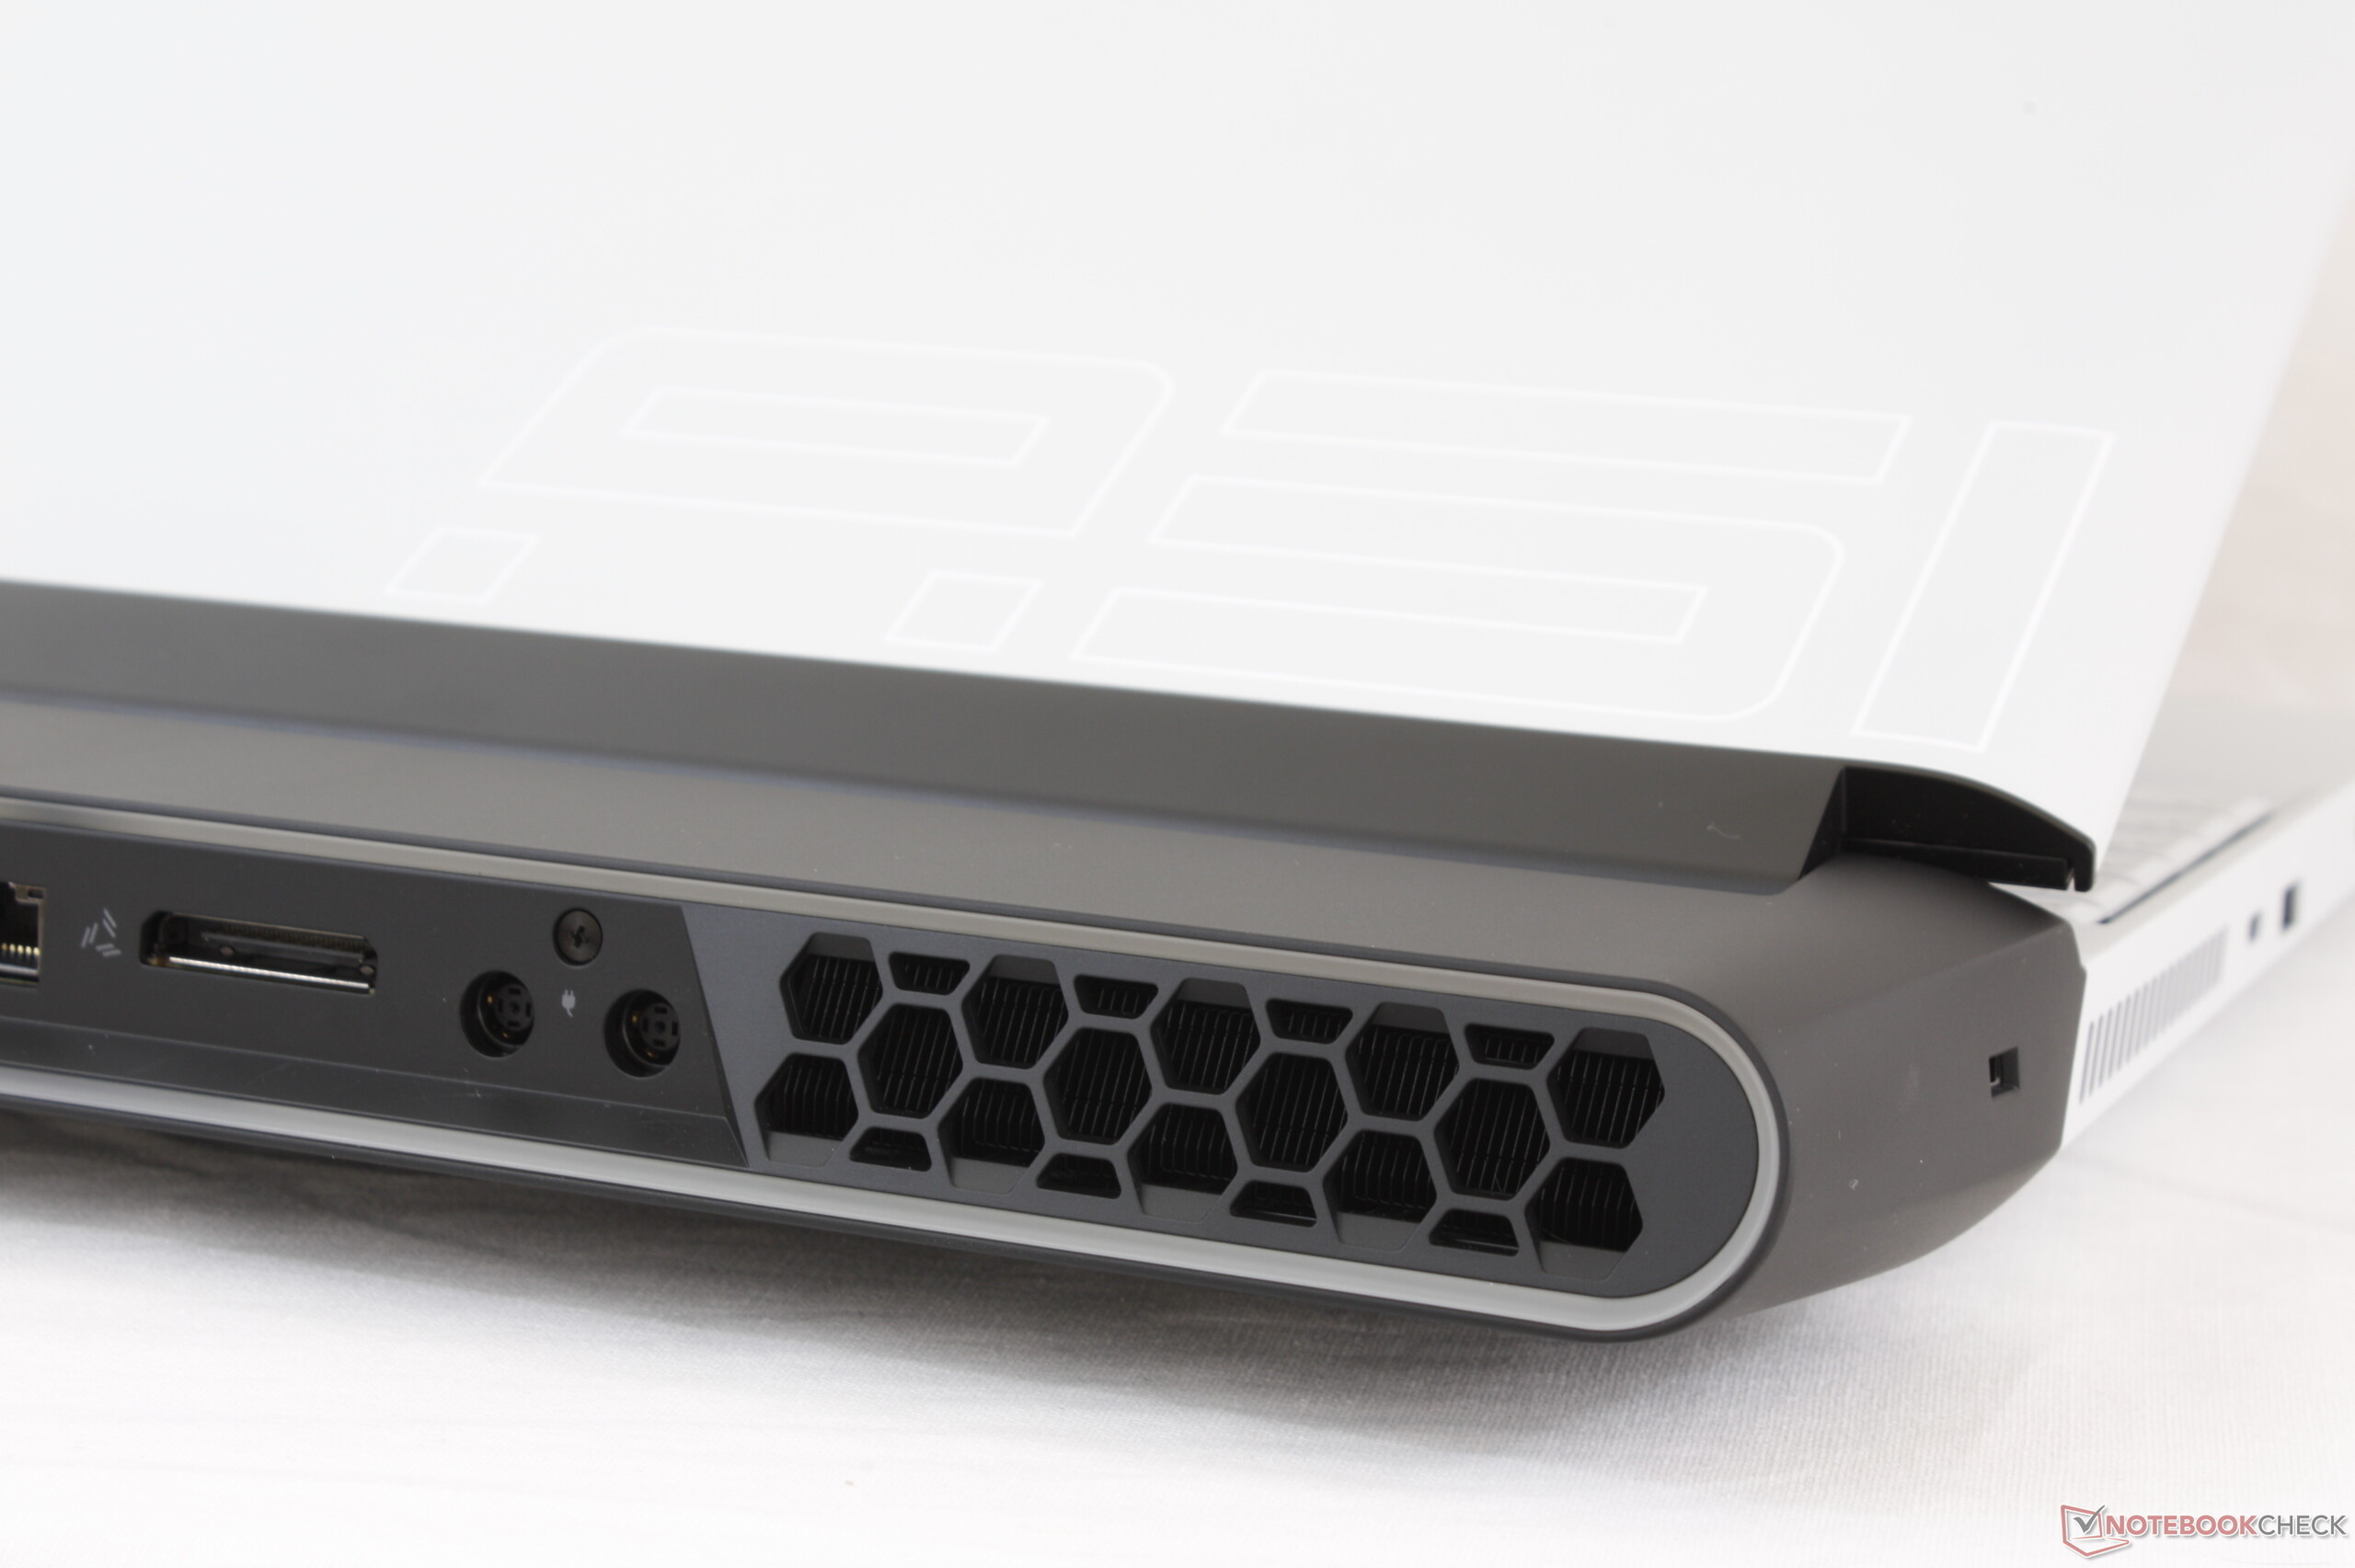
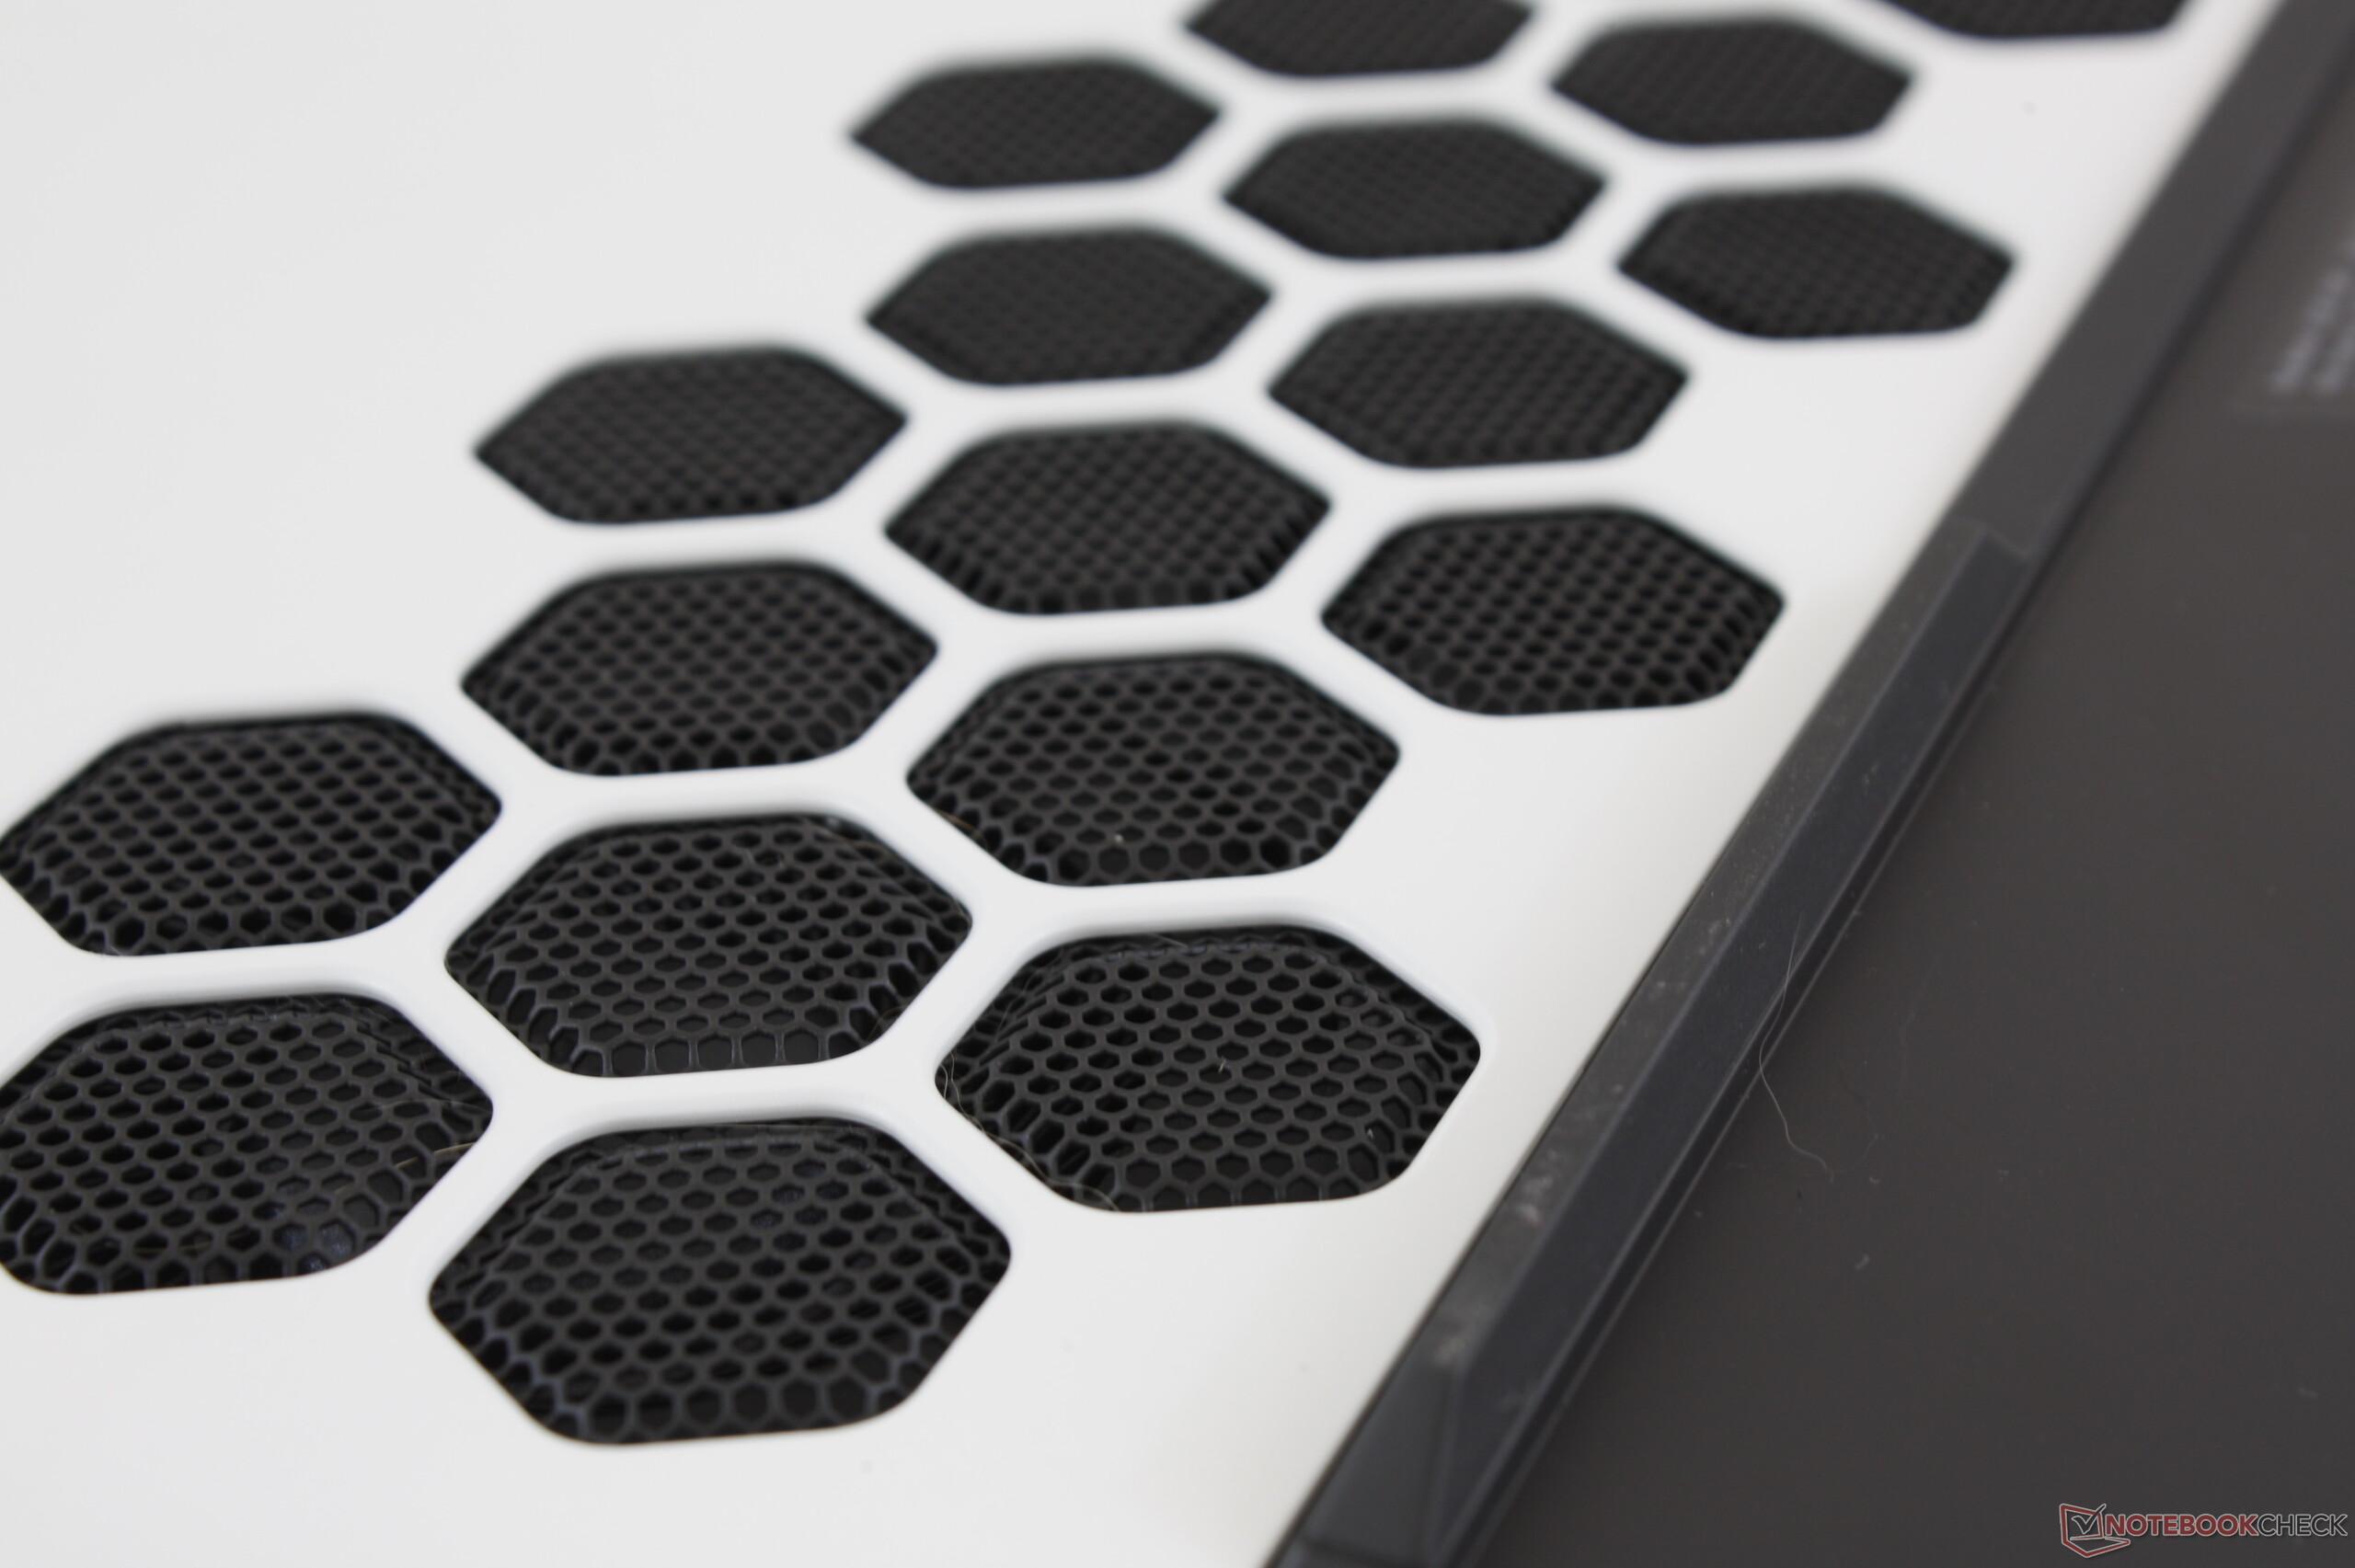
从换代的角度来看,Area-51m是Alienware 17 R5的值得尊敬的继承者。它保留了我们喜欢的旧型号地方(斜面键盘,坚固的设计,易于维修),同时更新了我们认为最需要关注的几个方面(更强的散热,更窄的边框,更快的性能)。续航时间很短,但如果这是刚需,那么我们建议您考虑Alienware m17。
毫不奇怪,性能是这台笔记本电脑的真正亮点。事实上,该机器仅仅比我们内部台式PC参照物性能上差百分之几,这本身就令人印象深刻。游戏中的风扇噪音几乎与Alienware 17 R5完全相同,考虑到性能的大幅提升,这对于那些希望拥有更安静机器的人来说可能是一种失望。
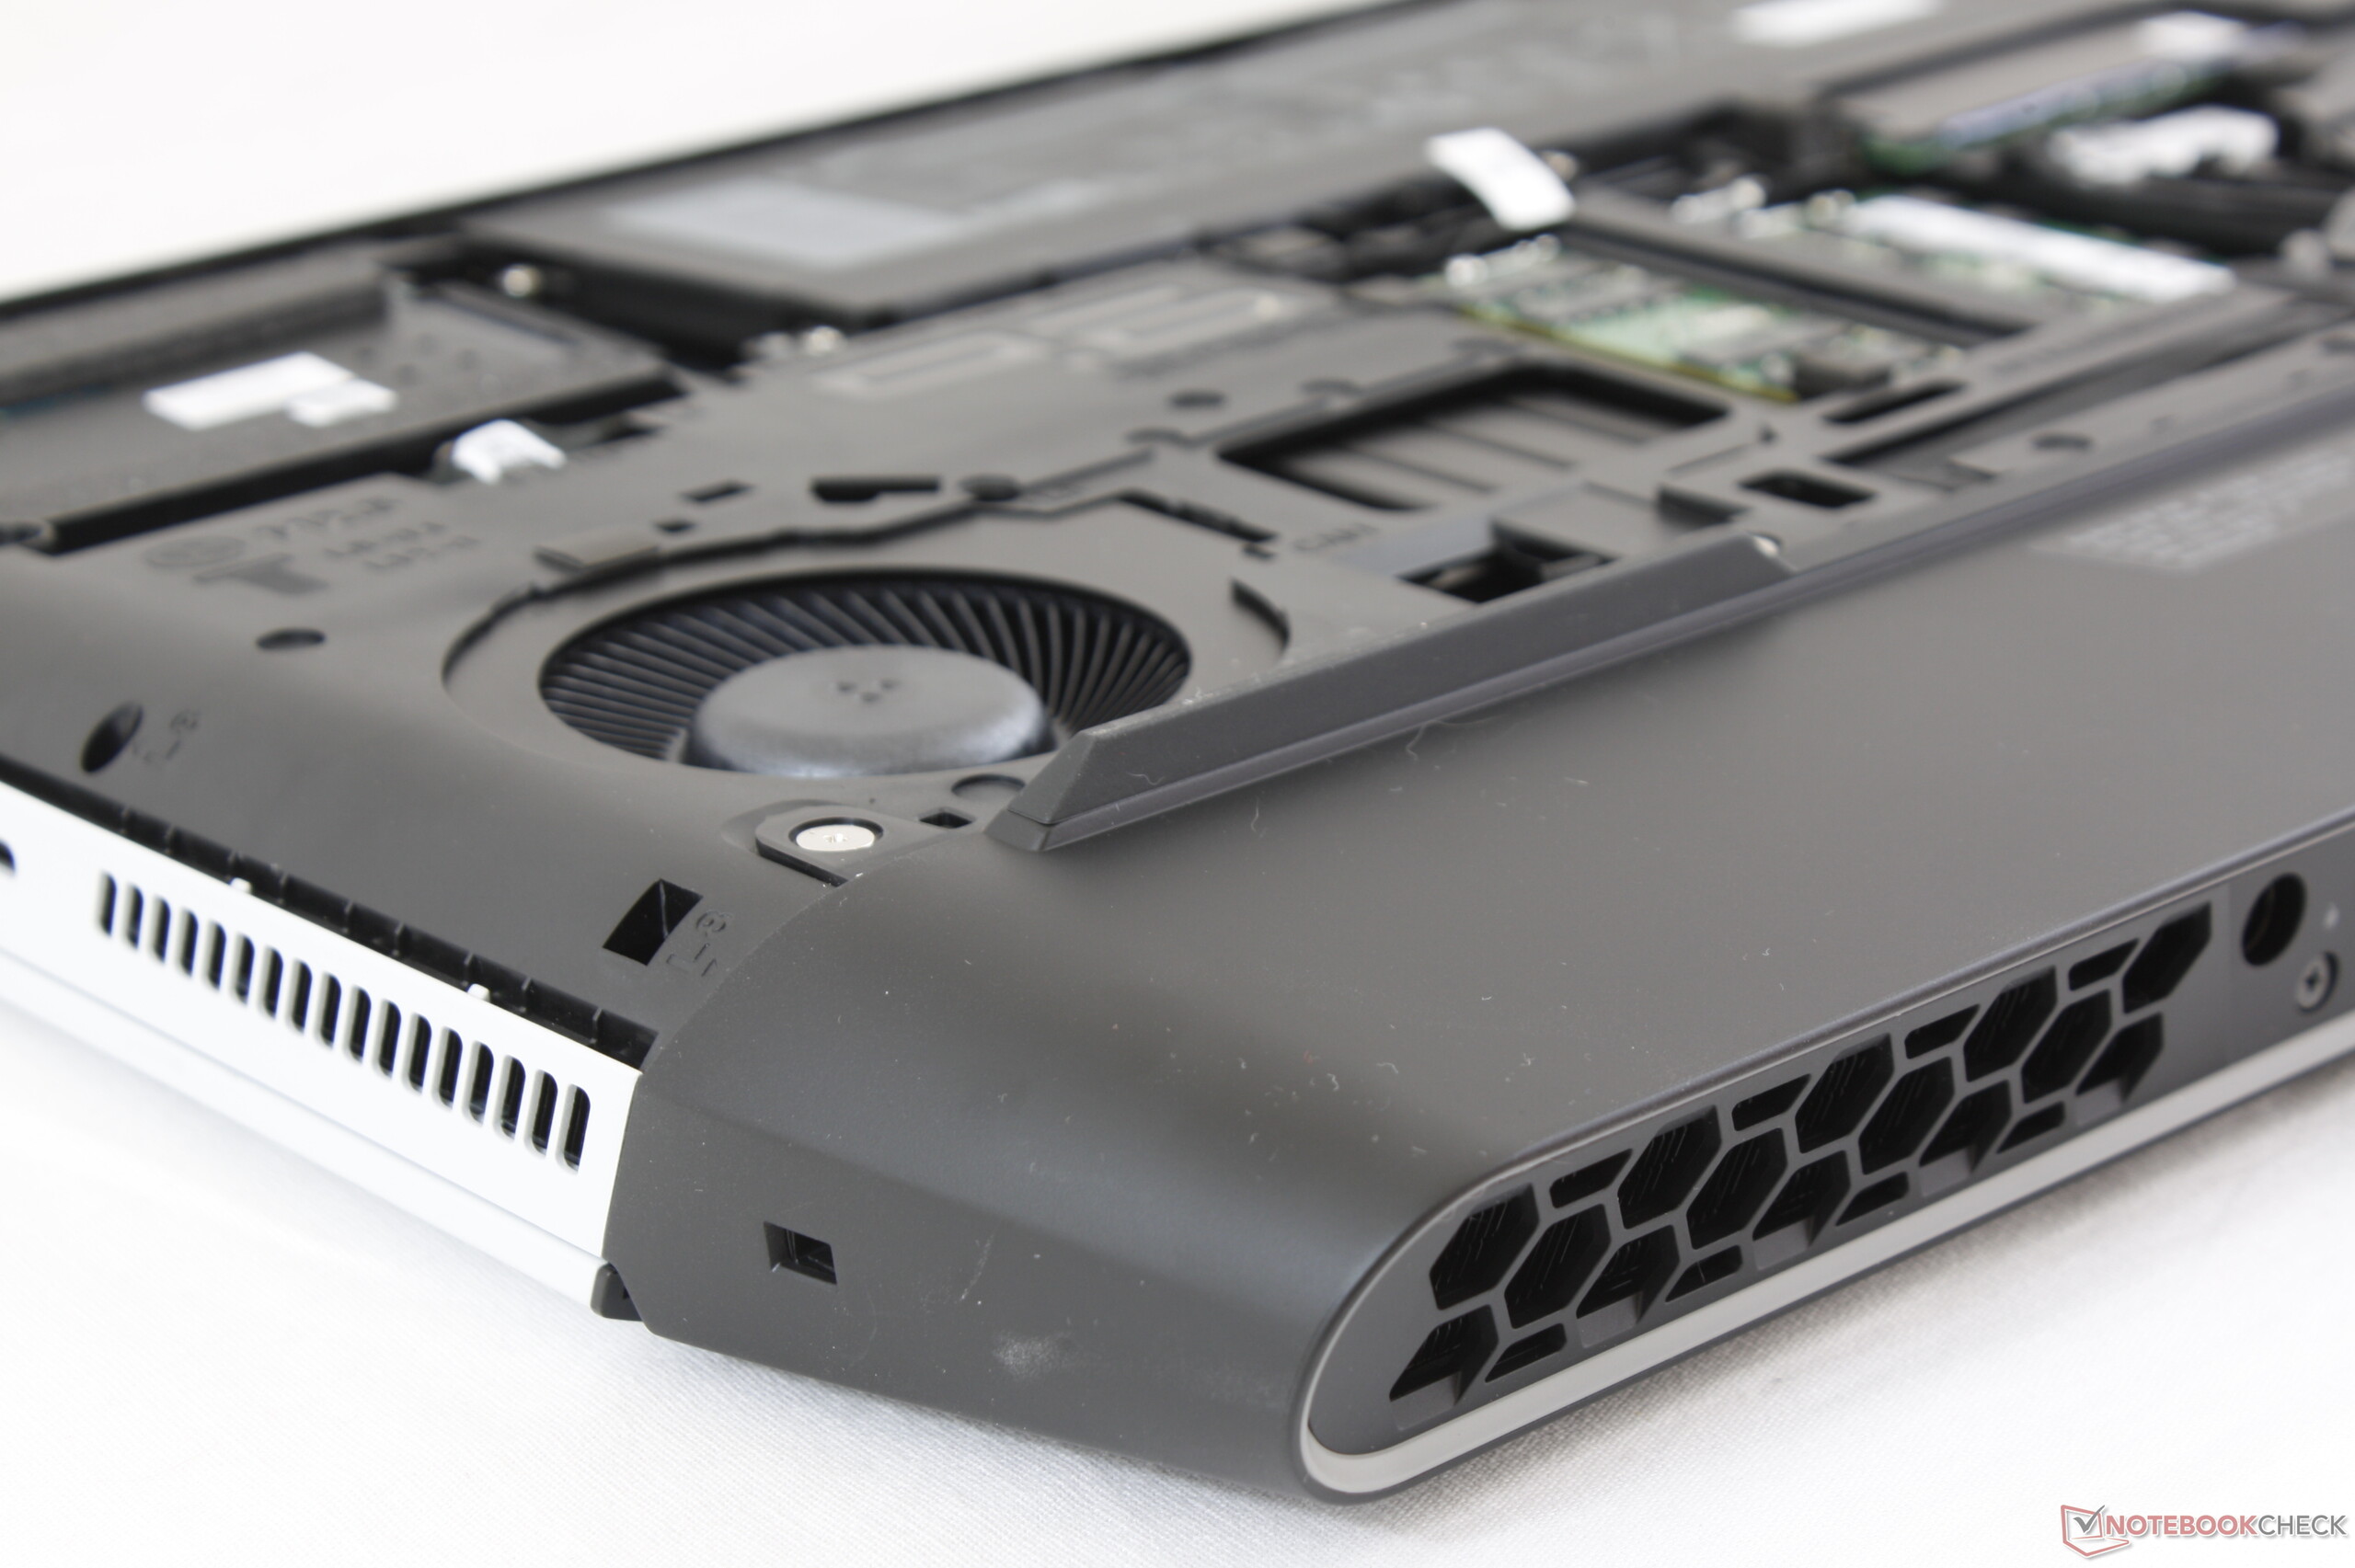
让Area-51m如此特别地方,似乎也是其核心劣势。例如,可升级且可能面向未来的DGFF显卡是一个非常酷的概念。然而,在实际的RTX 2080继任者出现之前,这只是一个实验性产品而已。其次,与传统的45W CoffeeLake-H相比,选择95+ W Core i9-9900K肯定会提升CPU性能,但是在满载下高于99度的核心温度会又我们感到痛苦。
虽然如此高的核心温度本身并不安全,但我们认为戴尔没有借口。Eurocom Sky X7C拥有相同的Core i9 CPU,但在进行相同的压力测试时最高只有84℃,而且没有降频。如果蓝天可以做到这一点,那么戴尔也没有理由不能这样做。
下一个缺点是我们没有预料到的。那就是屏幕对比度不如去年的Alienware 17 R5或MSI GT75那么深。这可能是性能最强的游戏笔记本电脑之一,但它并没有最好的显示效果。
虽然显而易见,但这些缺点并没有阻止Area-51m成为Alienware 17系列的大跃进。如果戴尔继续使用台式机CPU和DGFF,那么我们希望在未来的版本中能够看到更安静的风扇噪音和更低的温度。
以最好的方式小题大做。与Eurocom Sky X7C相比,在核心温度和风扇噪音方面肯定有改进的余地。但作为Alienware 17的继承者,它可以让笔记本成为强大的台式机的替代品。
Alienware Area-51m i9-9900K RTX 2080
- 09/20/2019 v7 (old)
Allen Ngo
Price comparison

