华硕ROG G703GXR笔记本电脑评测:高端老派游戏本
Rating | Date | Model | Weight | Height | Size | Resolution | Price |
|---|---|---|---|---|---|---|---|
| 85.8 % v7 (old) | 01 / 2020 | Asus ROG G703GXR i7-9750H, GeForce RTX 2080 Mobile | 4.7 kg | 48 mm | 17.30" | 1920x1080 | |
| 82.5 % v7 (old) | 01 / 2020 | Acer Predator Helios 700 PH717-71-785M i7-9750H, GeForce RTX 2080 Mobile | 4.8 kg | 42 mm | 17.30" | 1920x1080 | |
| 85.1 % v7 (old) | HP Omen 17-cb0020ng i9-9880H, GeForce RTX 2080 Mobile | 3.3 kg | 27 mm | 17.30" | 1920x1080 | ||
| 86.1 % v7 (old) | 07 / 2019 | MSI GE75 9SG i9-9880H, GeForce RTX 2080 Mobile | 2.7 kg | 27.5 mm | 17.30" | 1920x1080 |
| SD Card Reader | |
| average JPG Copy Test (av. of 3 runs) | |
| Asus ROG G703GXR (Toshiba Exceria Pro SDXC 64 GB UHS-II) | |
| Average of class Gaming (20.9 - 210, n=55, last 2 years) | |
| HP Omen 17-cb0020ng (Toshiba Exceria Pro SDXC 64 GB UHS-II) | |
| MSI GE75 9SG (Toshiba Exceria Pro SDXC 64 GB UHS-II) | |
| maximum AS SSD Seq Read Test (1GB) | |
| Asus ROG G703GXR (Toshiba Exceria Pro SDXC 64 GB UHS-II) | |
| Average of class Gaming (25.5 - 261, n=52, last 2 years) | |
| HP Omen 17-cb0020ng (Toshiba Exceria Pro SDXC 64 GB UHS-II) | |
| MSI GE75 9SG (Toshiba Exceria Pro SDXC 64 GB UHS-II) | |
| Networking | |
| iperf3 transmit AX12 | |
| HP Omen 17-cb0020ng | |
| Acer Predator Helios 700 PH717-71-785M | |
| MSI GE75 9SG | |
| Asus ROG G703GXR | |
| iperf3 receive AX12 | |
| Acer Predator Helios 700 PH717-71-785M | |
| Asus ROG G703GXR | |
| HP Omen 17-cb0020ng | |
| MSI GE75 9SG | |
| |||||||||||||||||||||||||
Brightness Distribution: 91 %
Center on Battery: 290 cd/m²
Contrast: 1450:1 (Black: 0.2 cd/m²)
ΔE ColorChecker Calman: 4.77 | ∀{0.5-29.43 Ø4.73}
calibrated: 1.46
ΔE Greyscale Calman: 5.83 | ∀{0.09-98 Ø4.97}
92% sRGB (Argyll 1.6.3 3D)
59% AdobeRGB 1998 (Argyll 1.6.3 3D)
64.7% AdobeRGB 1998 (Argyll 3D)
92% sRGB (Argyll 3D)
63.2% Display P3 (Argyll 3D)
Gamma: 2.47
CCT: 8076 K
| Asus ROG G703GXR AU Optronics B173HAN04.0 (AUO409D), IPS, 1920x1080 | Acer Predator Helios 700 PH717-71-785M AU Optronics B173HAN03.1 (AUO319D), IPS, 1920x1080 | HP Omen 17-cb0020ng CMN175D, IPS, 1920x1080 | MSI GE75 9SG Chi Mei N173HCE-G33, AHVA, 1920x1080 | Asus ROG G703GX AU Optronics B173HAN03.2 (AUO329D), IPS, 1920x1080 | |
|---|---|---|---|---|---|
| Display | 1% | 2% | -2% | 1% | |
| Display P3 Coverage (%) | 63.2 | 64.4 2% | 63.7 1% | 61.5 -3% | 64.1 1% |
| sRGB Coverage (%) | 92 | 92.1 0% | 96 4% | 92 0% | 93.3 1% |
| AdobeRGB 1998 Coverage (%) | 64.7 | 65.5 1% | 65.8 2% | 63.5 -2% | 65.6 1% |
| Response Times | -77% | -81% | 18% | 6% | |
| Response Time Grey 50% / Grey 80% * (ms) | 6.4 ? | 16.8 ? -163% | 17.6 ? -175% | 7.2 ? -13% | 7.2 ? -13% |
| Response Time Black / White * (ms) | 12.8 ? | 11.6 ? 9% | 11.2 ? 13% | 6.6 ? 48% | 9.6 ? 25% |
| PWM Frequency (Hz) | 25510 ? | 26040 ? | |||
| Screen | -10% | 21% | 18% | -4% | |
| Brightness middle (cd/m²) | 290 | 288 -1% | 360 24% | 400.7 38% | 296 2% |
| Brightness (cd/m²) | 281 | 271 -4% | 342 22% | 372 32% | 279 -1% |
| Brightness Distribution (%) | 91 | 85 -7% | 91 0% | 89 -2% | 85 -7% |
| Black Level * (cd/m²) | 0.2 | 0.2 -0% | 0.26 -30% | 0.34 -70% | 0.25 -25% |
| Contrast (:1) | 1450 | 1440 -1% | 1385 -4% | 1179 -19% | 1184 -18% |
| Colorchecker dE 2000 * | 4.77 | 5.79 -21% | 1.91 60% | 1.33 72% | 4.77 -0% |
| Colorchecker dE 2000 max. * | 9.08 | 11.89 -31% | 4.08 55% | 3.51 61% | 9.08 -0% |
| Colorchecker dE 2000 calibrated * | 1.46 | 1.89 -29% | 0.78 47% | 1.39 5% | 1.46 -0% |
| Greyscale dE 2000 * | 5.83 | 6.92 -19% | 2.72 53% | 1.3 78% | 5.83 -0% |
| Gamma | 2.47 89% | 2.46 89% | 2.37 93% | 2.24 98% | 2.47 89% |
| CCT | 8076 80% | 8433 77% | 6692 97% | 6735 97% | 8076 80% |
| Color Space (Percent of AdobeRGB 1998) (%) | 59 | 60 2% | 60 2% | 58.2 -1% | 60 2% |
| Color Space (Percent of sRGB) (%) | 92 | 92 0% | 96 4% | 92.1 0% | 93 1% |
| Total Average (Program / Settings) | -29% /
-16% | -19% /
5% | 11% /
14% | 1% /
-2% |
* ... smaller is better
Display Response Times
| ↔ Response Time Black to White | ||
|---|---|---|
| 12.8 ms ... rise ↗ and fall ↘ combined | ↗ 7.6 ms rise | 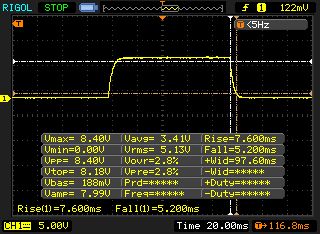 |
| ↘ 5.2 ms fall | ||
| The screen shows good response rates in our tests, but may be too slow for competitive gamers. In comparison, all tested devices range from 0.1 (minimum) to 240 (maximum) ms. » 33 % of all devices are better. This means that the measured response time is better than the average of all tested devices (19.9 ms). | ||
| ↔ Response Time 50% Grey to 80% Grey | ||
| 6.4 ms ... rise ↗ and fall ↘ combined | ↗ 3.4 ms rise | 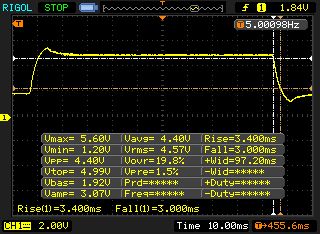 |
| ↘ 3 ms fall | ||
| The screen shows very fast response rates in our tests and should be very well suited for fast-paced gaming. In comparison, all tested devices range from 0.165 (minimum) to 636 (maximum) ms. » 19 % of all devices are better. This means that the measured response time is better than the average of all tested devices (31.1 ms). | ||
Screen Flickering / PWM (Pulse-Width Modulation)
| Screen flickering / PWM not detected | 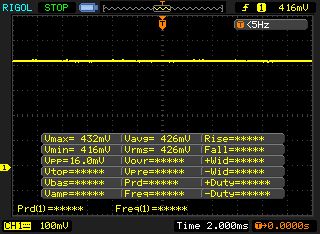 | ||
In comparison: 52 % of all tested devices do not use PWM to dim the display. If PWM was detected, an average of 7798 (minimum: 5 - maximum: 343500) Hz was measured. | |||
| Cinebench R20 | |
| CPU (Single Core) | |
| Average of class Gaming (442 - 895, n=112, last 2 years) | |
| HP Omen 17-cb0020ng | |
| Acer Predator Helios 700 PH717-71-785M | |
| MSI GE75 9SG | |
| Asus ROG G703GXR | |
| CPU (Multi Core) | |
| Average of class Gaming (4029 - 16108, n=112, last 2 years) | |
| MSI GE75 9SG | |
| Asus ROG G703GXR | |
| HP Omen 17-cb0020ng | |
| Acer Predator Helios 700 PH717-71-785M | |
| Cinebench R15 | |
| CPU Single 64Bit | |
| Average of class Gaming (188.8 - 343, n=112, last 2 years) | |
| HP Omen 17-cb0020ng | |
| MSI GE75 9SG | |
| Acer Predator Helios 700 PH717-71-785M | |
| Asus ROG G703GXR | |
| CPU Multi 64Bit | |
| Average of class Gaming (1578 - 6271, n=113, last 2 years) | |
| MSI GE75 9SG | |
| HP Omen 17-cb0020ng | |
| Acer Predator Helios 700 PH717-71-785M | |
| Asus ROG G703GXR | |
| PCMark 10 - Score | |
| Average of class Gaming (5828 - 11574, n=96, last 2 years) | |
| HP Omen 17-cb0020ng | |
| Acer Predator Helios 700 PH717-71-785M | |
| MSI GE75 9SG | |
| Asus ROG G703GXR | |
| Asus ROG G703GXR Samsung SSD PM981 MZVLB512HAJQ | Acer Predator Helios 700 PH717-71-785M 2x WDC PC SN720 SDAPNTW-512G-1014 (RAID 0) | HP Omen 17-cb0020ng 2x Samsung SSD PM981 MZVLB512HAJQ (RAID 0) | MSI GE75 9SG Samsung SSD PM981 MZVLB1T0HALR | |
|---|---|---|---|---|
| CrystalDiskMark 5.2 / 6 | 28% | 24% | 5% | |
| Write 4K (MB/s) | 99.3 | 115.3 16% | 103.8 5% | 116.1 17% |
| Read 4K (MB/s) | 40.25 | 41.79 4% | 41.67 4% | 44.98 12% |
| Write Seq (MB/s) | 2001 | 2841 42% | 2639 32% | 2370 18% |
| Read Seq (MB/s) | 2107 | 2547 21% | 2702 28% | 1465 -30% |
| Write 4K Q32T1 (MB/s) | 348.3 | 498.6 43% | 487.3 40% | 337.5 -3% |
| Read 4K Q32T1 (MB/s) | 391.5 | 555 42% | 555 42% | 453.6 16% |
| Write Seq Q32T1 (MB/s) | 2003 | 3123 56% | 2967 48% | 2399 20% |
| Read Seq Q32T1 (MB/s) | 3482 | 3476 0% | 3102 -11% | 3087 -11% |

| 3DMark 11 Performance | 24850 points | |
| 3DMark Cloud Gate Standard Score | 38299 points | |
| 3DMark Fire Strike Score | 20164 points | |
| 3DMark Time Spy Score | 9526 points | |
Help | ||
| 3DMark | |
| 1920x1080 Fire Strike Graphics | |
| Average of class Gaming (12242 - 62849, n=121, last 2 years) | |
| Acer Predator Helios 700 PH717-71-785M | |
| Asus ROG G703GXR | |
| MSI GE75 9SG | |
| HP Omen 17-cb0020ng | |
| 2560x1440 Time Spy Graphics | |
| Average of class Gaming (5012 - 26212, n=120, last 2 years) | |
| Acer Predator Helios 700 PH717-71-785M | |
| Asus ROG G703GXR | |
| MSI GE75 9SG | |
| HP Omen 17-cb0020ng | |
| 2560x1440 Port Royal Graphics | |
| Average of class Gaming (4395 - 17286, n=70, last 2 years) | |
| Acer Predator Helios 700 PH717-71-785M | |
| HP Omen 17-cb0020ng | |
| Asus ROG G703GXR | |
| MSI GE75 9SG | |
| 3DMark 11 - 1280x720 Performance GPU | |
| Average of class Gaming (21841 - 80022, n=109, last 2 years) | |
| Acer Predator Helios 700 PH717-71-785M | |
| Asus ROG G703GXR | |
| MSI GE75 9SG | |
| HP Omen 17-cb0020ng | |
| The Witcher 3 - 1920x1080 Ultra Graphics & Postprocessing (HBAO+) | |
| Average of class Gaming (95 - 240, n=8, last 2 years) | |
| Acer Predator Helios 700 PH717-71-785M | |
| Asus ROG G703GXR | |
| MSI GE75 9SG | |
| HP Omen 17-cb0020ng | |
| low | med. | high | ultra | |
|---|---|---|---|---|
| The Witcher 3 (2015) | 165 | 97.1 | ||
| Fortnite (2018) | 148 | 133 | ||
| Hitman 2 (2018) | 76 | 73.1 | ||
| Anthem (2019) | 96.9 | 91 | ||
| The Division 2 (2019) | 116 | 92 | ||
| Anno 1800 (2019) | 70 | 40.8 | ||
| Rage 2 (2019) | 110 | 108 | ||
| F1 2019 (2019) | 83 | 80 | ||
| Control (2019) | 91.7 | |||
| Borderlands 3 (2019) | 91.8 | 79.4 | ||
| FIFA 20 (2019) | 202 | 201 |
Noise level
| Idle |
| 33 / 34 / 35 dB(A) |
| Load |
| 38 / 54 dB(A) |
 | ||
30 dB silent 40 dB(A) audible 50 dB(A) loud |
||
min: | ||
| Asus ROG G703GXR i7-9750H, GeForce RTX 2080 Mobile | Acer Predator Helios 700 PH717-71-785M i7-9750H, GeForce RTX 2080 Mobile | HP Omen 17-cb0020ng i9-9880H, GeForce RTX 2080 Mobile | MSI GE75 9SG i9-9880H, GeForce RTX 2080 Mobile | Average of class Gaming | |
|---|---|---|---|---|---|
| Noise | -7% | -4% | 3% | 10% | |
| off / environment * (dB) | 30 | 30 -0% | 30 -0% | 28.2 6% | 24.1 ? 20% |
| Idle Minimum * (dB) | 33 | 30 9% | 34 -3% | 30.4 8% | 25.8 ? 22% |
| Idle Average * (dB) | 34 | 34 -0% | 35 -3% | 30.4 11% | 27.5 ? 19% |
| Idle Maximum * (dB) | 35 | 45 -29% | 36 -3% | 33.4 5% | 30 ? 14% |
| Load Average * (dB) | 38 | 40 -5% | 51 -34% | 37.1 2% | 43.1 ? -13% |
| Witcher 3 ultra * (dB) | 50 | 57 -14% | 47 6% | 54.2 -8% | |
| Load Maximum * (dB) | 54 | 60 -11% | 51 6% | 56.4 -4% | 54 ? -0% |
* ... smaller is better
(-) The maximum temperature on the upper side is 46 °C / 115 F, compared to the average of 40.4 °C / 105 F, ranging from 21.2 to 68.8 °C for the class Gaming.
(-) The bottom heats up to a maximum of 49 °C / 120 F, compared to the average of 43.2 °C / 110 F
(+) In idle usage, the average temperature for the upper side is 28.8 °C / 84 F, compared to the device average of 33.9 °C / 93 F.
(±) Playing The Witcher 3, the average temperature for the upper side is 35.4 °C / 96 F, compared to the device average of 33.9 °C / 93 F.
(+) The palmrests and touchpad are cooler than skin temperature with a maximum of 27 °C / 80.6 F and are therefore cool to the touch.
(±) The average temperature of the palmrest area of similar devices was 28.8 °C / 83.8 F (+1.8 °C / 3.2 F).
| Asus ROG G703GXR i7-9750H, GeForce RTX 2080 Mobile | Acer Predator Helios 700 PH717-71-785M i7-9750H, GeForce RTX 2080 Mobile | HP Omen 17-cb0020ng i9-9880H, GeForce RTX 2080 Mobile | MSI GE75 9SG i9-9880H, GeForce RTX 2080 Mobile | Average of class Gaming | |
|---|---|---|---|---|---|
| Heat | 4% | -2% | -17% | -1% | |
| Maximum Upper Side * (°C) | 46 | 37 20% | 47 -2% | 48.8 -6% | 45.2 ? 2% |
| Maximum Bottom * (°C) | 49 | 40 18% | 54 -10% | 52 -6% | 48.2 ? 2% |
| Idle Upper Side * (°C) | 31 | 34 -10% | 32 -3% | 36.2 -17% | 31.1 ? -0% |
| Idle Bottom * (°C) | 32 | 36 -13% | 30 6% | 44.4 -39% | 34.3 ? -7% |
* ... smaller is better
Asus ROG G703GXR audio analysis
(+) | speakers can play relatively loud (92 dB)
Bass 100 - 315 Hz
(±) | reduced bass - on average 13.2% lower than median
(±) | linearity of bass is average (8.9% delta to prev. frequency)
Mids 400 - 2000 Hz
(+) | balanced mids - only 3.1% away from median
(+) | mids are linear (3.1% delta to prev. frequency)
Highs 2 - 16 kHz
(±) | reduced highs - on average 5.4% lower than median
(+) | highs are linear (4.2% delta to prev. frequency)
Overall 100 - 16.000 Hz
(+) | overall sound is linear (14.8% difference to median)
Compared to same class
» 29% of all tested devices in this class were better, 7% similar, 64% worse
» The best had a delta of 6%, average was 18%, worst was 132%
Compared to all devices tested
» 20% of all tested devices were better, 4% similar, 76% worse
» The best had a delta of 4%, average was 24%, worst was 134%
Acer Predator Helios 700 PH717-71-785M audio analysis
(+) | speakers can play relatively loud (83 dB)
Bass 100 - 315 Hz
(-) | nearly no bass - on average 15.4% lower than median
(±) | linearity of bass is average (11.8% delta to prev. frequency)
Mids 400 - 2000 Hz
(+) | balanced mids - only 2.2% away from median
(+) | mids are linear (5.7% delta to prev. frequency)
Highs 2 - 16 kHz
(+) | balanced highs - only 2.1% away from median
(+) | highs are linear (5.7% delta to prev. frequency)
Overall 100 - 16.000 Hz
(+) | overall sound is linear (12.9% difference to median)
Compared to same class
» 17% of all tested devices in this class were better, 4% similar, 79% worse
» The best had a delta of 6%, average was 18%, worst was 132%
Compared to all devices tested
» 12% of all tested devices were better, 3% similar, 85% worse
» The best had a delta of 4%, average was 24%, worst was 134%
| Off / Standby | |
| Idle | |
| Load |
|
Key:
min: | |
| Asus ROG G703GXR i7-9750H, GeForce RTX 2080 Mobile | Acer Predator Helios 700 PH717-71-785M i7-9750H, GeForce RTX 2080 Mobile | HP Omen 17-cb0020ng i9-9880H, GeForce RTX 2080 Mobile | MSI GE75 9SG i9-9880H, GeForce RTX 2080 Mobile | Average of class Gaming | |
|---|---|---|---|---|---|
| Power Consumption | 2% | 11% | 28% | 33% | |
| Idle Minimum * (Watt) | 27 | 28 -4% | 26 4% | 13.9 49% | 13.3 ? 51% |
| Idle Average * (Watt) | 32 | 34 -6% | 29 9% | 18.8 41% | 19 ? 41% |
| Idle Maximum * (Watt) | 39 | 45 -15% | 38 3% | 23.1 41% | 24.5 ? 37% |
| Load Average * (Watt) | 124 | 98 21% | 106 15% | 112.3 9% | 108.1 ? 13% |
| Witcher 3 ultra * (Watt) | 274 | 263 4% | 228 17% | 231 16% | |
| Load Maximum * (Watt) | 338 | 307 9% | 287 15% | 291.5 14% | 254 ? 25% |
* ... smaller is better
| Asus ROG G703GXR i7-9750H, GeForce RTX 2080 Mobile, 96 Wh | Acer Predator Helios 700 PH717-71-785M i7-9750H, GeForce RTX 2080 Mobile, 72 Wh | HP Omen 17-cb0020ng i9-9880H, GeForce RTX 2080 Mobile, 70 Wh | MSI GE75 9SG i9-9880H, GeForce RTX 2080 Mobile, 65 Wh | Average of class Gaming | |
|---|---|---|---|---|---|
| Battery runtime | -33% | -28% | -20% | 23% | |
| Reader / Idle (h) | 8.1 | 3.6 -56% | 4.2 -48% | 8.71 ? 8% | |
| WiFi v1.3 (h) | 6.1 | 2.8 -54% | 3.3 -46% | 4.9 -20% | 7.01 ? 15% |
| Load (h) | 1 | 1.1 10% | 1.1 10% | 1.47 ? 47% |
Pros
Cons
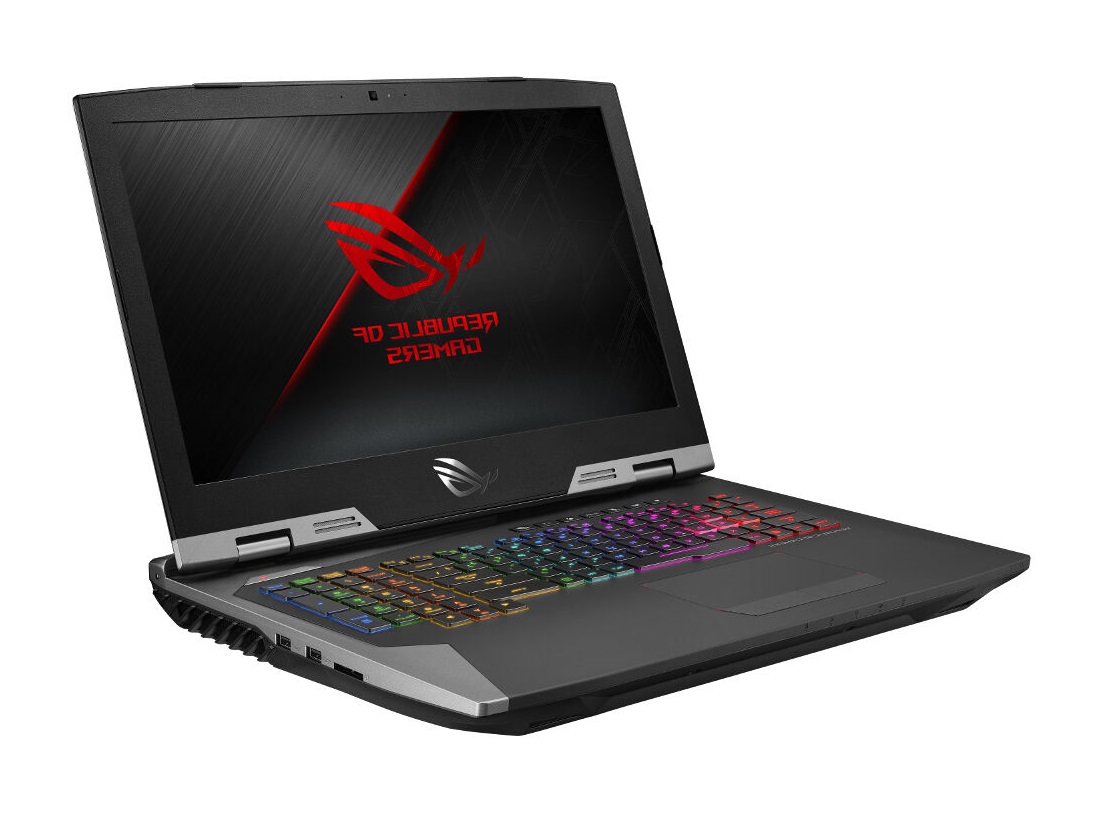
华硕ROG G703GXR专为主要在家玩游戏的玩家而设计。
ROG G703GXR的尺寸和重量不适合随身携带和用作移动游戏笔记本电脑。 但是,如果您对庞大的机箱没有任何意见,那么ROG G703GXR将成为出色的游戏伴侣,并且没有重大缺陷。 例如,在我们看来,它的维护选项可以做得更好,但我们遇到的任何缺陷都很小。
华硕还为该设备配备了出色的输入设备和多种端口选择,包括Thunderbolt3。此外,ROG G703GXR还具有高对比度和反应灵敏的IPS显示屏。 在G-Sync(更好的图像质量)和Optimus(更好的续航时间)之间的选择也值得赞扬。 此外,我们希望笔记本电脑可以在负载下保持最高的CPU和GPU性能。华硕在功率,温度和体积之间也取得了不错的折衷。 总体而言,ROG G703GXR是一款出色的经典游戏笔记本电脑。
Asus ROG G703GXR
- 05/14/2020 v7 (old)
Florian Glaser
Price comparison

