华硕ROG G703GX(i7-8750H, RTX 2080)笔记本电脑评测
| SD Card Reader | |
| average JPG Copy Test (av. of 3 runs) | |
| Asus Chimera G703GI (Toshiba Exceria Pro SDXC 64 GB UHS-II) | |
| Aorus X7 DT v8 (Toshiba Exceria Pro SDXC 64 GB UHS-II) | |
| Schenker XMG Ultra 17 (Toshiba Exceria Pro SDXC 64 GB UHS-II) | |
| Asus ROG G703GX (Toshiba Exceria Pro SDXC 64 GB UHS-II) | |
| Average of class Gaming (20.9 - 210, n=54, last 2 years) | |
| maximum AS SSD Seq Read Test (1GB) | |
| Asus Chimera G703GI (Toshiba Exceria Pro SDXC 64 GB UHS-II) | |
| Aorus X7 DT v8 (Toshiba Exceria Pro SDXC 64 GB UHS-II) | |
| Asus ROG G703GX (Toshiba Exceria Pro SDXC 64 GB UHS-II) | |
| Schenker XMG Ultra 17 (Toshiba Exceria Pro SDXC 64 GB UHS-II) | |
| Average of class Gaming (25.5 - 261, n=51, last 2 years) | |
| Networking | |
| iperf3 transmit AX12 | |
| Acer Predator Helios 500 PH517-51-79BY | |
| Asus Chimera G703GI | |
| Asus ROG G703GX | |
| Aorus X7 DT v8 | |
| Schenker XMG Ultra 17 | |
| iperf3 receive AX12 | |
| Schenker XMG Ultra 17 | |
| Asus Chimera G703GI | |
| Acer Predator Helios 500 PH517-51-79BY | |
| Asus ROG G703GX | |
| Aorus X7 DT v8 | |
| |||||||||||||||||||||||||
Brightness Distribution: 85 %
Center on Battery: 296 cd/m²
Contrast: 1184:1 (Black: 0.25 cd/m²)
ΔE ColorChecker Calman: 4.77 | ∀{0.5-29.43 Ø4.73}
calibrated: 1.46
ΔE Greyscale Calman: 5.83 | ∀{0.09-98 Ø4.97}
93% sRGB (Argyll 1.6.3 3D)
60% AdobeRGB 1998 (Argyll 1.6.3 3D)
65.6% AdobeRGB 1998 (Argyll 3D)
93.3% sRGB (Argyll 3D)
64.1% Display P3 (Argyll 3D)
Gamma: 2.47
CCT: 8076 K
| Asus ROG G703GX AU Optronics B173HAN03.2 (AUO329D), IPS, 1920x1080 | Acer Predator Helios 500 PH517-51-79BY AUO_B173HAN03, IPS, 1920x1080 | Aorus X7 DT v8 AU Optronics B173HAN03.0 (AUO309D), IPS, 1920x1080 | Asus Chimera G703GI B173HAN03.2 (AUO329D), IPS, 1920x1080 | Schenker XMG Ultra 17 AU Optronics B173ZAN01.0 (AUO109B), IPS, 3840x2160 | |
|---|---|---|---|---|---|
| Display | -1% | 0% | 1% | 31% | |
| Display P3 Coverage (%) | 64.1 | 64.4 0% | 65.3 2% | 65.8 3% | 86.4 35% |
| sRGB Coverage (%) | 93.3 | 91.3 -2% | 91.2 -2% | 92.6 -1% | 100 7% |
| AdobeRGB 1998 Coverage (%) | 65.6 | 65.6 0% | 66.3 1% | 67 2% | 99.1 51% |
| Response Times | -44% | -88% | -1% | -335% | |
| Response Time Grey 50% / Grey 80% * (ms) | 7.2 ? | 14 ? -94% | 18 ? -150% | 6.4 ? 11% | 44 ? -511% |
| Response Time Black / White * (ms) | 9.6 ? | 9 ? 6% | 12 ? -25% | 10.8 ? -13% | 24.8 ? -158% |
| PWM Frequency (Hz) | |||||
| Screen | -23% | 19% | 10% | 15% | |
| Brightness middle (cd/m²) | 296 | 335 13% | 297 0% | 285 -4% | 332 12% |
| Brightness (cd/m²) | 279 | 300 8% | 281 1% | 275 -1% | 313 12% |
| Brightness Distribution (%) | 85 | 82 -4% | 84 -1% | 82 -4% | 88 4% |
| Black Level * (cd/m²) | 0.25 | 0.7 -180% | 0.23 8% | 0.22 12% | 0.28 -12% |
| Contrast (:1) | 1184 | 479 -60% | 1291 9% | 1295 9% | 1186 0% |
| Colorchecker dE 2000 * | 4.77 | 4.99 -5% | 2.19 54% | 3.18 33% | 3.86 19% |
| Colorchecker dE 2000 max. * | 9.08 | 9.32 -3% | 4.81 47% | 5.99 34% | 5.88 35% |
| Colorchecker dE 2000 calibrated * | 1.46 | 1.93 -32% | 1.73 -18% | ||
| Greyscale dE 2000 * | 5.83 | 5.2 11% | 1.31 78% | 2.93 50% | 4.33 26% |
| Gamma | 2.47 89% | 2.49 88% | 2.42 91% | 2.45 90% | 2.41 91% |
| CCT | 8076 80% | 7719 84% | 6464 101% | 7165 91% | 6595 99% |
| Color Space (Percent of AdobeRGB 1998) (%) | 60 | 59 -2% | 59 -2% | 60 0% | 88 47% |
| Color Space (Percent of sRGB) (%) | 93 | 91 -2% | 91 -2% | 93 0% | 100 8% |
| Total Average (Program / Settings) | -23% /
-22% | -23% /
1% | 3% /
7% | -96% /
-28% |
* ... smaller is better
Display Response Times
| ↔ Response Time Black to White | ||
|---|---|---|
| 9.6 ms ... rise ↗ and fall ↘ combined | ↗ 4.4 ms rise | 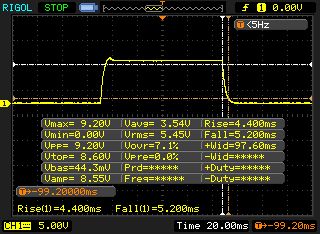 |
| ↘ 5.2 ms fall | ||
| The screen shows fast response rates in our tests and should be suited for gaming. In comparison, all tested devices range from 0.1 (minimum) to 240 (maximum) ms. » 26 % of all devices are better. This means that the measured response time is better than the average of all tested devices (19.9 ms). | ||
| ↔ Response Time 50% Grey to 80% Grey | ||
| 7.2 ms ... rise ↗ and fall ↘ combined | ↗ 3.8 ms rise | 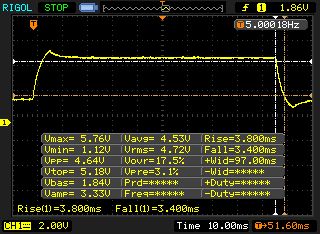 |
| ↘ 3.4 ms fall | ||
| The screen shows very fast response rates in our tests and should be very well suited for fast-paced gaming. In comparison, all tested devices range from 0.165 (minimum) to 636 (maximum) ms. » 20 % of all devices are better. This means that the measured response time is better than the average of all tested devices (31.1 ms). | ||
Screen Flickering / PWM (Pulse-Width Modulation)
| Screen flickering / PWM not detected | 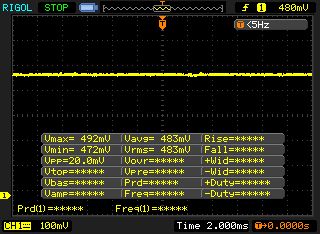 | ||
In comparison: 52 % of all tested devices do not use PWM to dim the display. If PWM was detected, an average of 7784 (minimum: 5 - maximum: 343500) Hz was measured. | |||
| Cinebench R15 | |
| CPU Single 64Bit | |
| Average of class Gaming (188.8 - 343, n=109, last 2 years) | |
| Asus Chimera G703GI | |
| Schenker XMG Ultra 17 | |
| Aorus X7 DT v8 | |
| Acer Predator Helios 500 PH517-51-79BY | |
| Asus ROG G703GX | |
| CPU Multi 64Bit | |
| Average of class Gaming (1578 - 6271, n=109, last 2 years) | |
| Asus Chimera G703GI | |
| Aorus X7 DT v8 | |
| Asus ROG G703GX | |
| Schenker XMG Ultra 17 | |
| Acer Predator Helios 500 PH517-51-79BY | |
| Cinebench R10 | |
| Rendering Single 32Bit | |
| Average of class Gaming (7457 - 11779, n=8, last 2 years) | |
| Schenker XMG Ultra 17 | |
| Asus ROG G703GX | |
| Rendering Multiple CPUs 32Bit | |
| Average of class Gaming (42932 - 81339, n=8, last 2 years) | |
| Asus ROG G703GX | |
| Schenker XMG Ultra 17 | |
| Geekbench 3 | |
| 32 Bit Multi-Core Score | |
| Asus ROG G703GX | |
| Schenker XMG Ultra 17 | |
| 32 Bit Single-Core Score | |
| Schenker XMG Ultra 17 | |
| Asus ROG G703GX | |
| Geekbench 4.0 | |
| 64 Bit Multi-Core Score | |
| Average of class Gaming (40469 - 76142, n=4, last 2 years) | |
| Asus ROG G703GX | |
| 64 Bit Single-Core Score | |
| Average of class Gaming (7589 - 9053, n=4, last 2 years) | |
| Asus ROG G703GX | |
| Geekbench 4.4 | |
| 64 Bit Multi-Core Score | |
| Average of class Gaming (89200 - 97490, n=2, last 2 years) | |
| Asus ROG G703GX | |
| 64 Bit Single-Core Score | |
| Average of class Gaming (9335 - 9492, n=2, last 2 years) | |
| Asus ROG G703GX | |
| Mozilla Kraken 1.1 - Total | |
| Asus ROG G703GX (Edge 44) | |
| Schenker XMG Ultra 17 (Edge 41) | |
| Acer Predator Helios 500 PH517-51-79BY | |
| Average of class Gaming (391 - 590, n=104, last 2 years) | |
| Octane V2 - Total Score | |
| Average of class Gaming (89353 - 139447, n=29, last 2 years) | |
| Acer Predator Helios 500 PH517-51-79BY | |
| Asus ROG G703GX (Edge 44) | |
| JetStream 1.1 - 1.1 Total | |
| Average of class Gaming (533 - 647, n=4, last 2 years) | |
| Schenker XMG Ultra 17 (Edge 41) | |
| Asus ROG G703GX (Edge 44) | |
| Acer Predator Helios 500 PH517-51-79BY | |
* ... smaller is better
| PCMark 7 Score | 6734 points | |
| PCMark 8 Home Score Accelerated v2 | 4622 points | |
| PCMark 8 Creative Score Accelerated v2 | 5305 points | |
| PCMark 8 Work Score Accelerated v2 | 5697 points | |
| PCMark 10 Score | 5680 points | |
Help | ||
| PCMark 10 - Score | |
| Average of class Gaming (5828 - 11574, n=94, last 2 years) | |
| Asus Chimera G703GI | |
| Schenker XMG Ultra 17 | |
| Asus ROG G703GX | |
| Acer Predator Helios 500 PH517-51-79BY | |
| Aorus X7 DT v8 | |
| PCMark 8 | |
| Home Score Accelerated v2 | |
| Asus Chimera G703GI | |
| Aorus X7 DT v8 | |
| Average of class Gaming (n=1last 2 years) | |
| Acer Predator Helios 500 PH517-51-79BY | |
| Schenker XMG Ultra 17 | |
| Asus ROG G703GX | |
| Work Score Accelerated v2 | |
| Asus Chimera G703GI | |
| Acer Predator Helios 500 PH517-51-79BY | |
| Asus ROG G703GX | |
| Schenker XMG Ultra 17 | |
| Average of class Gaming (n=1last 2 years) | |

| Asus ROG G703GX Samsung SSD PM981 MZVLB512HAJQ | Acer Predator Helios 500 PH517-51-79BY SK hynix SSD Canvas SC300 HFS256GD9MNE-6200A | Aorus X7 DT v8 Toshiba NVMe THNSN5512GPU7 | Asus Chimera G703GI 2x Intel 760p 512 GB + 1x Samsung SM961 512 GB (RAID) | Schenker XMG Ultra 17 Samsung SSD 960 Evo 500GB m.2 NVMe | |
|---|---|---|---|---|---|
| CrystalDiskMark 5.2 / 6 | -30% | -12% | 92% | 14% | |
| Write 4K (MB/s) | 90.4 | 79.2 -12% | 88.6 -2% | 130.2 44% | 153.5 70% |
| Read 4K (MB/s) | 39.19 | 39.69 1% | 30.76 -22% | 57.3 46% | 44.1 13% |
| Write Seq (MB/s) | 1863 | 950 -49% | 1340 -28% | 4049 117% | 1725 -7% |
| Read Seq (MB/s) | 2100 | 1087 -48% | 1362 -35% | 5325 154% | 1750 -17% |
| Write 4K Q32T1 (MB/s) | 260.2 | 189.6 -27% | 305.7 17% | 383.2 47% | 340 31% |
| Read 4K Q32T1 (MB/s) | 297 | 304 2% | 366.8 24% | 424.9 43% | 392.1 32% |
| Write Seq Q32T1 (MB/s) | 1870 | 948 -49% | 1562 -16% | 4316 131% | 1839 -2% |
| Read Seq Q32T1 (MB/s) | 3471 | 1488 -57% | 2414 -30% | 8905 157% | 3308 -5% |
| 3DMark 06 Standard Score | 35591 points | |
| 3DMark 11 Performance | 24624 points | |
| 3DMark Ice Storm Standard Score | 117607 points | |
| 3DMark Cloud Gate Standard Score | 37209 points | |
| 3DMark Fire Strike Score | 20452 points | |
| 3DMark Fire Strike Extreme Score | 11801 points | |
| 3DMark Time Spy Score | 9617 points | |
Help | ||
| 3DMark | |
| 2560x1440 Port Royal Graphics | |
| Average of class Gaming (4395 - 17286, n=70, last 2 years) | |
| Asus ROG G703GX (Turbo-Mode) | |
| Asus ROG G703GX | |
| Schenker XMG Ultra 15 | |
| 2560x1440 Time Spy Graphics | |
| Average of class Gaming (5012 - 26212, n=117, last 2 years) | |
| Asus ROG G703GX (Turbo-Mode) | |
| Asus ROG G703GX | |
| Schenker XMG Ultra 15 | |
| Schenker XMG Ultra 17 | |
| Acer Predator Helios 500 PH517-51-79BY | |
| 1920x1080 Fire Strike Graphics | |
| Average of class Gaming (12242 - 62849, n=118, last 2 years) | |
| Asus ROG G703GX (Turbo-Mode) | |
| Asus ROG G703GX | |
| Schenker XMG Ultra 15 | |
| Asus Chimera G703GI | |
| Schenker XMG Ultra 17 | |
| Aorus X7 DT v8 | |
| Acer Predator Helios 500 PH517-51-79BY | |
| 3DMark 11 - 1280x720 Performance GPU | |
| Average of class Gaming (21841 - 80022, n=106, last 2 years) | |
| Asus ROG G703GX (Turbo-Mode) | |
| Asus ROG G703GX | |
| Schenker XMG Ultra 15 | |
| Asus Chimera G703GI | |
| Schenker XMG Ultra 17 | |
| Aorus X7 DT v8 | |
| low | med. | high | ultra | |
|---|---|---|---|---|
| BioShock Infinite (2013) | 298.3 | 264.1 | 247.8 | 180.7 |
| GTA V (2015) | 164 | 159.6 | 126.4 | 75 |
| The Witcher 3 (2015) | 280.8 | 210.2 | 169.6 | 99.7 |
| X-Plane 11.11 (2018) | 98.2 | 86.2 | 73.1 | |
| Far Cry 5 (2018) | 123 | 104 | 97 | 96 |
| Shadow of the Tomb Raider (2018) | 124 | 115 | 111 | 106 |
| Call of Duty Black Ops 4 (2018) | 143.8 | 119.1 | 124.6 | 120 |
| Battlefield V (2018) | 157.2 | 117.6 | 118.3 | 117.4 |
| Darksiders III (2018) | 171.9 | 111 | 104.2 | 102.9 |
| The Witcher 3 - 1920x1080 Ultra Graphics & Postprocessing (HBAO+) | |
| Average of class Gaming (95 - 240, n=8, last 2 years) | |
| Asus ROG G703GX | |
| Schenker XMG Ultra 15 | |
| Aorus X9 DT | |
| MSI GT75 8RG-090 Titan | |
| Asus Chimera G703GI | |
| Schenker XMG Ultra 17 | |
| MSI GT63 Titan 8RG-046 | |
| Aorus X7 DT v8 | |
| Acer Predator Helios 500 PH517-51-79BY | |
| BioShock Infinite - 1920x1080 Ultra Preset, DX11 (DDOF) | |
| Asus ROG G703GX | |
| MSI GT63 Titan 8RG-046 | |
| Far Cry 5 - 1920x1080 Ultra Preset AA:T | |
| Average of class Gaming (70 - 151, n=10, last 2 years) | |
| Schenker XMG Ultra 15 | |
| Aorus X9 DT | |
| MSI GT75 8RG-090 Titan | |
| Asus Chimera G703GI | |
| Asus ROG G703GX | |
| Shadow of the Tomb Raider - 1920x1080 Highest Preset AA:T | |
| Asus ROG G703GX | |
| Average of class Gaming (96 - 116, n=2, last 2 years) | |
| Schenker XMG Ultra 15 | |
| Call of Duty Black Ops 4 - 1920x1080 Very High / On | |
| Schenker XMG Ultra 15 | |
| Asus ROG G703GX | |
| Darksiders III - 1920x1080 Epic | |
| Schenker XMG Ultra 15 | |
| Asus ROG G703GX | |
Noise level
| Idle |
| 30 / 35 / 41 dB(A) |
| HDD |
| 33 dB(A) |
| Load |
| 44 / 52 dB(A) |
 | ||
30 dB silent 40 dB(A) audible 50 dB(A) loud |
||
min: | ||
| Asus ROG G703GX i7-8750H, GeForce RTX 2080 Mobile | Acer Predator Helios 500 PH517-51-79BY i7-8750H, GeForce GTX 1070 Mobile | Aorus X7 DT v8 i7-8850H, GeForce GTX 1080 Mobile | Asus Chimera G703GI i9-8950HK, GeForce GTX 1080 Mobile | Schenker XMG Ultra 17 i7-8700, GeForce GTX 1080 Mobile | Average of class Gaming | |
|---|---|---|---|---|---|---|
| Noise | 6% | -3% | -3% | -4% | 14% | |
| off / environment * (dB) | 30 | 30.4 -1% | 29 3% | 29 3% | 30 -0% | 24.1 ? 20% |
| Idle Minimum * (dB) | 30 | 31.2 -4% | 35 -17% | 30 -0% | 34 -13% | 25.8 ? 14% |
| Idle Average * (dB) | 35 | 35.3 -1% | 36 -3% | 34 3% | 35 -0% | 27.4 ? 22% |
| Idle Maximum * (dB) | 41 | 35.3 14% | 41 -0% | 42 -2% | 40 2% | 29.9 ? 27% |
| Load Average * (dB) | 44 | 44.4 -1% | 43 2% | 53 -20% | 45 -2% | 43 ? 2% |
| Witcher 3 ultra * (dB) | 51 | 41 20% | 53 -4% | 51 -0% | 52 -2% | |
| Load Maximum * (dB) | 52 | 45.2 13% | 54 -4% | 53 -2% | 60 -15% | 54 ? -4% |
* ... smaller is better
(-) The maximum temperature on the upper side is 50 °C / 122 F, compared to the average of 40.4 °C / 105 F, ranging from 21.2 to 68.8 °C for the class Gaming.
(-) The bottom heats up to a maximum of 50 °C / 122 F, compared to the average of 43.2 °C / 110 F
(+) In idle usage, the average temperature for the upper side is 28.3 °C / 83 F, compared to the device average of 33.9 °C / 93 F.
(±) Playing The Witcher 3, the average temperature for the upper side is 37.2 °C / 99 F, compared to the device average of 33.9 °C / 93 F.
(+) The palmrests and touchpad are cooler than skin temperature with a maximum of 28 °C / 82.4 F and are therefore cool to the touch.
(±) The average temperature of the palmrest area of similar devices was 28.8 °C / 83.8 F (+0.8 °C / 1.4 F).
| Asus ROG G703GX i7-8750H, GeForce RTX 2080 Mobile | Acer Predator Helios 500 PH517-51-79BY i7-8750H, GeForce GTX 1070 Mobile | Aorus X7 DT v8 i7-8850H, GeForce GTX 1080 Mobile | Asus Chimera G703GI i9-8950HK, GeForce GTX 1080 Mobile | Schenker XMG Ultra 17 i7-8700, GeForce GTX 1080 Mobile | Average of class Gaming | |
|---|---|---|---|---|---|---|
| Heat | 9% | -1% | -2% | 4% | 2% | |
| Maximum Upper Side * (°C) | 50 | 42.6 15% | 51 -2% | 50 -0% | 41 18% | 45.2 ? 10% |
| Maximum Bottom * (°C) | 50 | 37.2 26% | 63 -26% | 50 -0% | 48 4% | 47.9 ? 4% |
| Idle Upper Side * (°C) | 30 | 33.6 -12% | 27 10% | 32 -7% | 30 -0% | 31.1 ? -4% |
| Idle Bottom * (°C) | 33 | 31 6% | 28 15% | 33 -0% | 35 -6% | 34.2 ? -4% |
* ... smaller is better
Asus ROG G703GX audio analysis
(+) | speakers can play relatively loud (91 dB)
Bass 100 - 315 Hz
(±) | reduced bass - on average 13.3% lower than median
(±) | linearity of bass is average (8.9% delta to prev. frequency)
Mids 400 - 2000 Hz
(+) | balanced mids - only 4% away from median
(+) | mids are linear (3.4% delta to prev. frequency)
Highs 2 - 16 kHz
(±) | reduced highs - on average 5.1% lower than median
(+) | highs are linear (4.4% delta to prev. frequency)
Overall 100 - 16.000 Hz
(±) | linearity of overall sound is average (15.4% difference to median)
Compared to same class
» 34% of all tested devices in this class were better, 7% similar, 59% worse
» The best had a delta of 6%, average was 18%, worst was 132%
Compared to all devices tested
» 22% of all tested devices were better, 4% similar, 73% worse
» The best had a delta of 4%, average was 24%, worst was 134%
Asus Chimera G703GI audio analysis
(+) | speakers can play relatively loud (89 dB)
Bass 100 - 315 Hz
(±) | reduced bass - on average 8.9% lower than median
(+) | bass is linear (6.4% delta to prev. frequency)
Mids 400 - 2000 Hz
(+) | balanced mids - only 3.1% away from median
(+) | mids are linear (2.4% delta to prev. frequency)
Highs 2 - 16 kHz
(+) | balanced highs - only 4.4% away from median
(+) | highs are linear (3.2% delta to prev. frequency)
Overall 100 - 16.000 Hz
(+) | overall sound is linear (11.8% difference to median)
Compared to same class
» 11% of all tested devices in this class were better, 4% similar, 85% worse
» The best had a delta of 6%, average was 18%, worst was 132%
Compared to all devices tested
» 8% of all tested devices were better, 3% similar, 89% worse
» The best had a delta of 4%, average was 24%, worst was 134%
| Off / Standby | |
| Idle | |
| Load |
|
Key:
min: | |
| Asus ROG G703GX i7-8750H, GeForce RTX 2080 Mobile | Acer Predator Helios 500 PH517-51-79BY i7-8750H, GeForce GTX 1070 Mobile | Aorus X7 DT v8 i7-8850H, GeForce GTX 1080 Mobile | Asus Chimera G703GI i9-8950HK, GeForce GTX 1080 Mobile | Schenker XMG Ultra 17 i7-8700, GeForce GTX 1080 Mobile | Average of class Gaming | |
|---|---|---|---|---|---|---|
| Power Consumption | -42% | -59% | -95% | -96% | -15% | |
| Idle Minimum * (Watt) | 5 | 20.4 -308% | 23 -360% | 29 -480% | 32 -540% | 13.2 ? -164% |
| Idle Average * (Watt) | 24 | 26.5 -10% | 33 -38% | 37 -54% | 38 -58% | 18.9 ? 21% |
| Idle Maximum * (Watt) | 42 | 37 12% | 37 12% | 46 -10% | 45 -7% | 24.3 ? 42% |
| Load Average * (Watt) | 112 | 129 -15% | 115 -3% | 156 -39% | 96 14% | 108.3 ? 3% |
| Witcher 3 ultra * (Watt) | 284 | 186 35% | 225 21% | 252 11% | 237 17% | |
| Load Maximum * (Watt) | 320 | 216 32% | 281 12% | 314 2% | 331 -3% | 254 ? 21% |
* ... smaller is better
| Asus ROG G703GX i7-8750H, GeForce RTX 2080 Mobile, 96 Wh | Schenker XMG Ultra 17 i7-8700, GeForce GTX 1080 Mobile, 82 Wh | Acer Predator Helios 500 PH517-51-79BY i7-8750H, GeForce GTX 1070 Mobile, 72 Wh | Aorus X7 DT v8 i7-8850H, GeForce GTX 1080 Mobile, 94.24 Wh | Asus Chimera G703GI i9-8950HK, GeForce GTX 1080 Mobile, 71 Wh | Average of class Gaming | |
|---|---|---|---|---|---|---|
| Battery runtime | -32% | -9% | -2% | -40% | 70% | |
| Reader / Idle (h) | 5 | 2.7 -46% | 4.2 -16% | 4.9 -2% | 2.8 -44% | 8.71 ? 74% |
| H.264 (h) | 3.8 | 2.5 -34% | 8.26 ? 117% | |||
| WiFi v1.3 (h) | 4 | 2.4 -40% | 2.9 -27% | 3.8 -5% | 2.2 -45% | 7.04 ? 76% |
| Load (h) | 1.3 | 1.2 -8% | 1.5 15% | 1.3 0% | 0.9 -31% | 1.47 ? 13% |
| Witcher 3 ultra (h) | 1.1 |
Pros
Cons
华硕ROG G703GX能够将在全高清屏幕中流畅运行所有的现代电脑游戏。您无需关心画质设置,在所有游戏中,您都可以将设置调整到最大值。 GeForce RTX 2080和Coffee-Lake六核处理器可在未来几年内提供足够的计算性能。
华硕ROG G703GX是目前市面上最好,最强劲的高端游戏笔记本之一。
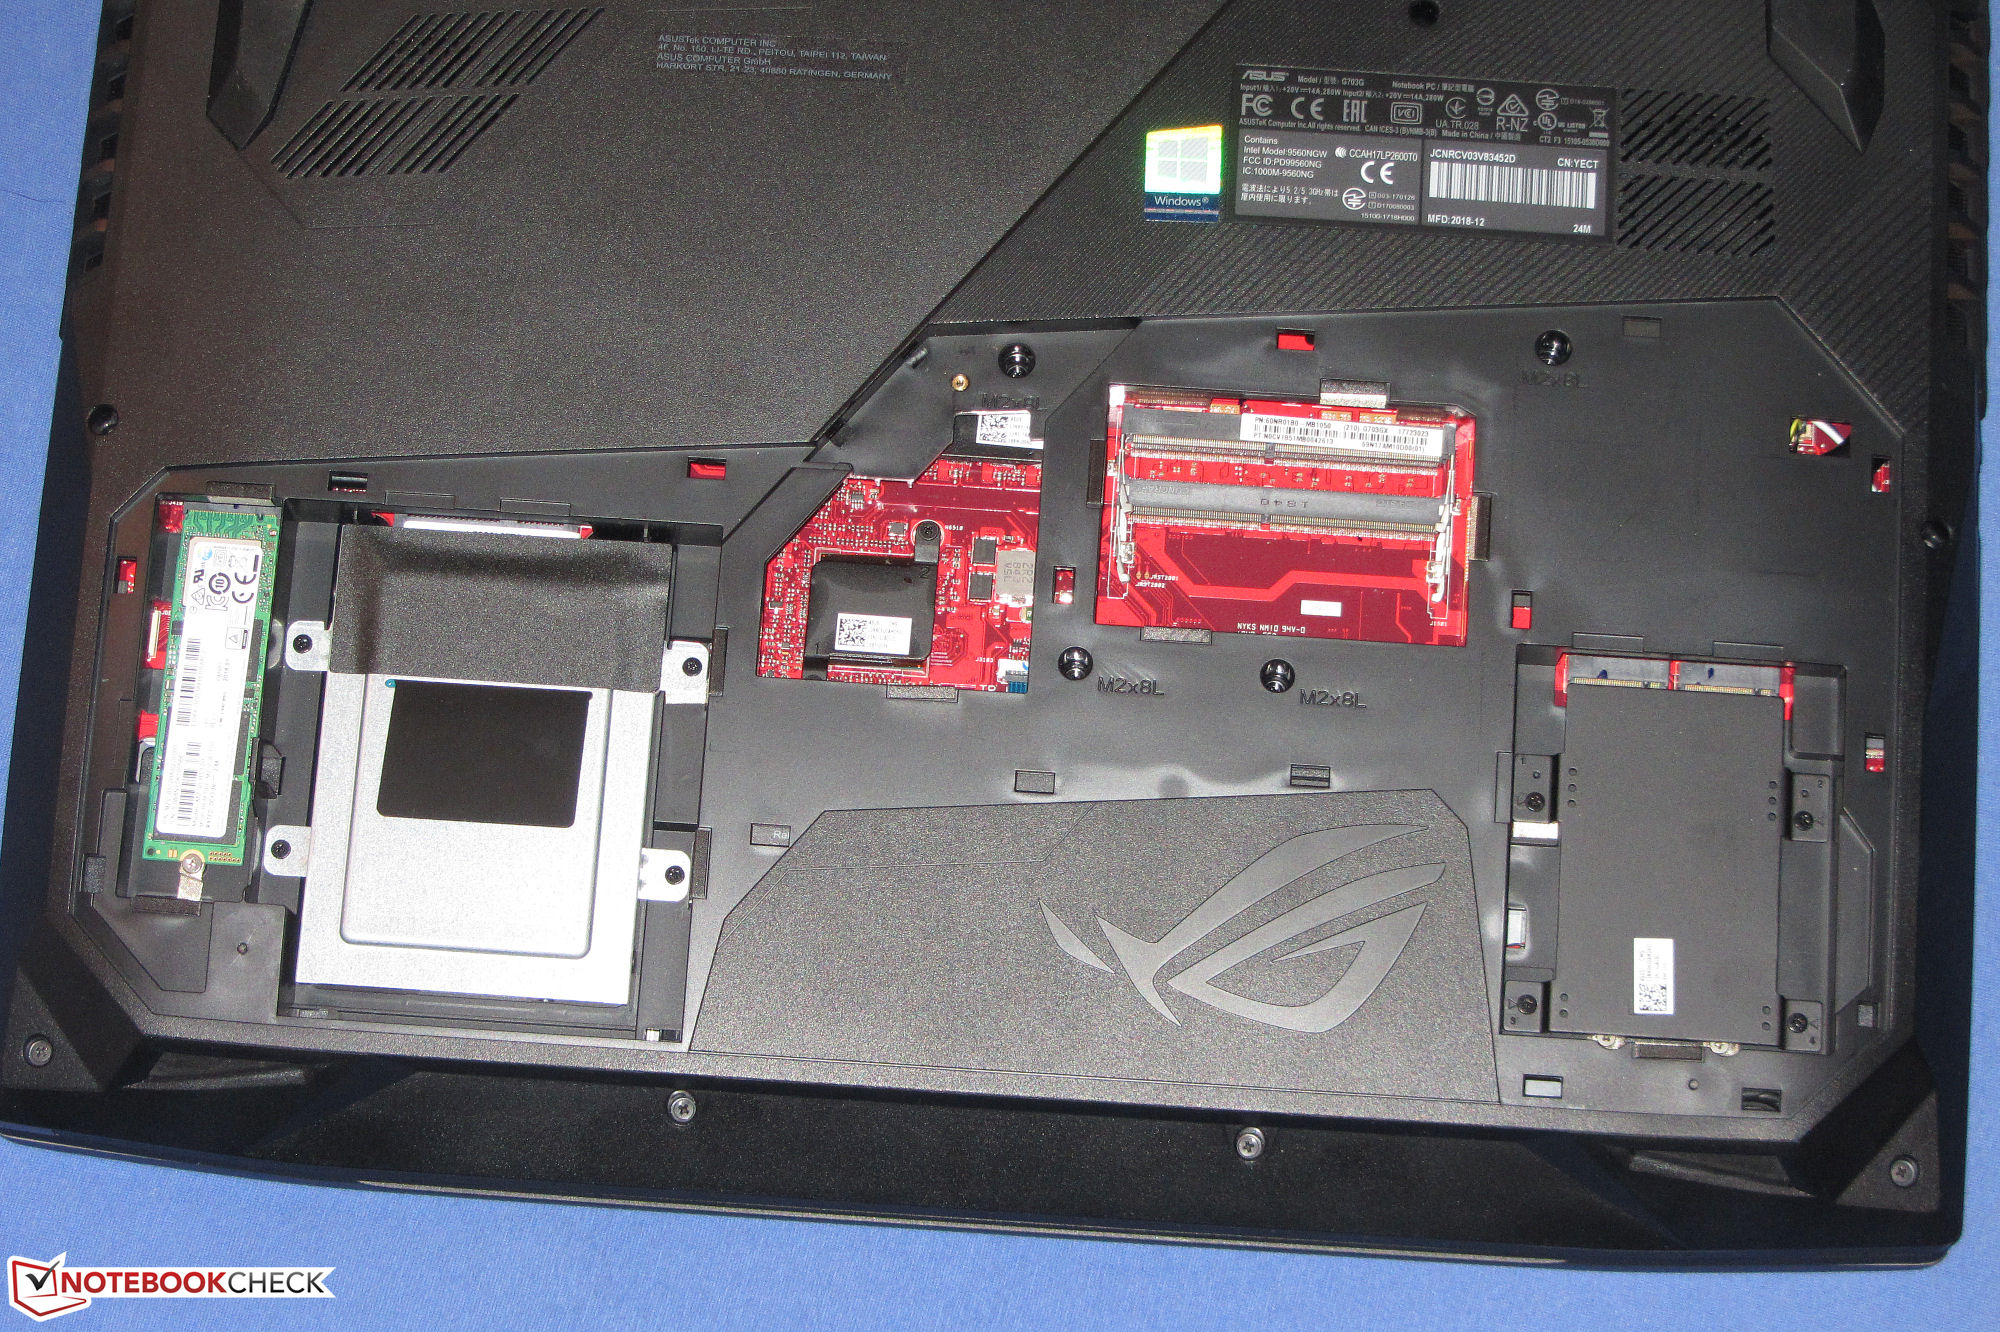
闪电般快速的NVMe SSD可确保快速运行的系统。除此之外还包含了1TB硬盘。更换两个驱动器非常简单,您还可以添加更多SSD,因为另外两个M.2-2280插槽仍然空余。
支持G-Sync的144 Hz IPS显示屏具有良好的对比度,稳定的视角和良好的响应时间。亮度值没问题,不算特别高。对于这种性能等级的设备,电池寿命是不错的。与前一代产品相比,更大容量电池的效果在这里是显而易见的。其他优点包括雷电3和2.5千兆以太网。
Asus ROG G703GX
- 05/14/2020 v7 (old)
Sascha Mölck
Price comparison

