联想 Yoga 510-14AST (A9-9410, HD) 变形本简短评测
» Notebookcheck多媒体笔记本电脑Top 10排名
» Notebookcheck游戏笔记本电脑Top 10排名
» Notebookcheck低价办公/商务笔记本电脑Top 10排名
» Notebookcheck高端办公/商务笔记本电脑Top 10排名
» Notebookcheck工作站笔记本电脑Top 10排名
» Notebookcheck亚笔记本电脑Top 10排名
» Notebookcheck超级本产品Top 10排名
» Notebookcheck变形本产品Top 10排名
» Notebookcheck平板电脑Top 10排名
» Notebookcheck智能手机Top 10排名
» Notebookcheck评测过最出色的笔记本电脑屏幕
» Notebookcheck售价500欧元以下笔记本电脑Top 10排名
» Notebookcheck售价300欧元以下笔记本电脑Top 10排名
| SD Card Reader | |
| average JPG Copy Test (av. of 3 runs) | |
| HP Pavilion x360 13-u102ng | |
| Lenovo Yoga 510-14AST | |
| Lenovo Yoga 510-14IKB | |
| maximum AS SSD Seq Read Test (1GB) | |
| HP Pavilion x360 13-u102ng | |
| Lenovo Yoga 510-14AST | |
| Lenovo Yoga 510-14IKB | |
| Networking | |
| iperf3 transmit AX12 | |
| Acer Spin 5 SP513-51 | |
| Lenovo Yoga 510-14AST | |
| iperf3 receive AX12 | |
| Acer Spin 5 SP513-51 | |
| Lenovo Yoga 510-14AST | |
| |||||||||||||||||||||||||
Brightness Distribution: 88 %
Center on Battery: 242 cd/m²
Contrast: 390:1 (Black: 0.62 cd/m²)
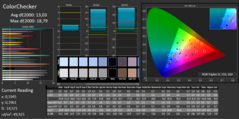
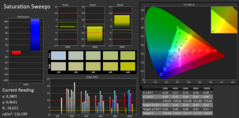
ΔE ColorChecker Calman: 13.03 | ∀{0.5-29.43 Ø4.77}
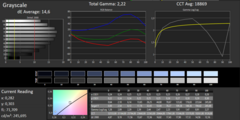
ΔE Greyscale Calman: 14.6 | ∀{0.09-98 Ø5}
52% sRGB (Argyll 1.6.3 3D)
33% AdobeRGB 1998 (Argyll 1.6.3 3D)
35.28% AdobeRGB 1998 (Argyll 3D)
51.4% sRGB (Argyll 3D)
34.15% Display P3 (Argyll 3D)
Gamma: 2.22
CCT: 18869 K
| Lenovo Yoga 510-14AST TN LED, 1366x768, 14" | Lenovo Yoga 510-14IKB IPS, 1920x1080, 14" | HP Pavilion x360 13-u102ng IPS, 1920x1080, 13.3" | Acer Spin 5 SP513-51 IPS LED, 1920x1080, 13.3" | |
|---|---|---|---|---|
| Display | 22% | 15% | 17% | |
| Display P3 Coverage (%) | 34.15 | 41.78 22% | 39.43 15% | 39.99 17% |
| sRGB Coverage (%) | 51.4 | 62.9 22% | 59.1 15% | 59.5 16% |
| AdobeRGB 1998 Coverage (%) | 35.28 | 43.17 22% | 40.76 16% | 41.32 17% |
| Response Times | -5% | 30% | 14% | |
| Response Time Grey 50% / Grey 80% * (ms) | 70 ? | 53 ? 24% | 38 ? 46% | 56 ? 20% |
| Response Time Black / White * (ms) | 29 ? | 39 ? -34% | 25 ? 14% | 27 ? 7% |
| PWM Frequency (Hz) | 350 ? | |||
| Screen | 37% | 39% | 49% | |
| Brightness middle (cd/m²) | 242 | 243 0% | 277 14% | 245 1% |
| Brightness (cd/m²) | 224 | 248 11% | 263 17% | 233 4% |
| Brightness Distribution (%) | 88 | 91 3% | 88 0% | 87 -1% |
| Black Level * (cd/m²) | 0.62 | 0.32 48% | 0.31 50% | 0.21 66% |
| Contrast (:1) | 390 | 759 95% | 894 129% | 1167 199% |
| Colorchecker dE 2000 * | 13.03 | 5.44 58% | 5.57 57% | 4.2 68% |
| Colorchecker dE 2000 max. * | 18.79 | 9.73 48% | 13.6 28% | 8.75 53% |
| Greyscale dE 2000 * | 14.6 | 4.74 68% | 4.56 69% | 3.94 73% |
| Gamma | 2.22 99% | 2.38 92% | 2.28 96% | 2.66 83% |
| CCT | 18869 34% | 7799 83% | 6648 98% | 6096 107% |
| Color Space (Percent of AdobeRGB 1998) (%) | 33 | 39.6 20% | 38 15% | 38 15% |
| Color Space (Percent of sRGB) (%) | 52 | 62.5 20% | 59 13% | 59 13% |
| Total Average (Program / Settings) | 18% /
28% | 28% /
33% | 27% /
38% |
* ... smaller is better
Screen Flickering / PWM (Pulse-Width Modulation)
| Screen flickering / PWM not detected | ||
In comparison: 53 % of all tested devices do not use PWM to dim the display. If PWM was detected, an average of 8070 (minimum: 5 - maximum: 343500) Hz was measured. | ||
Display Response Times
| ↔ Response Time Black to White | ||
|---|---|---|
| 29 ms ... rise ↗ and fall ↘ combined | ↗ 23 ms rise | |
| ↘ 6 ms fall | ||
| The screen shows relatively slow response rates in our tests and may be too slow for gamers. In comparison, all tested devices range from 0.1 (minimum) to 240 (maximum) ms. » 76 % of all devices are better. This means that the measured response time is worse than the average of all tested devices (20.2 ms). | ||
| ↔ Response Time 50% Grey to 80% Grey | ||
| 70 ms ... rise ↗ and fall ↘ combined | ↗ 32 ms rise | |
| ↘ 38 ms fall | ||
| The screen shows slow response rates in our tests and will be unsatisfactory for gamers. In comparison, all tested devices range from 0.165 (minimum) to 636 (maximum) ms. » 99 % of all devices are better. This means that the measured response time is worse than the average of all tested devices (31.5 ms). | ||
| Cinebench R15 | |
| CPU Single 64Bit | |
| Lenovo Yoga 510-14IKB | |
| HP Pavilion x360 13-u102ng | |
| Acer Spin 5 SP513-51 | |
| HP Pavilion x2 12-b000ng | |
| Asus Zenbook UX360CA-FC060T | |
| Lenovo B50-70 MCC2GGE | |
| Lenovo M30-70 | |
| Lenovo Yoga 510-14AST | |
| Acer Aspire ES1-332-P91H | |
| HP 250 G5 Y1V08UT | |
| CPU Multi 64Bit | |
| Lenovo Yoga 510-14IKB | |
| HP Pavilion x360 13-u102ng | |
| Acer Spin 5 SP513-51 | |
| HP Pavilion x2 12-b000ng | |
| Asus Zenbook UX360CA-FC060T | |
| Lenovo B50-70 MCC2GGE | |
| Medion Akoya S4217T MD98599 | |
| Medion Akoya S4217T MD98599 | |
| Lenovo M30-70 | |
| Acer Aspire ES1-332-P91H | |
| Lenovo Yoga 510-14AST | |
| HP 250 G5 Y1V08UT | |
| Cinebench R11.5 | |
| CPU Multi 64Bit | |
| HP Pavilion x360 13-u102ng | |
| HP Pavilion x2 12-b000ng | |
| Acer Aspire ES1-332-P91H | |
| Medion Akoya S4217T MD98599 | |
| Lenovo M30-70 | |
| Lenovo Yoga 510-14AST | |
| HP 250 G5 Y1V08UT | |
| CPU Single 64Bit | |
| HP Pavilion x360 13-u102ng | |
| HP Pavilion x2 12-b000ng | |
| Lenovo Yoga 510-14AST | |
| Medion Akoya S4217T MD98599 | |
| Lenovo M30-70 | |
| Acer Aspire ES1-332-P91H | |
| HP 250 G5 Y1V08UT | |
| Cinebench R10 | |
| Rendering Multiple CPUs 32Bit | |
| HP Pavilion x360 13-u102ng | |
| HP Pavilion x2 12-b000ng | |
| Lenovo B50-70 MCC2GGE | |
| Lenovo M30-70 | |
| Acer Aspire ES1-332-P91H | |
| Lenovo Yoga 510-14AST | |
| HP 250 G5 Y1V08UT | |
| Rendering Single 32Bit | |
| HP Pavilion x360 13-u102ng | |
| HP Pavilion x2 12-b000ng | |
| Lenovo B50-70 MCC2GGE | |
| Lenovo Yoga 510-14AST | |
| Lenovo M30-70 | |
| Acer Aspire ES1-332-P91H | |
| HP 250 G5 Y1V08UT | |
| Geekbench 3 | |
| 32 Bit Single-Core Score | |
| HP Pavilion x360 13-u102ng | |
| HP Pavilion x2 12-b000ng | |
| Lenovo Yoga 510-14AST | |
| Lenovo B50-70 MCC2GGE | |
| Acer Aspire ES1-332-P91H | |
| 32 Bit Multi-Core Score | |
| HP Pavilion x360 13-u102ng | |
| HP Pavilion x2 12-b000ng | |
| Acer Aspire ES1-332-P91H | |
| Lenovo B50-70 MCC2GGE | |
| Lenovo Yoga 510-14AST | |
| Geekbench 4.0 | |
| 64 Bit Single-Core Score | |
| HP Pavilion x360 13-u102ng | |
| Lenovo Yoga 510-14AST | |
| Acer Aspire ES1-332-P91H | |
| 64 Bit Multi-Core Score | |
| HP Pavilion x360 13-u102ng | |
| Acer Aspire ES1-332-P91H | |
| Lenovo Yoga 510-14AST | |
| JetStream 1.1 - Total Score | |
| HP Pavilion x360 13-u102ng | |
| HP Pavilion x2 12-b000ng | |
| Lenovo Yoga 510-14AST | |
| Lenovo B50-70 MCC2GGE | |
| Asus Zenbook UX360CA-FC060T | |
| Acer Spin 5 SP513-51 | |
| Acer Aspire ES1-332-P91H | |
| HP 250 G5 Y1V08UT | |
| PCMark 7 Score | 3814 points | |
| PCMark 8 Home Score Accelerated v2 | 2670 points | |
| PCMark 8 Creative Score Accelerated v2 | 2898 points | |
| PCMark 8 Work Score Accelerated v2 | 3728 points | |
Help | ||
| PCMark 8 | |
| Home Score Accelerated v2 | |
| Lenovo Yoga 510-14IKB | |
| HP Pavilion x360 13-u102ng | |
| Acer Spin 5 SP513-51 | |
| Lenovo Yoga 510-14AST | |
| Work Score Accelerated v2 | |
| Acer Spin 5 SP513-51 | |
| HP Pavilion x360 13-u102ng | |
| Lenovo Yoga 510-14AST | |
| Lenovo Yoga 510-14AST | Lenovo Yoga 510-14IKB Samsung MZYTY256HDHP | HP Pavilion x360 13-u102ng HGST Travelstar 5K1000 HTS541010A7E630 | |
|---|---|---|---|
| CrystalDiskMark 3.0 | 61% | -87% | |
| Read Seq (MB/s) | 434.6 | 518 19% | 104.8 -76% |
| Write Seq (MB/s) | 207.7 | 476.5 129% | 91 -56% |
| Read 512 (MB/s) | 356.3 | 408 15% | 20.67 -94% |
| Write 512 (MB/s) | 195.6 | 274.5 40% | 45.05 -77% |
| Read 4k (MB/s) | 26.71 | 35.66 34% | 0.215 -99% |
| Write 4k (MB/s) | 56.8 | 106.7 88% | 1.037 -98% |
| Read 4k QD32 (MB/s) | 176.3 | 368.7 109% | 0.968 -99% |
| Write 4k QD32 (MB/s) | 163.3 | 246.3 51% | 1.09 -99% |
| 3DMark 06 Standard Score | 5141 points | |
| 3DMark Vantage P Result | 3346 points | |
| 3DMark 11 Performance | 1199 points | |
| 3DMark Ice Storm Standard Score | 36896 points | |
| 3DMark Cloud Gate Standard Score | 3010 points | |
| 3DMark Fire Strike Score | 712 points | |
| 3DMark Fire Strike Extreme Score | 344 points | |
| 3DMark Time Spy Score | 274 points | |
Help | ||
| 3DMark 11 - 1280x720 Performance GPU | |
| Lenovo Yoga 510-14IKB | |
| HP Pavilion x360 13-u102ng | |
| Acer Spin 5 SP513-51 | |
| Lenovo Yoga 510-14AST | |
| 3DMark | |
| 1280x720 Cloud Gate Standard Graphics | |
| HP Pavilion x360 13-u102ng | |
| Acer Spin 5 SP513-51 | |
| Lenovo Yoga 510-14IKB | |
| Lenovo Yoga 510-14AST | |
| 1920x1080 Fire Strike Graphics | |
| Lenovo Yoga 510-14IKB | |
| Lenovo Yoga 510-14AST | |
| HP Pavilion x360 13-u102ng | |
| Acer Spin 5 SP513-51 | |
| low | med. | high | ultra | |
|---|---|---|---|---|
| World of Warcraft (2005) | 82.6 | 43.7 | ||
| Deus Ex Human Revolution (2011) | 62.4 | 29 | ||
| The Elder Scrolls V: Skyrim (2011) | 32.7 | 22.2 | 15.4 | |
| Diablo III (2012) | 59.6 | 41.8 | 33.6 | |
| Counter-Strike: GO (2012) | 39.2 | 28.5 | 25 | |
| Dead Space 3 (2013) | 63.9 | 31 | 26.6 | |
| Tomb Raider (2013) | 51.9 | 25.7 | 18.2 | |
| BioShock Infinite (2013) | 43.5 | 26.9 | 22.2 | |
| X-Plane 10.25 (2013) | 31.7 | 17.7 | 9.6 | |
| GRID: Autosport (2014) | 65.1 | 29.7 | ||
| Risen 3: Titan Lords (2014) | 20.9 | 12.9 | ||
| Sims 4 (2014) | 111.9 | 34.3 | ||
| Middle-earth: Shadow of Mordor (2014) | 22.3 | 13.8 | ||
| F1 2014 (2014) | 39 | 30 | ||
| Dragon Age: Inquisition (2014) | 19.3 | 14.8 | ||
| Dirt Rally (2015) | 59.7 | 22 | ||
| Metal Gear Solid V (2015) | 34.1 | 24.9 | ||
| Dota 2 Reborn (2015) | 33.1 | 23.2 | ||
| World of Warships (2015) | 37.7 | 28.8 | ||
| Rainbow Six Siege (2015) | 26.9 | 21.6 | ||
| Rise of the Tomb Raider (2016) | 16.1 | 10.4 | ||
| The Division (2016) | 18.2 | 11.3 | ||
| Civilization 6 (2016) | 29.4 | 12.1 | ||
| Farming Simulator 17 (2016) | 53.4 | 36.1 | ||
| Resident Evil 7 (2017) | 28.6 | 13.2 | ||
| For Honor (2017) | 19.9 | 7.3 | ||
| Ghost Recon Wildlands (2017) | 10.9 | 5.2 |
| BioShock Infinite - 1280x720 Very Low Preset | |
| Lenovo Yoga 510-14AST | |
| Acer Spin 5 SP513-51 | |
| Lenovo Yoga 510-14IKB | |
| HP Pavilion x360 13-u102ng | |
| Acer Aspire ES1-332-P91H | |
| Tomb Raider - 1024x768 Low Preset | |
| HP Pavilion x360 13-u102ng | |
| Lenovo Yoga 510-14AST | |
| Acer Aspire ES1-332-P91H | |
| GRID: Autosport - 1024x768 Ultra Low Preset | |
| Lenovo Yoga 510-14AST | |
| Acer Aspire ES1-332-P91H | |
Noise level
| Idle |
| 30.4 / 30.4 / 30.4 dB(A) |
| Load |
| 31.3 / 33.3 dB(A) |
 | ||
30 dB silent 40 dB(A) audible 50 dB(A) loud |
||
min: | ||
| Lenovo Yoga 510-14AST A9-9410, Radeon R5 (Stoney Ridge) | Lenovo Yoga 510-14IKB i5-7200U, Radeon R5 M430 | HP Pavilion x360 13-u102ng i5-7200U, HD Graphics 620 | Acer Spin 5 SP513-51 6100U, HD Graphics 520 | |
|---|---|---|---|---|
| Noise | -5% | -5% | -2% | |
| off / environment * (dB) | 30.4 | 29 5% | 30.5 -0% | 30.5 -0% |
| Idle Minimum * (dB) | 30.4 | 29 5% | 31.3 -3% | 30.5 -0% |
| Idle Average * (dB) | 30.4 | 29 5% | 31.3 -3% | 30.5 -0% |
| Idle Maximum * (dB) | 30.4 | 29 5% | 31.6 -4% | 30.6 -1% |
| Load Average * (dB) | 31.3 | 37.3 -19% | 34.2 -9% | 31 1% |
| Load Maximum * (dB) | 33.3 | 43.1 -29% | 37.3 -12% | 36.8 -11% |
* ... smaller is better
(+) The maximum temperature on the upper side is 34.5 °C / 94 F, compared to the average of 35.3 °C / 96 F, ranging from 19.6 to 60 °C for the class Convertible.
(+) The bottom heats up to a maximum of 39 °C / 102 F, compared to the average of 36.8 °C / 98 F
(+) In idle usage, the average temperature for the upper side is 27.1 °C / 81 F, compared to the device average of 30.3 °C / 87 F.
(+) The palmrests and touchpad are cooler than skin temperature with a maximum of 26.3 °C / 79.3 F and are therefore cool to the touch.
(±) The average temperature of the palmrest area of similar devices was 27.9 °C / 82.2 F (+1.6 °C / 2.9 F).
| Lenovo Yoga 510-14AST A9-9410, Radeon R5 (Stoney Ridge) | Lenovo Yoga 510-14IKB i5-7200U, Radeon R5 M430 | HP Pavilion x360 13-u102ng i5-7200U, HD Graphics 620 | Acer Spin 5 SP513-51 6100U, HD Graphics 520 | |
|---|---|---|---|---|
| Heat | -6% | 10% | -0% | |
| Maximum Upper Side * (°C) | 34.5 | 40.1 -16% | 34.6 -0% | 38.3 -11% |
| Maximum Bottom * (°C) | 39 | 46.1 -18% | 36.4 7% | 42.5 -9% |
| Idle Upper Side * (°C) | 30.8 | 28.5 7% | 26.6 14% | 28.7 7% |
| Idle Bottom * (°C) | 33.4 | 31.6 5% | 27.7 17% | 29.4 12% |
* ... smaller is better
Lenovo Yoga 510-14AST audio analysis
(-) | not very loud speakers (65 dB)
Bass 100 - 315 Hz
(-) | nearly no bass - on average 24.3% lower than median
(±) | linearity of bass is average (11.4% delta to prev. frequency)
Mids 400 - 2000 Hz
(+) | balanced mids - only 2.6% away from median
(±) | linearity of mids is average (8.2% delta to prev. frequency)
Highs 2 - 16 kHz
(+) | balanced highs - only 2.1% away from median
(±) | linearity of highs is average (8.1% delta to prev. frequency)
Overall 100 - 16.000 Hz
(±) | linearity of overall sound is average (21.8% difference to median)
Compared to same class
» 61% of all tested devices in this class were better, 8% similar, 31% worse
» The best had a delta of 6%, average was 20%, worst was 57%
Compared to all devices tested
» 61% of all tested devices were better, 7% similar, 32% worse
» The best had a delta of 4%, average was 24%, worst was 134%
Apple MacBook 12 (Early 2016) 1.1 GHz audio analysis
(+) | speakers can play relatively loud (83.6 dB)
Bass 100 - 315 Hz
(±) | reduced bass - on average 11.3% lower than median
(±) | linearity of bass is average (14.2% delta to prev. frequency)
Mids 400 - 2000 Hz
(+) | balanced mids - only 2.4% away from median
(+) | mids are linear (5.5% delta to prev. frequency)
Highs 2 - 16 kHz
(+) | balanced highs - only 2% away from median
(+) | highs are linear (4.5% delta to prev. frequency)
Overall 100 - 16.000 Hz
(+) | overall sound is linear (10.2% difference to median)
Compared to same class
» 7% of all tested devices in this class were better, 2% similar, 91% worse
» The best had a delta of 5%, average was 18%, worst was 53%
Compared to all devices tested
» 4% of all tested devices were better, 1% similar, 94% worse
» The best had a delta of 4%, average was 24%, worst was 134%
| Off / Standby | |
| Idle | |
| Load |
|
Key:
min: | |
| Lenovo Yoga 510-14AST A9-9410, Radeon R5 (Stoney Ridge) | Lenovo Yoga 510-14IKB i5-7200U, Radeon R5 M430 | HP Pavilion x360 13-u102ng i5-7200U, HD Graphics 620 | Acer Spin 5 SP513-51 6100U, HD Graphics 520 | |
|---|---|---|---|---|
| Power Consumption | -40% | -17% | -1% | |
| Idle Minimum * (Watt) | 3.9 | 3.9 -0% | 4.7 -21% | 4.1 -5% |
| Idle Average * (Watt) | 7.4 | 7.1 4% | 7.2 3% | 6.8 8% |
| Idle Maximum * (Watt) | 9.4 | 7.7 18% | 7.9 16% | 7.9 16% |
| Load Average * (Watt) | 19.2 | 33.4 -74% | 30 -56% | 20.4 -6% |
| Load Maximum * (Watt) | 22.5 | 55.9 -148% | 29 -29% | 26.8 -19% |
* ... smaller is better
| Lenovo Yoga 510-14AST A9-9410, Radeon R5 (Stoney Ridge), 35 Wh | Lenovo Yoga 510-14IKB i5-7200U, Radeon R5 M430, 35 Wh | HP Pavilion x360 13-u102ng i5-7200U, HD Graphics 620, 41 Wh | Acer Spin 5 SP513-51 6100U, HD Graphics 520, 45 Wh | |
|---|---|---|---|---|
| Battery runtime | -4% | -14% | 16% | |
| Reader / Idle (h) | 14.1 | 12 -15% | 9.3 -34% | 12.5 -11% |
| H.264 (h) | 5.1 | 5.3 4% | ||
| WiFi v1.3 (h) | 5.4 | 6.2 15% | 5.4 0% | 7.7 43% |
| Load (h) | 1.9 | 1.7 -11% | 1.4 -26% | 2.2 16% |
Pros
Cons
联想以 Yoga 510-14AST的形式提供了一个之前我们测试过的Yoga 510-15IKB的廉价版。售价500欧元左右,Yoga510-14AST比测试过的姊妹版足足便宜了400欧元之多。新的斯通利之桥APU的确很好地压缩了价格。CPU足以应付它用来处理的应用,并且GPU能在处理单元和渲染单元上与Intel HD520分庭抗礼。
Yoga 在整个负载范围内都能安静的运行,发热水平也仅是温热而已。固态硬盘保证了系统的高速运行。需要多余128GB存储空间的用于可以将其换成更高容量的型号。更换操作需要移除笔记本的底壳。内置的键盘整体上比较吸引人,甚至能够承担较为频繁的打字操作。电池续航时间偏短。
屏幕令人失望,对此负责的联想员工似乎认为在变形本上搭载一块窄视角TN屏幕是个好选择。
再者,它也是一块低亮度,第对比度,色彩还原度很糟糕的面板。由于屏幕的选择,联想使其设备的吸引力大幅度下降。这真是太糟糕了考虑到联想实际上设计了一台全面的设备而且肯定会吸引很多的买家。显然也不能去选择另一个型号,所有的14AST系列型号都搭载了这块糟糕的屏幕,令人无法理解。
想要获得广视角屏幕的用户将需要考虑基于英特尔平台的Yoga产品。Yoga 510-14IKB 80VB0081GE大约贵50欧元(约合53美元),搭载有性能强得多的酷睿 i3-7100U处理器以及一块广视角全高清IPS屏幕。因此,很难找到理由去购买AMD平台的型号。
注:本文是基于完整评测的缩减版本,阅读完整的英文评测,请点击这里。
Lenovo Yoga 510-14AST
- 03/23/2017 v6 (old)
Sascha Mölck


