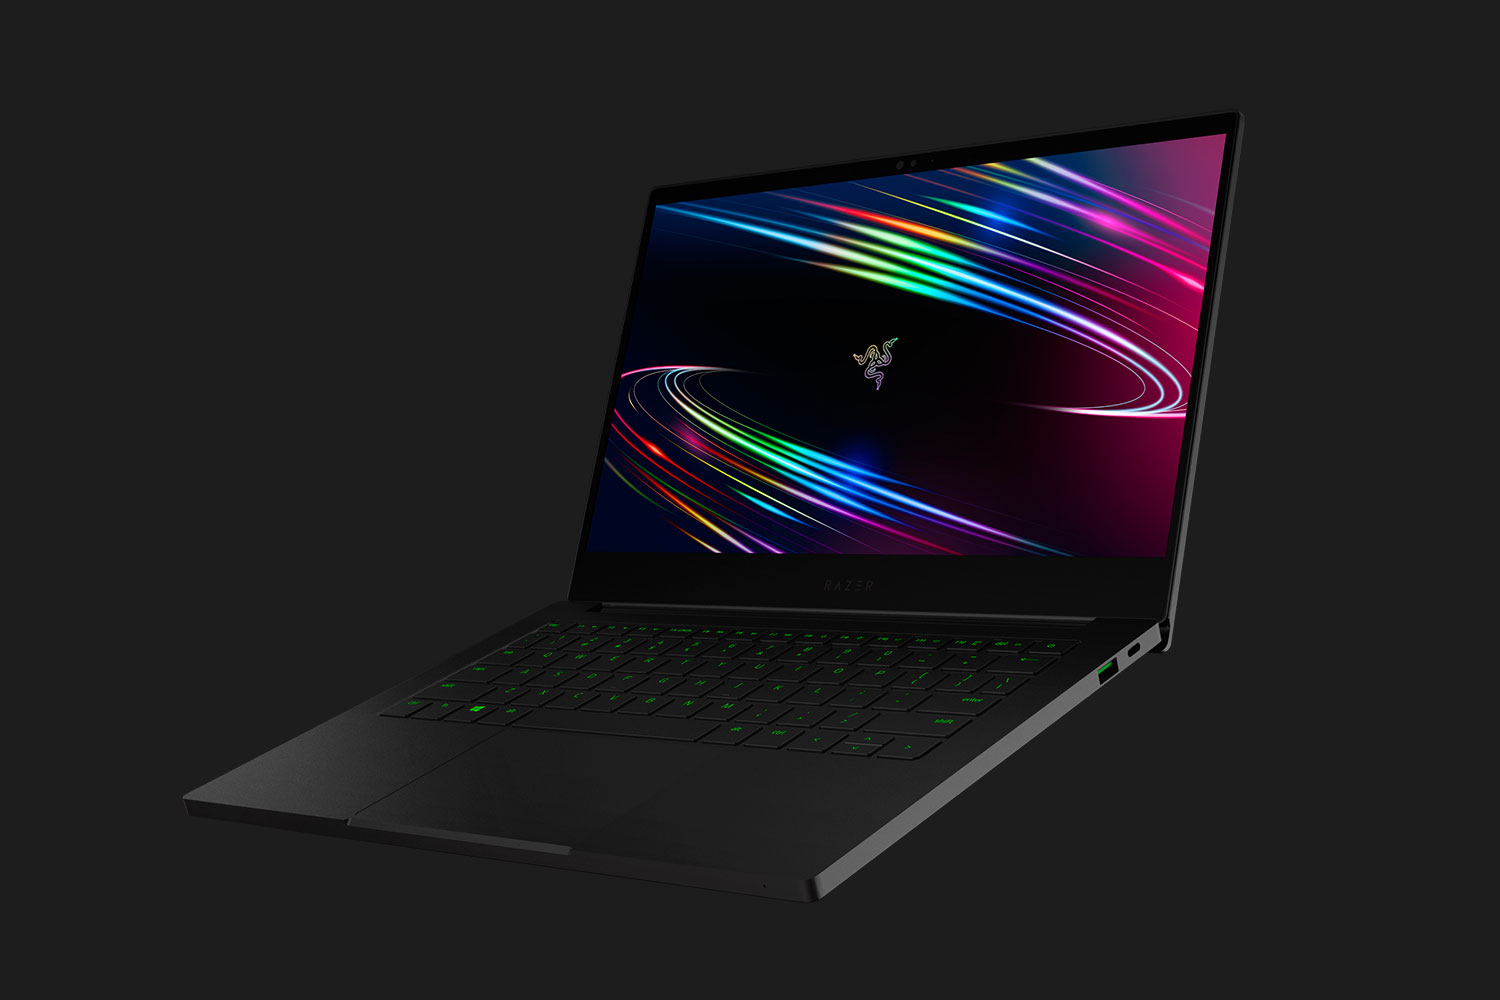
雷蛇灵刃潜行版GTX 1650 Ti Max-Q笔记本电脑评测:把2019版本搞对了
Rating | Date | Model | Weight | Height | Size | Resolution | Price |
|---|---|---|---|---|---|---|---|
| 84.8 % v7 (old) | 08 / 2020 | Razer Blade Stealth Core i7 GTX 1650 Ti Max-Q 4K i7-1065G7, GeForce GTX 1650 Ti Max-Q | 1.5 kg | 15.3 mm | 13.30" | 3840x2160 | |
| 88 % v7 (old) | 06 / 2020 | Dell XPS 13 9300 4K UHD i7-1065G7, Iris Plus Graphics G7 (Ice Lake 64 EU) | 1.2 kg | 14.8 mm | 13.40" | 3840x2400 | |
| 88.4 % v7 (old) | 07 / 2020 | HP Spectre x360 13-aw0013dx i7-1065G7, Iris Plus Graphics G7 (Ice Lake 64 EU) | 1.2 kg | 16.9 mm | 13.30" | 1920x1080 | |
| 86.6 % v6 (old) | 03 / 2019 | Asus ZenBook S13 UX392FN i7-8565U, GeForce MX150 | 1.1 kg | 12.9 mm | 13.90" | 1920x1080 | |
| 85 % v6 (old) | 08 / 2019 | Lenovo IdeaPad S940-14IWL i7-8565U, UHD Graphics 620 | 1.2 kg | 12 mm | 14.00" | 3840x2160 | |
| 84.2 % v7 (old) | 05 / 2020 | MSI Prestige 14 A10SC-009 i7-10710U, GeForce GTX 1650 Max-Q | 1.3 kg | 16 mm | 14.00" | 3840x2160 |


| |||||||||||||||||||||||||
Brightness Distribution: 92 %
Center on Battery: 467 cd/m²
Contrast: 1197:1 (Black: 0.39 cd/m²)
ΔE ColorChecker Calman: 2.1 | ∀{0.5-29.43 Ø4.73}
calibrated: 2.04
ΔE Greyscale Calman: 1.3 | ∀{0.09-98 Ø4.97}
93.4% sRGB (Argyll 1.6.3 3D)
59.5% AdobeRGB 1998 (Argyll 1.6.3 3D)
64.5% AdobeRGB 1998 (Argyll 3D)
93.7% sRGB (Argyll 3D)
63.7% Display P3 (Argyll 3D)
Gamma: 2.26
CCT: 6501 K
| Razer Blade Stealth Core i7 GTX 1650 Ti Max-Q 4K AUO272B, IPS, 13.3", 3840x2160 | Dell XPS 13 9300 4K UHD Sharp LQ134R1, IPS, 13.4", 3840x2400 | HP Spectre x360 13-aw0013dx AU Optronics AUO5E2D, IPS, 13.3", 1920x1080 | MSI Prestige 14 A10SC-009 IPS, 14", 3840x2160 | Razer Blade Stealth i7-8565U Sharp LQ133M1JW41, IPS, 13.3", 1920x1080 | Razer Blade Stealth 13, Core i7-1065G7 AUO202B, IPS LED, 13.3", 3840x2160 | |
|---|---|---|---|---|---|---|
| Display | 1% | 9% | 3% | 2% | ||
| Display P3 Coverage (%) | 63.7 | 64.5 1% | 69.6 9% | 65.5 3% | 64.3 1% | |
| sRGB Coverage (%) | 93.7 | 91.4 -2% | 98.9 6% | 96.3 3% | 95.8 2% | |
| AdobeRGB 1998 Coverage (%) | 64.5 | 66.6 3% | 71.5 11% | 66.3 3% | 65.7 2% | |
| Response Times | 30% | -3% | 4% | 5% | -7% | |
| Response Time Grey 50% / Grey 80% * (ms) | 57.6 ? | 41.6 ? 28% | 60.8 ? -6% | 55 ? 5% | 57.6 ? -0% | 62 ? -8% |
| Response Time Black / White * (ms) | 37.2 ? | 25.6 ? 31% | 36.8 ? 1% | 36 ? 3% | 34 ? 9% | 39 ? -5% |
| PWM Frequency (Hz) | 22730 ? | |||||
| Screen | -22% | -44% | 8% | 12% | -38% | |
| Brightness middle (cd/m²) | 467 | 414 -11% | 447.4 -4% | 567 21% | 429.8 -8% | 353 -24% |
| Brightness (cd/m²) | 448 | 401 -10% | 420 -6% | 516 15% | 403 -10% | 335 -25% |
| Brightness Distribution (%) | 92 | 94 2% | 85 -8% | 86 -7% | 89 -3% | 90 -2% |
| Black Level * (cd/m²) | 0.39 | 0.28 28% | 0.31 21% | 0.445 -14% | 0.32 18% | 0.25 36% |
| Contrast (:1) | 1197 | 1479 24% | 1443 21% | 1274 6% | 1343 12% | 1412 18% |
| Colorchecker dE 2000 * | 2.1 | 3.06 -46% | 4.23 -101% | 1.55 26% | 1.08 49% | 4.4 -110% |
| Colorchecker dE 2000 max. * | 5.1 | 6.5 -27% | 9.34 -83% | 5.14 -1% | 3.96 22% | 7.21 -41% |
| Colorchecker dE 2000 calibrated * | 2.04 | 3.5 -72% | 1.32 35% | 1.24 39% | 1.21 41% | 1.1 46% |
| Greyscale dE 2000 * | 1.3 | 3 -131% | 6.1 -369% | 1.48 -14% | 1.3 -0% | 5.49 -322% |
| Gamma | 2.26 97% | 2.42 91% | 2.11 104% | 2.19 100% | 2.23 99% | 2.26 97% |
| CCT | 6501 100% | 6840 95% | 6136 106% | 6741 96% | 6452 101% | 7689 85% |
| Color Space (Percent of AdobeRGB 1998) (%) | 59.5 | 61.1 3% | 64.8 9% | 61.4 3% | 61 3% | |
| Color Space (Percent of sRGB) (%) | 93.4 | 91.4 -2% | 98.9 6% | 96.3 3% | 96 3% | |
| Total Average (Program / Settings) | 3% /
-11% | -13% /
-29% | 6% /
7% | 7% /
9% | -14% /
-27% |
* ... smaller is better
Display Response Times
| ↔ Response Time Black to White | ||
|---|---|---|
| 37.2 ms ... rise ↗ and fall ↘ combined | ↗ 21.2 ms rise | 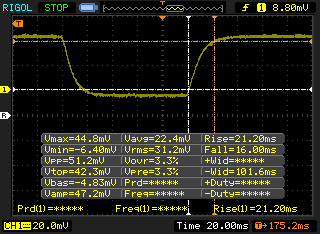 |
| ↘ 16 ms fall | ||
| The screen shows slow response rates in our tests and will be unsatisfactory for gamers. In comparison, all tested devices range from 0.1 (minimum) to 240 (maximum) ms. » 95 % of all devices are better. This means that the measured response time is worse than the average of all tested devices (19.9 ms). | ||
| ↔ Response Time 50% Grey to 80% Grey | ||
| 57.6 ms ... rise ↗ and fall ↘ combined | ↗ 28 ms rise |  |
| ↘ 29.6 ms fall | ||
| The screen shows slow response rates in our tests and will be unsatisfactory for gamers. In comparison, all tested devices range from 0.165 (minimum) to 636 (maximum) ms. » 94 % of all devices are better. This means that the measured response time is worse than the average of all tested devices (31.1 ms). | ||
Screen Flickering / PWM (Pulse-Width Modulation)
| Screen flickering / PWM not detected |  | ||
In comparison: 52 % of all tested devices do not use PWM to dim the display. If PWM was detected, an average of 7798 (minimum: 5 - maximum: 343500) Hz was measured. | |||

Cinebench R20: CPU (Multi Core) | CPU (Single Core)
Blender: v2.79 BMW27 CPU
7-Zip 18.03: 7z b 4 -mmt1 | 7z b 4
Geekbench 5.5: Single-Core | Multi-Core
HWBOT x265 Benchmark v2.2: 4k Preset
LibreOffice : 20 Documents To PDF
R Benchmark 2.5: Overall mean
| Cinebench R15 / CPU Multi 64Bit | |
| Dell XPS 13 7390 Core i7-10710U | |
| Dell XPS 15 9500 Core i5 | |
| MSI GF63 Thin 9SC | |
| Razer Blade Stealth Core i7 GTX 1650 Ti Max-Q 4K | |
| Razer Blade Stealth i7-1065G7 Iris Plus | |
| Dell Inspiron 15 5000 5585 | |
| Average Intel Core i7-1065G7 (288 - 836, n=36) | |
| Huawei MateBook X Pro 2020 i7 | |
| Razer Blade Stealth 13, Core i7-1065G7 | |
| HP Spectre x360 13-ap0312ng | |
| Dynabook Portege A30-E-174 | |
| Cinebench R15 / CPU Single 64Bit | |
| Dell XPS 15 9500 Core i5 | |
| Dell XPS 13 7390 Core i7-10710U | |
| Average Intel Core i7-1065G7 (141 - 190, n=35) | |
| MSI GF63 Thin 9SC | |
| Razer Blade Stealth 13, Core i7-1065G7 | |
| Huawei MateBook X Pro 2020 i7 | |
| HP Spectre x360 13-ap0312ng | |
| Razer Blade Stealth Core i7 GTX 1650 Ti Max-Q 4K | |
| Dynabook Portege A30-E-174 | |
| Razer Blade Stealth i7-1065G7 Iris Plus | |
| Dell Inspiron 15 5000 5585 | |
| Cinebench R20 / CPU (Multi Core) | |
| Dell XPS 13 7390 Core i7-10710U | |
| Dell XPS 15 9500 Core i5 | |
| MSI GF63 Thin 9SC | |
| Razer Blade Stealth Core i7 GTX 1650 Ti Max-Q 4K | |
| Average Intel Core i7-1065G7 (1081 - 2024, n=31) | |
| Dell Inspiron 15 5000 5585 | |
| Razer Blade Stealth i7-1065G7 Iris Plus | |
| Dynabook Portege A30-E-174 | |
| Huawei MateBook X Pro 2020 i7 | |
| HP Spectre x360 13-ap0312ng | |
| Cinebench R20 / CPU (Single Core) | |
| Dell XPS 13 7390 Core i7-10710U | |
| Dell XPS 15 9500 Core i5 | |
| Average Intel Core i7-1065G7 (358 - 474, n=31) | |
| Razer Blade Stealth Core i7 GTX 1650 Ti Max-Q 4K | |
| MSI GF63 Thin 9SC | |
| Huawei MateBook X Pro 2020 i7 | |
| Razer Blade Stealth i7-1065G7 Iris Plus | |
| Dynabook Portege A30-E-174 | |
| HP Spectre x360 13-ap0312ng | |
| Dell Inspiron 15 5000 5585 | |
| Blender / v2.79 BMW27 CPU | |
| Huawei MateBook X Pro 2020 i7 | |
| HP Spectre x360 13-ap0312ng | |
| Average Intel Core i7-1065G7 (675 - 1650, n=23) | |
| Dell XPS 13 7390 Core i7-10710U | |
| Dell XPS 15 9500 Core i5 | |
| 7-Zip 18.03 / 7z b 4 -mmt1 | |
| Dell XPS 15 9500 Core i5 | |
| Huawei MateBook X Pro 2020 i7 | |
| Dell XPS 13 7390 Core i7-10710U | |
| Average Intel Core i7-1065G7 (3289 - 4589, n=24) | |
| HP Spectre x360 13-ap0312ng | |
| Razer Blade Stealth Core i7 GTX 1650 Ti Max-Q 4K | |
| 7-Zip 18.03 / 7z b 4 | |
| Dell XPS 13 7390 Core i7-10710U | |
| Dell XPS 15 9500 Core i5 | |
| Razer Blade Stealth Core i7 GTX 1650 Ti Max-Q 4K | |
| Average Intel Core i7-1065G7 (10406 - 22898, n=24) | |
| Huawei MateBook X Pro 2020 i7 | |
| HP Spectre x360 13-ap0312ng | |
| Geekbench 5.5 / Single-Core | |
| Average Intel Core i7-1065G7 (948 - 1348, n=18) | |
| Razer Blade Stealth Core i7 GTX 1650 Ti Max-Q 4K | |
| Dell XPS 15 9500 Core i5 | |
| Huawei MateBook X Pro 2020 i7 | |
| Geekbench 5.5 / Multi-Core | |
| Razer Blade Stealth Core i7 GTX 1650 Ti Max-Q 4K | |
| Dell XPS 15 9500 Core i5 | |
| Average Intel Core i7-1065G7 (2464 - 4855, n=18) | |
| Huawei MateBook X Pro 2020 i7 | |
| HWBOT x265 Benchmark v2.2 / 4k Preset | |
| Dell XPS 15 9500 Core i5 | |
| Dell XPS 13 7390 Core i7-10710U | |
| Average Intel Core i7-1065G7 (2.2 - 6.38, n=22) | |
| Huawei MateBook X Pro 2020 i7 | |
| HP Spectre x360 13-ap0312ng | |
| LibreOffice / 20 Documents To PDF | |
| Dell XPS 15 9500 Core i5 | |
| Razer Blade Stealth Core i7 GTX 1650 Ti Max-Q 4K | |
| Average Intel Core i7-1065G7 (46.9 - 85.3, n=19) | |
| Huawei MateBook X Pro 2020 i7 | |
| R Benchmark 2.5 / Overall mean | |
| Average Intel Core i7-1065G7 (0.661 - 0.798, n=18) | |
| Dell XPS 15 9500 Core i5 | |
| Huawei MateBook X Pro 2020 i7 | |
* ... smaller is better
| PCMark 10 | |
| Score | |
| MSI Prestige 14 A10SC-009 | |
| Razer Blade Stealth i7-1065G7 Iris Plus | |
| Razer Blade Stealth Core i7 GTX 1650 Ti Max-Q 4K | |
| Razer Blade Stealth 13, Core i7-1065G7 | |
| Dell XPS 13 9300 4K UHD | |
| Razer Blade Stealth i7-8565U | |
| Essentials | |
| Razer Blade Stealth i7-1065G7 Iris Plus | |
| Dell XPS 13 9300 4K UHD | |
| MSI Prestige 14 A10SC-009 | |
| Razer Blade Stealth Core i7 GTX 1650 Ti Max-Q 4K | |
| Razer Blade Stealth i7-8565U | |
| Razer Blade Stealth 13, Core i7-1065G7 | |
| Productivity | |
| Razer Blade Stealth i7-1065G7 Iris Plus | |
| Razer Blade Stealth Core i7 GTX 1650 Ti Max-Q 4K | |
| Dell XPS 13 9300 4K UHD | |
| MSI Prestige 14 A10SC-009 | |
| Razer Blade Stealth 13, Core i7-1065G7 | |
| Razer Blade Stealth i7-8565U | |
| Digital Content Creation | |
| MSI Prestige 14 A10SC-009 | |
| Razer Blade Stealth 13, Core i7-1065G7 | |
| Razer Blade Stealth Core i7 GTX 1650 Ti Max-Q 4K | |
| Dell XPS 13 9300 4K UHD | |
| Razer Blade Stealth i7-1065G7 Iris Plus | |
| Razer Blade Stealth i7-8565U | |
| PCMark 8 | |
| Home Score Accelerated v2 | |
| Razer Blade Stealth i7-1065G7 Iris Plus | |
| Razer Blade Stealth i7-8565U | |
| MSI Prestige 14 A10SC-009 | |
| Razer Blade Stealth Core i7 GTX 1650 Ti Max-Q 4K | |
| Dell XPS 13 9300 4K UHD | |
| Razer Blade Stealth 13, Core i7-1065G7 | |
| Work Score Accelerated v2 | |
| Razer Blade Stealth i7-1065G7 Iris Plus | |
| Razer Blade Stealth i7-8565U | |
| MSI Prestige 14 A10SC-009 | |
| Dell XPS 13 9300 4K UHD | |
| Razer Blade Stealth Core i7 GTX 1650 Ti Max-Q 4K | |
| Razer Blade Stealth 13, Core i7-1065G7 | |
| PCMark 8 Home Score Accelerated v2 | 3424 points | |
| PCMark 8 Work Score Accelerated v2 | 4202 points | |
| PCMark 10 Score | 4497 points | |
Help | ||
| DPC Latencies / LatencyMon - interrupt to process latency (max), Web, Youtube, Prime95 | |
| Dell XPS 15 9500 Core i7 4K UHD | |
| Razer Blade Stealth Core i7 GTX 1650 Ti Max-Q 4K | |
| Dell XPS 13 9300 4K UHD | |
| Asus Zephyrus G14 GA401IV | |
| Dell XPS 15 9500 Core i5 | |
| MSI GS66 10SGS | |
| Eluktronics RP-15 | |
* ... smaller is better
| Razer Blade Stealth Core i7 GTX 1650 Ti Max-Q 4K Lite-On CA5-8D512 | Dell XPS 13 9300 4K UHD Intel SSDPEMKF512G8 NVMe SSD | Asus ZenBook S13 UX392FN WDC PC SN520 SDAPNUW-512G | MSI Prestige 14 A10SC-009 Samsung SSD PM981 MZVLB1T0HALR | Razer Blade Stealth 13, Core i7-1065G7 Lite-On CA3-8D512 | |
|---|---|---|---|---|---|
| AS SSD | -11% | 8% | 39% | -5% | |
| Seq Read (MB/s) | 2220 | 1821 -18% | 1224 -45% | 2300 4% | 2666 20% |
| Seq Write (MB/s) | 2006 | 931 -54% | 907 -55% | 2051 2% | 1497 -25% |
| 4K Read (MB/s) | 51.4 | 56.4 10% | 41.46 -19% | 46.23 -10% | 53.7 4% |
| 4K Write (MB/s) | 119.2 | 127.2 7% | 126.2 6% | 84.6 -29% | 133.7 12% |
| 4K-64 Read (MB/s) | 740 | 462.6 -37% | 1021 38% | 1552 110% | 652 -12% |
| 4K-64 Write (MB/s) | 968 | 541 -44% | 1251 29% | 1789 85% | 272 -72% |
| Access Time Read * (ms) | 0.051 | 0.04 22% | 0.053 -4% | 0.049 4% | 0.075 -47% |
| Access Time Write * (ms) | 0.1 | 0.123 -23% | 0.027 73% | 0.045 55% | 0.032 68% |
| Score Read (Points) | 1013 | 701 -31% | 1185 17% | 1828 80% | 972 -4% |
| Score Write (Points) | 1288 | 762 -41% | 1468 14% | 2079 61% | 555 -57% |
| Score Total (Points) | 2822 | 1797 -36% | 3250 15% | 4831 71% | 1982 -30% |
| Copy ISO MB/s (MB/s) | 1881 | 1068 -43% | 1404 -25% | 1495 -21% | |
| Copy Program MB/s (MB/s) | 441.8 | 446.4 1% | 402.4 -9% | 458.4 4% | |
| Copy Game MB/s (MB/s) | 505 | 1163 130% | 902 79% | 964 91% | |
| CrystalDiskMark 5.2 / 6 | -23% | -22% | -11% | -7% | |
| Write 4K (MB/s) | 158.7 | 126.2 -20% | 149.2 -6% | 163.8 3% | 153 -4% |
| Read 4K (MB/s) | 58.2 | 61.1 5% | 47.18 -19% | 48.6 -16% | 59.5 2% |
| Write Seq (MB/s) | 2219 | 1049 -53% | 750 -66% | 2269 2% | 1608 -28% |
| Read Seq (MB/s) | 2444 | 2231 -9% | 1137 -53% | 1963 -20% | 2293 -6% |
| Write 4K Q32T1 (MB/s) | 475.9 | 410.1 -14% | 749 57% | 289.8 -39% | 497 4% |
| Read 4K Q32T1 (MB/s) | 509 | 418.9 -18% | 478.7 -6% | 373.6 -27% | 544 7% |
| Write Seq Q32T1 (MB/s) | 2202 | 784 -64% | 1453 -34% | 2395 9% | 1640 -26% |
| Read Seq Q32T1 (MB/s) | 3372 | 2964 -12% | 1713 -49% | 3479 3% | 3158 -6% |
| Write 4K Q8T8 (MB/s) | 960 | ||||
| Read 4K Q8T8 (MB/s) | 844 | ||||
| Total Average (Program / Settings) | -17% /
-16% | -7% /
-3% | 14% /
18% | -6% /
-6% |
* ... smaller is better

Disk Throttling: DiskSpd Read Loop, Queue Depth 8
| 3DMark 11 | |
| 1280x720 Performance GPU | |
| MSI RTX 2060 Gaming Z 6G | |
| Asus Zephyrus G14 GA401IV | |
| Razer Blade 15 GTX 1660 Ti | |
| MSI P65 8RF-451 - Creator | |
| Gainward GeForce GTX 1650 4 GB | |
| Dell XPS 15 9500 Core i7 4K UHD | |
| Dell XPS 15 7590 9980HK GTX 1650 | |
| Razer Blade Stealth Core i7 GTX 1650 Ti Max-Q 4K | |
| MSI PS63 Modern 8SC | |
| Schenker XMG P407 | |
| HP Pavilion Gaming 15-ec0002ng | |
| Razer Blade Stealth i7-8565U | |
| 1280x720 Performance Combined | |
| MSI RTX 2060 Gaming Z 6G | |
| Asus Zephyrus G14 GA401IV | |
| Dell XPS 15 9500 Core i7 4K UHD | |
| Gainward GeForce GTX 1650 4 GB | |
| Razer Blade 15 GTX 1660 Ti | |
| Razer Blade Stealth Core i7 GTX 1650 Ti Max-Q 4K | |
| MSI P65 8RF-451 - Creator | |
| Dell XPS 15 7590 9980HK GTX 1650 | |
| MSI PS63 Modern 8SC | |
| Schenker XMG P407 | |
| HP Pavilion Gaming 15-ec0002ng | |
| Razer Blade Stealth i7-8565U | |
| 3DMark 06 Standard Score | 30266 points | |
| 3DMark Vantage P Result | 31116 points | |
| 3DMark 11 Performance | 11070 points | |
| 3DMark Cloud Gate Standard Score | 19073 points | |
| 3DMark Fire Strike Score | 7356 points | |
| 3DMark Time Spy Score | 3193 points | |
Help | ||
| The Witcher 3 | |
| 1024x768 Low Graphics & Postprocessing | |
| Razer Blade 15 GTX 1660 Ti | |
| Razer Blade Stealth Core i7 GTX 1650 Ti Max-Q 4K | |
| Razer Blade Stealth 13, Core i7-1065G7 | |
| Razer Blade Stealth i7-8565U | |
| 1366x768 Medium Graphics & Postprocessing | |
| Razer Blade 15 GTX 1660 Ti | |
| Razer Blade Stealth Core i7 GTX 1650 Ti Max-Q 4K | |
| Razer Blade Stealth 13, Core i7-1065G7 | |
| Razer Blade Stealth i7-8565U | |
| 1920x1080 High Graphics & Postprocessing (Nvidia HairWorks Off) | |
| Razer Blade 15 GTX 1660 Ti | |
| Razer Blade Stealth Core i7 GTX 1650 Ti Max-Q 4K | |
| Razer Blade Stealth 13, Core i7-1065G7 | |
| Razer Blade Stealth i7-8565U | |
| 1920x1080 Ultra Graphics & Postprocessing (HBAO+) | |
| Razer Blade 15 GTX 1660 Ti | |
| Razer Blade Stealth Core i7 GTX 1650 Ti Max-Q 4K | |
| Razer Blade Stealth 13, Core i7-1065G7 | |
| Razer Blade Stealth i7-8565U | |
| low | med. | high | ultra | QHD | 4K | |
|---|---|---|---|---|---|---|
| The Witcher 3 (2015) | 159.5 | 92 | 52.6 | 29.8 | ||
| Dota 2 Reborn (2015) | 118 | 112 | 107 | 104 | 51.5 | |
| X-Plane 11.11 (2018) | 79 | 71.5 | 60.5 | 49.2 | ||
| Shadow of the Tomb Raider (2018) | 102 | 55 | 44 | 37 | ||
| Assassin´s Creed Odyssey (2018) | 63 | 49 | 41 | 19 | ||
| Apex Legends (2019) | 143.7 | 86.2 | 68.7 | 62.9 | ||
| Far Cry New Dawn (2019) | 89 | 56 | 53 | 49 | ||
| Metro Exodus (2019) | 83.1 | 40.1 | 29.8 | 23.2 | ||
| Dirt Rally 2.0 (2019) | 195.9 | 63.1 | 55.1 | 38.1 | ||
| The Division 2 (2019) | 93 | 51 | 41 | 30 | ||
| Anno 1800 (2019) | 89.4 | 65.8 | 41.1 | 21.5 | ||
| Total War: Three Kingdoms (2019) | 155.9 | 56 | 33.4 | 21.6 | ||
| F1 2019 (2019) | 171 | 89 | 71 | 62 | ||
| Control (2019) | 104.7 | 39.2 | 29.1 | |||
| Borderlands 3 (2019) | 102.8 | 52.6 | 34.7 | 26.1 | ||
| Ghost Recon Breakpoint (2019) | 74 | 45 | 34 | 22 | ||
| GRID 2019 (2019) | 114 | 76.9 | 64.3 | 27.5 | ||
| Need for Speed Heat (2019) | 61.8 | 49.3 | 45.8 | 33.9 | ||
| Star Wars Jedi Fallen Order (2019) | 63.3 | 53.2 | 46 | |||
| Escape from Tarkov (2020) | 120.7 | 71.2 | 52.8 | 47 | ||
| Hunt Showdown (2020) | 115.7 | 50.1 | 41.8 | |||
| Doom Eternal (2020) | 145.1 | 91.2 | 52.6 | |||
| Gears Tactics (2020) | 162.9 | 73.7 | 44.4 | 33.4 | 23.5 | 13.5 |
| Razer Blade Stealth Core i7 GTX 1650 Ti Max-Q 4K GeForce GTX 1650 Ti Max-Q, i7-1065G7, Lite-On CA5-8D512 | Dell XPS 13 9300 4K UHD Iris Plus Graphics G7 (Ice Lake 64 EU), i7-1065G7, Intel SSDPEMKF512G8 NVMe SSD | Asus ZenBook S13 UX392FN GeForce MX150, i7-8565U, WDC PC SN520 SDAPNUW-512G | MSI Prestige 14 A10SC-009 GeForce GTX 1650 Max-Q, i7-10710U, Samsung SSD PM981 MZVLB1T0HALR | Razer Blade Stealth 13, Core i7-1065G7 GeForce GTX 1650 Max-Q, i7-1065G7, Lite-On CA3-8D512 | Razer Blade Stealth i7-8565U GeForce MX150, i7-8565U, Lite-On CA3-8D256-Q11 | |
|---|---|---|---|---|---|---|
| Noise | 1% | 0% | -6% | 1% | -2% | |
| off / environment * (dB) | 28 | 29 -4% | 28.1 -0% | 30.3 -8% | 30 -7% | 28.4 -1% |
| Idle Minimum * (dB) | 28 | 29 -4% | 28.1 -0% | 30.3 -8% | 30 -7% | 28.5 -2% |
| Idle Average * (dB) | 28 | 29 -4% | 28.1 -0% | 30.3 -8% | 30 -7% | 29 -4% |
| Idle Maximum * (dB) | 28 | 29 -4% | 29 -4% | 30.3 -8% | 30 -7% | 29.1 -4% |
| Load Average * (dB) | 39 | 33.5 14% | 41.1 -5% | 40.2 -3% | 33.9 13% | 42.8 -10% |
| Witcher 3 ultra * (dB) | 42.7 | 40.5 5% | 41.1 4% | 38.1 11% | 41.4 3% | |
| Load Maximum * (dB) | 43.7 | 40.5 7% | 41.1 6% | 43.5 -0% | 38.1 13% | 41.6 5% |
* ... smaller is better
Noise level
| Idle |
| 28 / 28 / 28 dB(A) |
| Load |
| 39 / 43.7 dB(A) |
 | ||
30 dB silent 40 dB(A) audible 50 dB(A) loud |
||
min: | ||
(-) The maximum temperature on the upper side is 48.2 °C / 119 F, compared to the average of 35.9 °C / 97 F, ranging from 21.4 to 59 °C for the class Subnotebook.
(-) The bottom heats up to a maximum of 50 °C / 122 F, compared to the average of 39.2 °C / 103 F
(±) In idle usage, the average temperature for the upper side is 32.3 °C / 90 F, compared to the device average of 30.8 °C / 87 F.
(-) Playing The Witcher 3, the average temperature for the upper side is 40 °C / 104 F, compared to the device average of 30.8 °C / 87 F.
(±) The palmrests and touchpad can get very hot to the touch with a maximum of 38.2 °C / 100.8 F.
(-) The average temperature of the palmrest area of similar devices was 28.2 °C / 82.8 F (-10 °C / -18 F).
| Off / Standby | |
| Idle | |
| Load |
|
Key:
min: | |
| Razer Blade Stealth Core i7 GTX 1650 Ti Max-Q 4K i7-1065G7, GeForce GTX 1650 Ti Max-Q, Lite-On CA5-8D512, IPS, 3840x2160, 13.3" | Dell XPS 13 9300 4K UHD i7-1065G7, Iris Plus Graphics G7 (Ice Lake 64 EU), Intel SSDPEMKF512G8 NVMe SSD, IPS, 3840x2400, 13.4" | HP Spectre x360 13-aw0013dx i7-1065G7, Iris Plus Graphics G7 (Ice Lake 64 EU), Intel Optane Memory H10 with Solid State Storage 32GB + 512GB HBRPEKNX0202A(L/H), IPS, 1920x1080, 13.3" | MSI Prestige 14 A10SC-009 i7-10710U, GeForce GTX 1650 Max-Q, Samsung SSD PM981 MZVLB1T0HALR, IPS, 3840x2160, 14" | Razer Blade Stealth i7-8565U i7-8565U, GeForce MX150, Lite-On CA3-8D256-Q11, IPS, 1920x1080, 13.3" | Razer Blade Stealth 13, Core i7-1065G7 i7-1065G7, GeForce GTX 1650 Max-Q, Lite-On CA3-8D512, IPS LED, 3840x2160, 13.3" | |
|---|---|---|---|---|---|---|
| Power Consumption | 34% | 49% | 10% | 18% | -8% | |
| Idle Minimum * (Watt) | 6 | 5.3 12% | 3.9 35% | 5.2 13% | 6.7 -12% | 10.7 -78% |
| Idle Average * (Watt) | 10.9 | 7.8 28% | 6.3 42% | 12.2 -12% | 8.6 21% | 13.6 -25% |
| Idle Maximum * (Watt) | 15.5 | 9.8 37% | 6.8 56% | 14.3 8% | 9.4 39% | 15.7 -1% |
| Load Average * (Watt) | 71.9 | 46 36% | 32.6 55% | 67 7% | 64.1 11% | 60 17% |
| Witcher 3 ultra * (Watt) | 72.9 | 43 41% | 25.6 65% | 63.7 13% | 64 12% | |
| Load Maximum * (Watt) | 100.5 | 48.3 52% | 59 41% | 67 33% | 64.1 36% | 71 29% |
* ... smaller is better
| Razer Blade Stealth Core i7 GTX 1650 Ti Max-Q 4K i7-1065G7, GeForce GTX 1650 Ti Max-Q, 53.1 Wh | Dell XPS 13 9300 4K UHD i7-1065G7, Iris Plus Graphics G7 (Ice Lake 64 EU), 52 Wh | HP Spectre x360 13-aw0013dx i7-1065G7, Iris Plus Graphics G7 (Ice Lake 64 EU), 60 Wh | MSI Prestige 14 A10SC-009 i7-10710U, GeForce GTX 1650 Max-Q, 52 Wh | Razer Blade Stealth i7-8565U i7-8565U, GeForce MX150, 53.1 Wh | Razer Blade Stealth 13, Core i7-1065G7 i7-1065G7, GeForce GTX 1650 Max-Q, 53.1 Wh | |
|---|---|---|---|---|---|---|
| Battery runtime | 75% | 162% | 14% | 79% | 1% | |
| Reader / Idle (h) | 7.8 | 37.1 376% | 9.9 27% | 20.5 163% | 8.3 6% | |
| WiFi v1.3 (h) | 6.5 | 11.4 75% | 9.9 52% | 5.9 -9% | 9.5 46% | 5.5 -15% |
| Load (h) | 1.7 | 2.7 59% | 2.1 24% | 2.2 29% | 1.9 12% |
Pros
Cons
就性能而言,我们并不特别喜欢2019年的两个选项,但2020年的版本可以解决这些问题,因为它们是您可以获得的最快的Blade Stealth。如果将2020版本与MX150的2018版本进行比较,差异将更加明显。某些超级本可能会提供更快的处理器,例如采用六核酷睿i7-10710U或Zen 2 CPU的处理器,但没有一个能与Blade Stealth的游戏潜力相提并论。 GTX 1650 Ti Max-Q使该系统在其13英寸尺寸级别中独一无二。
如果您想玩游戏,我们建议使用便宜的1080p 120 Hz SKU,而不是此4K 60 Hz SKU。重影在这里太明显了,大多数游戏在如此高的本机分辨率下运行效果不佳。因此,GTX 1650 Ti Max-Q将与1080p120面板更好地配合。但是,如果您执行大量电子表格或CAD工作,则4K选项可能更有价值。
考虑到这一点,我们不禁感到2020 Blade Stealth对于购买10 W Core i7 2019版本的用户来说是记耳光。雷蛇可以完全跳过10 W Core i7,而是在2019年提供此25 W版本。这种方法也会简化Blade Stealth的阵容。现在,购买型号已经与所有这些不同的10/25 W Core i7 CPU和Max-Q GPU选项混淆了。
目前,没有任何其他选择可以替代Blade Stealth。只要知道风扇噪音和随之而来的非常温暖的表面温度,它就是您可以买到的游戏性能最好的13.3英寸Ultrabook。
Razer Blade Stealth Core i7 GTX 1650 Ti Max-Q 4K
- 06/15/2020 v7 (old)
Allen Ngo
Price comparison

