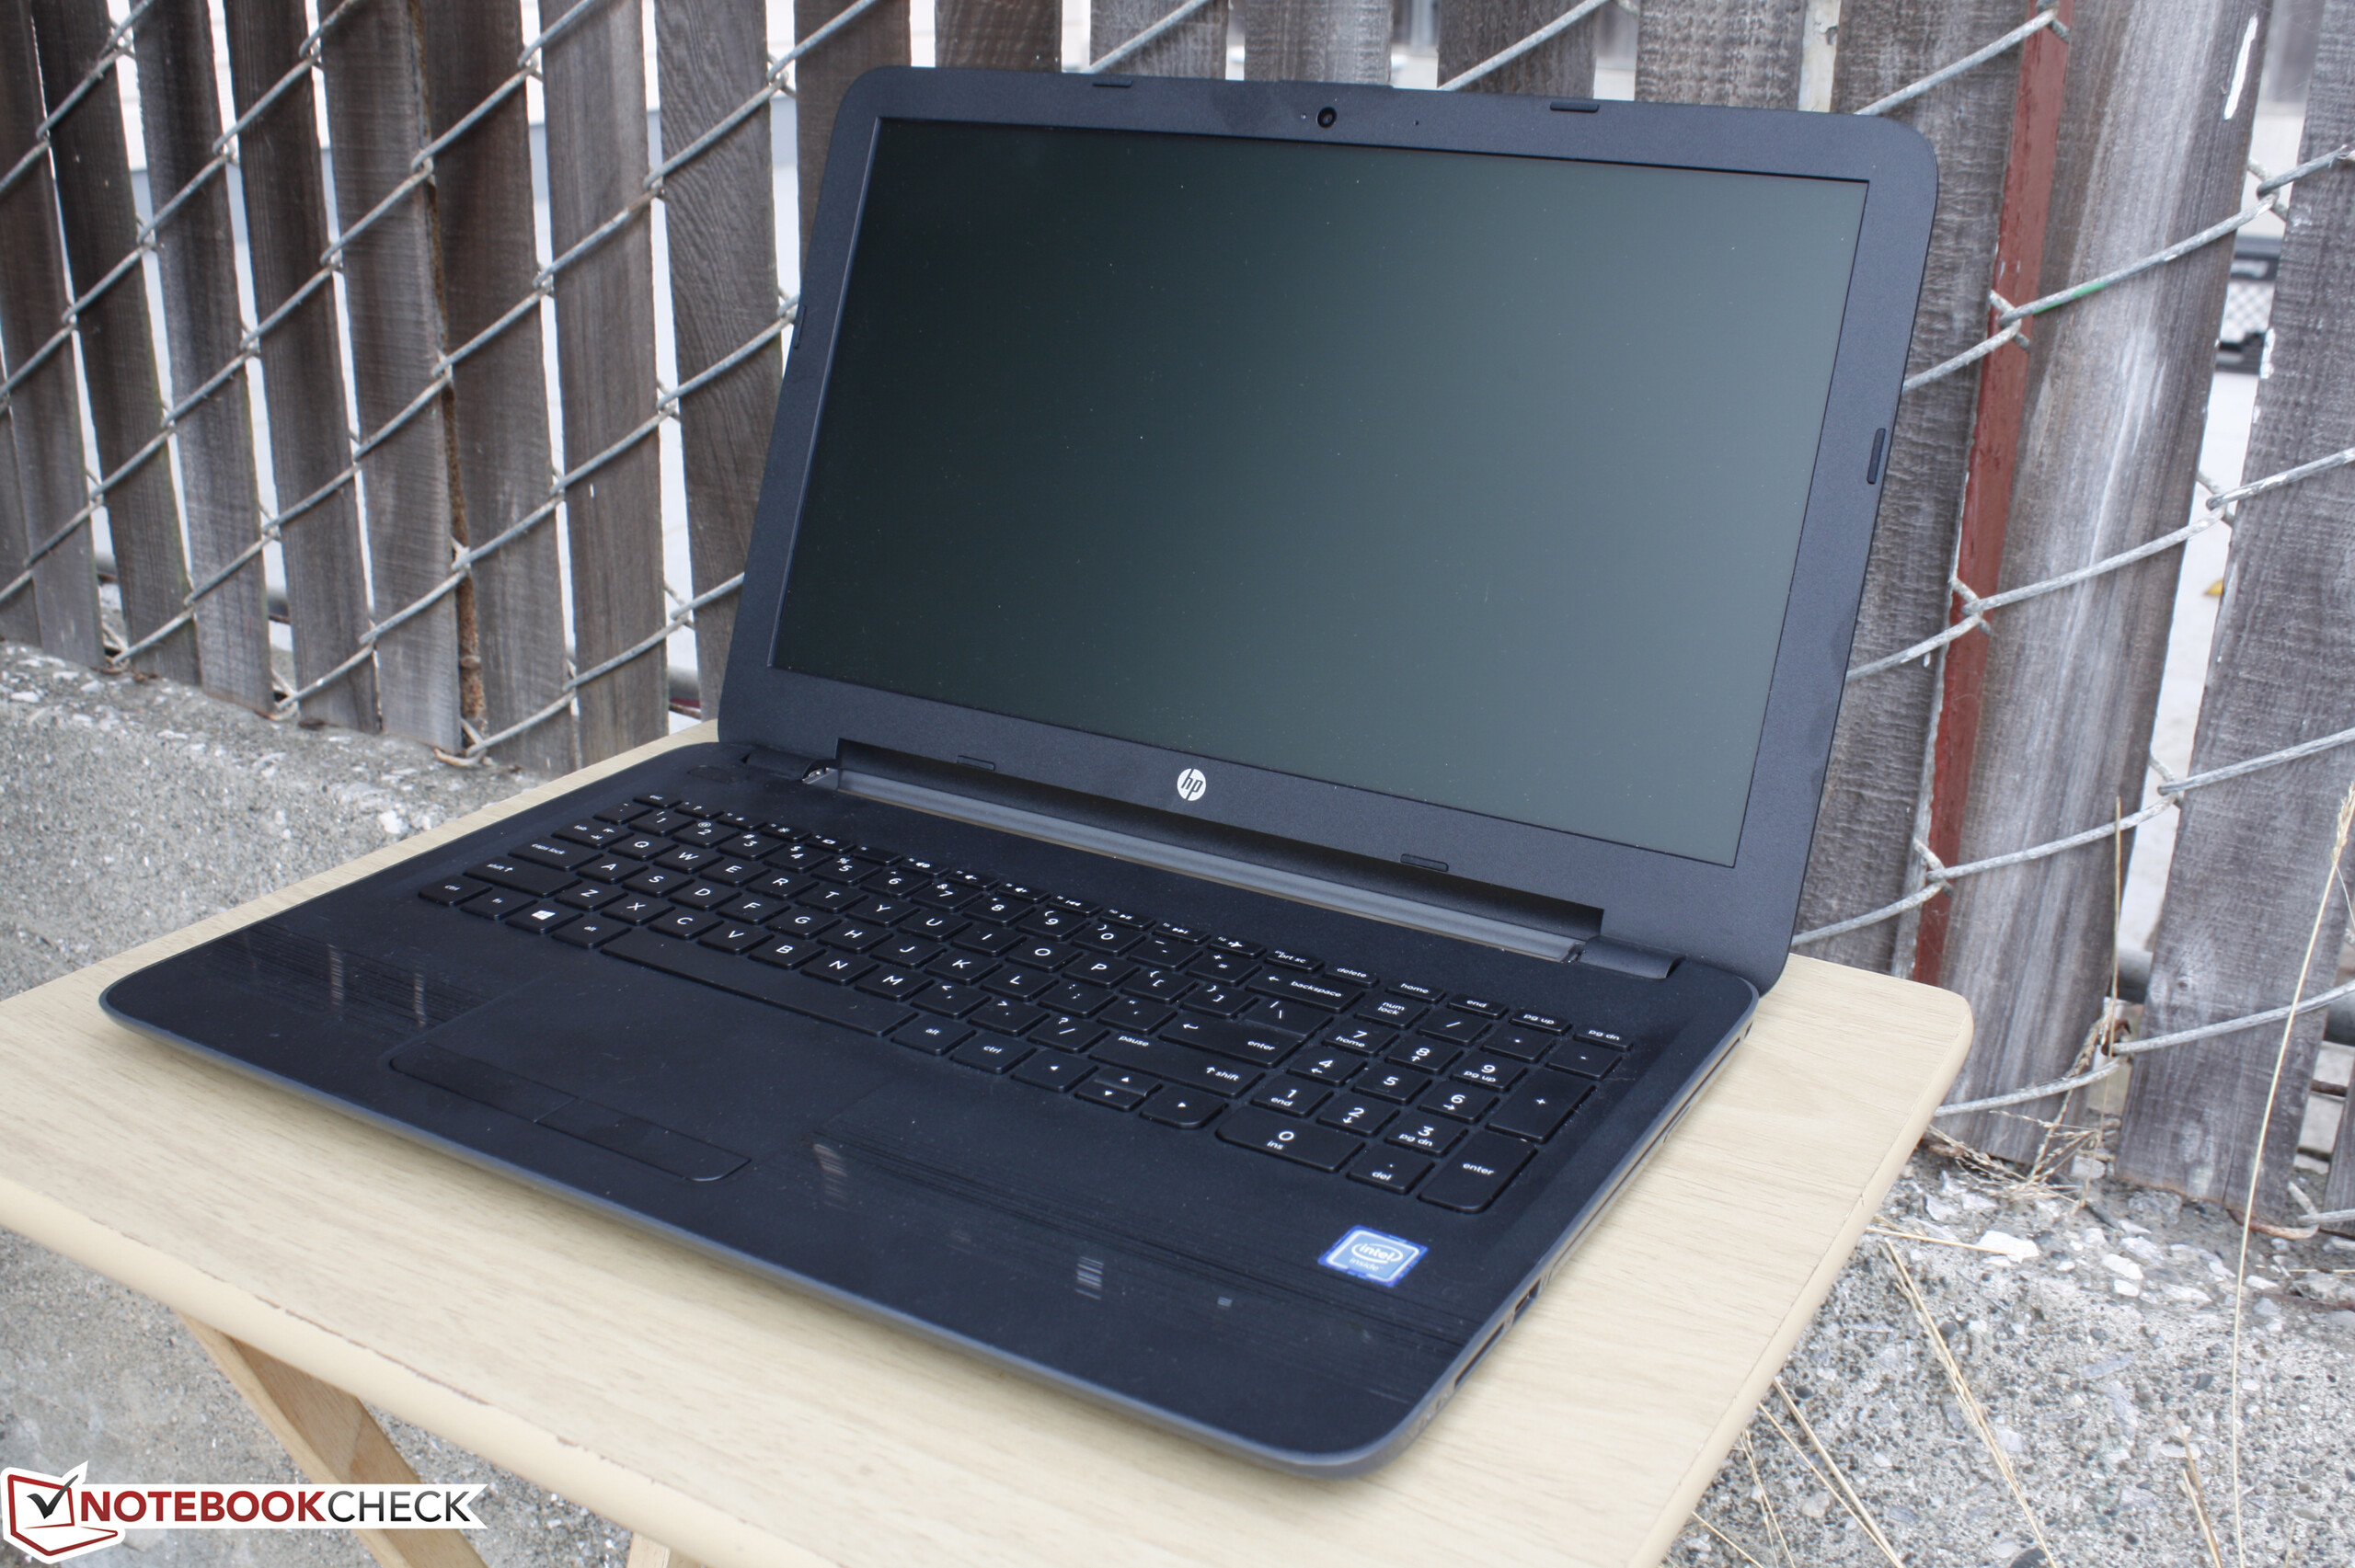
惠普 250 G5 Y1V08UT (Celeron N3060, HD) 笔记本电脑简短评测
| SD Card Reader | |
| average JPG Copy Test (av. of 3 runs) | |
| Dell XPS 15-9550 i7 | |
| Acer Extensa 2520-59CD | |
| HP 250 G5 Y1V08UT | |
| maximum AS SSD Seq Read Test (1GB) | |
| Dell XPS 15-9550 i7 | |
| Acer Extensa 2520-59CD | |
| HP 250 G5 Y1V08UT | |
| Networking | |
| iperf Server (receive) TCP 1 m 512KB | |
| MSI GT72VR 6RD-063US | |
| HP 250 G5 Y1V08UT | |
| iperf Client (transmit) TCP 1 m 512KB | |
| MSI GT72VR 6RD-063US | |
| HP 250 G5 Y1V08UT | |
| |||||||||||||||||||||||||
Brightness Distribution: 85 %
Center on Battery: 199.8 cd/m²
Contrast: 281:1 (Black: 0.712 cd/m²)
ΔE ColorChecker Calman: 13.24 | ∀{0.5-29.43 Ø4.71}
ΔE Greyscale Calman: 13.33 | ∀{0.09-98 Ø4.96}
53.4% sRGB (Argyll 1.6.3 3D)
33.8% AdobeRGB 1998 (Argyll 1.6.3 3D)
36.6% AdobeRGB 1998 (Argyll 3D)
53.3% sRGB (Argyll 3D)
35.43% Display P3 (Argyll 3D)
Gamma: 1.69
CCT: 15879 K
| HP 250 G5 Y1V08UT LG Philips LGD0504, TN LED, 15.6", 1366x768 | Acer Extensa 2520-59CD ChiMei N156BGE-E32, TN LED, 15.6", 1366x768 | Lenovo B50-10 80QR0013GE Chi Mei N156BGE-EA2, TN LED, 15.6", 1366x768 | Asus F540SA-XX087T Chi Mei N156BGE-E42, TN LED, 15.6", 1366x768 | HP 250 G4 T6P08ES ChiMei, TN LED, 15.6", 1366x768 | HP 250 G5 SP X0N33EA AU Optronics AUO38ED, TN, 15.6", 1920x1080 | |
|---|---|---|---|---|---|---|
| Display | 15% | 13% | 13% | 23% | 3% | |
| Display P3 Coverage (%) | 35.43 | 40.71 15% | 40.21 13% | 40.17 13% | 43.63 23% | 36.51 3% |
| sRGB Coverage (%) | 53.3 | 61.1 15% | 60.1 13% | 60 13% | 65.1 22% | 55 3% |
| AdobeRGB 1998 Coverage (%) | 36.6 | 42.07 15% | 41.56 14% | 41.54 13% | 45.1 23% | 37.72 3% |
| Response Times | -16% | 33% | 42% | 9% | 15% | |
| Response Time Grey 50% / Grey 80% * (ms) | 42.4 ? | 52 ? -23% | 28 ? 34% | 20 ? 53% | 42 ? 1% | 40 ? 6% |
| Response Time Black / White * (ms) | 28.8 ? | 31 ? -8% | 20 ? 31% | 20 ? 31% | 24 ? 17% | 22 ? 24% |
| PWM Frequency (Hz) | 1000 | 200 ? | 200 ? | 806 ? | ||
| Screen | 20% | 29% | 39% | 22% | 18% | |
| Brightness middle (cd/m²) | 199.8 | 211 6% | 245 23% | 215 8% | 220 10% | 219 10% |
| Brightness (cd/m²) | 199 | 200 1% | 230 16% | 200 1% | 203 2% | 222 12% |
| Brightness Distribution (%) | 85 | 83 -2% | 84 -1% | 87 2% | 83 -2% | 85 0% |
| Black Level * (cd/m²) | 0.712 | 0.43 40% | 0.46 35% | 0.26 63% | 0.49 31% | 0.39 45% |
| Contrast (:1) | 281 | 491 75% | 533 90% | 827 194% | 449 60% | 562 100% |
| Colorchecker dE 2000 * | 13.24 | 10.53 20% | 8.34 37% | 13.07 1% | 8.95 32% | 12.67 4% |
| Colorchecker dE 2000 max. * | 21.52 | 17.79 17% | 12.31 43% | 16.06 25% | 15.89 26% | 20.99 2% |
| Greyscale dE 2000 * | 13.33 | 11.85 11% | 9.48 29% | 4.34 67% | 10.59 21% | 13.82 -4% |
| Gamma | 1.69 130% | 2.25 98% | 2.38 92% | 2.48 89% | 2.51 88% | 2.63 84% |
| CCT | 15879 41% | 13758 47% | 10624 61% | 7212 90% | 12049 54% | 15633 42% |
| Color Space (Percent of AdobeRGB 1998) (%) | 33.8 | 39 15% | 38 12% | 38 12% | 41 21% | 35 4% |
| Color Space (Percent of sRGB) (%) | 53.4 | 61 14% | 57 7% | 60 12% | 65 22% | 55 3% |
| Total Average (Program / Settings) | 6% /
14% | 25% /
26% | 31% /
34% | 18% /
21% | 12% /
14% |
* ... smaller is better
Display Response Times
| ↔ Response Time Black to White | ||
|---|---|---|
| 28.8 ms ... rise ↗ and fall ↘ combined | ↗ 10.8 ms rise | 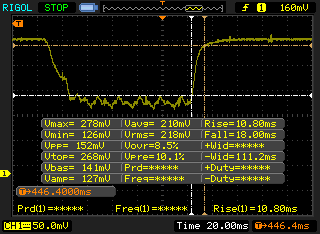 |
| ↘ 18 ms fall | ||
| The screen shows relatively slow response rates in our tests and may be too slow for gamers. In comparison, all tested devices range from 0.1 (minimum) to 240 (maximum) ms. » 76 % of all devices are better. This means that the measured response time is worse than the average of all tested devices (19.8 ms). | ||
| ↔ Response Time 50% Grey to 80% Grey | ||
| 42.4 ms ... rise ↗ and fall ↘ combined | ↗ 14.8 ms rise | 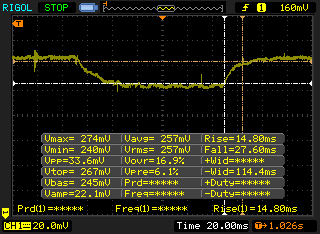 |
| ↘ 27.6 ms fall | ||
| The screen shows slow response rates in our tests and will be unsatisfactory for gamers. In comparison, all tested devices range from 0.165 (minimum) to 636 (maximum) ms. » 70 % of all devices are better. This means that the measured response time is worse than the average of all tested devices (31 ms). | ||
Screen Flickering / PWM (Pulse-Width Modulation)
| Screen flickering / PWM not detected | 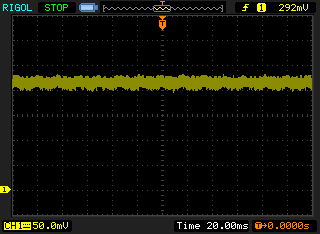 | ||
In comparison: 52 % of all tested devices do not use PWM to dim the display. If PWM was detected, an average of 7754 (minimum: 5 - maximum: 343500) Hz was measured. | |||
| Cinebench R15 | |
| CPU Single 64Bit | |
| HP 250 G5 SP X0N33EA | |
| HP 250 G4 T6P08ES | |
| Acer Aspire V3-572PG-604M | |
| Microsoft Surface Pro 4, Core m3 | |
| Acer Extensa 2520-59CD | |
| Lenovo B50-10 80QR0013GE | |
| HP 250 G5 Y1V08UT | |
| Asus F540SA-XX087T | |
| VOYO VBook V3 | |
| CPU Multi 64Bit | |
| HP 250 G5 SP X0N33EA | |
| Acer Extensa 2520-59CD | |
| HP 250 G4 T6P08ES | |
| Acer Aspire V3-572PG-604M | |
| Microsoft Surface Pro 4, Core m3 | |
| Lenovo B50-10 80QR0013GE | |
| VOYO VBook V3 | |
| HP 250 G5 Y1V08UT | |
| Asus F540SA-XX087T | |
| Cinebench R11.5 | |
| CPU Single 64Bit | |
| HP 250 G4 T6P08ES | |
| Acer Aspire V3-572PG-604M | |
| Microsoft Surface Pro 4, Core m3 | |
| HP 250 G5 Y1V08UT | |
| CPU Multi 64Bit | |
| HP 250 G4 T6P08ES | |
| Acer Aspire V3-572PG-604M | |
| Microsoft Surface Pro 4, Core m3 | |
| HP 250 G5 Y1V08UT | |
| Cinebench R10 | |
| Rendering Multiple CPUs 32Bit | |
| Acer Extensa 2520-59CD | |
| HP 250 G4 T6P08ES | |
| Acer Aspire V3-572PG-604M | |
| Microsoft Surface Pro 4, Core m3 | |
| Lenovo B50-10 80QR0013GE | |
| HP 250 G5 Y1V08UT | |
| Asus F540SA-XX087T | |
| Acer One 10 S1002-17HU | |
| Rendering Single 32Bit | |
| HP 250 G4 T6P08ES | |
| Acer Aspire V3-572PG-604M | |
| Acer Extensa 2520-59CD | |
| Microsoft Surface Pro 4, Core m3 | |
| Acer One 10 S1002-17HU | |
| Lenovo B50-10 80QR0013GE | |
| HP 250 G5 Y1V08UT | |
| Asus F540SA-XX087T | |
| wPrime 2.10 - 1024m | |
| HP 250 G5 Y1V08UT | |
| Microsoft Surface Pro 4, Core m3 | |
| Super Pi Mod 1.5 XS 32M - 32M | |
| HP 250 G5 Y1V08UT | |
| Microsoft Surface Pro 4, Core m3 | |
* ... smaller is better
| PCMark 8 | |
| Home Score Accelerated v2 | |
| HP 250 G5 SP X0N33EA | |
| HP 250 G4 T6P08ES | |
| Acer Extensa 2520-59CD | |
| Acer Aspire V3-572PG-604M | |
| HP 250 G5 Y1V08UT | |
| Asus F540SA-XX087T | |
| Lenovo IdeaPad MIIX 310-10ICR | |
| Lenovo B50-10 80QR0013GE | |
| Medion Akoya S2218 | |
| Work Score Accelerated v2 | |
| HP 250 G5 SP X0N33EA | |
| HP 250 G4 T6P08ES | |
| Acer Aspire V3-572PG-604M | |
| HP 250 G5 Y1V08UT | |
| Lenovo B50-10 80QR0013GE | |
| Asus F540SA-XX087T | |
| Lenovo IdeaPad MIIX 310-10ICR | |
| Creative Score Accelerated v2 | |
| HP 250 G4 T6P08ES | |
| HP 250 G5 SP X0N33EA | |
| Acer Aspire V3-572PG-604M | |
| HP 250 G5 Y1V08UT | |
| Asus F540SA-XX087T | |
| Lenovo B50-10 80QR0013GE | |
| PCMark 8 Home Score Accelerated v2 | 1661 points | |
| PCMark 8 Creative Score Accelerated v2 | 1779 points | |
| PCMark 8 Work Score Accelerated v2 | 1464 points | |
Help | ||
| HP 250 G5 Y1V08UT Samsung CM871 MZNLF128HCHP | Acer Extensa 2520-59CD Toshiba MQ01ABF050 | Lenovo B50-10 80QR0013GE Seagate Momentus Thin ST500LT012-1DG142 | Asus F540SA-XX087T Seagate Momentus Thin ST500LT012-1DG142 | HP 250 G4 T6P08ES HGST Travelstar 5K1000 HTS541010A9E680 | HP 250 G5 SP X0N33EA SanDisk Z400s SD8SNAT-256G | |
|---|---|---|---|---|---|---|
| CrystalDiskMark 3.0 | -83% | -84% | -85% | -82% | 141% | |
| Read Seq (MB/s) | 484.4 | 104.7 -78% | 103.5 -79% | 98.3 -80% | 101 -79% | 509 5% |
| Write Seq (MB/s) | 139.2 | 95.7 -31% | 91.1 -35% | 89.8 -35% | 99.6 -28% | 322.1 131% |
| Read 512 (MB/s) | 338.1 | 33 -90% | 33.74 -90% | 20.79 -94% | 38.12 -89% | 321.2 -5% |
| Write 512 (MB/s) | 134.7 | 38.3 -72% | 38.77 -71% | 34.84 -74% | 42.22 -69% | 289.4 115% |
| Read 4k (MB/s) | 17.21 | 0.375 -98% | 0.374 -98% | 0.335 -98% | 0.522 -97% | 20.99 22% |
| Write 4k (MB/s) | 31.52 | 0.782 -98% | 0.649 -98% | 0.619 -98% | 1.29 -96% | 88 179% |
| Read 4k QD32 (MB/s) | 94.6 | 0.675 -99% | 0.818 -99% | 0.789 -99% | 1.116 -99% | 141.3 49% |
| Write 4k QD32 (MB/s) | 31.08 | 0.769 -98% | 0.648 -98% | 0.641 -98% | 1.287 -96% | 228.5 635% |

| 3DMark 11 | |
| 1280x720 Performance GPU | |
| Acer Aspire V3-572PG-604M | |
| HP 250 G4 T6P08ES | |
| HP 250 G5 SP X0N33EA | |
| Acer Extensa 2520-59CD | |
| Asus F540SA-XX087T | |
| HP 250 G5 Y1V08UT | |
| Lenovo B50-10 80QR0013GE | |
| Acer One 10 S1002-17HU | |
| 1280x720 Performance Combined | |
| Acer Aspire V3-572PG-604M | |
| HP 250 G4 T6P08ES | |
| HP 250 G5 SP X0N33EA | |
| Acer Extensa 2520-59CD | |
| Asus F540SA-XX087T | |
| HP 250 G5 Y1V08UT | |
| Lenovo B50-10 80QR0013GE | |
| Acer One 10 S1002-17HU | |
| 3DMark | |
| 1280x720 Cloud Gate Standard Graphics | |
| Acer Aspire V3-572PG-604M | |
| HP 250 G5 SP X0N33EA | |
| HP 250 G4 T6P08ES | |
| Asus F540SA-XX087T | |
| HP 250 G5 Y1V08UT | |
| Lenovo B50-10 80QR0013GE | |
| Acer One 10 S1002-17HU | |
| 1920x1080 Ice Storm Extreme Graphics | |
| HP 250 G5 Y1V08UT | |
| 1920x1080 Ice Storm Extreme Score | |
| HP 250 G5 Y1V08UT | |
| 1280x720 Cloud Gate Standard Score | |
| Acer Aspire V3-572PG-604M | |
| HP 250 G5 SP X0N33EA | |
| HP 250 G4 T6P08ES | |
| Asus F540SA-XX087T | |
| Lenovo B50-10 80QR0013GE | |
| HP 250 G5 Y1V08UT | |
| Acer One 10 S1002-17HU | |
| 1280x720 Cloud Gate Standard Physics | |
| HP 250 G5 SP X0N33EA | |
| HP 250 G4 T6P08ES | |
| Acer Aspire V3-572PG-604M | |
| Lenovo B50-10 80QR0013GE | |
| Acer One 10 S1002-17HU | |
| Asus F540SA-XX087T | |
| HP 250 G5 Y1V08UT | |
| 1920x1080 Ice Storm Extreme Physics | |
| HP 250 G5 Y1V08UT | |
| 3DMark 11 Performance | 422 points | |
| 3DMark Ice Storm Standard Score | 18104 points | |
| 3DMark Cloud Gate Standard Score | 1350 points | |
Help | ||
| BioShock Infinite | |
| 1280x720 Very Low Preset | |
| Toshiba Portege Z20t-C-121 | |
| Samsung ATIV Book 9 900X3G-K01 | |
| Lenovo ThinkPad Helix | |
| HP Split x2 13-m210eg | |
| Acer TravelMate B117-M-P16Q | |
| HP 250 G5 Y1V08UT | |
| Acer Aspire Switch 10V SW5-014-1742 | |
| Dell Latitude 11 3150 | |
| 1366x768 Medium Preset | |
| Toshiba Portege Z20t-C-121 | |
| Samsung ATIV Book 9 900X3G-K01 | |
| HP Split x2 13-m210eg | |
| Lenovo ThinkPad Helix | |
| Acer TravelMate B117-M-P16Q | |
| Acer Aspire Switch 10V SW5-014-1742 | |
| HP 250 G5 Y1V08UT | |
| Dell Latitude 11 3150 | |
| low | med. | high | ultra | |
|---|---|---|---|---|
| BioShock Infinite (2013) | 18.1 | 9.6 | ||
| Overwatch (2016) | 15.1 | 9.7 |
Noise level
| Idle |
| / / dB(A) |
| Load |
| / dB(A) |
 | ||
30 dB silent 40 dB(A) audible 50 dB(A) loud |
||
min: | ||
| HP 250 G5 Y1V08UT HD Graphics 400 (Braswell), N3060, Samsung CM871 MZNLF128HCHP | Acer Extensa 2520-59CD HD Graphics 520, 6200U, Toshiba MQ01ABF050 | Lenovo B50-10 80QR0013GE HD Graphics (Bay Trail), N3540, Seagate Momentus Thin ST500LT012-1DG142 | Asus F540SA-XX087T HD Graphics (Braswell), N3050, Seagate Momentus Thin ST500LT012-1DG142 | HP 250 G4 T6P08ES Radeon R5 M330, 5200U, HGST Travelstar 5K1000 HTS541010A9E680 | HP 250 G5 SP X0N33EA HD Graphics 520, 6200U, SanDisk Z400s SD8SNAT-256G | |
|---|---|---|---|---|---|---|
| Noise | ||||||
| off / environment * (dB) | 31.2 | 31.2 | 31.2 | 31.2 | 31.6 | |
| Idle Minimum * (dB) | 31.5 | 33.5 | 31.7 | 33.2 | 34.5 | |
| Idle Average * (dB) | 31.9 | 33.5 | 31.7 | 33.2 | 34.5 | |
| Idle Maximum * (dB) | 31.9 | 33.5 | 31.7 | 34.6 | 34.5 | |
| Load Average * (dB) | 34.2 | 33.5 | 37.2 | 45 | 39 | |
| Load Maximum * (dB) | 36.8 | 33.5 | 35.3 | 45.2 | 38.3 |
* ... smaller is better
(+) The maximum temperature on the upper side is 38 °C / 100 F, compared to the average of 34.3 °C / 94 F, ranging from 21.2 to 62.5 °C for the class Office.
(±) The bottom heats up to a maximum of 42.8 °C / 109 F, compared to the average of 36.8 °C / 98 F
(+) In idle usage, the average temperature for the upper side is 24.2 °C / 76 F, compared to the device average of 29.5 °C / 85 F.
(+) The palmrests and touchpad are reaching skin temperature as a maximum (33.4 °C / 92.1 F) and are therefore not hot.
(-) The average temperature of the palmrest area of similar devices was 27.5 °C / 81.5 F (-5.9 °C / -10.6 F).
HP 250 G5 Y1V08UT audio analysis
(±) | speaker loudness is average but good (78.4 dB)
Bass 100 - 315 Hz
(-) | nearly no bass - on average 19.1% lower than median
(±) | linearity of bass is average (14.3% delta to prev. frequency)
Mids 400 - 2000 Hz
(+) | balanced mids - only 2.2% away from median
(+) | mids are linear (6.8% delta to prev. frequency)
Highs 2 - 16 kHz
(±) | higher highs - on average 5.2% higher than median
(+) | highs are linear (6.9% delta to prev. frequency)
Overall 100 - 16.000 Hz
(±) | linearity of overall sound is average (21.5% difference to median)
Compared to same class
» 54% of all tested devices in this class were better, 8% similar, 37% worse
» The best had a delta of 7%, average was 21%, worst was 53%
Compared to all devices tested
» 61% of all tested devices were better, 7% similar, 32% worse
» The best had a delta of 4%, average was 23%, worst was 134%
Apple MacBook 12 (Early 2016) 1.1 GHz audio analysis
(+) | speakers can play relatively loud (83.6 dB)
Bass 100 - 315 Hz
(±) | reduced bass - on average 11.3% lower than median
(±) | linearity of bass is average (14.2% delta to prev. frequency)
Mids 400 - 2000 Hz
(+) | balanced mids - only 2.4% away from median
(+) | mids are linear (5.5% delta to prev. frequency)
Highs 2 - 16 kHz
(+) | balanced highs - only 2% away from median
(+) | highs are linear (4.5% delta to prev. frequency)
Overall 100 - 16.000 Hz
(+) | overall sound is linear (10.2% difference to median)
Compared to same class
» 7% of all tested devices in this class were better, 2% similar, 90% worse
» The best had a delta of 5%, average was 18%, worst was 53%
Compared to all devices tested
» 5% of all tested devices were better, 1% similar, 94% worse
» The best had a delta of 4%, average was 23%, worst was 134%
| Off / Standby | |
| Idle | |
| Load |
|
Key:
min: | |
| HP 250 G5 Y1V08UT N3060, HD Graphics 400 (Braswell), Samsung CM871 MZNLF128HCHP, TN LED, 1366x768, 15.6" | Acer Extensa 2520-59CD 6200U, HD Graphics 520, Toshiba MQ01ABF050, TN LED, 1366x768, 15.6" | Lenovo B50-10 80QR0013GE N3540, HD Graphics (Bay Trail), Seagate Momentus Thin ST500LT012-1DG142, TN LED, 1366x768, 15.6" | Asus F540SA-XX087T N3050, HD Graphics (Braswell), Seagate Momentus Thin ST500LT012-1DG142, TN LED, 1366x768, 15.6" | HP 250 G4 T6P08ES 5200U, Radeon R5 M330, HGST Travelstar 5K1000 HTS541010A9E680, TN LED, 1366x768, 15.6" | HP 250 G5 SP X0N33EA 6200U, HD Graphics 520, SanDisk Z400s SD8SNAT-256G, TN, 1920x1080, 15.6" | |
|---|---|---|---|---|---|---|
| Power Consumption | -102% | -28% | -29% | -91% | -44% | |
| Idle Minimum * (Watt) | 3.9 | 5.8 -49% | 4.8 -23% | 3.8 3% | 4 -3% | 3.6 8% |
| Idle Average * (Watt) | 6.4 | 12.6 -97% | 7.5 -17% | 6.9 -8% | 6.5 -2% | 6 6% |
| Idle Maximum * (Watt) | 6.5 | 12.8 -97% | 9.2 -42% | 7.14 -10% | 7 -8% | 6.4 2% |
| Load Average * (Watt) | 11.1 | 27.6 -149% | 16 -44% | 20 -80% | 36 -224% | 26 -134% |
| Load Maximum * (Watt) | 13.8 | 30 -117% | 15.4 -12% | 20.7 -50% | 43.6 -216% | 28.1 -104% |
* ... smaller is better
| HP 250 G5 Y1V08UT N3060, HD Graphics 400 (Braswell), 41 Wh | Acer Extensa 2520-59CD 6200U, HD Graphics 520, 37 Wh | Lenovo B50-10 80QR0013GE N3540, HD Graphics (Bay Trail), 24 Wh | Asus F540SA-XX087T N3050, HD Graphics (Braswell), 33 Wh | HP 250 G4 T6P08ES 5200U, Radeon R5 M330, 41 Wh | HP 250 G5 SP X0N33EA 6200U, HD Graphics 520, 41 Wh | |
|---|---|---|---|---|---|---|
| Battery runtime | -16% | -44% | -13% | -22% | -24% | |
| Reader / Idle (h) | 11.9 | 11.1 -7% | 10.6 -11% | |||
| WiFi v1.3 (h) | 6.3 | 5.3 -16% | 3.5 -44% | 5.5 -13% | 5.7 -10% | 5.8 -8% |
| Load (h) | 3.8 | 1.9 -50% | 1.8 -53% |
Pros
Cons
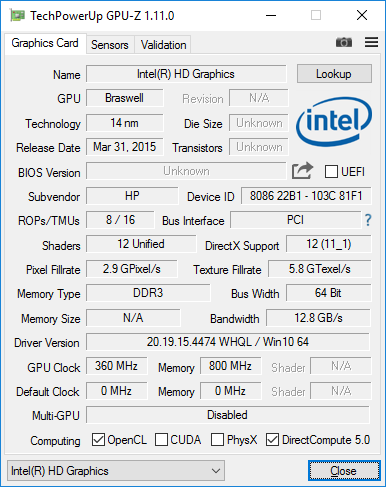
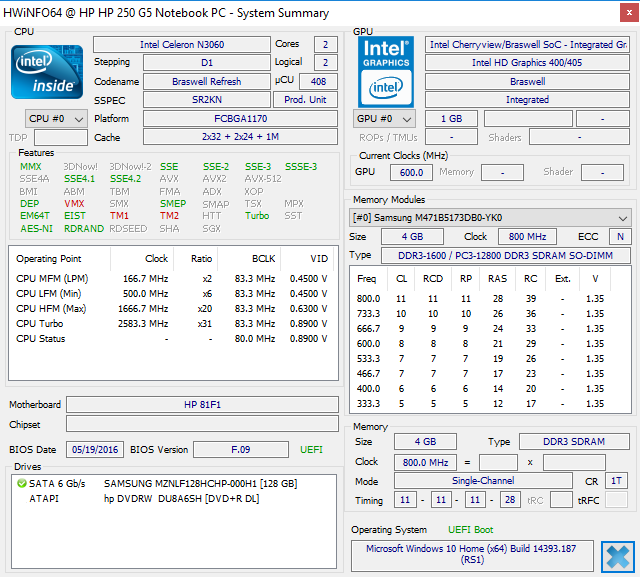
较老的主流笔记本电脑通常都搭配了高速处理器和迟缓的机械硬盘,硬盘在这个情况下就成了系统性能瓶颈。我们在测试的这台设备搭配了很弱的赛扬N3060处理器和高速固态硬盘,完全相反的故事带来的结果是:它只适合文字处理,上网浏览和视频播放等负载较低的用途,与凌动处理器上网本的能力相近。
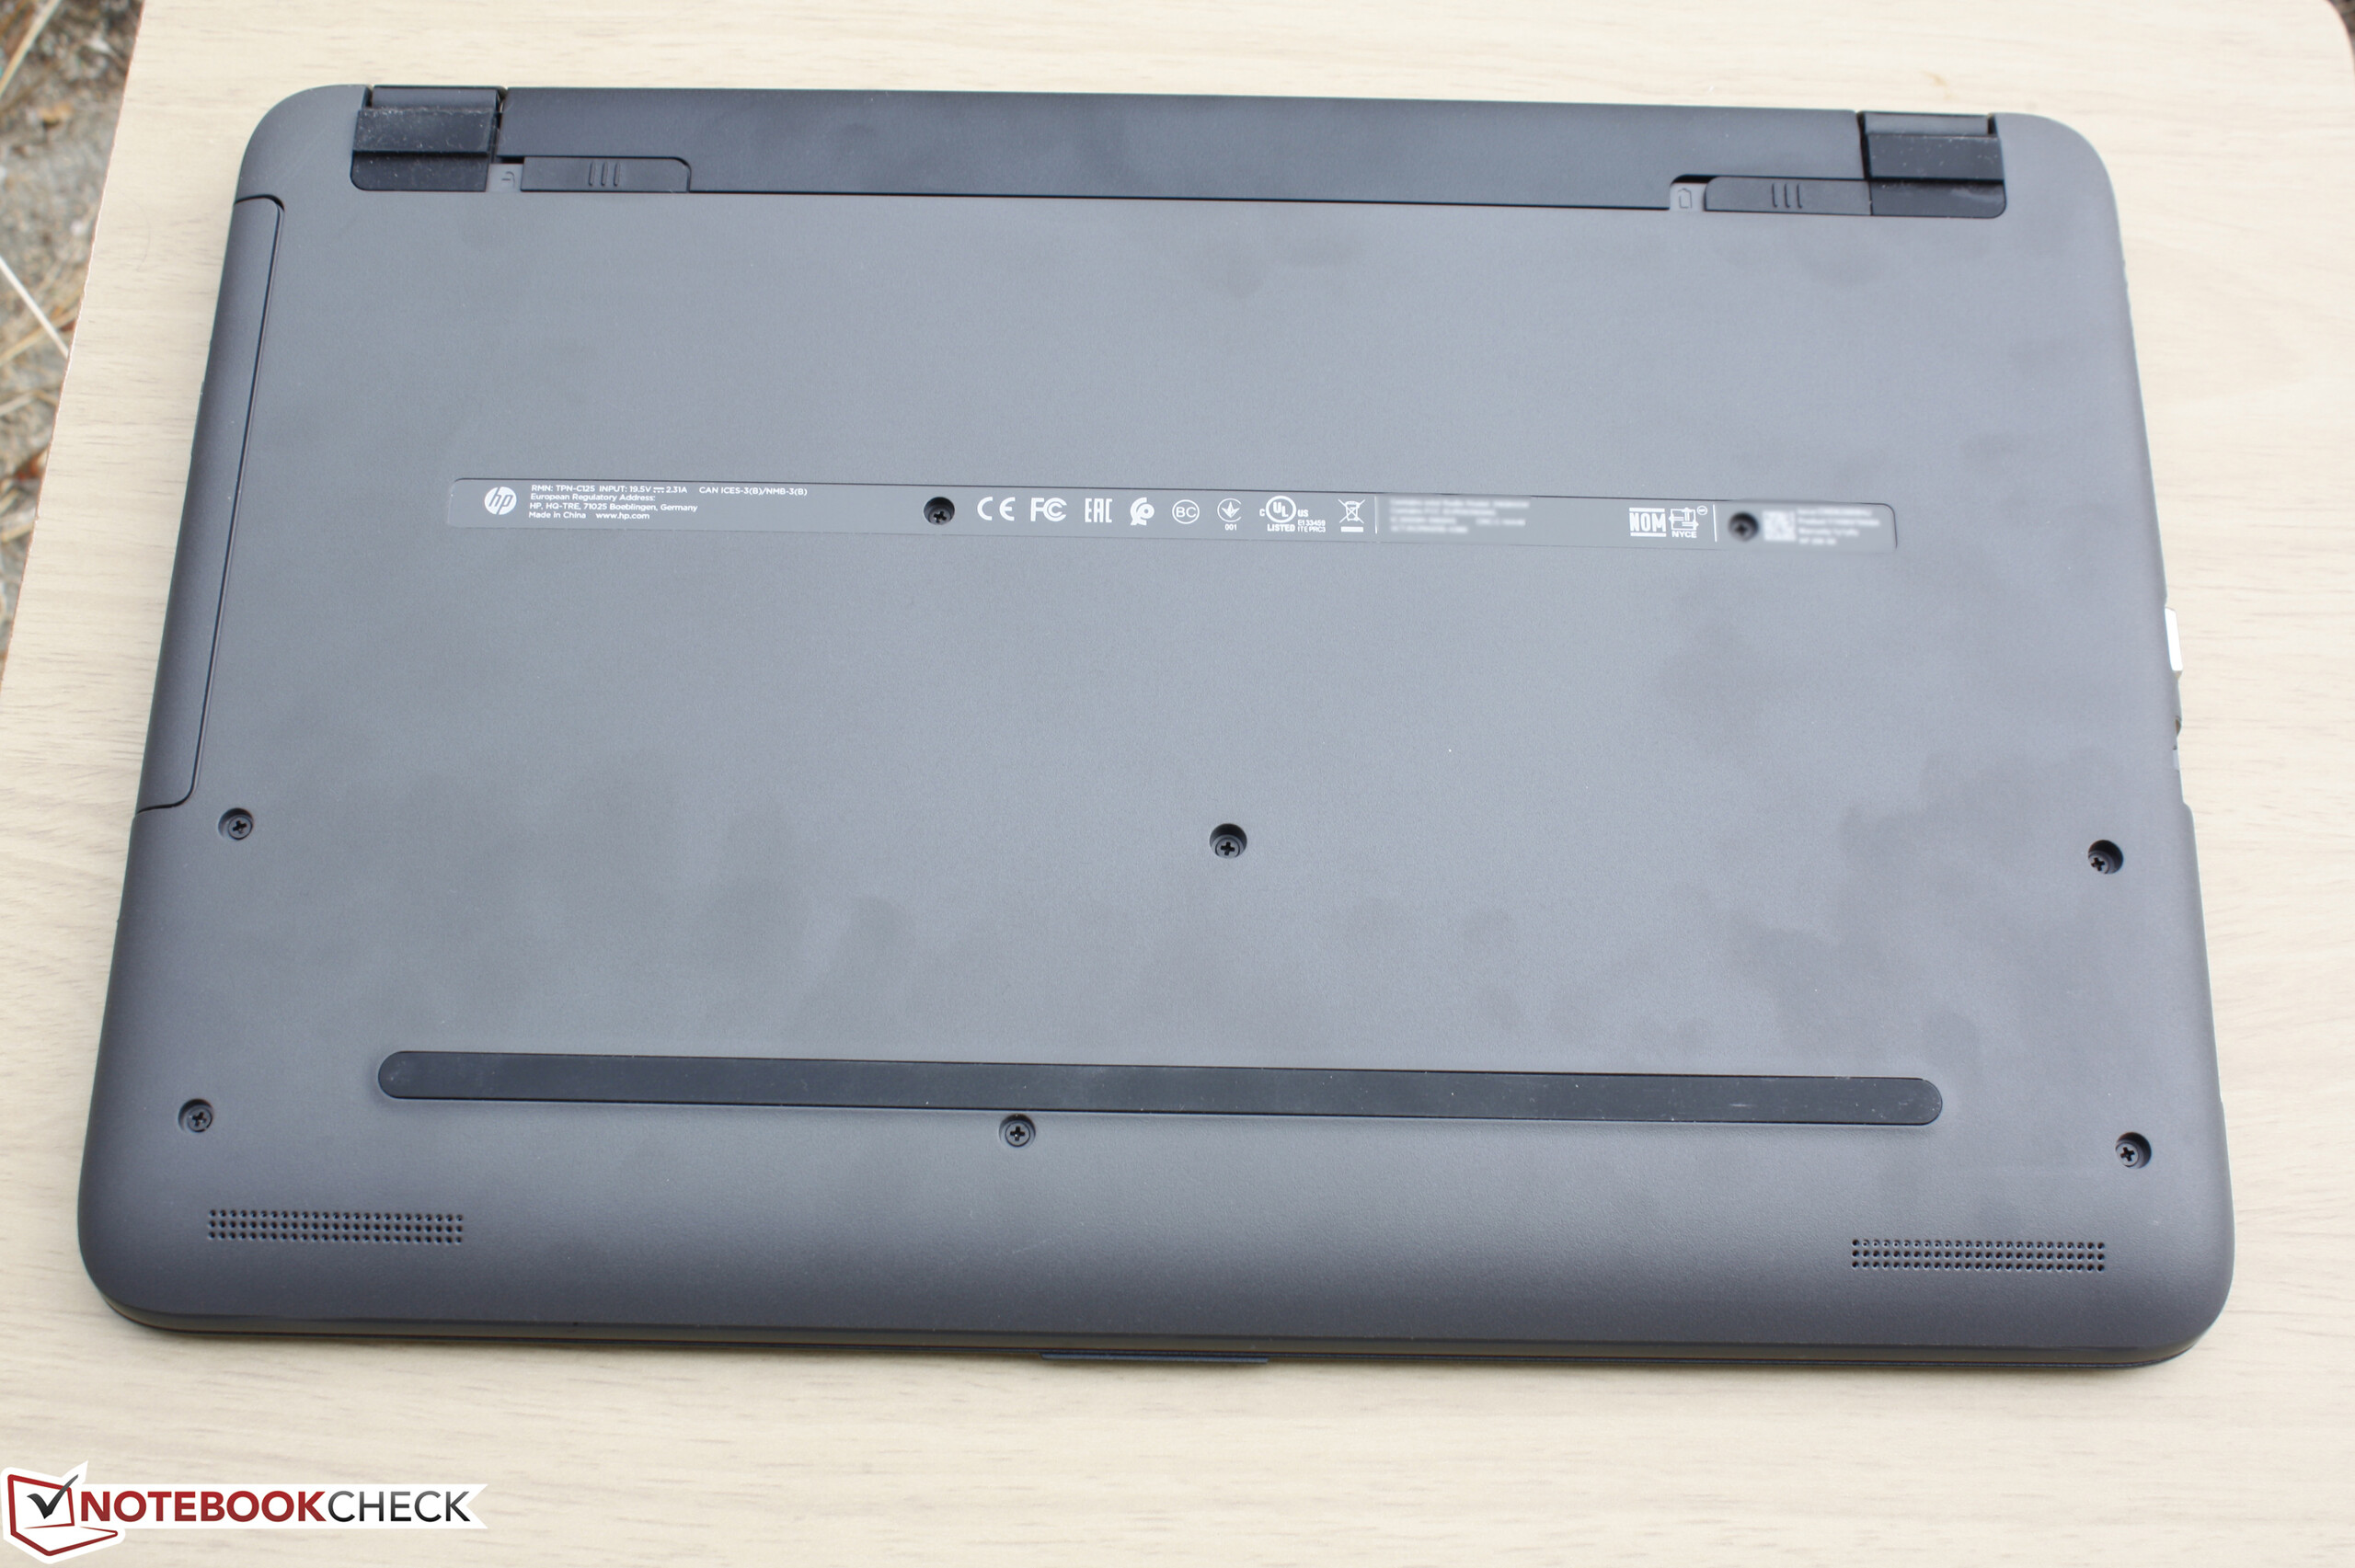
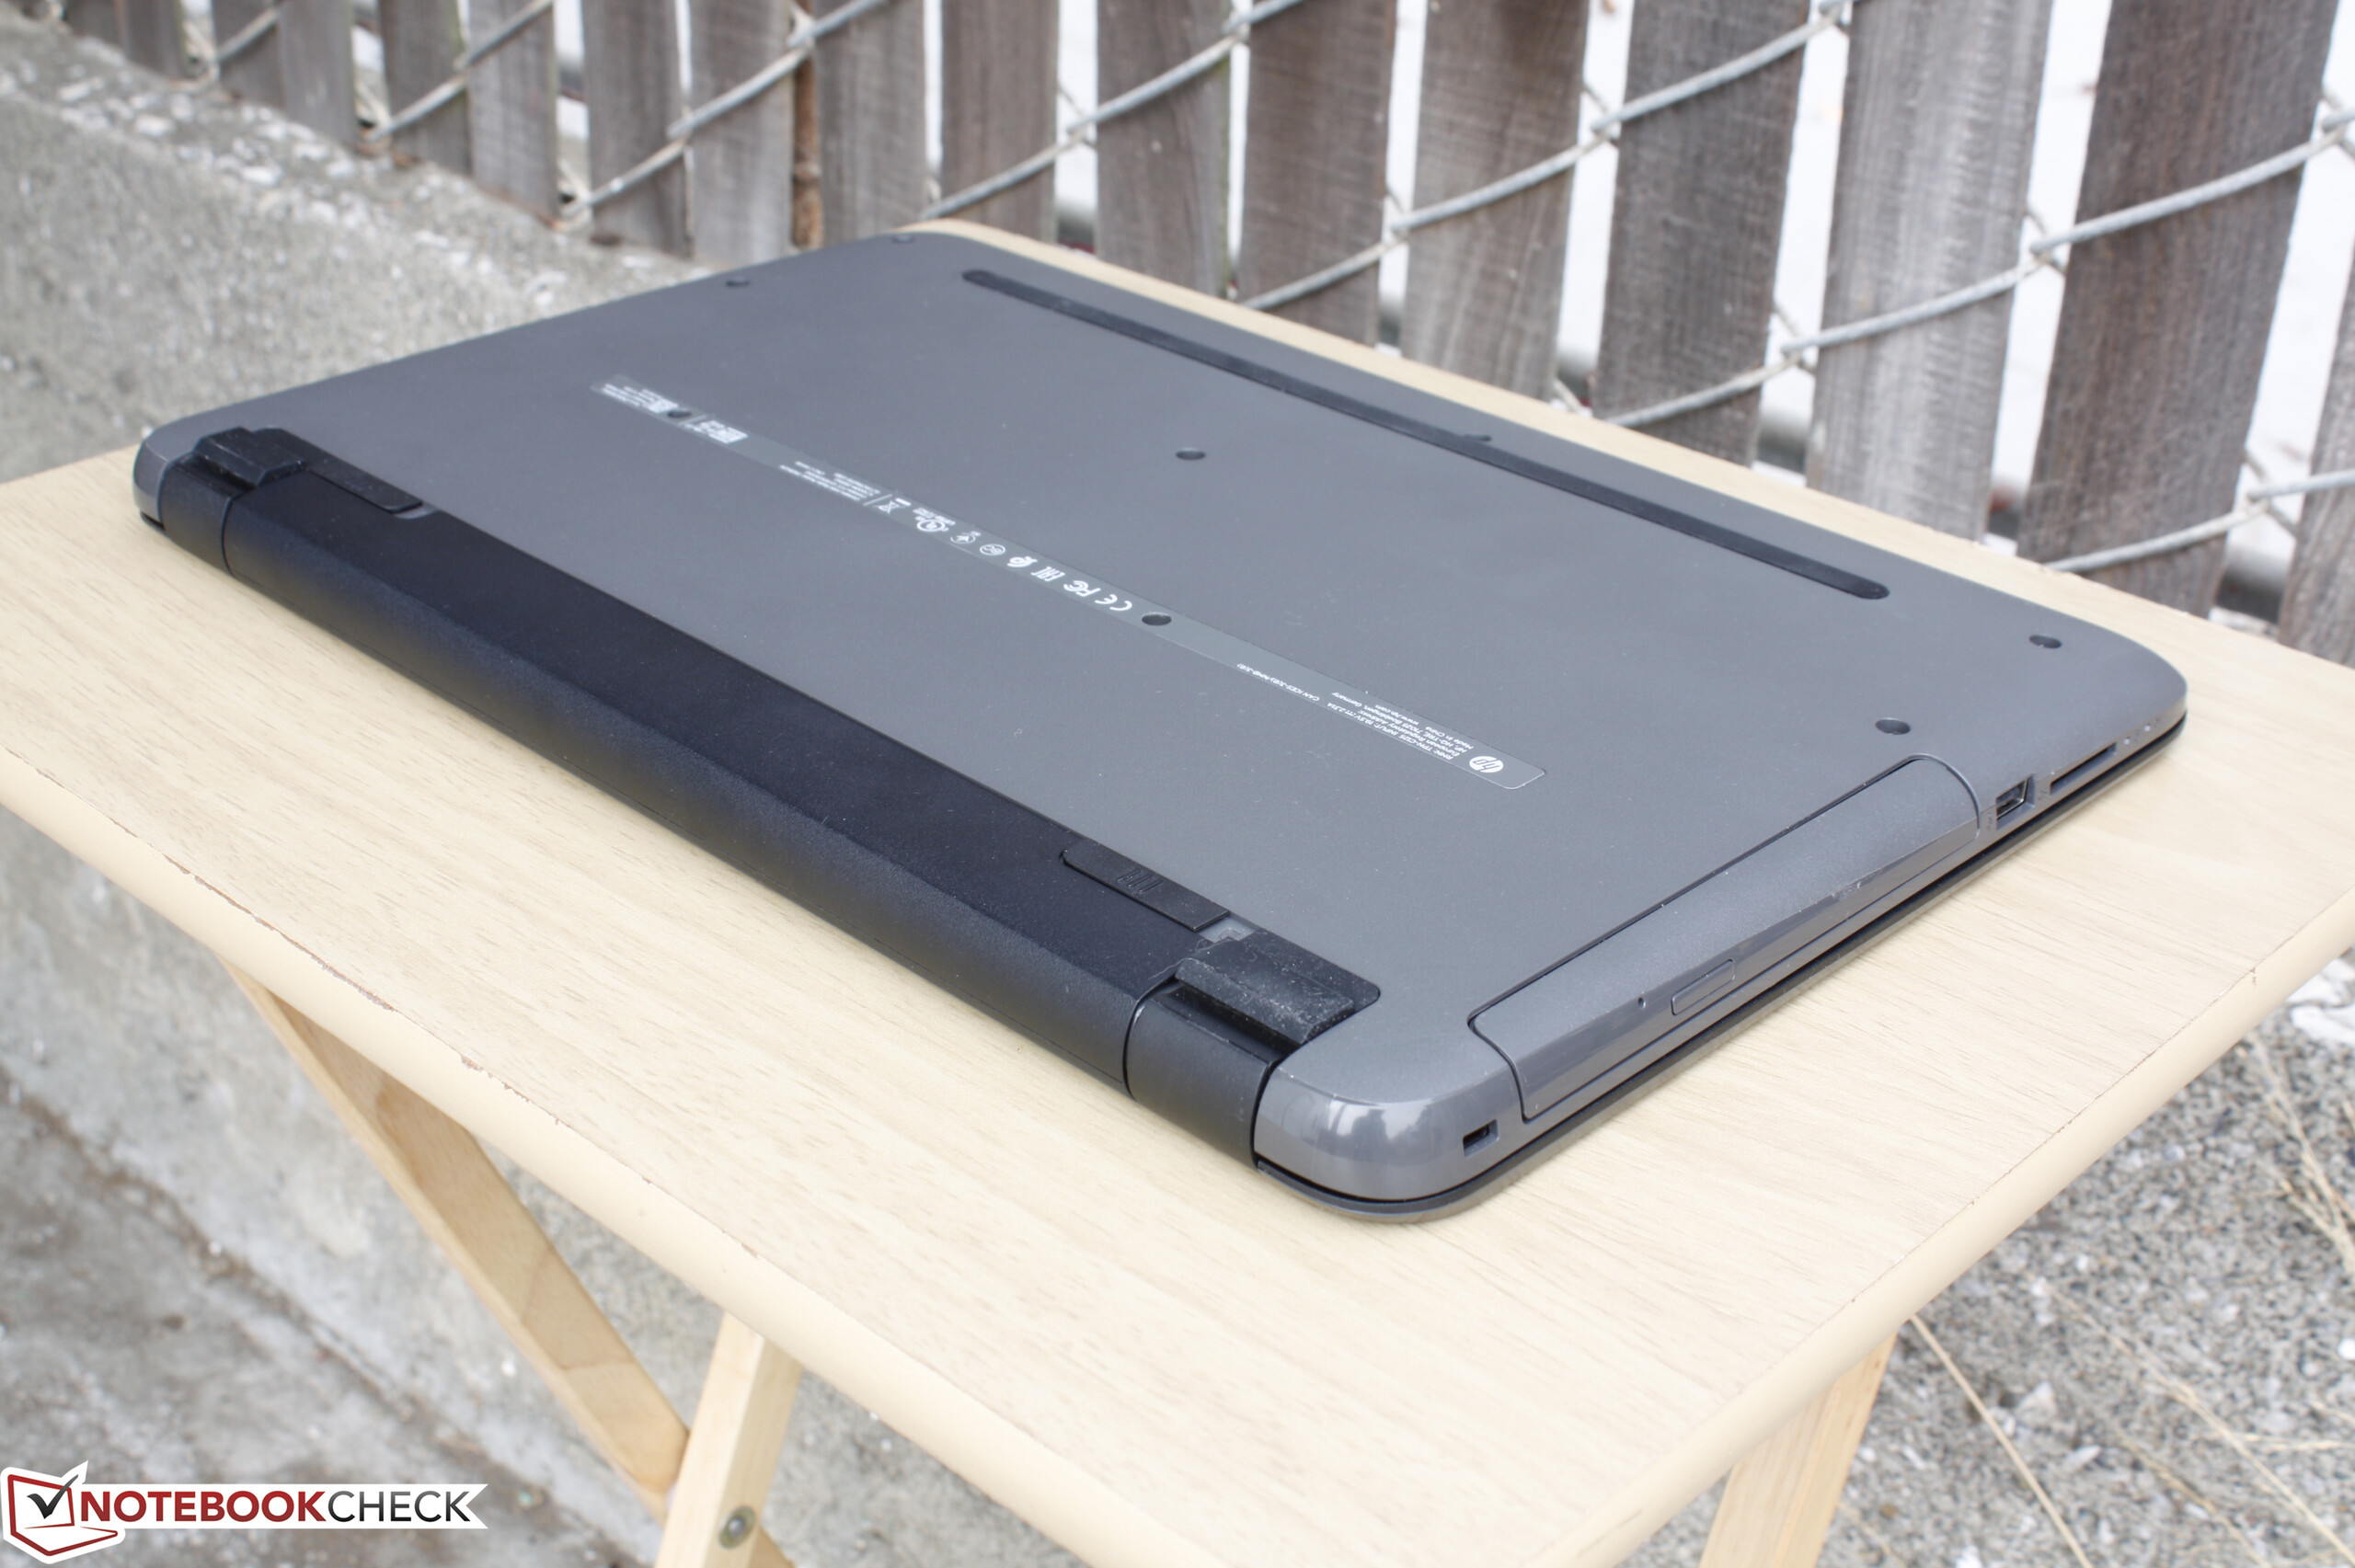
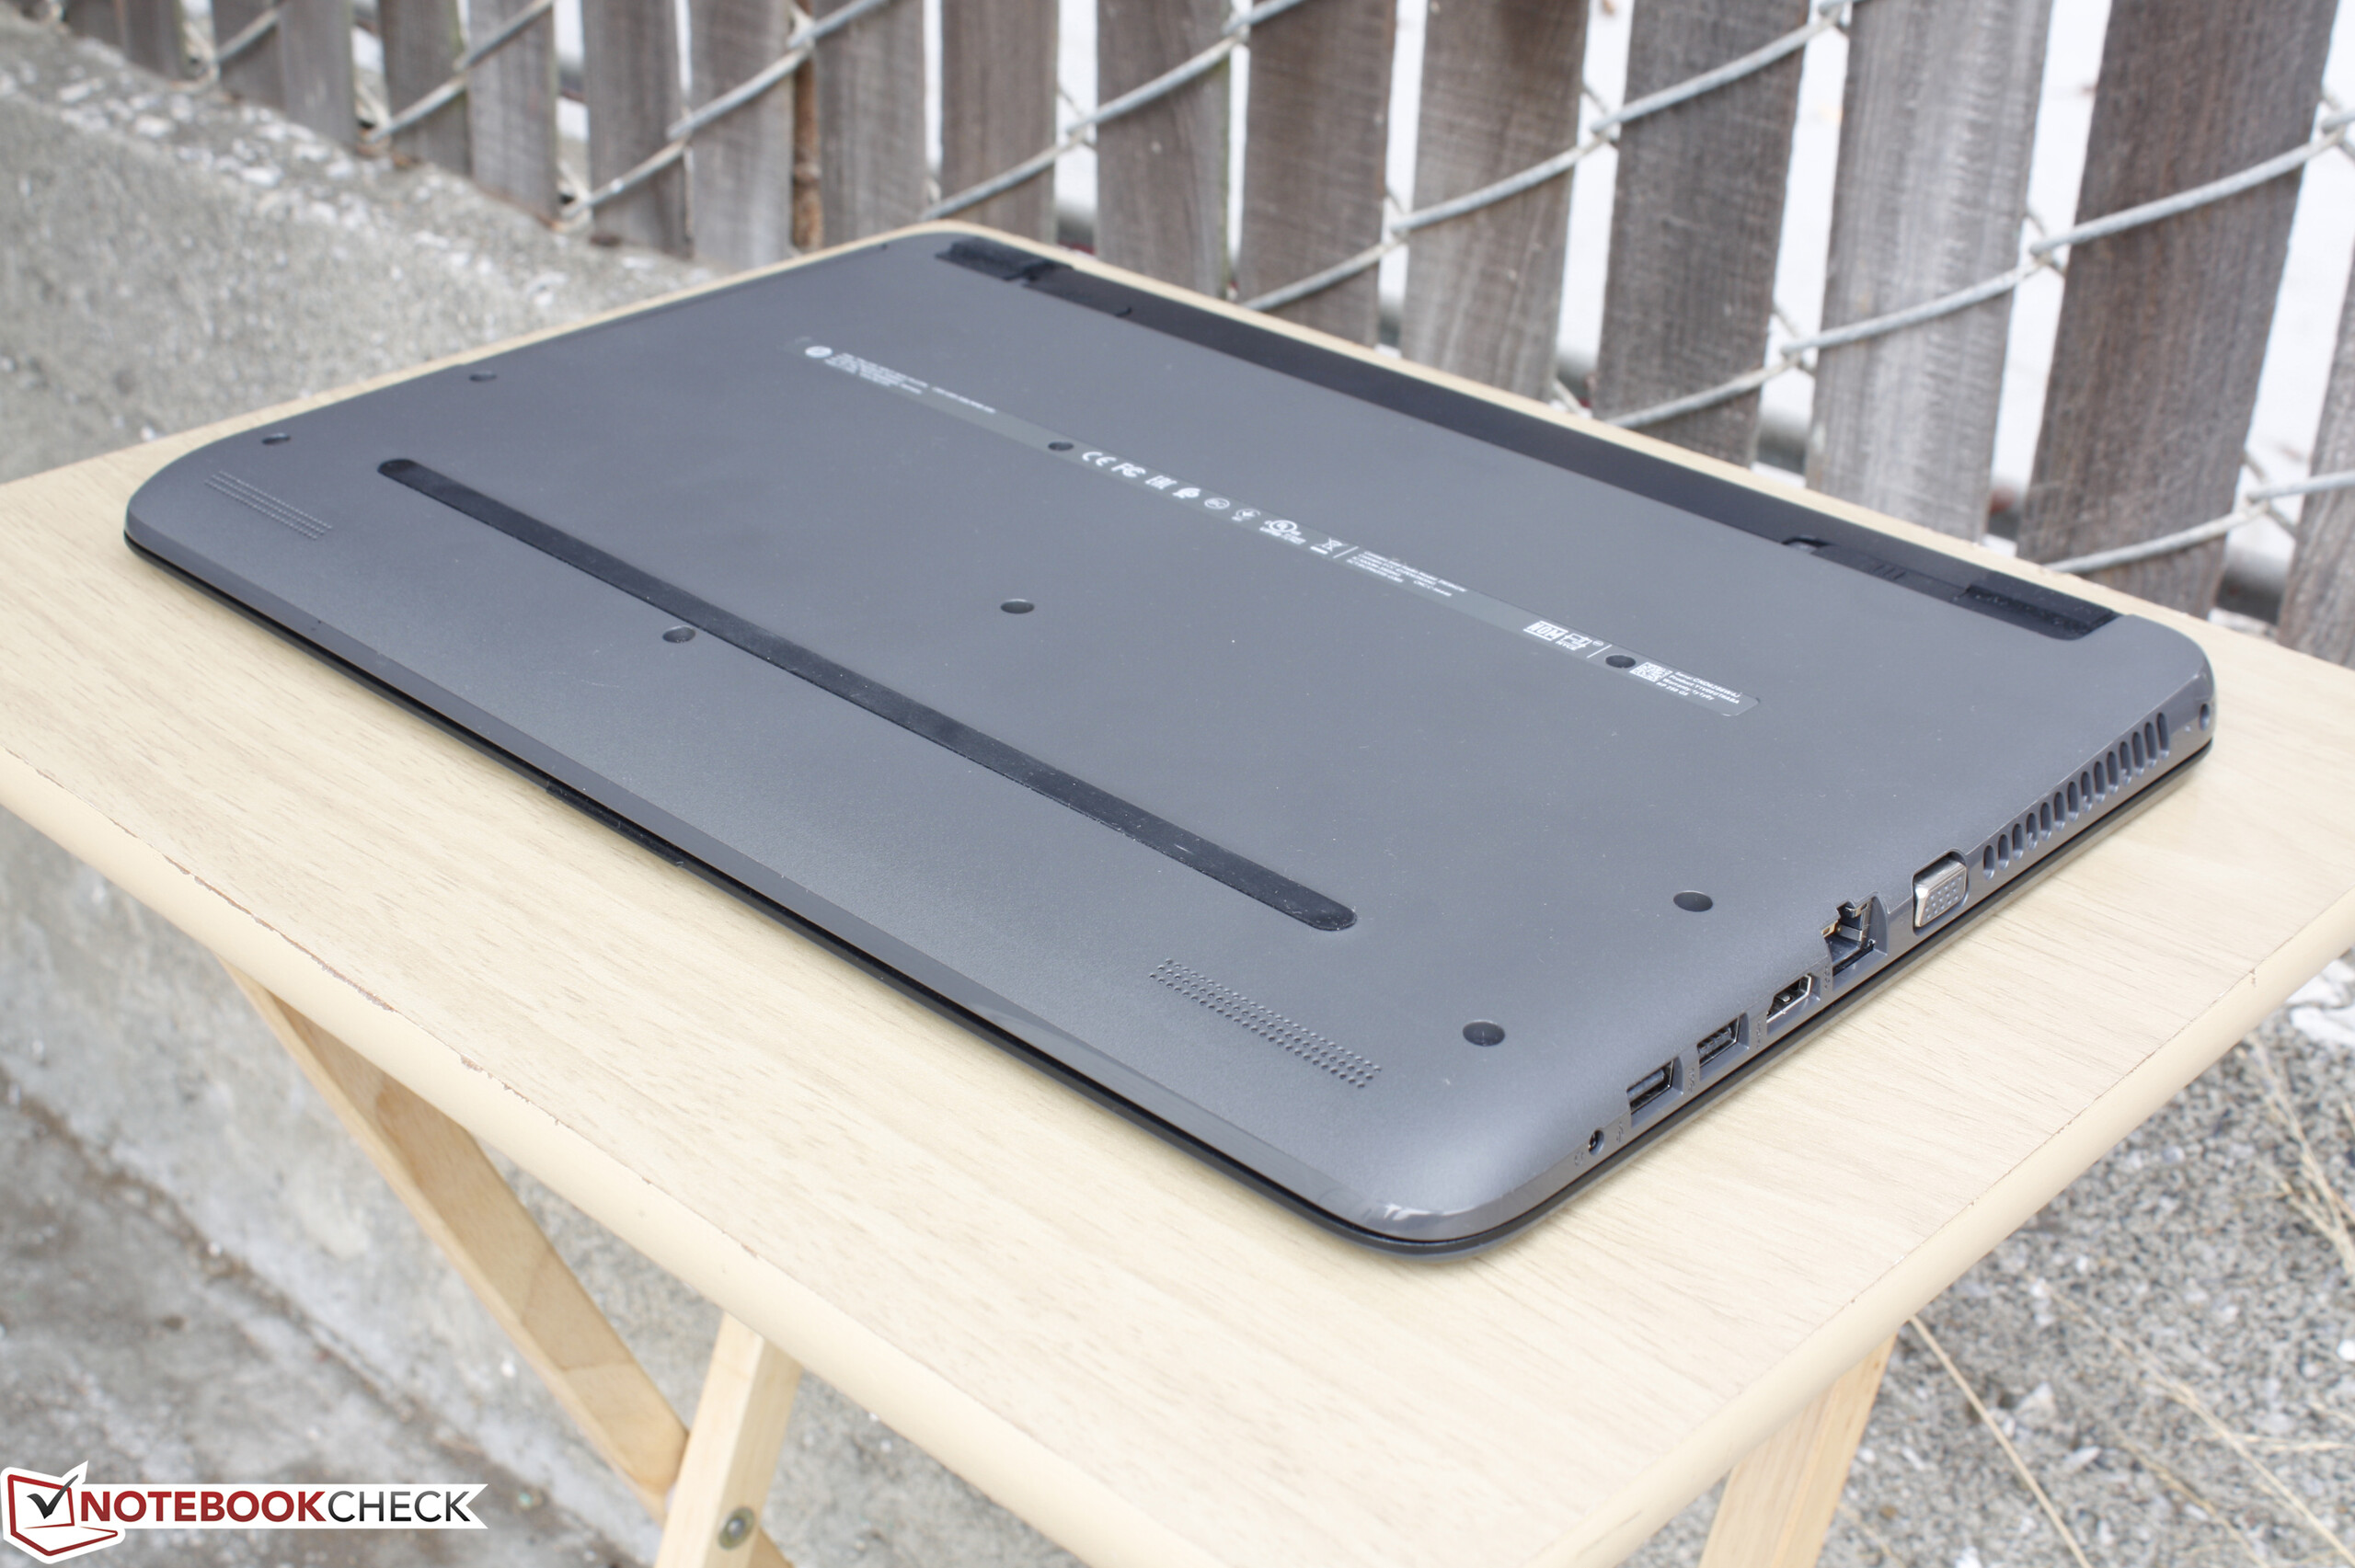
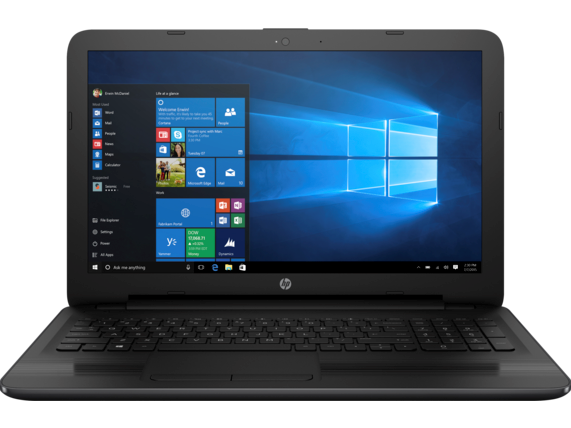
它的优势包括了安静的运行,低售价和长电池续航。它的机身品质中规中矩,我们更推荐选择搭配酷睿i系列处理器和全高清屏幕的250 G5机型。如果用户对屏幕品质的要求较高,应该尽早进行色彩校准。配置相近的前代250 G4机型性能表现并没有落后很多,性价比相对更高。
如果用户可以避免搭配赛扬N3060的入门机型的话,惠普250 G5对于一般用途来说还是一款值得推荐的设备。
注:本文是基于完整评测的缩减版本,阅读完整的英文评测,请点击这里。
HP 250 G5 Y1V08UT
- 10/30/2016 v5.1 (old)
Allen Ngo
Price comparison
