宏碁Swift X SFX16-52G回顾:平衡效率和性能的笔记本电脑

通过Swift X SFX16-52G,宏碁提供了一款面向创意工作的超极本。英特尔Arc A370M显卡和可用的i5-1240P或 i7-1260P都是为高效工作而设计的,不一定是为了顶级性能。鉴于1,300欧元的上市价格,这款笔记本似乎是最佳配置,因此,也应该满足要求更高的用户。16:10格式的400万像素显示屏也是对这一点的补充--没有忘记三个视频输出。
竞争对手包括类似设计的多媒体笔记本电脑,其图形性能良好,但并不突出,如联想ThinkBook 16 G4+ ,或实际上华硕ZenBook Flip 15 ,采用相同的GPU。
潜在的竞争对手比较
Rating | Date | Model | Weight | Height | Size | Resolution | Price |
|---|---|---|---|---|---|---|---|
| 86.2 % v7 (old) | 11 / 2022 | Acer Swift X SFX16-52G-52VE i5-1240P, A370M | 1.8 kg | 21.3 mm | 16.00" | 2560x1600 | |
| 80.7 % v7 (old) | 09 / 2022 | Acer Aspire 5 A515-57G-53N8 i5-1240P, GeForce RTX 2050 Mobile | 1.8 kg | 18 mm | 15.60" | 1920x1080 | |
| 89.3 % v7 (old) | 09 / 2022 | Lenovo ThinkPad T16 G1 21BWS00200 i5-1240P, Iris Xe G7 80EUs | 1.9 kg | 20.5 mm | 16.00" | 1920x1200 | |
| 88 % v7 (old) | 06 / 2022 | Asus ZenBook Flip 15 Q539ZD i7-12700H, A370M | 1.8 kg | 18.9 mm | 15.60" | 2880x1620 | |
| 82.8 % v7 (old) | 10 / 2022 | Lenovo IdeaPad Gaming 3 15IAH7 i5-12500H, GeForce RTX 3050 Ti Laptop GPU | 2.4 kg | 26 mm | 15.60" | 1920x1080 | |
| 86 % v7 (old) | 04 / 2022 | HP Omen 16-c0077ng R7 5800H, Radeon RX 6600M | 2.3 kg | 26 mm | 16.10" | 2560x1440 | |
| 88.4 % v7 (old) | 09 / 2022 | Lenovo ThinkBook 16 G4+ IAP i7-12700H, GeForce RTX 2050 Mobile | 1.8 kg | 16.5 mm | 16.00" | 2560x1600 |
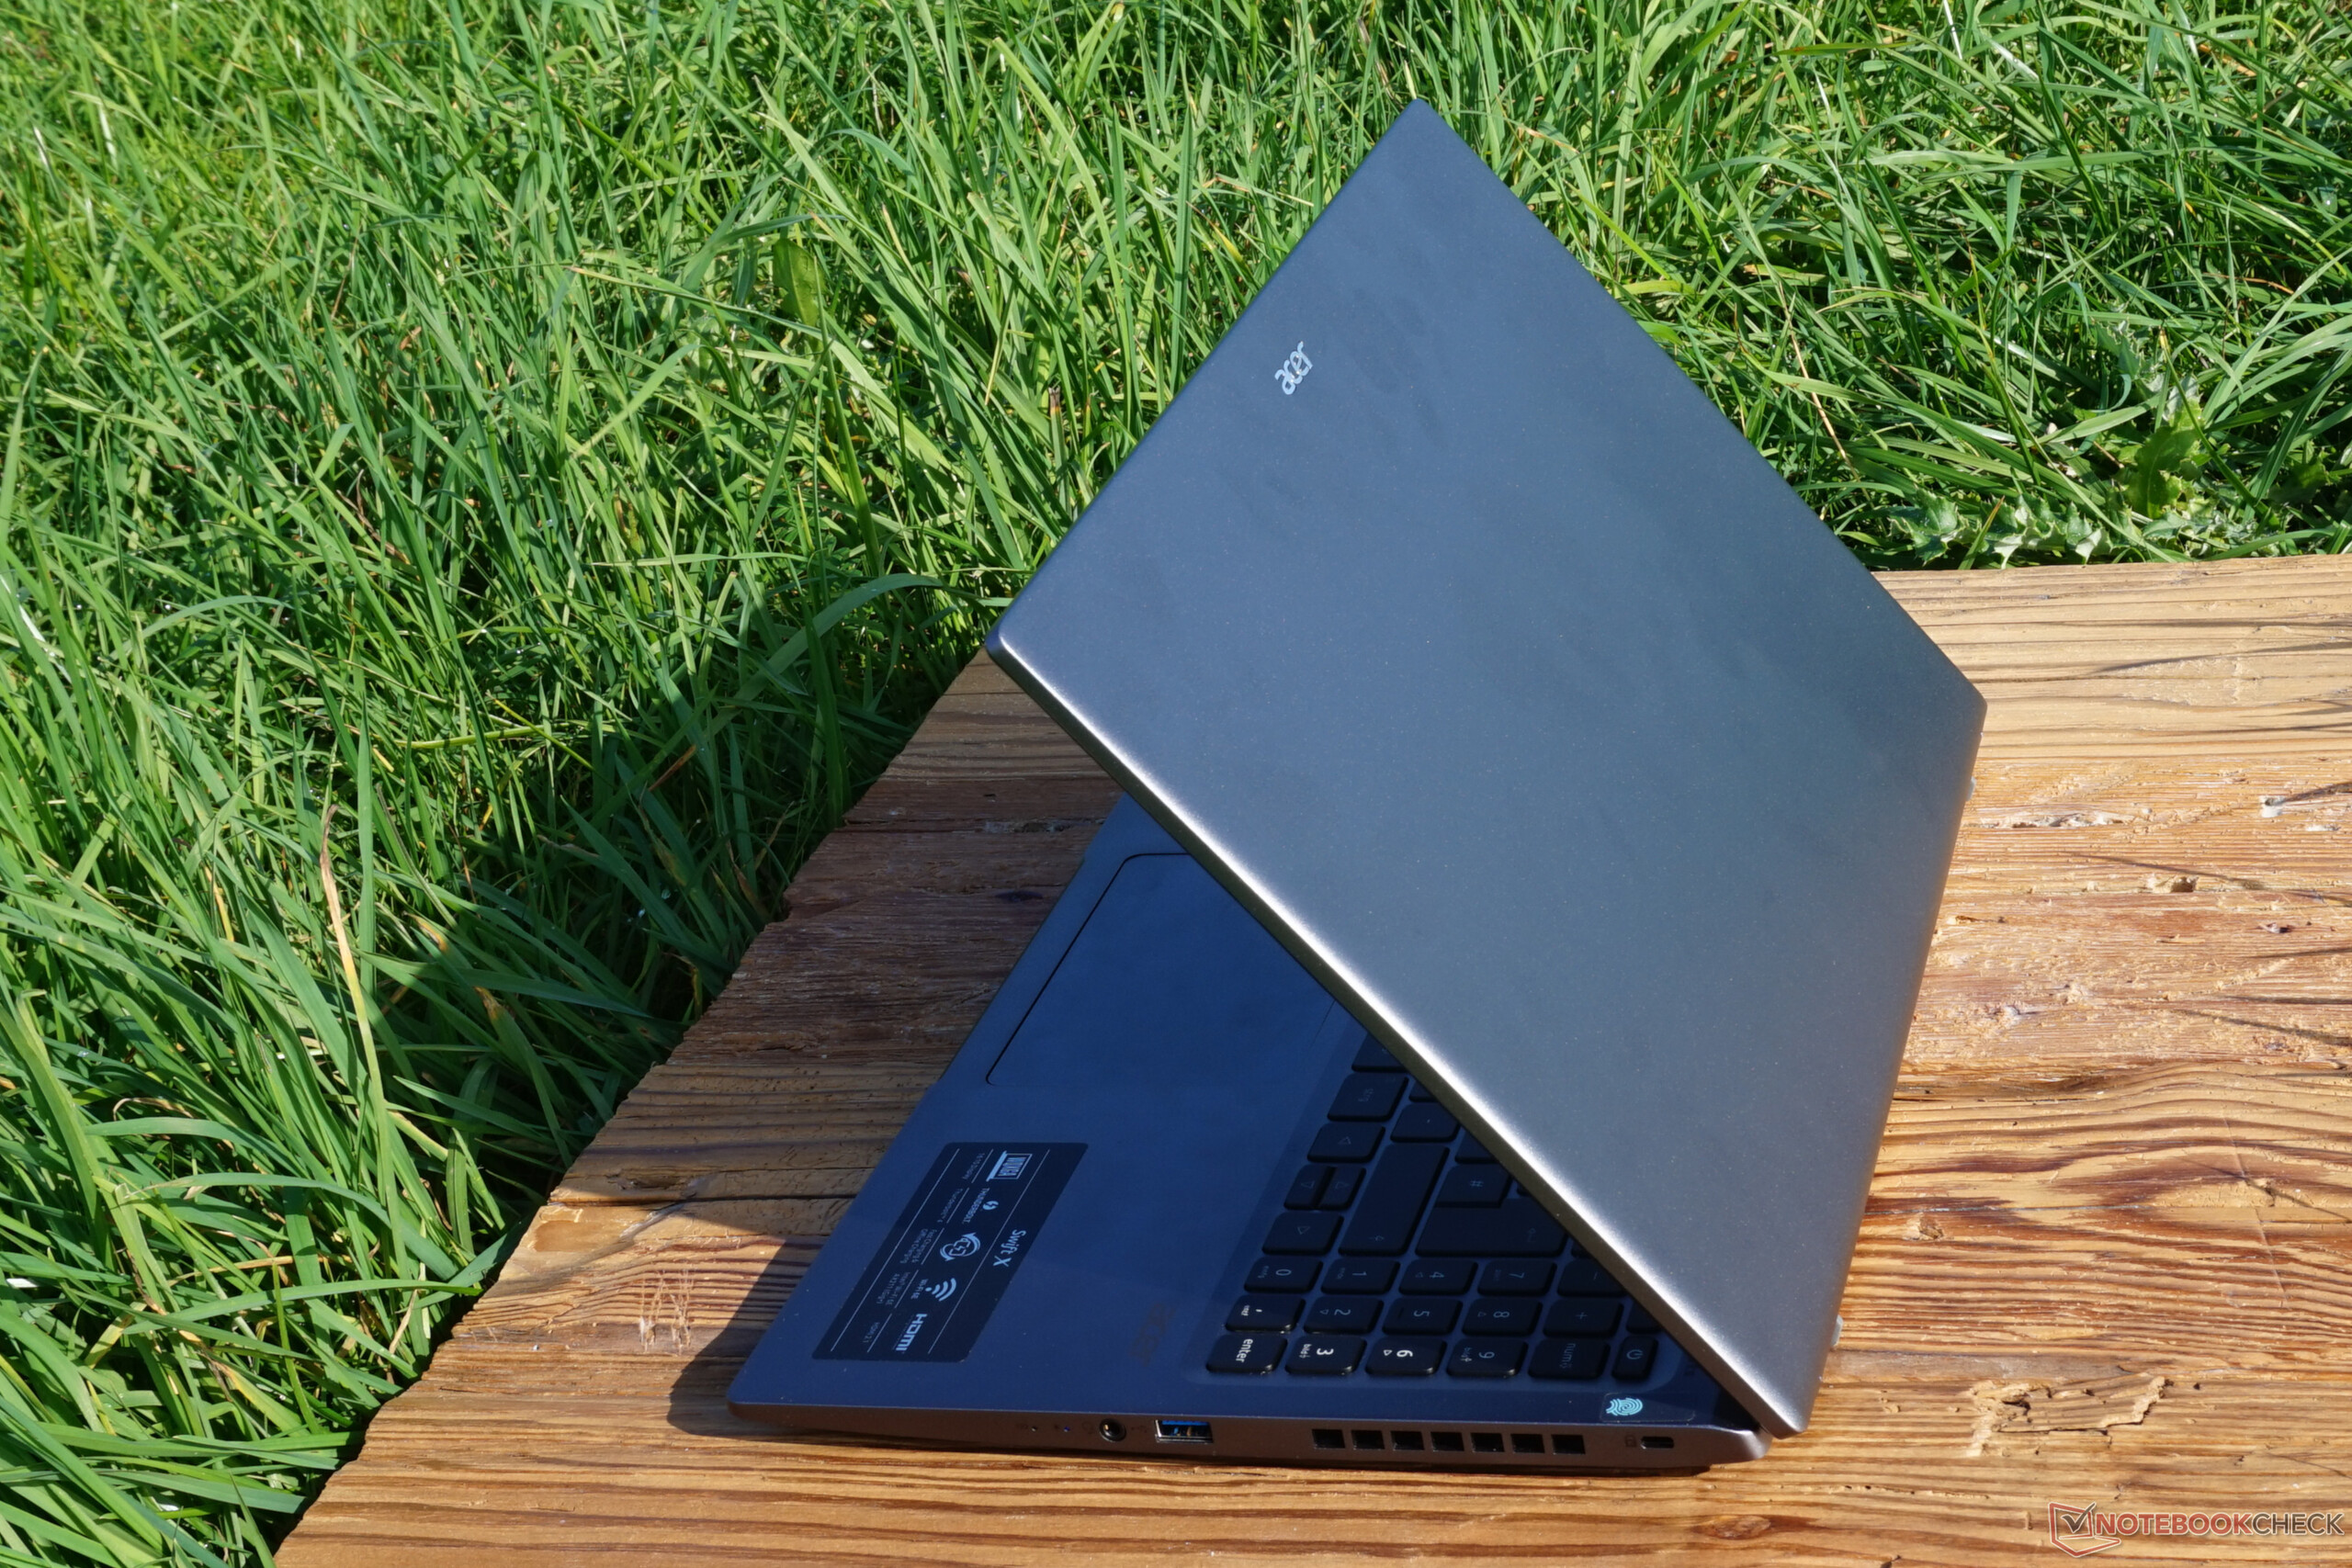
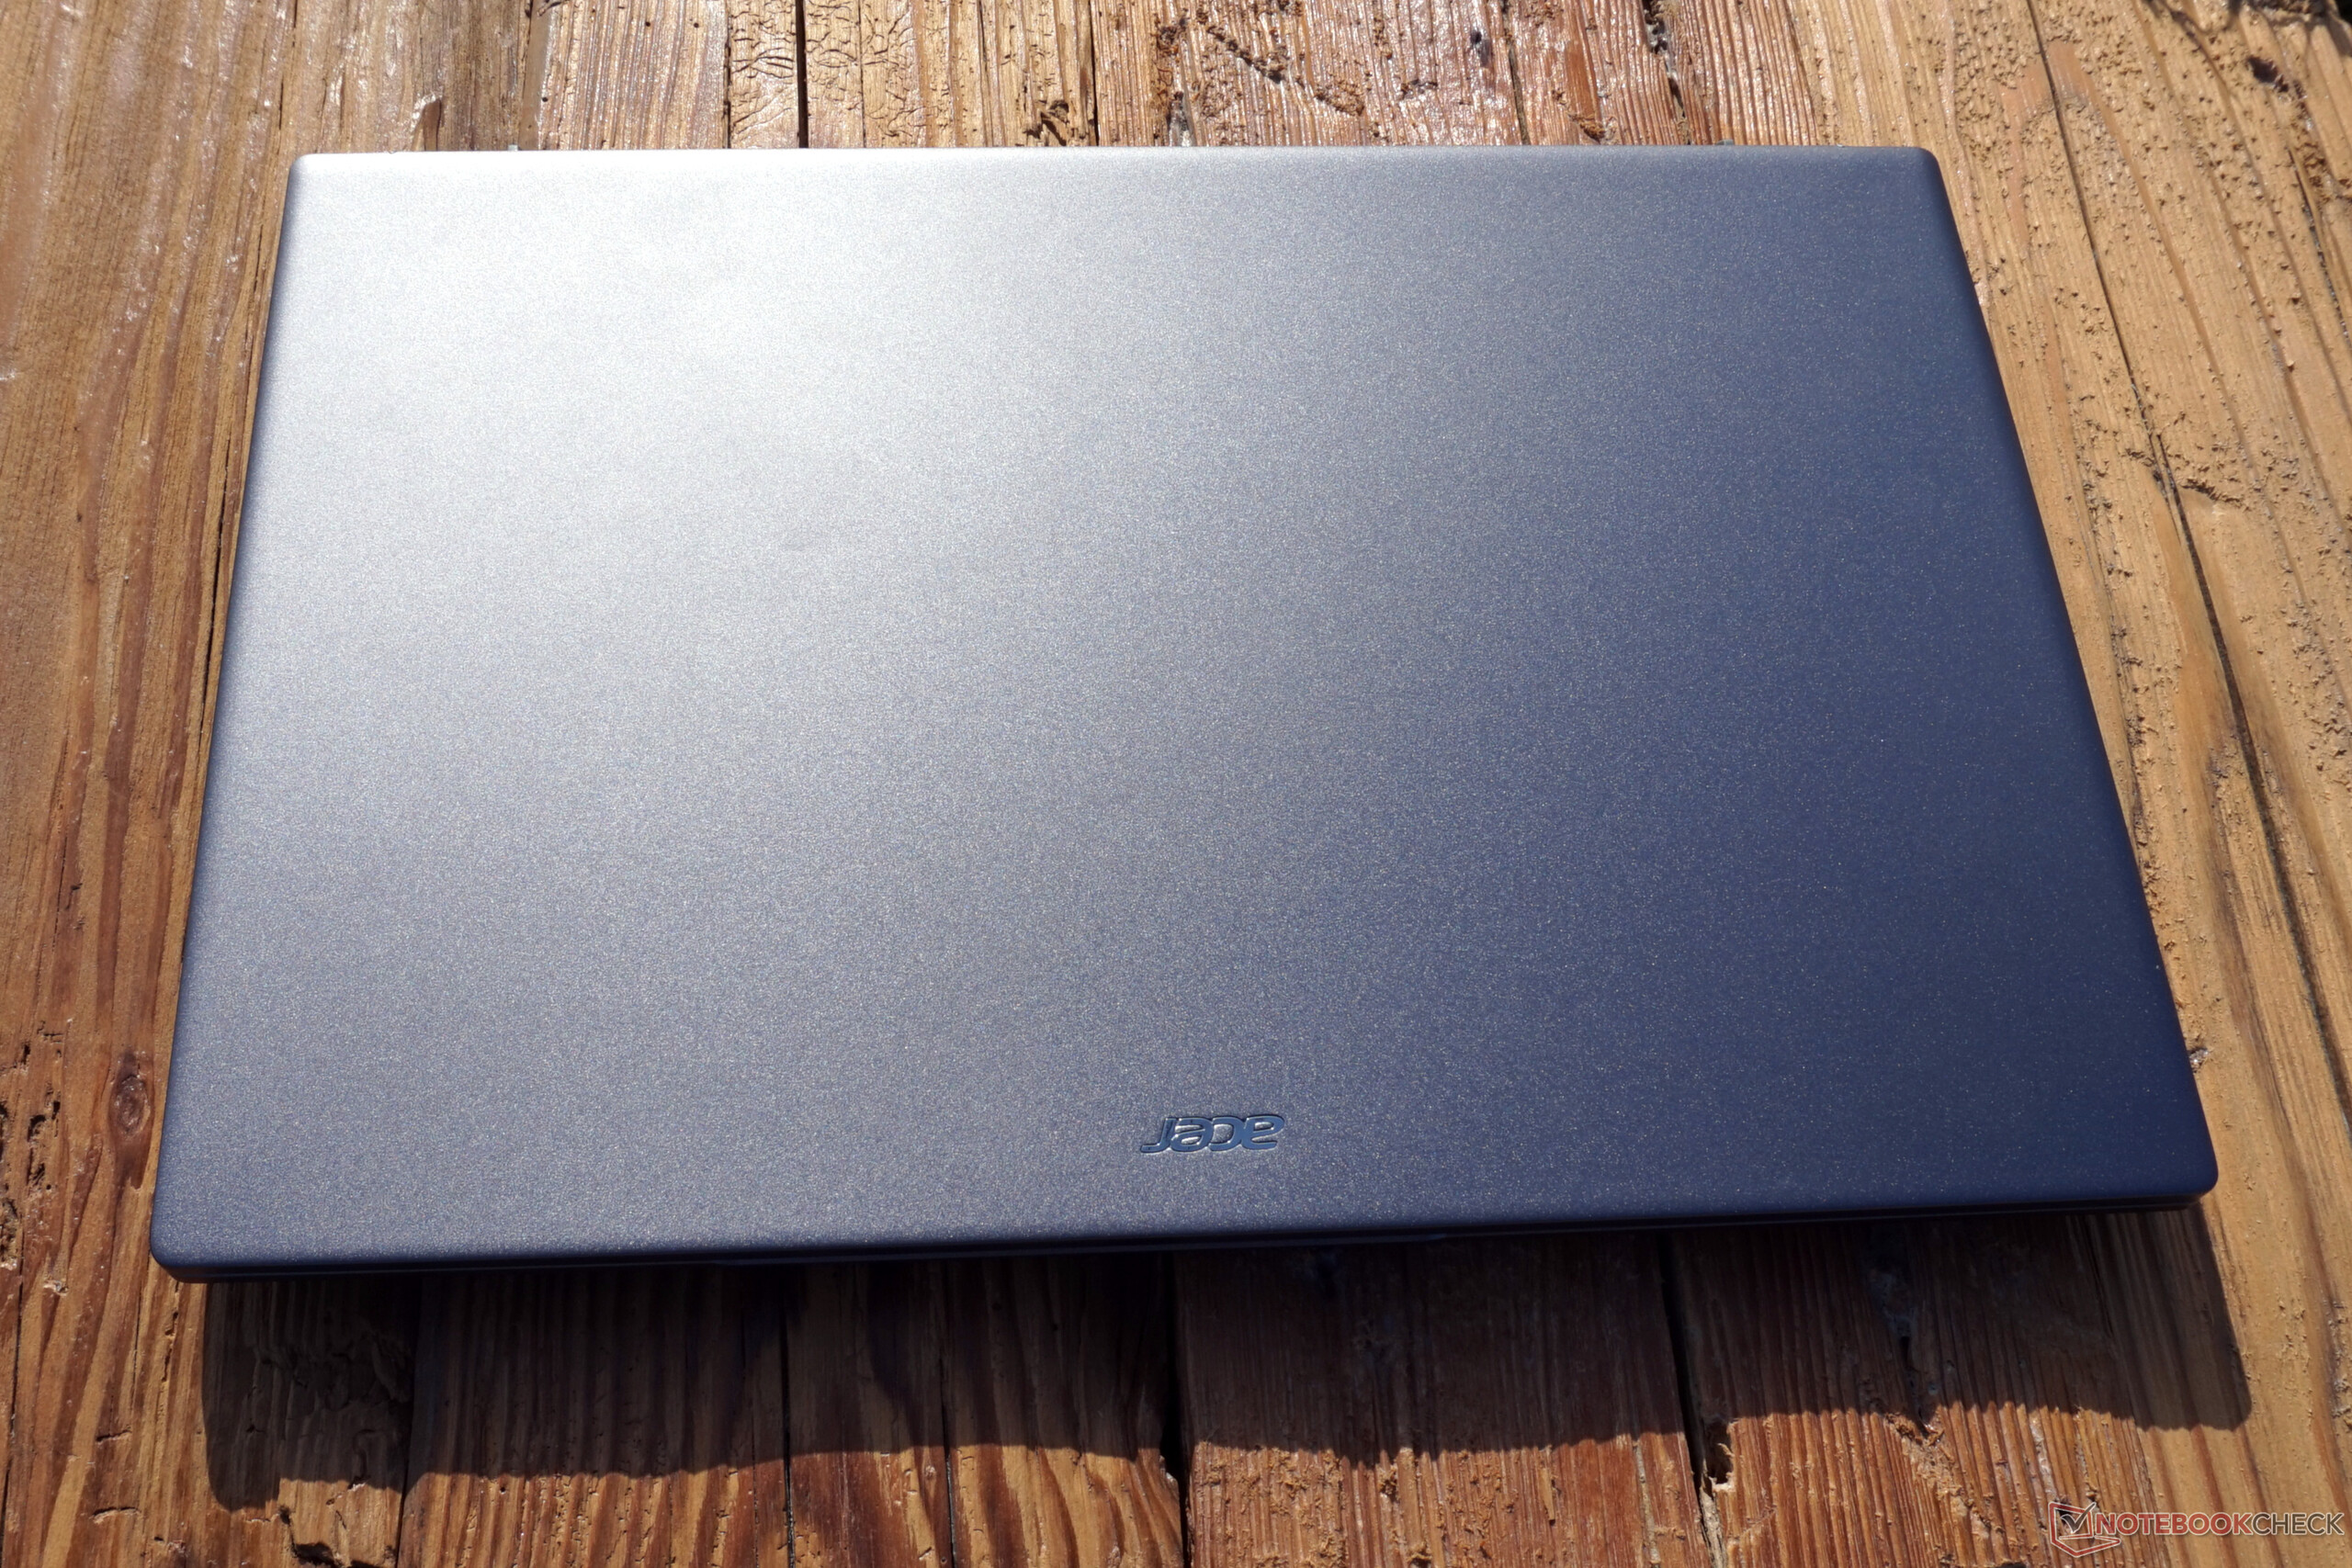
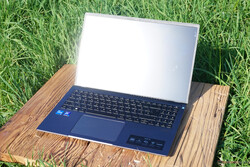
外壳 - Swift X是相当隐蔽的
Swift X看起来很精致,最重要的是,拿在手里很结实。键盘框架和金属显示屏盖确保了良好的印象。然而,对我们来说,顶盖太容易被压住了。底部由塑料制成的事实也是显而易见的。屏幕的边框是一个缺点,因为它的黑色塑料与其他相当优雅的外观完全不匹配。
总的来说,外壳是令人愉快的坚固。即使是单手操作,显示屏的打开也有轻微的阻力,而且很难变形。从90°的打开角度看,屏幕的边缘(也有两个脚)靠在桌子上,这除了是一个稳定的支架外,还为空气供应创造了更好的条件。
考虑到这些功能和16英寸的屏幕对角线,重量被限制在1.8公斤,这也是由于有一些过多的塑料部件。由于屏幕边缘窄得令人愉快,笔记本电脑的外壳很紧凑,应该很容易装入许多15英寸的笔记本电脑外壳。
从纸面上看,宏碁Swift X是同类产品中最薄的设备之一。这正是我们不得不对其进行多次测量的原因。我们测量的是后部的21.3毫米和前部的20.1毫米,而不是宏碁指定的17.9毫米。宏碁声称的好得多的数值无处可寻。但也许这只是他们网站上的一个数据库错误。
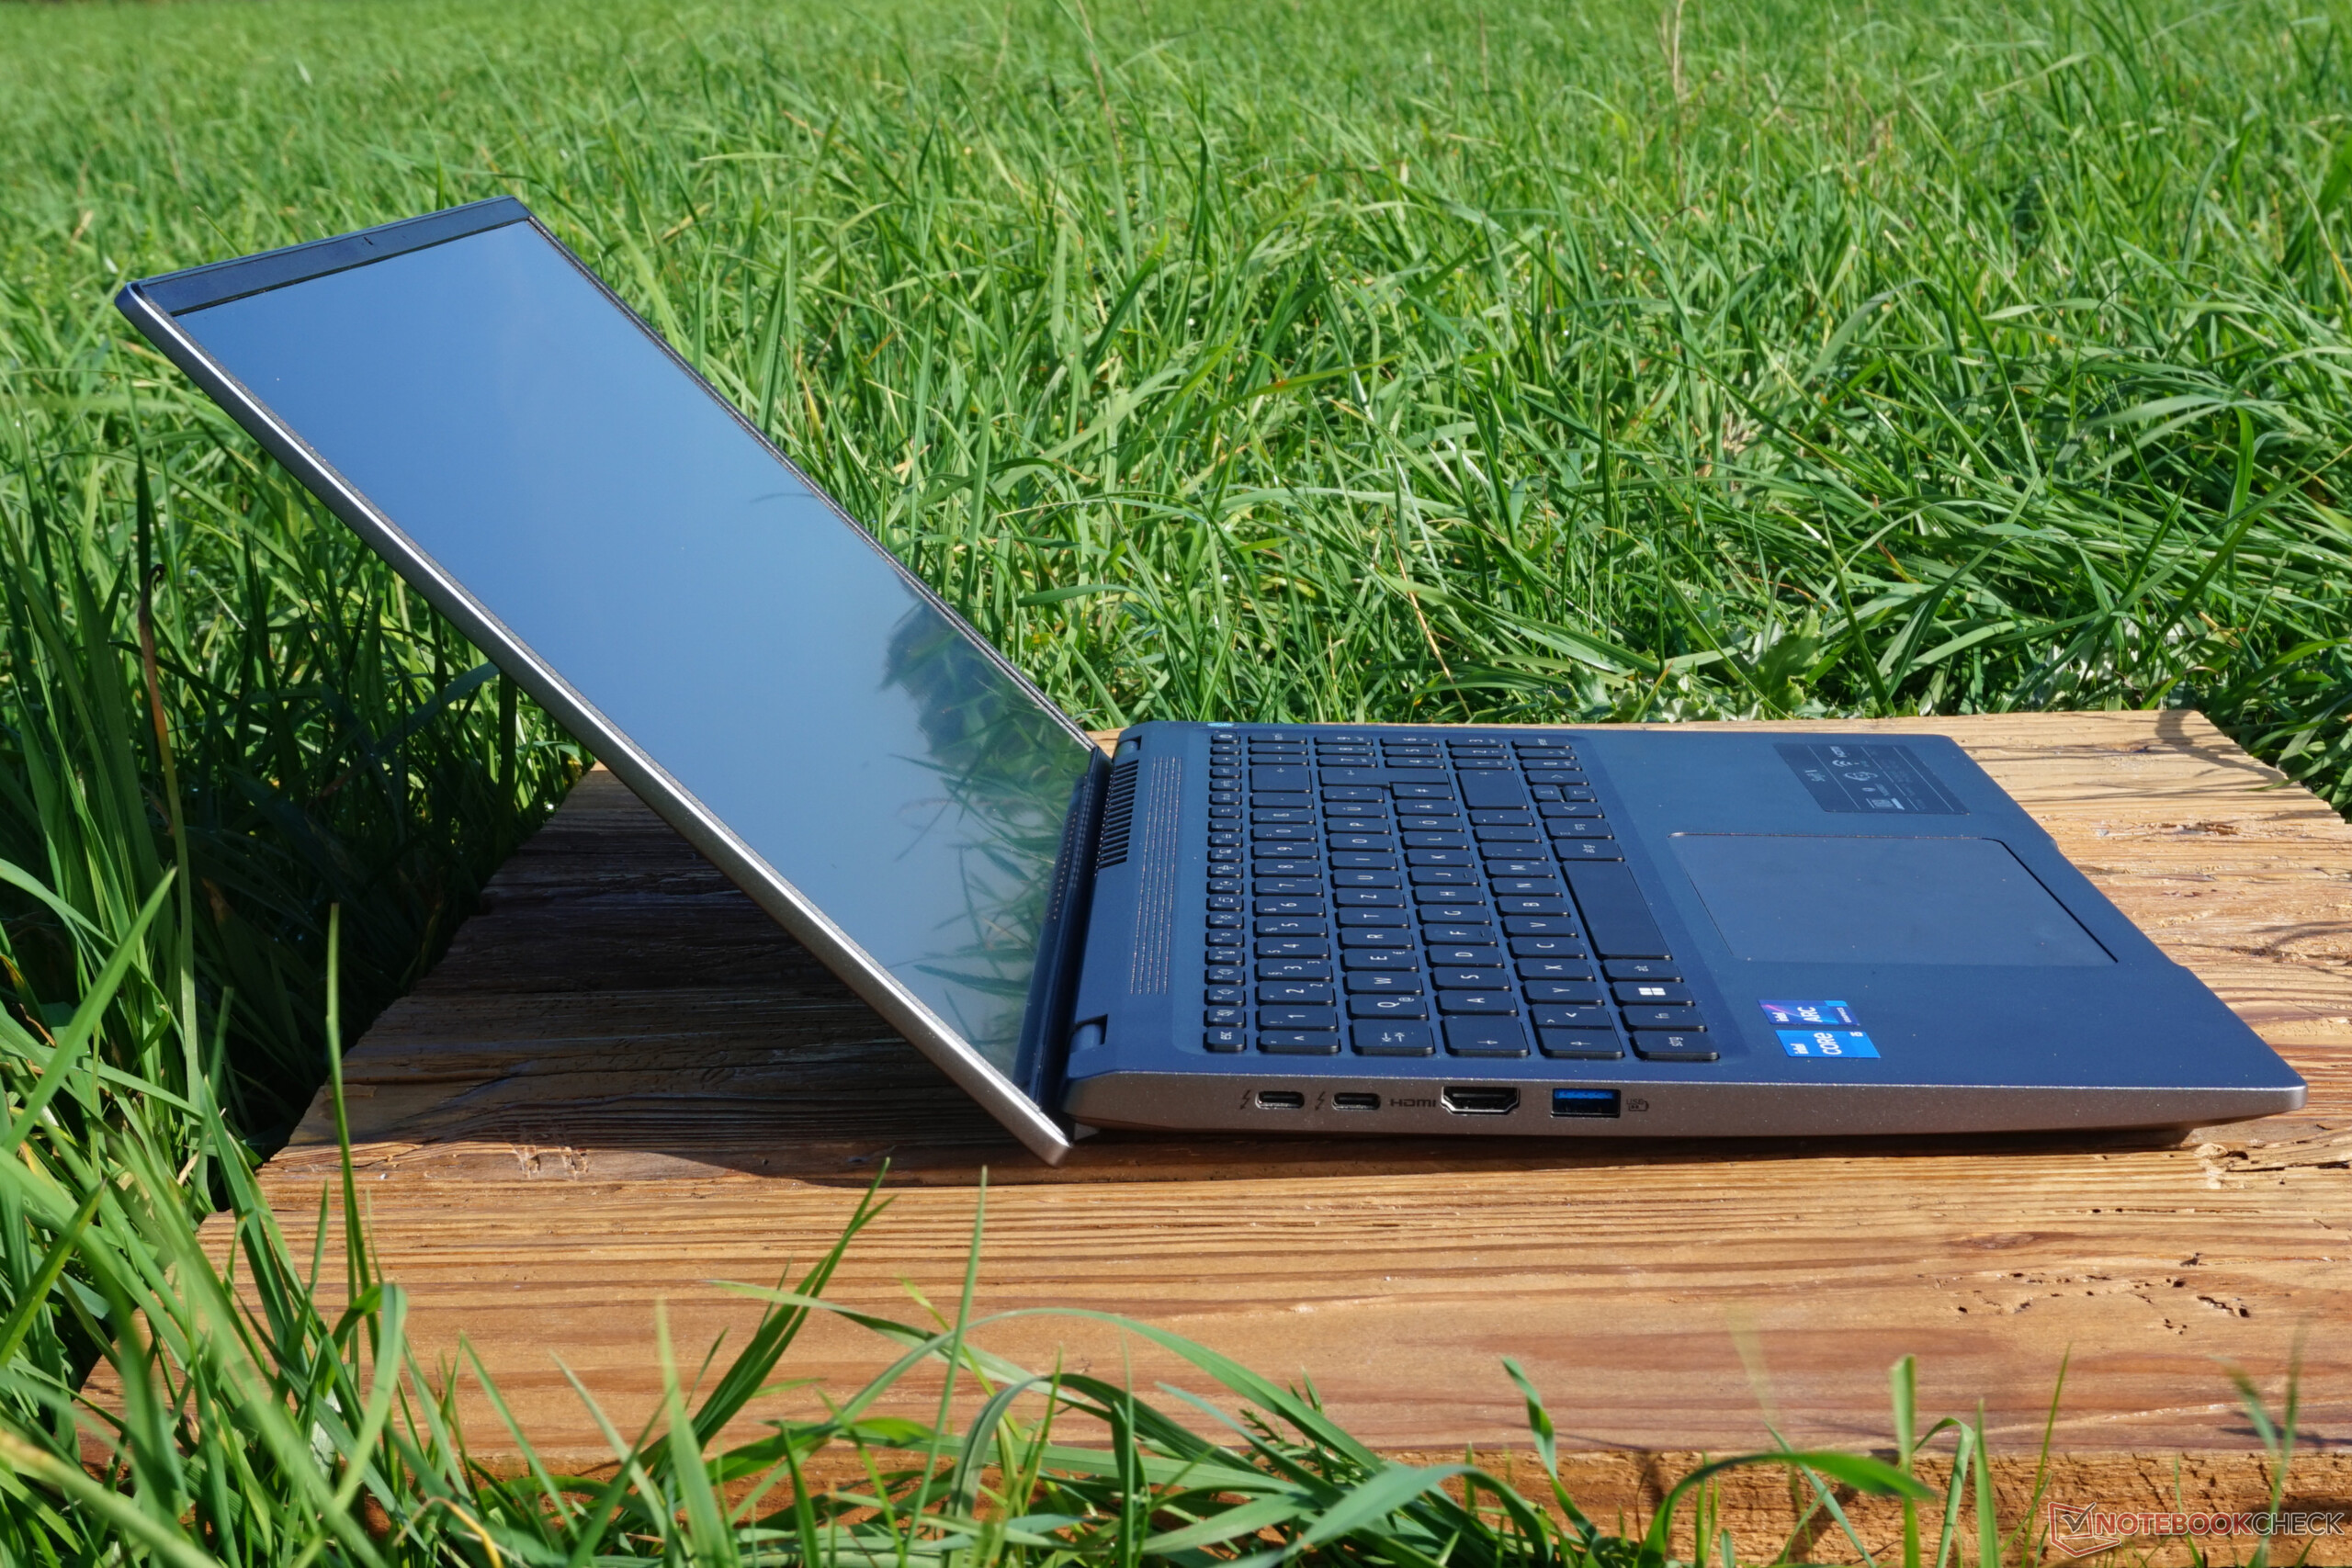
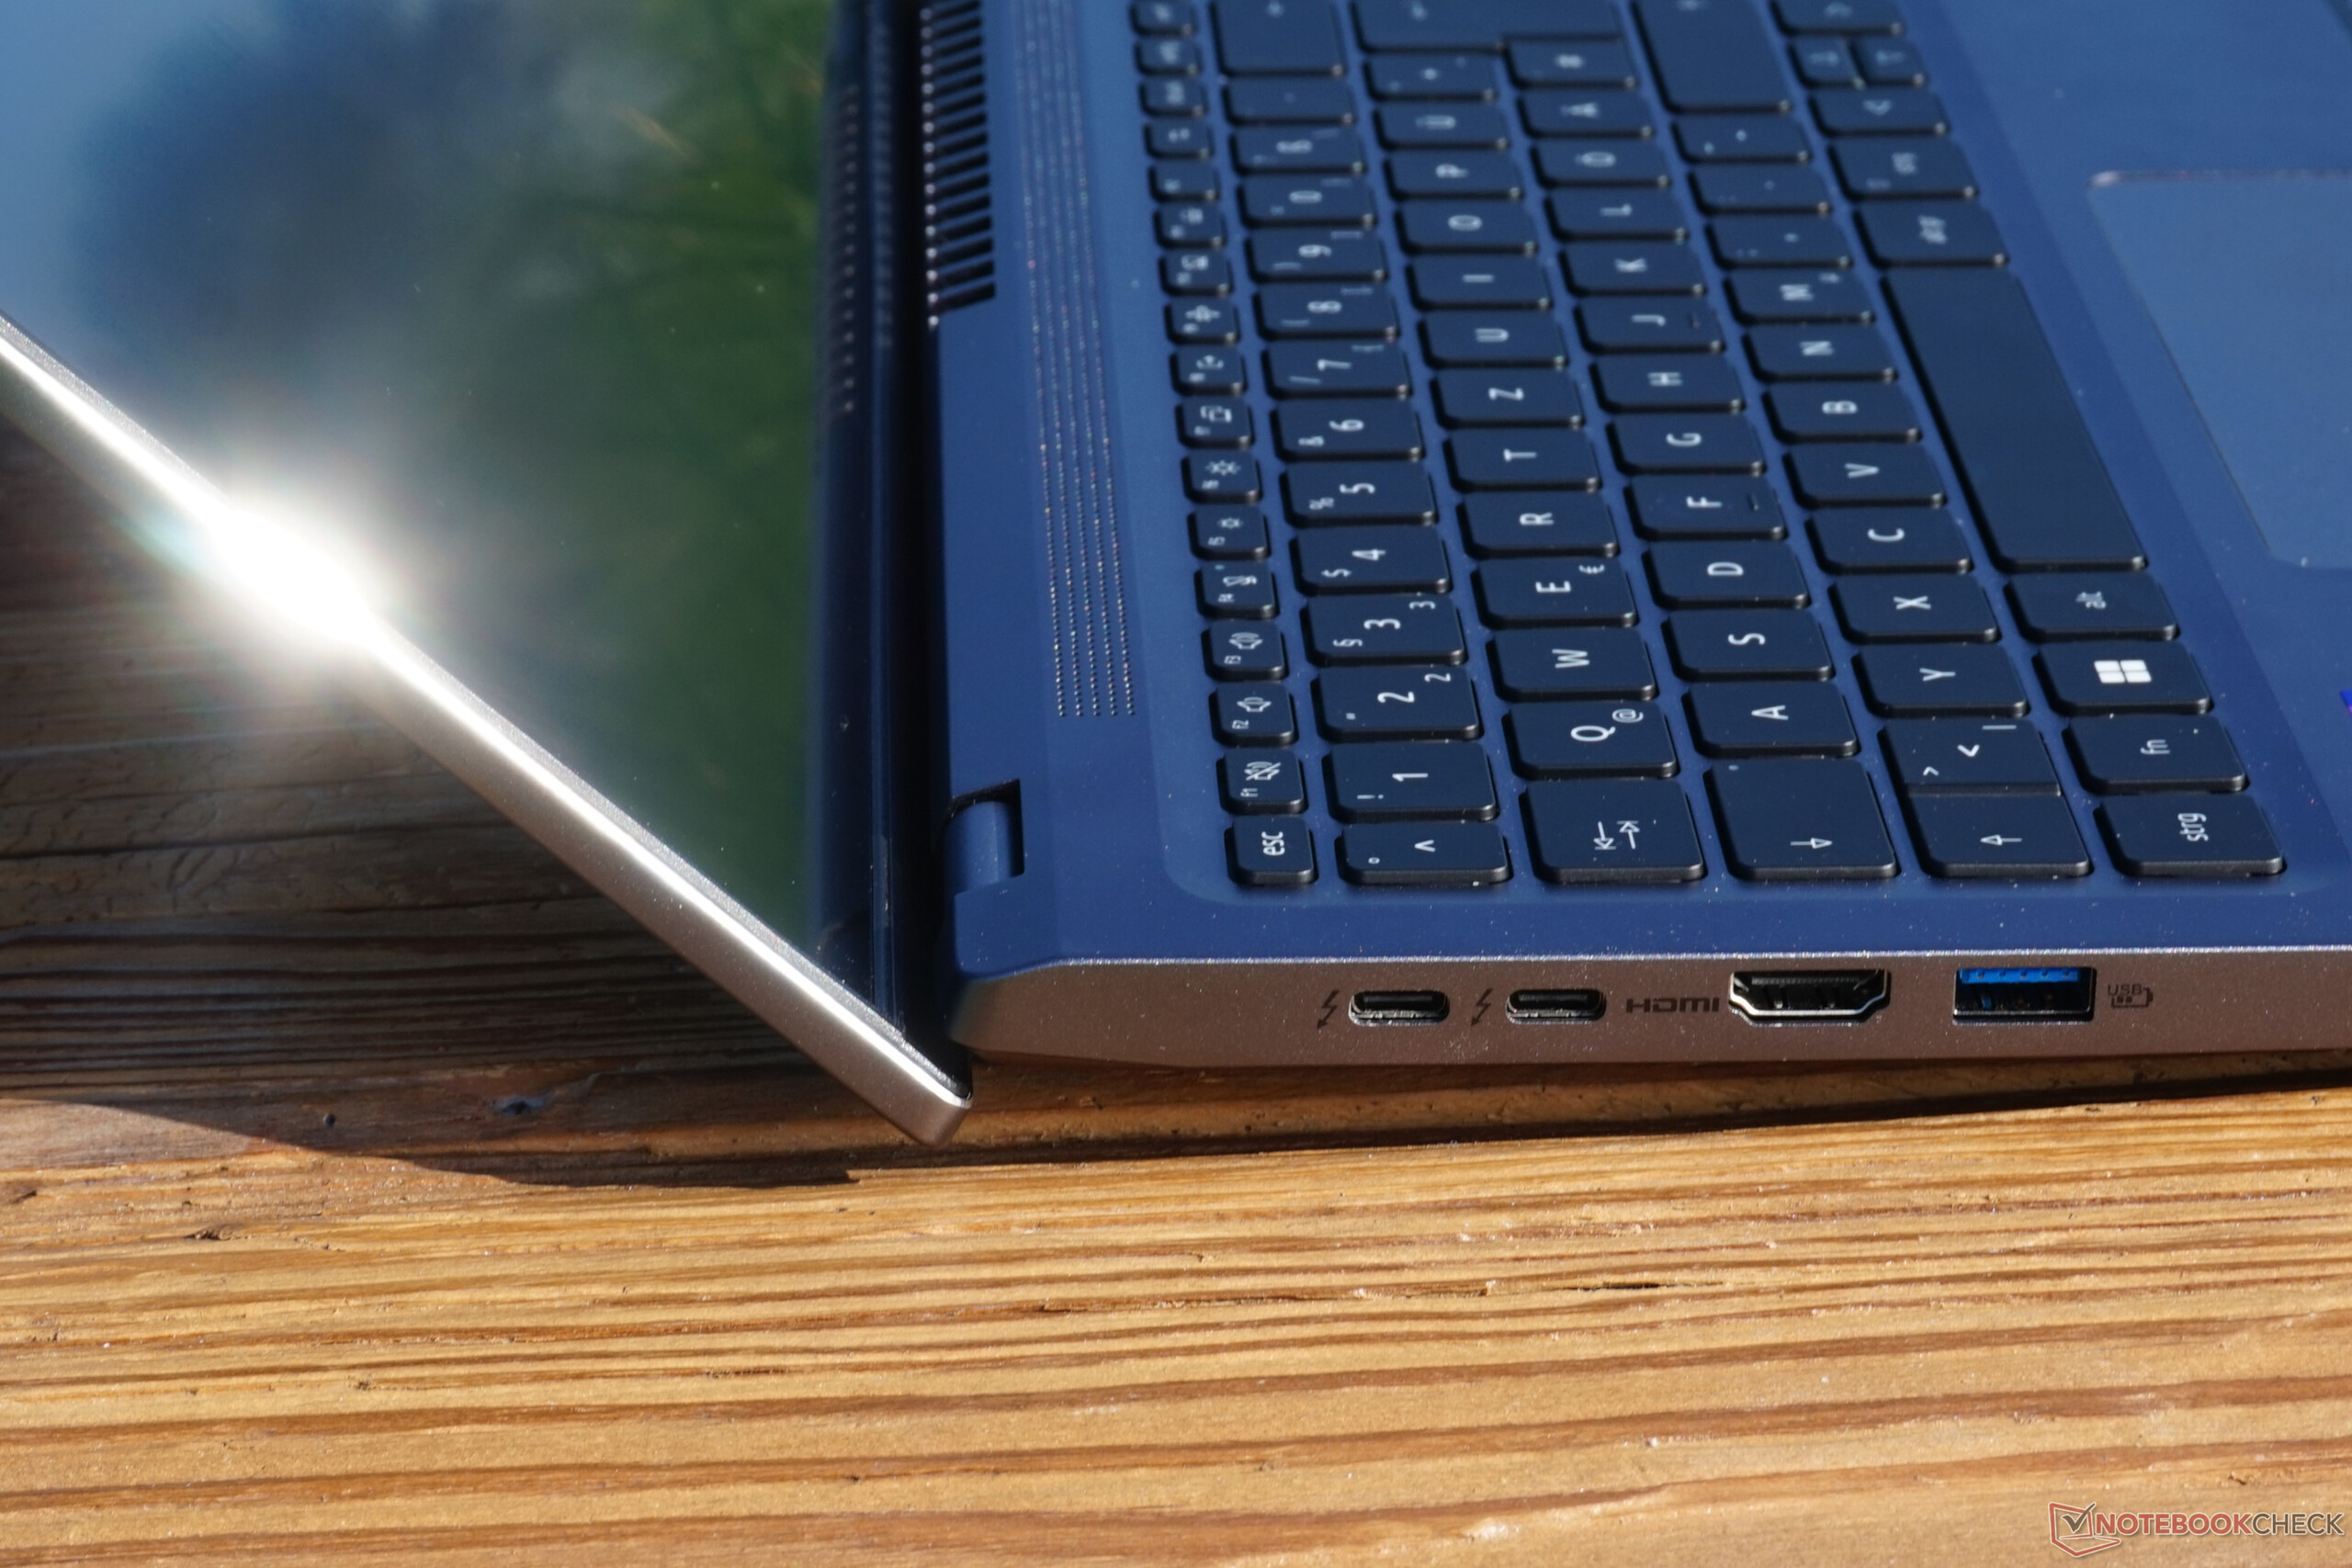
特点 - 带有TB4的多媒体笔记本,但其他方面不多
Thunderbolt 4 x 2在任何情况下都可能被强调。笔记本电脑可以使用这两个端口进行充电。40Gbit/s的最大传输速率也允许连接到高性能外围设备。此外,还有一个特殊的功能:左边的USB-A端口始终有电源供应。即使在笔记本电脑完全关闭的情况下,该端口也可用于为智能手机充电等。
否则,节俭的风气就会盛行。右边还有一个USB-A接口,以及用于连接电视的HDMI和一个模拟耳机接口,这就是你得到的全部。没有卡槽或LAN端口。


沟通
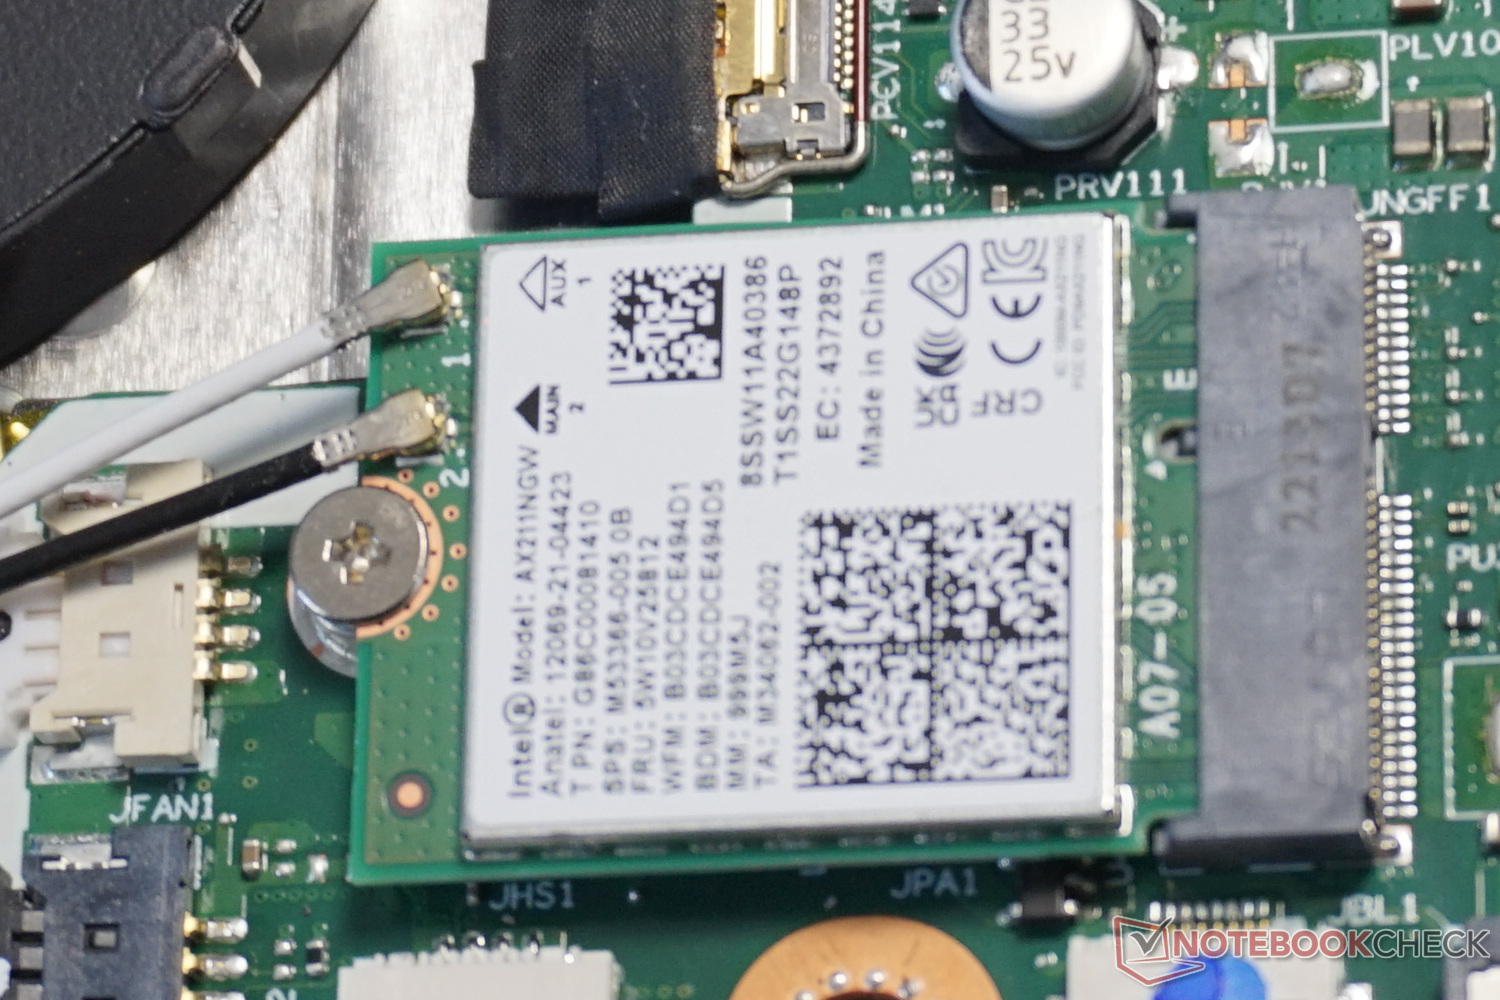
可更换的英特尔AX211 WLAN模块的表现符合预期。在测试时,传输率始终保持在一个较高的水平,也可以被评为略高于平均水平。有了足够好的WLAN信号,缺少一个LAN端口几乎不是问题。
网络摄像头
由于全高清分辨率,相对高质量的视频通话是可能的。然而,令人震惊的是不由自主的增亮效果,即使是在照明的轻微变化下。一片云或打开附近的灯,就足以引发令人不快的闪烁。这在我们的颜色对比图上很容易看到。色彩偏差特别明显的领域只是被相机提亮了,因为它实际上是在拍摄体面的照片。
至少麦克风是完全令人信服的。在测试中,它接收到的声音几乎没有失真,几乎不管声音来自哪个方向,也不管笔记本离得多远。


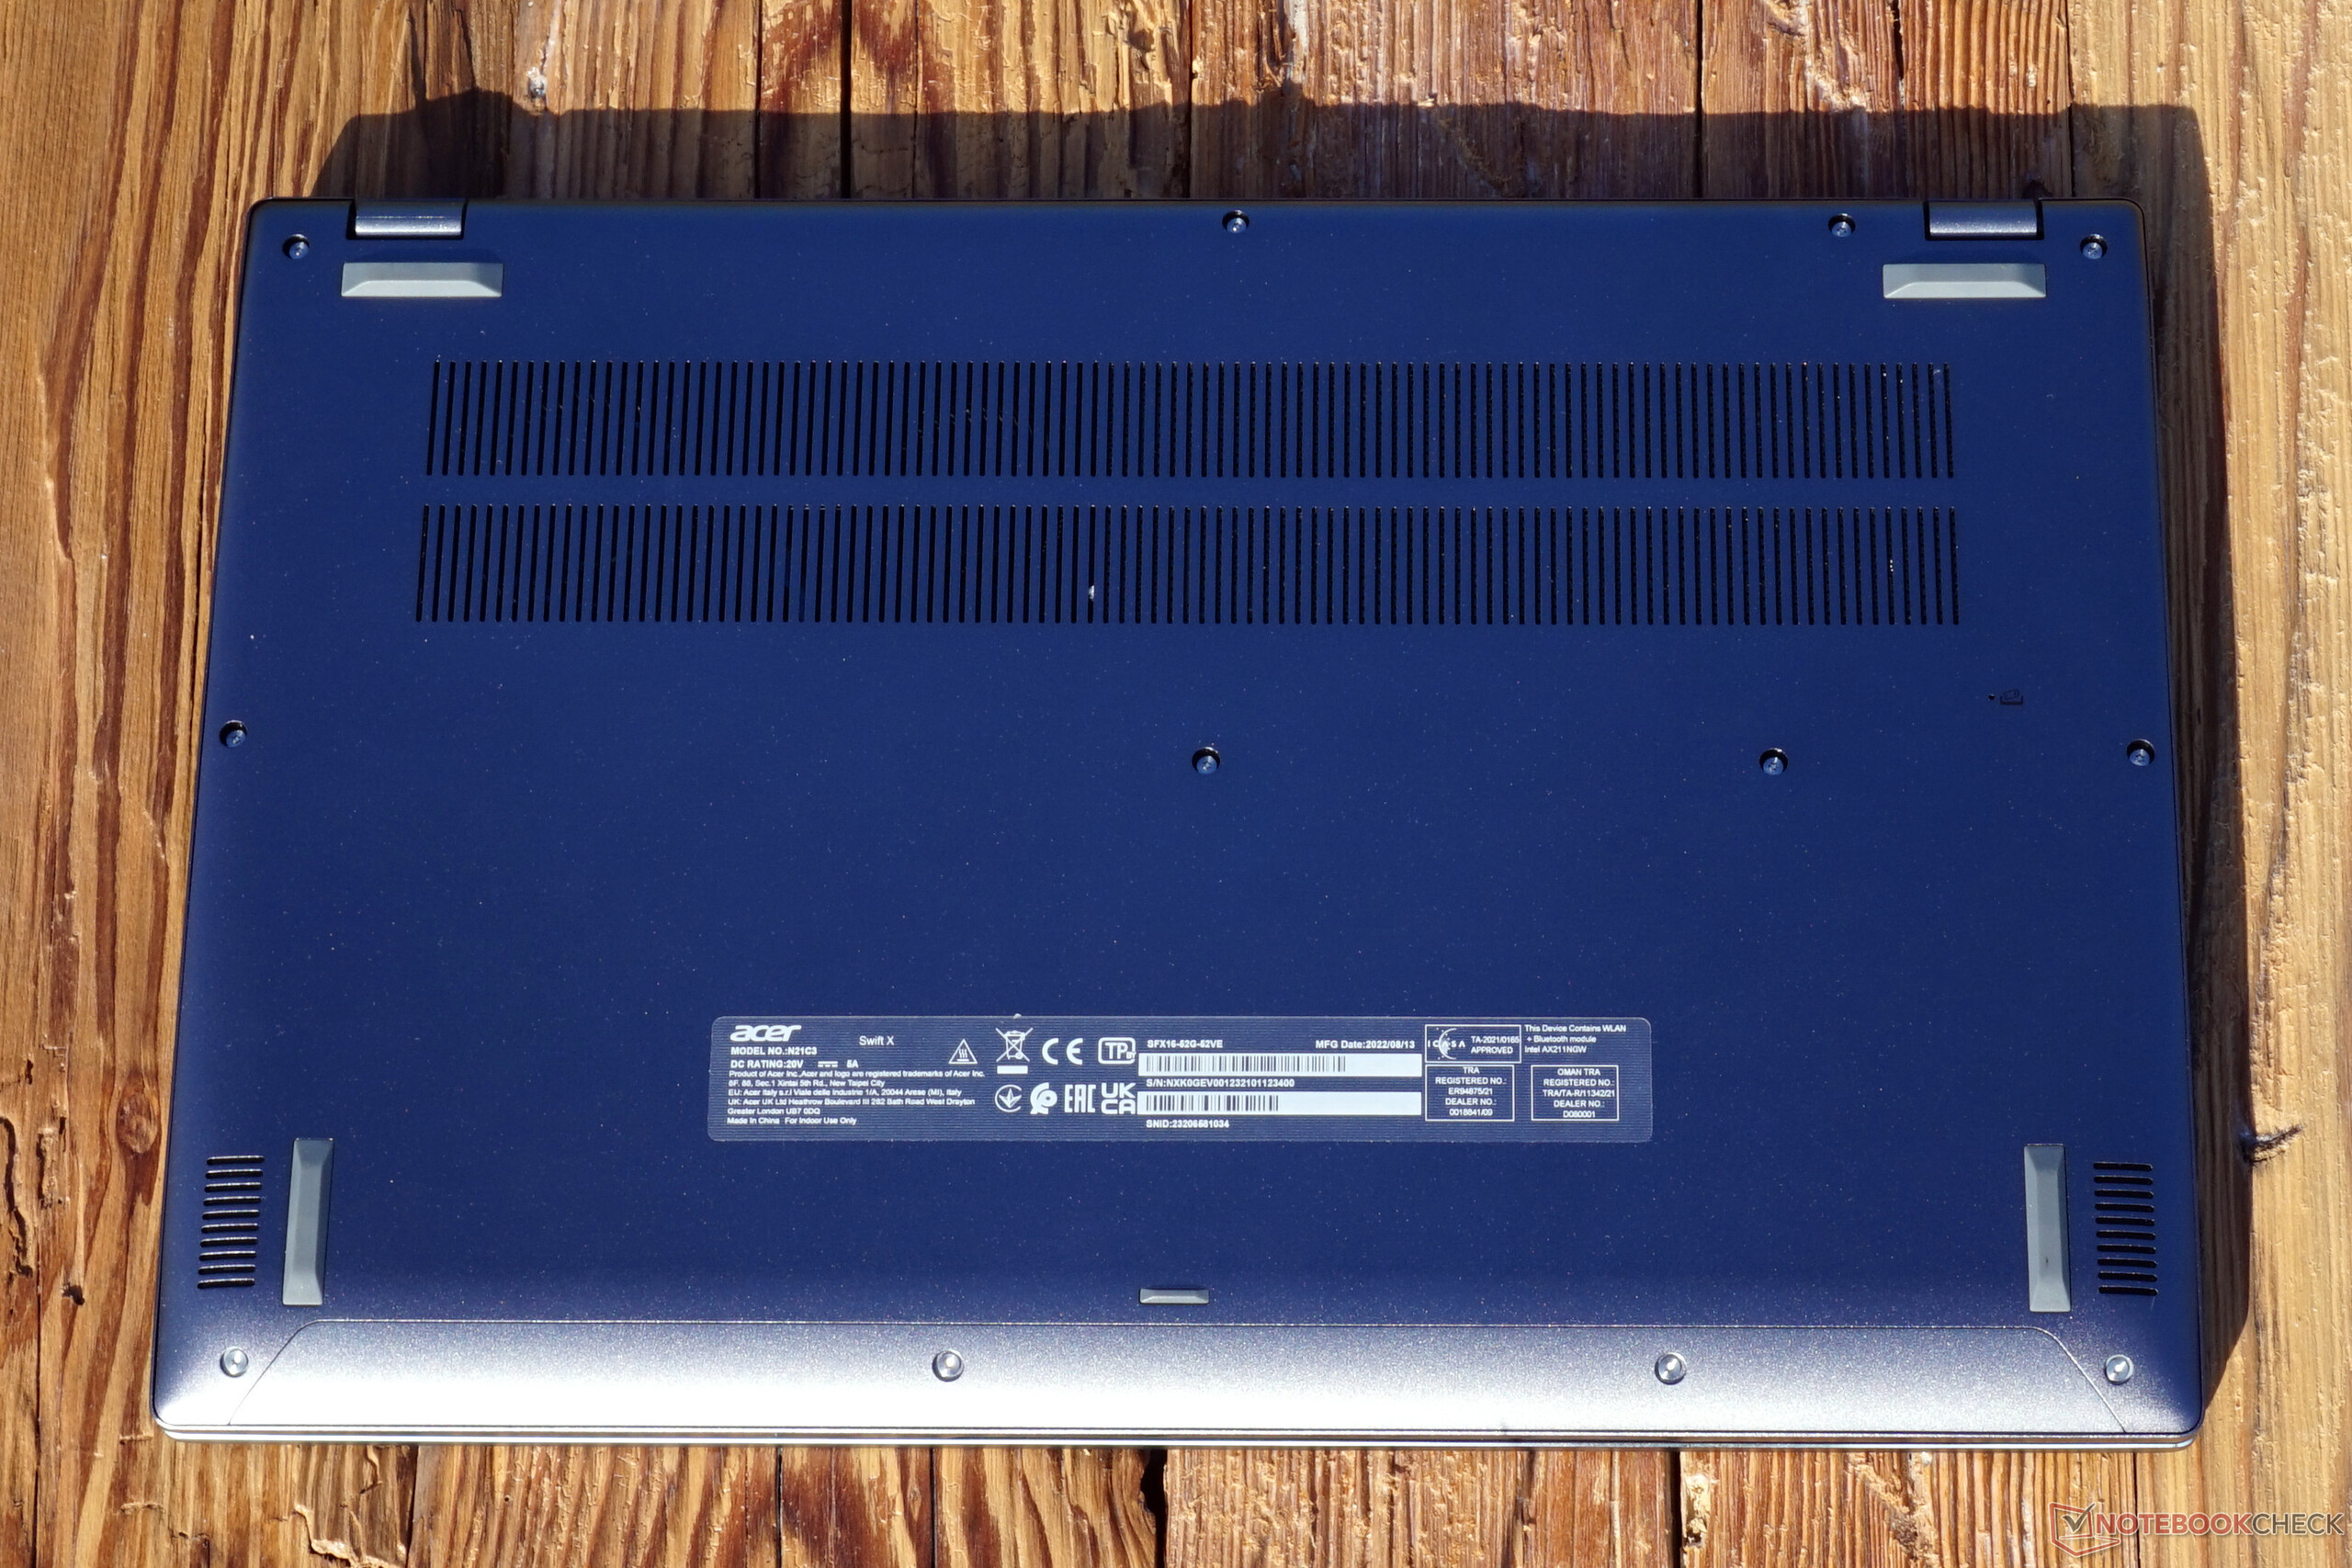
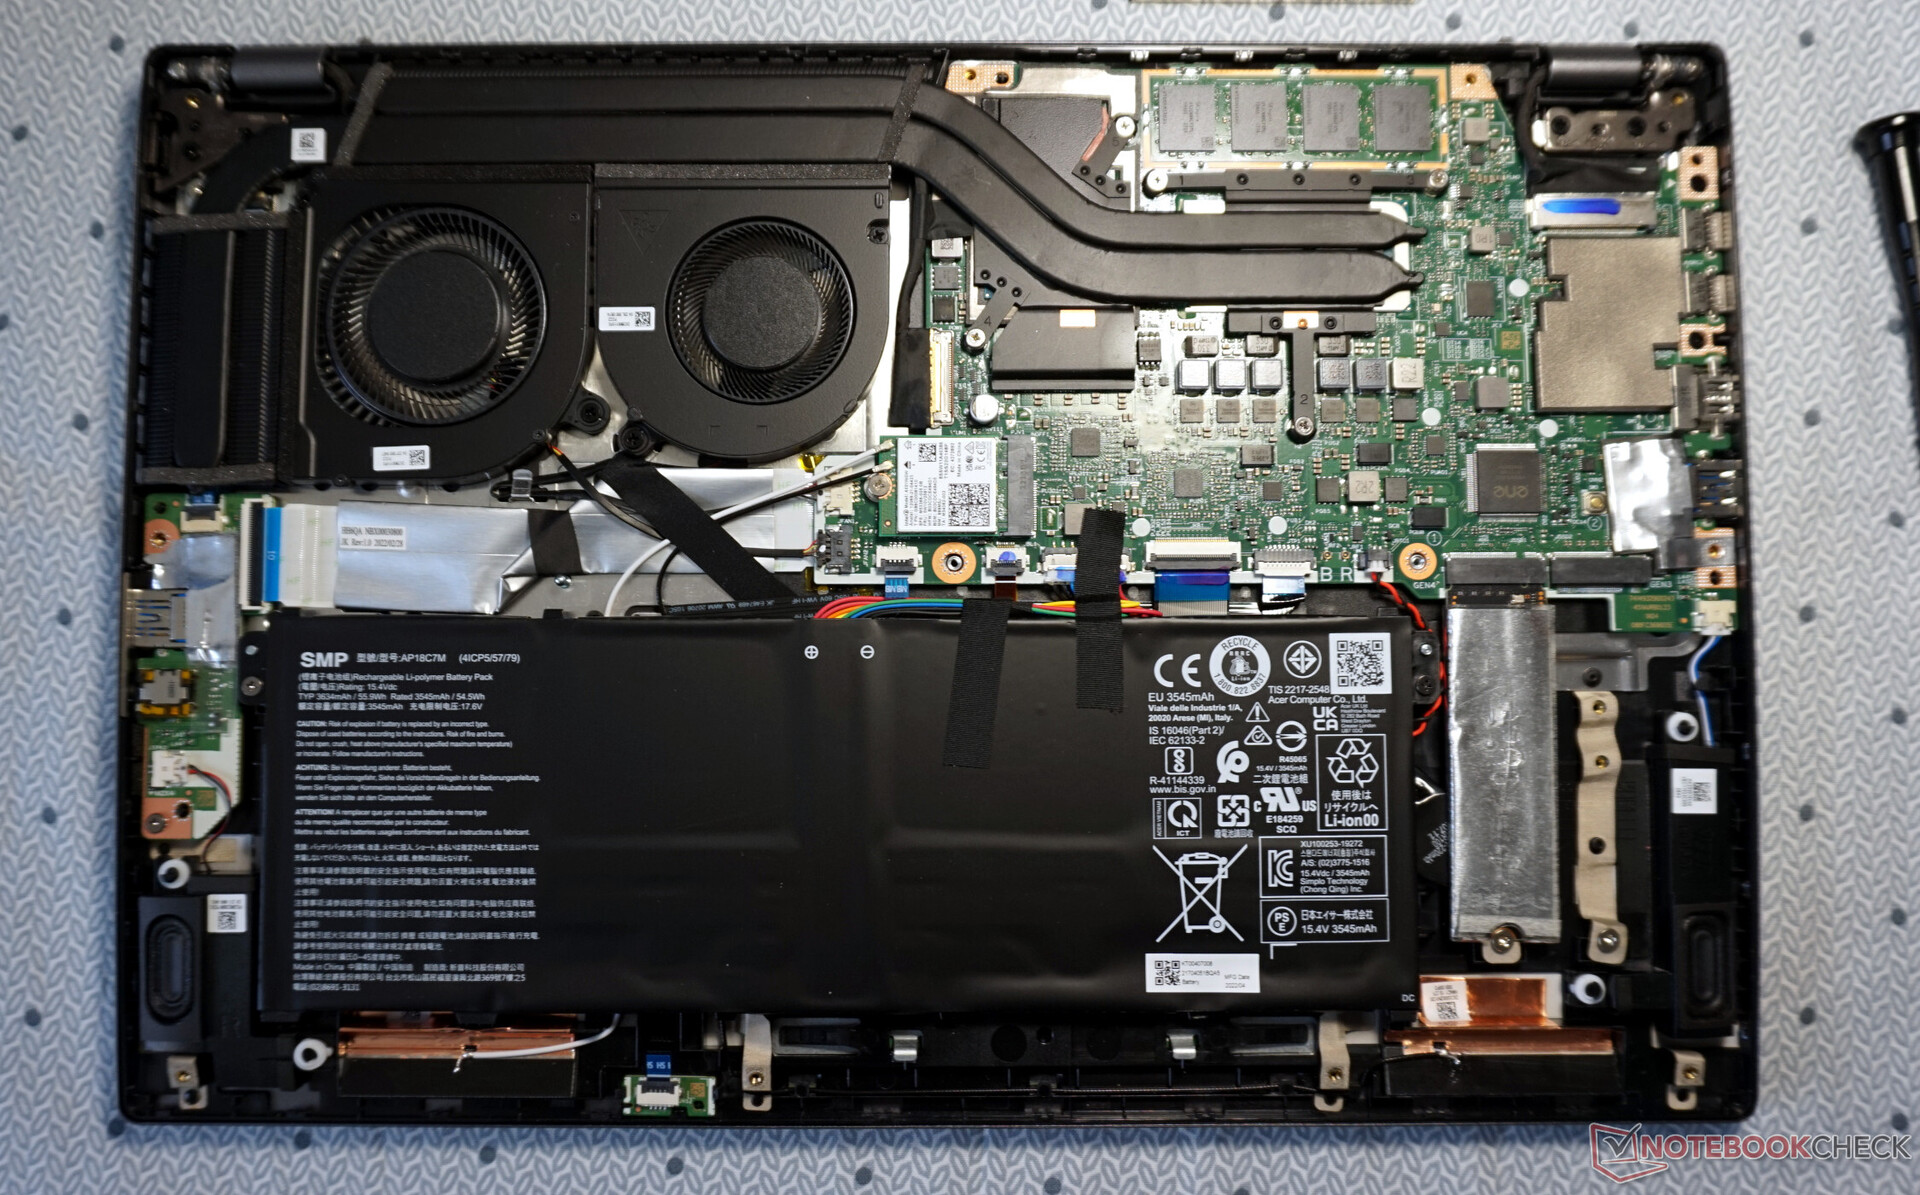
维护
卸下12颗Torx螺丝后,小心地松开底板就可以了。这是在塑料夹子的帮助下锁定的,但要非常均匀,不要太紧。
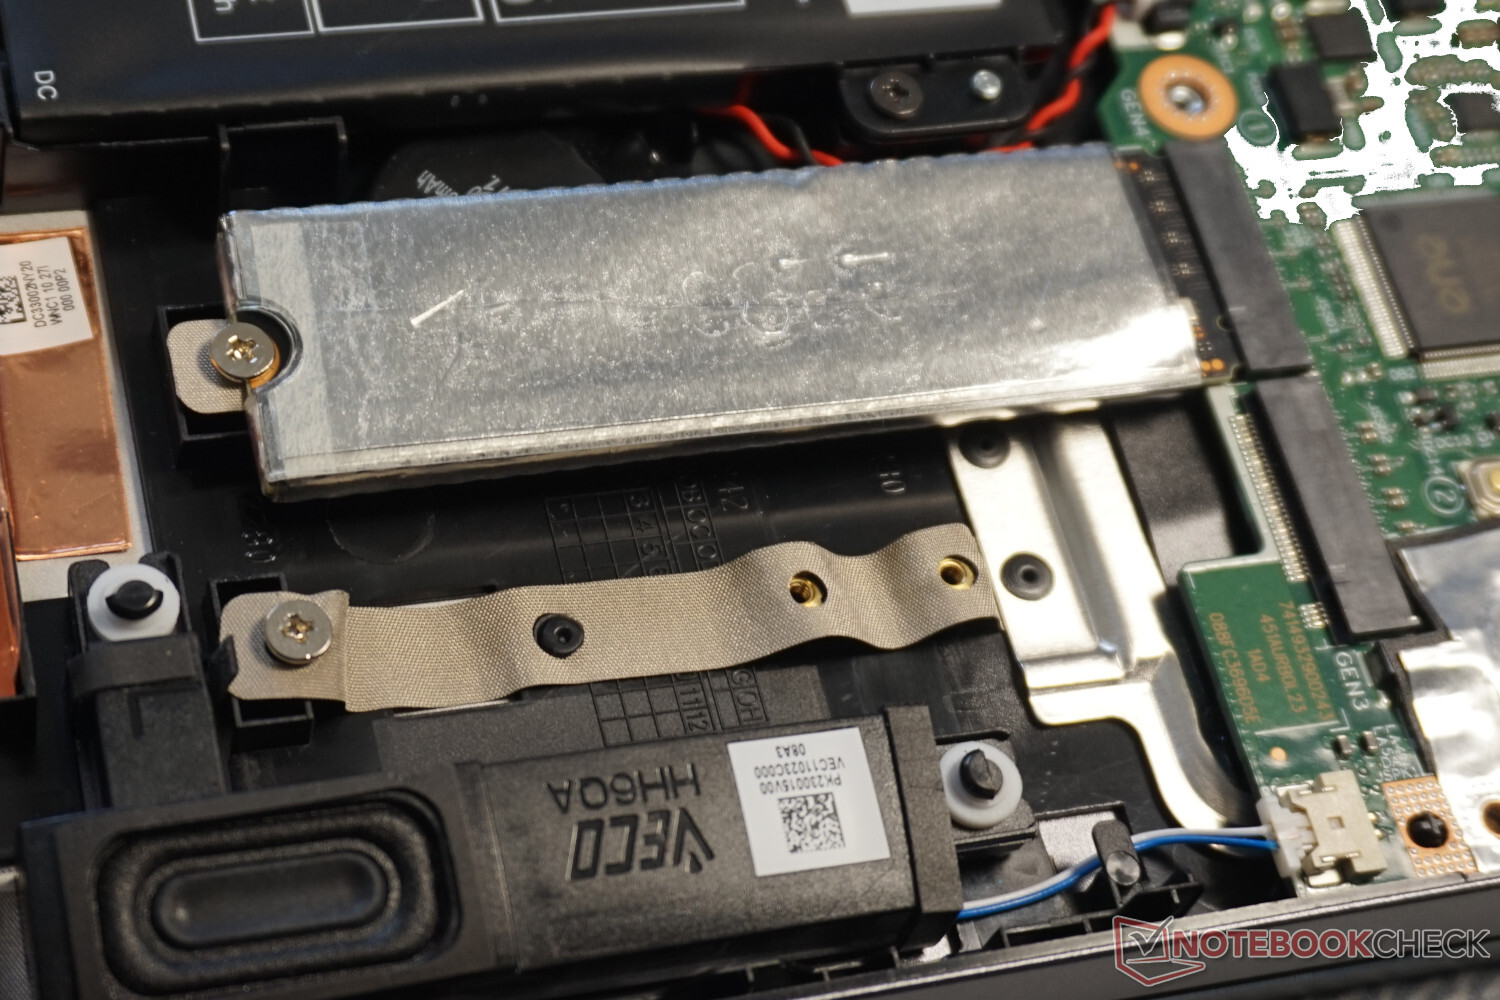
电池、M.2 SSD和WLAN模块可以被替换。升级内存就更简单了。除了标准的固态硬盘,还有一个额外的插槽是免费的,再加上相对容易的访问,使得这种升级即使对非专业人士来说也是现实的。另一方面,内存是焊接在主板上的,这就是为什么只有16GB的内存是不可更改的。
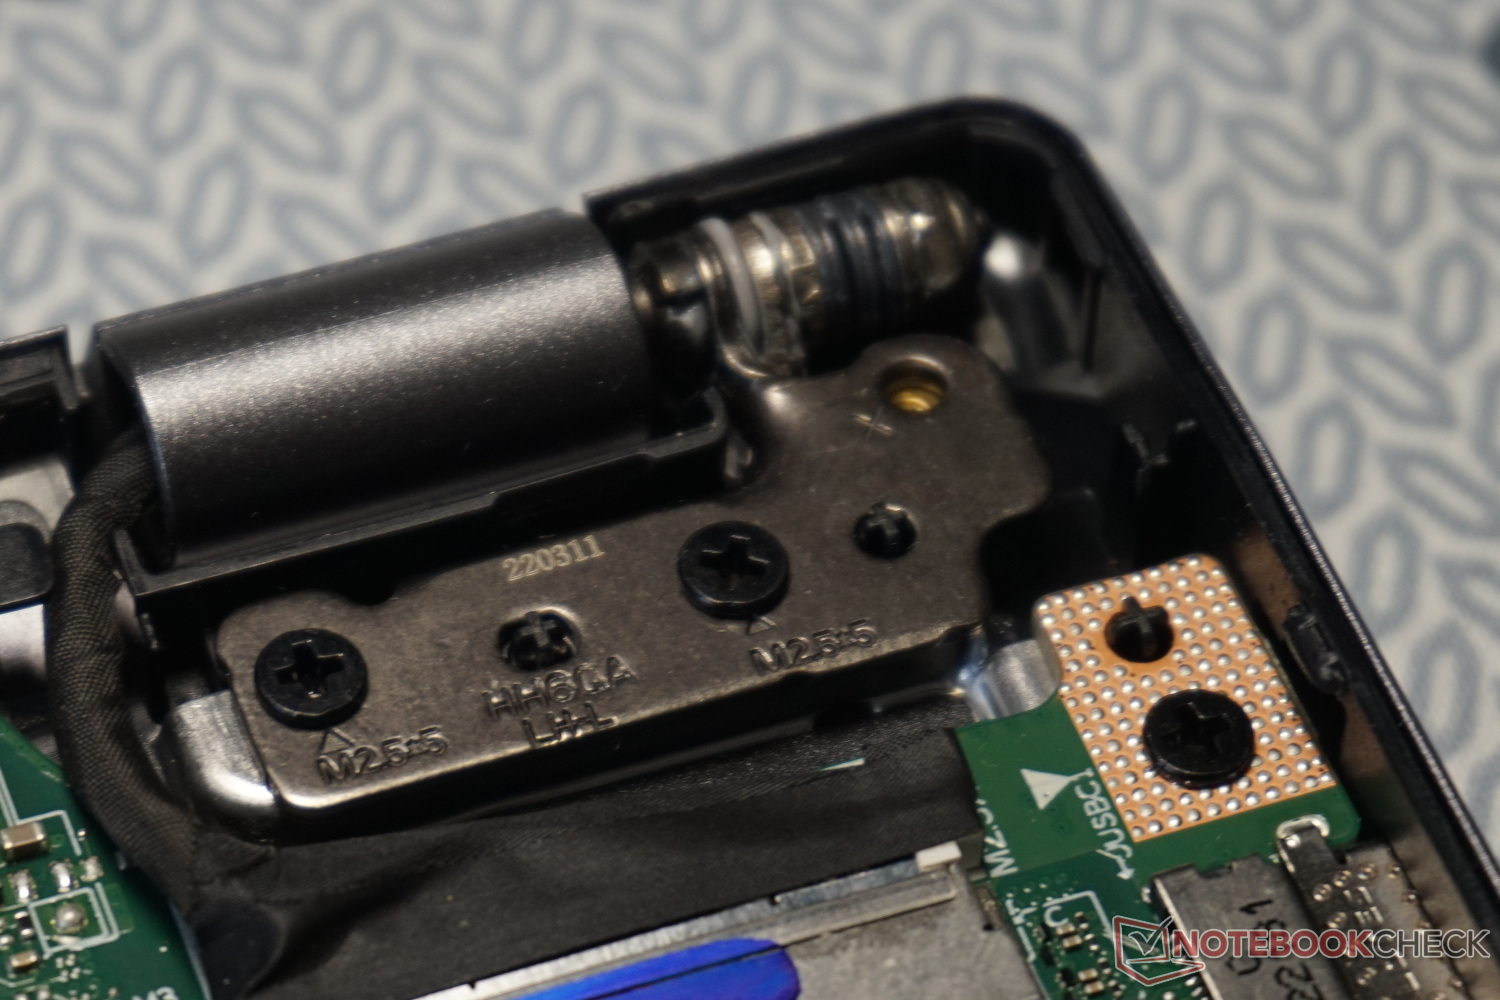
铰链和它们的螺丝连接有点太精致了。在其他更昂贵的笔记本电脑中,这个问题以更广泛的方式得到解决,因此也更稳定。
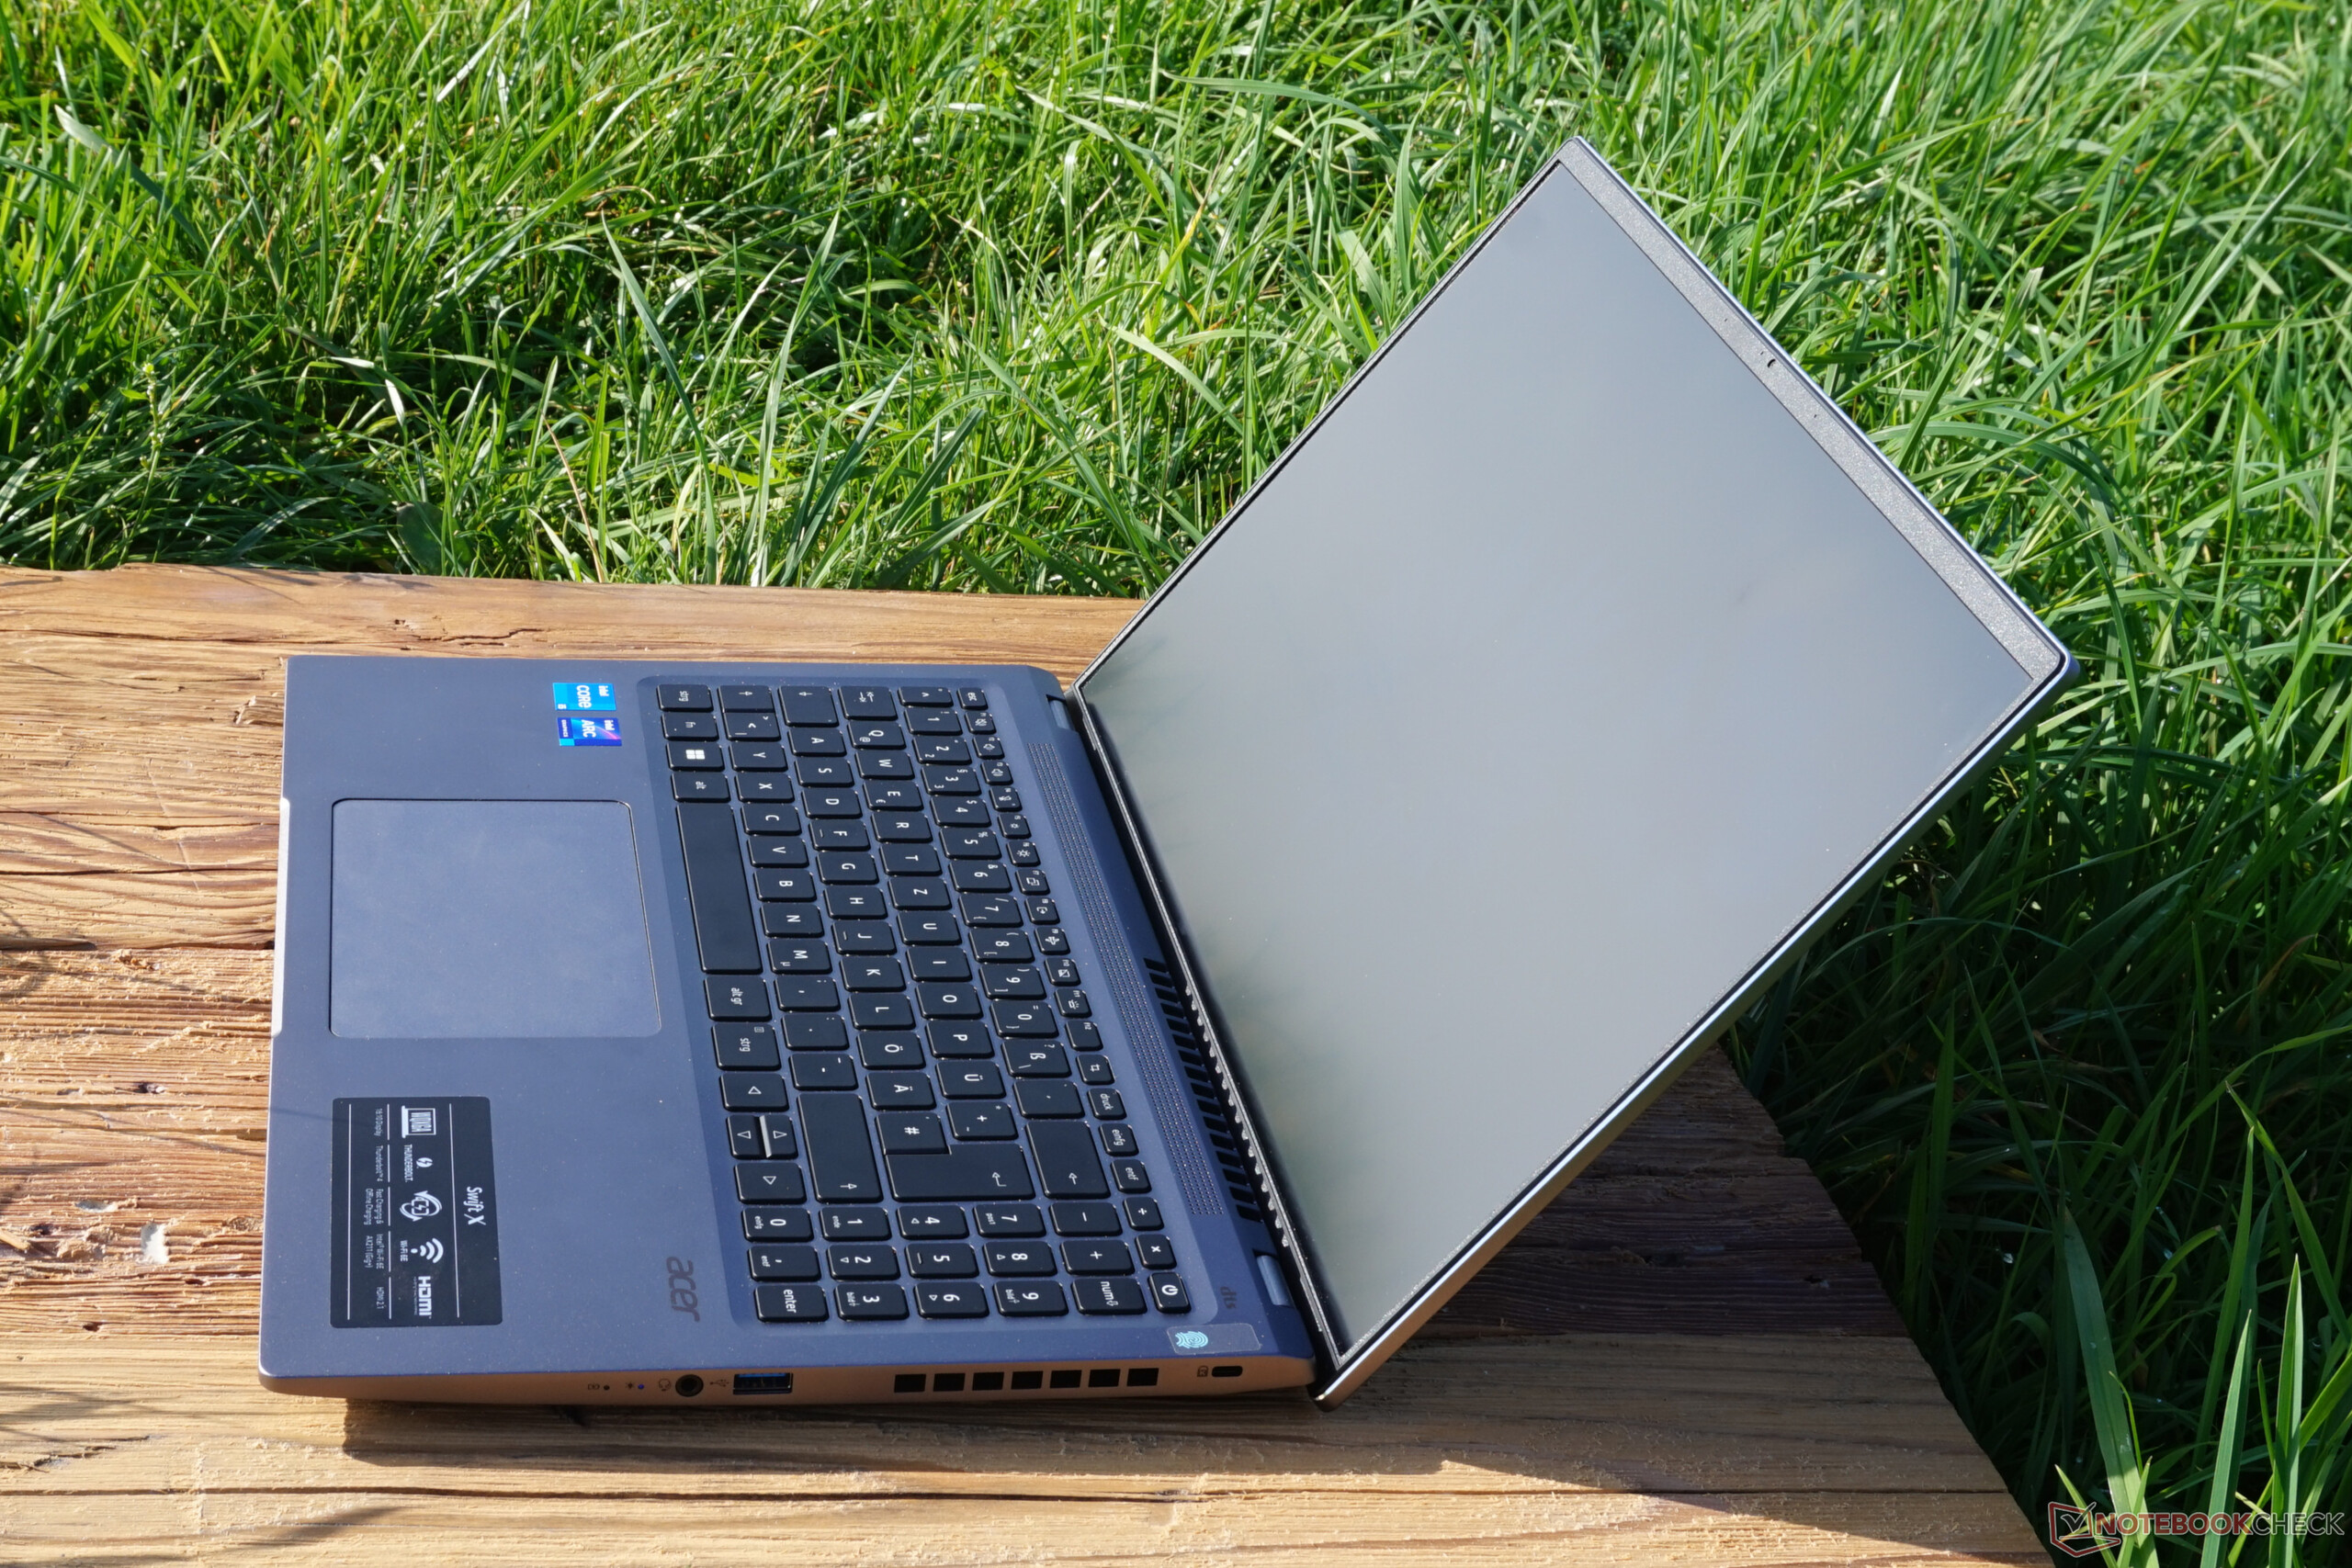
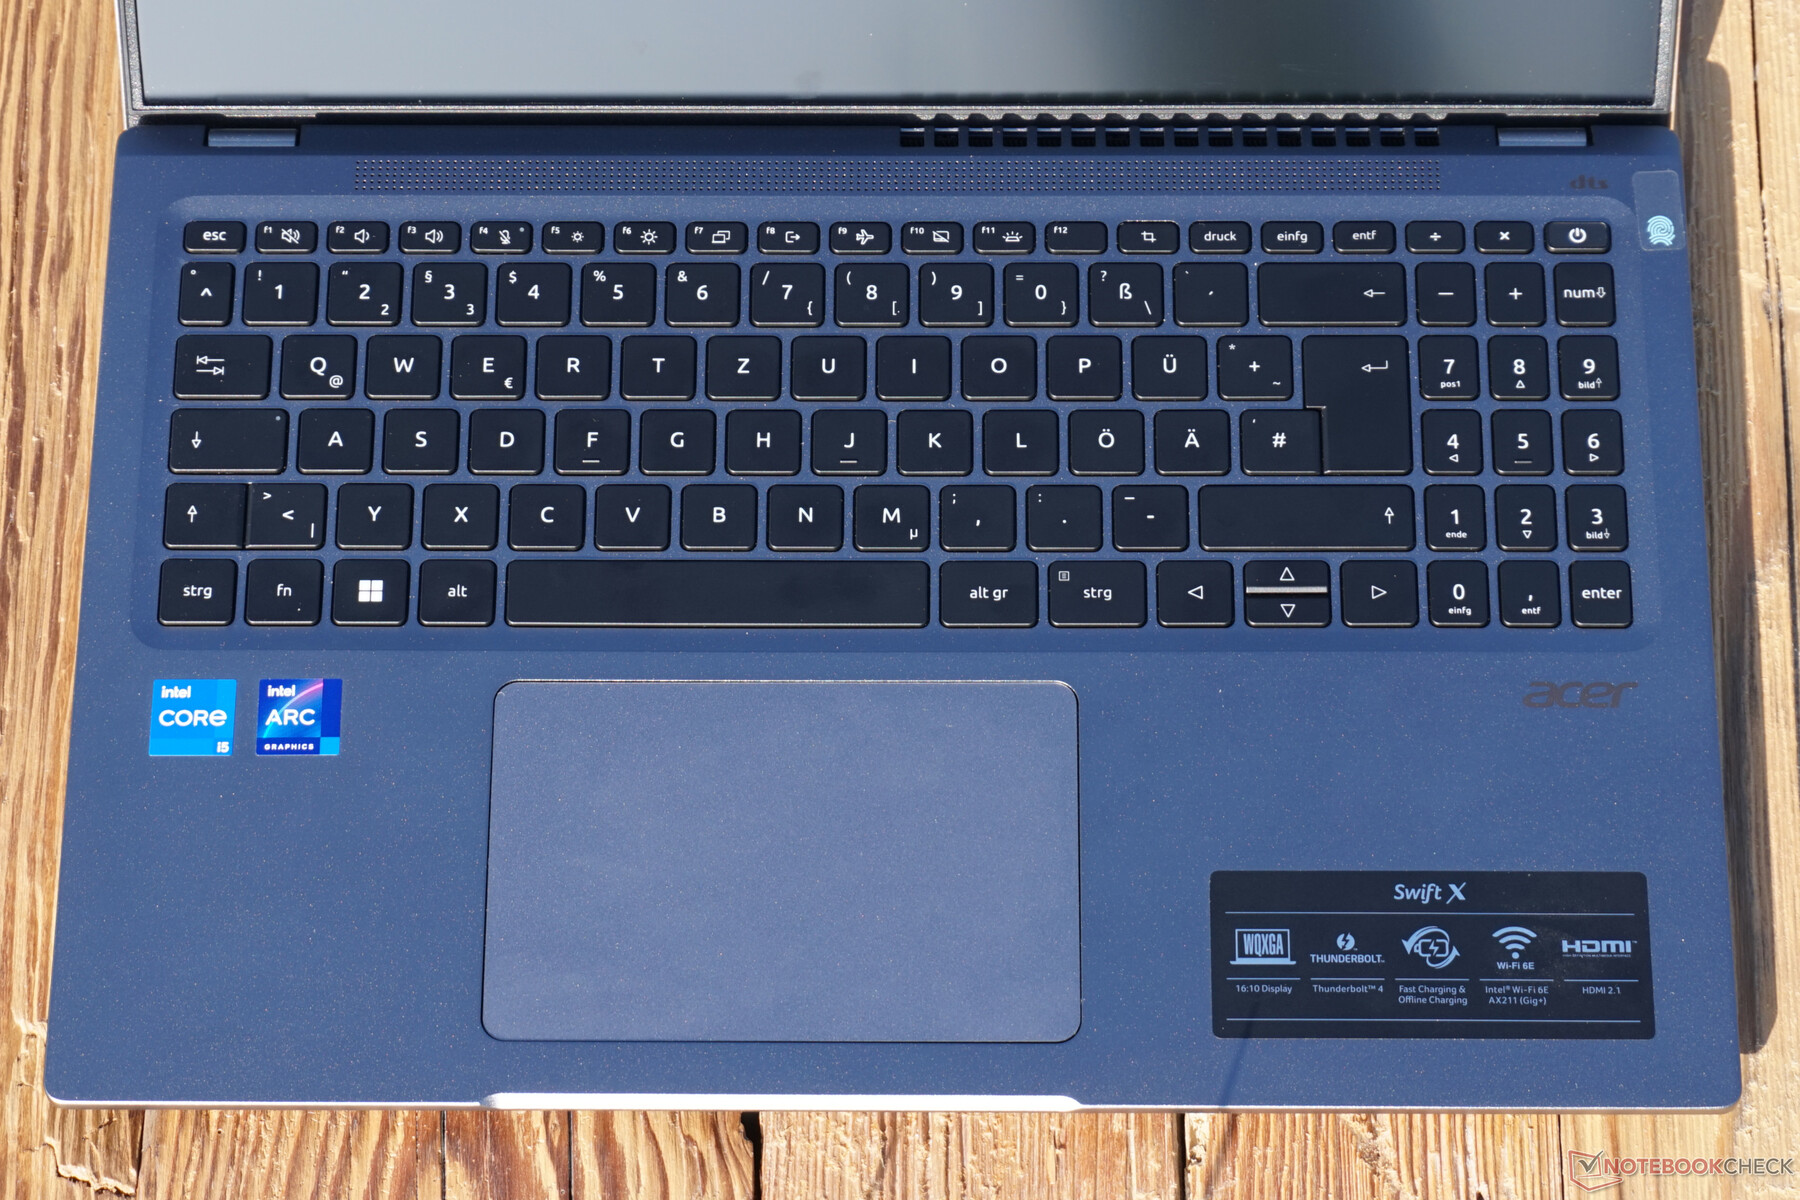
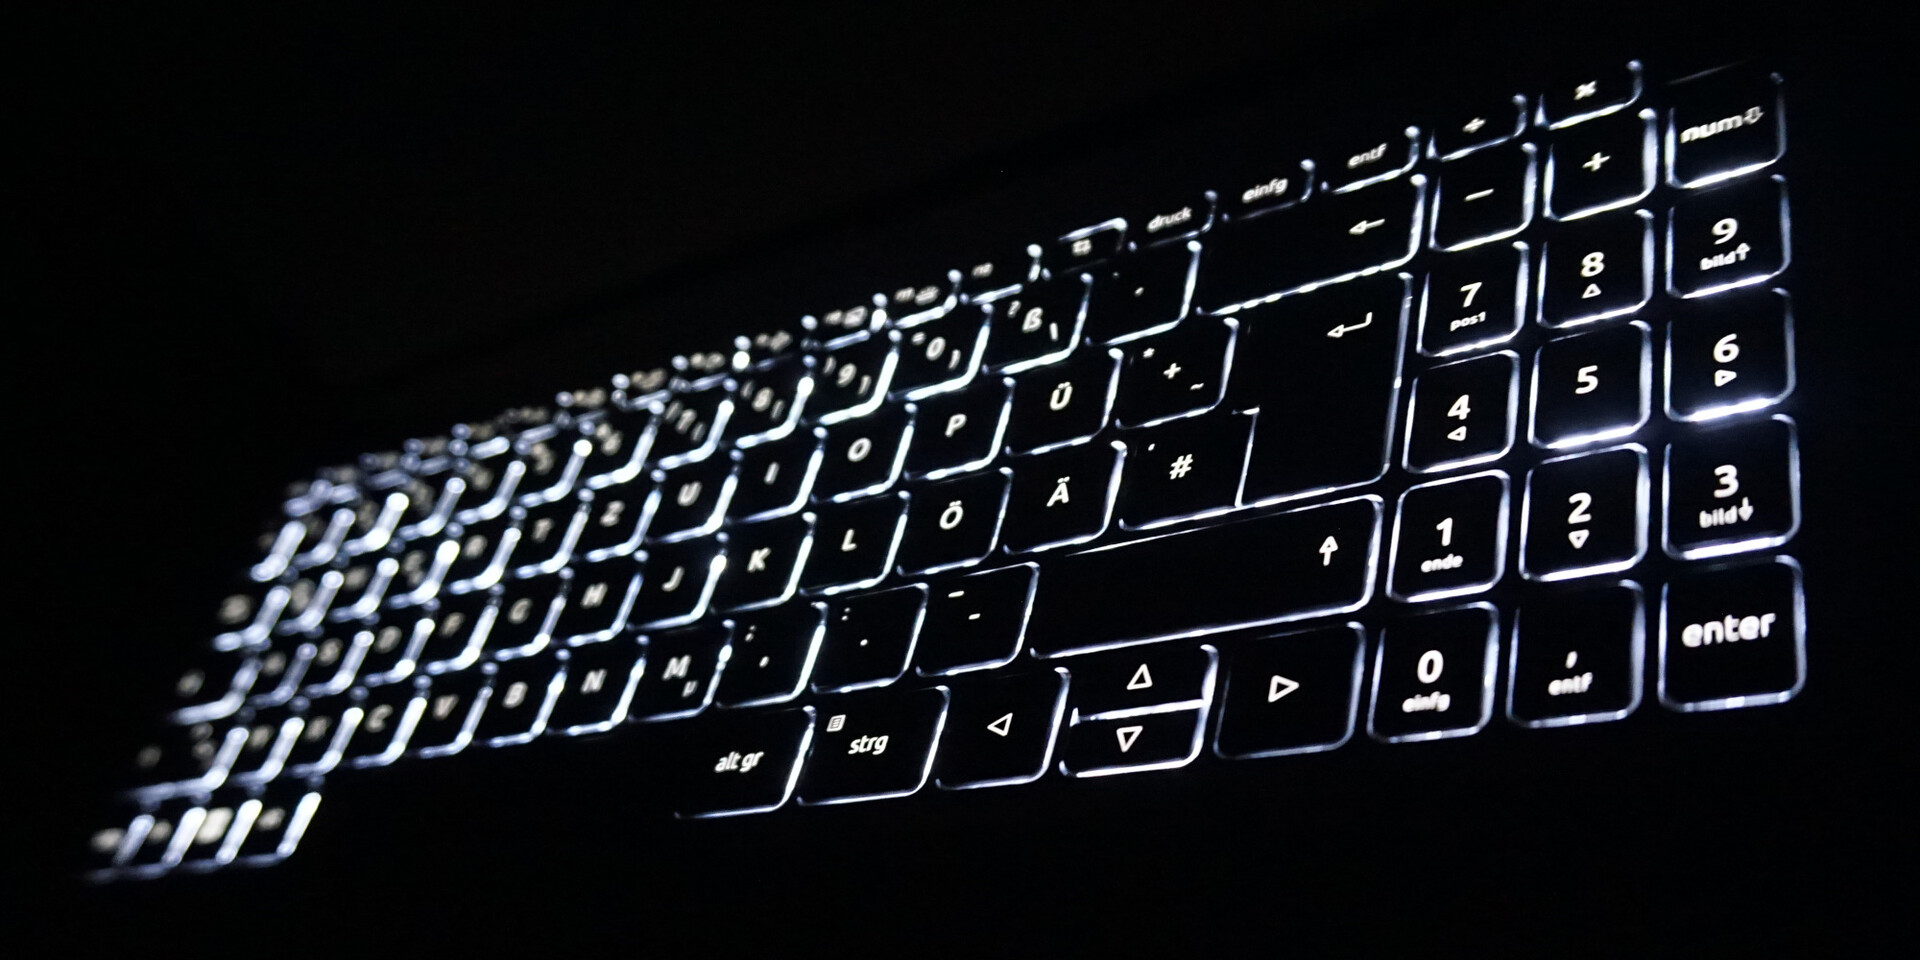
输入设备--宏碁笔记本专注于简单性
标准尺寸的Chiclet键盘很容易打字,而且相应的速度也很快。反压力也控制得很好。另一方面,键盘的行程很短,只有1毫米。随着时间的推移,如果你习惯于在大键盘上打字,这可能会变得不舒服。
底下的触摸板尺寸很实用,即使用几个手指也能精确而流畅地操作。另一方面,隐藏在下部区域的按键似乎很僵硬。
显示屏 - 宏碁Swift X的高分辨率和精确显示


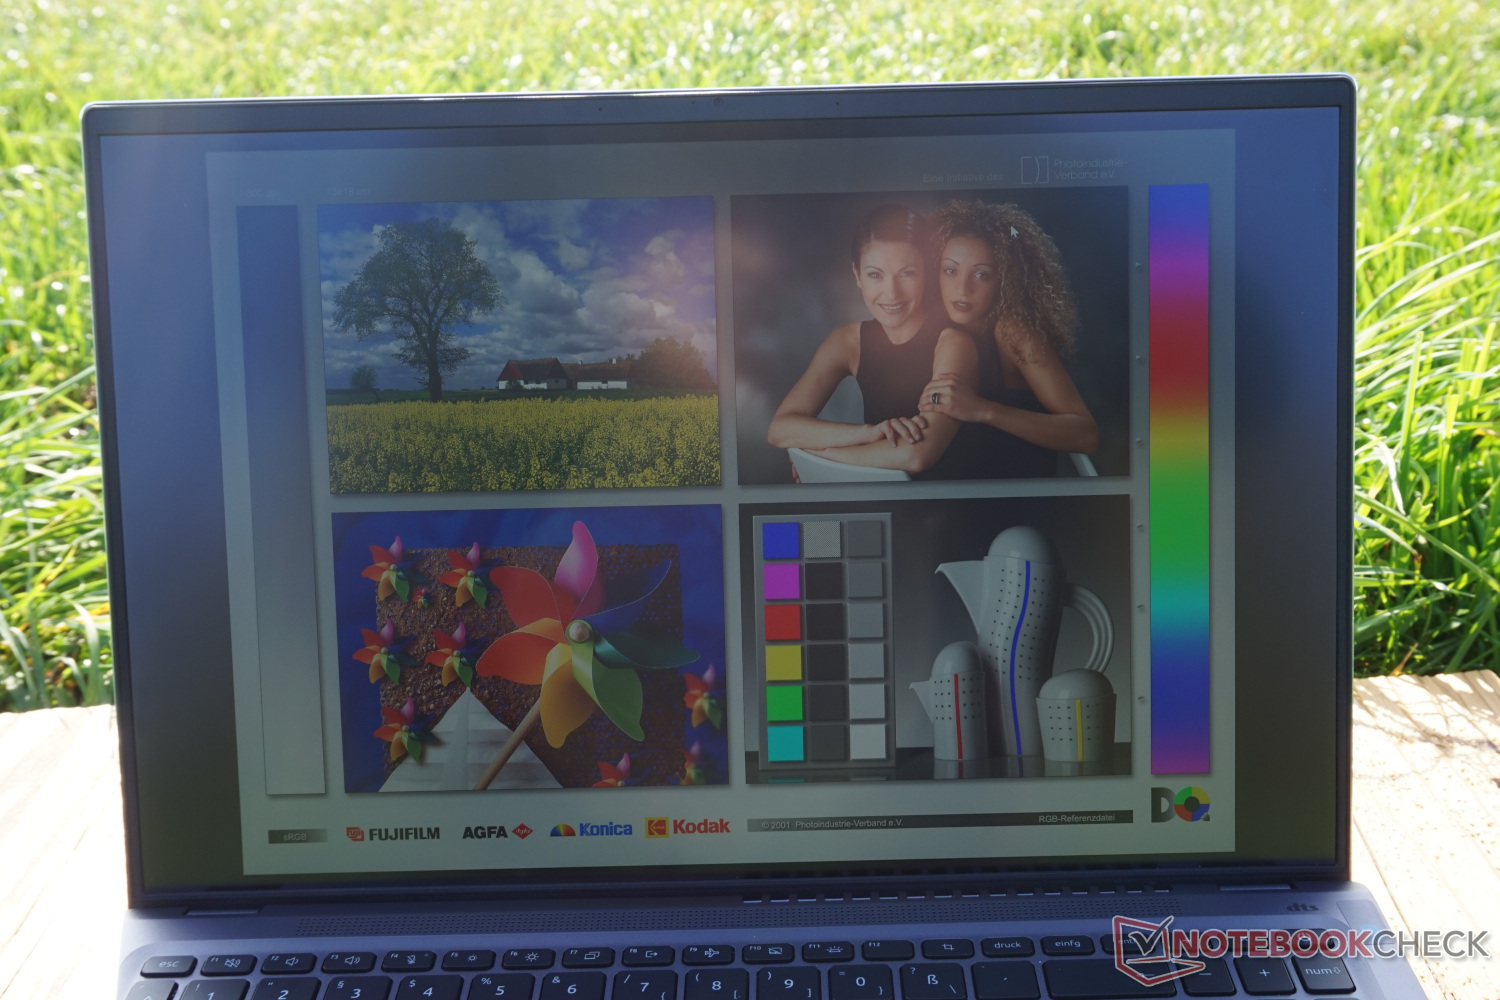
哑光屏幕提供了2,560×1,600像素的连贯分辨率,最适合用于编辑数码照片等方面。另一方面,对于正常的阅读、写作和浏览,应遵守150%的建议放大率。否则,几乎看不到任何东西。16:10的长宽比也是面向媒体设计的。这为典型的16:9镜头上方和下方的按钮留下了空间。
400cd/m²的最大亮度只在显示器的中心达到,但整体画面很明亮,也有一个体面的对比度值。总的来说,图像值几乎完全对应于一个坚实的、绝非杰出的多媒体笔记本所能期望的。
屏幕出血在所有四个角落都是可以感觉到的,但只有在显示内容非常暗、环境也很暗的情况下才会令人讨厌。
| |||||||||||||||||||||||||
Brightness Distribution: 81 %
Center on Battery: 316 cd/m²
Contrast: 1393:1 (Black: 0.295 cd/m²)
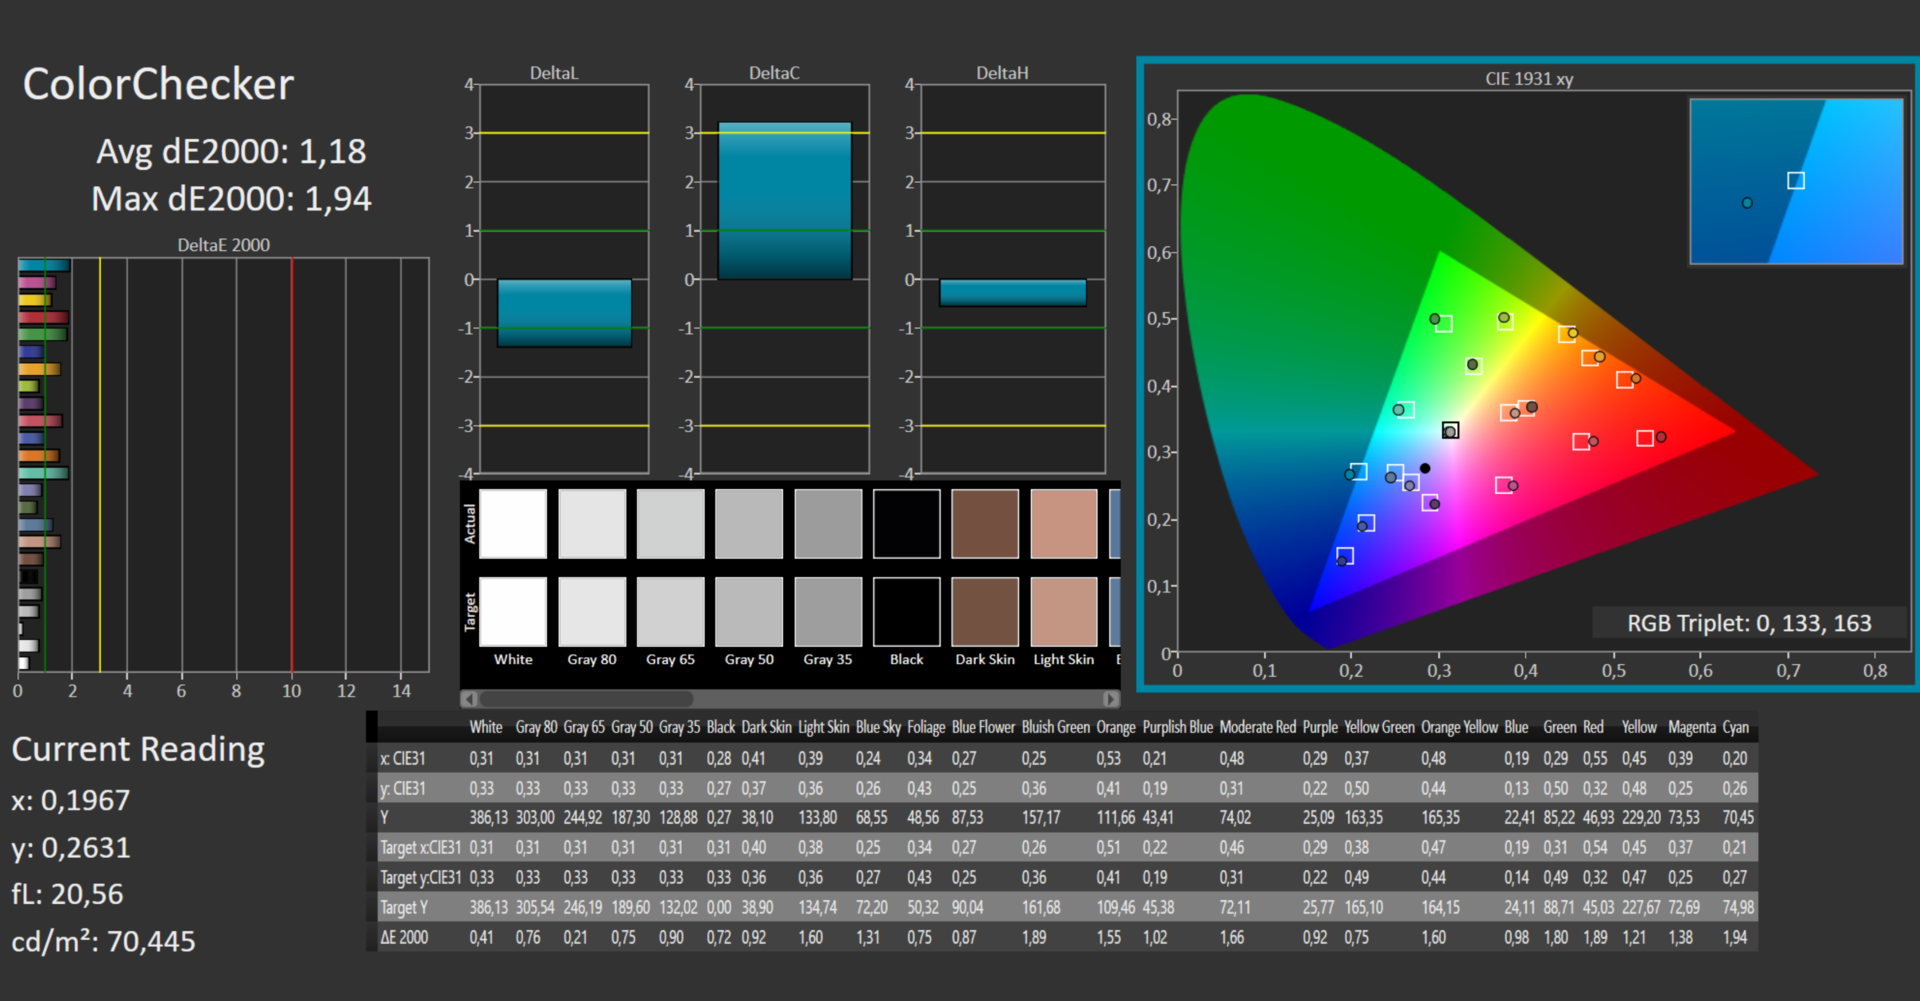
ΔE ColorChecker Calman: 1.73 | ∀{0.5-29.43 Ø4.71}
calibrated: 1.18
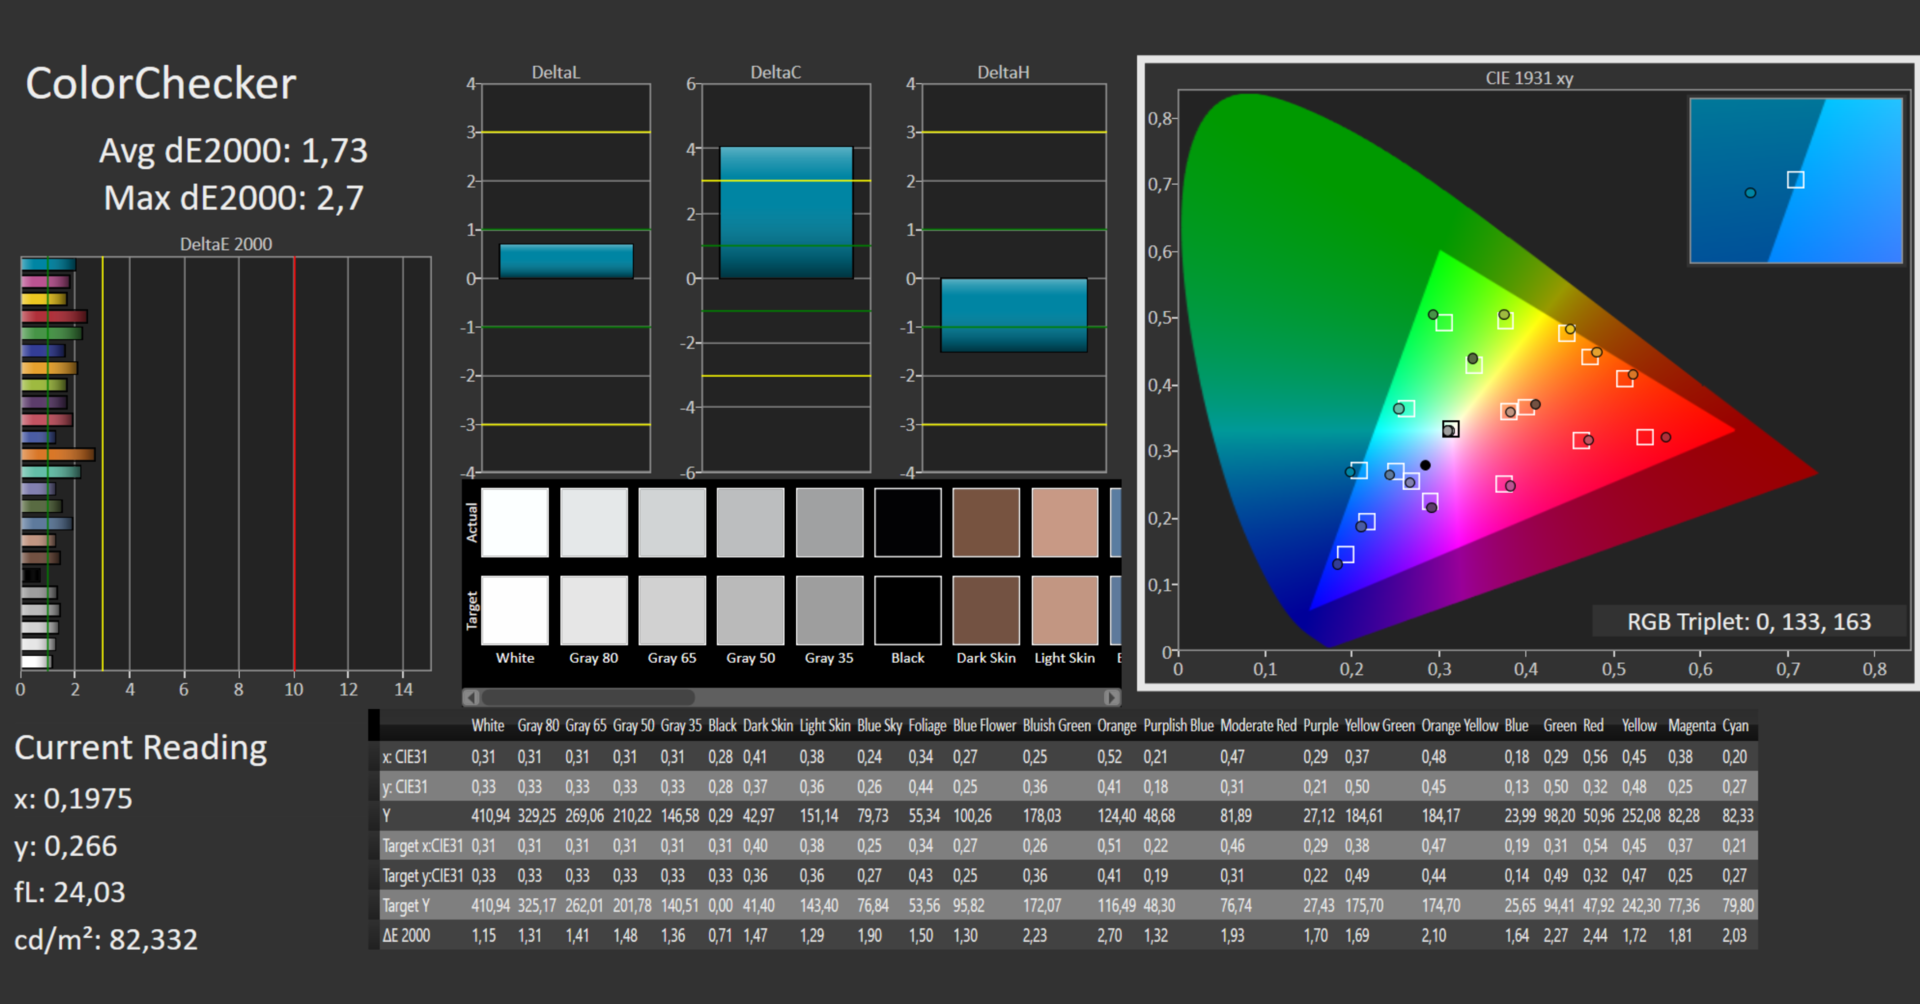
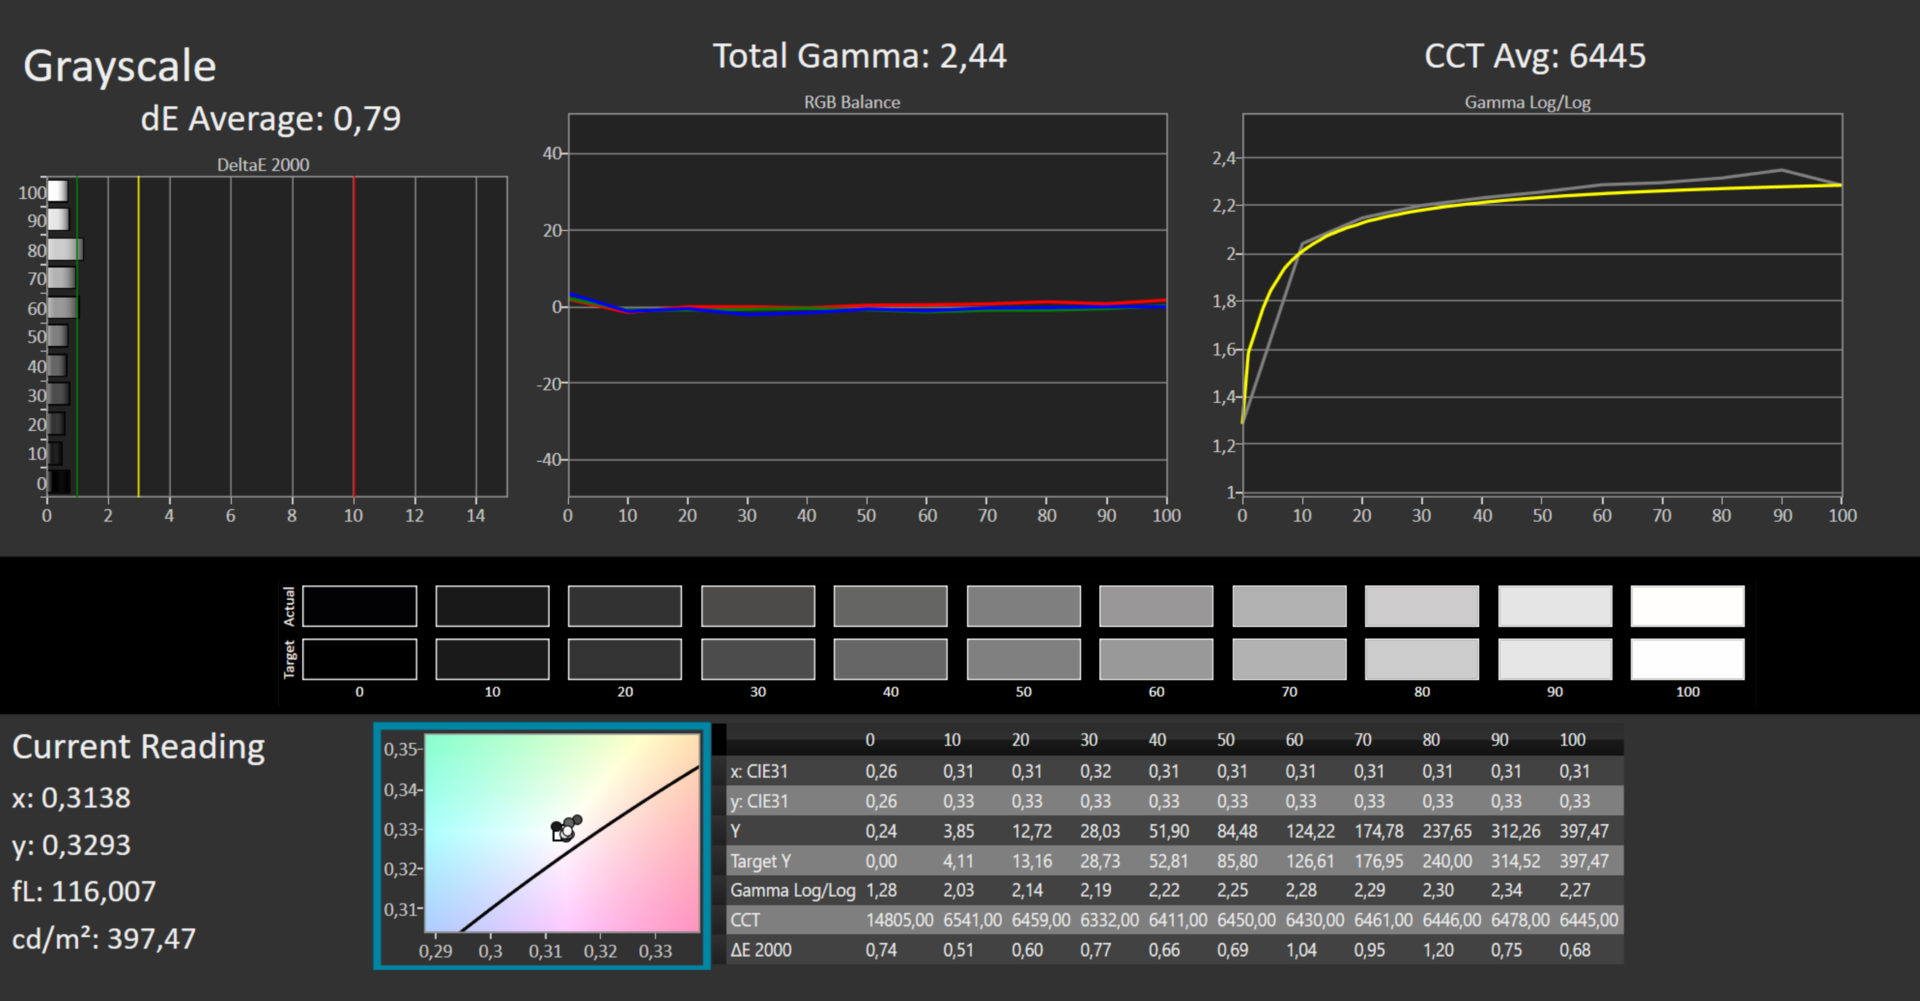
ΔE Greyscale Calman: 1.26 | ∀{0.09-98 Ø4.96}
76.51% AdobeRGB 1998 (Argyll 3D)
100% sRGB (Argyll 3D)
75.75% Display P3 (Argyll 3D)
Gamma: 2.35
CCT: 6616 K
| Acer Swift X SFX16-52G-52VE AU Optronics AUOBD9E, , 2560x1600, 16" | Acer Aspire 5 A515-57G-53N8 CMN N156HCA-EAB, IPS, 1920x1080, 15.6" | Lenovo ThinkPad T16 G1 21BWS00200 B160UAN01.K, IPS, 1920x1200, 16" | Asus ZenBook Flip 15 Q539ZD Samsung ATNA56AC01-0, OLED, 2880x1620, 15.6" | Lenovo IdeaPad Gaming 3 15IAH7 Lenovo LEN156FHD, IPS, 1920x1080, 15.6" | HP Omen 16-c0077ng BOE09E5, IPS, 2560x1440, 16.1" | Lenovo ThinkBook 16 G4+ IAP LEN160WQXGA, IPS, 2560x1600, 16" | |
|---|---|---|---|---|---|---|---|
| Display | -40% | 4% | 20% | -6% | -6% | -5% | |
| Display P3 Coverage (%) | 75.75 | 43.3 -43% | 80.1 6% | 99.8 32% | 69.1 -9% | 68.8 -9% | 69.6 -8% |
| sRGB Coverage (%) | 100 | 65 -35% | 100 0% | 100 0% | 99.2 -1% | 96.9 -3% | 97.5 -2% |
| AdobeRGB 1998 Coverage (%) | 76.51 | 44.8 -41% | 80.5 5% | 97.5 27% | 69.9 -9% | 71.1 -7% | 71.7 -6% |
| Response Times | -25% | 11% | 96% | 56% | 51% | 4% | |
| Response Time Grey 50% / Grey 80% * (ms) | 37 ? | 35.6 ? 4% | 27 ? 27% | 0.8 ? 98% | 13 ? 65% | 13 ? 65% | 32.7 ? 12% |
| Response Time Black / White * (ms) | 16 ? | 24.5 ? -53% | 17 ? -6% | 1.1 ? 93% | 8.4 ? 47% | 10 ? 37% | 16.8 ? -5% |
| PWM Frequency (Hz) | 240.4 ? | ||||||
| Screen | -116% | -79% | -35% | -70% | -76% | -31% | |
| Brightness middle (cd/m²) | 411 | 250 -39% | 404 -2% | 340.1 -17% | 338 -18% | 297 -28% | 371 -10% |
| Brightness (cd/m²) | 364 | 234 -36% | 391 7% | 344 -5% | 329 -10% | 283 -22% | 357 -2% |
| Brightness Distribution (%) | 81 | 79 -2% | 80 -1% | 97 20% | 92 14% | 91 12% | 91 12% |
| Black Level * (cd/m²) | 0.295 | 0.19 36% | 0.29 2% | 0.27 8% | 0.22 25% | 0.23 22% | |
| Contrast (:1) | 1393 | 1316 -6% | 1393 0% | 1252 -10% | 1350 -3% | 1613 16% | |
| Colorchecker dE 2000 * | 1.73 | 3.94 -128% | 3.9 -125% | 2.47 -43% | 2.88 -66% | 3.25 -88% | 2.6 -50% |
| Colorchecker dE 2000 max. * | 2.7 | 16.73 -520% | 8.5 -215% | 5.96 -121% | 9.35 -246% | 6.33 -134% | 4.4 -63% |
| Colorchecker dE 2000 calibrated * | 1.18 | 3.09 -162% | 1.7 -44% | 1.22 -3% | 1.11 6% | 1.3 -10% | |
| Greyscale dE 2000 * | 1.26 | 3.6 -186% | 5.4 -329% | 1.8 -43% | 5 -297% | 6.97 -453% | 3.7 -194% |
| Gamma | 2.35 94% | 2.081 106% | 2.21 100% | 2.2 100% | 2.162 102% | 2.3 96% | 2.32 95% |
| CCT | 6616 98% | 6476 100% | 6242 104% | 6346 102% | 7497 87% | 6050 107% | 7271 89% |
| Total Average (Program / Settings) | -60% /
-87% | -21% /
-48% | 27% /
4% | -7% /
-38% | -10% /
-43% | -11% /
-21% |
* ... smaller is better
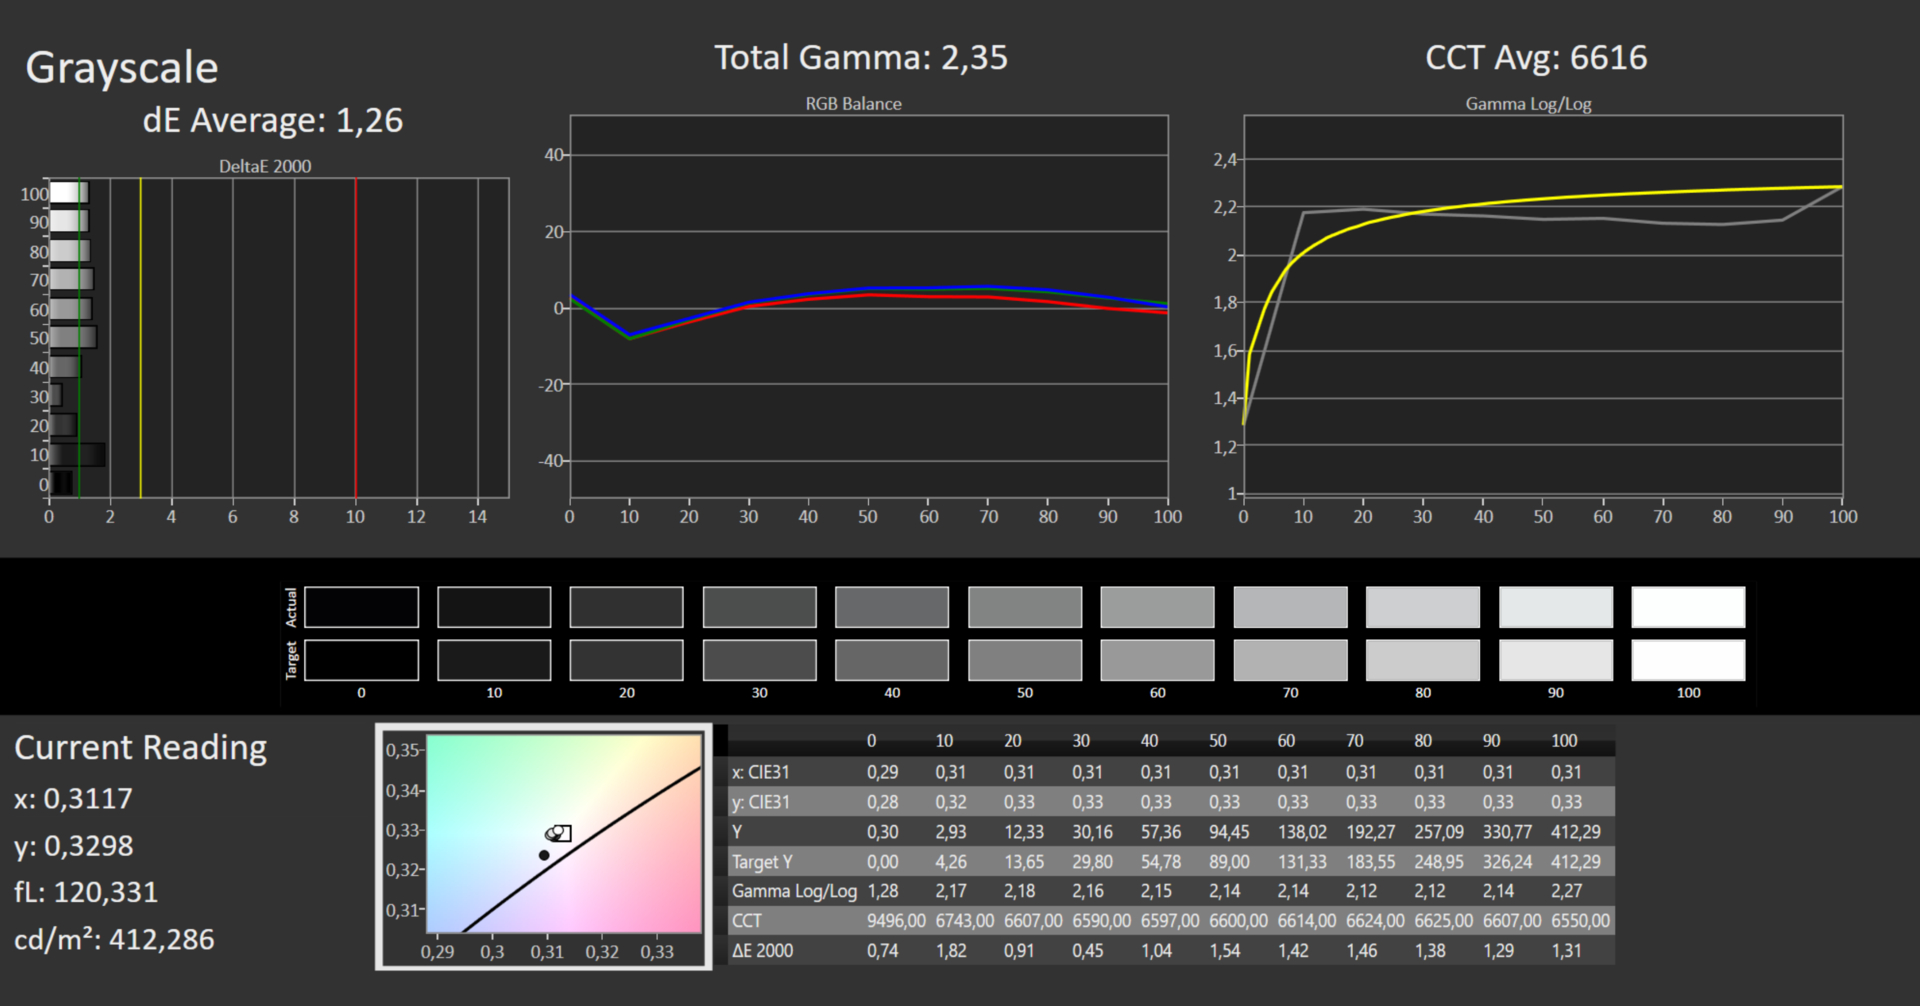
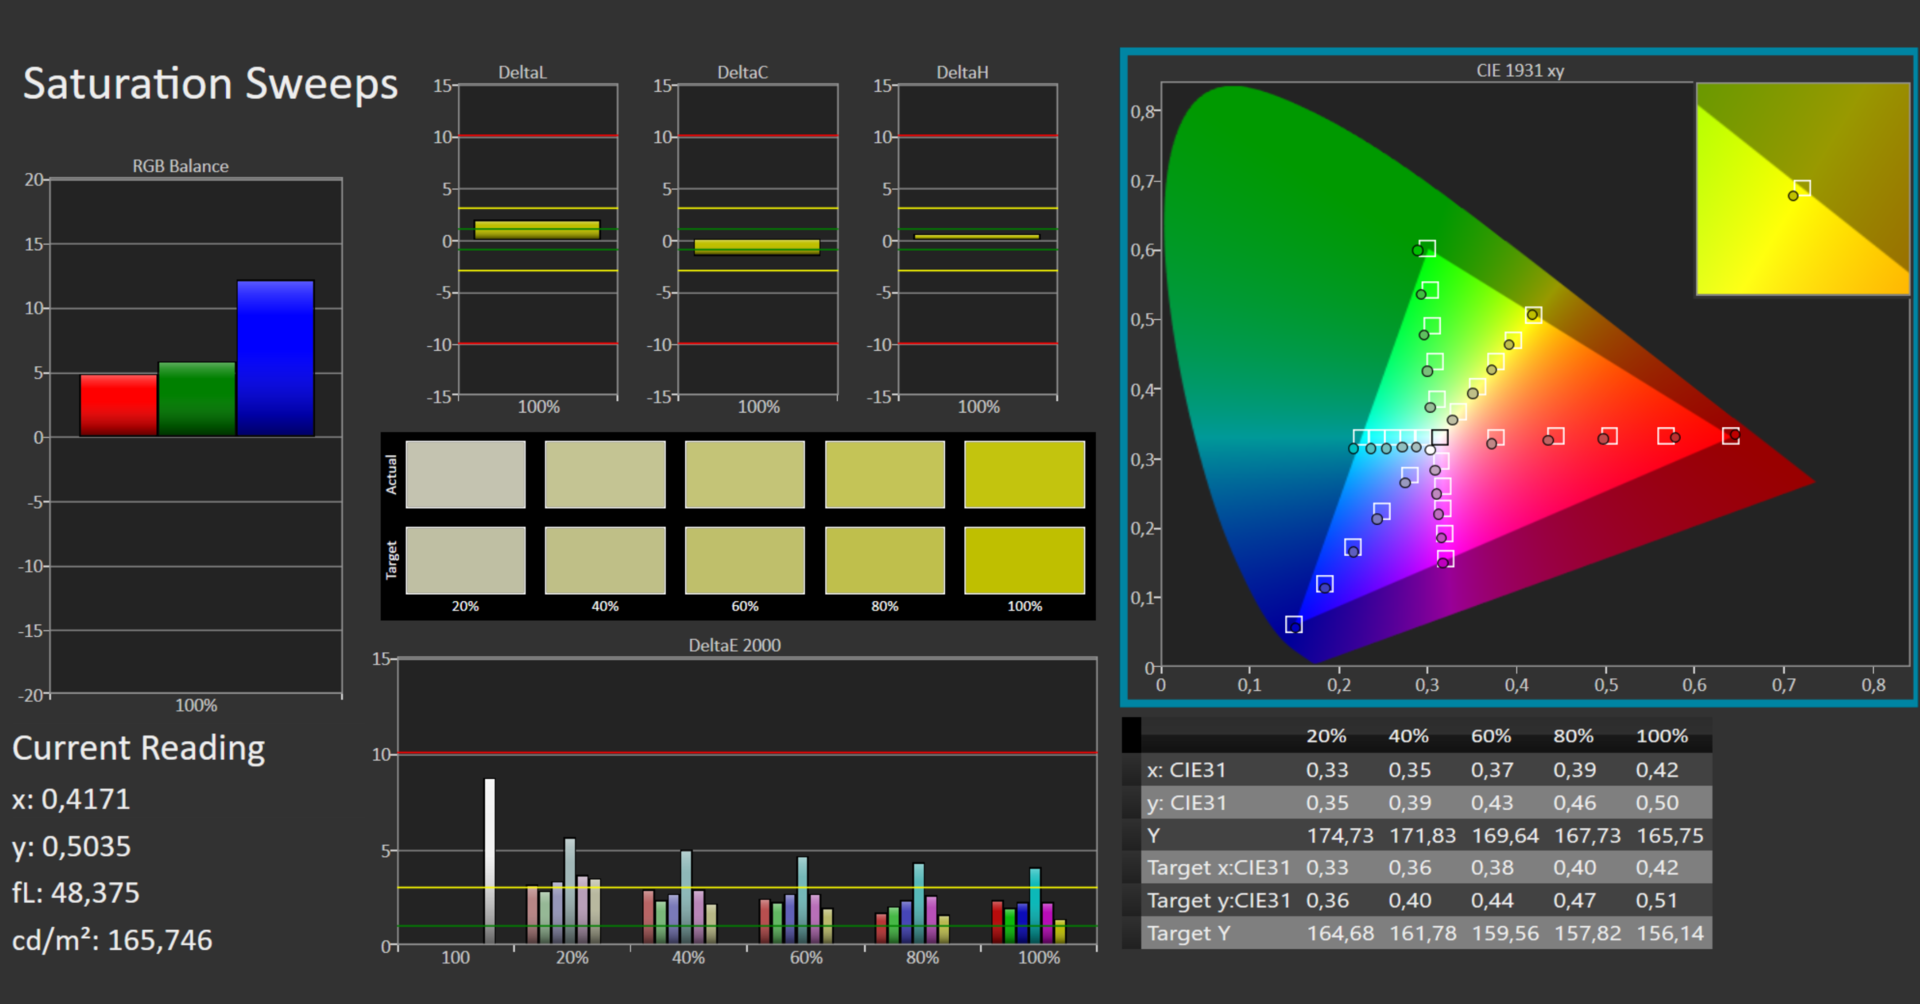
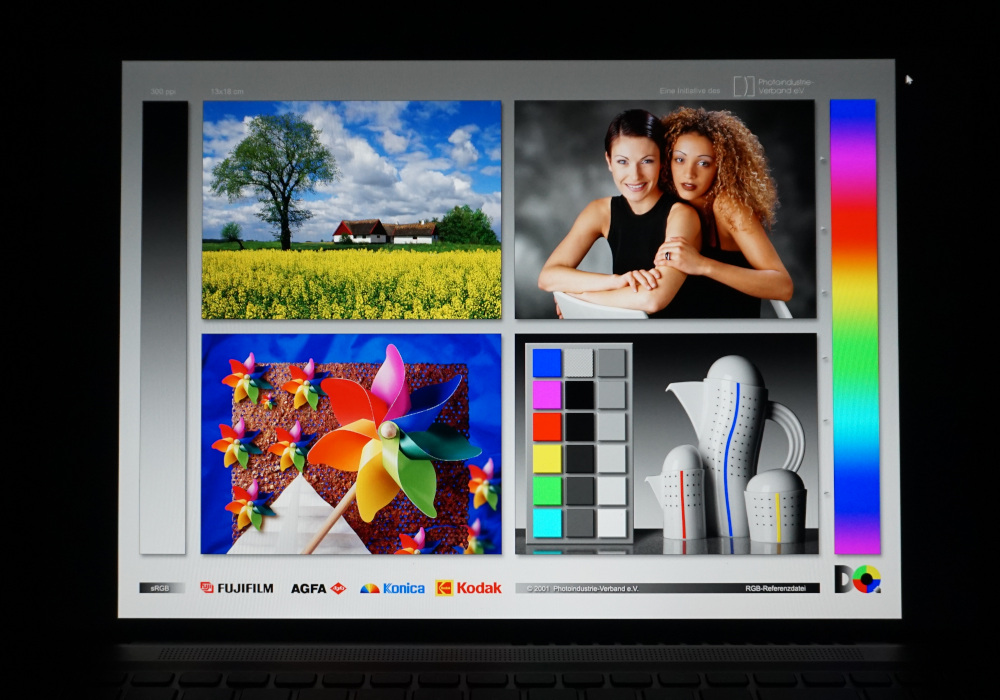
宏碁宣传Swift X具有100%的sRGB覆盖率,并能兑现这一承诺。另一方面,像AdobeRGB或DCI-P3这样较大的色彩空间并没有完全覆盖。例如,这对专业摄影师来说是不够的。然而,它应该能满足所有其他用户。
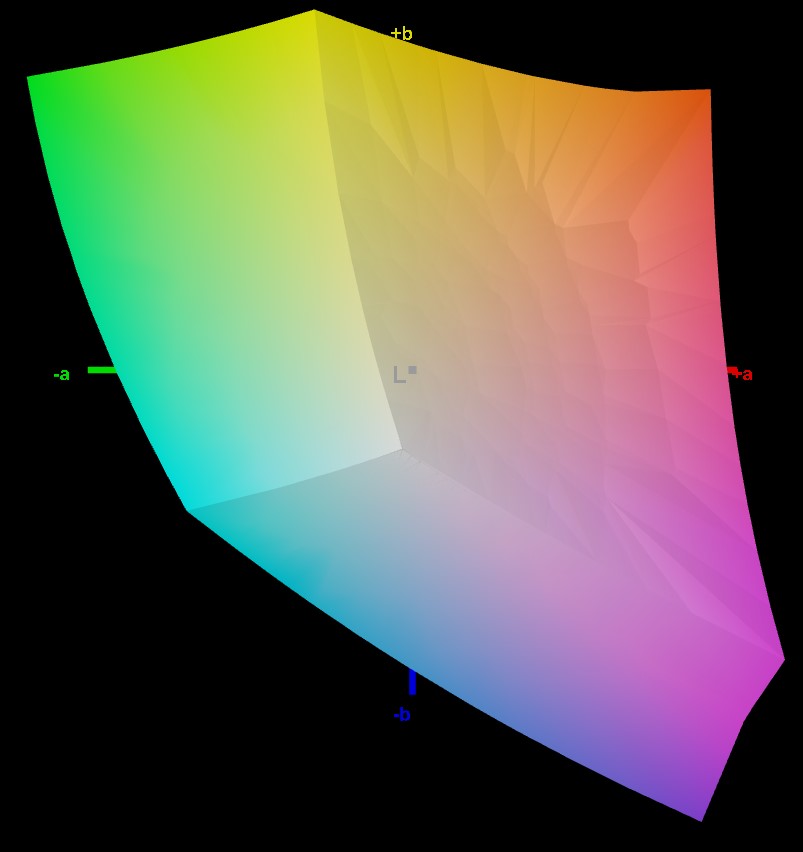
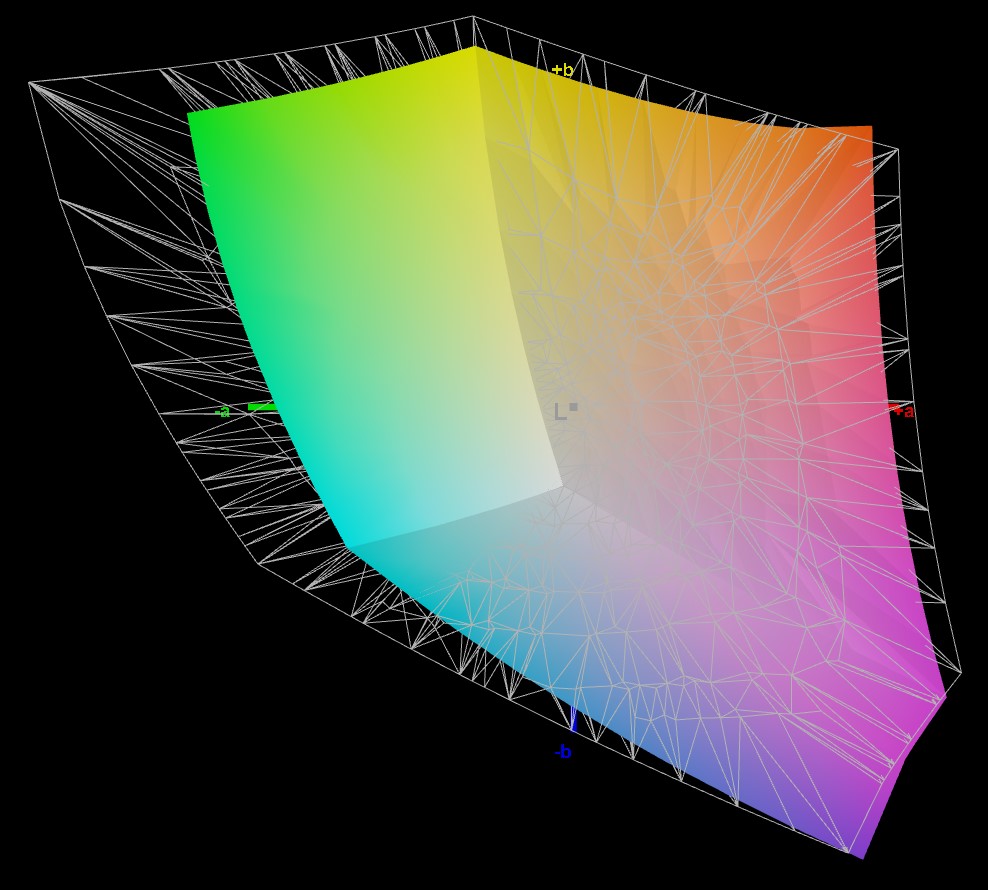
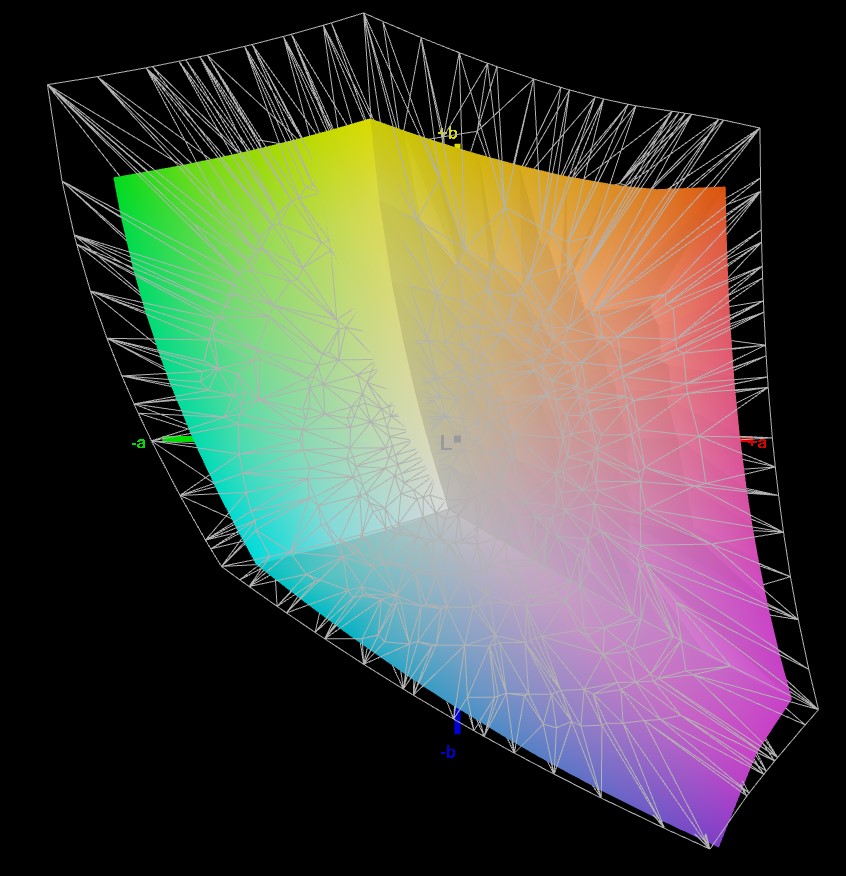
即使是原始显示器也几乎没有显示任何颜色偏差。测得的最高2.7的DeltaE不能真正用肉眼确定。事实上,校准将这个值降低到2以下。因此,色彩再现等级是非常好的。相应的配置文件可以在显示值的区域下面下载
Display Response Times
| ↔ Response Time Black to White | ||
|---|---|---|
| 16 ms ... rise ↗ and fall ↘ combined | ↗ 6 ms rise |  |
| ↘ 10 ms fall | ||
| The screen shows good response rates in our tests, but may be too slow for competitive gamers. In comparison, all tested devices range from 0.1 (minimum) to 240 (maximum) ms. » 37 % of all devices are better. This means that the measured response time is better than the average of all tested devices (19.8 ms). | ||
| ↔ Response Time 50% Grey to 80% Grey | ||
| 37 ms ... rise ↗ and fall ↘ combined | ↗ 17 ms rise |  |
| ↘ 20 ms fall | ||
| The screen shows slow response rates in our tests and will be unsatisfactory for gamers. In comparison, all tested devices range from 0.165 (minimum) to 636 (maximum) ms. » 53 % of all devices are better. This means that the measured response time is worse than the average of all tested devices (31 ms). | ||
Screen Flickering / PWM (Pulse-Width Modulation)
| Screen flickering / PWM not detected |  | ||
In comparison: 52 % of all tested devices do not use PWM to dim the display. If PWM was detected, an average of 7757 (minimum: 5 - maximum: 343500) Hz was measured. | |||
屏幕亮度还不错,但仍不足以在阳光下使用笔记本电脑。原因之一是亮度从400cd/m²大幅降低到300cd/m²。在阳光下,仍然可以很好地看到内容。颜色也不会显得苍白或失真。如果你想在户外阴凉的地方工作,你应该不会遇到任何问题。
在Windows设置中可以选择更高的显示亮度,但这是以牺牲电池寿命为代价的,从我们的角度来看,回报甚微。
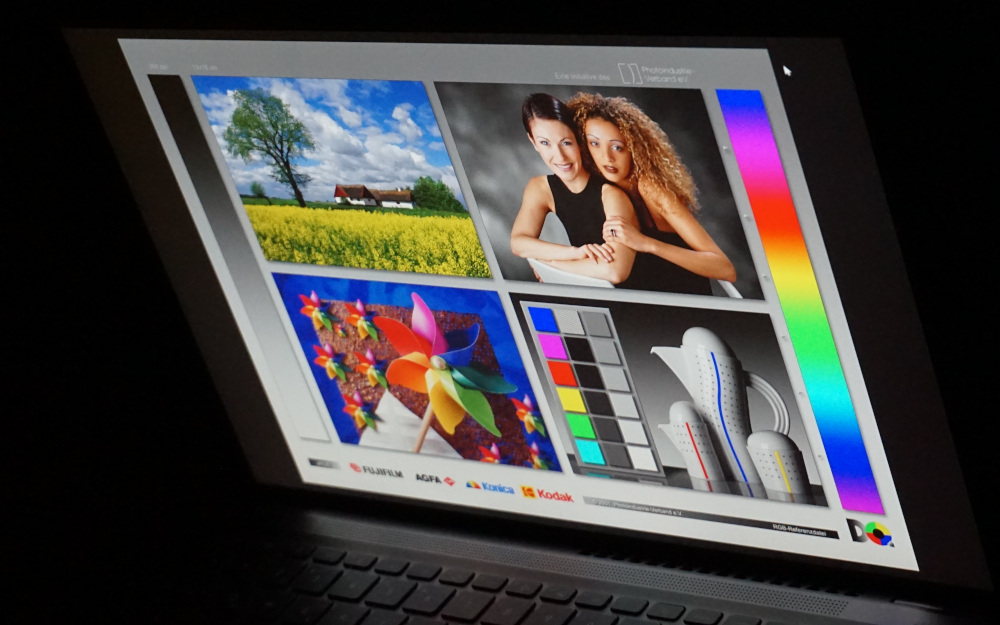
无论选择何种视角,IPS面板既不显示颜色变化,也不显示亮度减弱。然而,考虑到图像技术,你会期待这种情况的出现。

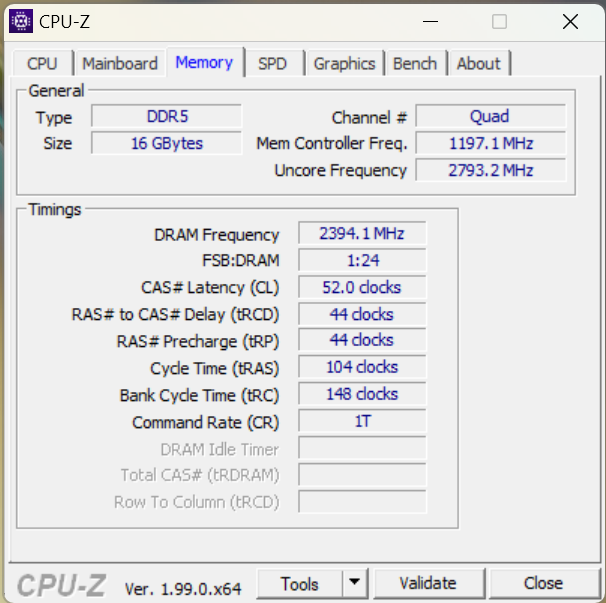
性能 - 英特尔Arc和i-Core调整得很好
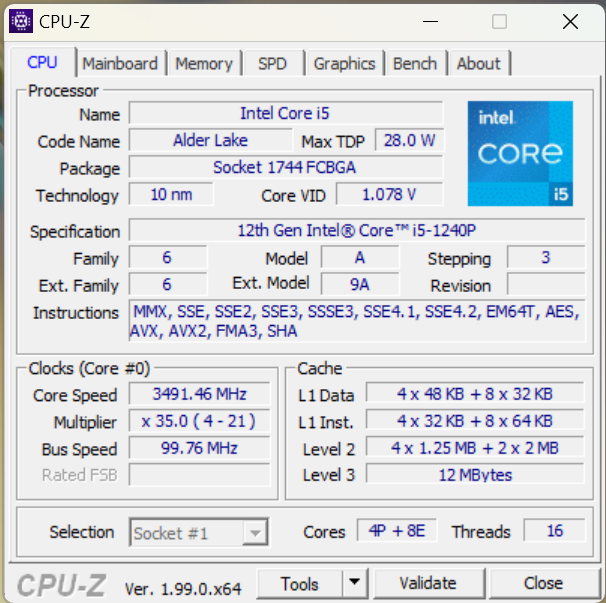
笔记本电脑英特尔酷睿i5-1240P处理器和 英特尔A370M是最先进的。两者的共同点是,它们的特点是效率高而不是性能值特别高。
这样一来,这款笔记本电脑将主要以高速、低耗电的方式处理日常任务。图形性能主要面向图像和视频编辑。游戏也可以玩,但在细节和分辨率方面有严格的限制。
测试条件
如果你在寻找多功能的定制选项,你将会徒劳地寻找。该处理器的功耗在节能模式和电池模式下都没有限制。然而,像往常一样,在没有电源连接的情况下,最大时钟频率会下降,这在一定程度上降低了性能。
我们在 "最佳性能 "设置下进行了所有性能和基准测试。另一方面,电池寿命是以 "最佳能效 "进行测试的。作为一项规则,Windows会自动选择这些设置。
处理器
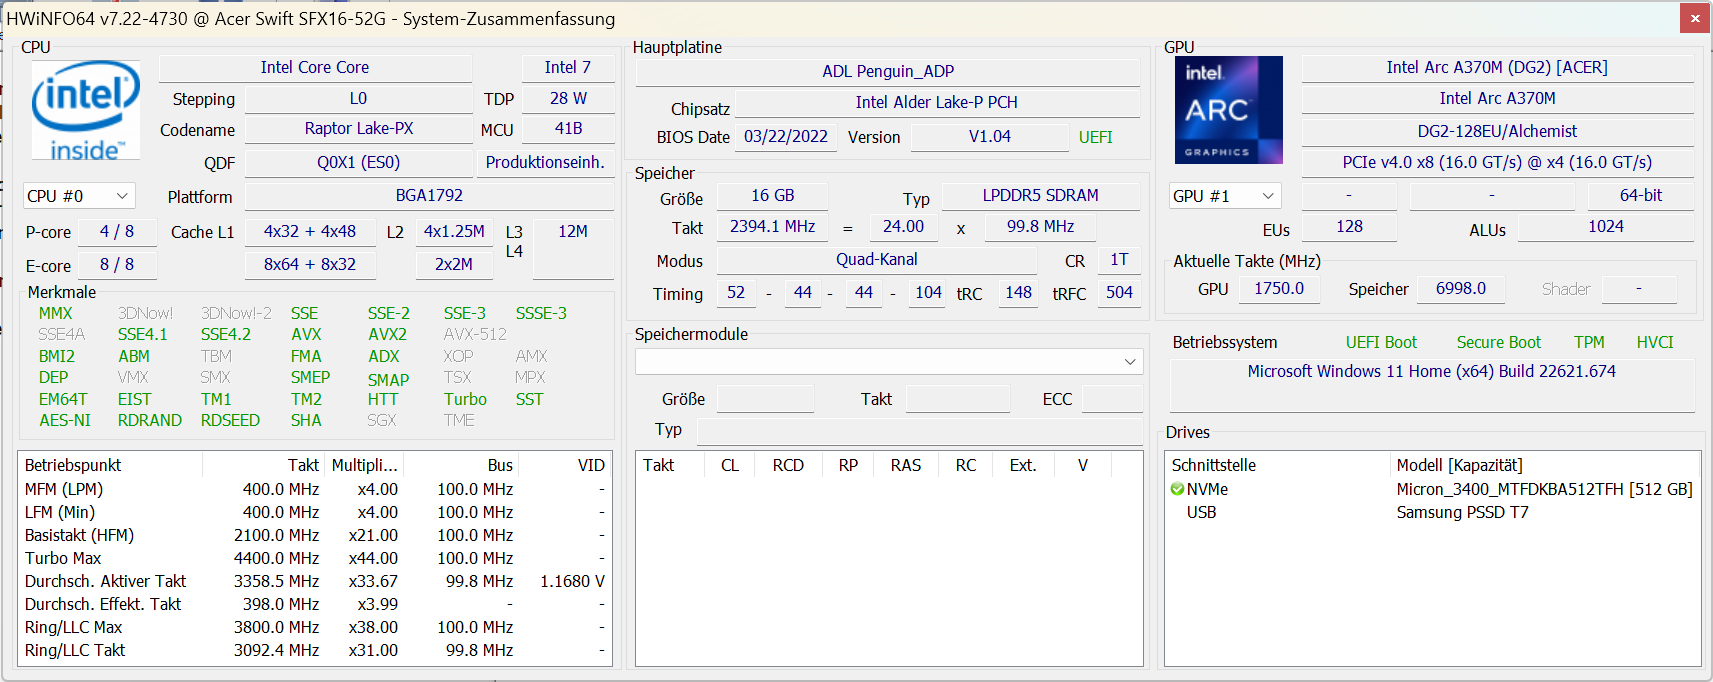
ǞǞǞ英特尔酷睿i5-1240P拥有12个内核和16个线程,是一款中端处理器。它不保证有过强的计算能力,但在操作上仍然很经济。宏碁Swift X SFX16-52G被设定为在一分钟内消耗35W,如果它需要执行更长的时间。它甚至在几分之一秒的时间内都是64W。在电池模式下也有很大一部分功率。看一下PCMark10就可以看出这一点。这些数值只比连接电源时的最高性能低了不到20%。
总的来说,其性能几乎没有在类似装备的笔记本中脱颖而出。相比之下,联想ThinkPad T16 G1的轻微优势是联想ThinkPad T16 G1的轻微优势,很可能是由独立的显卡造成的。与上一代英特尔处理器相比,性能的飞跃可以在Cinebench循环中清楚地观察到,它反映了纯粹的计算能力,使用的是 i7-1165G7作为例子。
其他基准和性能值可在我们的CPU基准测试列表。

Cinebench R15 Multi endurance test
Cinebench R23: Multi Core | Single Core
Cinebench R20: CPU (Multi Core) | CPU (Single Core)
Cinebench R15: CPU Multi 64Bit | CPU Single 64Bit
Blender: v2.79 BMW27 CPU
7-Zip 18.03: 7z b 4 | 7z b 4 -mmt1
Geekbench 5.5: Multi-Core | Single-Core
HWBOT x265 Benchmark v2.2: 4k Preset
LibreOffice : 20 Documents To PDF
R Benchmark 2.5: Overall mean
| CPU Performance rating | |
| Average of class Multimedia | |
| Lenovo ThinkBook 16 G4+ IAP | |
| Asus ZenBook Flip 15 Q539ZD | |
| Lenovo IdeaPad Gaming 3 15IAH7 | |
| Acer Swift X SFX16-52G-52VE | |
| Acer Aspire 5 A515-57G-53N8 | |
| HP Omen 16-c0077ng -1! | |
| Lenovo ThinkPad T16 G1 21BWS00200 | |
| Average Intel Core i5-1240P | |
| Cinebench R23 / Multi Core | |
| Average of class Multimedia (4861 - 33362, n=74, last 2 years) | |
| Lenovo ThinkBook 16 G4+ IAP | |
| Asus ZenBook Flip 15 Q539ZD | |
| Lenovo IdeaPad Gaming 3 15IAH7 | |
| HP Omen 16-c0077ng | |
| Acer Swift X SFX16-52G-52VE | |
| Acer Aspire 5 A515-57G-53N8 | |
| Average Intel Core i5-1240P (277 - 11556, n=20) | |
| Lenovo ThinkPad T16 G1 21BWS00200 | |
| Cinebench R23 / Single Core | |
| Average of class Multimedia (1128 - 2459, n=66, last 2 years) | |
| Lenovo ThinkBook 16 G4+ IAP | |
| Asus ZenBook Flip 15 Q539ZD | |
| Acer Aspire 5 A515-57G-53N8 | |
| Lenovo IdeaPad Gaming 3 15IAH7 | |
| Lenovo ThinkPad T16 G1 21BWS00200 | |
| Acer Swift X SFX16-52G-52VE | |
| Average Intel Core i5-1240P (640 - 1689, n=18) | |
| HP Omen 16-c0077ng | |
| Cinebench R20 / CPU (Multi Core) | |
| Average of class Multimedia (1887 - 12912, n=57, last 2 years) | |
| Lenovo ThinkBook 16 G4+ IAP | |
| Asus ZenBook Flip 15 Q539ZD | |
| Lenovo IdeaPad Gaming 3 15IAH7 | |
| HP Omen 16-c0077ng | |
| Acer Swift X SFX16-52G-52VE | |
| Acer Aspire 5 A515-57G-53N8 | |
| Average Intel Core i5-1240P (763 - 4456, n=16) | |
| Lenovo ThinkPad T16 G1 21BWS00200 | |
| Cinebench R20 / CPU (Single Core) | |
| Average of class Multimedia (425 - 853, n=57, last 2 years) | |
| Lenovo ThinkBook 16 G4+ IAP | |
| Asus ZenBook Flip 15 Q539ZD | |
| Lenovo IdeaPad Gaming 3 15IAH7 | |
| Acer Aspire 5 A515-57G-53N8 | |
| Acer Swift X SFX16-52G-52VE | |
| Lenovo ThinkPad T16 G1 21BWS00200 | |
| HP Omen 16-c0077ng | |
| Average Intel Core i5-1240P (251 - 653, n=16) | |
| Cinebench R15 / CPU Multi 64Bit | |
| Average of class Multimedia (856 - 5224, n=61, last 2 years) | |
| Lenovo ThinkBook 16 G4+ IAP | |
| Lenovo IdeaPad Gaming 3 15IAH7 | |
| Asus ZenBook Flip 15 Q539ZD | |
| HP Omen 16-c0077ng | |
| Acer Swift X SFX16-52G-52VE | |
| Lenovo ThinkPad T16 G1 21BWS00200 | |
| Lenovo ThinkPad T16 G1 21BWS00200 | |
| Acer Aspire 5 A515-57G-53N8 | |
| Average Intel Core i5-1240P (407 - 2007, n=19) | |
| Cinebench R15 / CPU Single 64Bit | |
| Average of class Multimedia (184.8 - 326, n=59, last 2 years) | |
| Lenovo ThinkBook 16 G4+ IAP | |
| Asus ZenBook Flip 15 Q539ZD | |
| Lenovo IdeaPad Gaming 3 15IAH7 | |
| Acer Aspire 5 A515-57G-53N8 | |
| Acer Swift X SFX16-52G-52VE | |
| HP Omen 16-c0077ng | |
| Lenovo ThinkPad T16 G1 21BWS00200 | |
| Average Intel Core i5-1240P (91.8 - 243, n=18) | |
| Blender / v2.79 BMW27 CPU | |
| Average Intel Core i5-1240P (285 - 1926, n=16) | |
| Lenovo ThinkPad T16 G1 21BWS00200 | |
| Acer Aspire 5 A515-57G-53N8 | |
| Acer Swift X SFX16-52G-52VE | |
| HP Omen 16-c0077ng | |
| Average of class Multimedia (100 - 557, n=58, last 2 years) | |
| Lenovo IdeaPad Gaming 3 15IAH7 | |
| Lenovo ThinkBook 16 G4+ IAP | |
| Asus ZenBook Flip 15 Q539ZD | |
| 7-Zip 18.03 / 7z b 4 | |
| Lenovo ThinkBook 16 G4+ IAP | |
| Asus ZenBook Flip 15 Q539ZD | |
| Average of class Multimedia (26062 - 130368, n=55, last 2 years) | |
| Acer Swift X SFX16-52G-52VE | |
| Lenovo IdeaPad Gaming 3 15IAH7 | |
| Acer Aspire 5 A515-57G-53N8 | |
| Average Intel Core i5-1240P (7254 - 47002, n=16) | |
| Lenovo ThinkPad T16 G1 21BWS00200 | |
| 7-Zip 18.03 / 7z b 4 -mmt1 | |
| Average of class Multimedia (3666 - 7545, n=56, last 2 years) | |
| Lenovo ThinkBook 16 G4+ IAP | |
| Asus ZenBook Flip 15 Q539ZD | |
| Lenovo IdeaPad Gaming 3 15IAH7 | |
| HP Omen 16-c0077ng | |
| Acer Aspire 5 A515-57G-53N8 | |
| Acer Swift X SFX16-52G-52VE | |
| Lenovo ThinkPad T16 G1 21BWS00200 | |
| Average Intel Core i5-1240P (2197 - 5320, n=16) | |
| Geekbench 5.5 / Multi-Core | |
| Average of class Multimedia (4652 - 20422, n=56, last 2 years) | |
| Asus ZenBook Flip 15 Q539ZD | |
| Lenovo ThinkBook 16 G4+ IAP | |
| Acer Swift X SFX16-52G-52VE | |
| Acer Aspire 5 A515-57G-53N8 | |
| Lenovo IdeaPad Gaming 3 15IAH7 | |
| Average Intel Core i5-1240P (1763 - 10112, n=15) | |
| HP Omen 16-c0077ng | |
| Lenovo ThinkPad T16 G1 21BWS00200 | |
| Geekbench 5.5 / Single-Core | |
| Average of class Multimedia (805 - 2974, n=56, last 2 years) | |
| Lenovo ThinkBook 16 G4+ IAP | |
| Asus ZenBook Flip 15 Q539ZD | |
| Acer Swift X SFX16-52G-52VE | |
| Acer Aspire 5 A515-57G-53N8 | |
| Lenovo IdeaPad Gaming 3 15IAH7 | |
| Lenovo ThinkPad T16 G1 21BWS00200 | |
| Average Intel Core i5-1240P (672 - 1658, n=15) | |
| HP Omen 16-c0077ng | |
| HWBOT x265 Benchmark v2.2 / 4k Preset | |
| Average of class Multimedia (5.26 - 36.1, n=56, last 2 years) | |
| Lenovo ThinkBook 16 G4+ IAP | |
| Asus ZenBook Flip 15 Q539ZD | |
| Lenovo IdeaPad Gaming 3 15IAH7 | |
| HP Omen 16-c0077ng | |
| Acer Swift X SFX16-52G-52VE | |
| Acer Aspire 5 A515-57G-53N8 | |
| Average Intel Core i5-1240P (1.99 - 12.9, n=16) | |
| Lenovo ThinkPad T16 G1 21BWS00200 | |
| LibreOffice / 20 Documents To PDF | |
| HP Omen 16-c0077ng | |
| Average Intel Core i5-1240P (46.4 - 120.5, n=16) | |
| Acer Aspire 5 A515-57G-53N8 | |
| Average of class Multimedia (23.9 - 146.7, n=57, last 2 years) | |
| Lenovo IdeaPad Gaming 3 15IAH7 | |
| Lenovo ThinkPad T16 G1 21BWS00200 | |
| Acer Swift X SFX16-52G-52VE | |
| Asus ZenBook Flip 15 Q539ZD | |
| Lenovo ThinkBook 16 G4+ IAP | |
| R Benchmark 2.5 / Overall mean | |
| Average Intel Core i5-1240P (0.4987 - 1.236, n=16) | |
| Acer Swift X SFX16-52G-52VE | |
| Lenovo ThinkPad T16 G1 21BWS00200 | |
| HP Omen 16-c0077ng | |
| Lenovo IdeaPad Gaming 3 15IAH7 | |
| Acer Aspire 5 A515-57G-53N8 | |
| Average of class Multimedia (0.3604 - 0.947, n=56, last 2 years) | |
| Lenovo ThinkBook 16 G4+ IAP | |
| Asus ZenBook Flip 15 Q539ZD | |
* ... smaller is better
AIDA64: FP32 Ray-Trace | FPU Julia | CPU SHA3 | CPU Queen | FPU SinJulia | FPU Mandel | CPU AES | CPU ZLib | FP64 Ray-Trace | CPU PhotoWorxx
| Performance rating | |
| Average of class Multimedia | |
| HP Omen 16-c0077ng | |
| Lenovo ThinkBook 16 G4+ IAP | |
| Lenovo IdeaPad Gaming 3 15IAH7 | |
| Asus ZenBook Flip 15 Q539ZD | |
| Acer Swift X SFX16-52G-52VE | |
| Lenovo ThinkPad T16 G1 21BWS00200 | |
| Acer Aspire 5 A515-57G-53N8 | |
| Average Intel Core i5-1240P | |
| AIDA64 / FP32 Ray-Trace | |
| Average of class Multimedia (2214 - 50388, n=53, last 2 years) | |
| HP Omen 16-c0077ng | |
| Lenovo ThinkBook 16 G4+ IAP | |
| Lenovo IdeaPad Gaming 3 15IAH7 | |
| Acer Swift X SFX16-52G-52VE | |
| Asus ZenBook Flip 15 Q539ZD | |
| Lenovo ThinkPad T16 G1 21BWS00200 | |
| Average Intel Core i5-1240P (2405 - 9694, n=16) | |
| Acer Aspire 5 A515-57G-53N8 | |
| AIDA64 / FPU Julia | |
| HP Omen 16-c0077ng | |
| Average of class Multimedia (12867 - 201874, n=54, last 2 years) | |
| Lenovo ThinkBook 16 G4+ IAP | |
| Lenovo IdeaPad Gaming 3 15IAH7 | |
| Acer Swift X SFX16-52G-52VE | |
| Lenovo ThinkPad T16 G1 21BWS00200 | |
| Asus ZenBook Flip 15 Q539ZD | |
| Average Intel Core i5-1240P (7407 - 49934, n=16) | |
| Acer Aspire 5 A515-57G-53N8 | |
| AIDA64 / CPU SHA3 | |
| Average of class Multimedia (626 - 8623, n=54, last 2 years) | |
| Lenovo ThinkBook 16 G4+ IAP | |
| Lenovo IdeaPad Gaming 3 15IAH7 | |
| HP Omen 16-c0077ng | |
| Asus ZenBook Flip 15 Q539ZD | |
| Acer Swift X SFX16-52G-52VE | |
| Acer Aspire 5 A515-57G-53N8 | |
| Lenovo ThinkPad T16 G1 21BWS00200 | |
| Average Intel Core i5-1240P (415 - 2462, n=16) | |
| AIDA64 / CPU Queen | |
| Lenovo ThinkBook 16 G4+ IAP | |
| HP Omen 16-c0077ng | |
| Asus ZenBook Flip 15 Q539ZD | |
| Lenovo IdeaPad Gaming 3 15IAH7 | |
| Lenovo ThinkPad T16 G1 21BWS00200 | |
| Acer Aspire 5 A515-57G-53N8 | |
| Average of class Multimedia (13483 - 181505, n=41, last 2 years) | |
| Average Intel Core i5-1240P (29405 - 76736, n=16) | |
| Acer Swift X SFX16-52G-52VE | |
| AIDA64 / FPU SinJulia | |
| HP Omen 16-c0077ng | |
| Lenovo ThinkBook 16 G4+ IAP | |
| Average of class Multimedia (886 - 28794, n=54, last 2 years) | |
| Asus ZenBook Flip 15 Q539ZD | |
| Lenovo IdeaPad Gaming 3 15IAH7 | |
| Acer Swift X SFX16-52G-52VE | |
| Acer Aspire 5 A515-57G-53N8 | |
| Lenovo ThinkPad T16 G1 21BWS00200 | |
| Average Intel Core i5-1240P (2135 - 6540, n=16) | |
| AIDA64 / FPU Mandel | |
| HP Omen 16-c0077ng | |
| Average of class Multimedia (6395 - 105740, n=53, last 2 years) | |
| Lenovo ThinkBook 16 G4+ IAP | |
| Lenovo IdeaPad Gaming 3 15IAH7 | |
| Acer Swift X SFX16-52G-52VE | |
| Asus ZenBook Flip 15 Q539ZD | |
| Lenovo ThinkPad T16 G1 21BWS00200 | |
| Average Intel Core i5-1240P (5113 - 23992, n=16) | |
| Acer Aspire 5 A515-57G-53N8 | |
| AIDA64 / CPU AES | |
| HP Omen 16-c0077ng | |
| Lenovo IdeaPad Gaming 3 15IAH7 | |
| Lenovo ThinkBook 16 G4+ IAP | |
| Average of class Multimedia (8171 - 126790, n=54, last 2 years) | |
| Asus ZenBook Flip 15 Q539ZD | |
| Acer Swift X SFX16-52G-52VE | |
| Lenovo ThinkPad T16 G1 21BWS00200 | |
| Average Intel Core i5-1240P (8849 - 90370, n=16) | |
| Acer Aspire 5 A515-57G-53N8 | |
| AIDA64 / CPU ZLib | |
| Lenovo ThinkBook 16 G4+ IAP | |
| Average of class Multimedia (143.8 - 2022, n=54, last 2 years) | |
| Asus ZenBook Flip 15 Q539ZD | |
| Lenovo IdeaPad Gaming 3 15IAH7 | |
| HP Omen 16-c0077ng | |
| Acer Swift X SFX16-52G-52VE | |
| Acer Aspire 5 A515-57G-53N8 | |
| Lenovo ThinkPad T16 G1 21BWS00200 | |
| Average Intel Core i5-1240P (101.6 - 812, n=16) | |
| AIDA64 / FP64 Ray-Trace | |
| Average of class Multimedia (1014 - 26875, n=54, last 2 years) | |
| HP Omen 16-c0077ng | |
| Lenovo ThinkBook 16 G4+ IAP | |
| Lenovo IdeaPad Gaming 3 15IAH7 | |
| Acer Swift X SFX16-52G-52VE | |
| Asus ZenBook Flip 15 Q539ZD | |
| Lenovo ThinkPad T16 G1 21BWS00200 | |
| Average Intel Core i5-1240P (1154 - 5258, n=16) | |
| Acer Aspire 5 A515-57G-53N8 | |
| AIDA64 / CPU PhotoWorxx | |
| Average of class Multimedia (8187 - 88154, n=54, last 2 years) | |
| Acer Swift X SFX16-52G-52VE | |
| Lenovo ThinkBook 16 G4+ IAP | |
| Asus ZenBook Flip 15 Q539ZD | |
| Average Intel Core i5-1240P (11873 - 43661, n=16) | |
| Acer Aspire 5 A515-57G-53N8 | |
| HP Omen 16-c0077ng | |
| Lenovo ThinkPad T16 G1 21BWS00200 | |
| Lenovo IdeaPad Gaming 3 15IAH7 | |
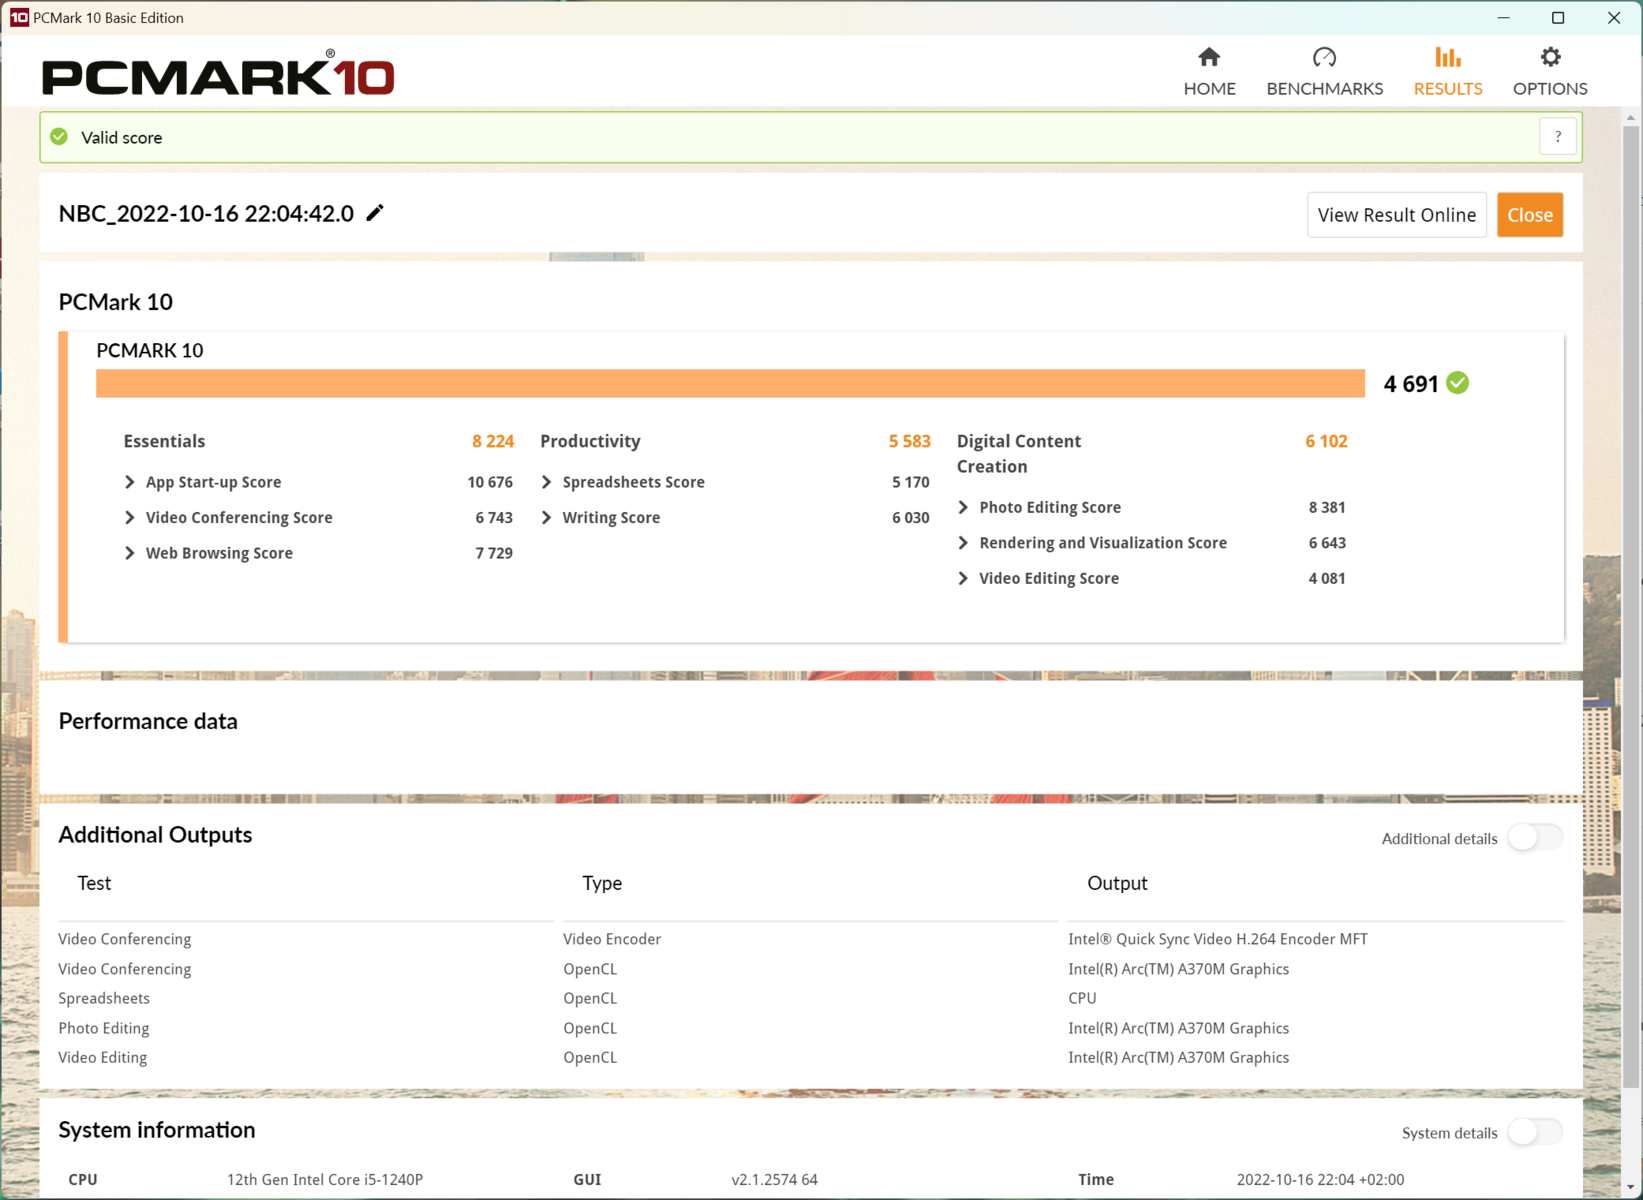
系统性能
从浏览、流媒体或写作等日常任务到雄心勃勃的图片和视频编辑,该系统没有出现任何弱点。由于有足够的核心,该处理器并不回避多任务处理。在复杂的任务中,包括安装过程,Swift X最多会偶尔休息一下。相反,在处理程序时没有明显的延迟。
另一方面,对图形要求较高的任务会使相当小的英特尔A370M图形单元很快达到极限。游戏得分相应地较弱,而内容创作的合成基准,例如媒体编辑,几乎与其他多媒体笔记本持平。然而,作为一项规则,他们使用更快的GPU,这总是负责稍高的评分。在任何情况下,像联想ThinkPad T16 G1这样一个整体坚实的商务笔记本联想ThinkPad T16 G1的处理器可以明显地被超越。
在电池模式下使用笔记本几乎不会导致任何性能损失。然而,尽管采用了相当经济的组件,但在繁重的工作负荷下,电池消耗得相当快。
CrossMark: Overall | Productivity | Creativity | Responsiveness
| PCMark 10 / Score | |
| Average of class Multimedia (4325 - 10386, n=52, last 2 years) | |
| HP Omen 16-c0077ng | |
| Lenovo IdeaPad Gaming 3 15IAH7 | |
| Asus ZenBook Flip 15 Q539ZD | |
| Acer Swift X SFX16-52G-52VE | |
| Average Intel Core i5-1240P, Intel Arc A370M (n=1) | |
| Acer Aspire 5 A515-57G-53N8 | |
| Lenovo ThinkPad T16 G1 21BWS00200 | |
| PCMark 10 / Essentials | |
| Asus ZenBook Flip 15 Q539ZD | |
| Average of class Multimedia (8025 - 11664, n=51, last 2 years) | |
| HP Omen 16-c0077ng | |
| Lenovo IdeaPad Gaming 3 15IAH7 | |
| Acer Swift X SFX16-52G-52VE | |
| Average Intel Core i5-1240P, Intel Arc A370M (n=1) | |
| Lenovo ThinkPad T16 G1 21BWS00200 | |
| Acer Aspire 5 A515-57G-53N8 | |
| PCMark 10 / Productivity | |
| Average of class Multimedia (7323 - 18233, n=51, last 2 years) | |
| Lenovo IdeaPad Gaming 3 15IAH7 | |
| HP Omen 16-c0077ng | |
| Acer Aspire 5 A515-57G-53N8 | |
| Acer Swift X SFX16-52G-52VE | |
| Average Intel Core i5-1240P, Intel Arc A370M (n=1) | |
| Asus ZenBook Flip 15 Q539ZD | |
| Lenovo ThinkPad T16 G1 21BWS00200 | |
| PCMark 10 / Digital Content Creation | |
| Average of class Multimedia (3651 - 16240, n=51, last 2 years) | |
| HP Omen 16-c0077ng | |
| Lenovo IdeaPad Gaming 3 15IAH7 | |
| Asus ZenBook Flip 15 Q539ZD | |
| Acer Swift X SFX16-52G-52VE | |
| Average Intel Core i5-1240P, Intel Arc A370M (n=1) | |
| Acer Aspire 5 A515-57G-53N8 | |
| Lenovo ThinkPad T16 G1 21BWS00200 | |
| CrossMark / Overall | |
| Average of class Multimedia (866 - 2728, n=60, last 2 years) | |
| Lenovo ThinkBook 16 G4+ IAP | |
| Asus ZenBook Flip 15 Q539ZD | |
| Acer Swift X SFX16-52G-52VE | |
| Average Intel Core i5-1240P, Intel Arc A370M (n=1) | |
| Lenovo ThinkPad T16 G1 21BWS00200 | |
| CrossMark / Productivity | |
| Average of class Multimedia (931 - 2489, n=60, last 2 years) | |
| Lenovo ThinkBook 16 G4+ IAP | |
| Asus ZenBook Flip 15 Q539ZD | |
| Lenovo ThinkPad T16 G1 21BWS00200 | |
| Acer Swift X SFX16-52G-52VE | |
| Average Intel Core i5-1240P, Intel Arc A370M (n=1) | |
| CrossMark / Creativity | |
| Average of class Multimedia (907 - 3465, n=60, last 2 years) | |
| Asus ZenBook Flip 15 Q539ZD | |
| Lenovo ThinkBook 16 G4+ IAP | |
| Acer Swift X SFX16-52G-52VE | |
| Average Intel Core i5-1240P, Intel Arc A370M (n=1) | |
| Lenovo ThinkPad T16 G1 21BWS00200 | |
| CrossMark / Responsiveness | |
| Lenovo ThinkBook 16 G4+ IAP | |
| Average of class Multimedia (605 - 2024, n=60, last 2 years) | |
| Asus ZenBook Flip 15 Q539ZD | |
| Lenovo ThinkPad T16 G1 21BWS00200 | |
| Acer Swift X SFX16-52G-52VE | |
| Average Intel Core i5-1240P, Intel Arc A370M (n=1) | |
| PCMark 10 Score | 5898 points | |
Help | ||
| AIDA64 / Memory Copy | |
| Average of class Multimedia (11299 - 132135, n=54, last 2 years) | |
| Acer Swift X SFX16-52G-52VE | |
| Asus ZenBook Flip 15 Q539ZD | |
| Lenovo ThinkBook 16 G4+ IAP | |
| Average Intel Core i5-1240P (23312 - 70537, n=16) | |
| Acer Aspire 5 A515-57G-53N8 | |
| HP Omen 16-c0077ng | |
| Lenovo IdeaPad Gaming 3 15IAH7 | |
| Lenovo ThinkPad T16 G1 21BWS00200 | |
| AIDA64 / Memory Read | |
| Average of class Multimedia (11624 - 174586, n=54, last 2 years) | |
| Lenovo ThinkBook 16 G4+ IAP | |
| Asus ZenBook Flip 15 Q539ZD | |
| Acer Swift X SFX16-52G-52VE | |
| Average Intel Core i5-1240P (18989 - 70553, n=16) | |
| Acer Aspire 5 A515-57G-53N8 | |
| HP Omen 16-c0077ng | |
| Lenovo IdeaPad Gaming 3 15IAH7 | |
| Lenovo ThinkPad T16 G1 21BWS00200 | |
| AIDA64 / Memory Write | |
| Average of class Multimedia (11755 - 134998, n=54, last 2 years) | |
| Asus ZenBook Flip 15 Q539ZD | |
| Acer Swift X SFX16-52G-52VE | |
| Lenovo ThinkBook 16 G4+ IAP | |
| Average Intel Core i5-1240P (23454 - 62496, n=16) | |
| Acer Aspire 5 A515-57G-53N8 | |
| HP Omen 16-c0077ng | |
| Lenovo IdeaPad Gaming 3 15IAH7 | |
| Lenovo ThinkPad T16 G1 21BWS00200 | |
| AIDA64 / Memory Latency | |
| Average of class Multimedia (7 - 535, n=53, last 2 years) | |
| Average Intel Core i5-1240P (85.1 - 188.3, n=11) | |
| Lenovo ThinkBook 16 G4+ IAP | |
| Acer Swift X SFX16-52G-52VE | |
| Lenovo IdeaPad Gaming 3 15IAH7 | |
| Lenovo ThinkPad T16 G1 21BWS00200 | |
| HP Omen 16-c0077ng | |
| Asus ZenBook Flip 15 Q539ZD | |
* ... smaller is better
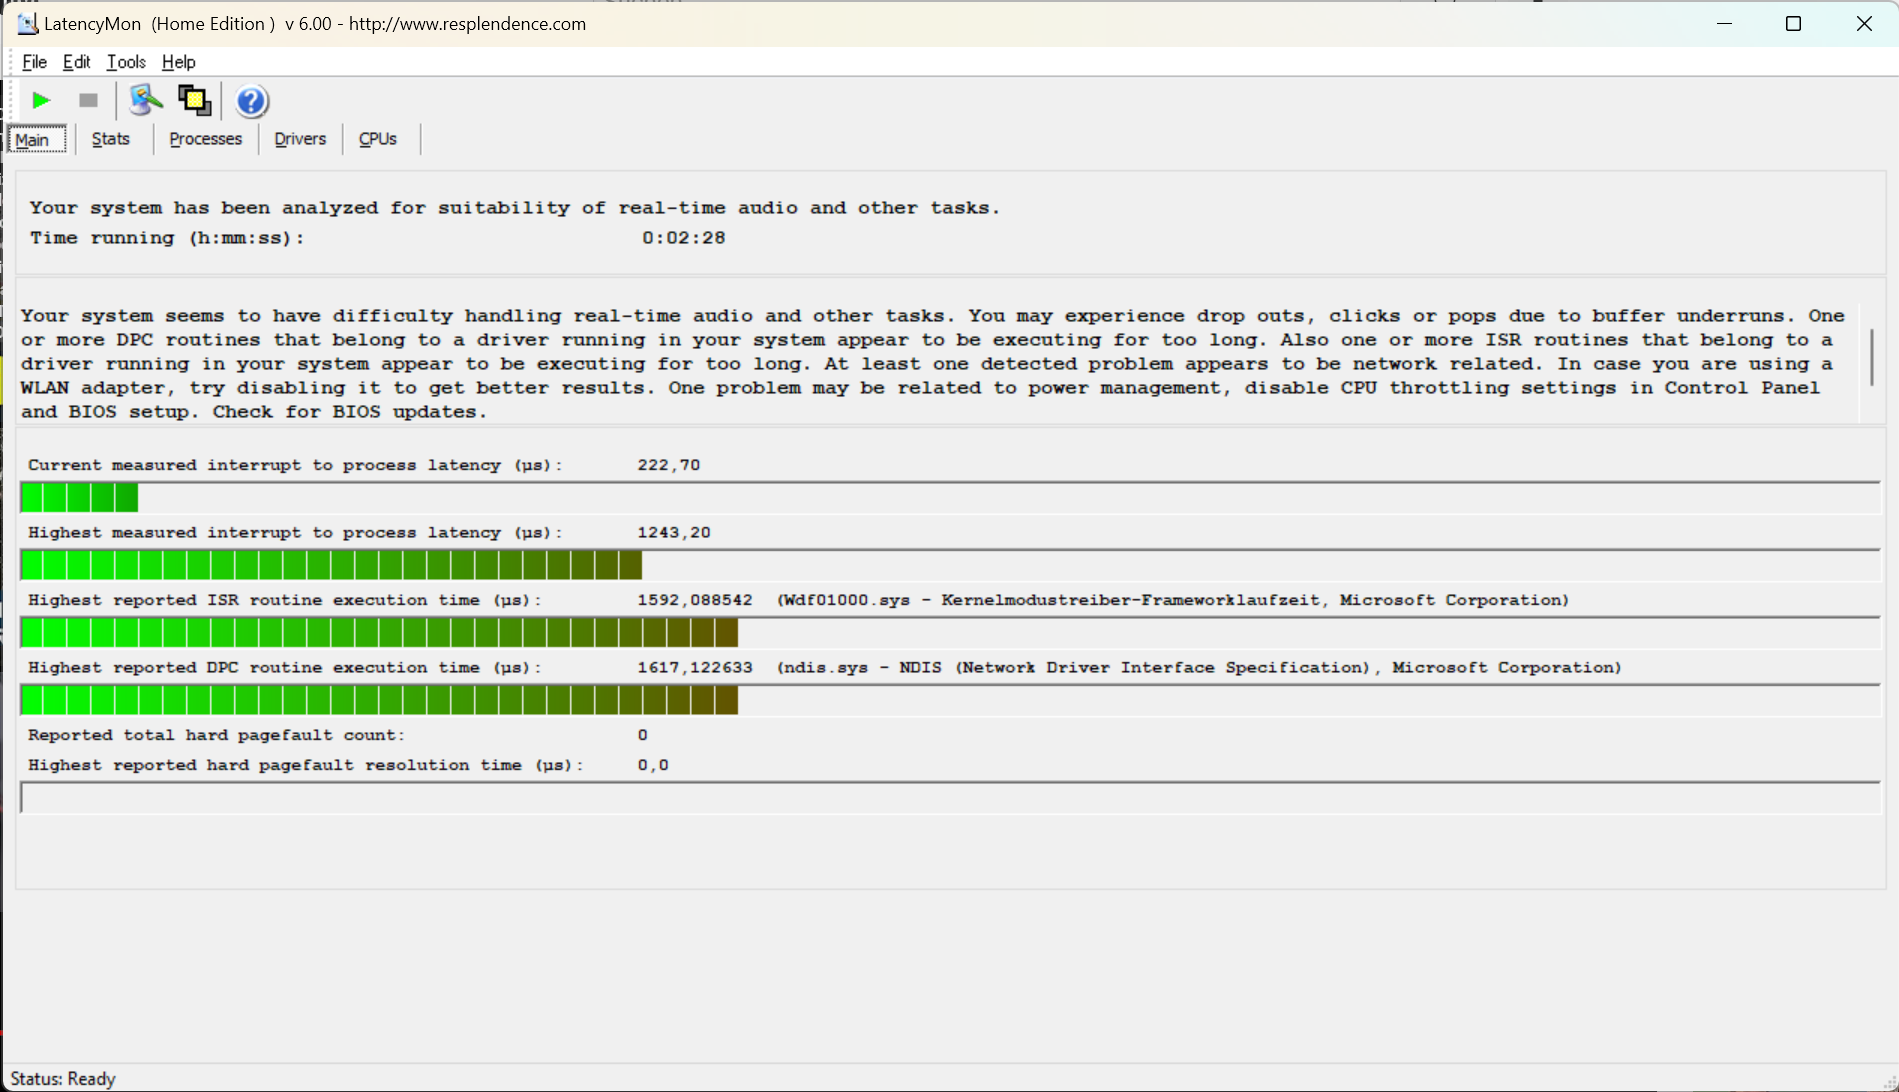
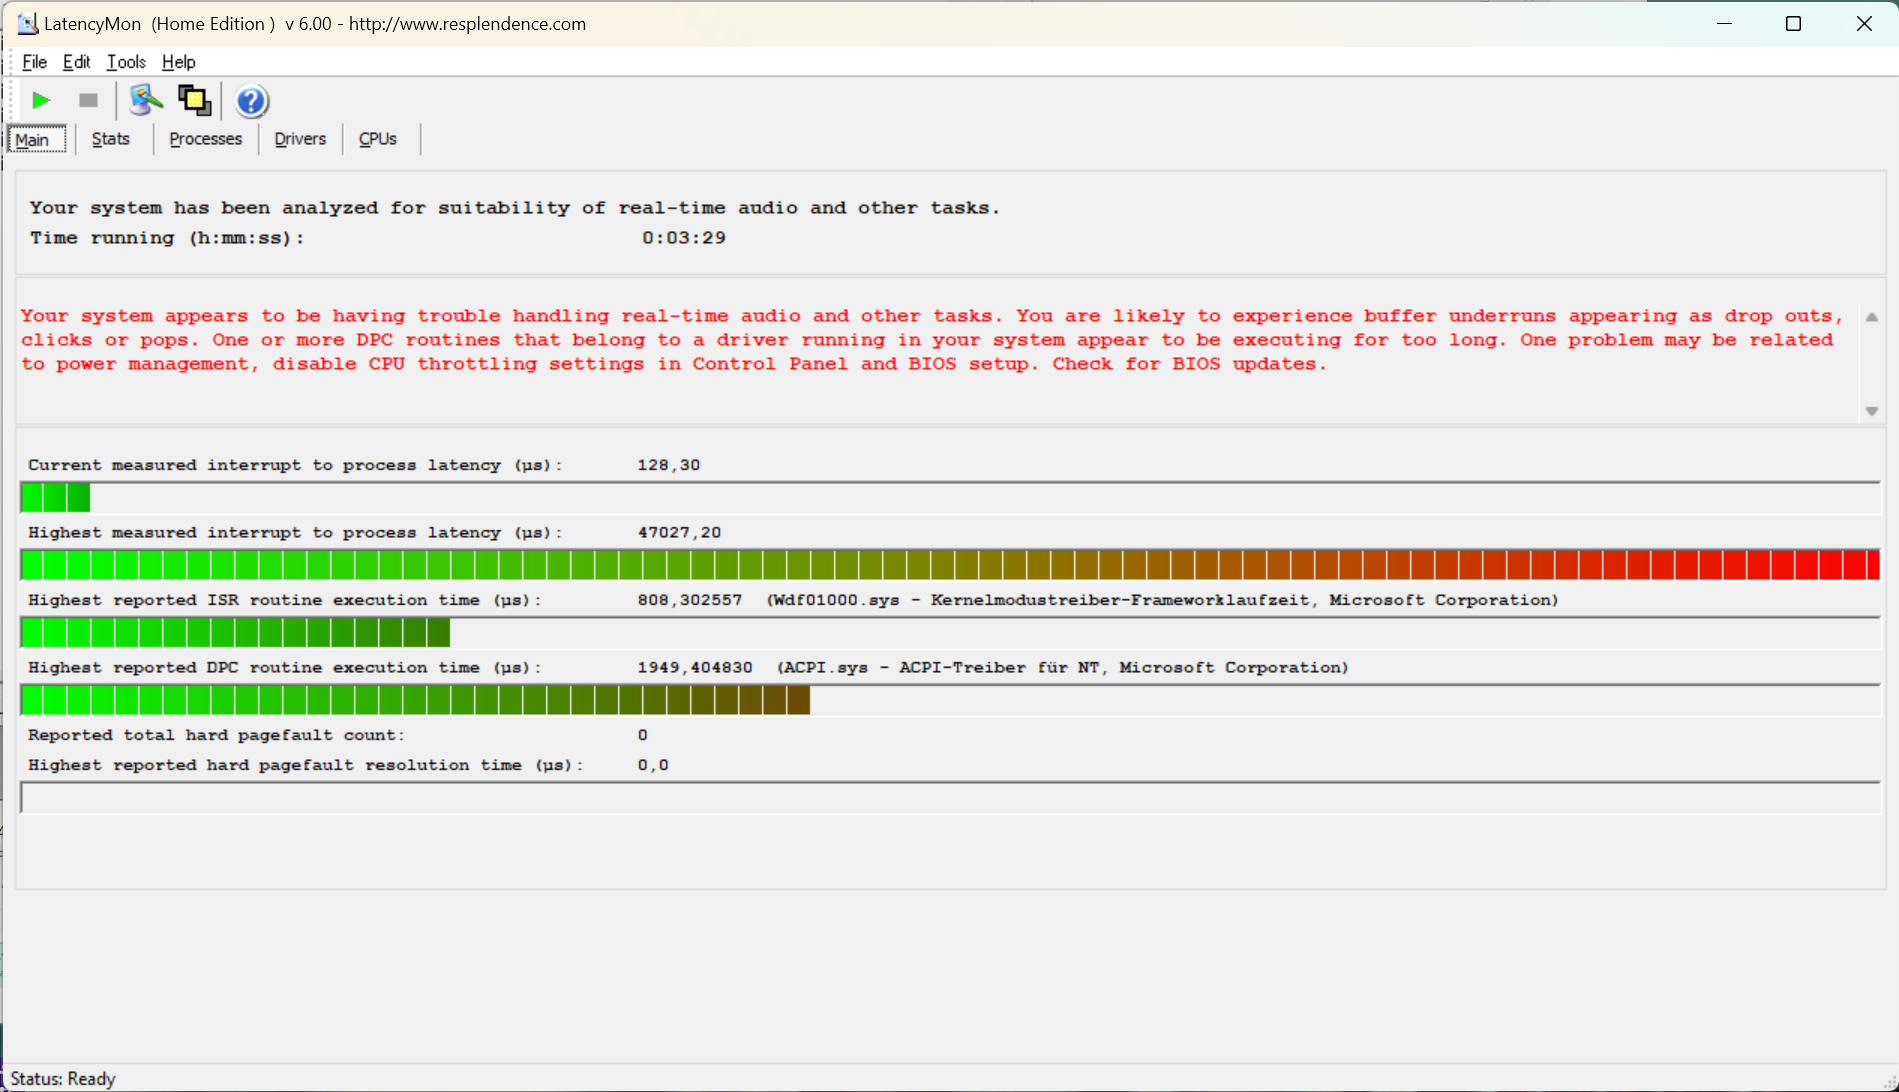
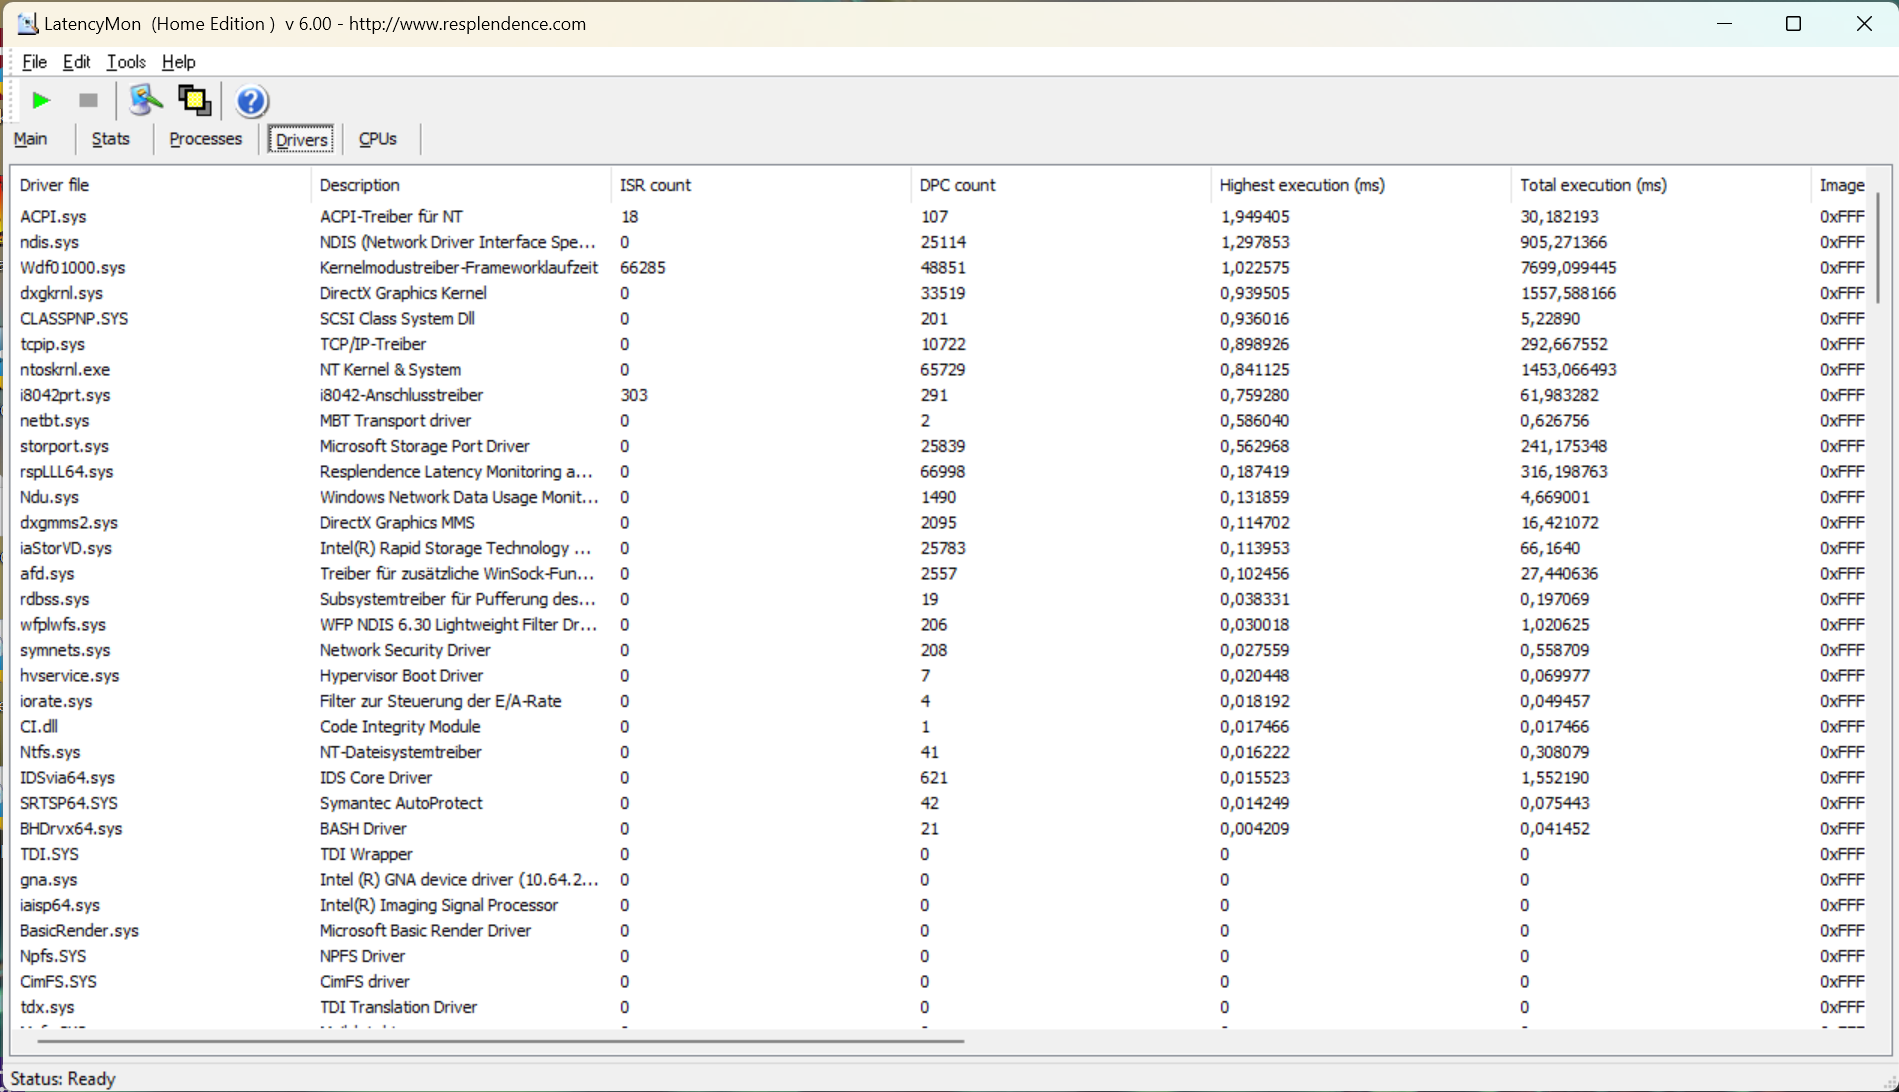
DPC延迟
宏碁的笔记本并不真正适合实时的音频和视频处理,尽管与竞争对手相比,刚刚超过1毫秒的时间是体面的。然而,类似的问题也发生在紧随其后的前辈,即Acer Swift X SFX16-51G当在节能计划中选择 "平衡 "时。然后,延迟超出了可接受的范围,无论是哪种方式,都可以感觉到明显的中断。然而,更新BIOS或改变驱动程序可以解决这个问题。
| DPC Latencies / LatencyMon - interrupt to process latency (max), Web, Youtube, Prime95 | |
| Lenovo ThinkBook 16 G4+ IAP | |
| HP Omen 16-c0077ng | |
| Acer Aspire 5 A515-57G-53N8 | |
| Lenovo ThinkPad T16 G1 21BWS00200 | |
| Lenovo IdeaPad Gaming 3 15IAH7 | |
| Acer Swift X SFX16-52G-52VE | |
| Asus ZenBook Flip 15 Q539ZD | |
* ... smaller is better
储存
美光公司的M.2固态硬盘具有令人印象深刻的性能。这主要是由于采用了PCIe 4.0标准,这意味着连续传输率非常高。在搜索时间方面也没有什么可抱怨的,所以内存不会对系统性能产生负面影响。
然而,在耐久性测试中,冷却方面的问题变得很明显。因此,即使有较大的写入量,数据率也会明显下降。这种情况在实践中相当罕见,但它表明,硬盘温度高于实现稳定性能的笔记本。这可能会对使用寿命产生负面影响。

| Acer Swift X SFX16-52G-52VE Micron 3400 MTFDKBA512TFH 512GB | Acer Aspire 5 A515-57G-53N8 Micron 2450 512GB MTFDKBA512TFK | Lenovo ThinkPad T16 G1 21BWS00200 Samsung PM9A1 MZVL2512HCJQ | Asus ZenBook Flip 15 Q539ZD SK Hynix HFM001TD3JX013N | Lenovo IdeaPad Gaming 3 15IAH7 Intel SSD 660p SSDPEKNW512G8 | HP Omen 16-c0077ng Samsung PM981a MZVLB1T0HBLR | Lenovo ThinkBook 16 G4+ IAP Micron 2450 1TB MTFDKCD1T0TFK | Average Micron 3400 MTFDKBA512TFH 512GB | Average of class Multimedia | |
|---|---|---|---|---|---|---|---|---|---|
| Drive Performance rating | |||||||||
| Percent (pt) | 79.3 | 50.8 -36% | 69.8 -12% | 58.2 -27% | 52 -34% | 74.1 -7% | 64.1 -19% | 72.5 -9% | 74.8 -6% |
| DiskSpd | -64% | -17% | -39% | -42% | -18% | -31% | -17% | -12% | |
| seq read (MB/s) | 2619 | 756 -71% | 3645 39% | 2216 -15% | 2168 -17% | 2746 5% | 2124 -19% | 2722 ? 4% | 2924 ? 12% |
| seq write (MB/s) | 3900 | 830 -79% | 2809 -28% | 2029 -48% | 1607 -59% | 2786 -29% | 2677 -31% | 3356 ? -14% | 3102 ? -20% |
| seq q8 t1 read (MB/s) | 6439 | 1023 -84% | 6524 1% | 3554 -45% | 2660 -59% | 3503 -46% | 3377 -48% | 6014 ? -7% | 5718 ? -11% |
| seq q8 t1 write (MB/s) | 3911 | 934 -76% | 4812 23% | 2969 -24% | 1671 -57% | 3016 -23% | 3241 -17% | 3698 ? -5% | 4618 ? 18% |
| 4k q1 t1 read (MB/s) | 65.3 | 18.6 -72% | 68.2 4% | 62.7 -4% | 72.3 11% | 48.8 -25% | 61.2 -6% | 54.8 ? -16% | 62.4 ? -4% |
| 4k q1 t1 write (MB/s) | 208 | 221 6% | 134.8 -35% | 138.2 -34% | 194.3 -7% | 144 -31% | 187.8 -10% | 161.6 ? -22% | 157.5 ? -24% |
| 4k q32 t16 read (MB/s) | 1522 | 416 -73% | 683 -55% | 628 -59% | 474 -69% | 1798 18% | 923 -39% | 1020 ? -33% | 1396 ? -8% |
| 4k q32 t16 write (MB/s) | 2390 | 923 -61% | 293 -88% | 405 -83% | 609 -75% | 2142 -10% | 501 -79% | 1356 ? -43% | 984 ? -59% |
| AS SSD | -47% | -1% | -27% | -24% | 5% | -32% | -3% | -10% | |
| Score Total (Points) | 4936 | 4707 -5% | 4630 -6% | 4202 -15% | 2702 -45% | 5866 19% | 4750 -4% | 4778 ? -3% | 5053 ? 2% |
| Score Read (Points) | 1737 | 1763 1% | 1112 -36% | 1221 -30% | 760 -56% | 2363 36% | 1296 -25% | 1588 ? -9% | 1595 ? -8% |
| Score Write (Points) | 2287 | 2024 -11% | 3010 32% | 2393 5% | 1584 -31% | 2325 2% | 2826 24% | 2443 ? 7% | 2703 ? 18% |
| Seq Read (MB/s) | 3200 | 3123.89 -2% | 3225 1% | 2906.11 -9% | 2432.02 -24% | 3148 -2% | 2825 -12% | 4340 ? 36% | 4493 ? 40% |
| Seq Write (MB/s) | 3430 | 3008.29 -12% | 1567 -54% | 1889.69 -45% | 1229.14 -64% | 2565 -25% | 1852 -46% | 2806 ? -18% | 3037 ? -11% |
| 4K Read (MB/s) | 63.1 | 89.47 42% | 69.7 10% | 57.61 -9% | 75.66 20% | 52.1 -17% | 58.44 -7% | 58.6 ? -7% | 61.5 ? -3% |
| 4K Write (MB/s) | 141.6 | 277.46 96% | 170.9 21% | 135.2 -5% | 242.19 71% | 136.8 -3% | 227.47 61% | 163.1 ? 15% | 184.5 ? 30% |
| 4K-64 Read (MB/s) | 1354 | 1360.83 1% | 720 -47% | 872.52 -36% | 441.63 -67% | 1996 47% | 954.65 -29% | 1096 ? -19% | 1084 ? -20% |
| 4K-64 Write (MB/s) | 1802 | 1446.04 -20% | 2682 49% | 2069.03 15% | 1218.61 -32% | 1931 7% | 2413.44 34% | 1999 ? 11% | 2215 ? 23% |
| Access Time Read * (ms) | 0.064 | 0.106 -66% | 0.059 8% | 0.035 45% | 0.073 -14% | 0.066 -3% | 0.026 59% | 0.0568 ? 11% | 0.06171 ? 4% |
| Access Time Write * (ms) | 0.026 | 0.168 -546% | 0.024 8% | 0.082 -215% | 0.033 -27% | 0.027 -4% | 0.131 -404% | 0.0402 ? -55% | 0.07475 ? -188% |
| Total Average (Program / Settings) | -49% /
-53% | -10% /
-8% | -31% /
-32% | -33% /
-32% | -7% /
-5% | -27% /
-31% | -10% /
-9% | -9% /
-11% |
* ... smaller is better
Continuous load read: DiskSpd Read Loop, Queue Depth 8
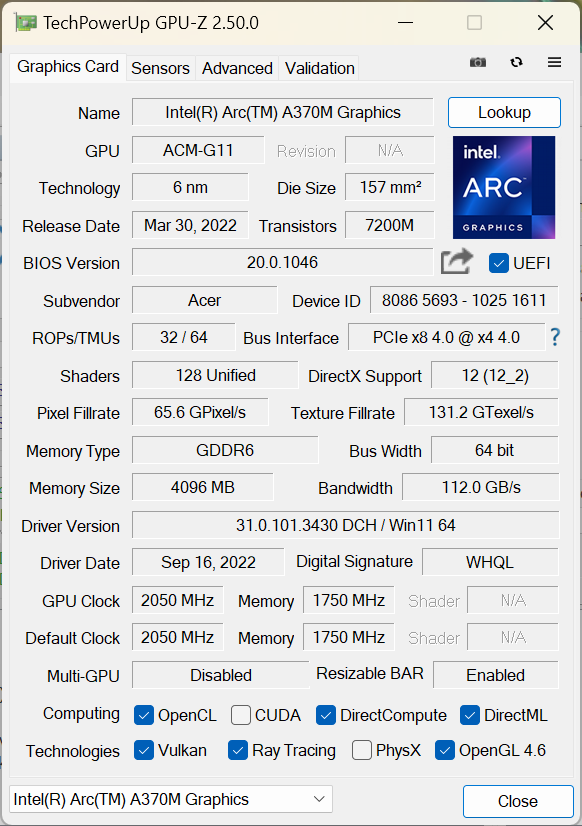
图形卡
这款英特尔A370M,在2022年春季才发布,使用了Iris Xe图形的计算单元。总共有8个核心和8个光线追踪单元。考虑到低性能,4GB的视频内存是很慷慨的。该卡的最大功率为45瓦。随着时间的推移,该值首先减少到35瓦,最后减少到25瓦。因此,该电源最多是通常授予游戏显卡的一半。
因此,它很难与竞争对手的简单移动GPU相比。这两款AMD Radeon RX 6500M和 NvidiaGeForce RTX 3050都明显更胜一筹。即使是 Acer Aspire 5 A515-57G与老旧的 NvidiaGeForce RTX 2050和35W的TGP也更快,特别是在玩游戏的时候。
相反,A370M的性能显然可以超过GeForce MX型号,例如。对于像宏碁Swift X SFX16这样的多媒体笔记本电脑,它是一个简陋但足够强大的选择。效率在这里是最重要的。我们在3DMark、Blender和其他测试中的结果都相应地很弱。Swift X总是处于性能的底部,但仍然明显领先于没有独立GPU的笔记本。在Blender中,英特尔Arc的表现也比过去两年的多媒体笔记本电脑的平均水平要好。
进一步的基准测试和性能值可以在我们的GPU基准测试列表中找到.
| 3DMark 11 Performance | 12308 points | |
| 3DMark Cloud Gate Standard Score | 27250 points | |
| 3DMark Fire Strike Score | 7717 points | |
| 3DMark Time Spy Score | 3505 points | |
Help | ||
* ... smaller is better
游戏性能
一般来说,也可以用宏碁Swift X相对较低的性能进行游戏。从2015年仍然要求很高的Witcher 3 ,到相当新的《网格传奇》,都有设置可以提供可玩的帧率。可以实现中等细节和全高清分辨率。
然而,即使是GeForce RTX 2050在几乎所有基准测试中都领先于这里使用的英特尔A370M。由于这是相当新的东西,在更多当前的游戏标题下,基准的差距明显减少。2018年的《奇异旅团》有时可以比用RTX 2050玩得更流畅。对于《网格传奇》,两块显卡都处于差不多的水平。游戏越老,因此它们背后的技术也越老,英特尔Arc处理这些游戏就越麻烦。
仍然可以观察到英特尔Arc驱动程序的一些问题。在这种情况下,《GTA V》出现了崩溃。在设备的最低质量设置下,《FIFA 23》的帧率反复明显下降。另一方面,高设置带来了相对愉快的游戏体验。一般来说,较新的作品会出现并发症,但通常只在某些设置下出现。持续更新到最新的驱动版本是明智之举。
相比之下,像联想IdeaPad Gaming 3这样的入门级游戏笔记本几乎可以稳定地产生每秒两倍的帧数。
| GTA V - 1920x1080 High/On (Advanced Graphics Off) AA:2xMSAA + FX AF:8x | |
| HP Omen 16-c0077ng | |
| Lenovo IdeaPad Gaming 3 15IAH7 | |
| Lenovo ThinkBook 16 G4+ IAP | |
| Average of class Multimedia (19.5 - 186.1, n=47, last 2 years) | |
| Acer Aspire 5 A515-57G-53N8 | |
| Average Intel Arc A370M (40.5 - 41.4, n=3) | |
| Asus ZenBook Flip 15 Q539ZD | |
| Acer Swift X SFX16-52G-52VE | |
| Lenovo ThinkPad T16 G1 21BWS00200 | |
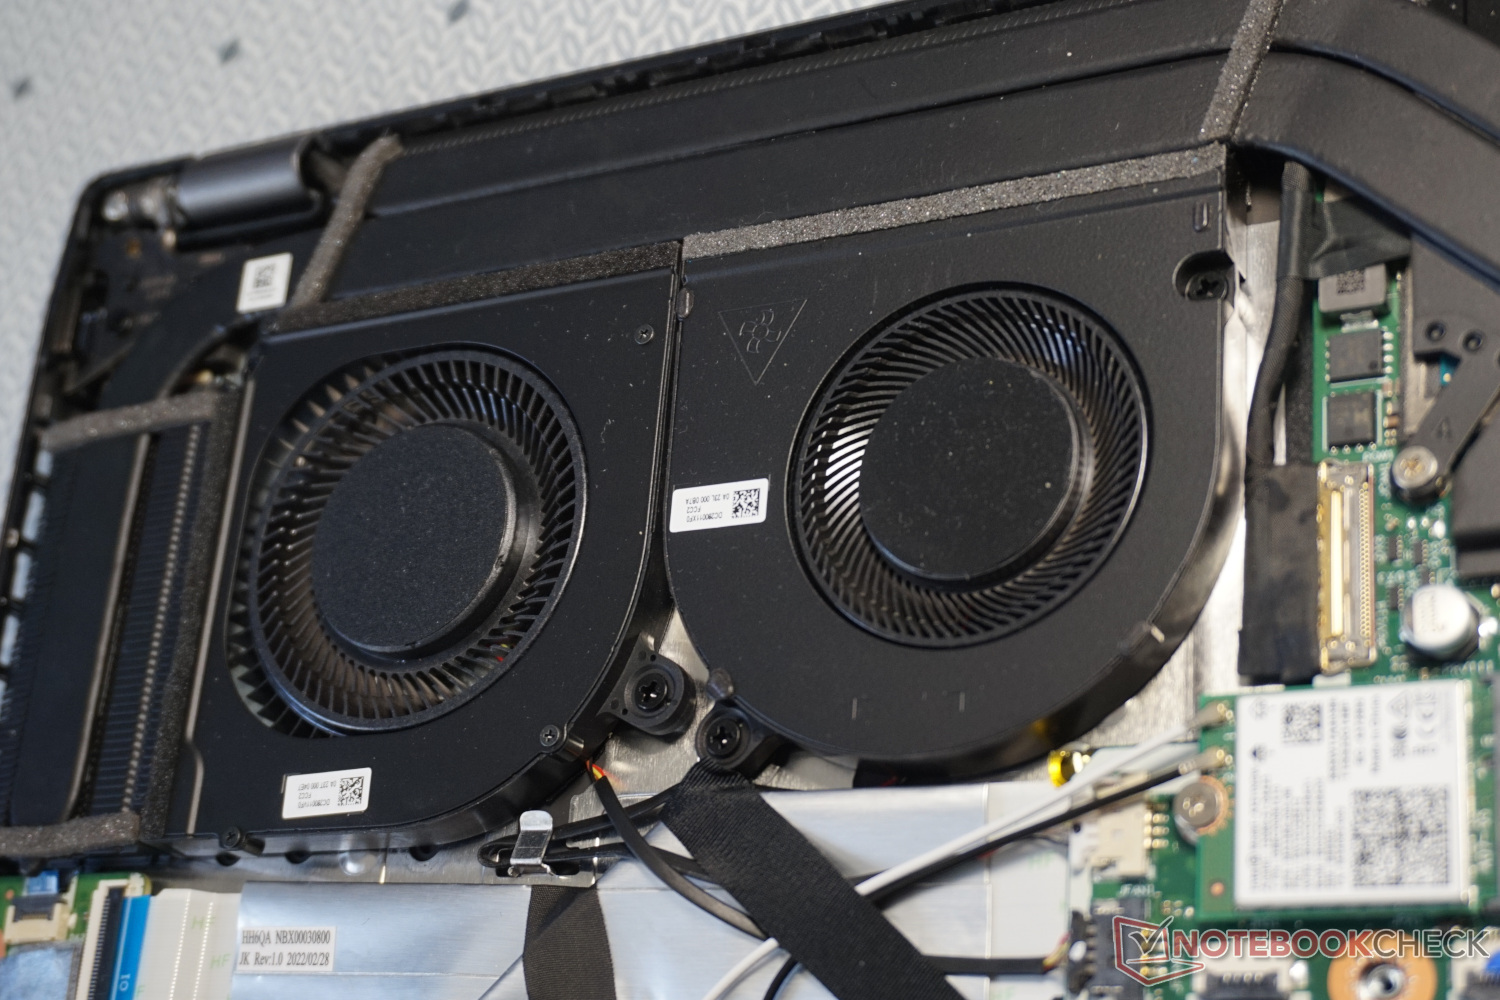
在最高设置下,Witcher 3 的压力测试显示出稳定的行为。启动后不久,帧率下降最小,但随后保持绝对稳定。这意味着双风扇可以充分冷却GPU和CPU,即使在特殊情况下,也没有必要进一步降低功耗。
Witcher 3 FPS-Diagramm
| low | med. | high | ultra | QHD | |
|---|---|---|---|---|---|
| GTA V (2015) | 145.4 | 135.1 | 40.5 | 0 | 9.67 |
| The Witcher 3 (2015) | 121 | 87 | 45 | 25 | |
| Dota 2 Reborn (2015) | 82.6 | 69.2 | 62.2 | 57.7 | |
| Final Fantasy XV Benchmark (2018) | 66.9 | 34.4 | 19.6 | 14.4 | |
| X-Plane 11.11 (2018) | 36.9 | 27.4 | 23.9 | ||
| Far Cry 5 (2018) | 87 | 48 | 45 | 42 | 28 |
| Strange Brigade (2018) | 184.8 | 76.7 | 64.2 | 54.3 | |
| God of War (2022) | 35 | 30 | 24 | 18 | 12 |
| GRID Legends (2022) | 97.5 | 68.3 | 57.6 | 41.7 | 31.3 |
| Vampire Bloodhunt (2022) | 127 | 87 | 62 | 55 | 34 |
| F1 22 (2022) | 127.2 | 49.5 | 46.3 | 33 | 2.85 |
| FIFA 23 (2022) | 70 (visible stuttering) | 62 | 40 | 41 | 30 |
Emissions - 低调的多媒体笔记本电脑
噪声排放
在最大性能之外,更多的背景噪音是听不到的。作为一项规则,宏碁的笔记本几乎是无声的。
在重度使用期间,风扇的速度经常加快,但速度可以接受。尖叫的风扇在这里不是一个问题。即使在最高的冷却性能下,噪音水平仍在可接受的范围内。那么,Swift X肯定是可以听到的,但与成熟的游戏笔记本或高端领域的创造者笔记本相比,它是安静的。
不幸的是,我们的测试设备产生了令人不快的电子噪音。据推测,这与一个不正确制造的晶体管有关。我们无法确定确切的来源。然而,值得注意的是,它只在低工作负荷时发生,在处理较高的工作负荷后,最初就会沉寂。然而,每次重新启动后,它又出现了。
Noise level
| Idle |
| 25 / 25 / 26.4 dB(A) |
| Load |
| 36.5 / 43 dB(A) |
 | ||
30 dB silent 40 dB(A) audible 50 dB(A) loud |
||
min: | ||
| Acer Swift X SFX16-52G-52VE A370M, i5-1240P, Micron 3400 MTFDKBA512TFH 512GB | Acer Aspire 5 A515-57G-53N8 GeForce RTX 2050 Mobile, i5-1240P, Micron 2450 512GB MTFDKBA512TFK | Lenovo ThinkPad T16 G1 21BWS00200 Iris Xe G7 80EUs, i5-1240P, Samsung PM9A1 MZVL2512HCJQ | Asus ZenBook Flip 15 Q539ZD A370M, i7-12700H, SK Hynix HFM001TD3JX013N | Lenovo IdeaPad Gaming 3 15IAH7 GeForce RTX 3050 Ti Laptop GPU, i5-12500H, Intel SSD 660p SSDPEKNW512G8 | HP Omen 16-c0077ng Radeon RX 6600M, R7 5800H, Samsung PM981a MZVLB1T0HBLR | Lenovo ThinkBook 16 G4+ IAP GeForce RTX 2050 Mobile, i7-12700H, Micron 2450 1TB MTFDKCD1T0TFK | |
|---|---|---|---|---|---|---|---|
| Noise | -11% | 14% | 6% | -16% | -23% | -4% | |
| off / environment * (dB) | 25 | 25 -0% | 23.3 7% | 23 8% | 25 -0% | 25 -0% | 24.2 3% |
| Idle Minimum * (dB) | 25 | 25 -0% | 23.3 7% | 23 8% | 29 -16% | 25 -0% | 24.2 3% |
| Idle Average * (dB) | 25 | 29 -16% | 23.3 7% | 23 8% | 30 -20% | 31.2 -25% | 24.2 3% |
| Idle Maximum * (dB) | 26.4 | 31 -17% | 23.3 12% | 24.7 6% | 32 -21% | 33.8 -28% | 24.2 8% |
| Load Average * (dB) | 36.5 | 46 -26% | 25.1 31% | 31.7 13% | 42 -15% | 55.4 -52% | 47 -29% |
| Load Maximum * (dB) | 43 | 47 -9% | 34 21% | 45.2 -5% | 54 -26% | 56 -30% | 47 -9% |
| Witcher 3 ultra * (dB) | 42 | 32.1 | 45.2 | 46 | 47 |
* ... smaller is better
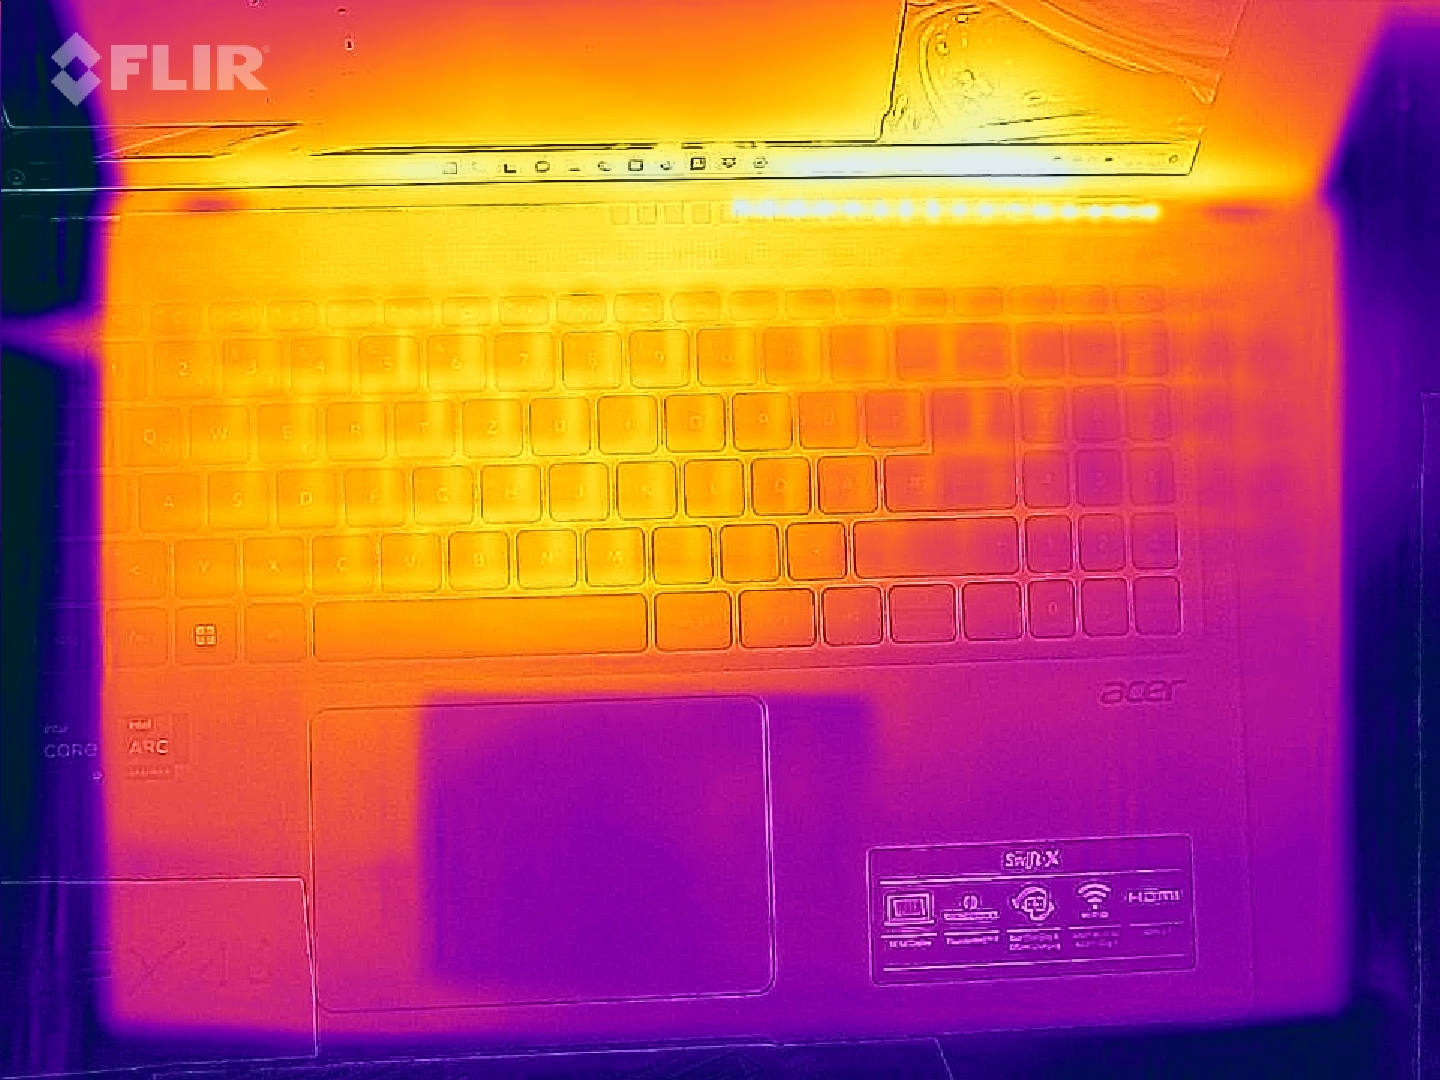
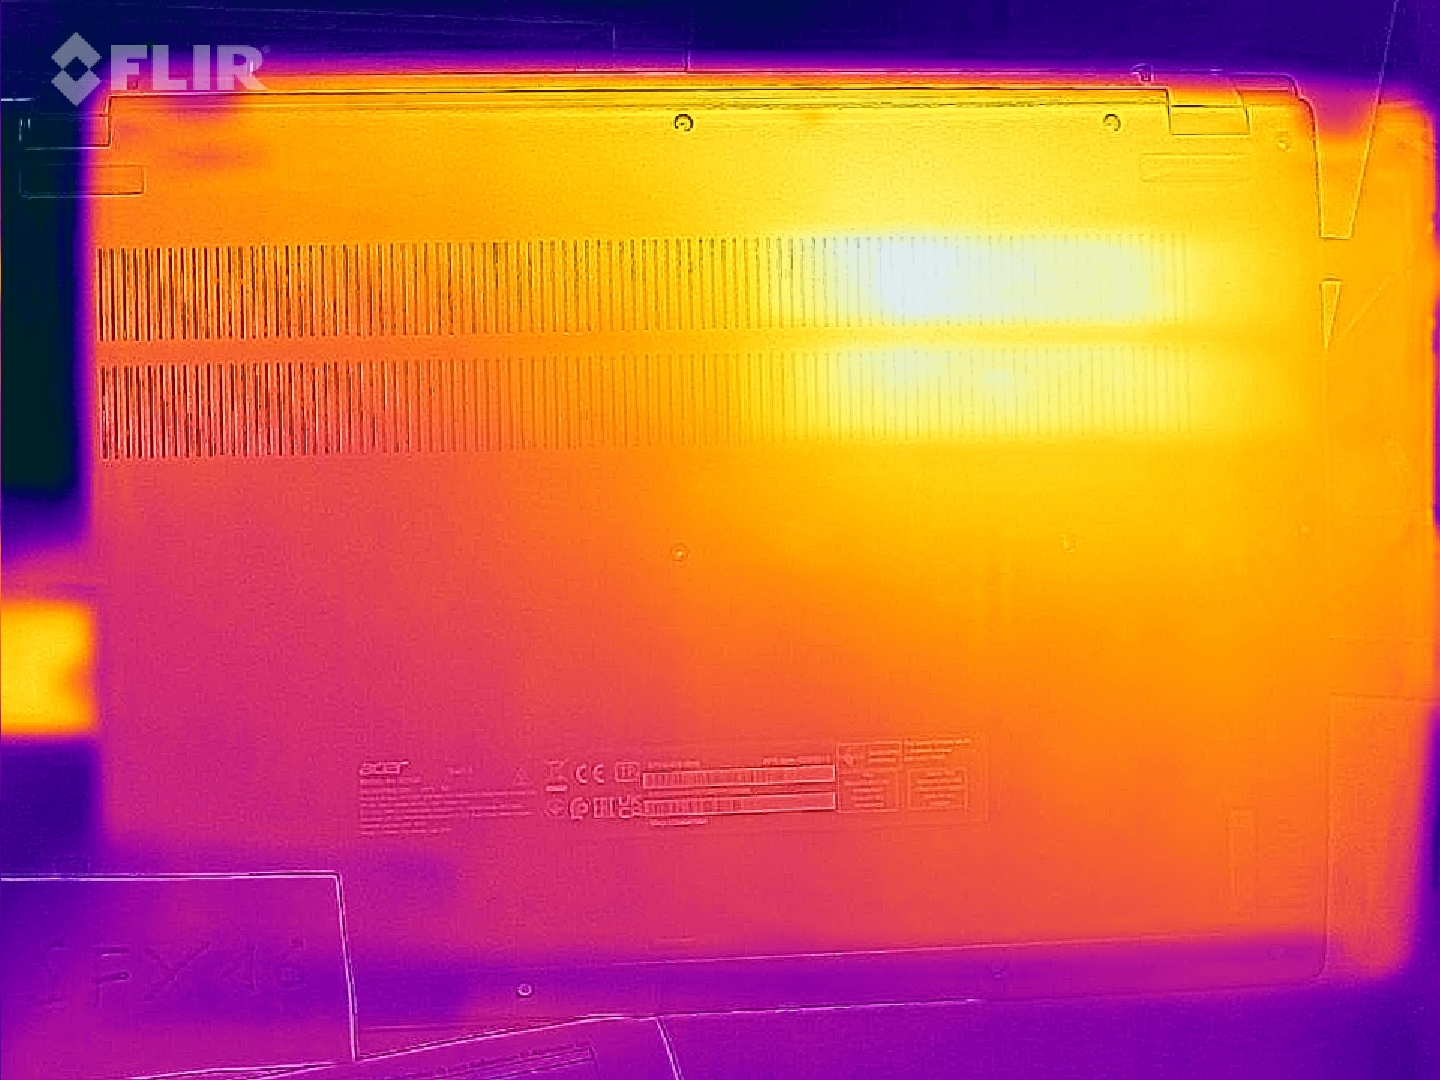
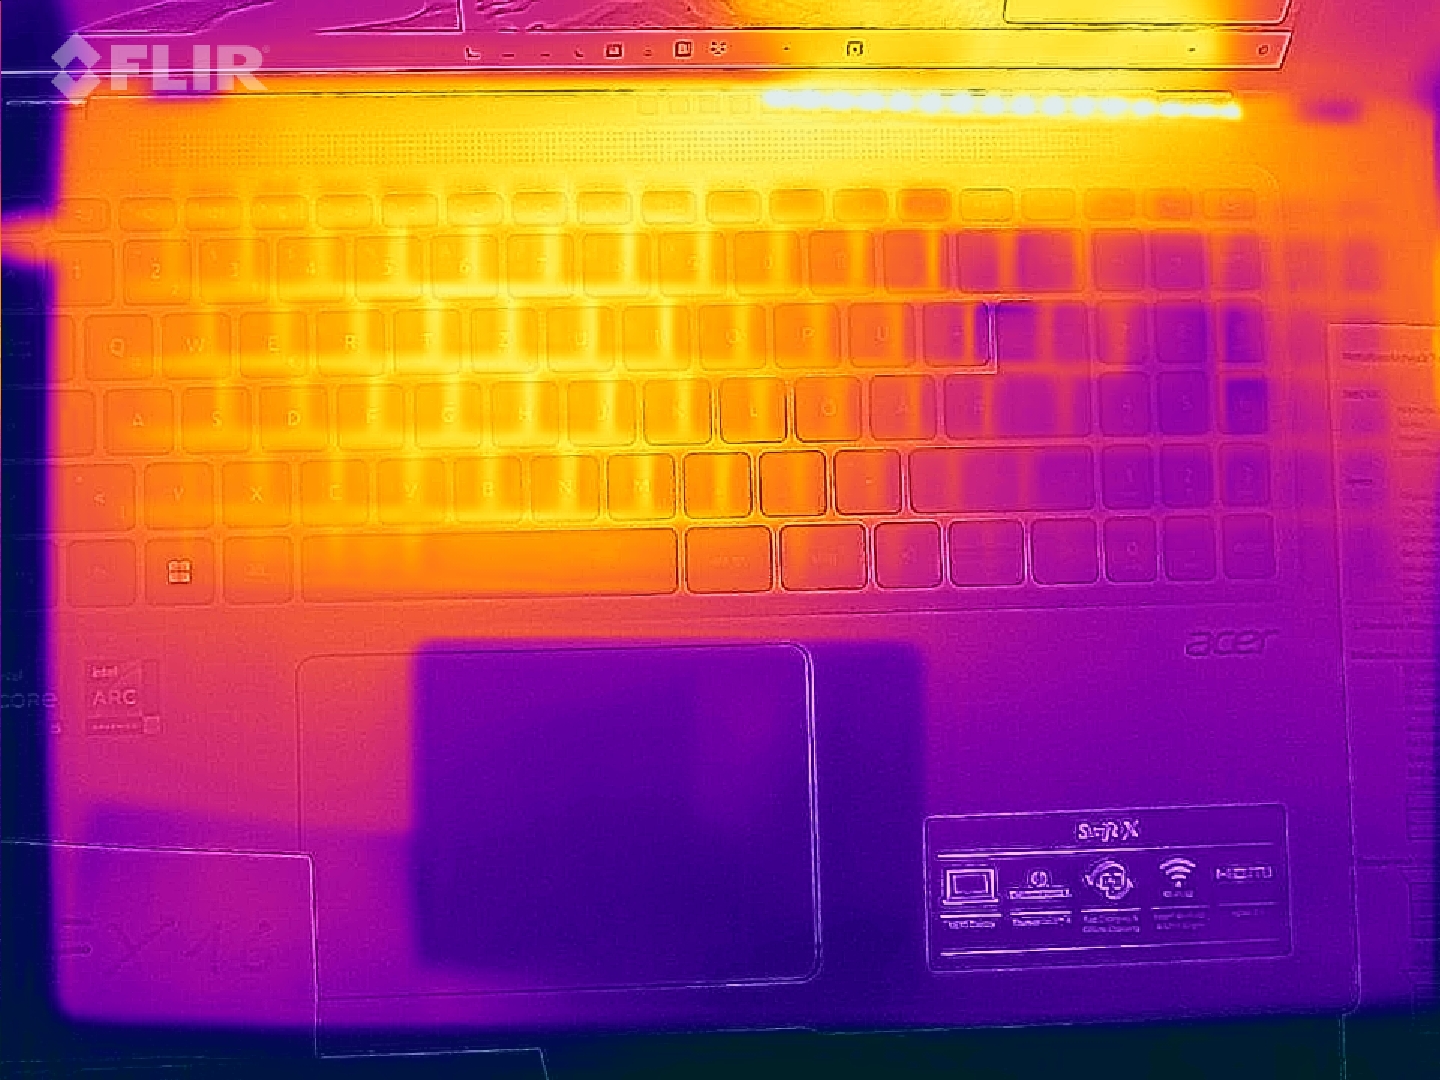
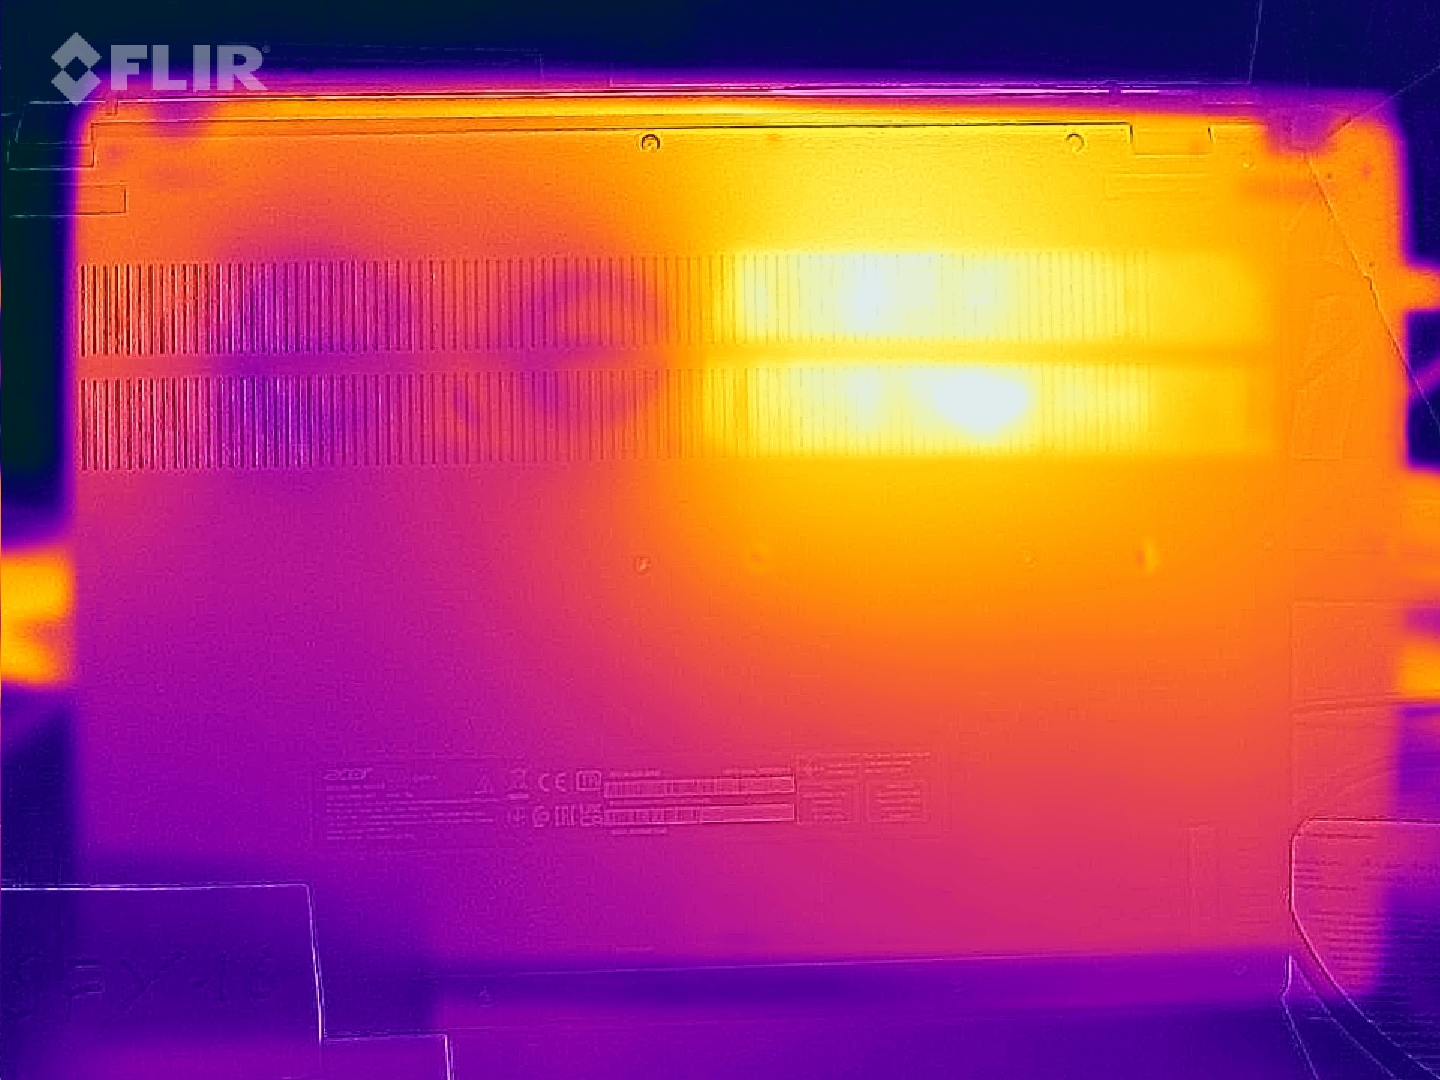
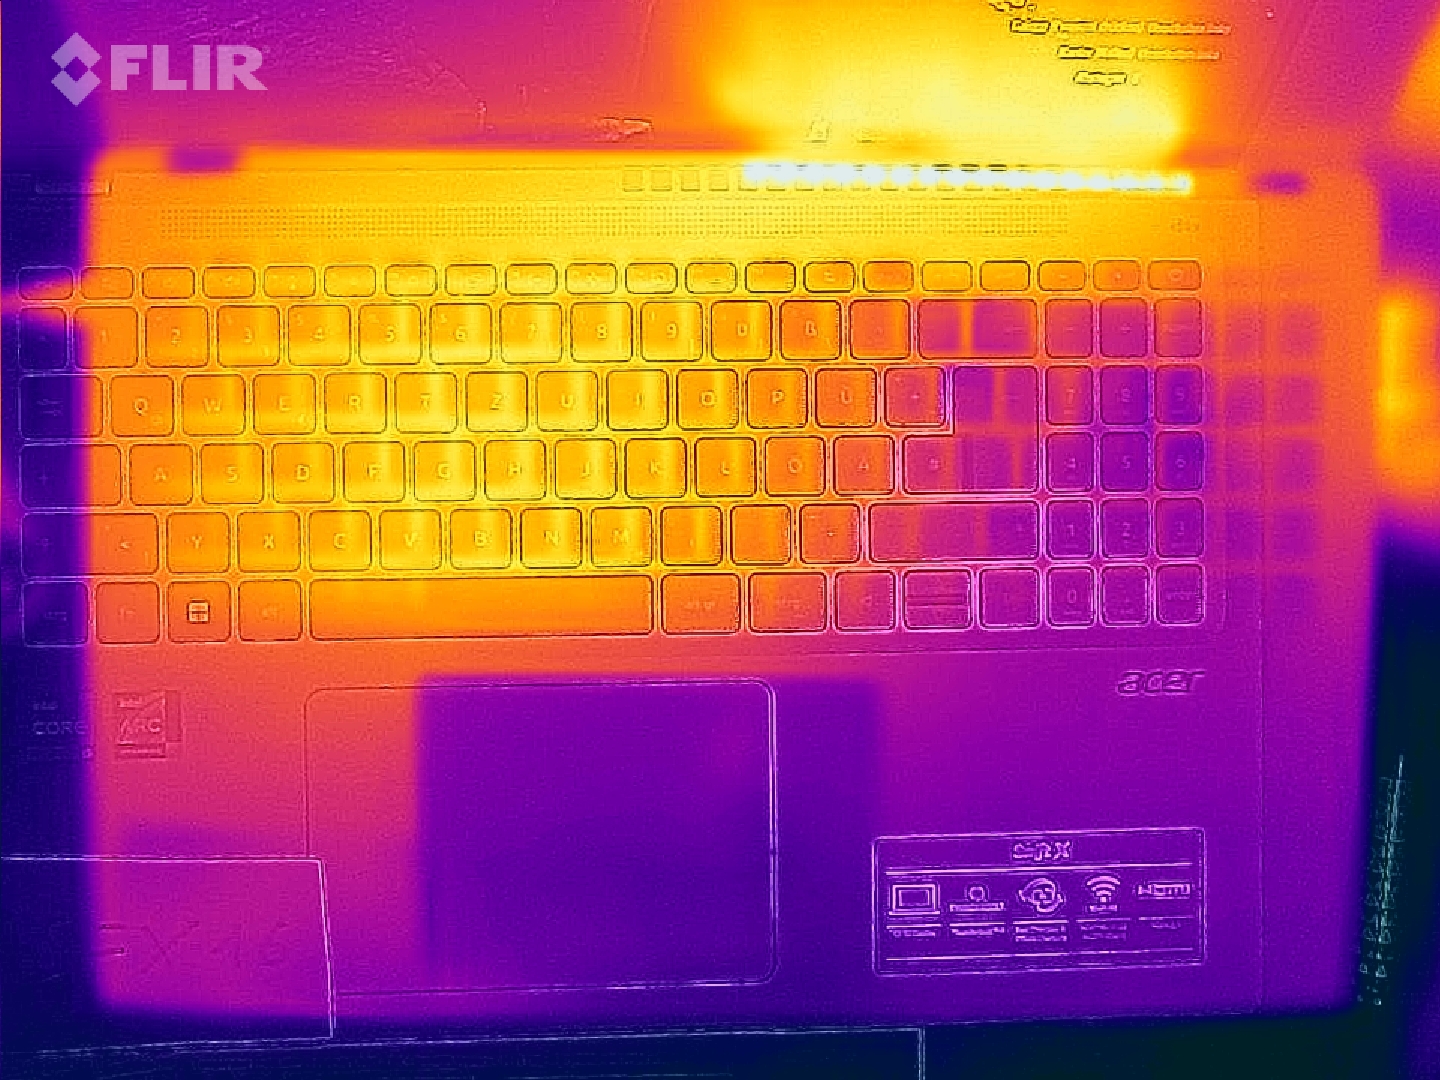
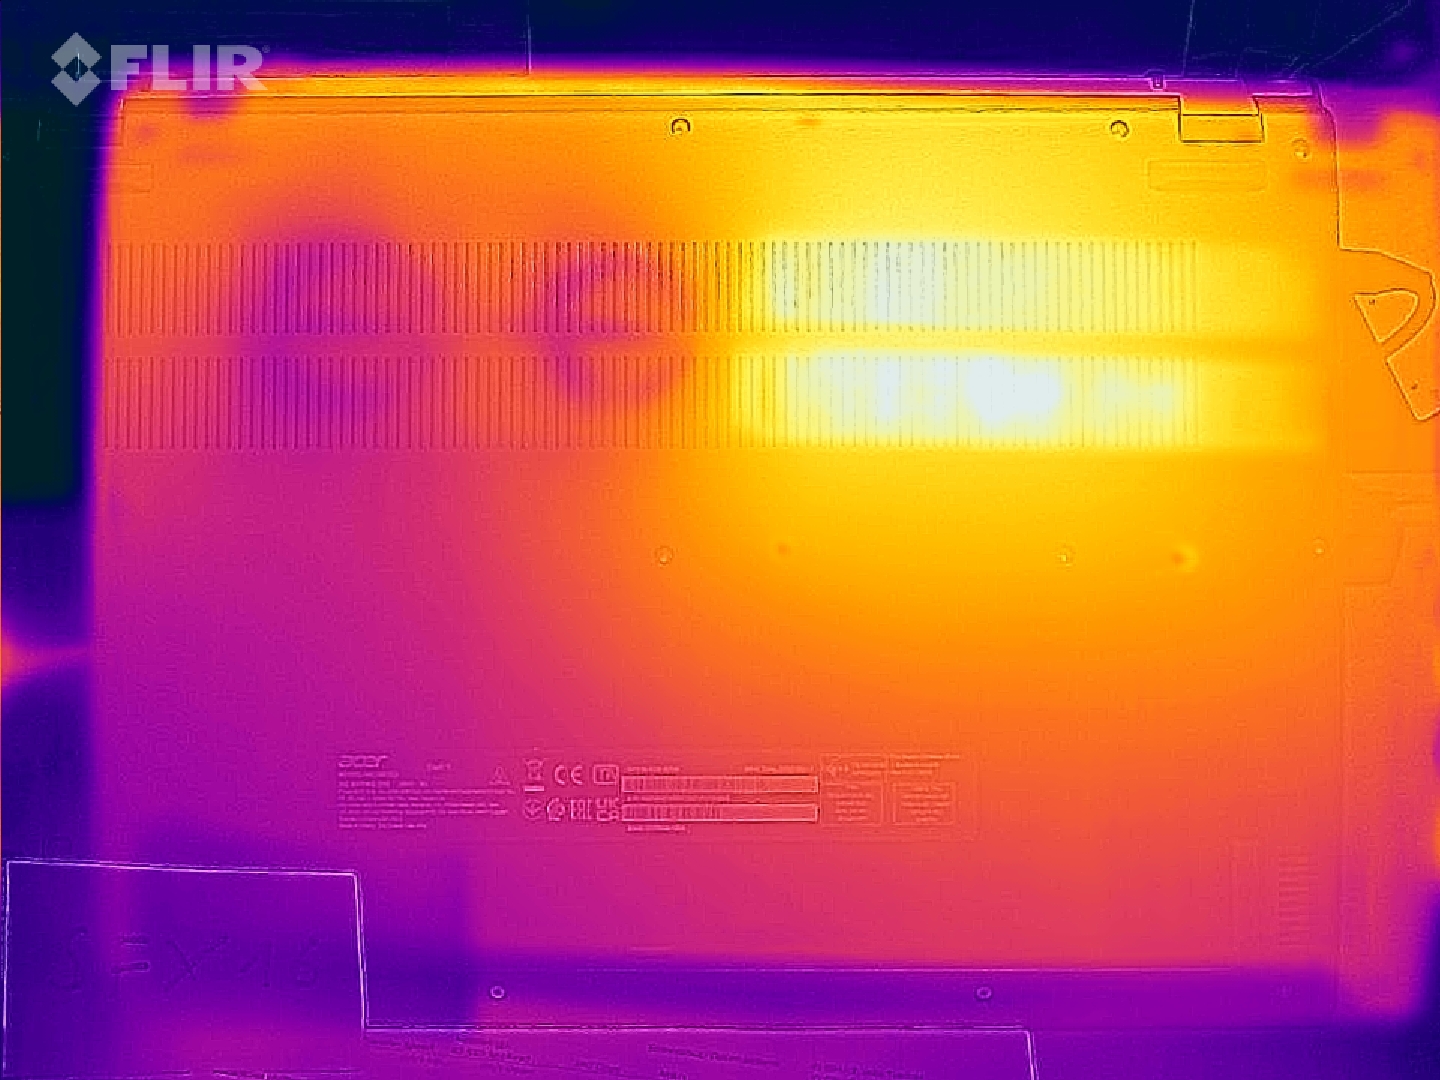
温度
即使在简单的任务中,宏碁Swift X SFX16也会有一点发热。键盘开始相对较快地感到温暖。在大量使用的情况下,温度上升,在双风扇的区域达到50℃以上。风扇的位置可以在顶部和底部的热图像上清楚地看到。然而,这只适用于极端情况。在Witcher 3 ,只达到43℃,这也将笔记本电脑推向了极限。
这里的一个特殊功能是透风的键盘。因此,与大多数竞争对手不同,顶部的温度比底部高。不幸的是,测得的温度对于实际有限的功耗来说似乎太高了,因此,热量的发展也是如此。在这种情况下,让加热的空气走自然路线的方法似乎很有希望。
(-) The maximum temperature on the upper side is 52 °C / 126 F, compared to the average of 36.8 °C / 98 F, ranging from 21 to 71 °C for the class Multimedia.
(-) The bottom heats up to a maximum of 50.4 °C / 123 F, compared to the average of 39.1 °C / 102 F
(+) In idle usage, the average temperature for the upper side is 28.1 °C / 83 F, compared to the device average of 31.3 °C / 88 F.
(±) Playing The Witcher 3, the average temperature for the upper side is 33.5 °C / 92 F, compared to the device average of 31.3 °C / 88 F.
(-) The palmrests and touchpad can get very hot to the touch with a maximum of 41.4 °C / 106.5 F.
(-) The average temperature of the palmrest area of similar devices was 28.7 °C / 83.7 F (-12.7 °C / -22.8 F).
| Acer Swift X SFX16-52G-52VE Intel Core i5-1240P, Intel Arc A370M | Acer Aspire 5 A515-57G-53N8 Intel Core i5-1240P, NVIDIA GeForce RTX 2050 Mobile | Lenovo ThinkPad T16 G1 21BWS00200 Intel Core i5-1240P, Intel Iris Xe Graphics G7 80EUs | Asus ZenBook Flip 15 Q539ZD Intel Core i7-12700H, Intel Arc A370M | Lenovo IdeaPad Gaming 3 15IAH7 Intel Core i5-12500H, NVIDIA GeForce RTX 3050 Ti Laptop GPU | HP Omen 16-c0077ng AMD Ryzen 7 5800H, AMD Radeon RX 6600M | Lenovo ThinkBook 16 G4+ IAP Intel Core i7-12700H, NVIDIA GeForce RTX 2050 Mobile | |
|---|---|---|---|---|---|---|---|
| Heat | 13% | 4% | 18% | 13% | 9% | 12% | |
| Maximum Upper Side * (°C) | 52 | 43 17% | 45 13% | 36.4 30% | 47 10% | 40.6 22% | 42.9 17% |
| Maximum Bottom * (°C) | 50.4 | 48 5% | 42.8 15% | 40.4 20% | 52 -3% | 36 29% | 50.6 -0% |
| Idle Upper Side * (°C) | 30 | 26 13% | 33 -10% | 26.2 13% | 25 17% | 31.3 -4% | 26 13% |
| Idle Bottom * (°C) | 32.4 | 27 17% | 33.6 -4% | 29.2 10% | 24 26% | 36 -11% | 26.5 18% |
* ... smaller is better
压力测试
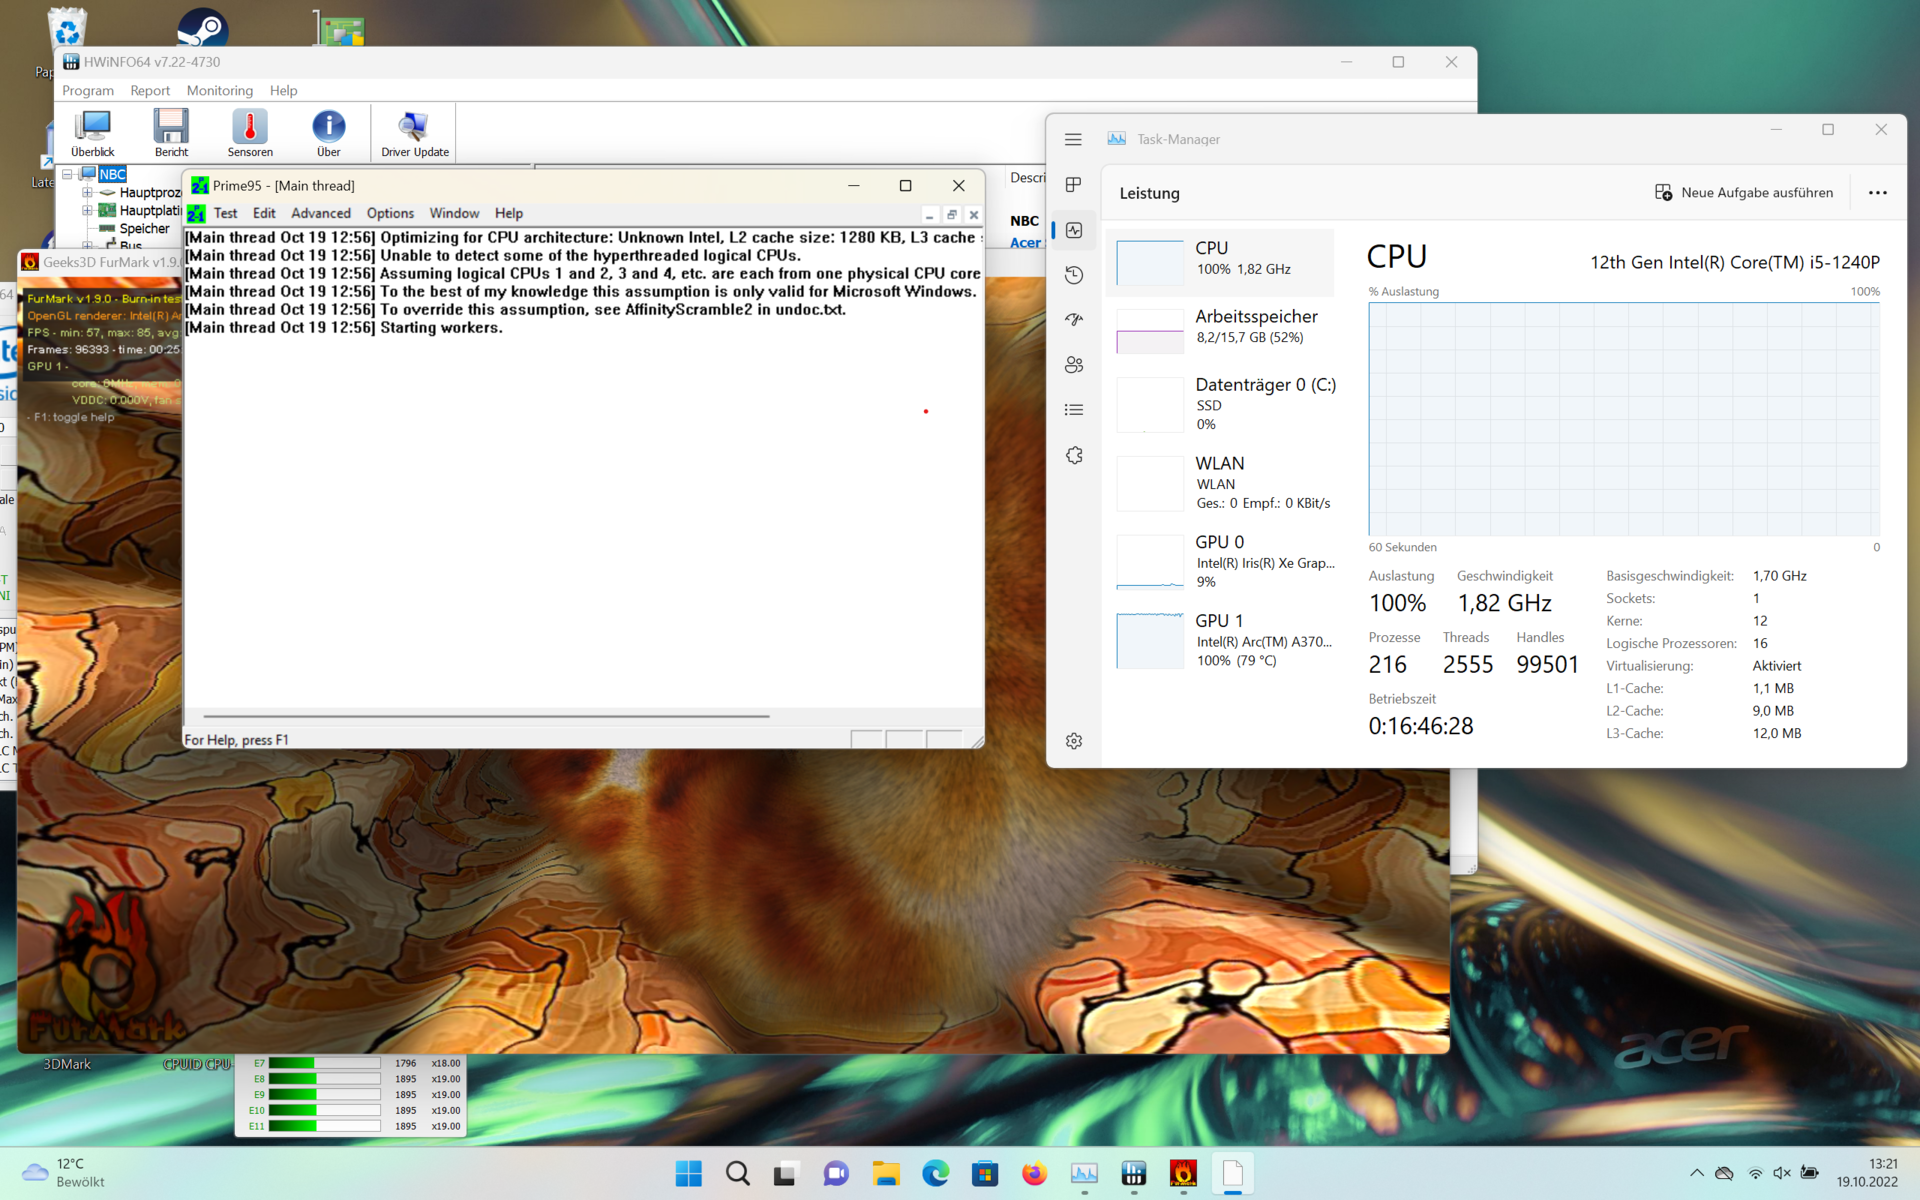
在最大工作负荷下,我们在Prime95和Furmark的帮助下进行管理,CPU温度可以在短时间内达到100℃的临界极限。然而,这只适用于个别核心,从未适用于整个CPU。
否则就会令人惊讶,最大功耗为100瓦,通常为70瓦。因此,两个风扇相邻的冷却效果是可靠的。
从CPU的功耗中可以清楚地看到冷却性能。35W的功率限制1,定义了不到1分钟的最大负荷,经过较长的时间后,又一次达到了。处理器在整个过程中可以消耗大约30W,因此在压力测试中几乎保持了全部性能。
发言人
至少对于音乐来说,这两个小型立体声扬声器只在有限的范围内适用。几乎完全没有低音,例如可以听到吉他的中低频也非常弱。
另一方面,声音的细节丰富且均匀,听起来很舒服。这对于视频电话、播客和观看直播流来说是足够的。其他的都需要外接扬声器或耳机。
Acer Swift X SFX16-52G-52VE audio analysis
(±) | speaker loudness is average but good (80.1 dB)
Bass 100 - 315 Hz
(-) | nearly no bass - on average 27.6% lower than median
(±) | linearity of bass is average (14.1% delta to prev. frequency)
Mids 400 - 2000 Hz
(+) | balanced mids - only 1.8% away from median
(+) | mids are linear (5.6% delta to prev. frequency)
Highs 2 - 16 kHz
(+) | balanced highs - only 2.9% away from median
(+) | highs are linear (5.7% delta to prev. frequency)
Overall 100 - 16.000 Hz
(±) | linearity of overall sound is average (18.3% difference to median)
Compared to same class
» 56% of all tested devices in this class were better, 7% similar, 38% worse
» The best had a delta of 5%, average was 17%, worst was 45%
Compared to all devices tested
» 40% of all tested devices were better, 8% similar, 52% worse
» The best had a delta of 4%, average was 23%, worst was 134%
Apple MacBook Pro 16 2021 M1 Pro audio analysis
(+) | speakers can play relatively loud (84.7 dB)
Bass 100 - 315 Hz
(+) | good bass - only 3.8% away from median
(+) | bass is linear (5.2% delta to prev. frequency)
Mids 400 - 2000 Hz
(+) | balanced mids - only 1.3% away from median
(+) | mids are linear (2.1% delta to prev. frequency)
Highs 2 - 16 kHz
(+) | balanced highs - only 1.9% away from median
(+) | highs are linear (2.7% delta to prev. frequency)
Overall 100 - 16.000 Hz
(+) | overall sound is linear (4.6% difference to median)
Compared to same class
» 0% of all tested devices in this class were better, 0% similar, 100% worse
» The best had a delta of 5%, average was 17%, worst was 45%
Compared to all devices tested
» 0% of all tested devices were better, 0% similar, 100% worse
» The best had a delta of 4%, average was 23%, worst was 134%
能源管理--低消耗、高耐力
消耗功率
在浏览、观看视频和类似的任务时,图形芯片仍然是禁用的。对于多媒体级别来说,其功耗相应较低。通常情况下,8W的功率只被商务和办公笔记本所压制。
由于CPU和GPU即使在负载下也往往只消耗适量的功率,Swift X的功耗略低于70瓦,远远低于大多数有额外显卡的笔记本电脑。
在峰值超过100瓦的情况下,我们希望有一个稍大的电源。然而,这可能不被允许用于Thunderbolt 4,所以这个差异是可控的。在任何情况下,短暂的功率峰值都应该能够被电子产品所吸收。
| Off / Standby | |
| Idle | |
| Load |
|
Key:
min: | |
| Acer Swift X SFX16-52G-52VE i5-1240P, A370M, Micron 3400 MTFDKBA512TFH 512GB, , 2560x1600, 16" | Acer Aspire 5 A515-57G-53N8 i5-1240P, GeForce RTX 2050 Mobile, Micron 2450 512GB MTFDKBA512TFK, IPS, 1920x1080, 15.6" | Lenovo ThinkPad T16 G1 21BWS00200 i5-1240P, Iris Xe G7 80EUs, Samsung PM9A1 MZVL2512HCJQ, IPS, 1920x1200, 16" | Asus ZenBook Flip 15 Q539ZD i7-12700H, A370M, SK Hynix HFM001TD3JX013N, OLED, 2880x1620, 15.6" | Lenovo IdeaPad Gaming 3 15IAH7 i5-12500H, GeForce RTX 3050 Ti Laptop GPU, Intel SSD 660p SSDPEKNW512G8, IPS, 1920x1080, 15.6" | Lenovo ThinkBook 16 G4+ IAP i7-12700H, GeForce RTX 2050 Mobile, Micron 2450 1TB MTFDKCD1T0TFK, IPS, 2560x1600, 16" | Average Intel Arc A370M | Average of class Multimedia | |
|---|---|---|---|---|---|---|---|---|
| Power Consumption | 11% | 38% | -40% | -55% | -14% | -11% | -8% | |
| Idle Minimum * (Watt) | 5.7 | 4 30% | 2.9 49% | 9.1 -60% | 8 -40% | 5 12% | 6.17 ? -8% | 5.66 ? 1% |
| Idle Average * (Watt) | 8 | 8 -0% | 6 25% | 11.9 -49% | 10 -25% | 11.2 -40% | 9.17 ? -15% | 10.2 ? -27% |
| Idle Maximum * (Watt) | 10.4 | 13 -25% | 6.9 34% | 12.4 -19% | 16 -54% | 11.6 -12% | 11.3 ? -9% | 12.5 ? -20% |
| Load Average * (Watt) | 74 | 62 16% | 27.3 63% | 101.3 -37% | 99 -34% | 89.3 -21% | 81.8 ? -11% | 65.2 ? 12% |
| Witcher 3 ultra * (Watt) | 65 | 60 8% | 42.6 34% | 85.6 -32% | 144.6 -122% | 83 -28% | ||
| Load Maximum * (Watt) | 108.5 | 70 35% | 81.53 25% | 155.7 -44% | 168 -55% | 102 6% | 124.1 ? -14% | 113.5 ? -5% |
* ... smaller is better
Power consumption - The Witcher 3 / Stress test
Power consumption with external monitor
电池寿命
高效率的英特尔酷睿i5-1240P在电池运行时间测试中显而易见。在模拟冲浪以及连续循环播放一部全高清电影时,电池持续了近10个小时。最多时,电池的容量为56Wh,略高于平均水平。
在电池模式下,耗电量没有减少,这反映在高负荷时的运行时间上。不到一个小时的时间是不令人满意的。毕竟,有大量的电力可用于此,即使只是短暂的。
| Acer Swift X SFX16-52G-52VE i5-1240P, A370M, 56 Wh | Acer Aspire 5 A515-57G-53N8 i5-1240P, GeForce RTX 2050 Mobile, 50 Wh | Asus ZenBook Flip 15 Q539ZD i7-12700H, A370M, 96 Wh | Lenovo IdeaPad Gaming 3 15IAH7 i5-12500H, GeForce RTX 3050 Ti Laptop GPU, 60 Wh | HP Omen 16-c0077ng R7 5800H, Radeon RX 6600M, 70 Wh | Lenovo ThinkBook 16 G4+ IAP i7-12700H, GeForce RTX 2050 Mobile, 71 Wh | Average of class Multimedia | |
|---|---|---|---|---|---|---|---|
| Battery runtime | 15% | 99% | -39% | -33% | 27% | 62% | |
| H.264 (h) | 9.8 | 7 -29% | 12.6 29% | 17.1 ? 74% | |||
| WiFi v1.3 (h) | 9.7 | 7.1 -27% | 9.4 -3% | 5.9 -39% | 6.1 -37% | 8.2 -15% | 12.2 ? 26% |
| Load (h) | 0.9 | 1.4 56% | 2.7 200% | 1.5 67% | 1.664 ? 85% | ||
| Witcher 3 ultra (h) | 1.4 |
Pros
Cons
结论 - 宏碁Swift X有相当多的平均得分
宏碁SFX16-52G的显卡没有预期的严重游戏性能。然而,即使是复杂的3D应用,也能满足基本期望。此外,GPU与i5-1240P 完美协调。这使得笔记本可以快速处理大多数任务,也可以进行图形密集型计算。
峰值的追求是徒劳的。在这方面,与广泛的、有时过度的性能相伴而生的弱点也同样没有。笔记本电脑不会太吵或太热,尽管容量一般,但电池寿命也很出色。此外,我们喜欢存储空间的简易升级选项和普遍良好的可维护性。
对于一台多媒体笔记本来说,合适的性能率和良好的显示效果给人留下了深刻的印象,但宏碁Swift X SFX16的许多,在某些情况下,不必要的弱点却使其蒙羞。
宏碁在其他方面做了节省,以便能够实现令人信服的基本功能,包括一个良好的显示器。外壳在显示屏盖子方面的产量太大。输入设备也可以有更高的质量,特别是触摸板。
此外,冷却系统并不完全令人信服;组件的高效率本可以用稍好的性能来强调。有缺陷的扬声器和缺少一个卡槽,使实际上非常好的总体印象有些减弱。
尽管如此,如果编辑图片和视频是对图形要求最高的任务,Swift X仍然是一个不错的选择。毕竟,其纯粹的性能完全处于仅次于游戏笔记本的要求水平。另一方面,如果你想不时地赌博,联想ThinkBook 16 G4+ ,或者更好,惠普Omen 16-c0077ng 是更合适的选择。如果办公桌上有高质量的显示器,也可以推荐Acer Aspire 5 A515 ,它的显示器在我们的测试中表现得非常令人失望。
价格和可用性
我们测试的宏碁Swift X SFX16-52G-52VE目前在notebooksbilliger.de有售。,配备更快的i7处理器和1TB固态硬盘的版本售价为1499欧元(约合人民币1490元)。和1TB固态硬盘的型号价格为1499欧元(约合人民币1490元)。
Acer Swift X SFX16-52G-52VE
- 10/21/2022 v7 (old)
Translated
Price comparison

