三星Galaxy Book2 15评测--配备Arc A350M的多媒体笔记本电脑未能给人留下深刻印象
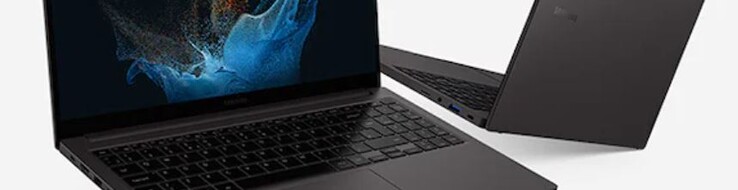
三星Galaxy Book2 15是一款新的多媒体笔记本电脑,配备了英特尔的最新组件。除了最新一代的Alder Lake P系列处理器,这家韩国制造商还包括Arc A350M--英特尔的入门级独立显卡。它的建议零售价为1299欧元(1300美元),还配备了哑光IPS显示屏、16GB内存和512GB PCIe SSD。
潜在的竞争对手比较
Rating | Date | Model | Weight | Height | Size | Resolution | Price |
|---|---|---|---|---|---|---|---|
| 79.8 % v7 (old) | 08 / 2022 | Samsung Galaxy Book2 15 i7-1260P, A350M | 1.6 kg | 15 mm | 15.60" | 1920x1080 | |
| 83.5 % v7 (old) | 07 / 2022 | Dell Inspiron 15 Plus i5-11400H, GeForce RTX 3050 4GB Laptop GPU | 1.9 kg | 19 mm | 15.60" | 1920x1080 | |
| 80.6 % v7 (old) | 11 / 2021 | Asus Vivobook 15 K513EQ i7-1165G7, GeForce MX350 | 1.6 kg | 17.9 mm | 15.60" | 1920x1080 | |
| 85.6 % v7 (old) | 03 / 2022 | Lenovo ThinkBook 15p G2 ITH 21B1000YGE i7-11800H, GeForce RTX 3050 Ti Laptop GPU | 1.9 kg | 20 mm | 15.60" | 3840x2160 | |
| 81.2 % v7 (old) | 07 / 2021 | HP Pavilion 15-eg i7-1165G7, GeForce MX450 | 1.7 kg | 17.9 mm | 15.60" | 1920x1080 | |
| 82 % v7 (old) | Samsung Galaxy Book NP750XDA i5-1135G7, Iris Xe G7 80EUs | 1.6 kg | 16 mm | 15.60" | 1920x1080 |
箱子 - 有很多吱吱嘎嘎的声音
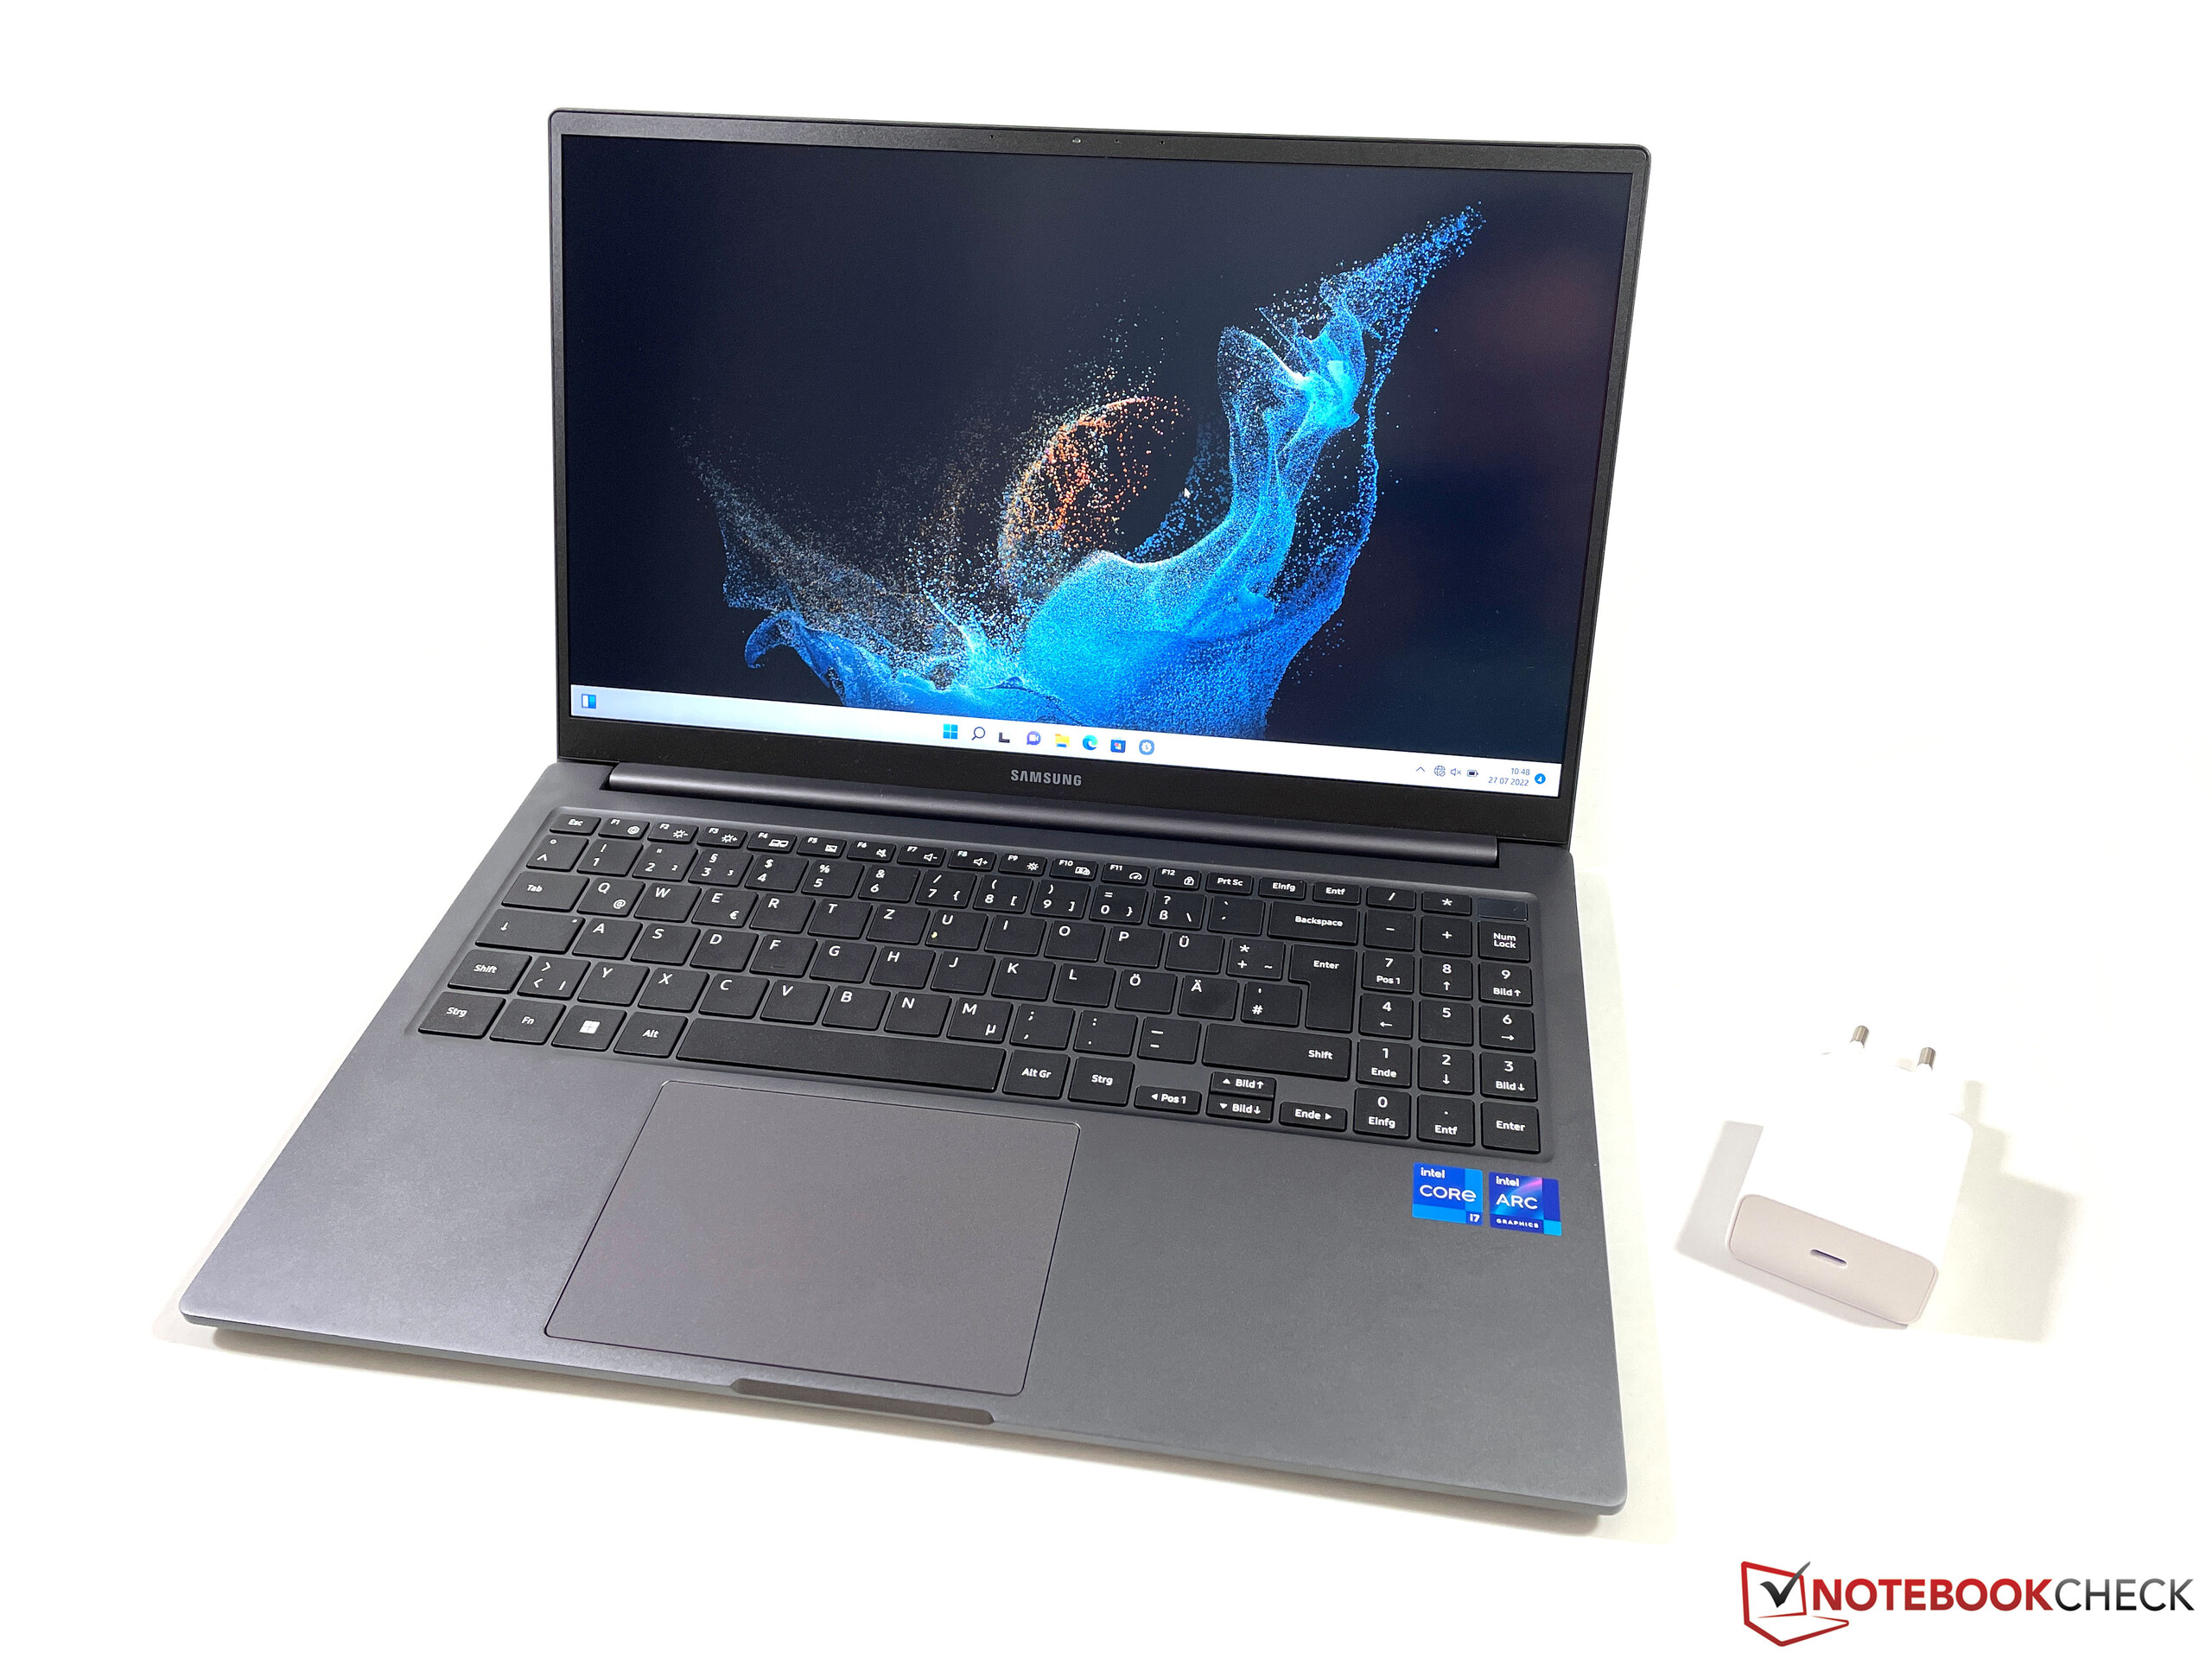
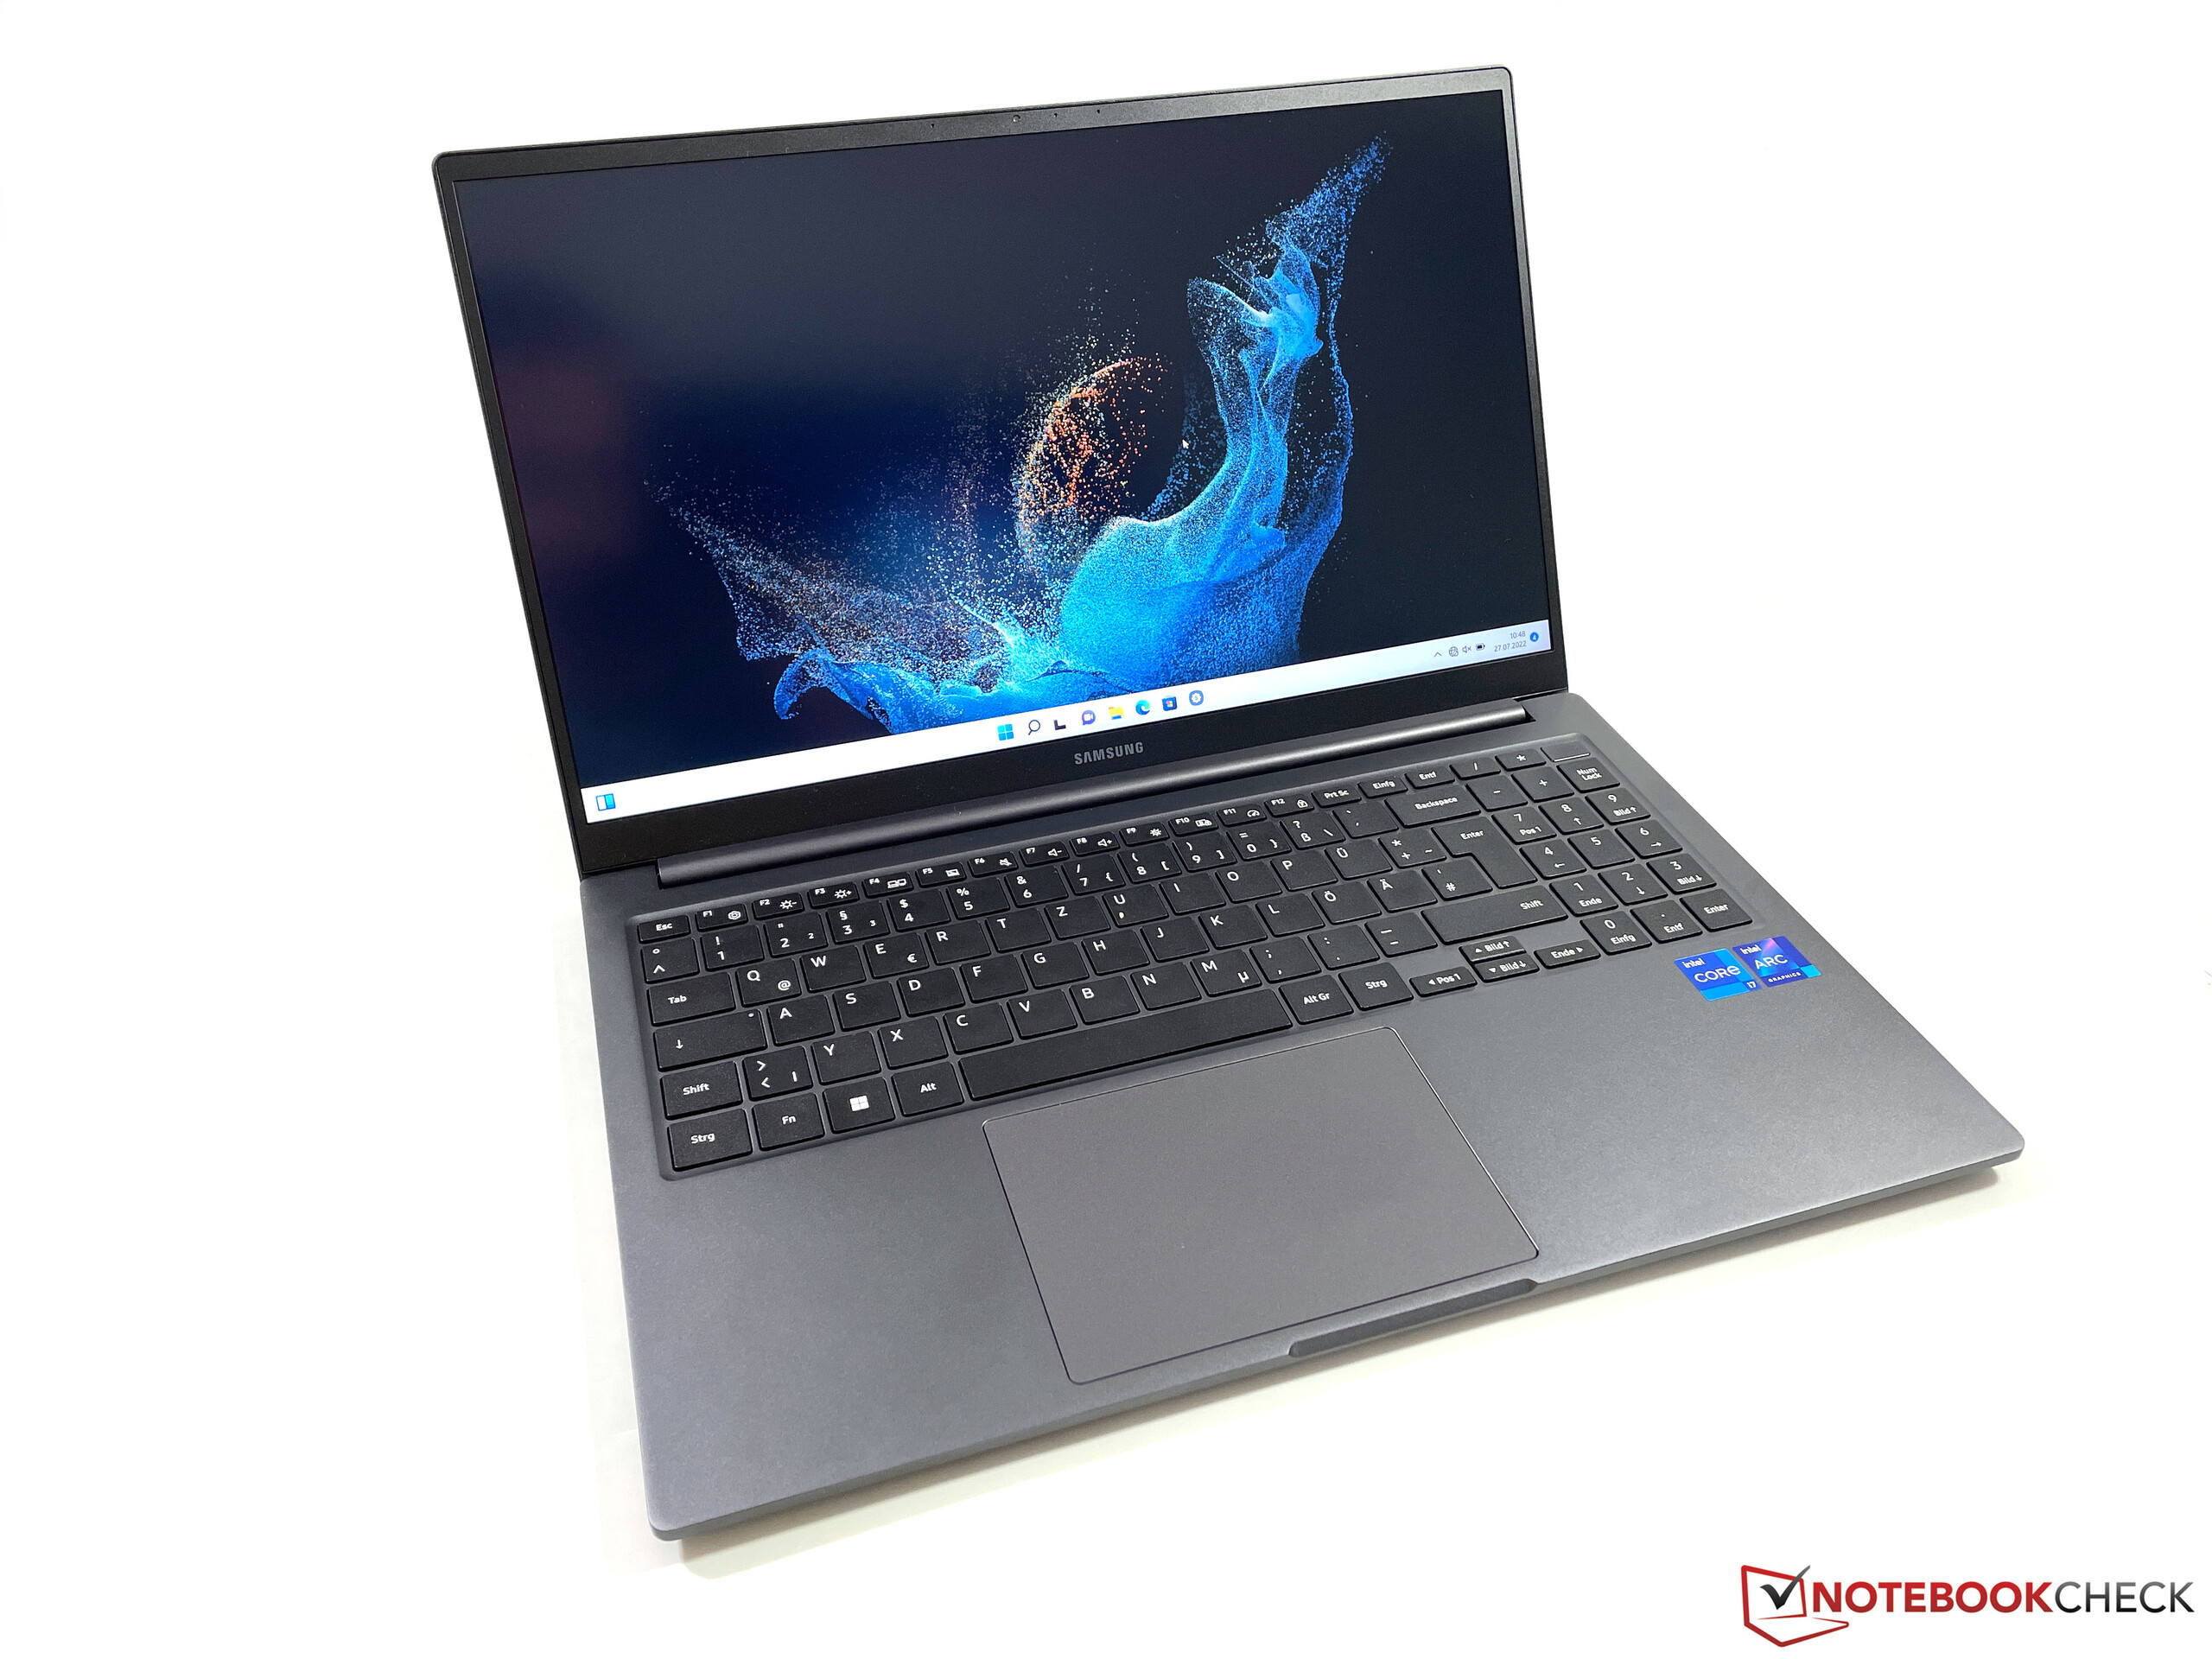
三星Galaxy Book2 15采用了与前代产品相同的机身,但现在只有石墨色的配色。该设备的外观非常简洁,没有任何引人注目的元素。而且其光滑的表面对指纹相当敏感。然而,这台由塑料和铝制成的15.6英寸笔记本电脑在质量方面未能给人留下深刻印象。我们的评测单元发出令人不快的吱吱声。特别是盖子区域受到这个问题的严重影响,但基本单元也不能幸免。
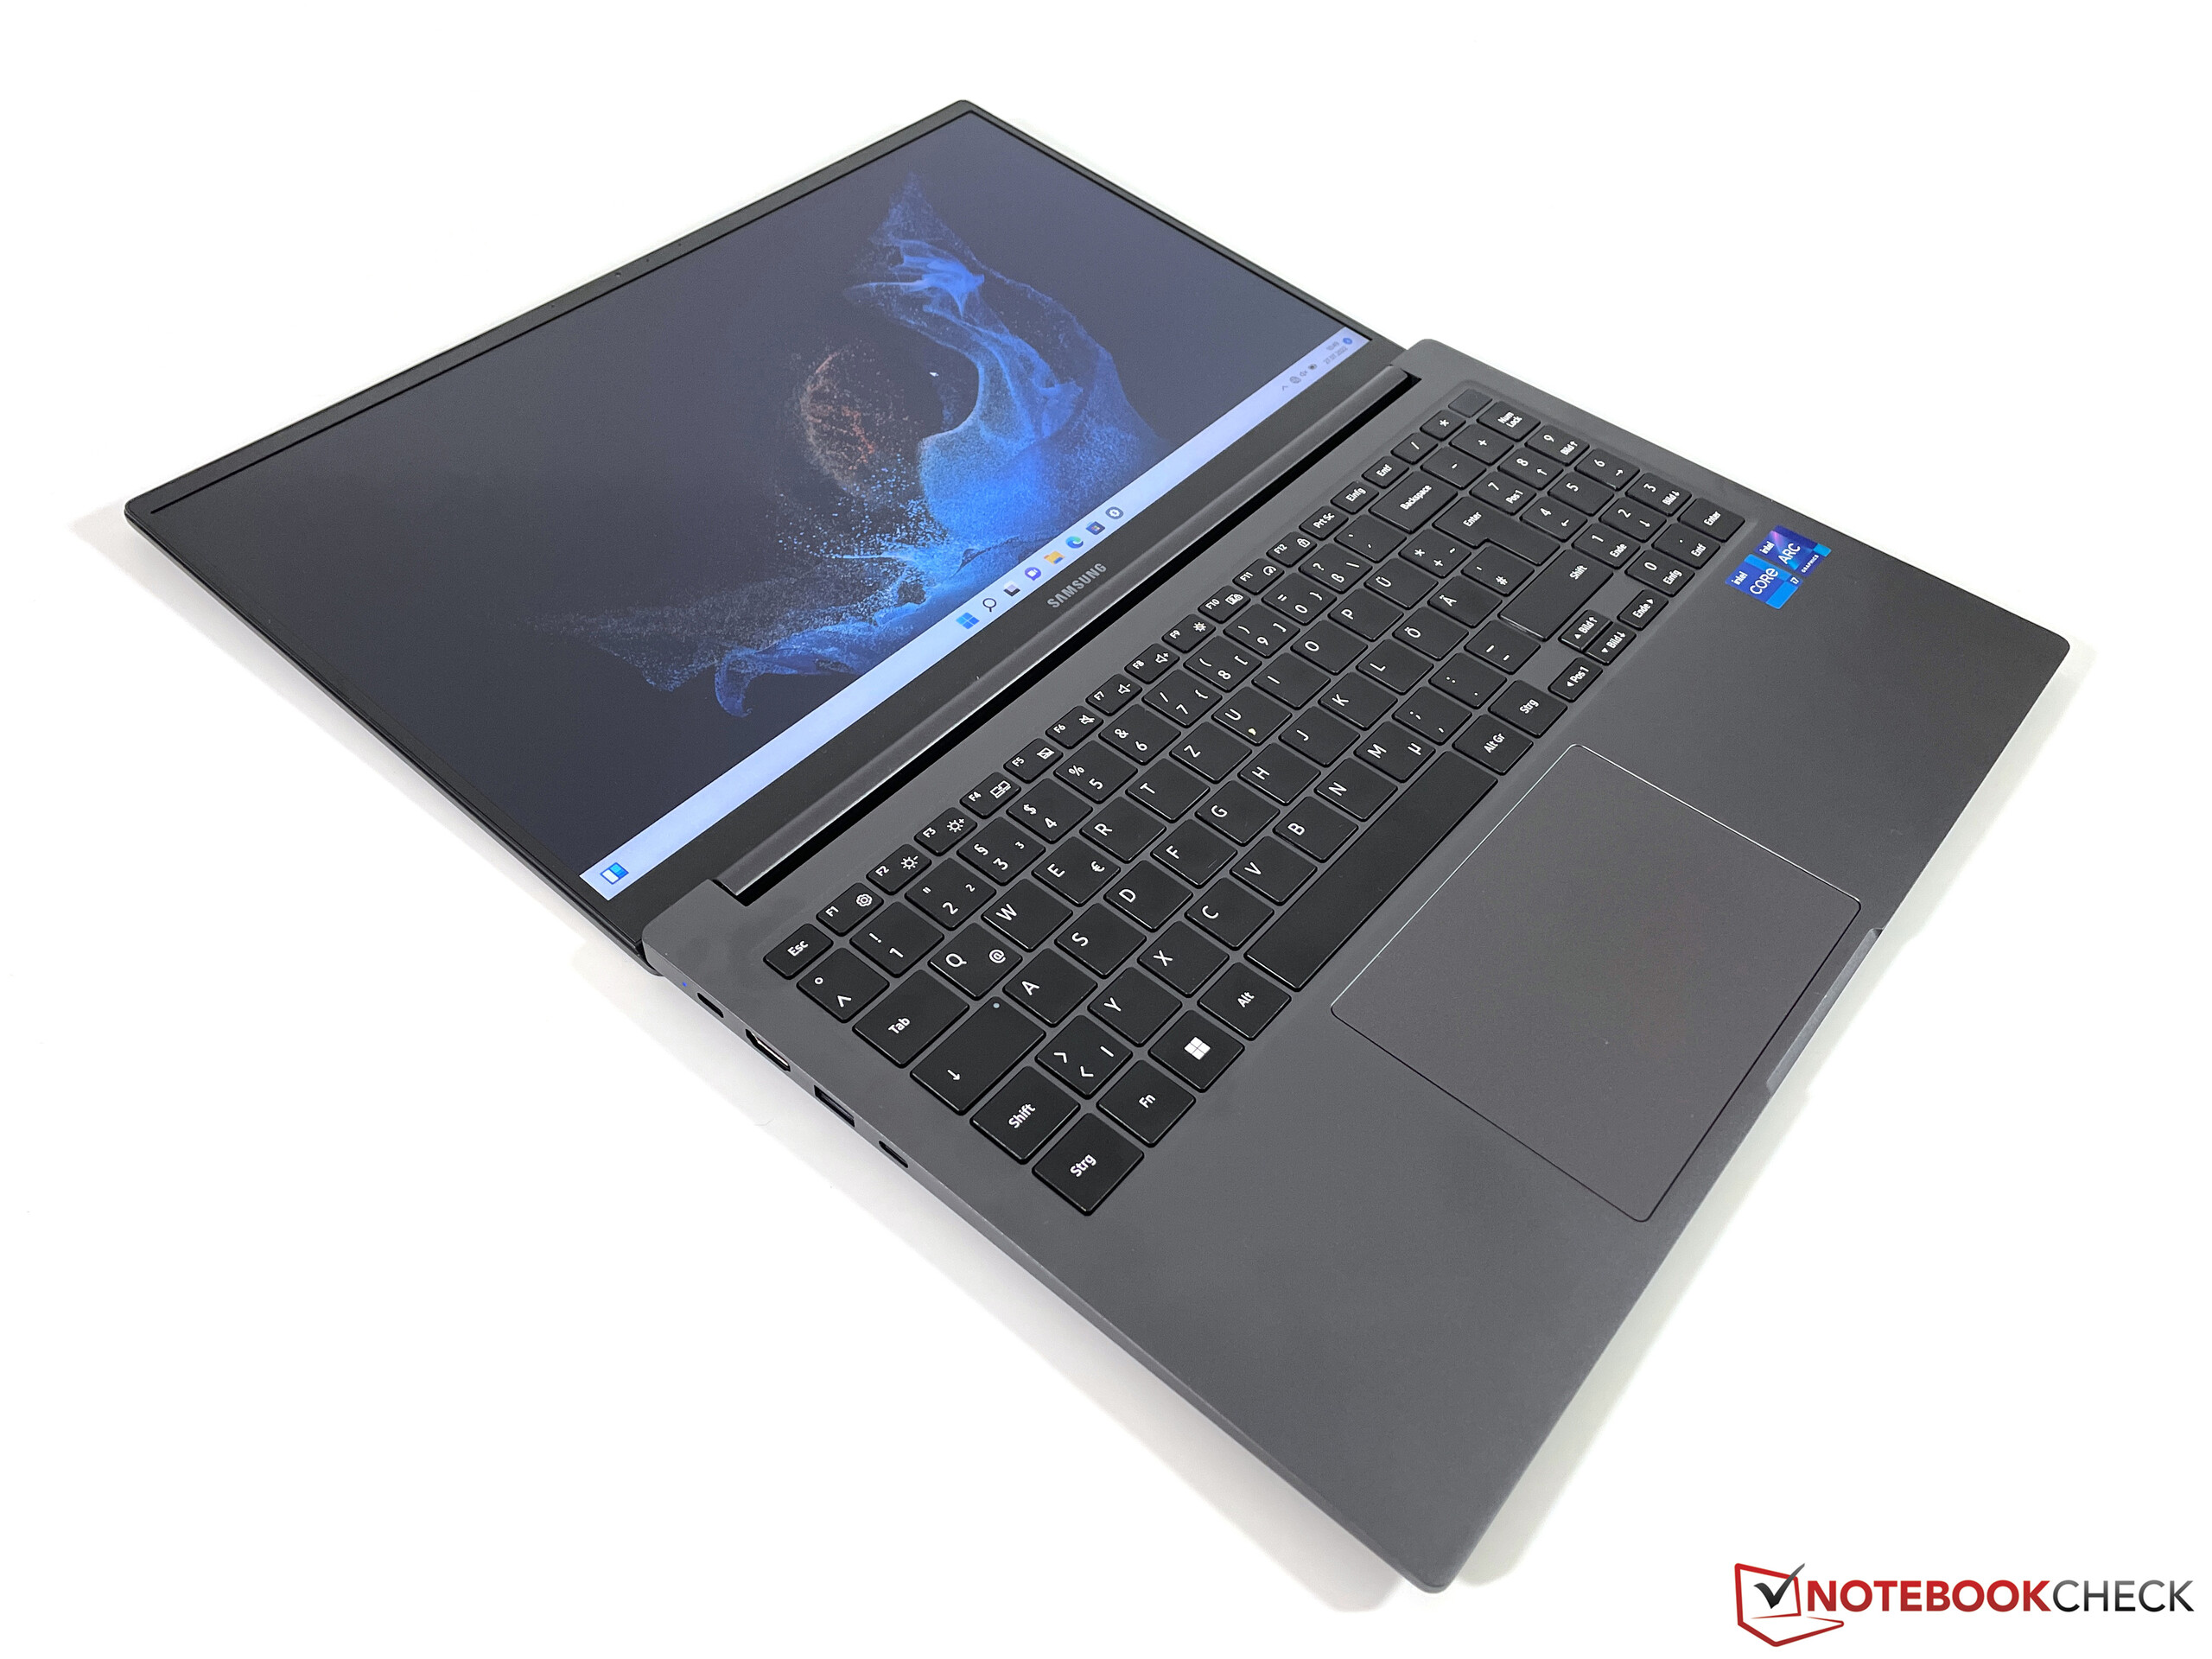
我们对其坚固程度也有异议。例如,键盘在被推动时明显弯曲,我们也能够很容易地扭曲显示屏上的图像。此外,尽管屏幕铰链可以让你将显示屏打开到180°角,但它也表现出明显的摇摆。总的来说,这款笔记本电脑给人的感觉完全不像是一款上市价格为1300欧元(1300美元)的产品。
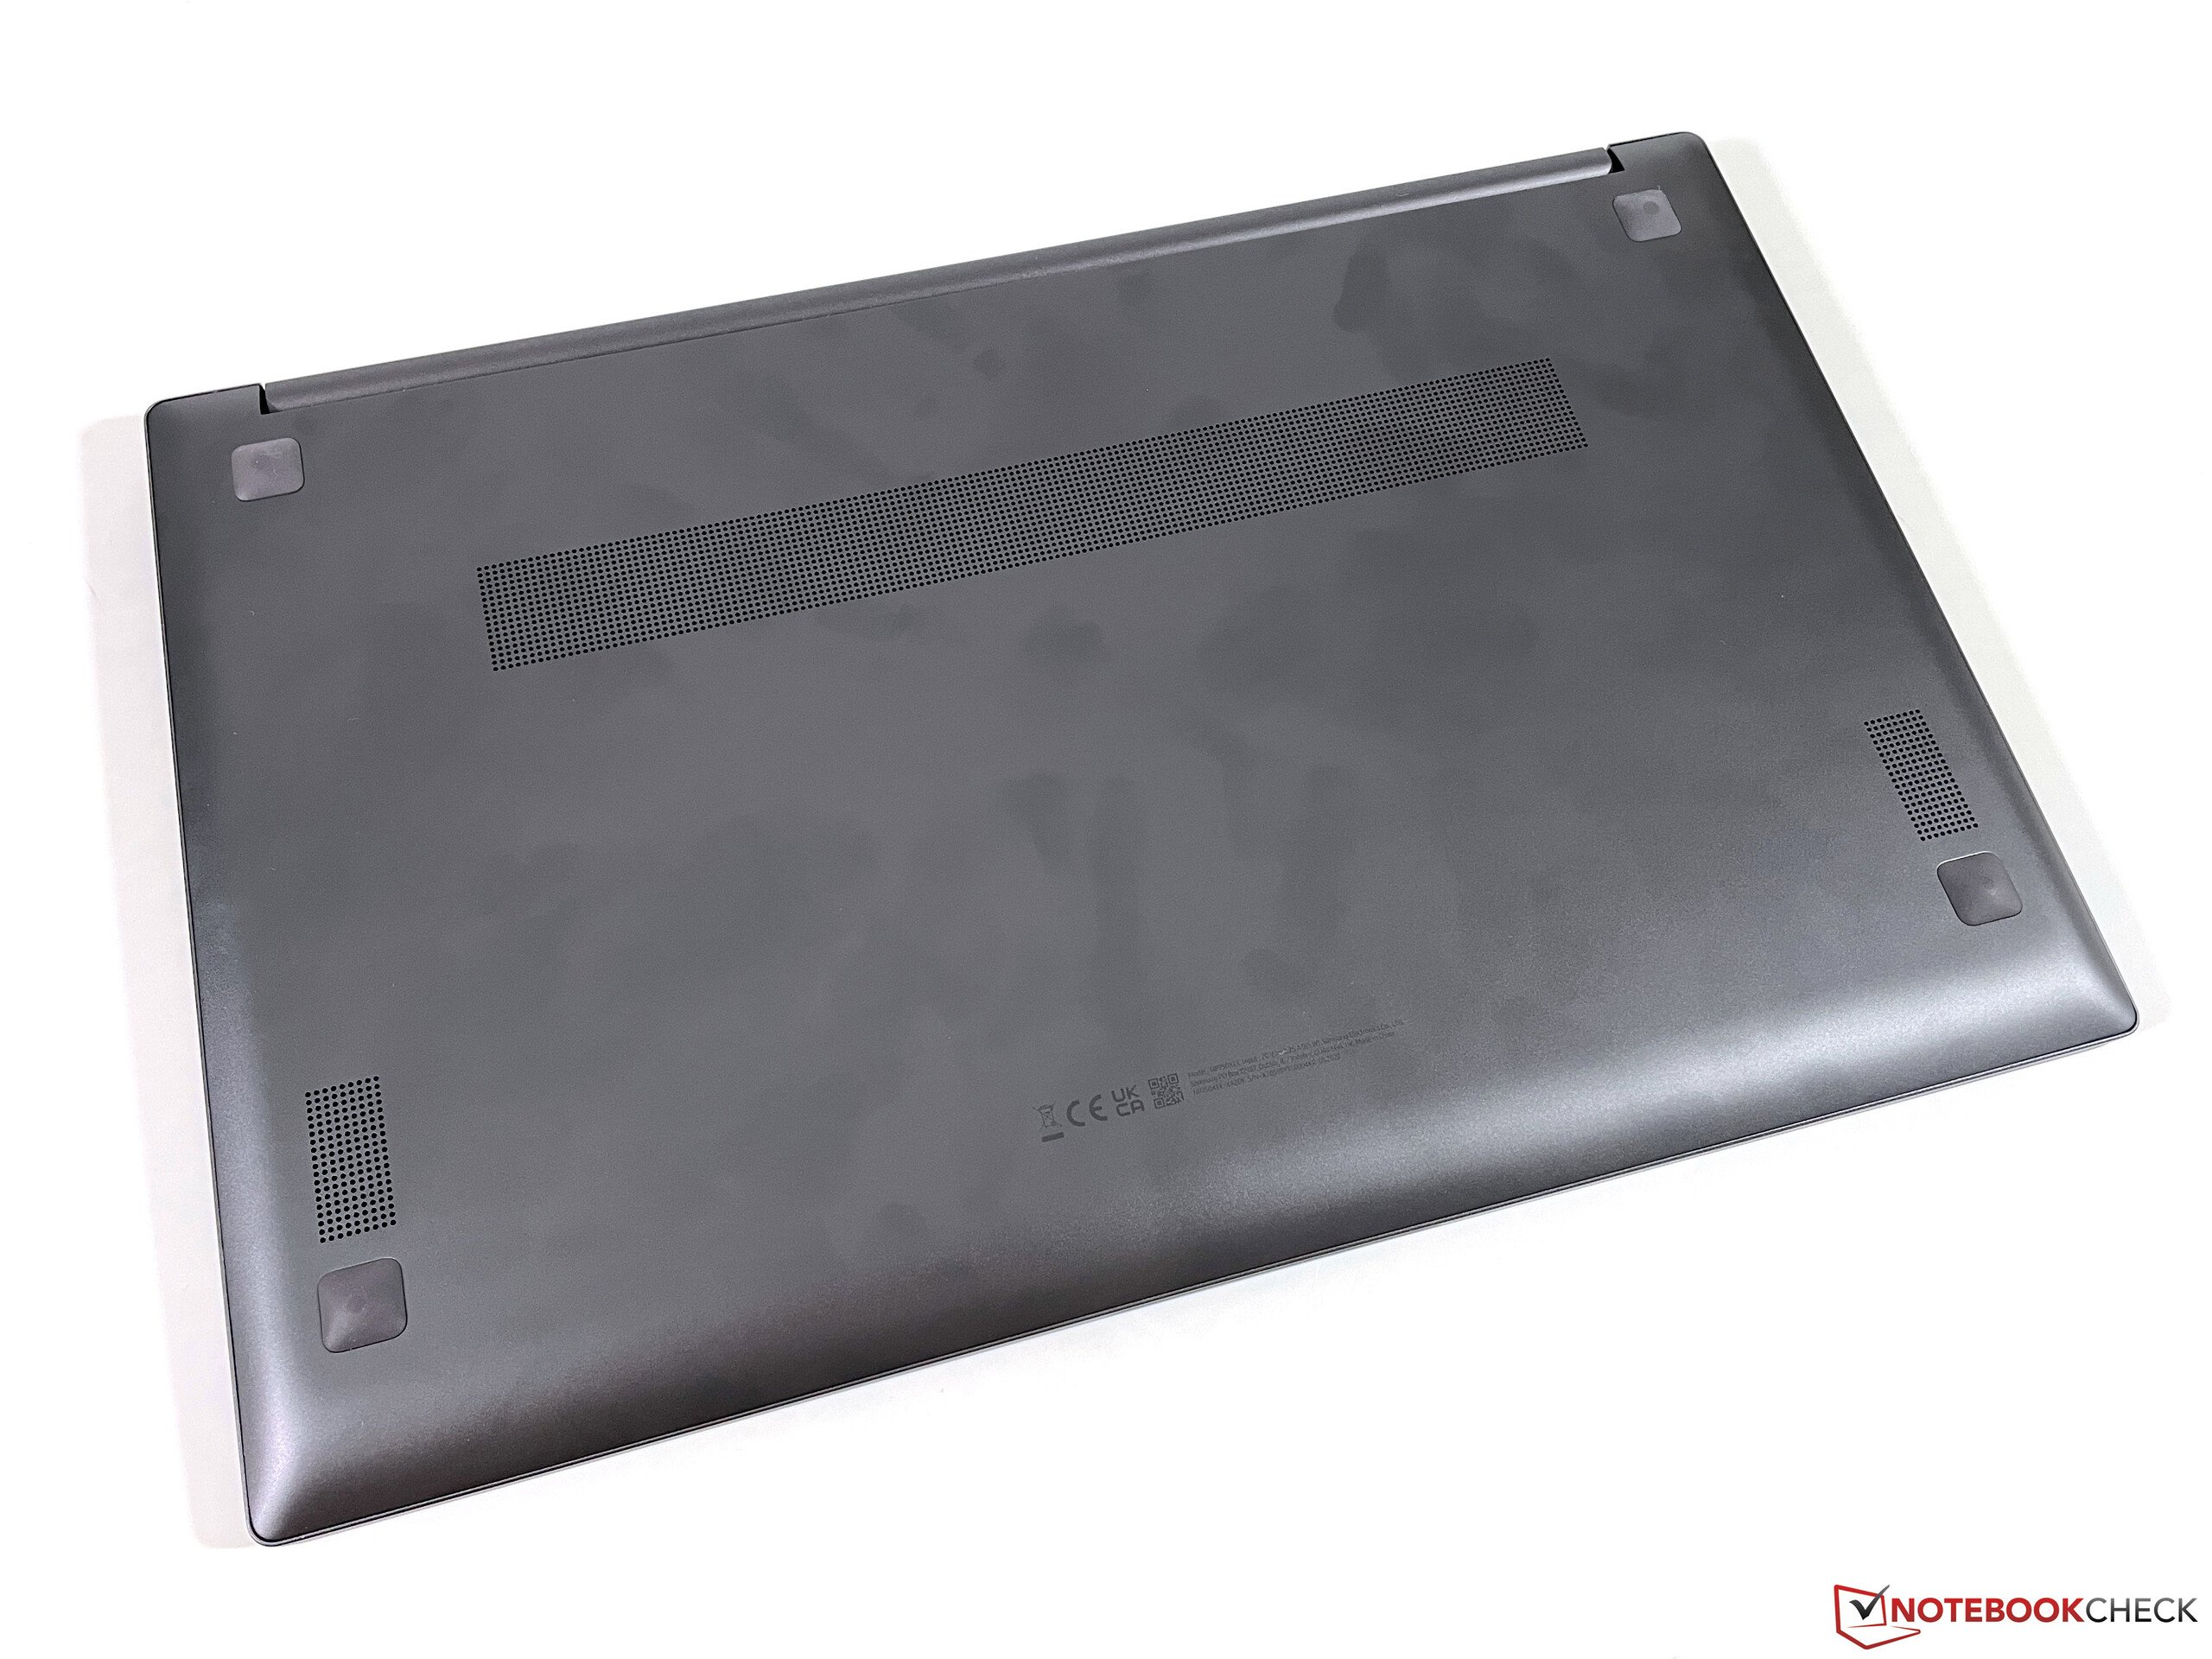
Galaxy Book2的重量略低于1.6公斤(3.5磅),是我们比较中的设备中最轻、最紧凑的笔记本电脑之一。三星为该设备配备了一个紧凑的65瓦壁式充电器,连同USB-C电缆仅重183克(0.4磅)。
连接性 - 支持Wi-Fi 6
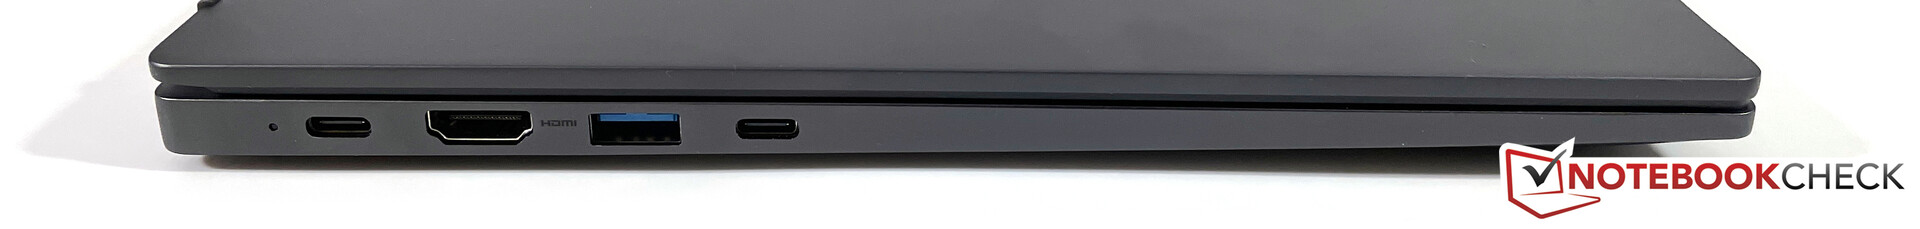
这款笔记本电脑有很好的现代USB-C端口、常规USB-A端口和一个HDMI输出。这意味着,在没有外部集线器或适配器的情况下,你使用这台笔记本电脑就可以了。然而,三星没有包括USB 4或Thunderbolt,这限制了该设备与扩展坞的使用。

SD卡阅读器
在右边,有一个microSD读卡器,通过USB 2.0在内部连接。因此,在我们的参考卡(Angelbird AV Pro V60)上,读卡器只能以最高26MB/s的速度传输数据。
| SD Card Reader | |
| average JPG Copy Test (av. of 3 runs) | |
| Average of class Multimedia (23 - 531, n=37, last 2 years) | |
| HP Pavilion 15-eg (AV PRO microSD 128 GB V60) | |
| Samsung Galaxy Book NP750XDA (AV PRO microSD 128 GB V60) | |
| Asus Vivobook 15 K513EQ (AV Pro V60) | |
| Samsung Galaxy Book2 15 (Angelbird AV Pro V60) | |
| Dell Inspiron 15 Plus (AV PRO microSD 128 GB V60) | |
| Lenovo ThinkBook 15p G2 ITH 21B1000YGE (AV Pro V60) | |
| maximum AS SSD Seq Read Test (1GB) | |
| Average of class Multimedia (37.3 - 1455, n=36, last 2 years) | |
| HP Pavilion 15-eg (AV PRO microSD 128 GB V60) | |
| Asus Vivobook 15 K513EQ (AV Pro V60) | |
| Samsung Galaxy Book NP750XDA (AV PRO microSD 128 GB V60) | |
| Lenovo ThinkBook 15p G2 ITH 21B1000YGE (AV Pro V60) | |
| Samsung Galaxy Book2 15 (Angelbird AV Pro V60) | |
沟通
尽管三星没有包括Wi-Fi 6E模块(6GHz),但该笔记本电脑仍然配备了英特尔AX201,这是一个优秀的Wi-Fi模块,支持Wi-Fi 6(802.11ax,2x2)。在使用我们的华硕参考路由器进行测试时,数据传输率在1.6Gbit/s左右,也非常稳定。这款笔记本电脑还支持蓝牙5.1,但没有LTE或5G模块。
| Networking | |
| iperf3 transmit AX12 | |
| Samsung Galaxy Book NP750XDA | |
| Lenovo ThinkBook 15p G2 ITH 21B1000YGE | |
| HP Pavilion 15-eg | |
| Average Intel Wi-Fi 6 AX201 (49.8 - 1775, n=324) | |
| Asus Vivobook 15 K513EQ | |
| iperf3 receive AX12 | |
| Lenovo ThinkBook 15p G2 ITH 21B1000YGE | |
| Samsung Galaxy Book NP750XDA | |
| HP Pavilion 15-eg | |
| Asus Vivobook 15 K513EQ | |
| Average Intel Wi-Fi 6 AX201 (136 - 1743, n=324) | |
| iperf3 transmit AXE11000 | |
| Samsung Galaxy Book2 15 | |
| Average of class Multimedia (606 - 1978, n=54, last 2 years) | |
| Average Intel Wi-Fi 6 AX201 (438 - 1715, n=74) | |
| iperf3 receive AXE11000 | |
| Samsung Galaxy Book2 15 | |
| Dell Inspiron 15 Plus | |
| Average Intel Wi-Fi 6 AX201 (390 - 1734, n=79) | |
| Average of class Multimedia (682 - 1818, n=54, last 2 years) | |
网络摄像头
位于边框顶部的网络摄像头只使用了一个720p的传感器。虽然它能完成工作,但即使在良好的照明条件下,图像质量也不是很好。既没有机械的网络摄像头盖,也没有用于Windows Hello面部认证的红外摄像头。


维护
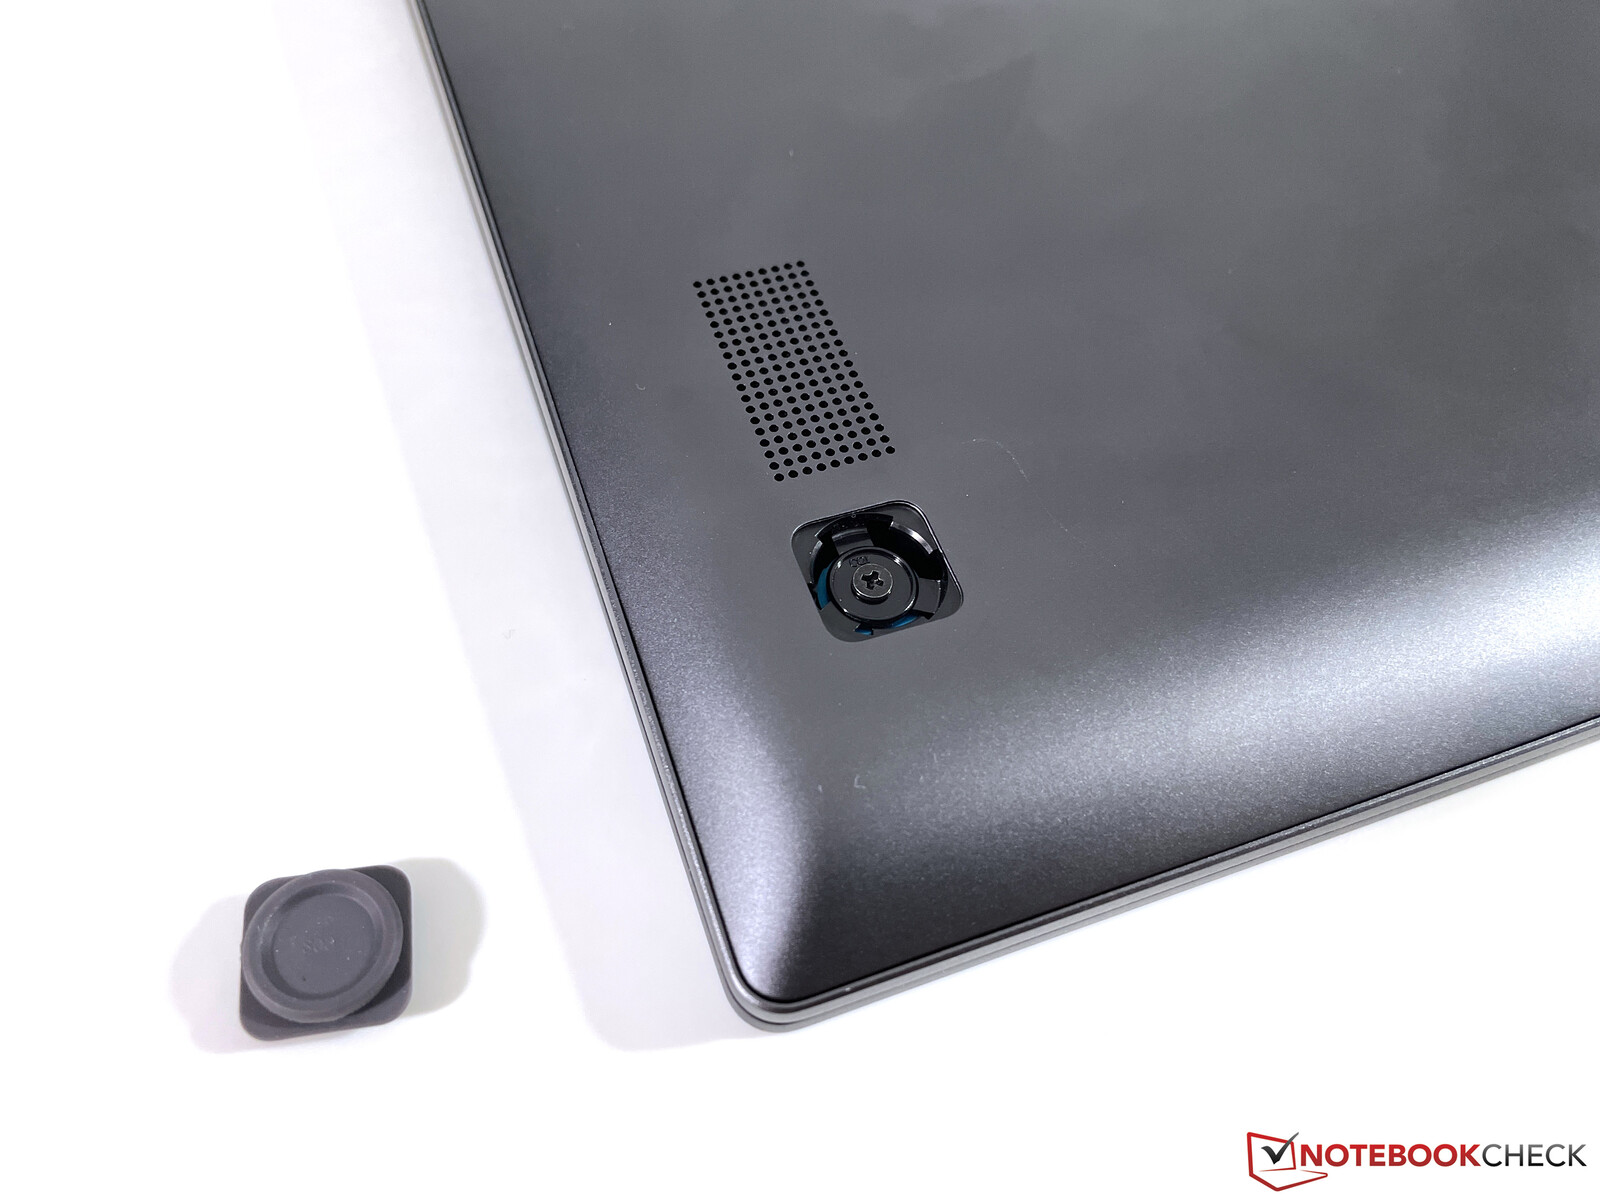
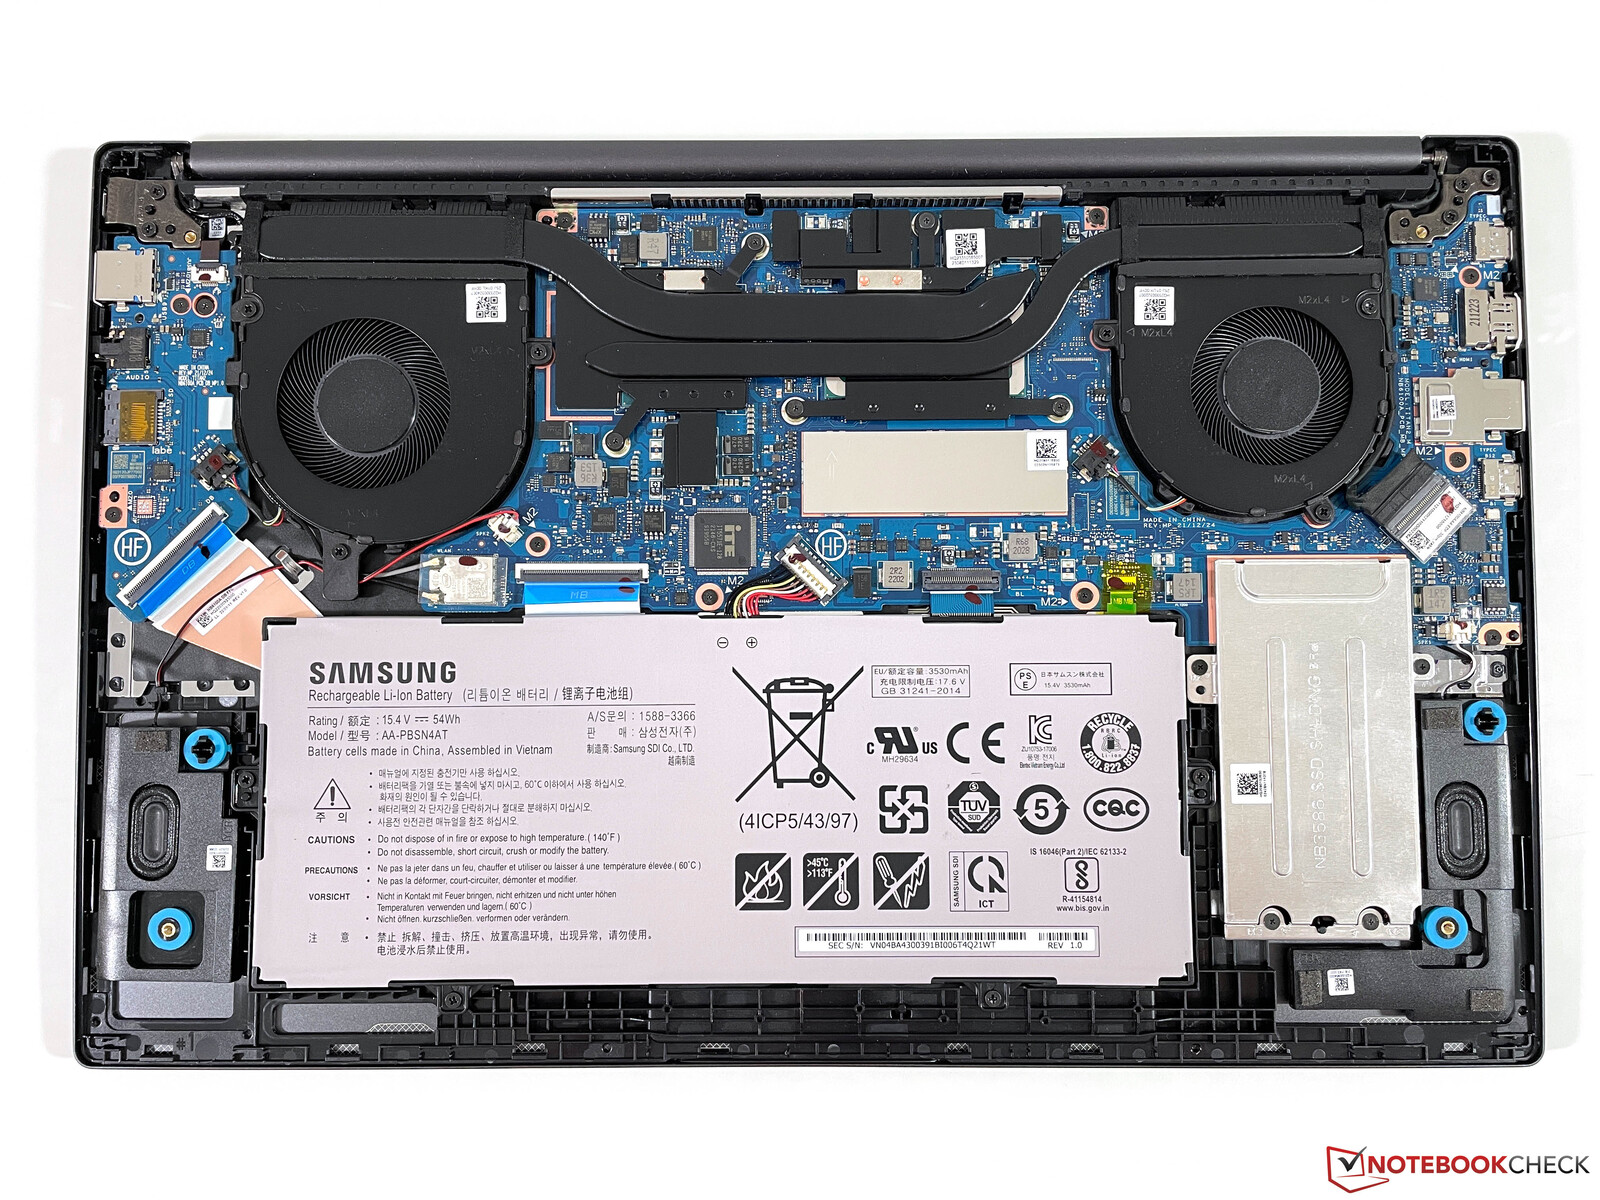
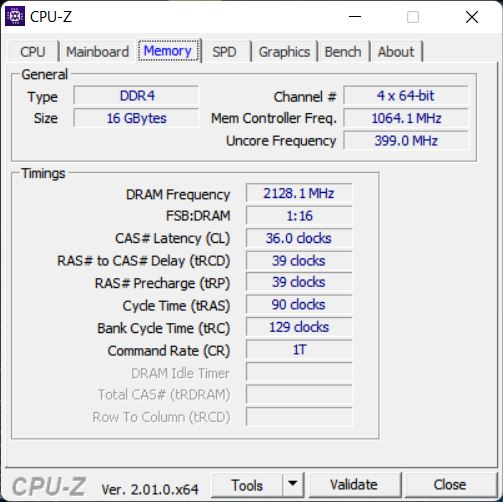
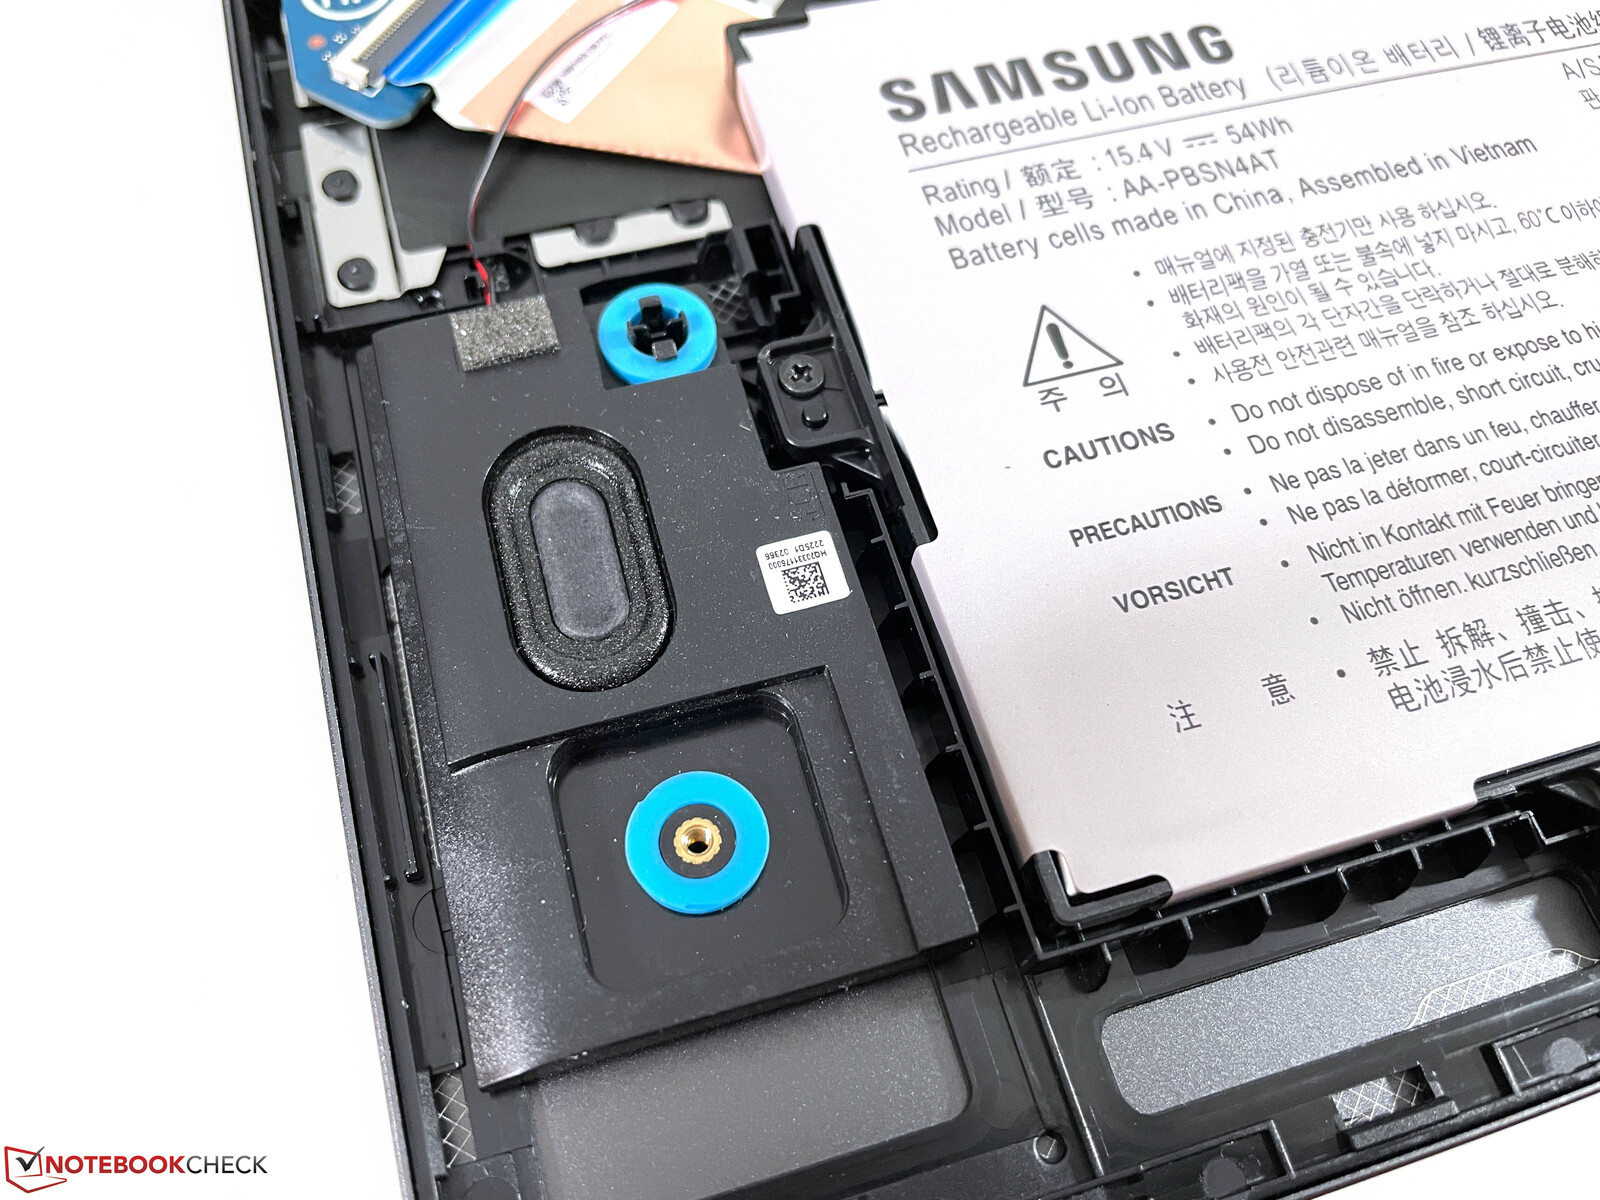
底部的盖子相对来说比较容易拆卸,因为三星把四个十字螺丝藏在了橡胶脚下,这些橡胶脚是插着的而不是粘着的。在笔记本内部,你可以接触到风扇、Wi-Fi模块和两个SSD插槽(在一个额外的盖子下面)。板载内存(LPDDR4x-4266)是焊接的,不能扩展。
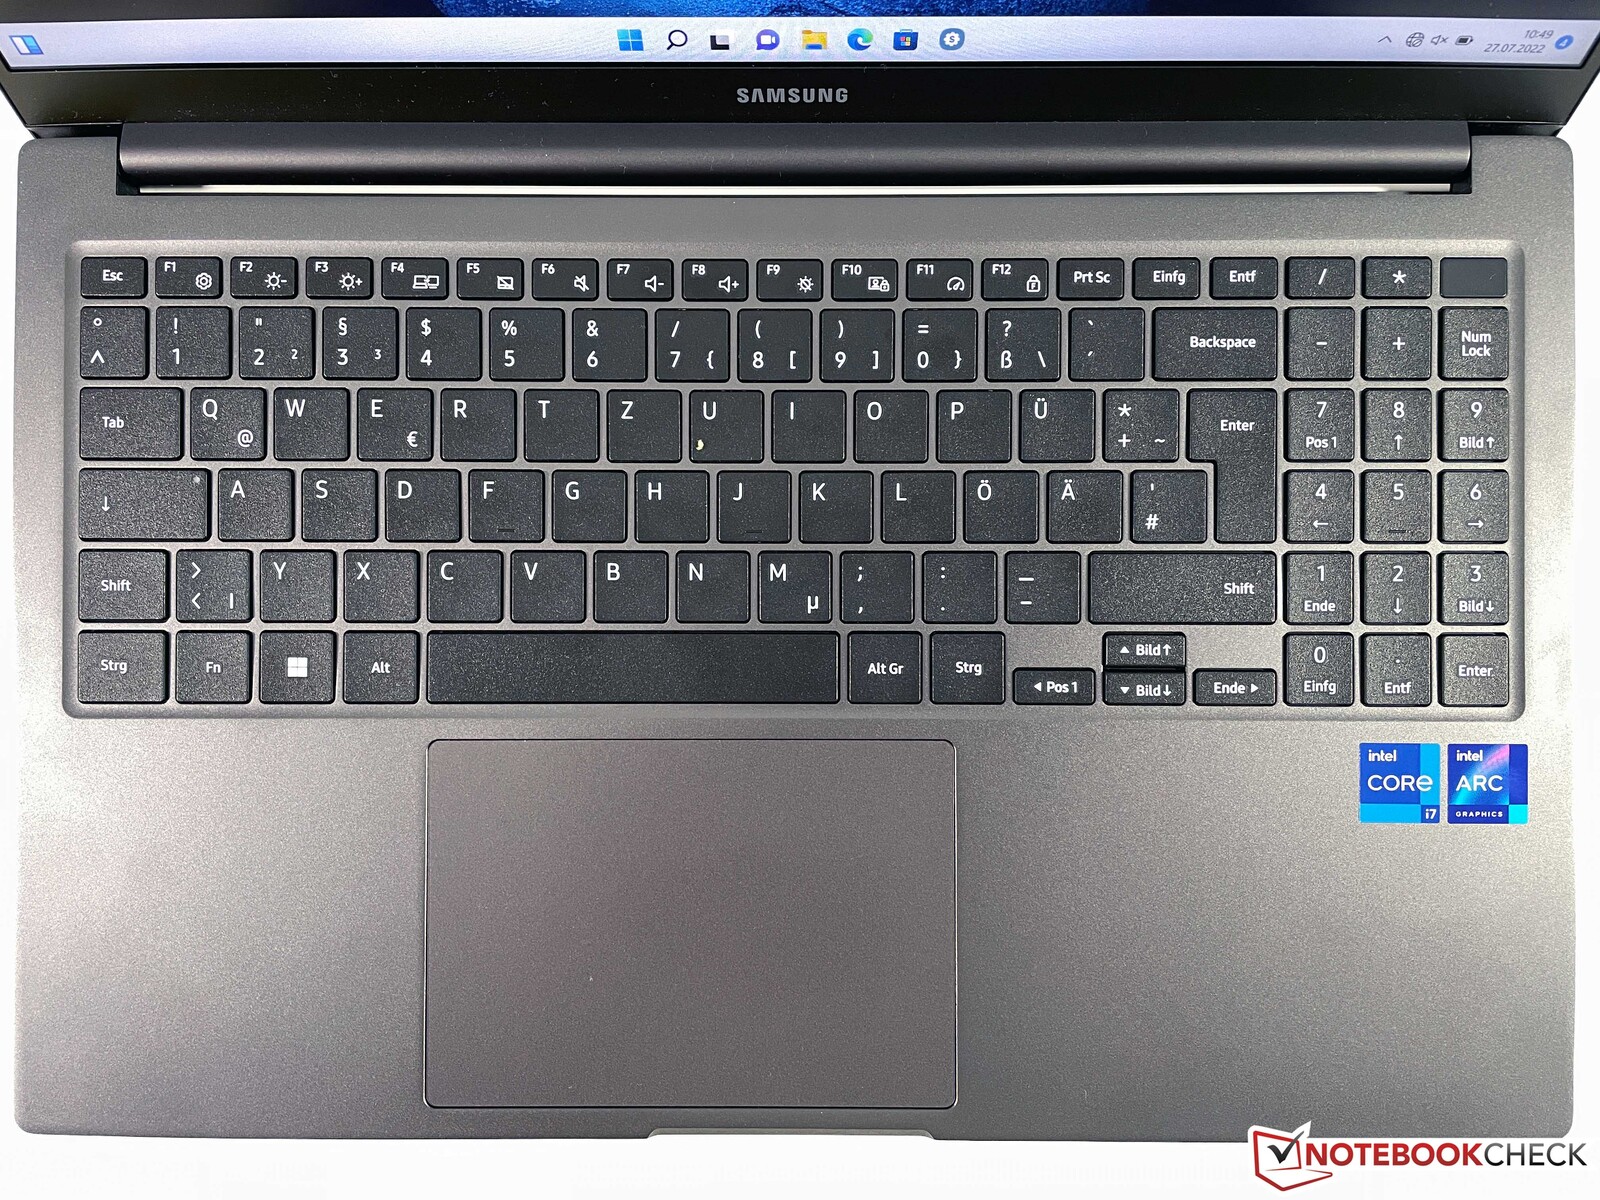
输入设备 - 没有背光键盘
带有专用数字键盘的黑色Chiclet键盘提供了非常浅的行程,最初需要一些时间来适应。一旦你熟悉了这个键盘,它的反应会感觉非常精确,而且击键的声音也不大。然而,方向键非常小。根据规格,右上方的电源按钮应该有一个指纹扫描仪,但在我们的评测单元中并不是这样的。
键盘的另一个问题是缺乏背光灯。这也同样与官方规格表上提供的信息不同。三星的应用程序甚至有一个背光水平的调节器,但在我们的评测单元上没有任何改变。
平滑的点击板工作起来没有任何问题,但点击的声音肯定太大,感觉很廉价。点击板能够正确识别多达四个手指的手势。
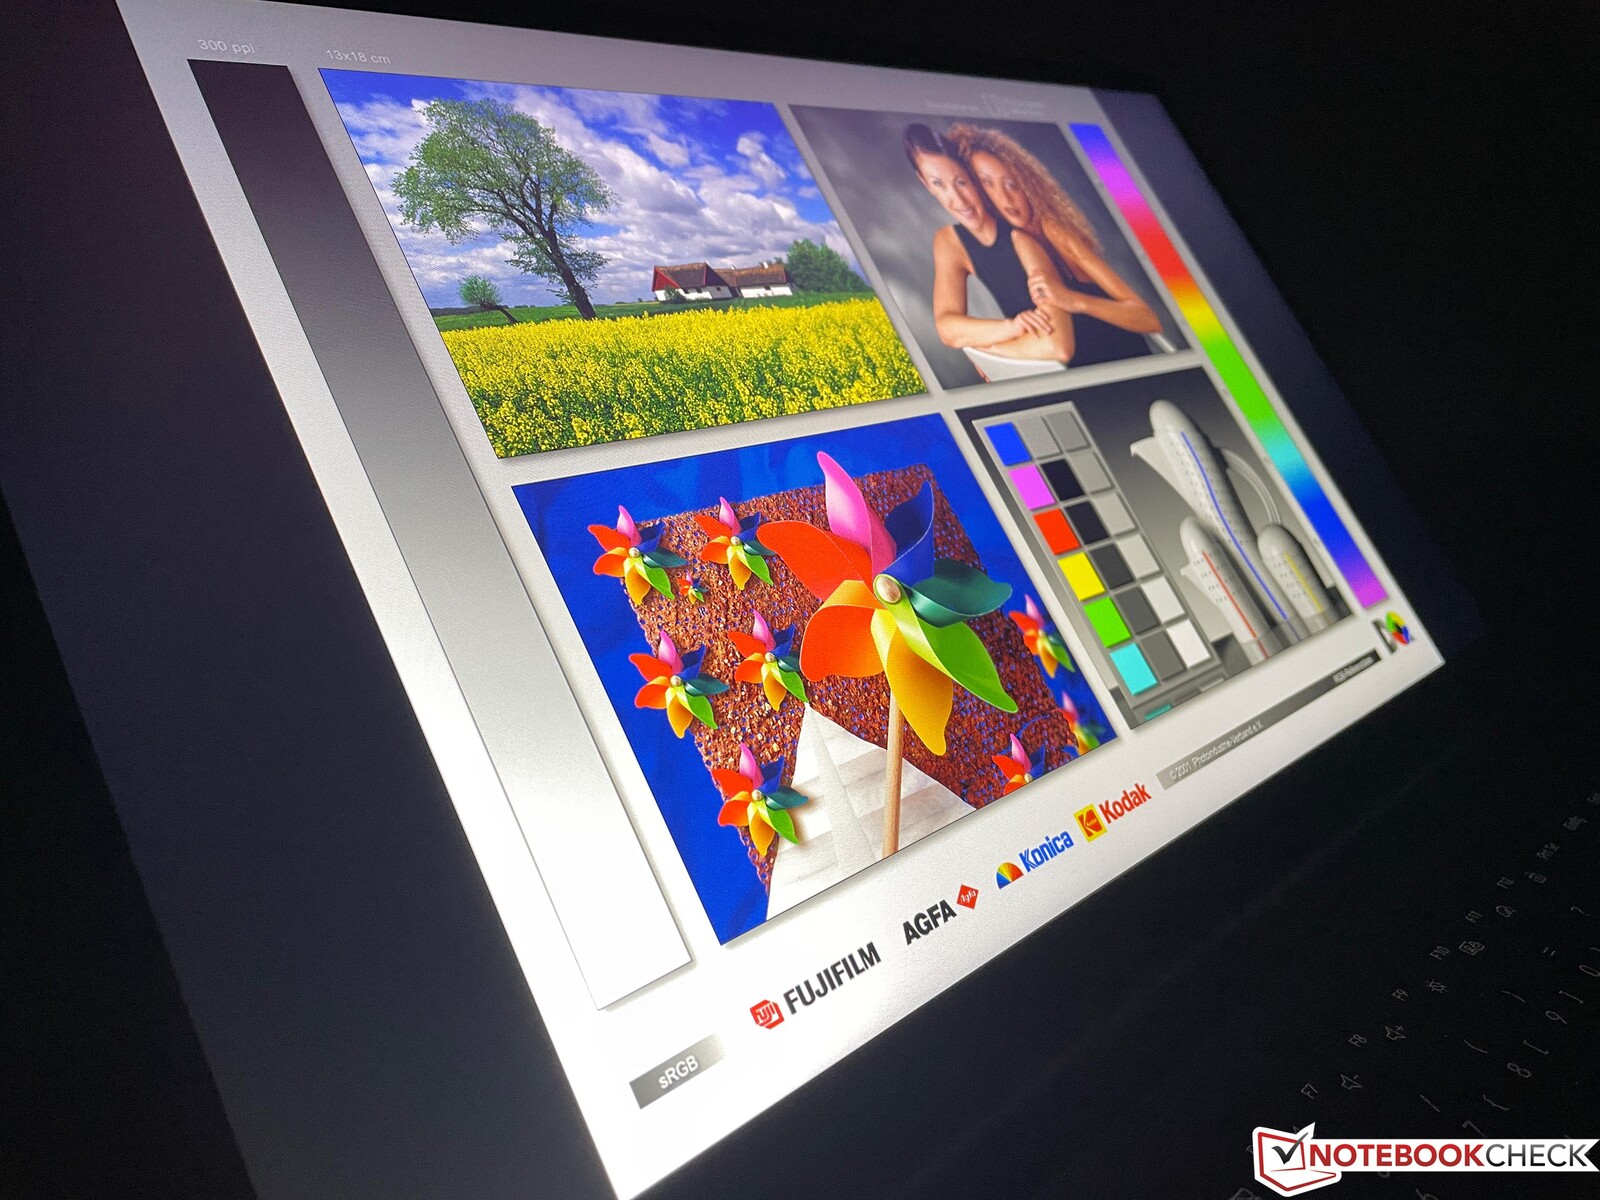
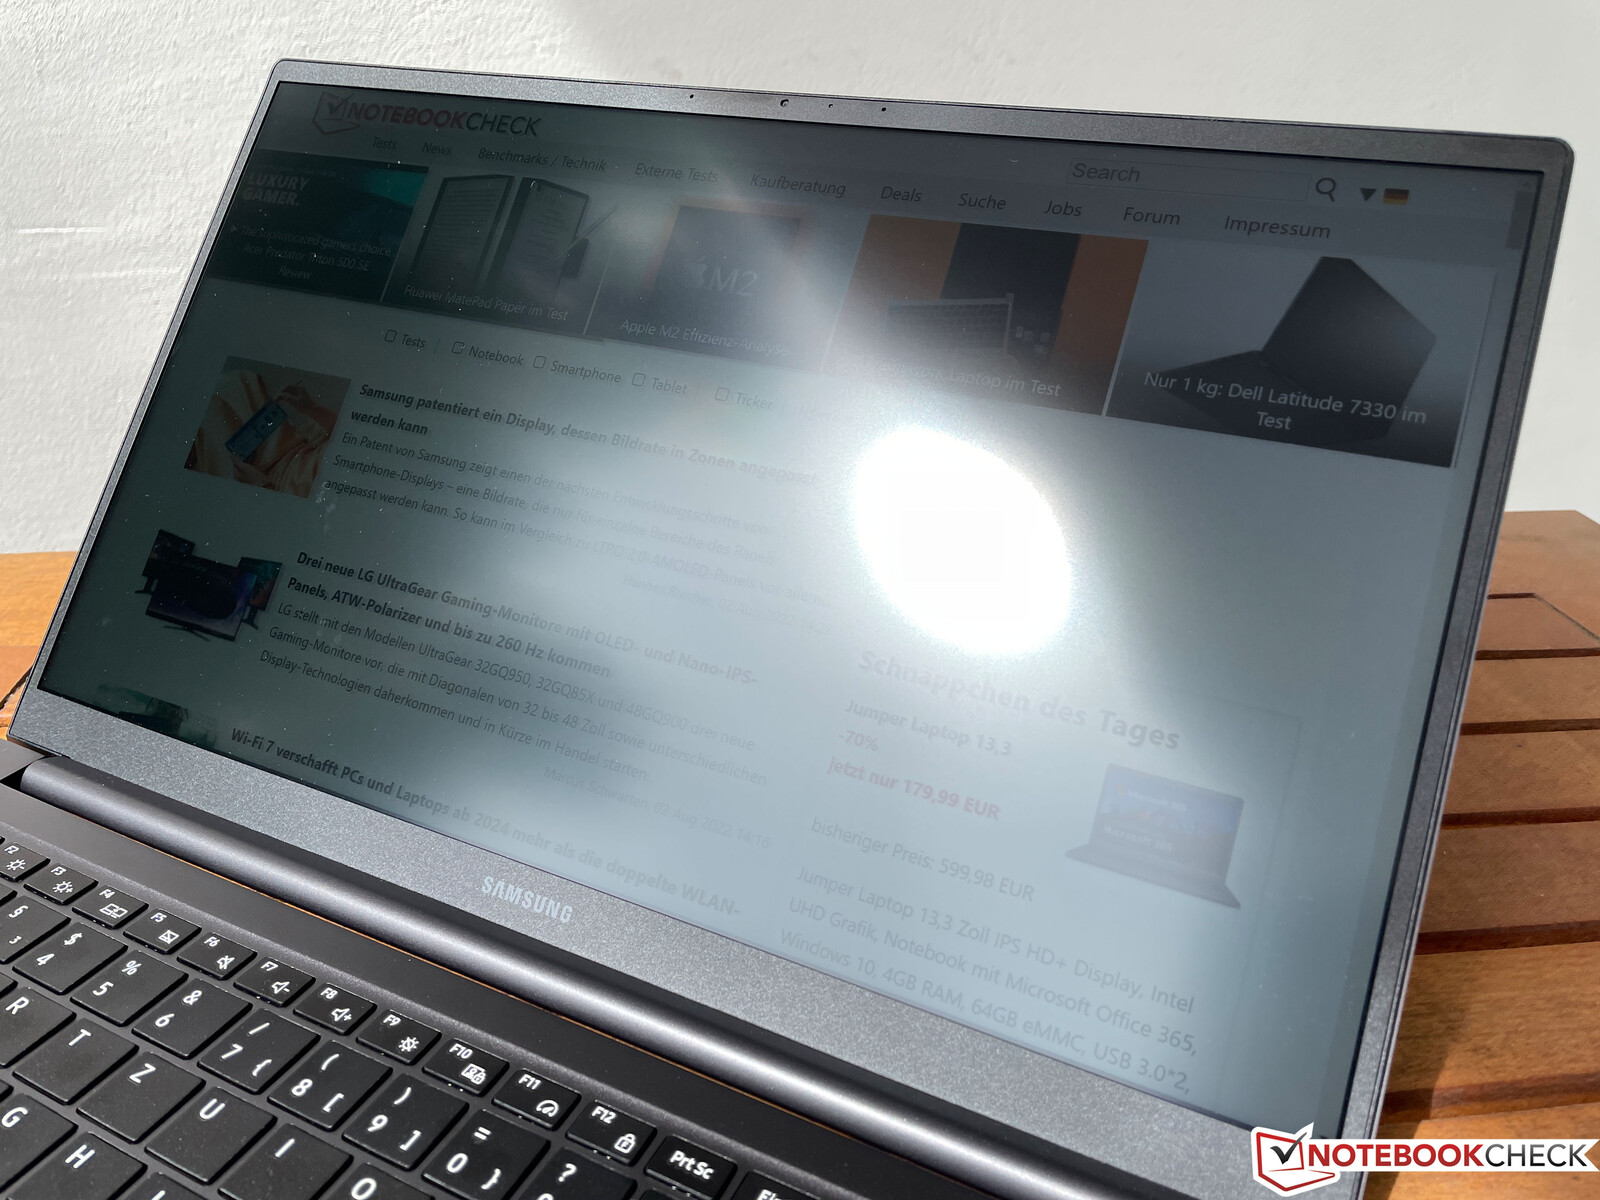
显示屏 - 三星使用廉价的IPS面板
类似于 旧型号Galaxy Book2仍然使用16:9比例的哑光全高清IPS屏幕,但现在的面板是由京东方公司制造。平均约为325cd/m²,新面板比以前的面板略微明亮,但它的黑度更差(0.4),导致对比度只有843:1。此外,该屏幕还具有明显的蓝色色调,整体的主观图像质量根本不好。相比之下,颜色显得暗淡,图像似乎有些冲淡,但至少明亮的地方看起来没有颗粒感。
该面板具有典型的响应时间和明显的宽视角。我们也没有发现任何PWM闪烁。然而,当显示器显示黑暗的图像时,在边缘有明显的IPS发光。

| |||||||||||||||||||||||||
Brightness Distribution: 89 %
Center on Battery: 337 cd/m²
Contrast: 843:1 (Black: 0.4 cd/m²)
ΔE ColorChecker Calman: 4.7 | ∀{0.5-29.43 Ø4.71}
calibrated: 2.8
ΔE Greyscale Calman: 5.4 | ∀{0.09-98 Ø4.96}
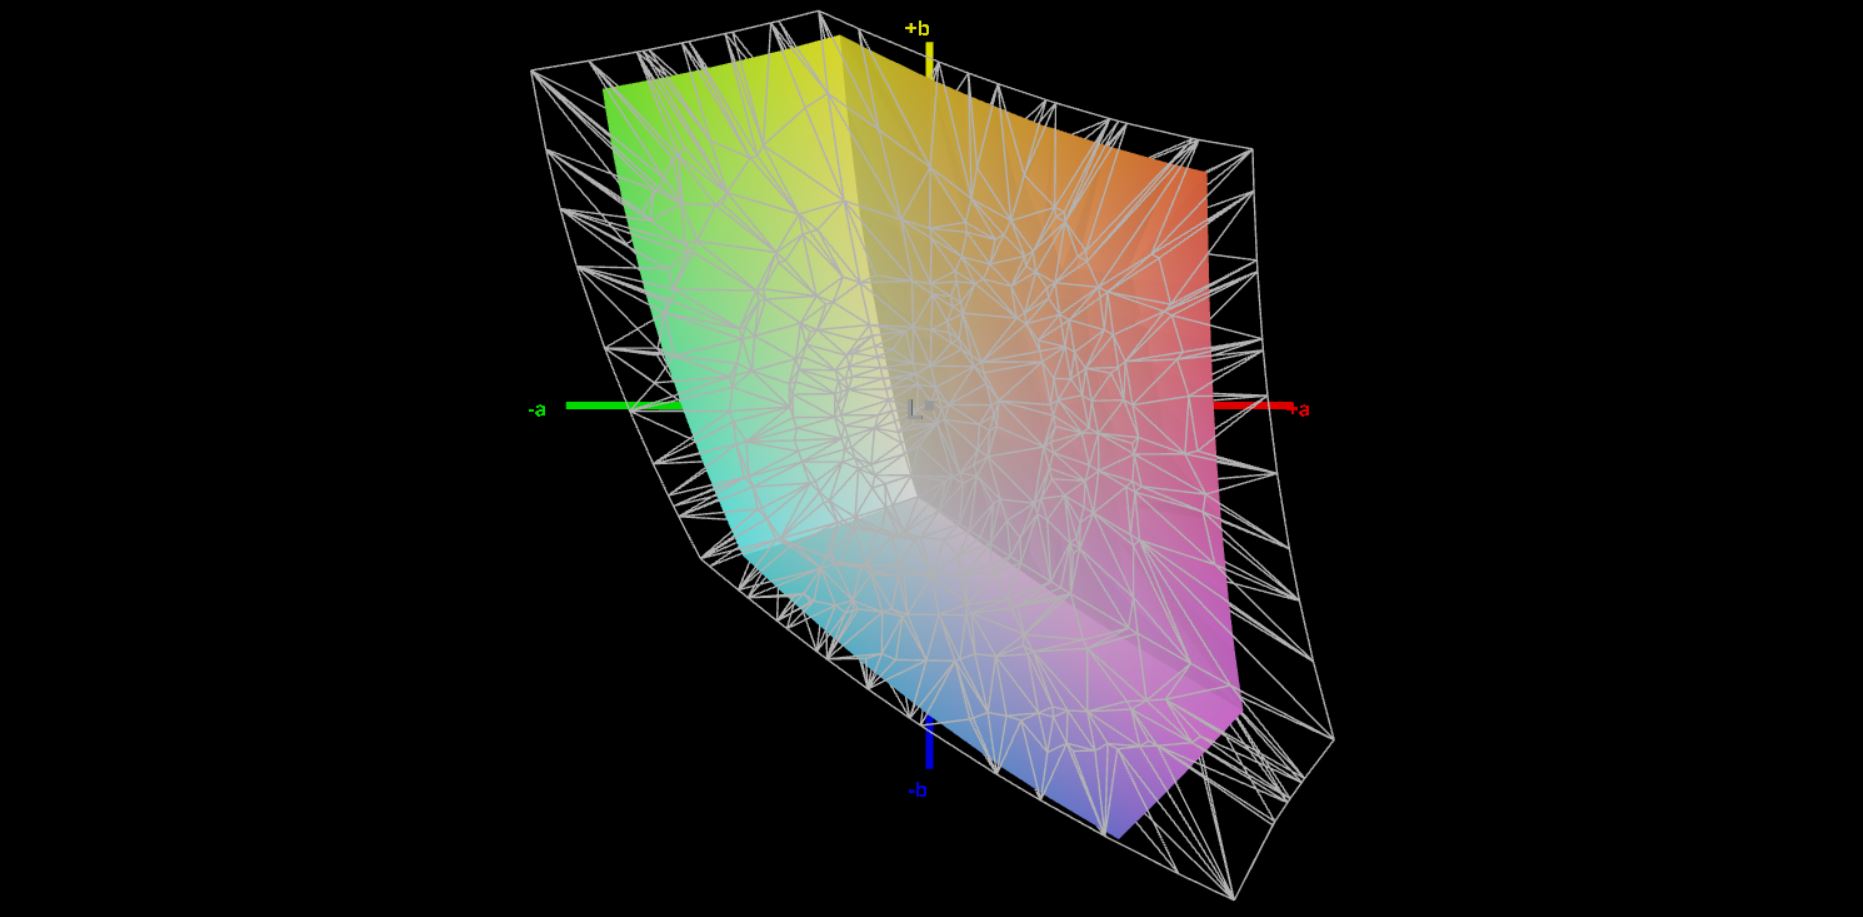
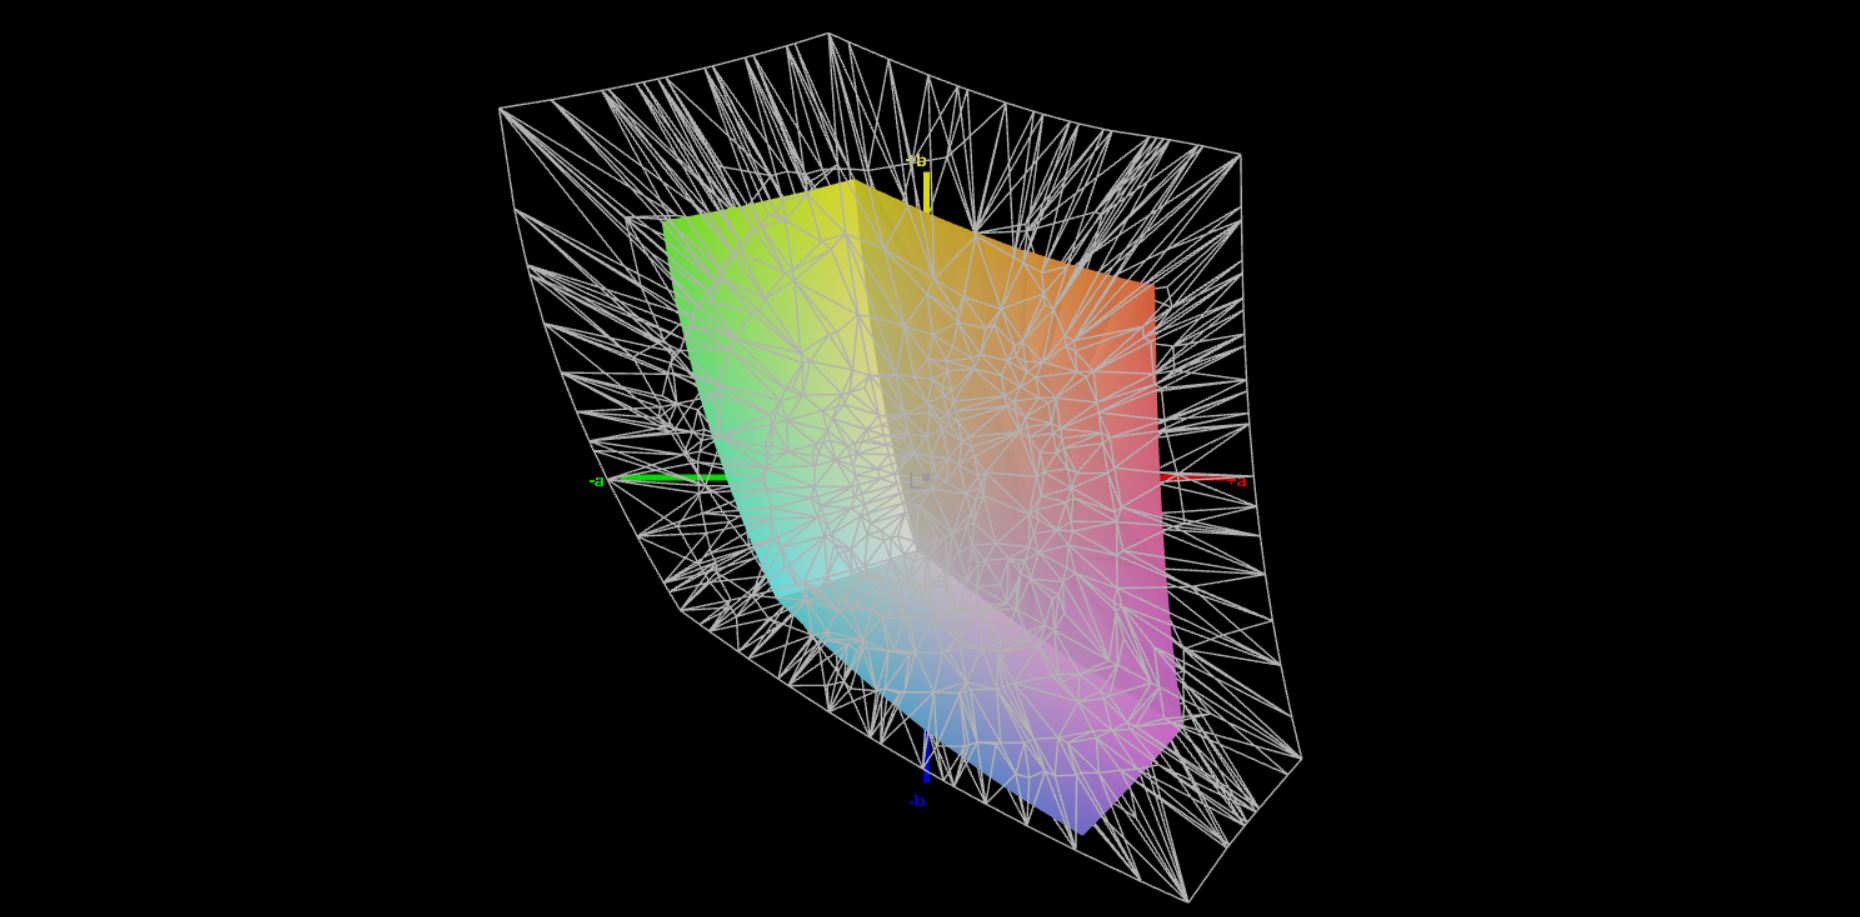
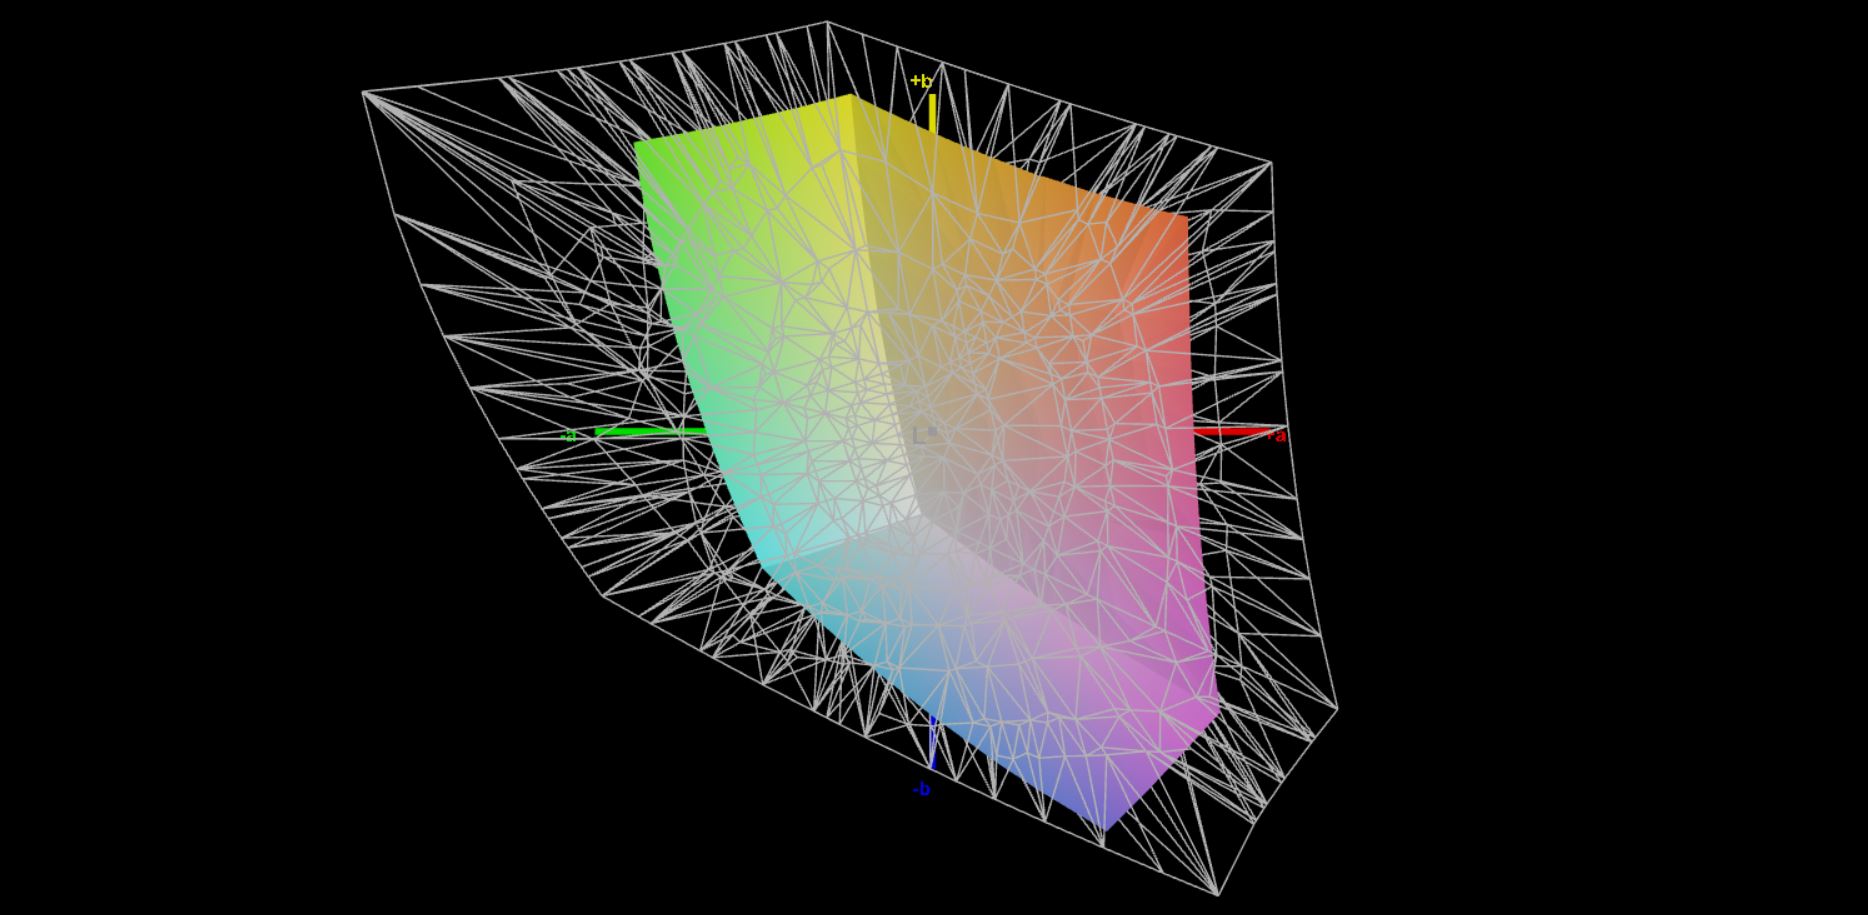
51.3% AdobeRGB 1998 (Argyll 3D)
74.8% sRGB (Argyll 3D)
49.6% Display P3 (Argyll 3D)
Gamma: 2.07
CCT: 7727 K
| Samsung Galaxy Book2 15 NE156FHM-NS0, IPS, 1920x1080, 15.6" | Dell Inspiron 15 Plus Dell INSPIRON LGD06A6, IPS, 1920x1080, 15.6" | Asus Vivobook 15 K513EQ Samsung ATNA56YX03-0, OLED, 1920x1080, 15.6" | Lenovo ThinkBook 15p G2 ITH 21B1000YGE LEN156UHD, IPS, 3840x2160, 15.6" | HP Pavilion 15-eg Chi Mei CMN1523, IPS, 1920x1080, 15.6" | Samsung Galaxy Book NP750XDA CEC PANDA LM156LF5L03, IPS, 1920x1080, 15.6" | |
|---|---|---|---|---|---|---|
| Display | 27% | 77% | 70% | -14% | ||
| Display P3 Coverage (%) | 49.6 | 64.1 29% | 99.9 101% | 90.2 82% | 42.9 -14% | |
| sRGB Coverage (%) | 74.8 | 92.8 24% | 100 34% | 100 34% | 64 -14% | |
| AdobeRGB 1998 Coverage (%) | 51.3 | 66.2 29% | 99.9 95% | 100 95% | 44.4 -13% | |
| Response Times | 8% | 91% | -66% | 18% | 11% | |
| Response Time Grey 50% / Grey 80% * (ms) | 32.3 ? | 31.6 ? 2% | 2.2 ? 93% | 66 ? -104% | 22.8 ? 29% | 29 ? 10% |
| Response Time Black / White * (ms) | 25 ? | 21.6 ? 14% | 2.9 ? 88% | 32 ? -28% | 23.6 ? 6% | 22 ? 12% |
| PWM Frequency (Hz) | 59.5 ? | 26320 ? | ||||
| Screen | 5% | 37% | 43% | 2% | 5% | |
| Brightness middle (cd/m²) | 337 | 298 -12% | 384.5 14% | 542 61% | 294.3 -13% | 325 -4% |
| Brightness (cd/m²) | 325 | 285 -12% | 388 19% | 496 53% | 251 -23% | 297 -9% |
| Brightness Distribution (%) | 89 | 86 -3% | 98 10% | 73 -18% | 76 -15% | 86 -3% |
| Black Level * (cd/m²) | 0.4 | 0.4 -0% | 0.31 23% | 0.26 35% | 0.445 -11% | |
| Contrast (:1) | 843 | 745 -12% | 1748 107% | 1132 34% | 730 -13% | |
| Colorchecker dE 2000 * | 4.7 | 3.68 22% | 2.53 46% | 3.7 21% | 4.08 13% | 3.48 26% |
| Colorchecker dE 2000 max. * | 15.7 | 7.39 53% | 6.16 61% | 5.8 63% | 19.49 -24% | 8.07 49% |
| Colorchecker dE 2000 calibrated * | 2.8 | 2.61 7% | 1.1 61% | 3.7 -32% | ||
| Greyscale dE 2000 * | 5.4 | 5.3 2% | 1.6 70% | 4.4 19% | 3 44% | 5.27 2% |
| Gamma | 2.07 106% | 2.102 105% | 2.24 98% | 2.38 92% | 2.21 100% | 2.41 91% |
| CCT | 7727 84% | 6143 106% | 6464 101% | 7116 91% | 6616 98% | 7769 84% |
| Color Space (Percent of AdobeRGB 1998) (%) | 44 | |||||
| Color Space (Percent of sRGB) (%) | 70 | |||||
| Total Average (Program / Settings) | 13% /
10% | 68% /
57% | 16% /
34% | 2% /
1% | 8% /
6% |
* ... smaller is better
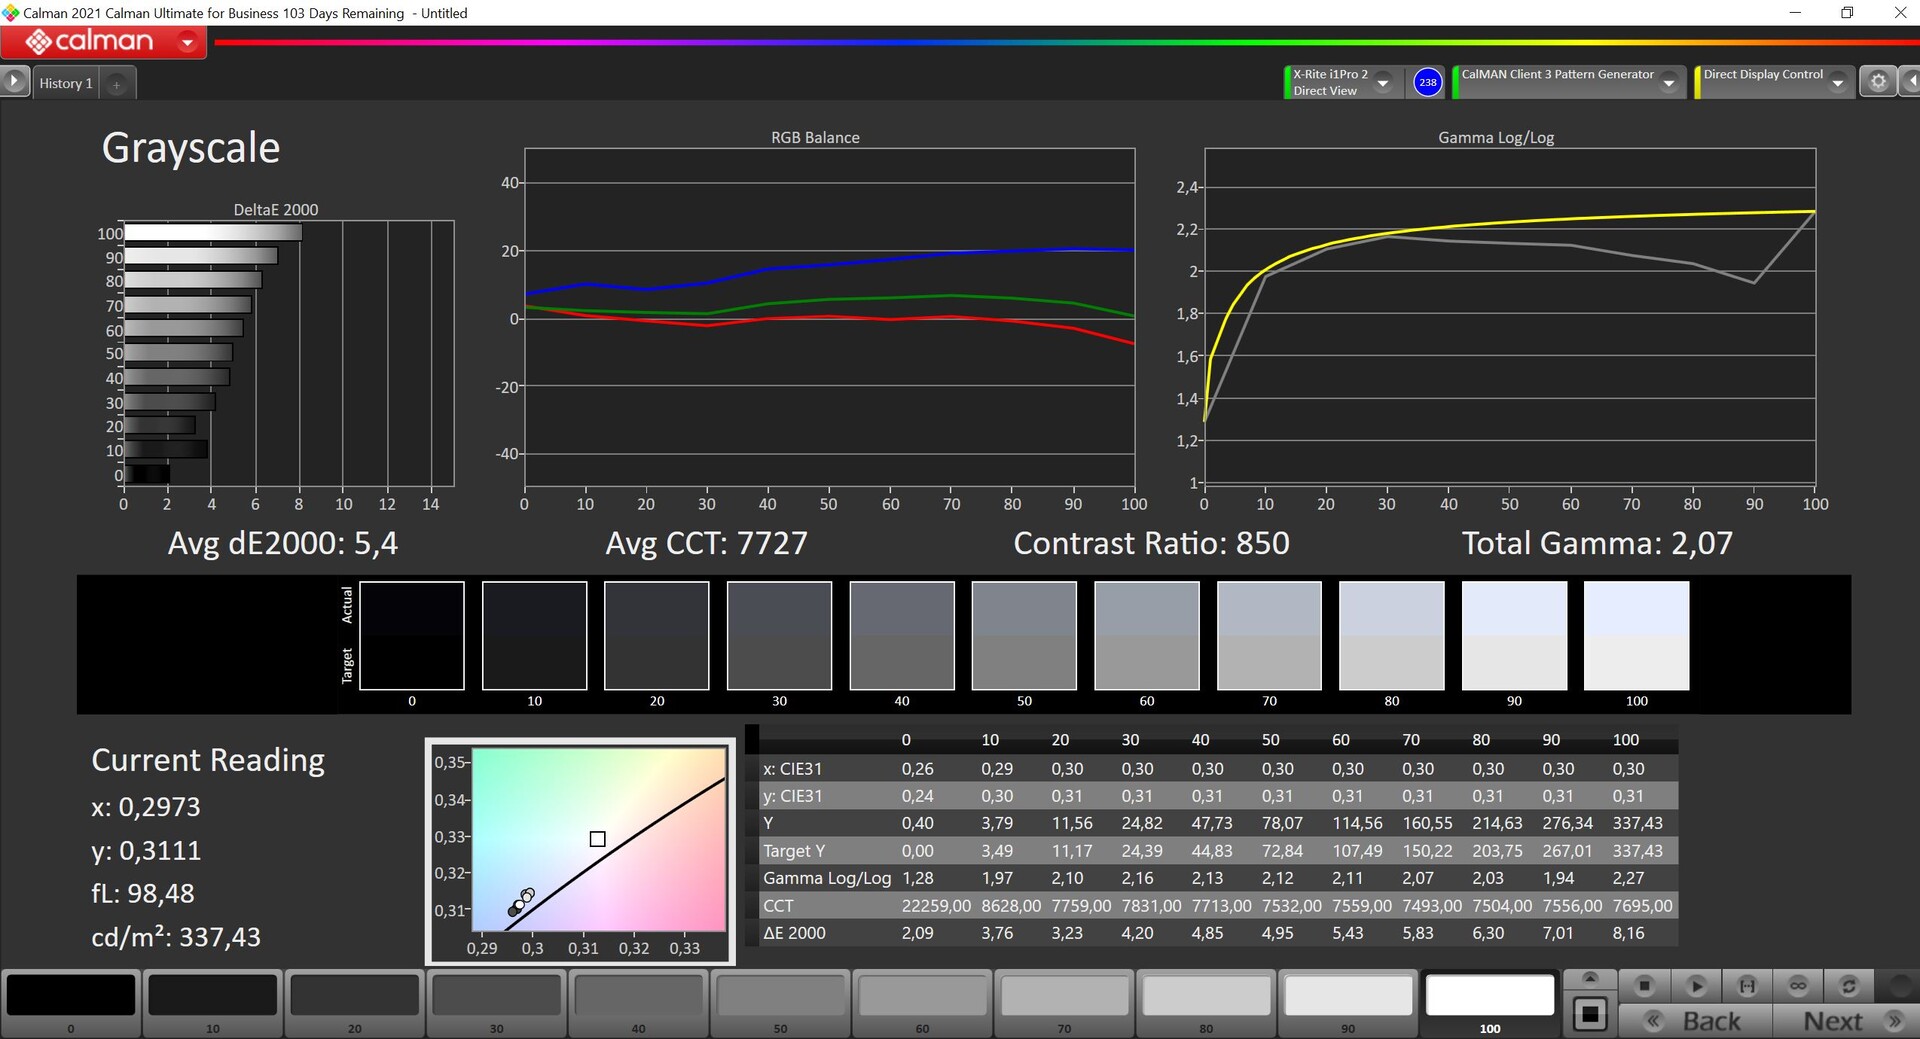
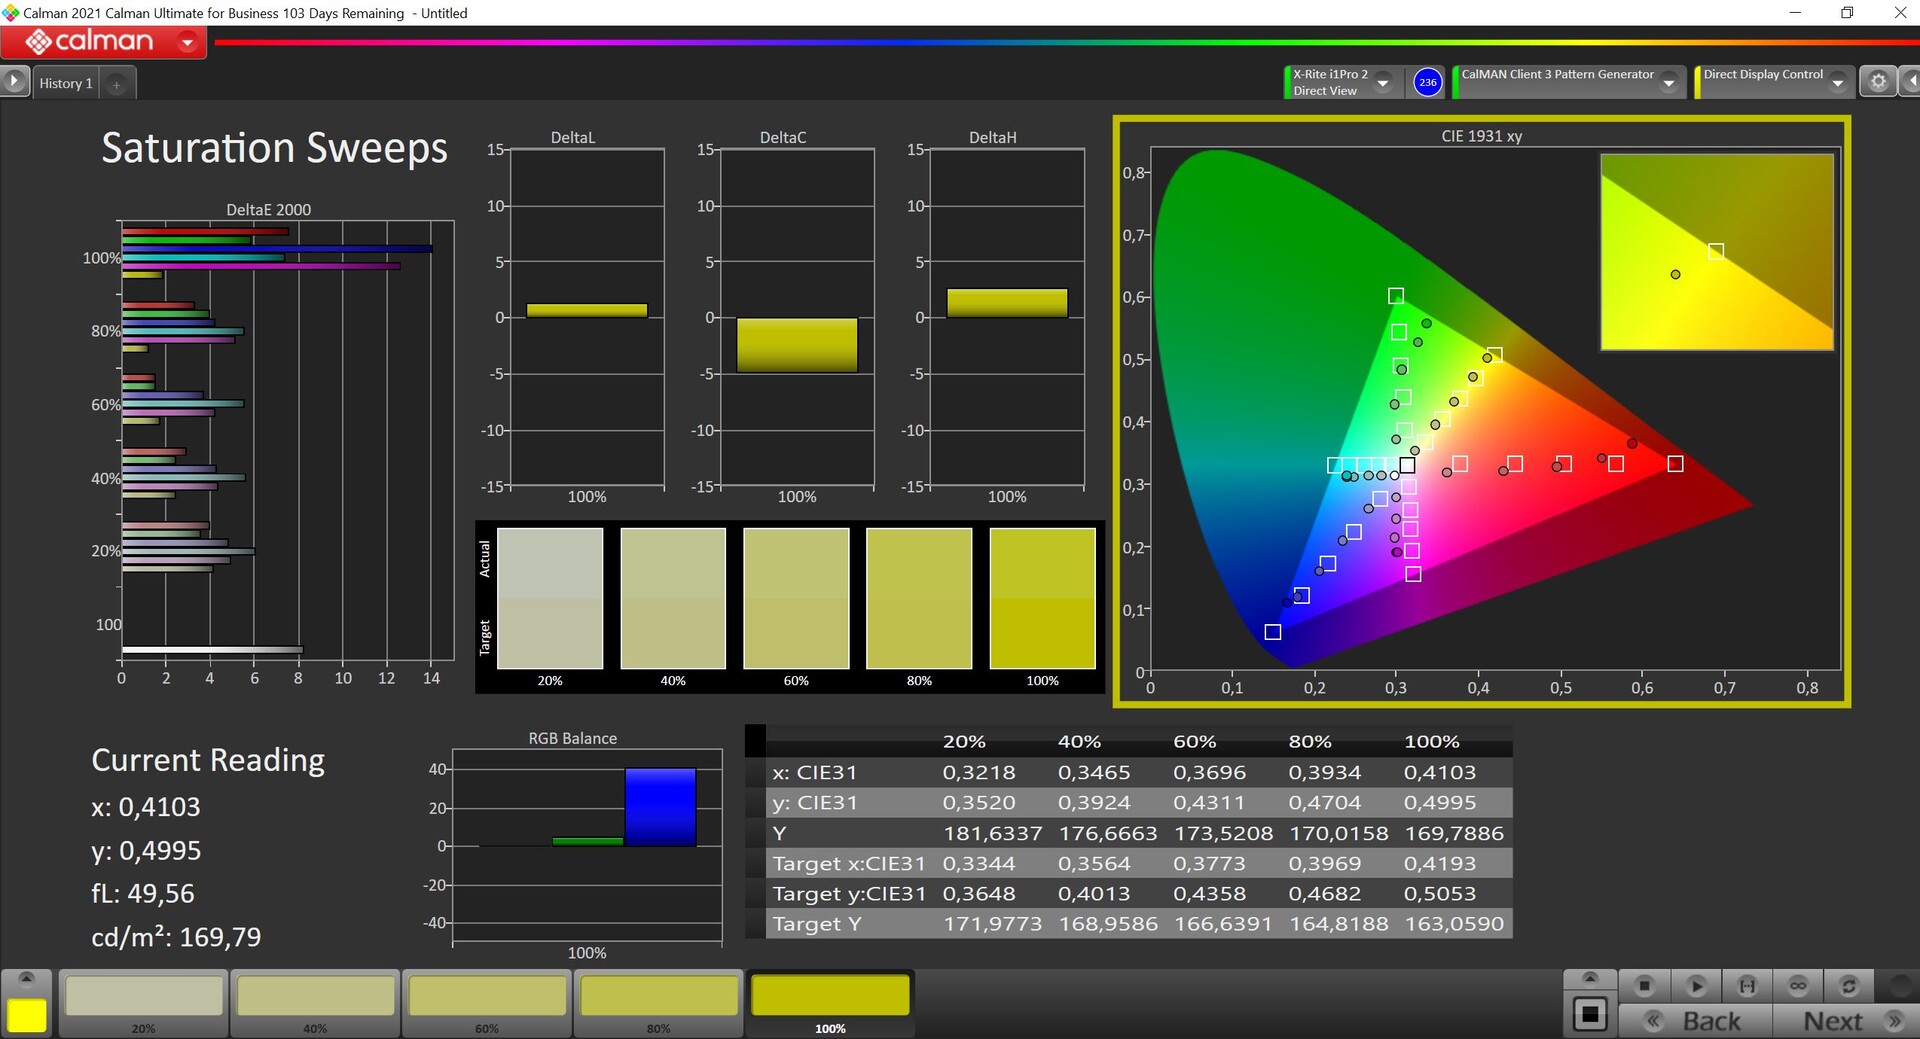
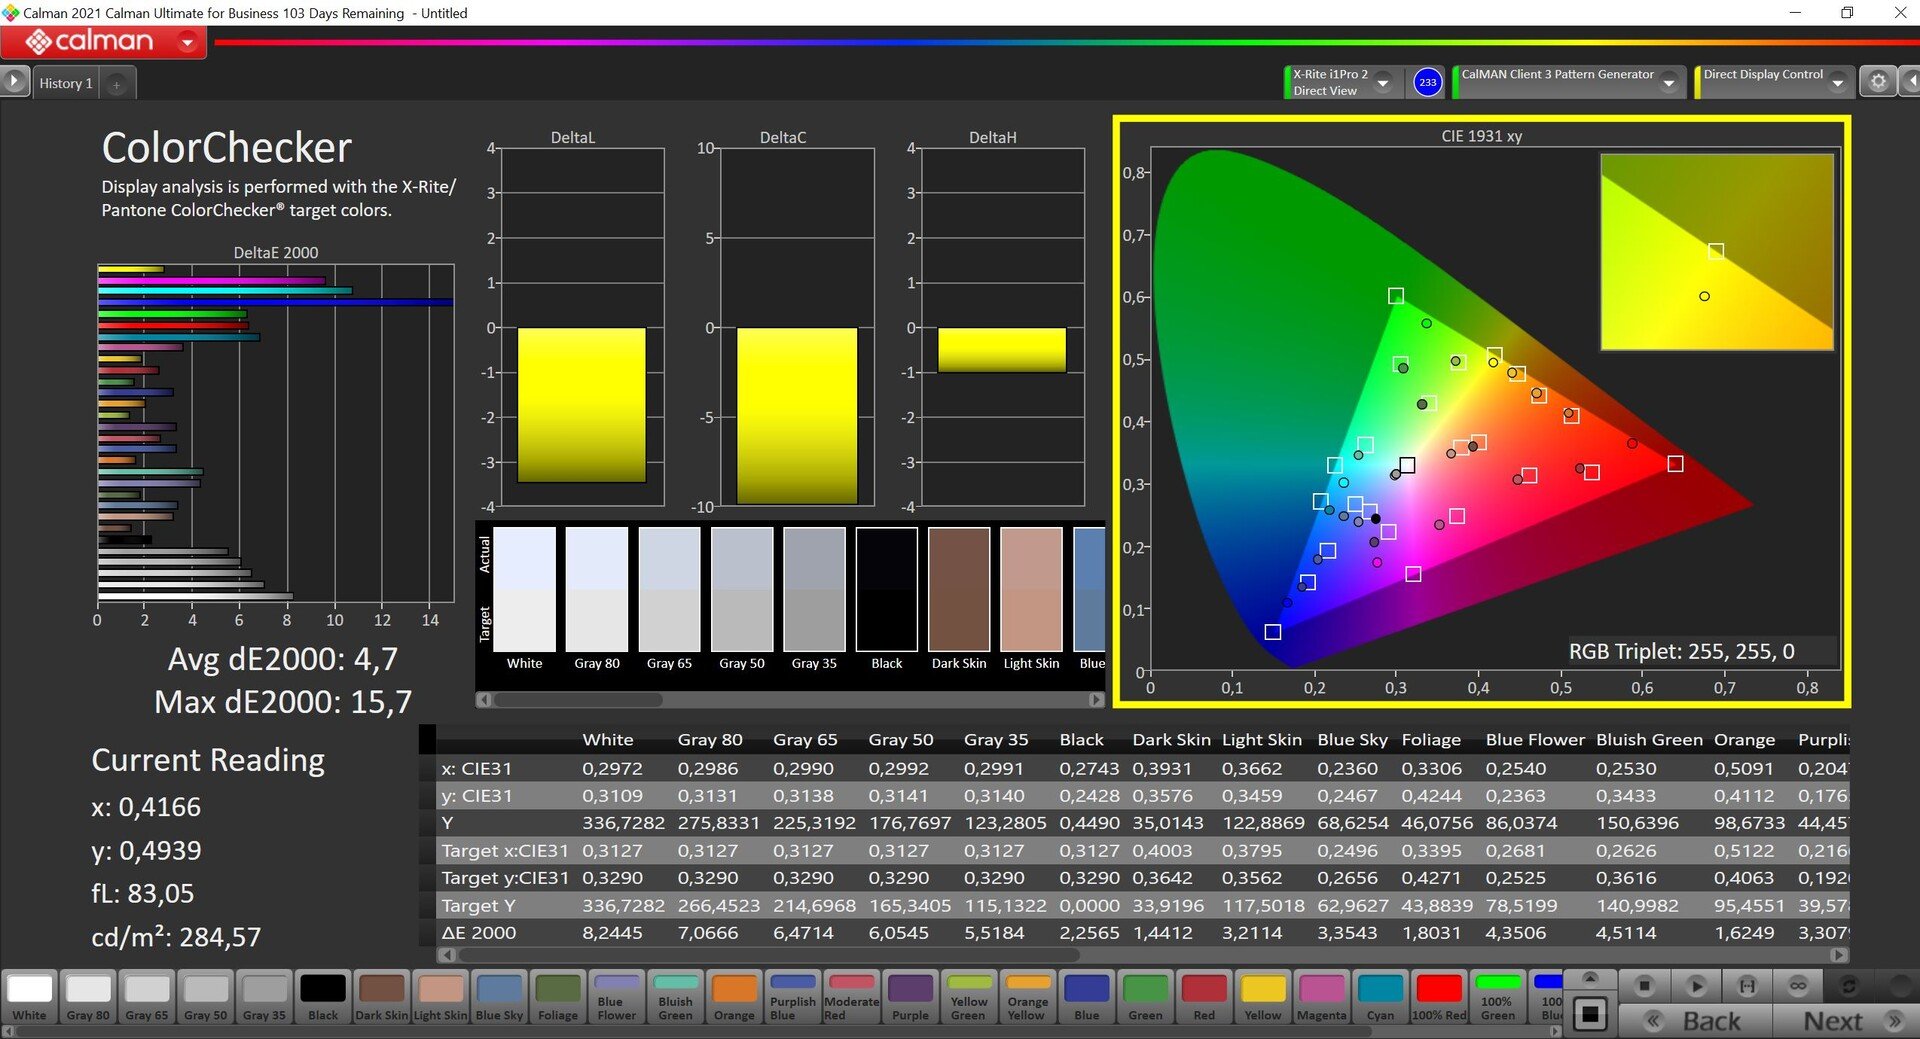
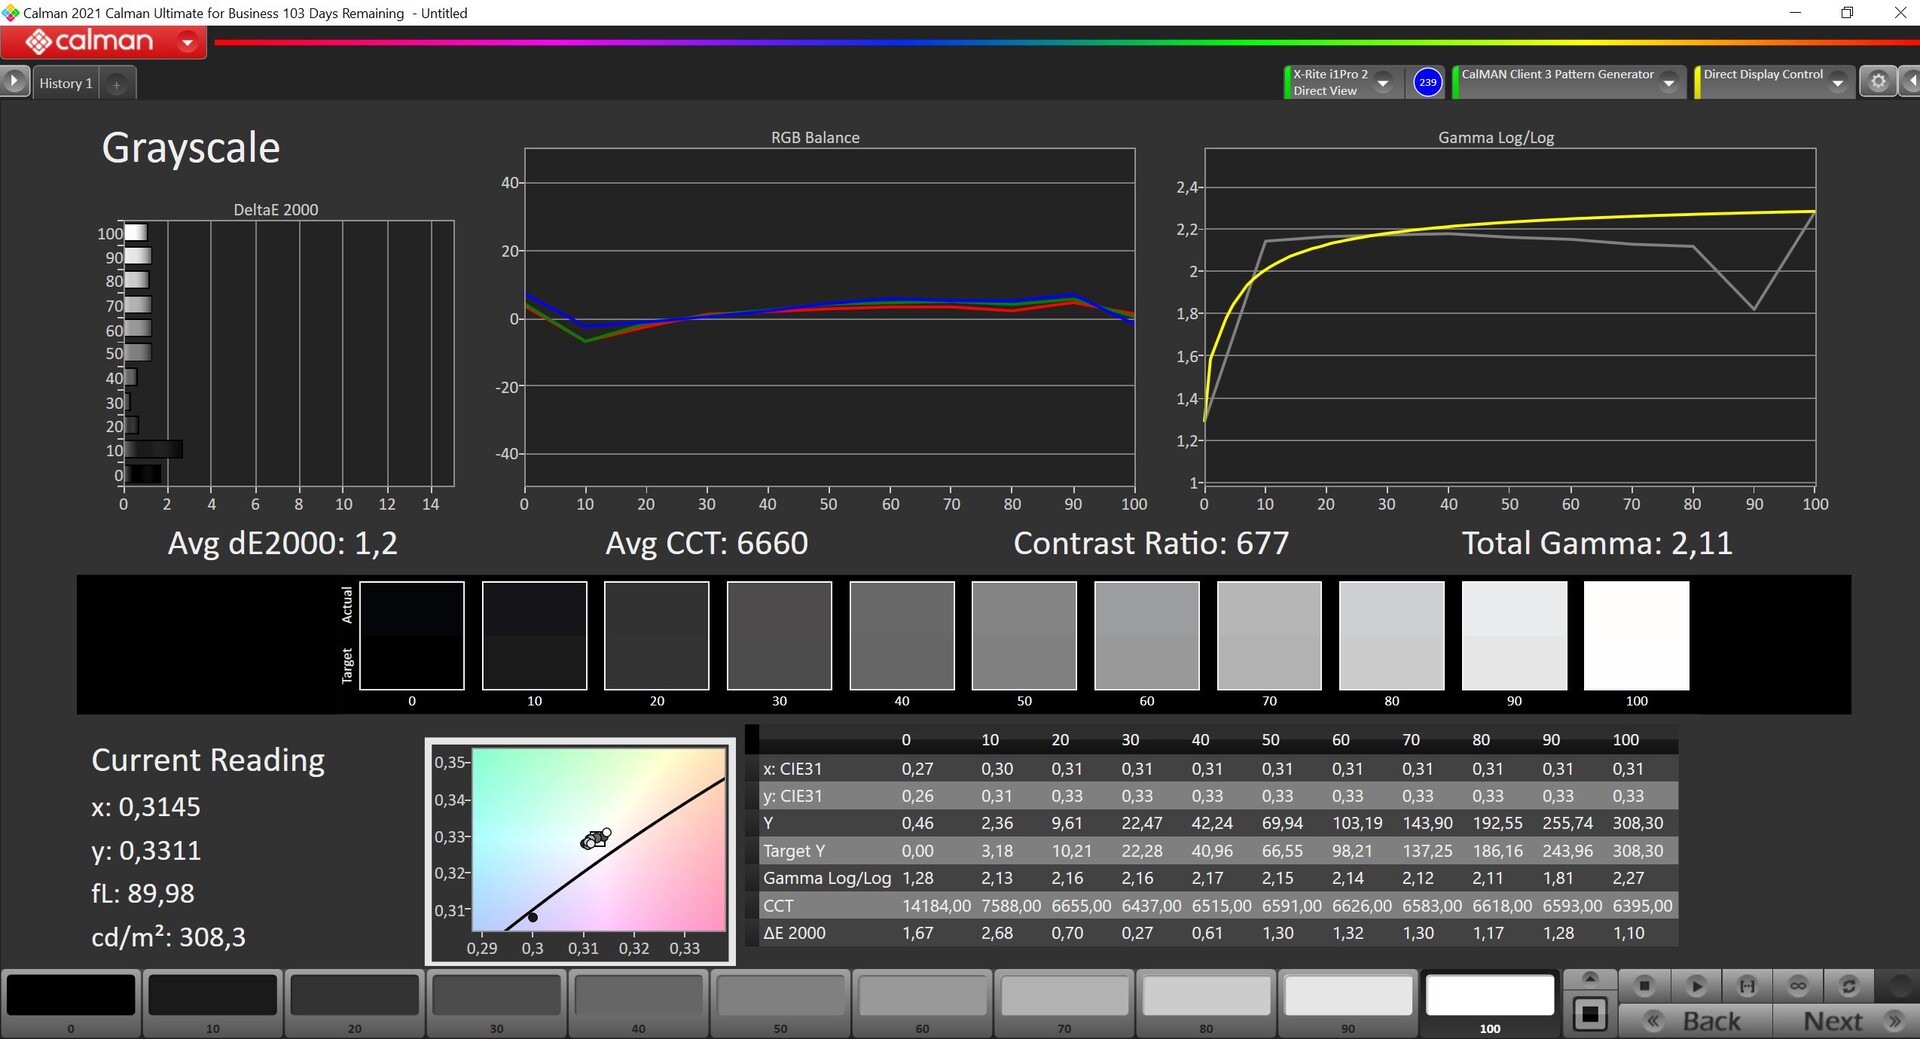
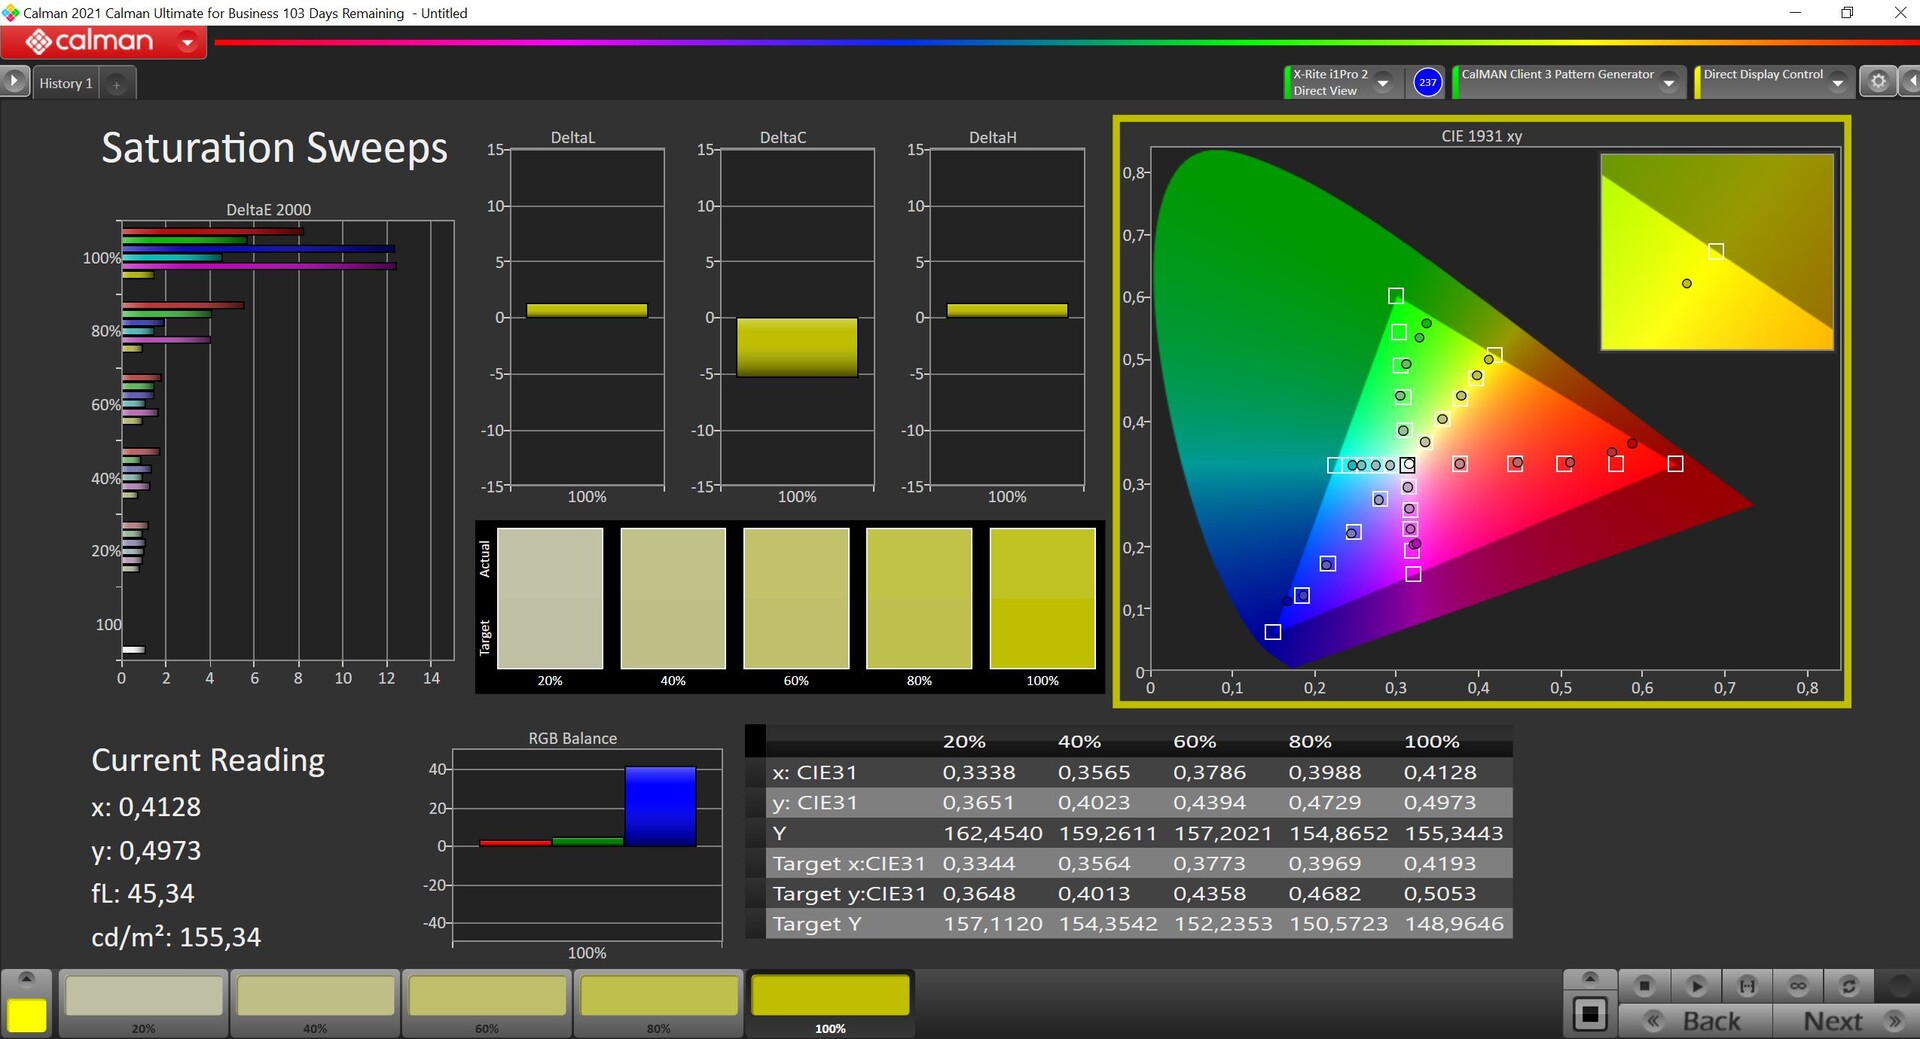
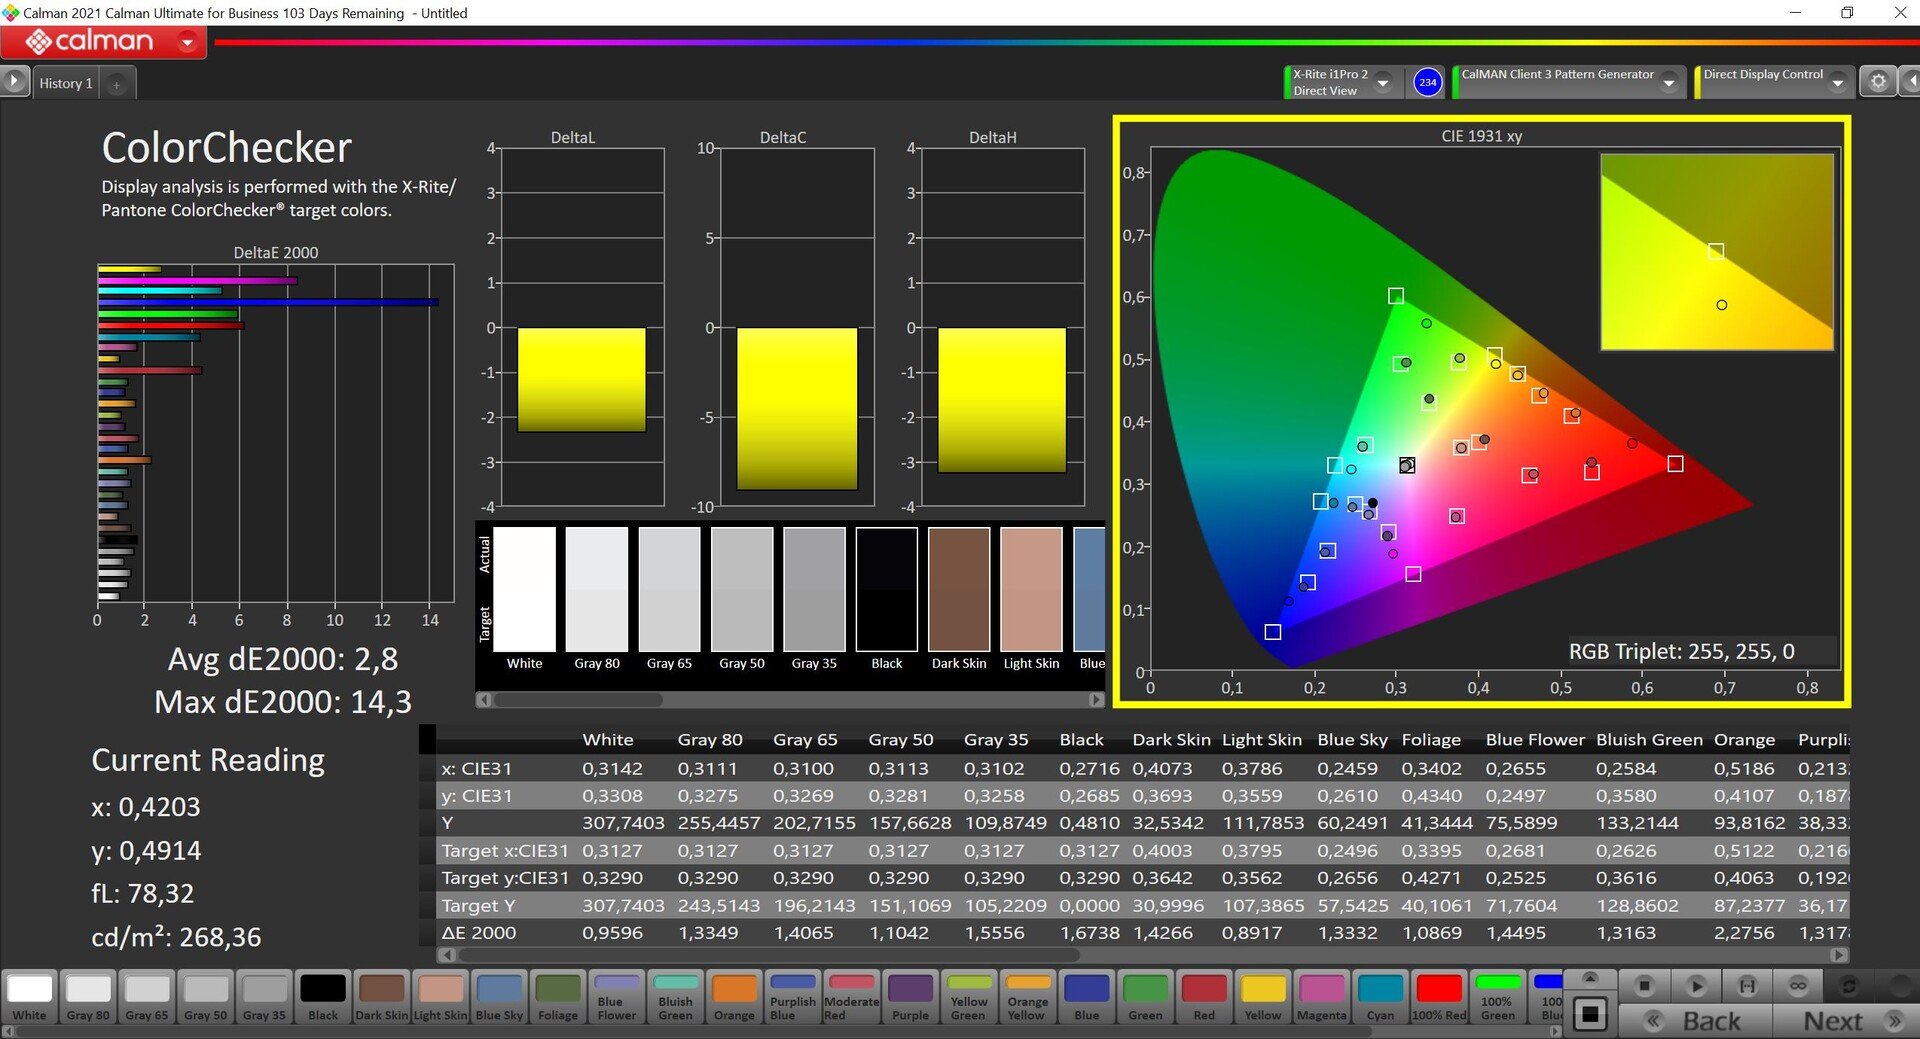
我们使用专业的CalMAN软件(X-Rite i1 Pro 2)进行分析,验证了该面板有一个蓝色的色调,色温肯定太冷。特别是,颜色偏差确实表明IPS显示屏很便宜。虽然我们能够通过校准来克服蓝色色调(配置文件可在上面免费下载),但这也使显示器的最大亮度降低了约30cd/m²,并没有缓解高色彩偏差。再加上极低的色域覆盖率(只有sRGB的75%),该面板不适合用于照片和视频编辑。
Display Response Times
| ↔ Response Time Black to White | ||
|---|---|---|
| 25 ms ... rise ↗ and fall ↘ combined | ↗ 13.3 ms rise | 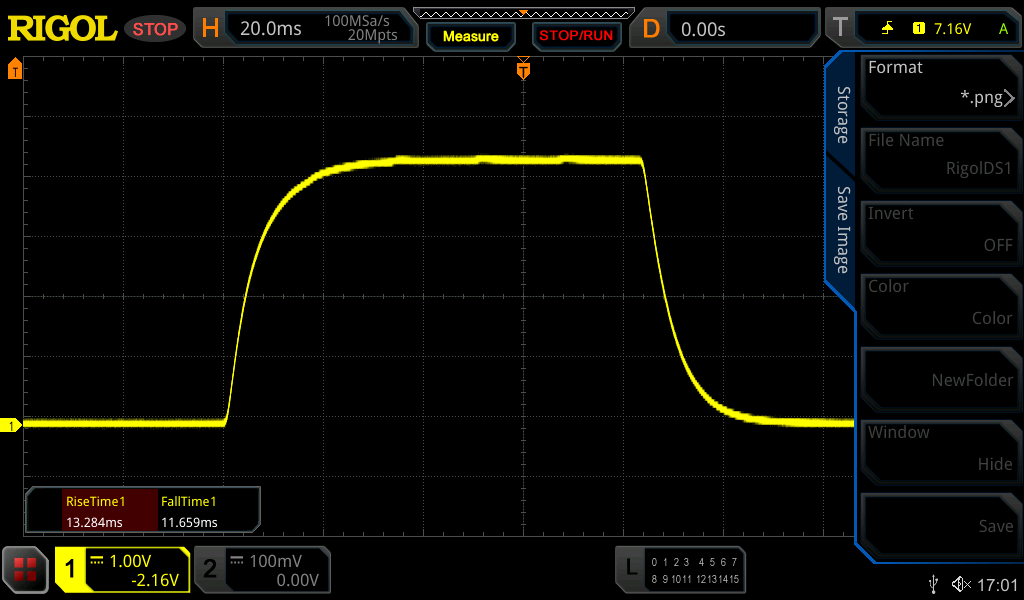 |
| ↘ 11.7 ms fall | ||
| The screen shows relatively slow response rates in our tests and may be too slow for gamers. In comparison, all tested devices range from 0.1 (minimum) to 240 (maximum) ms. » 59 % of all devices are better. This means that the measured response time is worse than the average of all tested devices (19.8 ms). | ||
| ↔ Response Time 50% Grey to 80% Grey | ||
| 32.3 ms ... rise ↗ and fall ↘ combined | ↗ 14.8 ms rise | 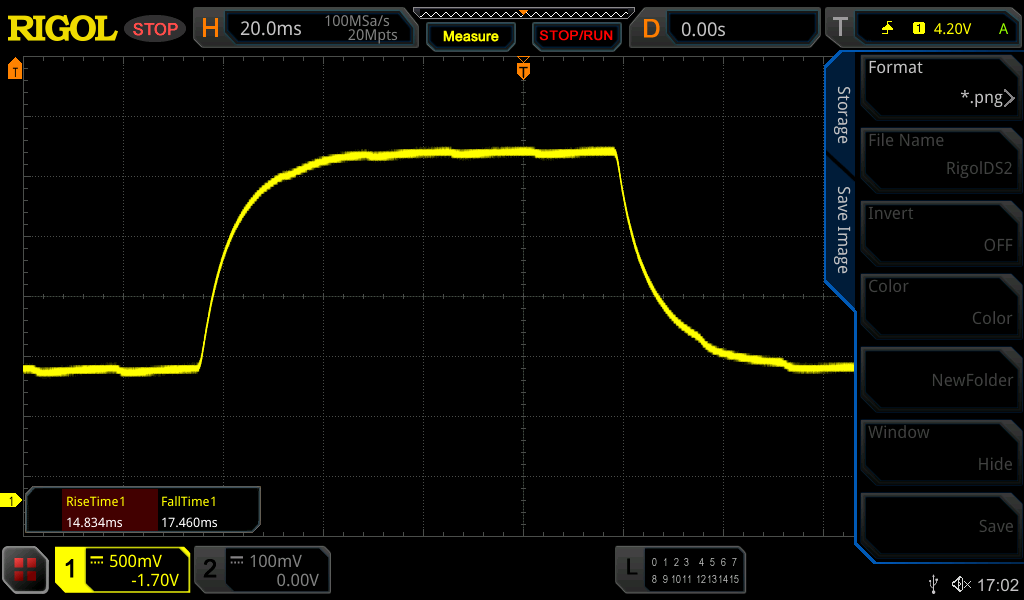 |
| ↘ 17.5 ms fall | ||
| The screen shows slow response rates in our tests and will be unsatisfactory for gamers. In comparison, all tested devices range from 0.165 (minimum) to 636 (maximum) ms. » 44 % of all devices are better. This means that the measured response time is similar to the average of all tested devices (31 ms). | ||
Screen Flickering / PWM (Pulse-Width Modulation)
| Screen flickering / PWM not detected |  | ||
In comparison: 52 % of all tested devices do not use PWM to dim the display. If PWM was detected, an average of 7757 (minimum: 5 - maximum: 343500) Hz was measured. | |||
由于采用了磨砂显示屏,Galaxy Book2 15在户外使用时相当舒适,只要你能避免显示屏上有光源的直接反射。
性能 - Alder Lake-P,功率为20瓦
测试条件
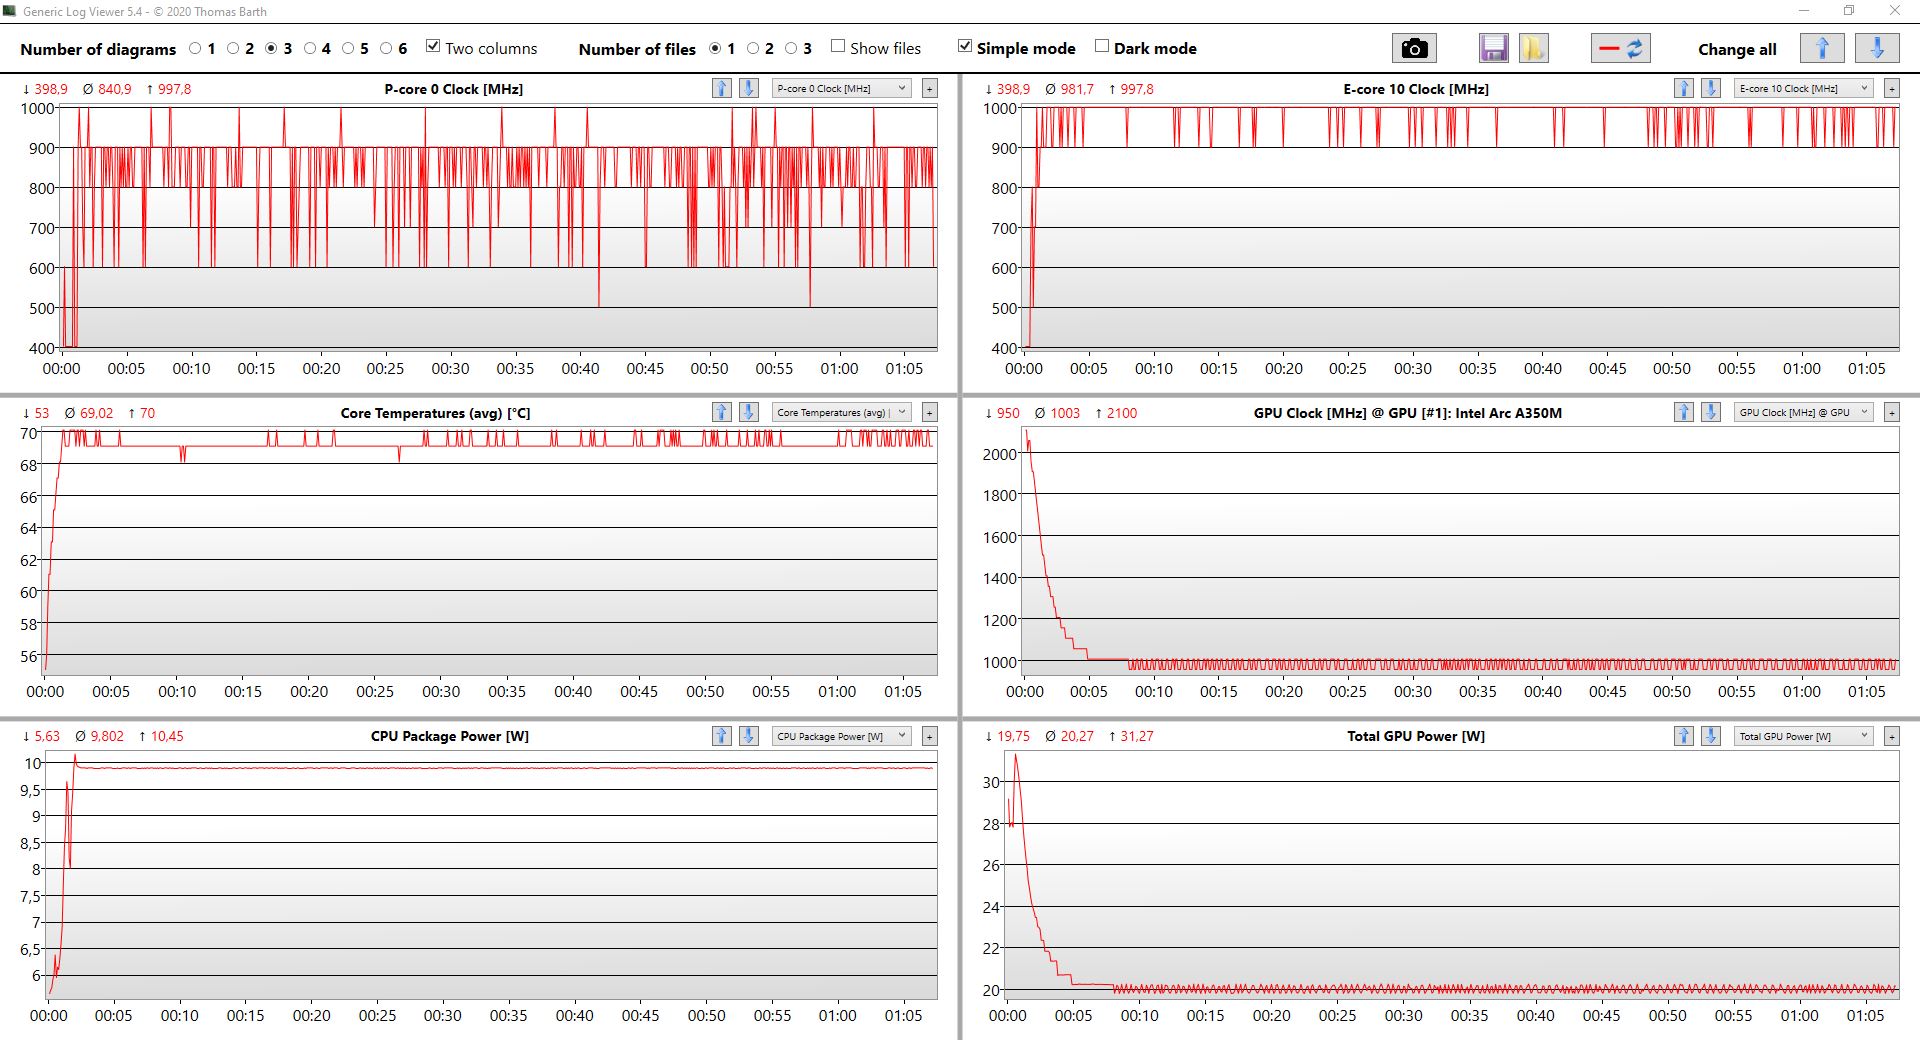
三星提供了三种不同的电源模式,你可以在三星设置应用程序中或在笔记本上按Fn+F11来选择。在下面的表格中,我们列出了每种模式下处理器和显卡在恒定负载下的TDP值。从根本上说,CPU和GPU在测试开始时都能利用较高的TDP值,但只持续了很短的时间。
| 静音 | 优化的 | 高性能 | |
|---|---|---|---|
| CPU负载 | 11.5瓦 | 17瓦 | 20瓦 |
| GPU负载 | 14瓦 | 20瓦 | 25瓦 |
| 压力测试 | CPU。10瓦GPU 。13 瓦 |
CPU:8瓦特GPU 。17瓦 |
CPU: 10瓦GPU: 20瓦 10瓦GPU :20瓦 |
当你看到这些数值并考虑到酷睿i7-1260P是一款标称TDP为28瓦的Alder Lake-P芯片时,令人相当失望的是,即使只在CPU负载下并在高性能模式下运行,系统也大大低于这个标称TDP。我们在高性能模式下进行了以下基准测试和测量,以便至少获得该笔记本电脑所能提供的最佳性能。
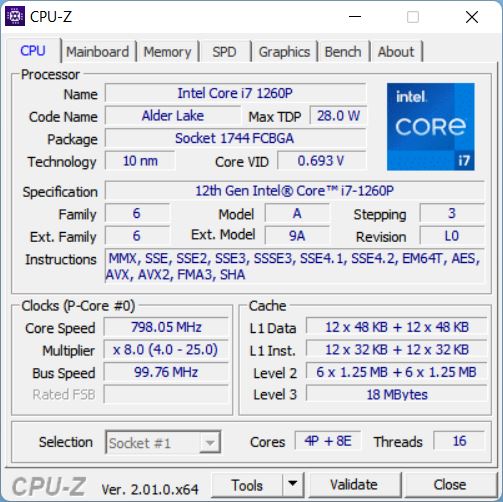
处理器 - 酷睿i7-1260P
这款 酷睿i7-1260P是英特尔最新一代Alder Lake系列的一部分,该系列采用混合架构,结合了性能和效率核心。酷睿i7-1260P具有四个高速性能核心(8个线程)和八个效率核心(8个线程),这意味着它能够并行运行多达16个线程。英特尔将Alder Lake-P芯片的最大功耗上限设定为64瓦。但是,正如我们已经看到的,芯片本身甚至没有达到这个功率的最大时钟速度。尽管如此,新的芯片在高功率使用下仍然表现得非常好,即使它们不是最高效的。
看看三星Galaxy Book2 15的TDP值,你已经可以想象它的处理器的性能会明显下降。在任何情况下,电源管理仍然真的需要一些优化,因为结果会有很大的波动。例如,我们在Cinebench R23 Multi中获得的分数大约在7,800和10,200分之间,程序上没有任何差别。此外,我们注意到,在运行当前的基准测试(如Cinebench R23和R20)时,该处理器似乎只能利用完整的35瓦特。即使如此,性能仍然经常波动。
Cinebench R15 Multi Loop
正如预期,单核性能非常好。在电池供电的情况下,其性能同样波动很大,耗电量为13-20瓦特。一般来说,你可以预期有30%左右的亏损。更多的CPU基准测试可以在这个页面上找到.
Cinebench R23: Multi Core | Single Core
Cinebench R20: CPU (Multi Core) | CPU (Single Core)
Cinebench R15: CPU Multi 64Bit | CPU Single 64Bit
Blender: v2.79 BMW27 CPU
7-Zip 18.03: 7z b 4 | 7z b 4 -mmt1
Geekbench 5.5: Multi-Core | Single-Core
HWBOT x265 Benchmark v2.2: 4k Preset
LibreOffice : 20 Documents To PDF
R Benchmark 2.5: Overall mean
| CPU Performance rating | |
| Average of class Multimedia | |
| Lenovo Yoga 9i 14 2022 i7-1260P | |
| Lenovo ThinkBook 15p G2 ITH 21B1000YGE | |
| Samsung Galaxy Book2 15 | |
| Average Intel Core i7-1260P | |
| Dell Inspiron 15 Plus | |
| Asus Vivobook 15 K513EQ -2! | |
| HP Pavilion 15-eg -2! | |
| Samsung Galaxy Book NP750XDA -2! | |
| Cinebench R23 / Multi Core | |
| Average of class Multimedia (4861 - 33362, n=74, last 2 years) | |
| Lenovo ThinkBook 15p G2 ITH 21B1000YGE | |
| Lenovo Yoga 9i 14 2022 i7-1260P | |
| Samsung Galaxy Book2 15 | |
| Average Intel Core i7-1260P (3173 - 12150, n=27) | |
| Dell Inspiron 15 Plus | |
| Asus Vivobook 15 K513EQ | |
| HP Pavilion 15-eg | |
| Cinebench R23 / Single Core | |
| Average of class Multimedia (1128 - 2459, n=66, last 2 years) | |
| Lenovo Yoga 9i 14 2022 i7-1260P | |
| Samsung Galaxy Book2 15 | |
| Average Intel Core i7-1260P (1155 - 1812, n=25) | |
| HP Pavilion 15-eg | |
| Lenovo ThinkBook 15p G2 ITH 21B1000YGE | |
| Asus Vivobook 15 K513EQ | |
| Dell Inspiron 15 Plus | |
| Cinebench R20 / CPU (Multi Core) | |
| Average of class Multimedia (1887 - 12912, n=57, last 2 years) | |
| Lenovo ThinkBook 15p G2 ITH 21B1000YGE | |
| Lenovo Yoga 9i 14 2022 i7-1260P | |
| Samsung Galaxy Book2 15 | |
| Average Intel Core i7-1260P (1234 - 4748, n=25) | |
| Dell Inspiron 15 Plus | |
| Asus Vivobook 15 K513EQ | |
| Samsung Galaxy Book NP750XDA | |
| HP Pavilion 15-eg | |
| Cinebench R20 / CPU (Single Core) | |
| Average of class Multimedia (425 - 853, n=57, last 2 years) | |
| Samsung Galaxy Book2 15 | |
| Lenovo Yoga 9i 14 2022 i7-1260P | |
| Average Intel Core i7-1260P (448 - 698, n=25) | |
| Lenovo ThinkBook 15p G2 ITH 21B1000YGE | |
| HP Pavilion 15-eg | |
| Asus Vivobook 15 K513EQ | |
| Dell Inspiron 15 Plus | |
| Samsung Galaxy Book NP750XDA | |
| Cinebench R15 / CPU Multi 64Bit | |
| Average of class Multimedia (856 - 5224, n=61, last 2 years) | |
| Lenovo ThinkBook 15p G2 ITH 21B1000YGE | |
| Lenovo Yoga 9i 14 2022 i7-1260P | |
| Average Intel Core i7-1260P (549 - 2034, n=29) | |
| Samsung Galaxy Book2 15 | |
| Dell Inspiron 15 Plus | |
| Asus Vivobook 15 K513EQ | |
| Samsung Galaxy Book NP750XDA | |
| HP Pavilion 15-eg | |
| Cinebench R15 / CPU Single 64Bit | |
| Average of class Multimedia (184.8 - 326, n=59, last 2 years) | |
| Samsung Galaxy Book2 15 | |
| Lenovo Yoga 9i 14 2022 i7-1260P | |
| Average Intel Core i7-1260P (165.4 - 260, n=27) | |
| Lenovo ThinkBook 15p G2 ITH 21B1000YGE | |
| Asus Vivobook 15 K513EQ | |
| HP Pavilion 15-eg | |
| Dell Inspiron 15 Plus | |
| Samsung Galaxy Book NP750XDA | |
| Samsung Galaxy Book NP750XDA | |
| Blender / v2.79 BMW27 CPU | |
| HP Pavilion 15-eg | |
| Samsung Galaxy Book NP750XDA | |
| Asus Vivobook 15 K513EQ | |
| Dell Inspiron 15 Plus | |
| Average Intel Core i7-1260P (264 - 906, n=26) | |
| Samsung Galaxy Book2 15 | |
| Lenovo Yoga 9i 14 2022 i7-1260P | |
| Lenovo ThinkBook 15p G2 ITH 21B1000YGE | |
| Average of class Multimedia (100 - 557, n=58, last 2 years) | |
| 7-Zip 18.03 / 7z b 4 | |
| Average of class Multimedia (26062 - 130368, n=55, last 2 years) | |
| Lenovo ThinkBook 15p G2 ITH 21B1000YGE | |
| Lenovo ThinkBook 15p G2 ITH 21B1000YGE | |
| Lenovo Yoga 9i 14 2022 i7-1260P | |
| Samsung Galaxy Book2 15 | |
| Average Intel Core i7-1260P (16146 - 47064, n=25) | |
| Dell Inspiron 15 Plus | |
| Asus Vivobook 15 K513EQ | |
| Samsung Galaxy Book NP750XDA | |
| HP Pavilion 15-eg | |
| 7-Zip 18.03 / 7z b 4 -mmt1 | |
| Average of class Multimedia (3666 - 7545, n=56, last 2 years) | |
| Lenovo ThinkBook 15p G2 ITH 21B1000YGE | |
| Lenovo ThinkBook 15p G2 ITH 21B1000YGE | |
| Samsung Galaxy Book2 15 | |
| HP Pavilion 15-eg | |
| Asus Vivobook 15 K513EQ | |
| Average Intel Core i7-1260P (4064 - 5791, n=25) | |
| Lenovo Yoga 9i 14 2022 i7-1260P | |
| Dell Inspiron 15 Plus | |
| Samsung Galaxy Book NP750XDA | |
| Geekbench 5.5 / Multi-Core | |
| Average of class Multimedia (4652 - 20422, n=56, last 2 years) | |
| Lenovo Yoga 9i 14 2022 i7-1260P | |
| Lenovo ThinkBook 15p G2 ITH 21B1000YGE | |
| Average Intel Core i7-1260P (3866 - 10570, n=25) | |
| Samsung Galaxy Book2 15 | |
| Samsung Galaxy Book NP750XDA | |
| Dell Inspiron 15 Plus | |
| Geekbench 5.5 / Single-Core | |
| Average of class Multimedia (805 - 2974, n=56, last 2 years) | |
| Lenovo Yoga 9i 14 2022 i7-1260P | |
| Samsung Galaxy Book2 15 | |
| Average Intel Core i7-1260P (1436 - 1786, n=25) | |
| Lenovo ThinkBook 15p G2 ITH 21B1000YGE | |
| Samsung Galaxy Book NP750XDA | |
| Dell Inspiron 15 Plus | |
| HWBOT x265 Benchmark v2.2 / 4k Preset | |
| Average of class Multimedia (5.26 - 36.1, n=56, last 2 years) | |
| Lenovo ThinkBook 15p G2 ITH 21B1000YGE | |
| Lenovo Yoga 9i 14 2022 i7-1260P | |
| Samsung Galaxy Book2 15 | |
| Average Intel Core i7-1260P (3.45 - 13.6, n=26) | |
| Dell Inspiron 15 Plus | |
| Asus Vivobook 15 K513EQ | |
| HP Pavilion 15-eg | |
| Samsung Galaxy Book NP750XDA | |
| LibreOffice / 20 Documents To PDF | |
| Samsung Galaxy Book NP750XDA | |
| Dell Inspiron 15 Plus | |
| Average of class Multimedia (23.9 - 146.7, n=57, last 2 years) | |
| Average Intel Core i7-1260P (40.2 - 65.7, n=25) | |
| Lenovo Yoga 9i 14 2022 i7-1260P | |
| Asus Vivobook 15 K513EQ | |
| HP Pavilion 15-eg | |
| Samsung Galaxy Book2 15 | |
| Lenovo ThinkBook 15p G2 ITH 21B1000YGE | |
| R Benchmark 2.5 / Overall mean | |
| Samsung Galaxy Book NP750XDA | |
| Dell Inspiron 15 Plus | |
| Asus Vivobook 15 K513EQ | |
| HP Pavilion 15-eg | |
| Lenovo ThinkBook 15p G2 ITH 21B1000YGE | |
| Average Intel Core i7-1260P (0.4559 - 0.727, n=25) | |
| Lenovo Yoga 9i 14 2022 i7-1260P | |
| Samsung Galaxy Book2 15 | |
| Average of class Multimedia (0.3604 - 0.947, n=56, last 2 years) | |
* ... smaller is better
AIDA64: FP32 Ray-Trace | FPU Julia | CPU SHA3 | CPU Queen | FPU SinJulia | FPU Mandel | CPU AES | CPU ZLib | FP64 Ray-Trace | CPU PhotoWorxx
| Performance rating | |
| Average of class Multimedia | |
| Lenovo ThinkBook 15p G2 ITH 21B1000YGE | |
| Dell Inspiron 15 Plus | |
| Average Intel Core i7-1260P | |
| Samsung Galaxy Book2 15 | |
| Asus Vivobook 15 K513EQ | |
| HP Pavilion 15-eg | |
| Samsung Galaxy Book NP750XDA -9! | |
| AIDA64 / FP32 Ray-Trace | |
| Average of class Multimedia (2214 - 50388, n=53, last 2 years) | |
| Lenovo ThinkBook 15p G2 ITH 21B1000YGE | |
| Dell Inspiron 15 Plus | |
| Asus Vivobook 15 K513EQ | |
| Average Intel Core i7-1260P (2176 - 10898, n=26) | |
| HP Pavilion 15-eg | |
| Samsung Galaxy Book2 15 | |
| AIDA64 / FPU Julia | |
| Average of class Multimedia (12867 - 201874, n=54, last 2 years) | |
| Lenovo ThinkBook 15p G2 ITH 21B1000YGE | |
| Dell Inspiron 15 Plus | |
| Average Intel Core i7-1260P (11015 - 56906, n=26) | |
| Asus Vivobook 15 K513EQ | |
| HP Pavilion 15-eg | |
| Samsung Galaxy Book2 15 | |
| AIDA64 / CPU SHA3 | |
| Lenovo ThinkBook 15p G2 ITH 21B1000YGE | |
| Average of class Multimedia (626 - 8623, n=54, last 2 years) | |
| Dell Inspiron 15 Plus | |
| Asus Vivobook 15 K513EQ | |
| HP Pavilion 15-eg | |
| Average Intel Core i7-1260P (669 - 2709, n=26) | |
| Samsung Galaxy Book2 15 | |
| AIDA64 / CPU Queen | |
| Lenovo ThinkBook 15p G2 ITH 21B1000YGE | |
| Average of class Multimedia (13483 - 181505, n=41, last 2 years) | |
| Samsung Galaxy Book2 15 | |
| Average Intel Core i7-1260P (42571 - 82493, n=26) | |
| Dell Inspiron 15 Plus | |
| HP Pavilion 15-eg | |
| Asus Vivobook 15 K513EQ | |
| AIDA64 / FPU SinJulia | |
| Lenovo ThinkBook 15p G2 ITH 21B1000YGE | |
| Average of class Multimedia (886 - 28794, n=54, last 2 years) | |
| Dell Inspiron 15 Plus | |
| Samsung Galaxy Book2 15 | |
| Average Intel Core i7-1260P (2901 - 6975, n=26) | |
| Asus Vivobook 15 K513EQ | |
| HP Pavilion 15-eg | |
| AIDA64 / FPU Mandel | |
| Average of class Multimedia (6395 - 105740, n=53, last 2 years) | |
| Lenovo ThinkBook 15p G2 ITH 21B1000YGE | |
| Dell Inspiron 15 Plus | |
| Asus Vivobook 15 K513EQ | |
| Average Intel Core i7-1260P (5950 - 26376, n=26) | |
| HP Pavilion 15-eg | |
| Samsung Galaxy Book2 15 | |
| AIDA64 / CPU AES | |
| Lenovo ThinkBook 15p G2 ITH 21B1000YGE | |
| Dell Inspiron 15 Plus | |
| Asus Vivobook 15 K513EQ | |
| Average of class Multimedia (8171 - 126790, n=54, last 2 years) | |
| HP Pavilion 15-eg | |
| Average Intel Core i7-1260P (16041 - 92356, n=26) | |
| Samsung Galaxy Book2 15 | |
| AIDA64 / CPU ZLib | |
| Average of class Multimedia (143.8 - 2022, n=54, last 2 years) | |
| Lenovo ThinkBook 15p G2 ITH 21B1000YGE | |
| Samsung Galaxy Book2 15 | |
| Average Intel Core i7-1260P (259 - 771, n=26) | |
| Dell Inspiron 15 Plus | |
| Asus Vivobook 15 K513EQ | |
| HP Pavilion 15-eg | |
| Samsung Galaxy Book NP750XDA | |
| AIDA64 / FP64 Ray-Trace | |
| Average of class Multimedia (1014 - 26875, n=54, last 2 years) | |
| Lenovo ThinkBook 15p G2 ITH 21B1000YGE | |
| Dell Inspiron 15 Plus | |
| Asus Vivobook 15 K513EQ | |
| Average Intel Core i7-1260P (1237 - 5858, n=26) | |
| HP Pavilion 15-eg | |
| Samsung Galaxy Book2 15 | |
| AIDA64 / CPU PhotoWorxx | |
| Average of class Multimedia (8187 - 88154, n=54, last 2 years) | |
| Samsung Galaxy Book2 15 | |
| HP Pavilion 15-eg | |
| Average Intel Core i7-1260P (13261 - 43652, n=26) | |
| Lenovo ThinkBook 15p G2 ITH 21B1000YGE | |
| Asus Vivobook 15 K513EQ | |
| Dell Inspiron 15 Plus | |
系统性能
尽管酷睿i7-1260P的TDP值很低,但Galaxy Book2 15仍然是一个高度响应的笔记本电脑,部分原因是它的PCIe SSD。我们在审查期间没有遇到任何问题。合成基准测试的结果是好的。尽管如此,我们在这里还是要谨慎一些,因为新的Arc A350M的驱动程序GPU的驱动为基准测试进行了非常高度的优化。
| PCMark 10 / Score | |
| Average of class Multimedia (4325 - 10386, n=52, last 2 years) | |
| Lenovo ThinkBook 15p G2 ITH 21B1000YGE | |
| HP Pavilion 15-eg | |
| Average Intel Core i7-1260P, Intel Arc A350M (5486 - 5609, n=2) | |
| Samsung Galaxy Book2 15 | |
| Dell Inspiron 15 Plus | |
| Asus Vivobook 15 K513EQ | |
| Samsung Galaxy Book NP750XDA | |
| PCMark 10 / Essentials | |
| Average of class Multimedia (8025 - 11664, n=51, last 2 years) | |
| Samsung Galaxy Book2 15 | |
| HP Pavilion 15-eg | |
| Average Intel Core i7-1260P, Intel Arc A350M (9411 - 9997, n=2) | |
| Lenovo ThinkBook 15p G2 ITH 21B1000YGE | |
| Asus Vivobook 15 K513EQ | |
| Samsung Galaxy Book NP750XDA | |
| Dell Inspiron 15 Plus | |
| PCMark 10 / Productivity | |
| Average of class Multimedia (7323 - 18233, n=51, last 2 years) | |
| HP Pavilion 15-eg | |
| Asus Vivobook 15 K513EQ | |
| Lenovo ThinkBook 15p G2 ITH 21B1000YGE | |
| Dell Inspiron 15 Plus | |
| Average Intel Core i7-1260P, Intel Arc A350M (6714 - 6728, n=2) | |
| Samsung Galaxy Book2 15 | |
| Samsung Galaxy Book NP750XDA | |
| PCMark 10 / Digital Content Creation | |
| Average of class Multimedia (3651 - 16240, n=51, last 2 years) | |
| Lenovo ThinkBook 15p G2 ITH 21B1000YGE | |
| Average Intel Core i7-1260P, Intel Arc A350M (6677 - 7562, n=2) | |
| Samsung Galaxy Book2 15 | |
| HP Pavilion 15-eg | |
| Dell Inspiron 15 Plus | |
| Samsung Galaxy Book NP750XDA | |
| Asus Vivobook 15 K513EQ | |
| PCMark 10 Score | 5486 points | |
Help | ||
| AIDA64 / Memory Copy | |
| Average of class Multimedia (11299 - 132135, n=54, last 2 years) | |
| Samsung Galaxy Book2 15 | |
| Average Intel Core i7-1260P (25125 - 71544, n=25) | |
| Lenovo ThinkBook 15p G2 ITH 21B1000YGE | |
| HP Pavilion 15-eg | |
| Asus Vivobook 15 K513EQ | |
| Dell Inspiron 15 Plus | |
| AIDA64 / Memory Read | |
| Average of class Multimedia (11624 - 174586, n=54, last 2 years) | |
| Samsung Galaxy Book2 15 | |
| Average Intel Core i7-1260P (24983 - 72065, n=25) | |
| Lenovo ThinkBook 15p G2 ITH 21B1000YGE | |
| HP Pavilion 15-eg | |
| Asus Vivobook 15 K513EQ | |
| Dell Inspiron 15 Plus | |
| AIDA64 / Memory Write | |
| Average of class Multimedia (11755 - 134998, n=54, last 2 years) | |
| Samsung Galaxy Book2 15 | |
| Average Intel Core i7-1260P (23512 - 66799, n=25) | |
| HP Pavilion 15-eg | |
| Lenovo ThinkBook 15p G2 ITH 21B1000YGE | |
| Asus Vivobook 15 K513EQ | |
| Dell Inspiron 15 Plus | |
| AIDA64 / Memory Latency | |
| Average of class Multimedia (7 - 535, n=53, last 2 years) | |
| Dell Inspiron 15 Plus | |
| Asus Vivobook 15 K513EQ | |
| Average Intel Core i7-1260P (77.9 - 118.4, n=21) | |
| Lenovo ThinkBook 15p G2 ITH 21B1000YGE | |
| HP Pavilion 15-eg | |
| Samsung Galaxy Book NP750XDA | |
| Samsung Galaxy Book2 15 | |
* ... smaller is better
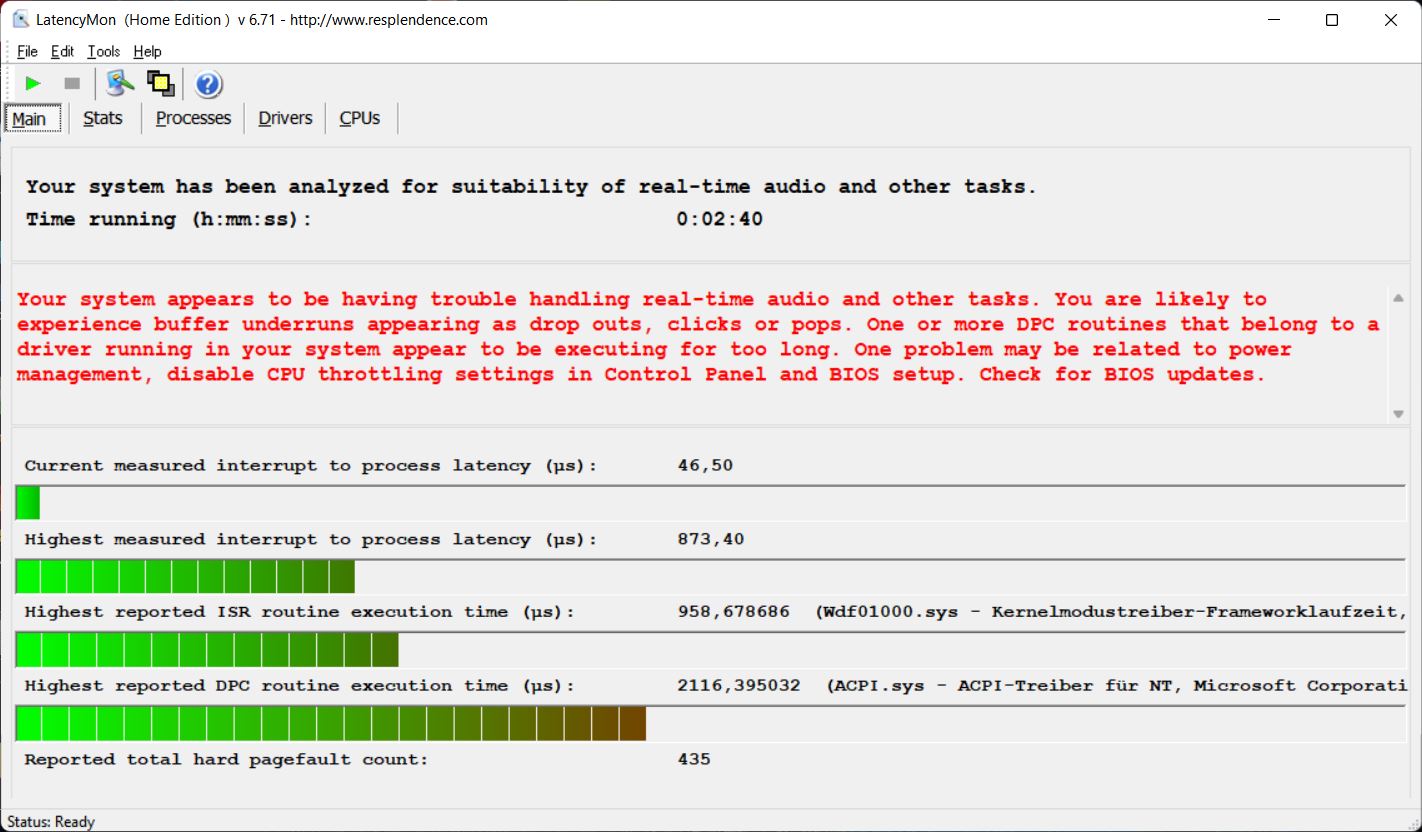
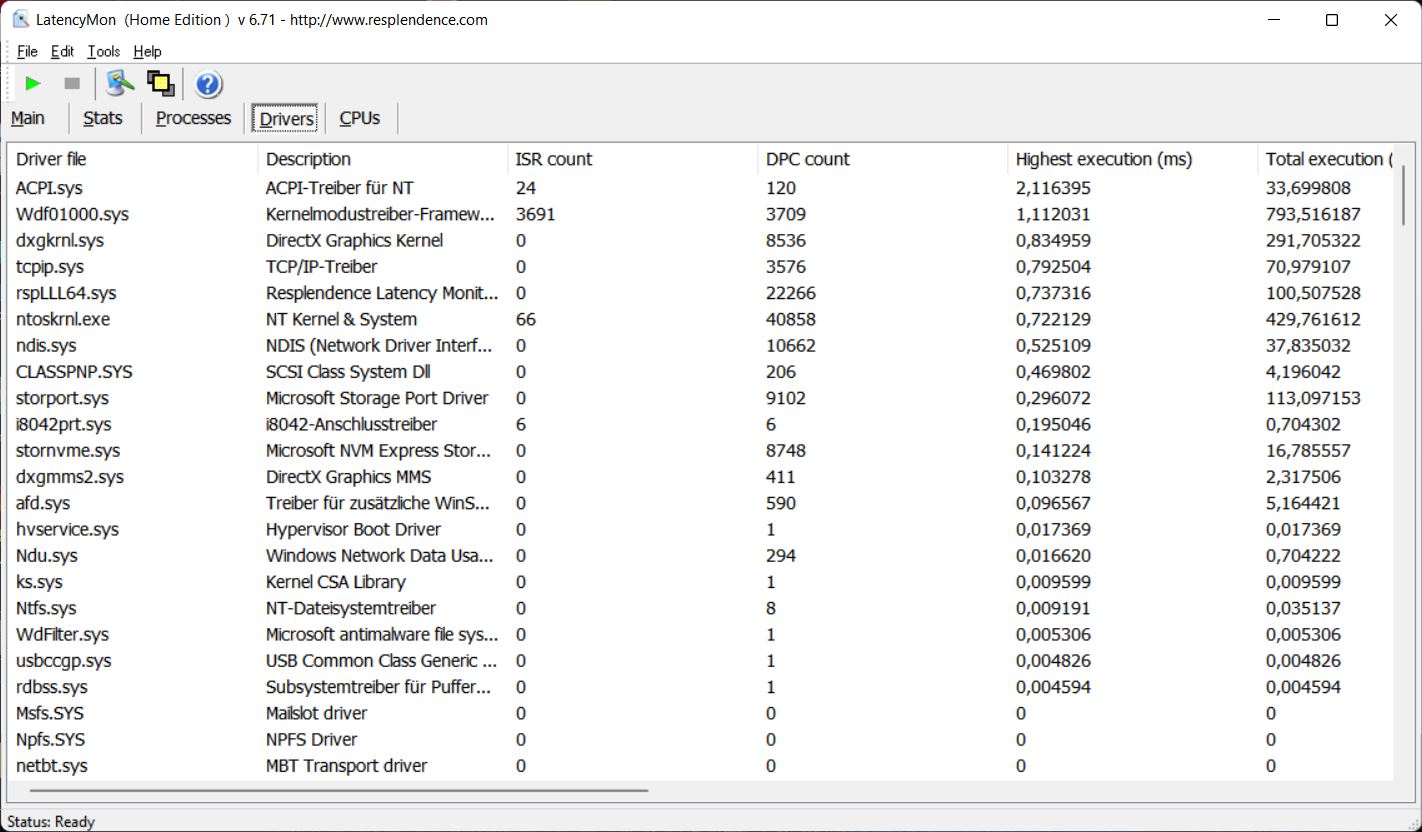
DPC延时
在我们的标准化延迟测试中(互联网浏览、4K YouTube视频播放、CPU负载),Galaxy Book2在目前的BIOS版本上显示了一些限制,因此不是运行实时音频应用程序的最佳选择。
| DPC Latencies / LatencyMon - interrupt to process latency (max), Web, Youtube, Prime95 | |
| Asus Vivobook 15 K513EQ | |
| HP Pavilion 15-eg | |
| Dell Inspiron 15 Plus | |
| Samsung Galaxy Book NP750XDA | |
| Samsung Galaxy Book2 15 | |
| Lenovo ThinkBook 15p G2 ITH 21B1000YGE | |
* ... smaller is better
存储设备
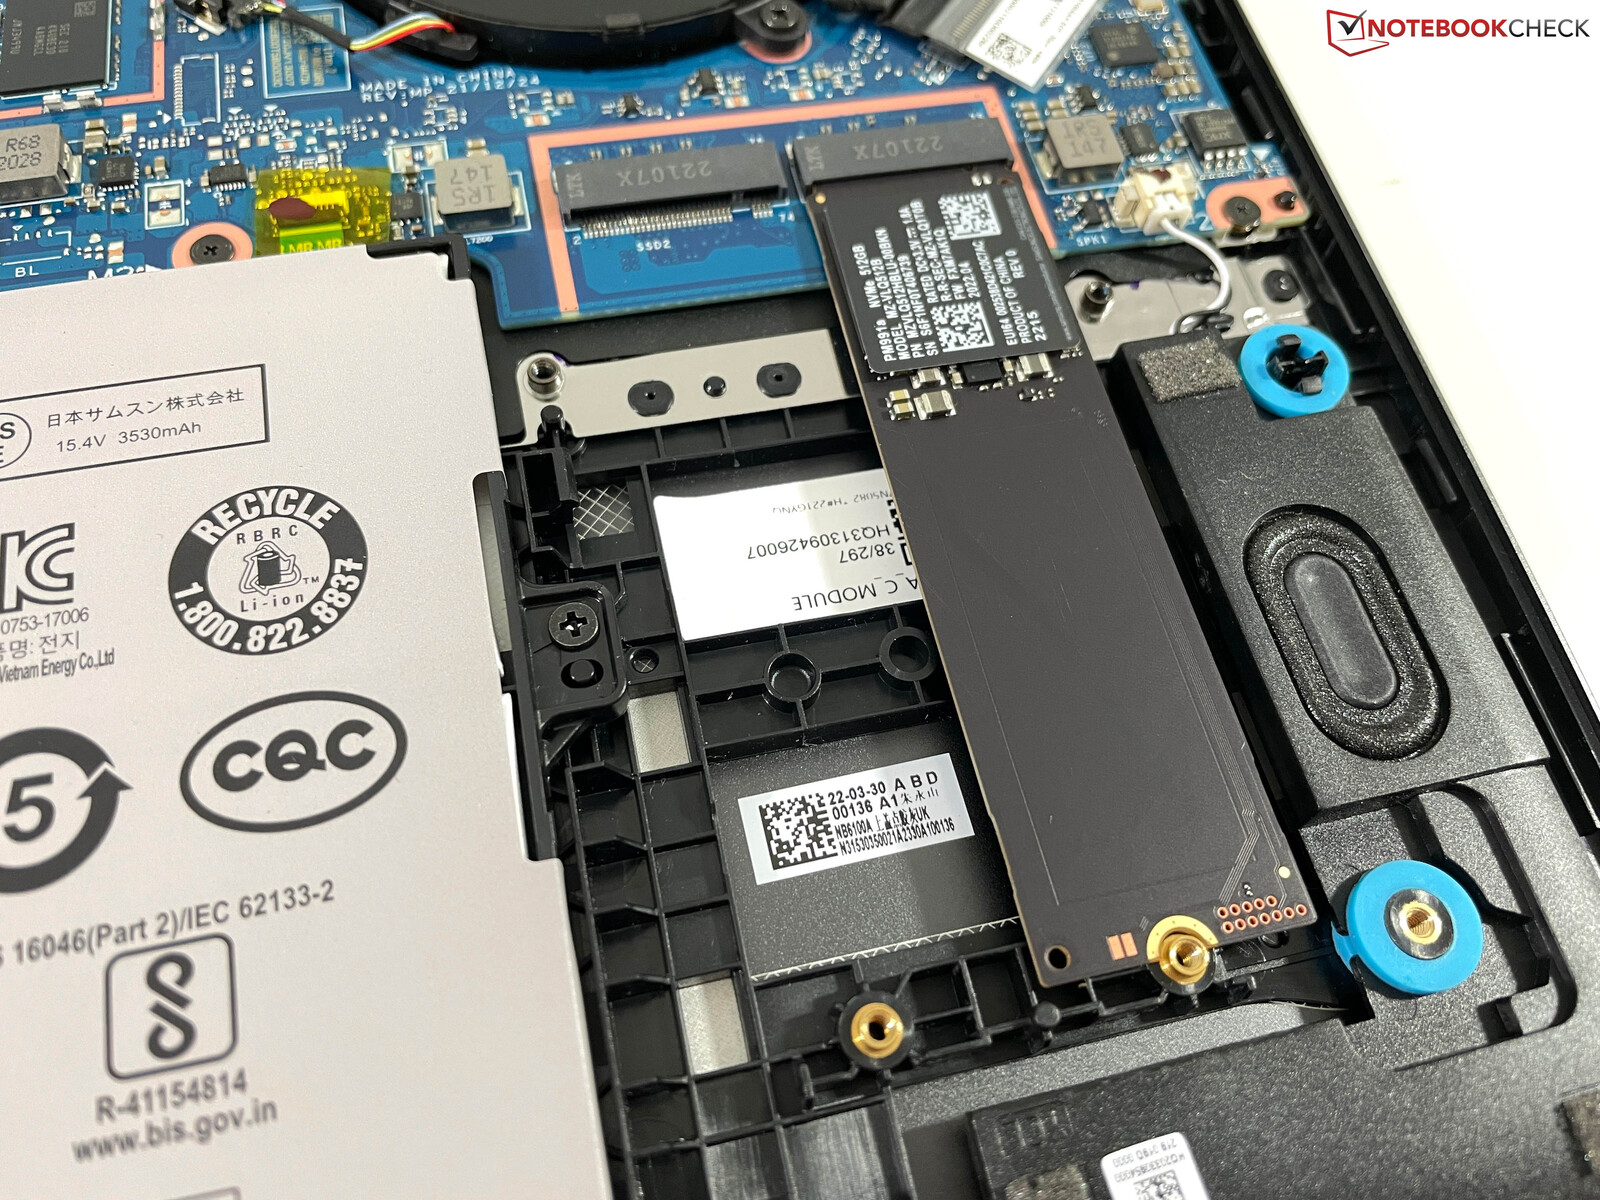
不出所料,三星在笔记本电脑中放入了自己的固态硬盘。PM991的存储容量为512GB,其中413GB在初始设置后可用。在我们的测试中,PCIe 3.0 x4固态硬盘设法提供高达约2GB/s的传输率。尽管Galaxy Book2不会创造任何记录,但该驱动器足以满足日常使用,其性能保持稳定。由于有了第二个固态硬盘插槽,该笔记本的存储容量可以根据需要轻松扩展。点击这里https://www.notebookcheck.net/Laptop-harddisks-HDD-SSD-comparison.22089.0.html?&archive=1&benchmark_values=&condensed=0&daysold=1&deskornote=0&gpubenchmarks=0&hdd_type=1&hdtune_read_avg=1&hdtune_read_max=1&inch=1&interface=1&month=&name=1&or=0&rpm=1&search=&showBars=0&showCount=1&showPercent=0&size=1&sort=b_31_0查看更多的SSD基准测试。

| Drive Performance rating - Percent | |
| Lenovo ThinkBook 15p G2 ITH 21B1000YGE | |
| Average of class Multimedia | |
| Dell Inspiron 15 Plus | |
| Samsung Galaxy Book2 15 | |
| HP Pavilion 15-eg | |
| Average Samsung PM991 MZVLQ512HBLU | |
| Asus Vivobook 15 K513EQ | |
| Samsung Galaxy Book NP750XDA | |
* ... smaller is better
Disk Throttling: DiskSpd Read Loop, Queue Depth 8
图形卡
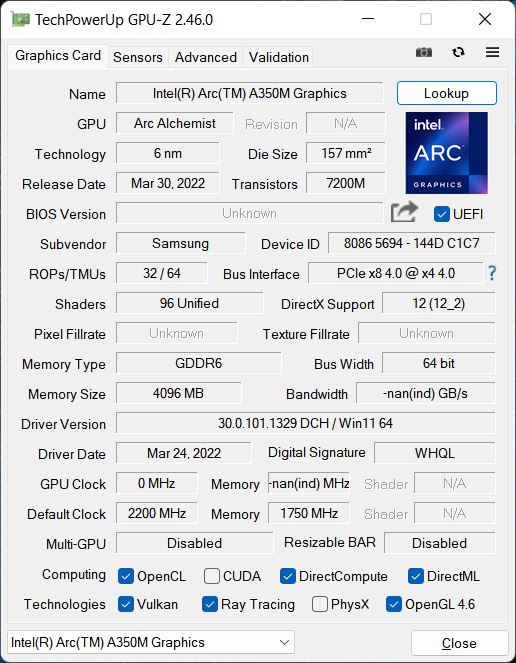
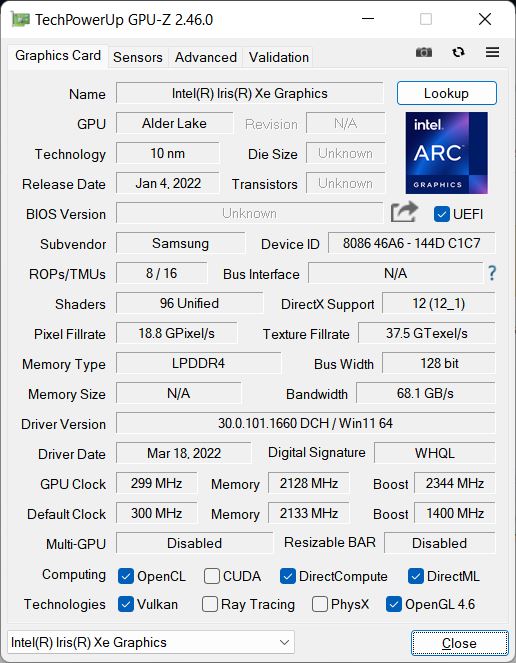
该 弧形A350M是英特尔阵容中新的入门级GPU,提供6个Xe核心和6个光线追踪单元,最大时钟速度为1150MHz。制造商可以将Arc A350M配置为25-35瓦的功率,并拥有4GB的GDDR6(64位)VRAM。
在我们的基准测试中,GPU达到了35瓦的峰值功耗,但它很快就稳定在25-28瓦。到目前为止,我们只在CPU中观察到这种行为,而GPU通常有稳定的耗电。因此,GPU不能提供稳定的性能,并且在Time Spy 压力测试中以92.9%的分数失败。
在合成基准测试中,Arc A350M一般都能提供良好的结果,而且往往比竞争对手的产品,如NvidiaGeForce MX550和集成的AMDRadeon 680M.这一点我们已经在我们的 详细的GPU分析.在电池供电的情况下,该GPU的性能并不稳定,因为它的功耗一直在14到32瓦之间波动。你可以在我们的比较页面上找到更多的GPU基准测试和试验。.
| 3DMark Performance rating - Percent | |
| Average of class Multimedia | |
| Dell Inspiron 15 Plus | |
| Lenovo ThinkBook 15p G2 ITH 21B1000YGE | |
| Samsung Galaxy Book2 15 | |
| Average Intel Arc A350M | |
| Lenovo IdeaCentre AIO 3 24IAP7 | |
| Asus Zenbook S 13 OLED -1! | |
| HP Pavilion 15-eg | |
| Samsung Galaxy Book NP750XDA | |
| Asus Vivobook 15 K513EQ | |
| 3DMark 11 - 1280x720 Performance GPU | |
| Average of class Multimedia (3749 - 60002, n=55, last 2 years) | |
| Lenovo ThinkBook 15p G2 ITH 21B1000YGE | |
| Dell Inspiron 15 Plus | |
| Average Intel Arc A350M (10687 - 10773, n=2) | |
| Samsung Galaxy Book2 15 | |
| Lenovo IdeaCentre AIO 3 24IAP7 | |
| Asus Zenbook S 13 OLED | |
| HP Pavilion 15-eg | |
| Asus Vivobook 15 K513EQ | |
| Samsung Galaxy Book NP750XDA | |
| 3DMark 06 Standard Score | 31625 points | |
| 3DMark Vantage P Result | 31023 points | |
| 3DMark 11 Performance | 10123 points | |
| 3DMark Cloud Gate Standard Score | 26328 points | |
| 3DMark Fire Strike Score | 6009 points | |
| 3DMark Time Spy Score | 2976 points | |
Help | ||
游戏性能
在实际的游戏基准测试中,在合成基准测试中看到的良好性能已经所剩无几。弧光A350M几乎总是落后于 NvidiaGeForce MX550的性能,有时甚至比集成的 AMD Radeon 680M.在某些情况下,这种新的专用GPU甚至没有比集成的最快版本的Iris Xe Graphics G7(96EUs)表现得更好。.
| The Witcher 3 | |
| 1920x1080 High Graphics & Postprocessing (Nvidia HairWorks Off) | |
| Lenovo ThinkBook 15p G2 ITH 21B1000YGE | |
| Average of class Multimedia (22 - 224, n=7, last 2 years) | |
| Dell Inspiron 15 Plus | |
| Lenovo IdeaCentre AIO 3 24IAP7 | |
| Average Intel Arc A350M (41 - 45, n=2) | |
| Samsung Galaxy Book2 15 | |
| Asus Zenbook S 13 OLED | |
| HP Pavilion 15-eg | |
| Asus Vivobook 15 K513EQ | |
| Samsung Galaxy Book NP750XDA | |
| 1920x1080 Ultra Graphics & Postprocessing (HBAO+) | |
| Average of class Multimedia (11 - 121, n=7, last 2 years) | |
| Lenovo ThinkBook 15p G2 ITH 21B1000YGE | |
| Dell Inspiron 15 Plus | |
| Lenovo IdeaCentre AIO 3 24IAP7 | |
| HP Pavilion 15-eg | |
| Asus Zenbook S 13 OLED | |
| Average Intel Arc A350M (18.4 - 20.5, n=2) | |
| Samsung Galaxy Book2 15 | |
| Asus Vivobook 15 K513EQ | |
| Samsung Galaxy Book NP750XDA | |
| GTA V | |
| 1366x768 Normal/Off AF:4x | |
| Lenovo ThinkBook 15p G2 ITH 21B1000YGE | |
| Lenovo IdeaCentre AIO 3 24IAP7 | |
| Average of class Multimedia (60.1 - 185.6, n=39, last 2 years) | |
| HP Pavilion 15-eg | |
| Average Intel Arc A350M (109.3 - 156.3, n=2) | |
| Asus Zenbook S 13 OLED | |
| Dell Inspiron 15 Plus | |
| Asus Vivobook 15 K513EQ | |
| Samsung Galaxy Book2 15 | |
| Samsung Galaxy Book NP750XDA | |
| 1920x1080 High/On (Advanced Graphics Off) AA:2xMSAA + FX AF:8x | |
| Lenovo ThinkBook 15p G2 ITH 21B1000YGE | |
| Dell Inspiron 15 Plus | |
| Average of class Multimedia (19.5 - 186.1, n=47, last 2 years) | |
| Lenovo IdeaCentre AIO 3 24IAP7 | |
| HP Pavilion 15-eg | |
| Asus Zenbook S 13 OLED | |
| Asus Vivobook 15 K513EQ | |
| Average Intel Arc A350M (36.5 - 38, n=2) | |
| Samsung Galaxy Book2 15 | |
| Samsung Galaxy Book NP750XDA | |
| Dota 2 Reborn | |
| 1920x1080 high (2/3) | |
| Lenovo ThinkBook 15p G2 ITH 21B1000YGE | |
| Lenovo IdeaCentre AIO 3 24IAP7 | |
| Average of class Multimedia (31.1 - 196.9, n=59, last 2 years) | |
| HP Pavilion 15-eg | |
| Dell Inspiron 15 Plus | |
| Asus Vivobook 15 K513EQ | |
| Asus Zenbook S 13 OLED | |
| Samsung Galaxy Book2 15 | |
| Average Intel Arc A350M (60.6 - 63.9, n=2) | |
| Samsung Galaxy Book NP750XDA | |
| 1920x1080 ultra (3/3) best looking | |
| Lenovo ThinkBook 15p G2 ITH 21B1000YGE | |
| Lenovo IdeaCentre AIO 3 24IAP7 | |
| Average of class Multimedia (29 - 179.9, n=59, last 2 years) | |
| HP Pavilion 15-eg | |
| Dell Inspiron 15 Plus | |
| Asus Vivobook 15 K513EQ | |
| Asus Zenbook S 13 OLED | |
| Samsung Galaxy Book2 15 | |
| Average Intel Arc A350M (56.1 - 62.1, n=2) | |
| Samsung Galaxy Book NP750XDA | |
| Final Fantasy XV Benchmark | |
| 1920x1080 Standard Quality | |
| Average of class Multimedia (11.4 - 181.1, n=57, last 2 years) | |
| Lenovo ThinkBook 15p G2 ITH 21B1000YGE | |
| Dell Inspiron 15 Plus | |
| Lenovo IdeaCentre AIO 3 24IAP7 | |
| Asus Zenbook S 13 OLED | |
| Average Intel Arc A350M (29.8 - 33.2, n=2) | |
| Samsung Galaxy Book2 15 | |
| HP Pavilion 15-eg | |
| Asus Vivobook 15 K513EQ | |
| Samsung Galaxy Book NP750XDA | |
| 1920x1080 High Quality | |
| Average of class Multimedia (7.61 - 144.4, n=57, last 2 years) | |
| Lenovo ThinkBook 15p G2 ITH 21B1000YGE | |
| Dell Inspiron 15 Plus | |
| Lenovo IdeaCentre AIO 3 24IAP7 | |
| Samsung Galaxy Book NP750XDA | |
| Asus Zenbook S 13 OLED | |
| Samsung Galaxy Book2 15 | |
| Average Intel Arc A350M (18.2 - 20.7, n=2) | |
| HP Pavilion 15-eg | |
| Asus Vivobook 15 K513EQ | |
| F1 2021 | |
| 1920x1080 Medium Preset AA:T AF:16x | |
| Asus Zenbook S 13 OLED | |
| Lenovo IdeaCentre AIO 3 24IAP7 | |
| Samsung Galaxy Book2 15 | |
| Average Intel Arc A350M (n=1) | |
| 1920x1080 High Preset AA:T AF:16x | |
| Asus Zenbook S 13 OLED | |
| Lenovo IdeaCentre AIO 3 24IAP7 | |
| Samsung Galaxy Book2 15 | |
| Average Intel Arc A350M (n=1) | |
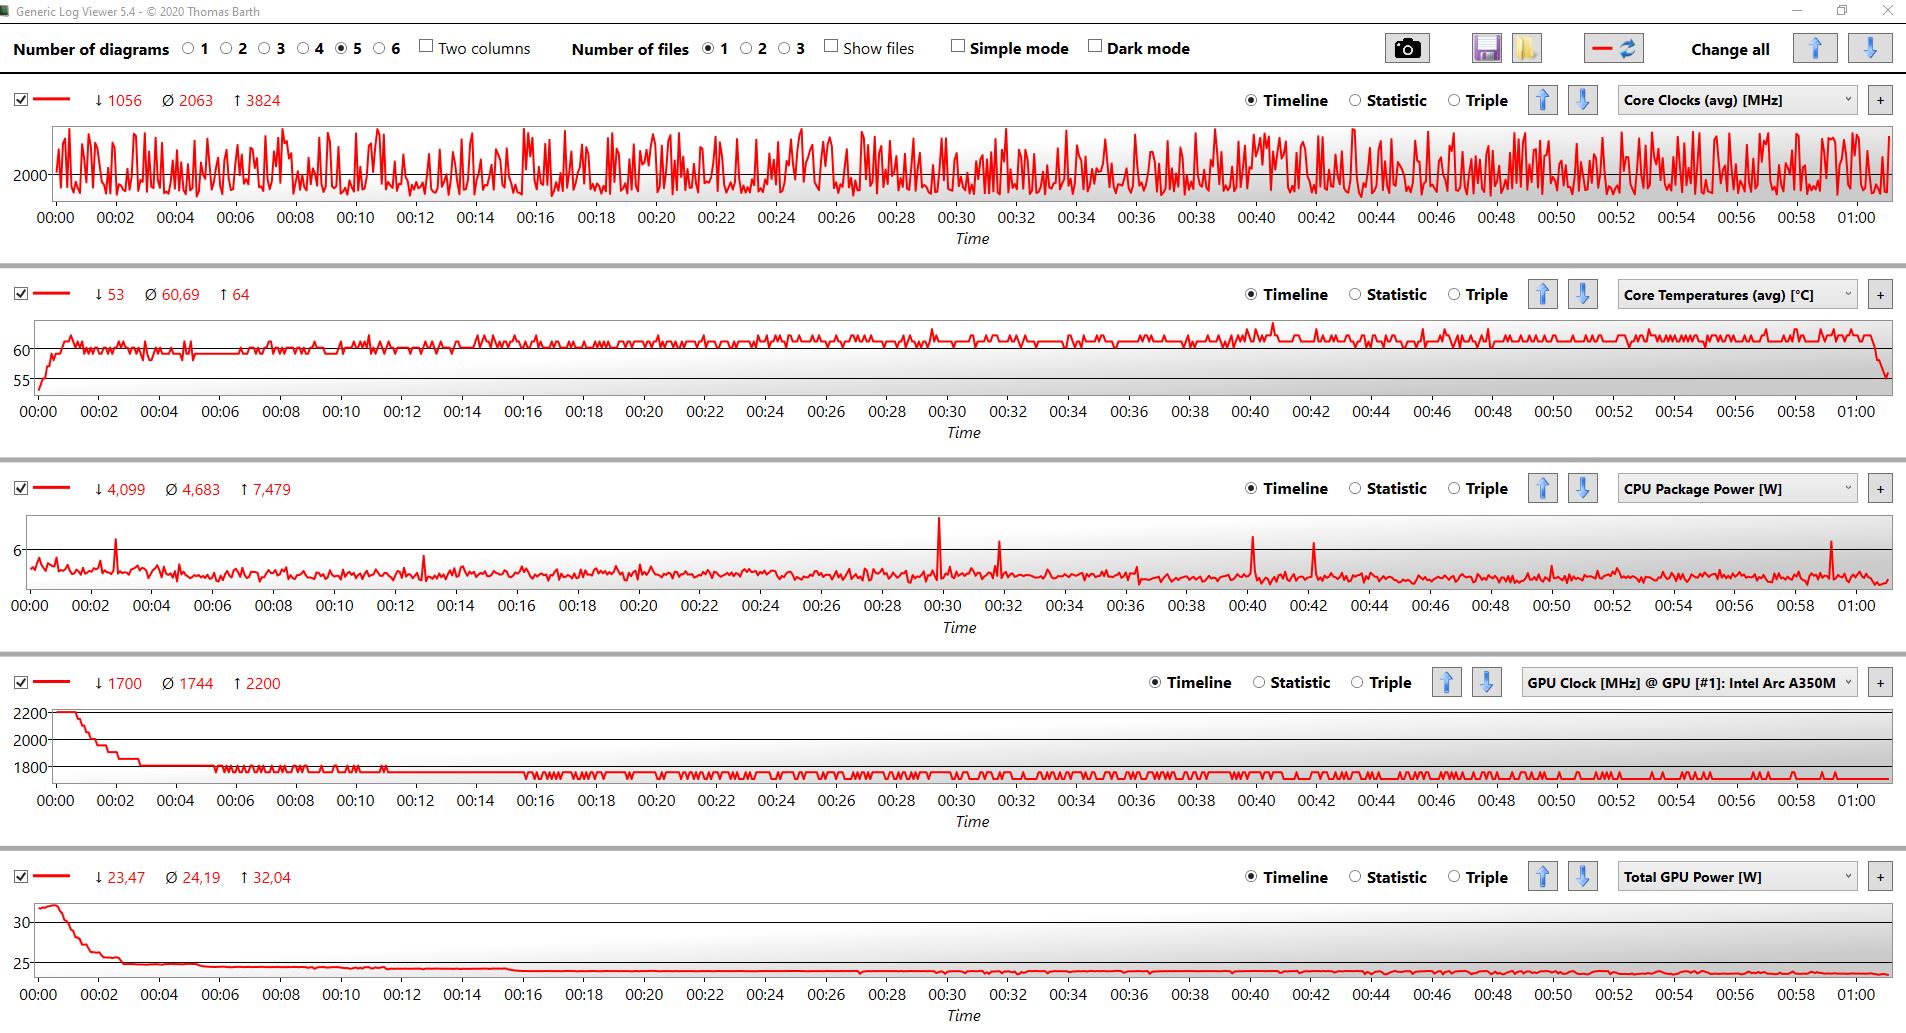
我们的Witcher 3 循环显示,GPU无法保持其初始性能,但后来没有表现出任何进一步的性能波动。在电池供电的情况下很难玩游戏,因为笔记本电脑一直在经历FPS下降。
Witcher 3 FPS graph
| low | med. | high | ultra | |
|---|---|---|---|---|
| GTA V (2015) | 134.5 | 109.3 | 36.5 | 14.7 |
| The Witcher 3 (2015) | 120 | 76 | 41 | 18.4 |
| Dota 2 Reborn (2015) | 102.9 | 83.5 | 63.9 | 62.1 |
| Final Fantasy XV Benchmark (2018) | 59.3 | 29.8 | 20.7 | |
| X-Plane 11.11 (2018) | 33.9 | 29.4 | 25.8 | |
| Far Cry 5 (2018) | 65 | 39 | 37 | 35 |
| Strange Brigade (2018) | 138 | 59.8 | 47.4 | 40.9 |
| F1 2021 (2021) | 166.6 | 63.8 | 52.2 | 21.1 |
| Farming Simulator 22 (2021) | 121 | 63 | 47 | 43 |
| God of War (2022) | 22 | 18 | 15 | 11 |
| GRID Legends (2022) | 78 | 56 | 41 | 28 |
| Cyberpunk 2077 1.6 (2022) | 27.4 | 18.5 | 16.2 | 11.6 |
| Ghostwire Tokyo (2022) | 32.2 | 30.6 | 29.6 | 29.2 |
排放 - 大声的风扇
噪声排放
当笔记本电脑处于闲置状态时,这两个风扇有时会无缘无故地开始运转。此外,无论负载如何,它们可以在几秒钟内或多或少地上升到最大速度(根据所选择的电源模式确定)。在高性能模式下,风扇噪音达到了非常明显的47.5分贝(A)。在优化和静音模式下,最高水平分别为41.3分贝(A)和37.2分贝(A)。我们没有注意到电子装置的任何其他噪音。
Noise level
| Idle |
| 24.3 / 24.3 / 29.8 dB(A) |
| Load |
| 47.5 / 47.5 dB(A) |
 | ||
30 dB silent 40 dB(A) audible 50 dB(A) loud |
||
min: | ||
| Samsung Galaxy Book2 15 A350M, i7-1260P, Samsung PM991 MZVLQ512HBLU | Dell Inspiron 15 Plus GeForce RTX 3050 4GB Laptop GPU, i5-11400H, Micron 2450 512GB MTFDKBA512TFK | Asus Vivobook 15 K513EQ GeForce MX350, i7-1165G7, Intel SSD 660p SSDPEKNW512G8 | Lenovo ThinkBook 15p G2 ITH 21B1000YGE GeForce RTX 3050 Ti Laptop GPU, i7-11800H, Samsung PM9A1 MZVL21T0HCLR | HP Pavilion 15-eg GeForce MX450, i7-1165G7, Samsung PM991 MZVLQ1T0HALB | Samsung Galaxy Book NP750XDA Iris Xe G7 80EUs, i5-1135G7, Lite-On CL1-8D512 | |
|---|---|---|---|---|---|---|
| Noise | -5% | 8% | 4% | 7% | 1% | |
| off / environment * (dB) | 24.3 | 26 -7% | 23.4 4% | 26.15 -8% | 25.4 -5% | 26 -7% |
| Idle Minimum * (dB) | 24.3 | 26 -7% | 23.6 3% | 26.15 -8% | 25.6 -5% | 26 -7% |
| Idle Average * (dB) | 24.3 | 28 -15% | 23.6 3% | 26.15 -8% | 25.6 -5% | 26 -7% |
| Idle Maximum * (dB) | 29.8 | 32 -7% | 23.6 21% | 26.15 12% | 25.6 14% | 26 13% |
| Load Average * (dB) | 47.5 | 47 1% | 41 14% | 33.34 30% | 39.2 17% | 43.3 9% |
| Witcher 3 ultra * (dB) | 47.5 | 46 3% | 42.9 10% | 44.64 6% | 39.1 18% | |
| Load Maximum * (dB) | 47.5 | 48 -1% | 47 1% | 45.79 4% | 41.5 13% | 45.7 4% |
* ... smaller is better
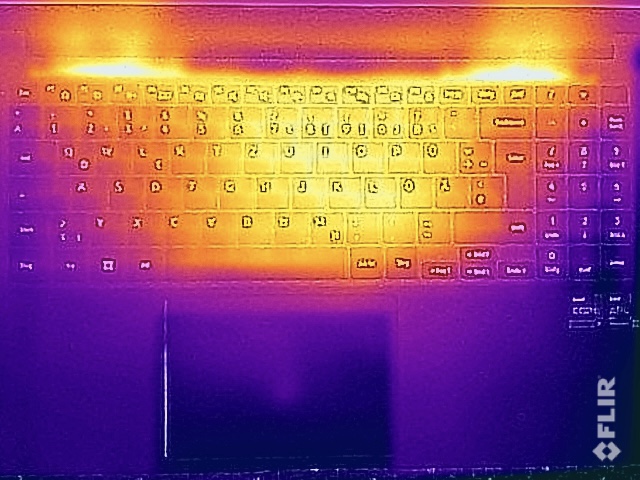
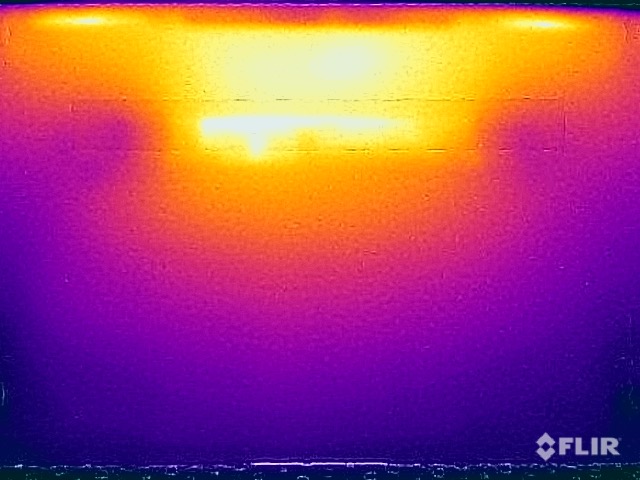
温度
这台笔记本电脑没有任何散热问题。当设备在处理要求不高的任务时,整个机箱保持良好的冷却。即使在满负荷的情况下,我们也只在底部的一个热点处测量到47°C(116.6°F)的最大表面温度,该热点位于背部的中间位置。不过,当设备变得如此温暖时,你仍然可以把它放在你的腿上。在压力测试中,CPU和GPU都经历了明显的节流,因为它们的功率消耗分别被限制在10瓦和20瓦。
(±) The maximum temperature on the upper side is 44.6 °C / 112 F, compared to the average of 36.8 °C / 98 F, ranging from 21 to 71 °C for the class Multimedia.
(-) The bottom heats up to a maximum of 47.5 °C / 118 F, compared to the average of 39.1 °C / 102 F
(+) In idle usage, the average temperature for the upper side is 25 °C / 77 F, compared to the device average of 31.3 °C / 88 F.
(±) Playing The Witcher 3, the average temperature for the upper side is 36.1 °C / 97 F, compared to the device average of 31.3 °C / 88 F.
(+) The palmrests and touchpad are cooler than skin temperature with a maximum of 27.5 °C / 81.5 F and are therefore cool to the touch.
(±) The average temperature of the palmrest area of similar devices was 28.7 °C / 83.7 F (+1.2 °C / 2.2 F).
| Samsung Galaxy Book2 15 Intel Core i7-1260P, Intel Arc A350M | Dell Inspiron 15 Plus Intel Core i5-11400H, NVIDIA GeForce RTX 3050 4GB Laptop GPU | Asus Vivobook 15 K513EQ Intel Core i7-1165G7, NVIDIA GeForce MX350 | Lenovo ThinkBook 15p G2 ITH 21B1000YGE Intel Core i7-11800H, NVIDIA GeForce RTX 3050 Ti Laptop GPU | HP Pavilion 15-eg Intel Core i7-1165G7, NVIDIA GeForce MX450 | Samsung Galaxy Book NP750XDA Intel Core i5-1135G7, Intel Iris Xe Graphics G7 80EUs | |
|---|---|---|---|---|---|---|
| Heat | -26% | -12% | -13% | -7% | -4% | |
| Maximum Upper Side * (°C) | 44.6 | 50 -12% | 48.8 -9% | 42.8 4% | 44 1% | 46.5 -4% |
| Maximum Bottom * (°C) | 47.5 | 51 -7% | 42 12% | 48.6 -2% | 53.4 -12% | 44.8 6% |
| Idle Upper Side * (°C) | 25.8 | 38 -47% | 30 -16% | 36 -40% | 27.4 -6% | 27.8 -8% |
| Idle Bottom * (°C) | 26.1 | 36 -38% | 35 -34% | 29.2 -12% | 28.8 -10% | 28.3 -8% |
* ... smaller is better
发言人
两个立体声扬声器只提供平均性能,与高级多媒体笔记本电脑相比,听起来非常薄,相当有金属感。它们对于偶尔的视频或一点背景音乐来说已经足够了,但如果你想获得更好的音频质量,你可能想使用外部扬声器或一副耳机。
Samsung Galaxy Book2 15 audio analysis
(±) | speaker loudness is average but good (76.1 dB)
Bass 100 - 315 Hz
(-) | nearly no bass - on average 18.5% lower than median
(±) | linearity of bass is average (12% delta to prev. frequency)
Mids 400 - 2000 Hz
(+) | balanced mids - only 4.2% away from median
(±) | linearity of mids is average (7.2% delta to prev. frequency)
Highs 2 - 16 kHz
(+) | balanced highs - only 3.9% away from median
(+) | highs are linear (6.2% delta to prev. frequency)
Overall 100 - 16.000 Hz
(±) | linearity of overall sound is average (18.3% difference to median)
Compared to same class
» 56% of all tested devices in this class were better, 7% similar, 38% worse
» The best had a delta of 5%, average was 17%, worst was 45%
Compared to all devices tested
» 40% of all tested devices were better, 8% similar, 52% worse
» The best had a delta of 4%, average was 23%, worst was 134%
Lenovo ThinkBook 15p G2 ITH 21B1000YGE audio analysis
(-) | not very loud speakers (68.4 dB)
Bass 100 - 315 Hz
(-) | nearly no bass - on average 15.3% lower than median
(-) | bass is not linear (16.1% delta to prev. frequency)
Mids 400 - 2000 Hz
(+) | balanced mids - only 1.9% away from median
(+) | mids are linear (6.2% delta to prev. frequency)
Highs 2 - 16 kHz
(+) | balanced highs - only 2.5% away from median
(±) | linearity of highs is average (7.4% delta to prev. frequency)
Overall 100 - 16.000 Hz
(±) | linearity of overall sound is average (17% difference to median)
Compared to same class
» 46% of all tested devices in this class were better, 7% similar, 46% worse
» The best had a delta of 5%, average was 17%, worst was 45%
Compared to all devices tested
» 31% of all tested devices were better, 8% similar, 61% worse
» The best had a delta of 4%, average was 23%, worst was 134%
电源管理 - 具有良好电池寿命的多媒体笔记本电脑
消耗功率
闲置时,Galaxy Book2对于一个15英寸的设备来说是非常高效的,在最大屏幕亮度下只需要8.5瓦。在负载情况下,你可以预期电力使用量约为55-60瓦,这意味着65瓦的壁式充电器对笔记本电脑来说勉强够用。
| Off / Standby | |
| Idle | |
| Load |
|
Key:
min: | |
| Samsung Galaxy Book2 15 i7-1260P, A350M, Samsung PM991 MZVLQ512HBLU, IPS, 1920x1080, 15.6" | Dell Inspiron 15 Plus i5-11400H, GeForce RTX 3050 4GB Laptop GPU, Micron 2450 512GB MTFDKBA512TFK, IPS, 1920x1080, 15.6" | Asus Vivobook 15 K513EQ i7-1165G7, GeForce MX350, Intel SSD 660p SSDPEKNW512G8, OLED, 1920x1080, 15.6" | Lenovo ThinkBook 15p G2 ITH 21B1000YGE i7-11800H, GeForce RTX 3050 Ti Laptop GPU, Samsung PM9A1 MZVL21T0HCLR, IPS, 3840x2160, 15.6" | HP Pavilion 15-eg i7-1165G7, GeForce MX450, Samsung PM991 MZVLQ1T0HALB, IPS, 1920x1080, 15.6" | Samsung Galaxy Book NP750XDA i5-1135G7, Iris Xe G7 80EUs, Lite-On CL1-8D512, IPS, 1920x1080, 15.6" | Average Intel Arc A350M | Average of class Multimedia | |
|---|---|---|---|---|---|---|---|---|
| Power Consumption | -82% | 2% | -113% | -17% | 16% | -17% | -42% | |
| Idle Minimum * (Watt) | 4 | 9 -125% | 3.7 7% | 10.69 -167% | 4.9 -23% | 3.5 12% | 5.25 ? -31% | 5.66 ? -42% |
| Idle Average * (Watt) | 7.8 | 11 -41% | 6.3 19% | 17.85 -129% | 7.9 -1% | 8 -3% | 7.7 ? 1% | 10.2 ? -31% |
| Idle Maximum * (Watt) | 8.5 | 15 -76% | 9.7 -14% | 18.67 -120% | 14.2 -67% | 9.4 -11% | 9.15 ? -8% | 12.5 ? -47% |
| Load Average * (Watt) | 59.1 | 97 -64% | 59 -0% | 98.17 -66% | 64.3 -9% | 37.8 36% | 72.1 ? -22% | 65.2 ? -10% |
| Witcher 3 ultra * (Watt) | 56.7 | 100.1 -77% | 51.4 9% | 100 -76% | 55.6 2% | 36.7 35% | ||
| Load Maximum * (Watt) | 62.4 | 129 -107% | 67.7 -8% | 135.55 -117% | 65.4 -5% | 45 28% | 76.7 ? -23% | 113.5 ? -82% |
* ... smaller is better
Power Consumption - The Witcher 3 / Stress test
Power Consumption - External monitor
电池寿命
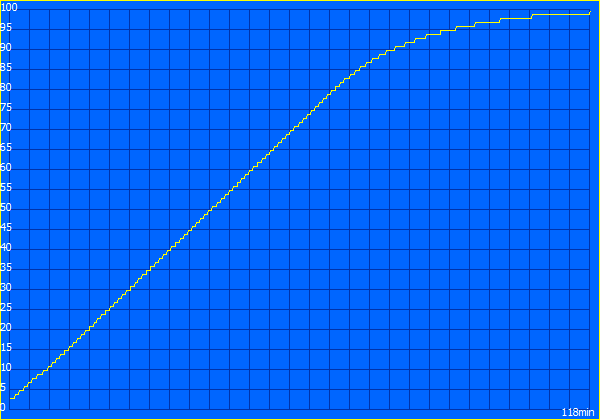
与前代产品一样,新的Galaxy Book2的电池寿命很好,这要归功于它的54Wh电池。之前的Galaxy Book是我们比较中唯一可以在不充电的情况下持续更长时间的设备。在我们的Wi-Fi测试中,根据屏幕亮度的不同,这款笔记本电脑可以持续使用6至8小时。它甚至能够在150cd/m²(相当于我们评测设备最大亮度的45%)下播放视频近10.5小时。在设备开启的情况下,充满电需要约两个小时;在充电约65分钟后,电池充满80%。
| Samsung Galaxy Book2 15 i7-1260P, A350M, 54 Wh | Dell Inspiron 15 Plus i5-11400H, GeForce RTX 3050 4GB Laptop GPU, 56 Wh | Asus Vivobook 15 K513EQ i7-1165G7, GeForce MX350, 42 Wh | Lenovo ThinkBook 15p G2 ITH 21B1000YGE i7-11800H, GeForce RTX 3050 Ti Laptop GPU, 57 Wh | HP Pavilion 15-eg i7-1165G7, GeForce MX450, 41 Wh | Samsung Galaxy Book NP750XDA i5-1135G7, Iris Xe G7 80EUs, 54 Wh | Average of class Multimedia | |
|---|---|---|---|---|---|---|---|
| Battery runtime | -24% | -20% | -44% | -20% | 15% | 40% | |
| H.264 (h) | 10.6 | 4.5 -58% | 17.1 ? 61% | ||||
| WiFi v1.3 (h) | 8.2 | 5.9 -28% | 6 -27% | 3.8 -54% | 6.6 -20% | 10.1 23% | 12.2 ? 49% |
| Load (h) | 1.5 | 1.2 -20% | 1.3 -13% | 1.2 -20% | 1.2 -20% | 1.6 7% | 1.664 ? 11% |
| Witcher 3 ultra (h) | 2 |
Pros
Cons
结论--Galaxy Book2存在显示效果弱和游戏性能差的问题

新的Galaxy Book2 15配备了当前一代Alder Lake-P Core i7 CPU和新的Arc A350M GPU,承诺提供体面的性能。不幸的是,情况并非如此。该处理器实际上马上就被限制在20瓦,这意味着U系列处理器会是该笔记本电脑更好的选择。与之前的Galaxy Book相比,CPU的性能有了明显的提高。也就是说,前代产品中的Tiger Lake 处理器的性能已经远远低于其实际潜力。尽管新的英特尔A350M显卡在合成基准中表现良好,但在实际游戏中,最新的AMD iGPU往往和英特尔专用GPU一样快,甚至比它更快。尽管这款笔记本电脑的性能乏善可陈,但里面的两个风扇非常响亮,其能源管理仍有改进的余地,因为系统有时会表现出巨大的性能波动。
另一个问题是显示效果不佳。三星选择使用非常廉价的无光泽IPS面板,不利用PWM,但就积极方面而言,这就是它。我们的主观印象是,图像质量非常差:颜色显得很冲,图像根本没有很高的对比度。此外,该面板的色彩偏差很高,只能覆盖本已很小的sRGB色彩空间的75%。这种显示屏在售价500-600欧元(500-600美元)的办公用笔记本电脑上可能是可以接受的,但在售价约为1300欧元(1300美元)的产品上就不行了。
价格和可用性
在审查配置中,Galaxy Book2的价格约为1,230欧元(1,230美元)。它在北美还没有上市。然而,你仍然可以从Cyberport订购它。那里,他们友好地给我们送来了评测装置。
Samsung Galaxy Book2 15
- 08/23/2022 v7 (old)
Andreas Osthoff
Price comparison

