联想ThinkPad T14 G3评测--商务笔记本用英特尔和Nvidia更糟糕
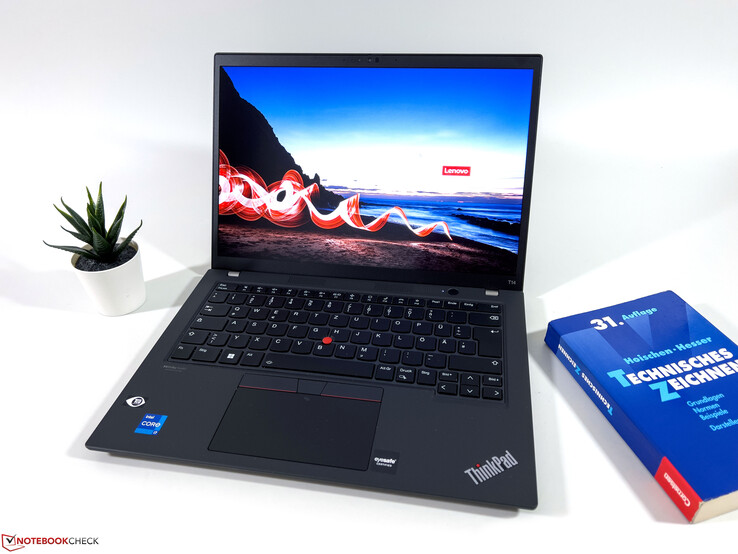
我们已经测试了ThinkPad T14 G3版本配备了AMD Ryzen 7 Pro包括快速的Radeon 680M iGPU进行了广泛的测试,但联想也继续提供配备英特尔处理器和可选NvidiaGeForce GPU的14英寸商务笔记本电脑。通过21AJS00400型号,我们现在有这样一个代表,结合了 Alder Lake酷睿i7-1260P与 GeForce MX550在我们的测试台上。我们可以忽略Raptor Lake处理器还没有在这里使用的事实,因为性能的提高只会是很小的,因为我们已经能够看到 我们已经能够看到.
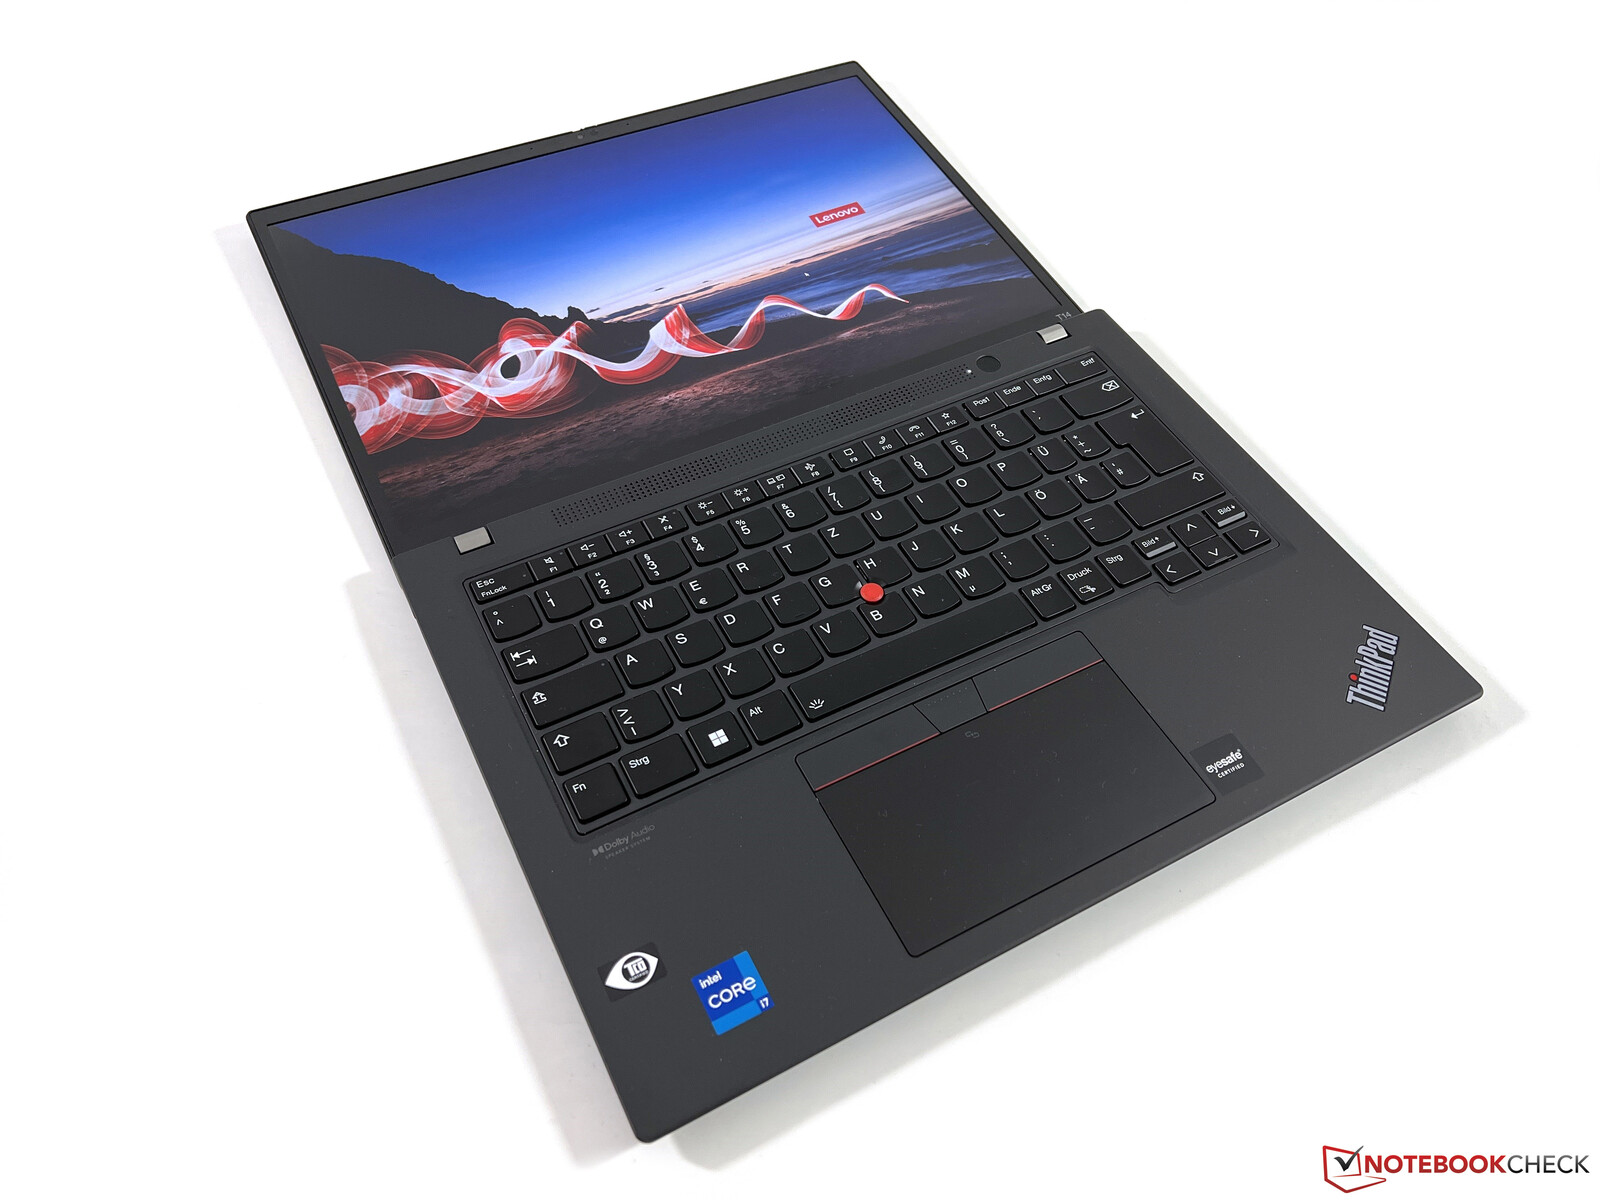
基本上,AMD和英特尔型号共享相同的外壳和输入设备、网络摄像头和扬声器。因此,在下面的测试中,我们将主要集中在哪个版本更好,以及额外的显卡是否真的还值得的问题上。
潜在的竞争对手比较
Rating | Date | Model | Weight | Height | Size | Resolution | Price |
|---|---|---|---|---|---|---|---|
| 86.4 % v7 (old) | 03 / 2023 | Lenovo ThinkPad T14 G3-21AJS00400 i7-1260P, GeForce MX550 | 1.5 kg | 17.9 mm | 14.00" | 1920x1200 | |
| 88.8 % v7 (old) | 09 / 2022 | Lenovo ThinkPad T14 G3-21CF004NGE R7 PRO 6850U, Radeon 680M | 1.4 kg | 17.9 mm | 14.00" | 1920x1200 | |
| 88.7 % v7 (old) | 12 / 2022 | HP EliteBook 840 G9 i7-1280P, Iris Xe G7 96EUs | 1.5 kg | 19 mm | 14.00" | 1920x1200 | |
| 88.8 % v7 (old) | 10 / 2022 | Schenker Vision 14 2022 RTX 3050 Ti i7-12700H, GeForce RTX 3050 Ti Laptop GPU | 1.3 kg | 16.6 mm | 14.00" | 2880x1800 | |
| 90.3 % v7 (old) | 09 / 2022 | Huawei MateBook X Pro 2022 i7-1260P, Iris Xe G7 96EUs | 1.3 kg | 15.6 mm | 14.20" | 3120x2080 |
与ThinkPad T14 G3 AMD的区别
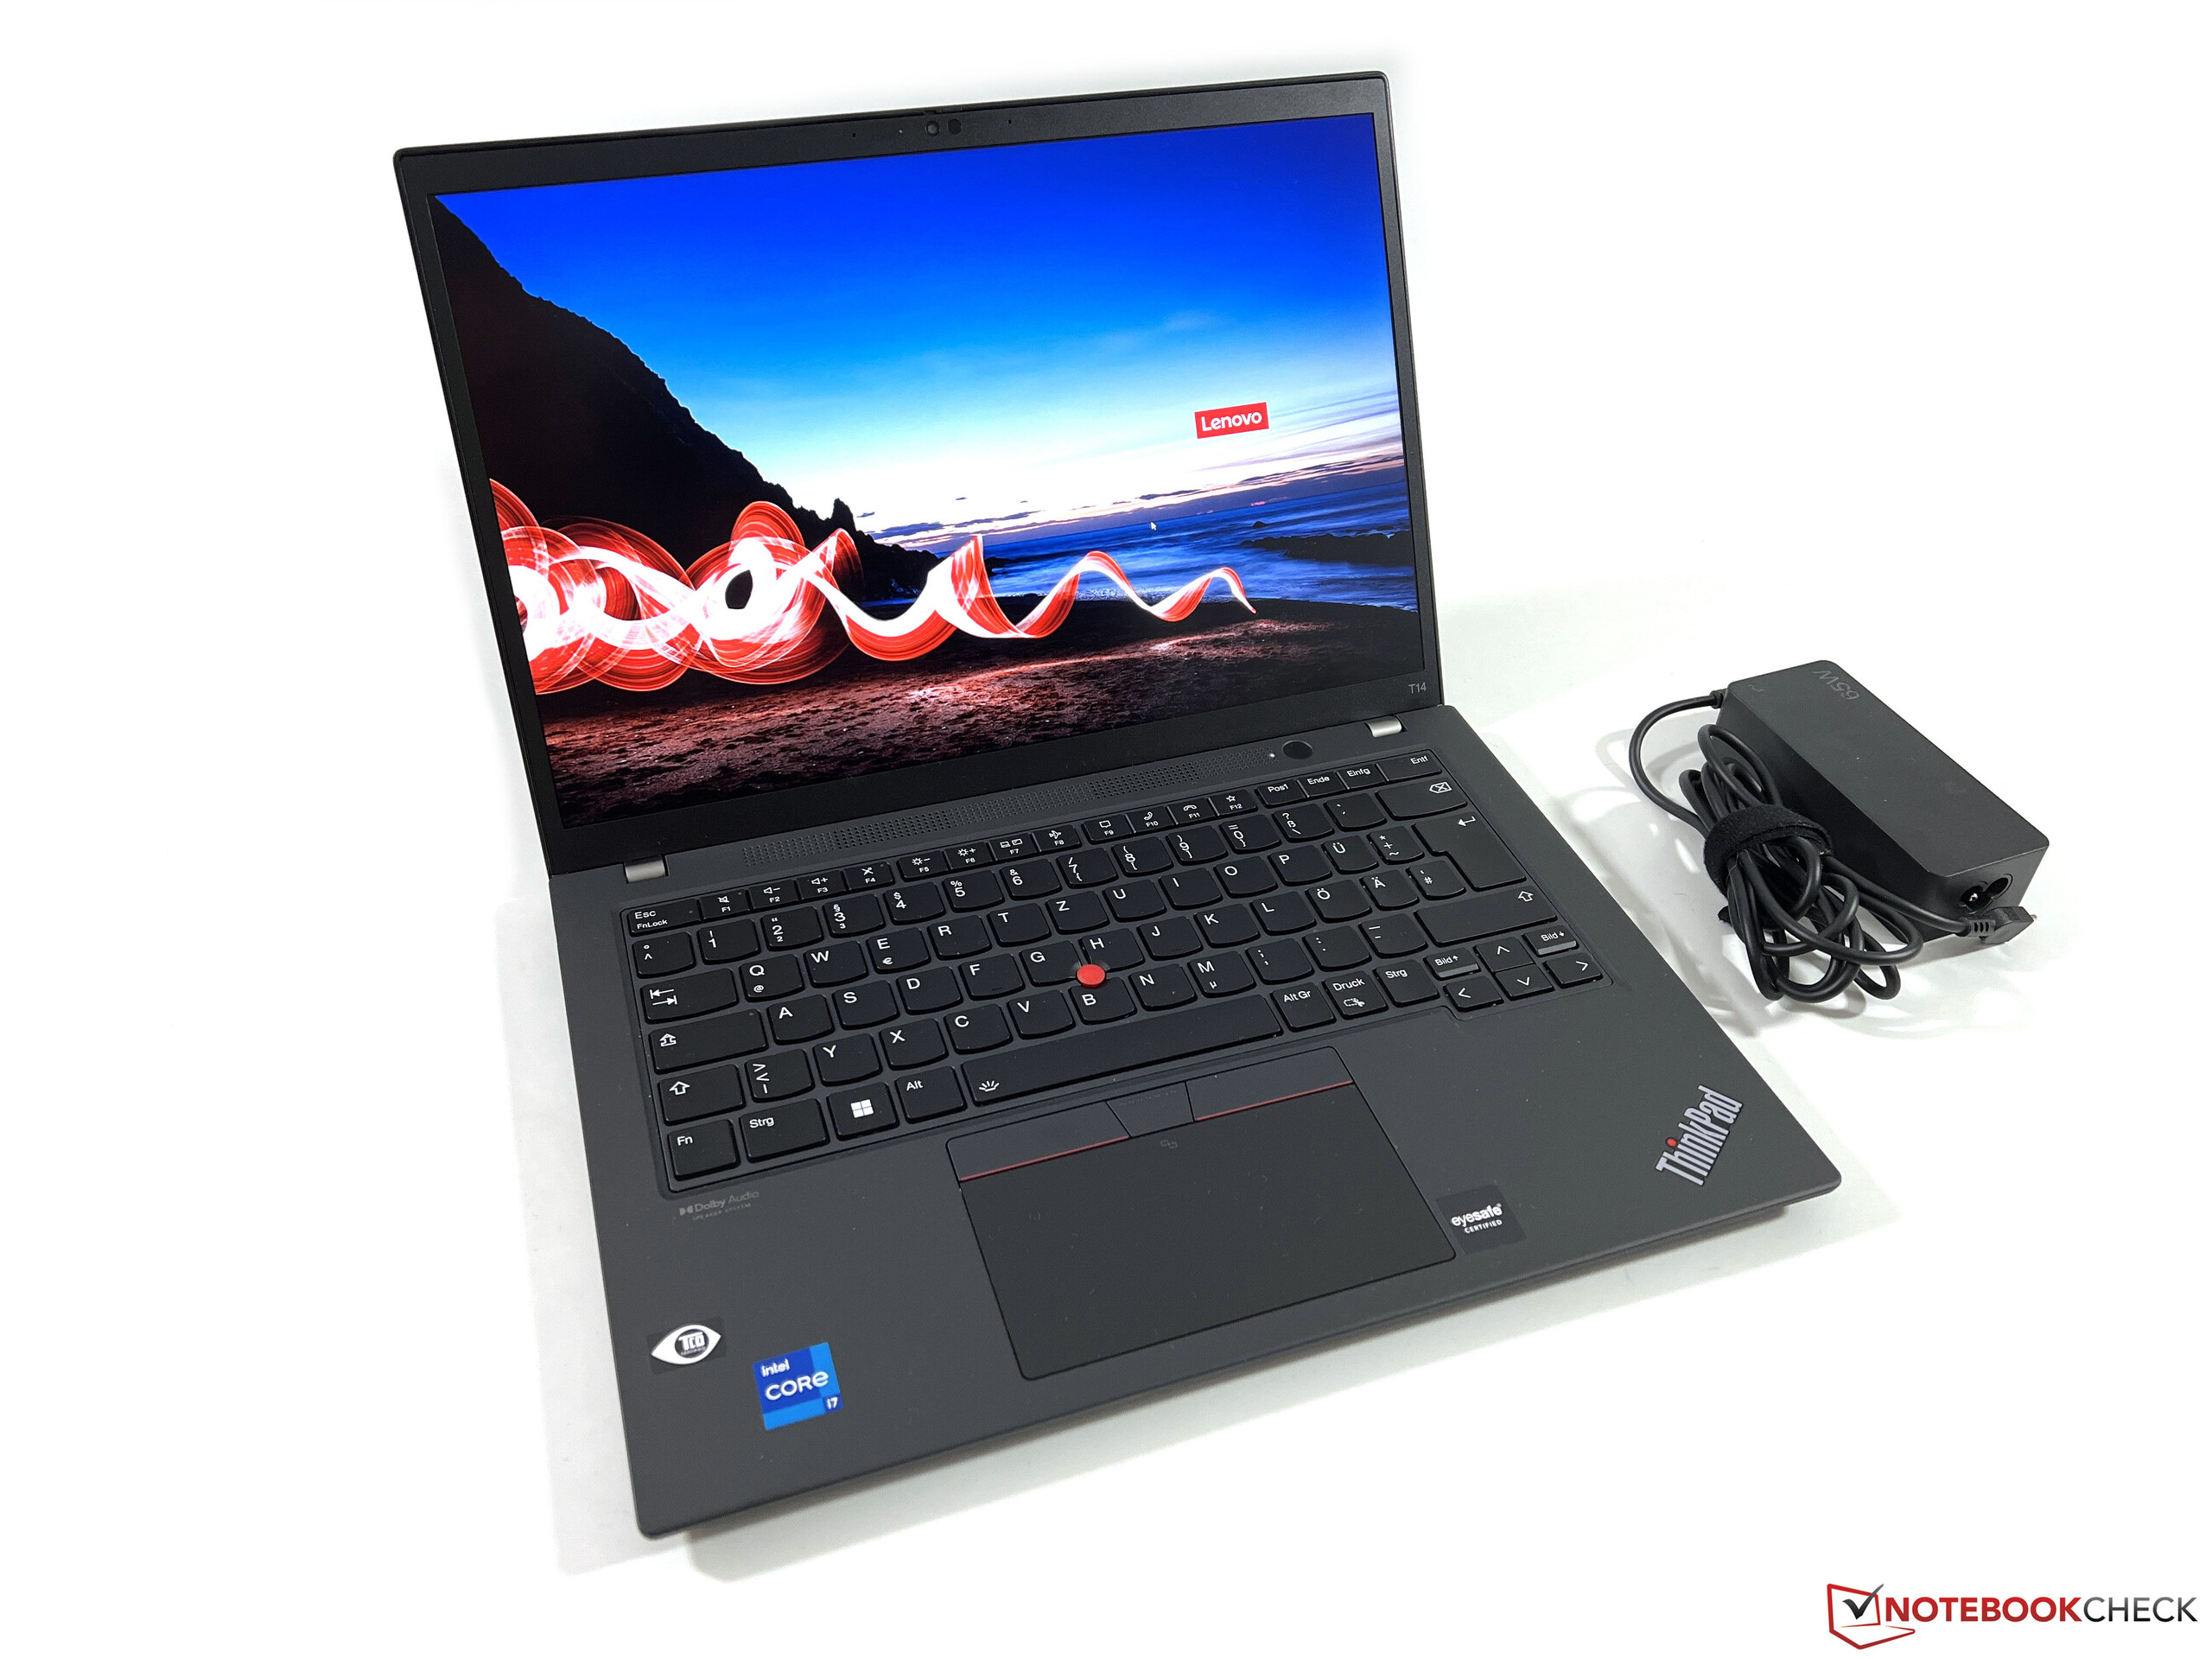
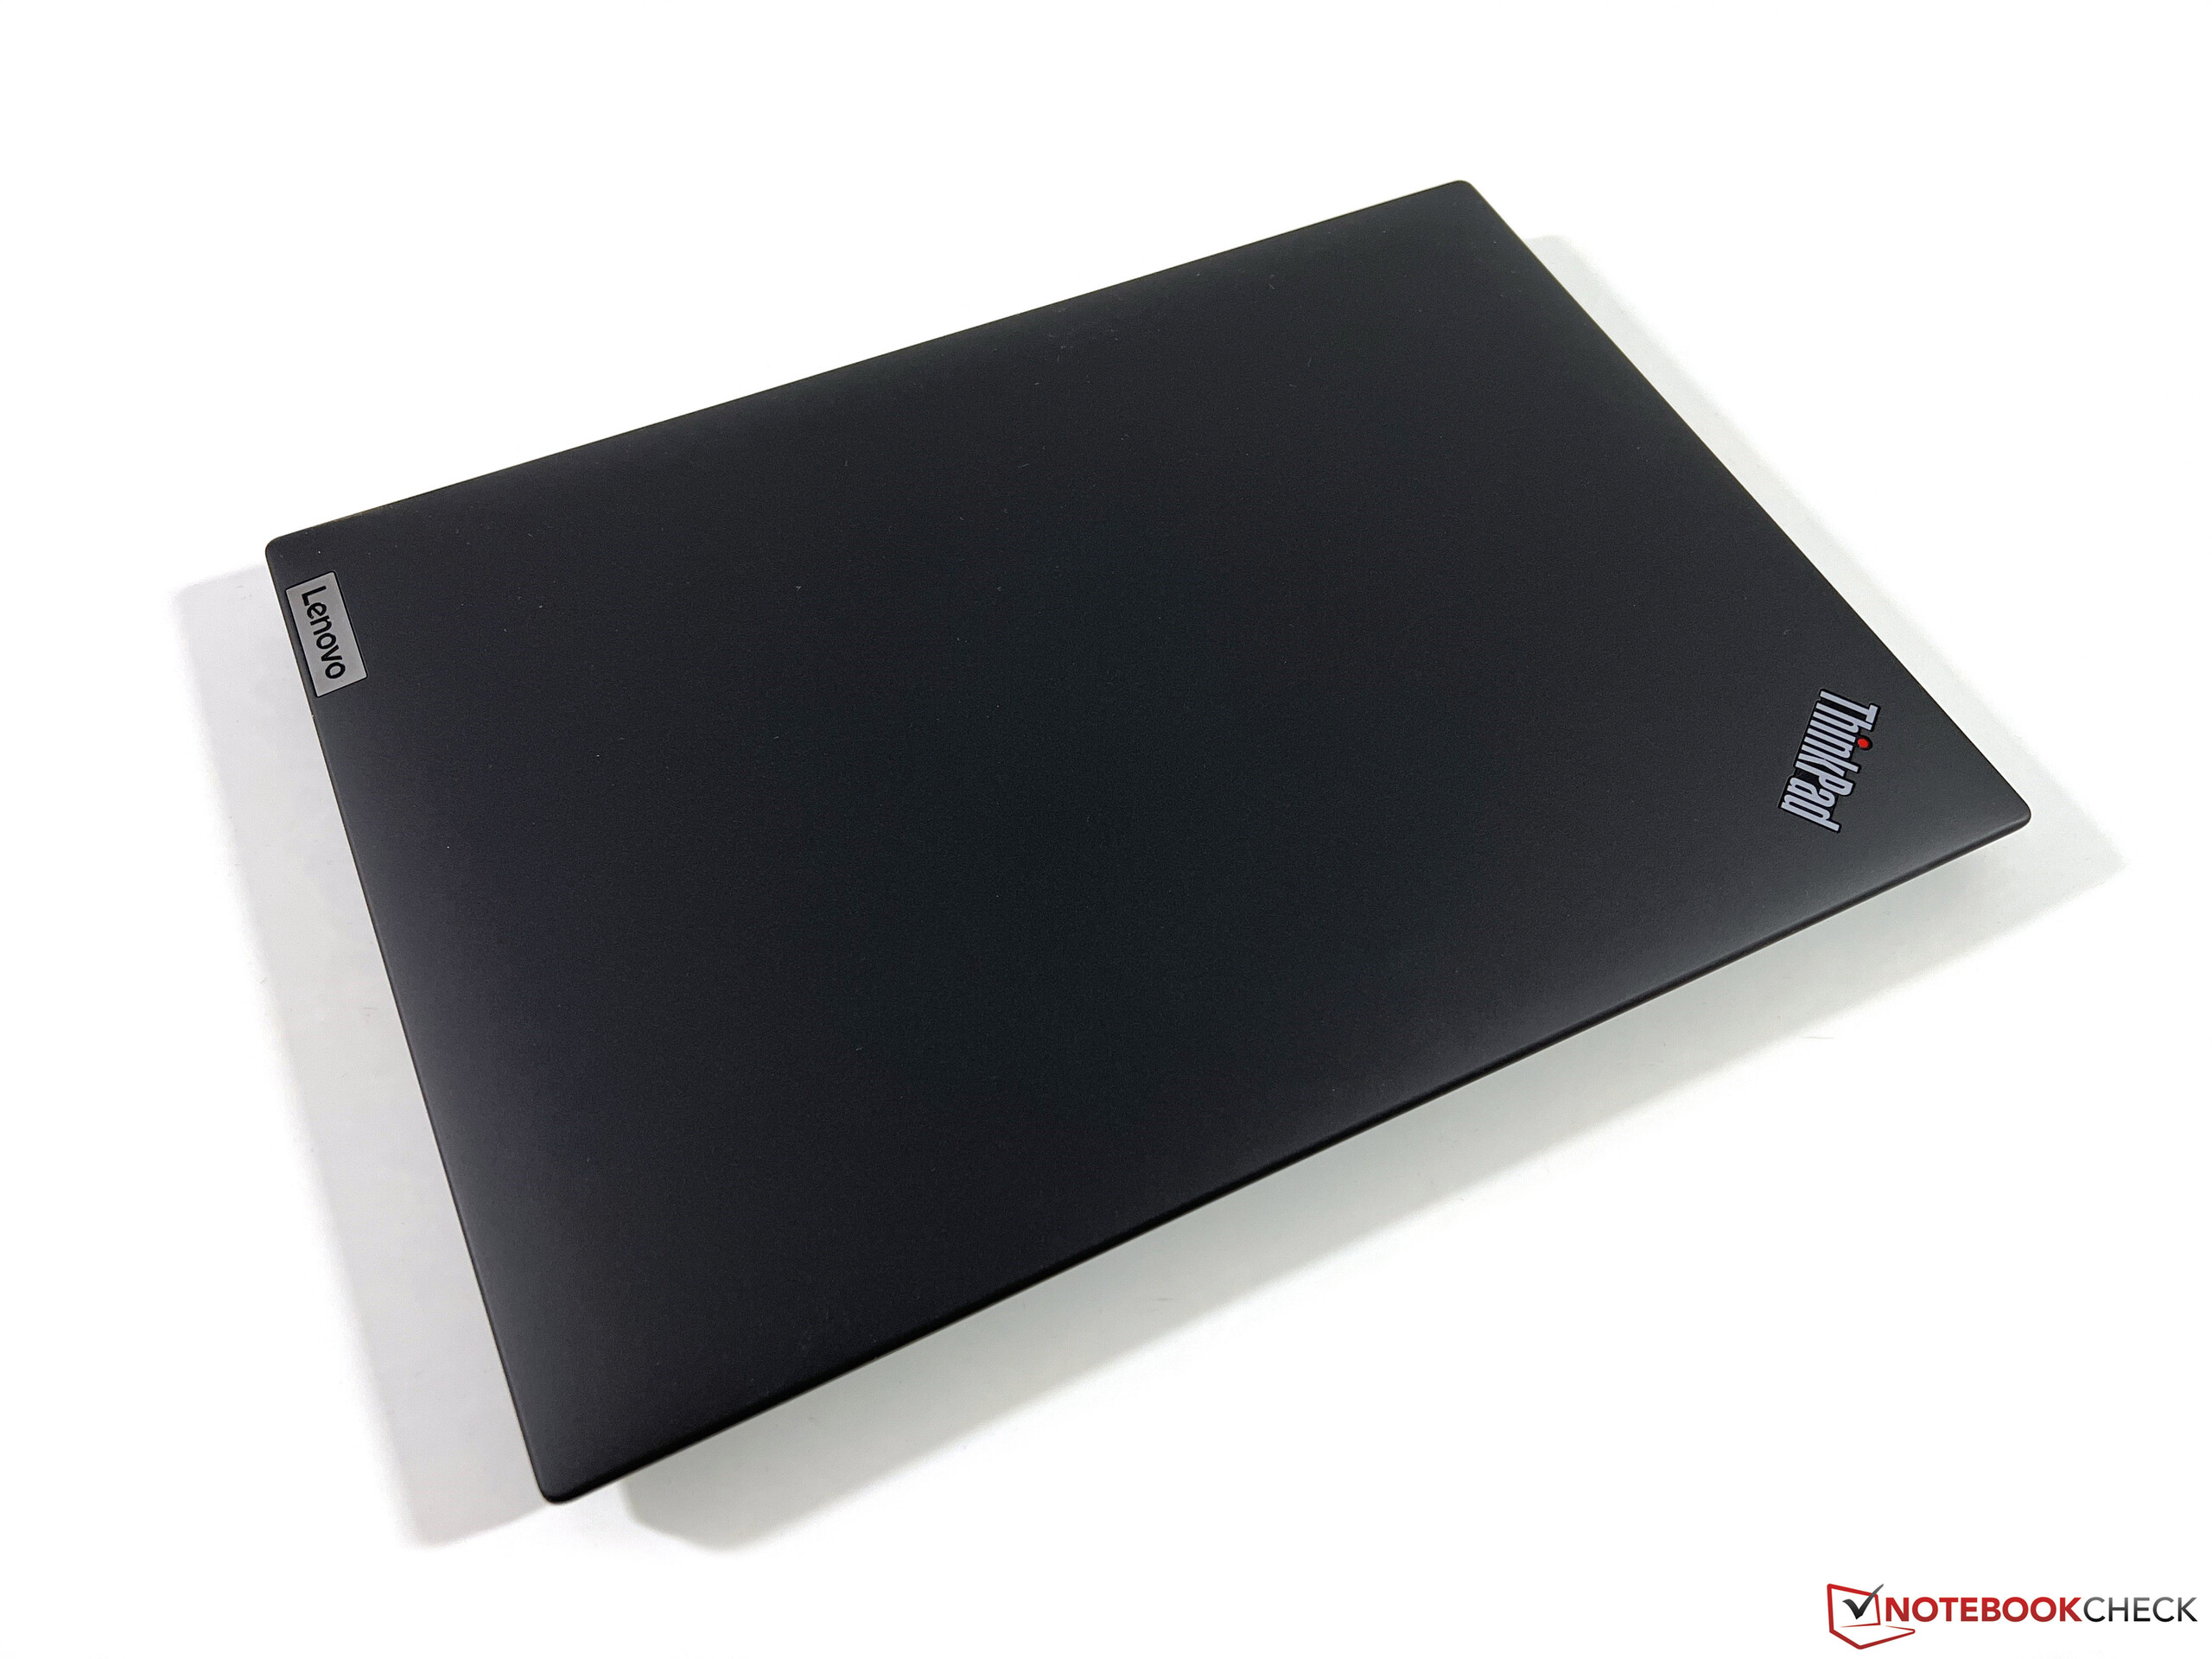
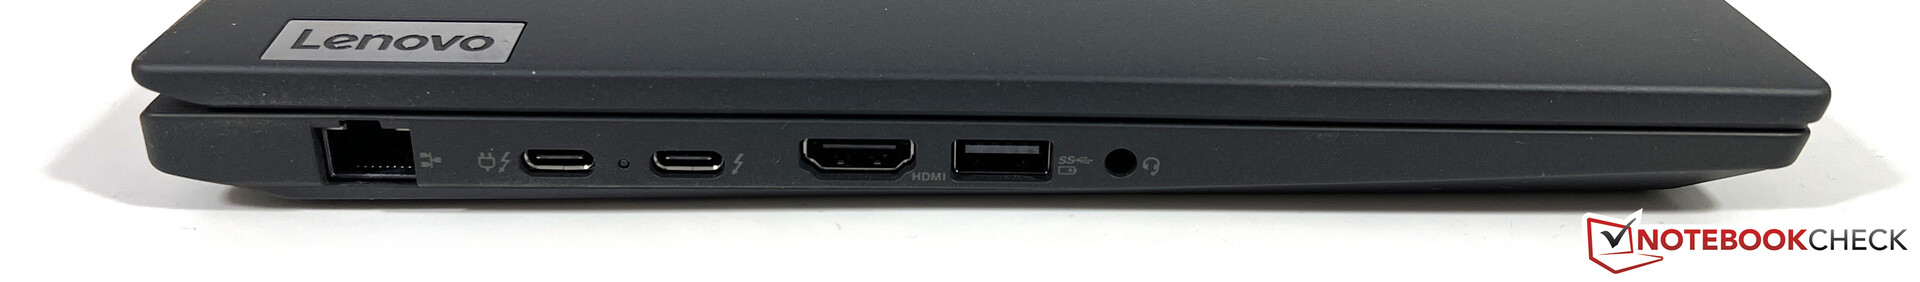
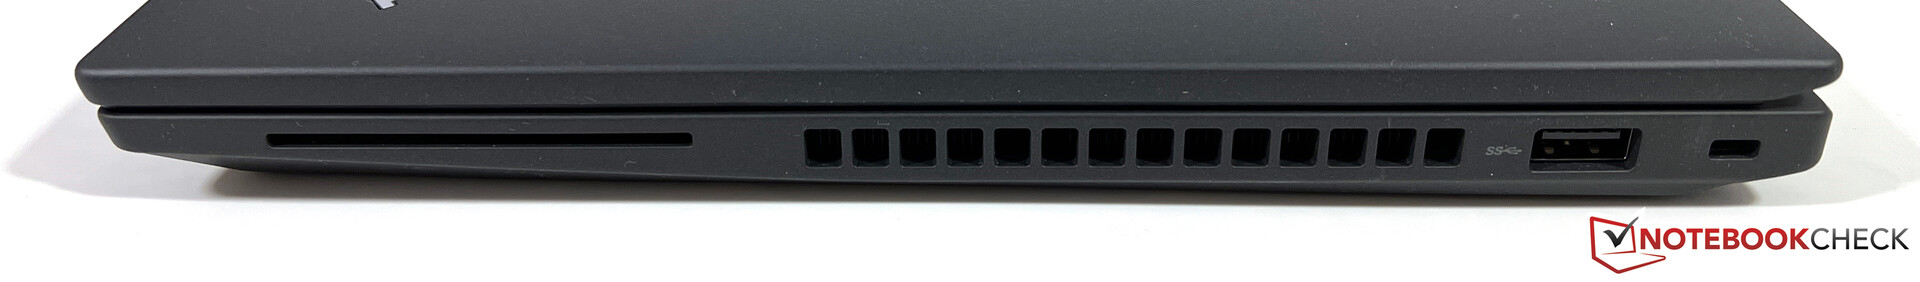
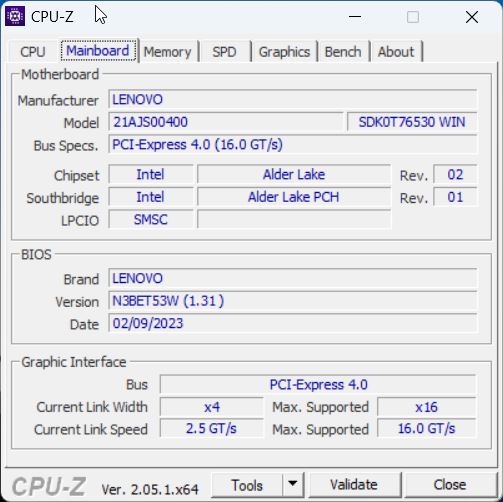
除了掌托上的贴纸不同外,两个ThinkPad T14版本在外观上没有任何区别,所以我们请你参考我们的 对AMD型号的广泛测试关于这一点的广泛测试。基本连接也是一样的,但联想在AMD型号中放弃了USB 4.0,而英特尔版本则有两个USB-C连接,支持雷电4。
通过AX211无线局域网卡,英特尔型号还支持现代的6-GHz网络,但我们在测试中无法使用参考网络路由器连接到相应的网络。然而,在常规5G网络中的表现也非常好。我们的测试装置已经做好了WWAN准备,后面的Nano-SIM卡插槽以及LTE模块所需的天线都已经到位。

| Networking | |
| Lenovo ThinkPad T14 G3-21AJS00400 | |
| iperf3 receive AXE11000 | |
| iperf3 transmit AXE11000 | |
| Lenovo ThinkPad T14 G3-21CF004NGE | |
| iperf3 receive AXE11000 6GHz | |
| iperf3 transmit AXE11000 6GHz | |
| HP EliteBook 840 G9 | |
| iperf3 receive AXE11000 6GHz | |
| iperf3 receive AXE11000 | |
| iperf3 transmit AXE11000 6GHz | |
| iperf3 transmit AXE11000 | |
| Schenker Vision 14 2022 RTX 3050 Ti | |
| iperf3 receive AXE11000 | |
| iperf3 transmit AXE11000 | |
| Huawei MateBook X Pro 2022 | |
| iperf3 receive AXE11000 6GHz | |
| iperf3 transmit AXE11000 6GHz | |


维护
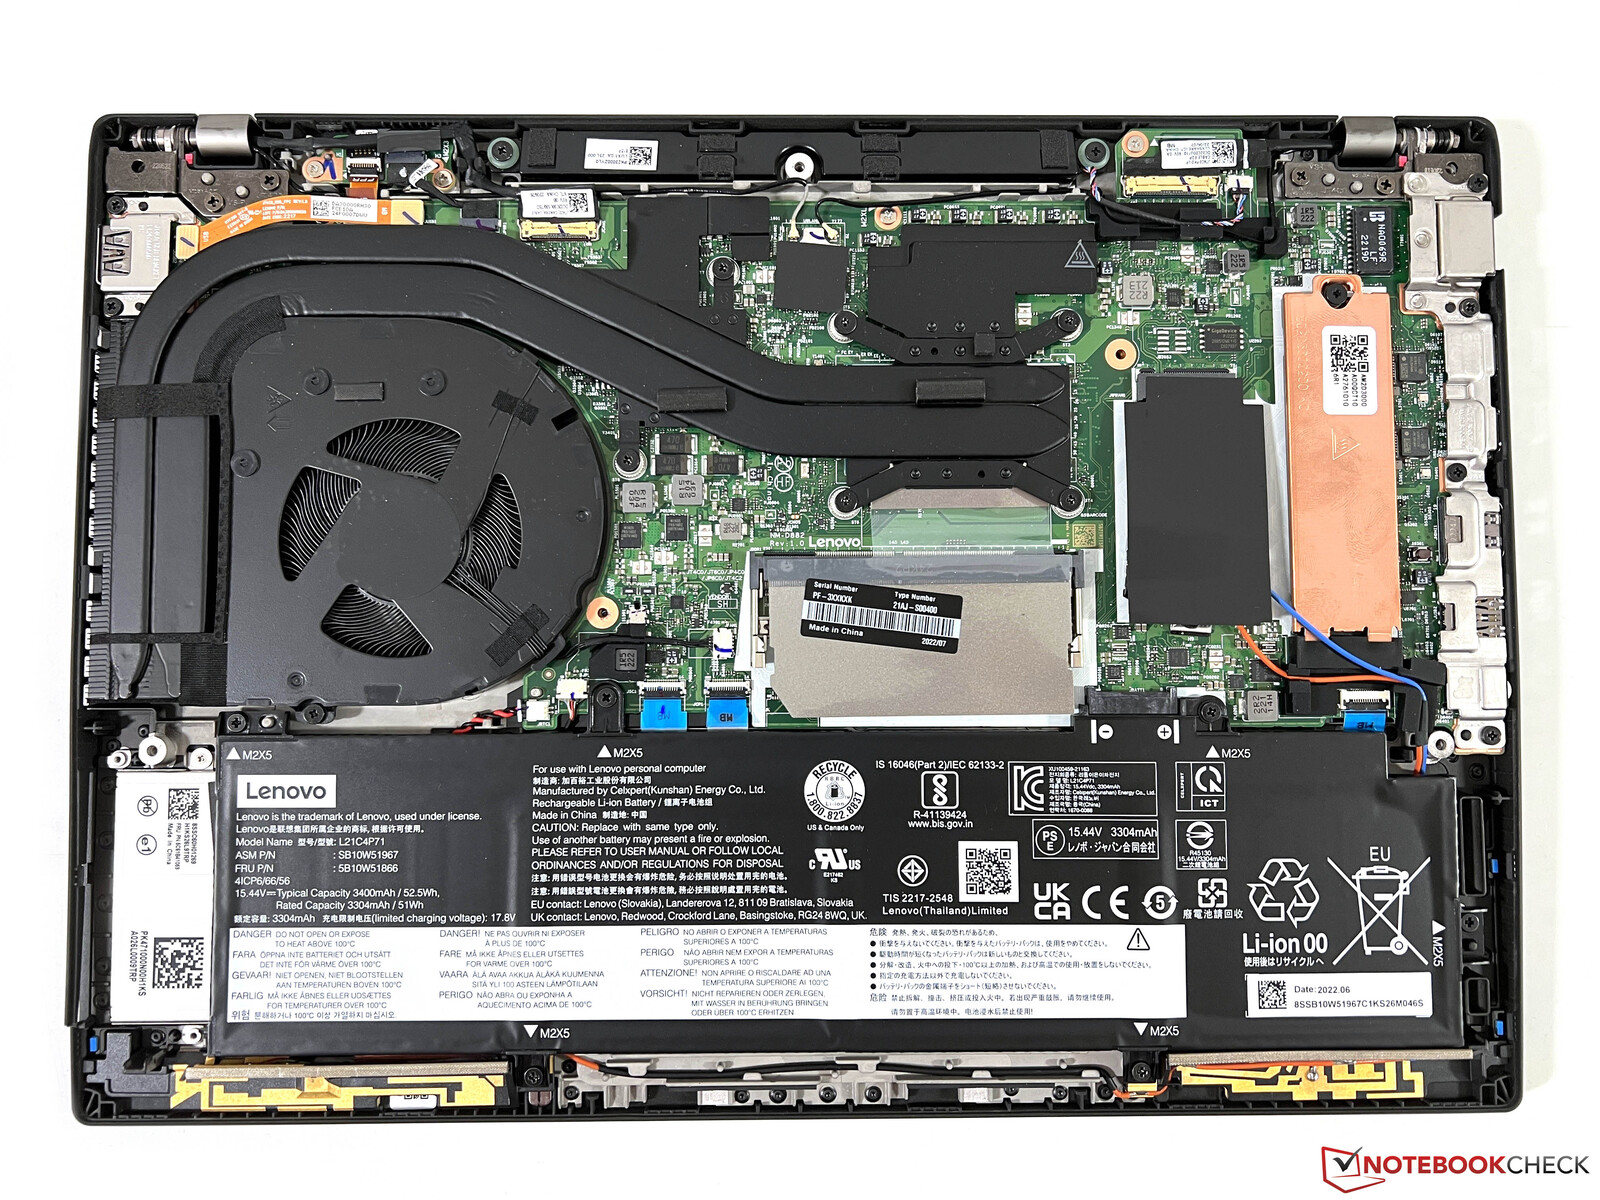
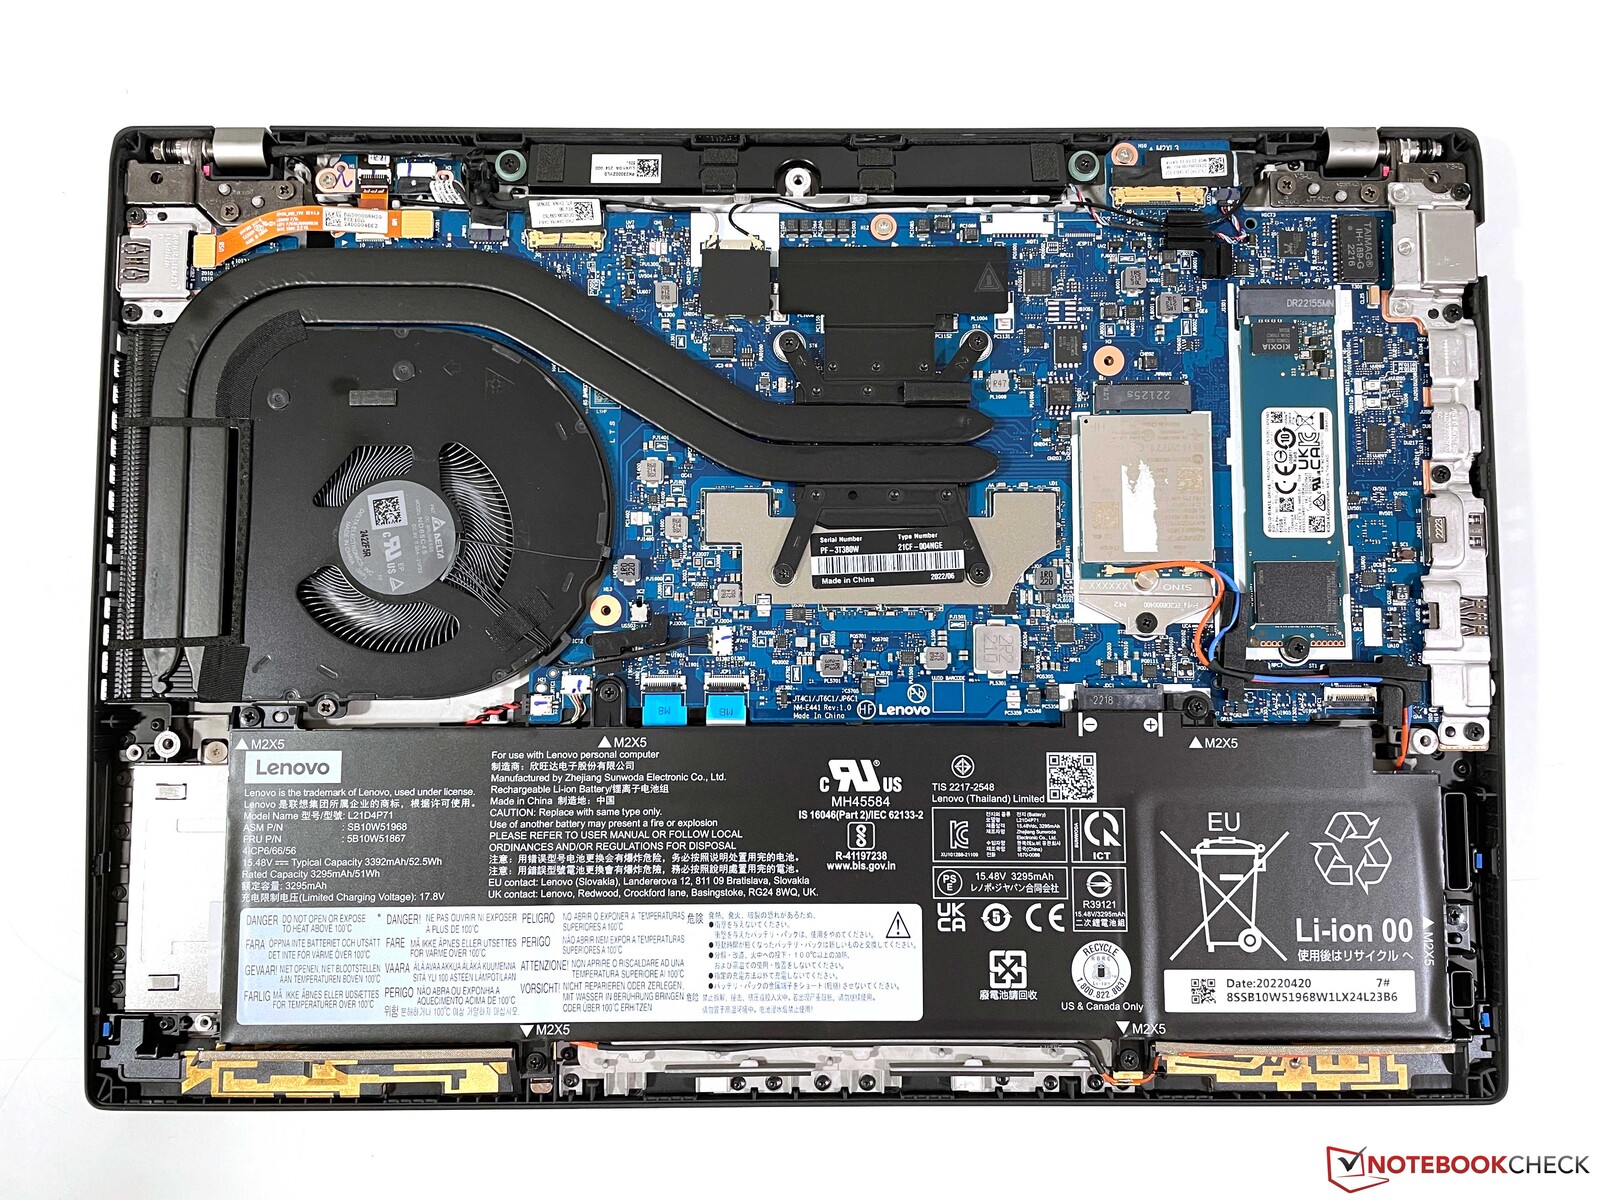
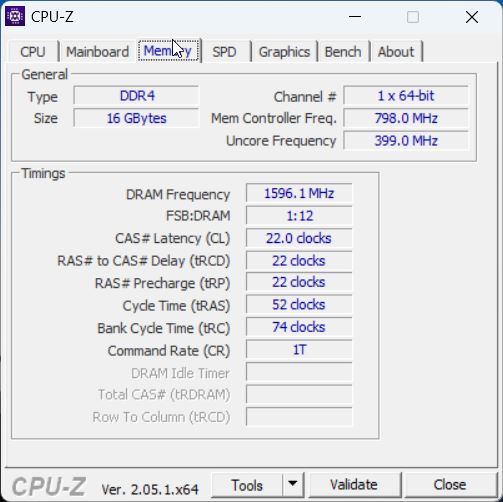
在内部布局上也有区别。虽然联想提供的是 AMD型号只提供焊接的内存,不向用户提供任何扩展功能,而英特尔机型的情况则不同。除了焊接的模块(在我们的案例中是16GB),还有一个免费的SO-DIMM插槽,使RAM的总量可能达到48GB。
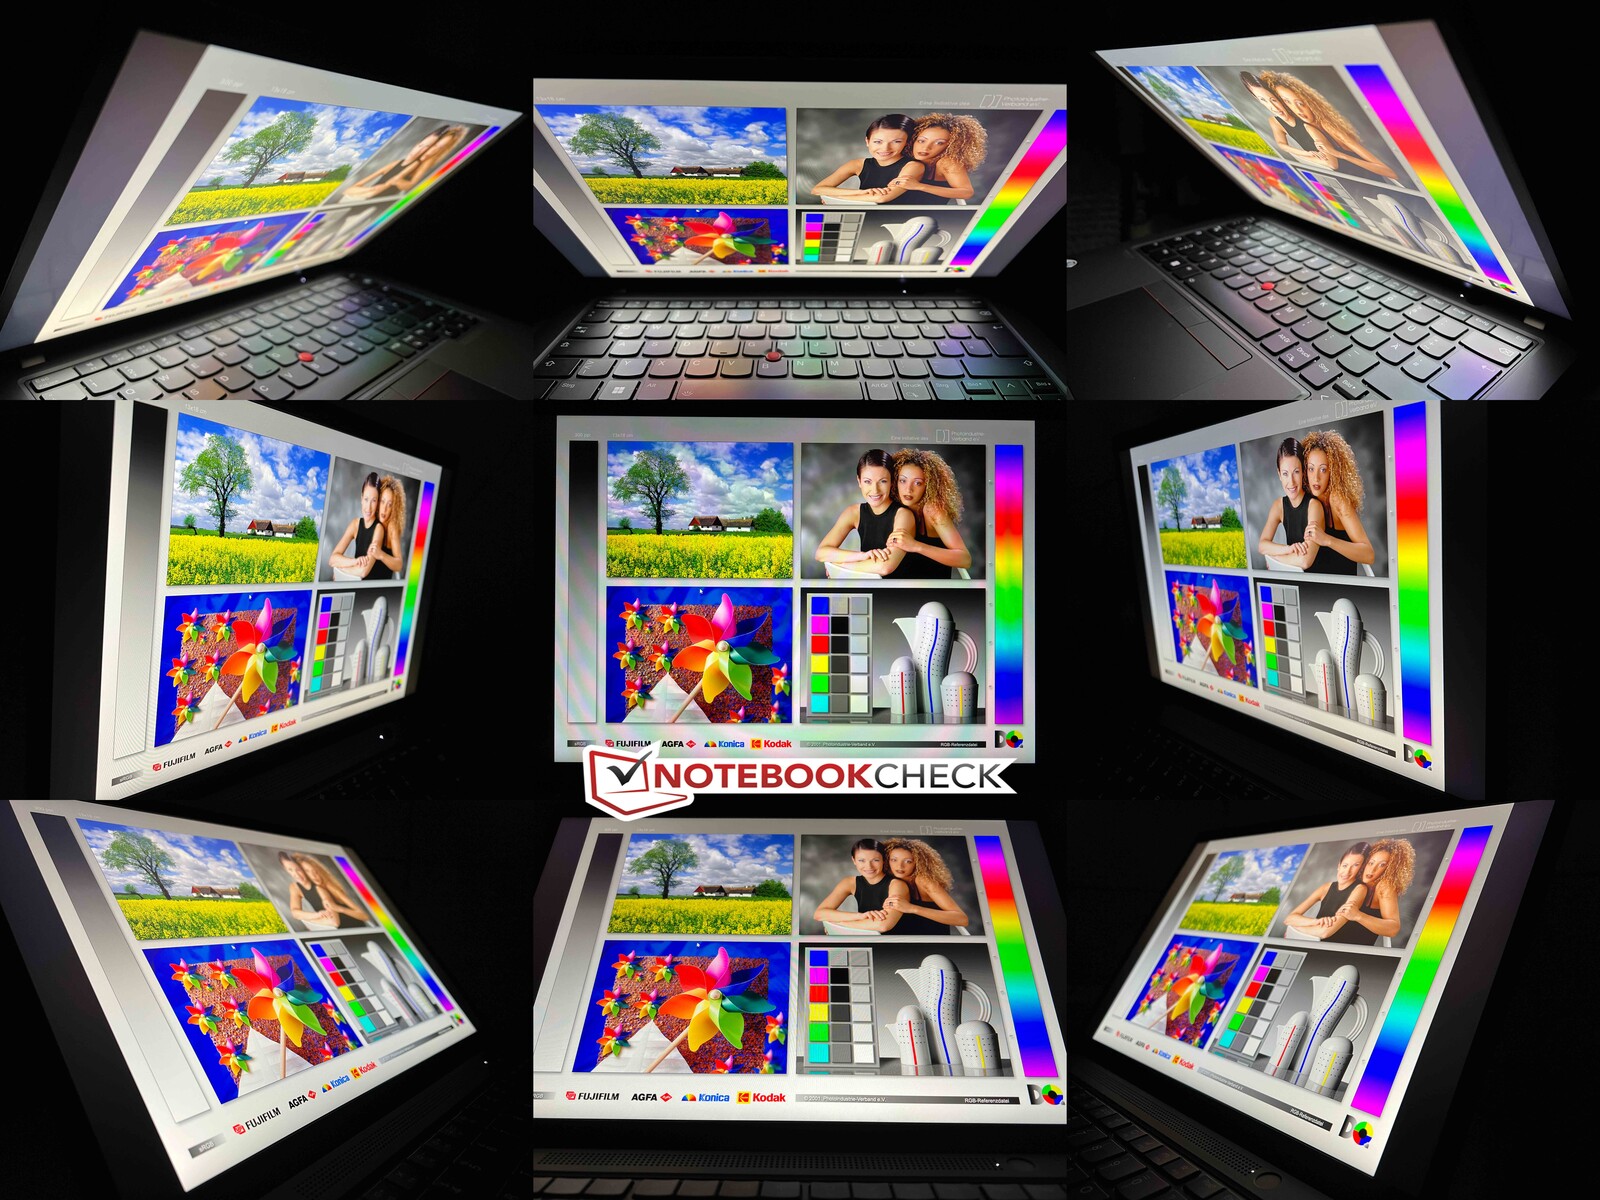
显示 - 面板抽奖继续
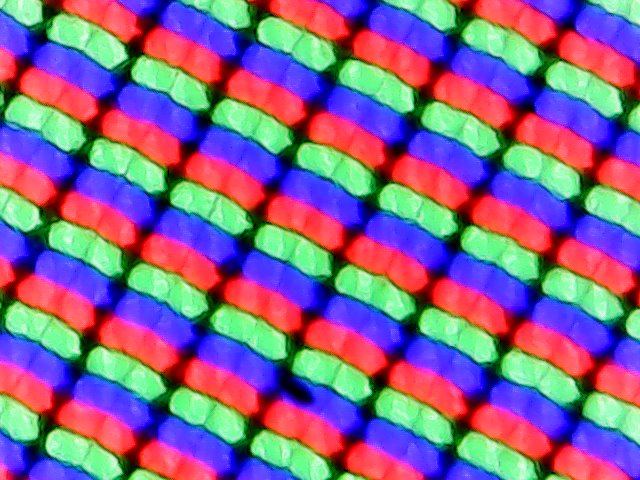
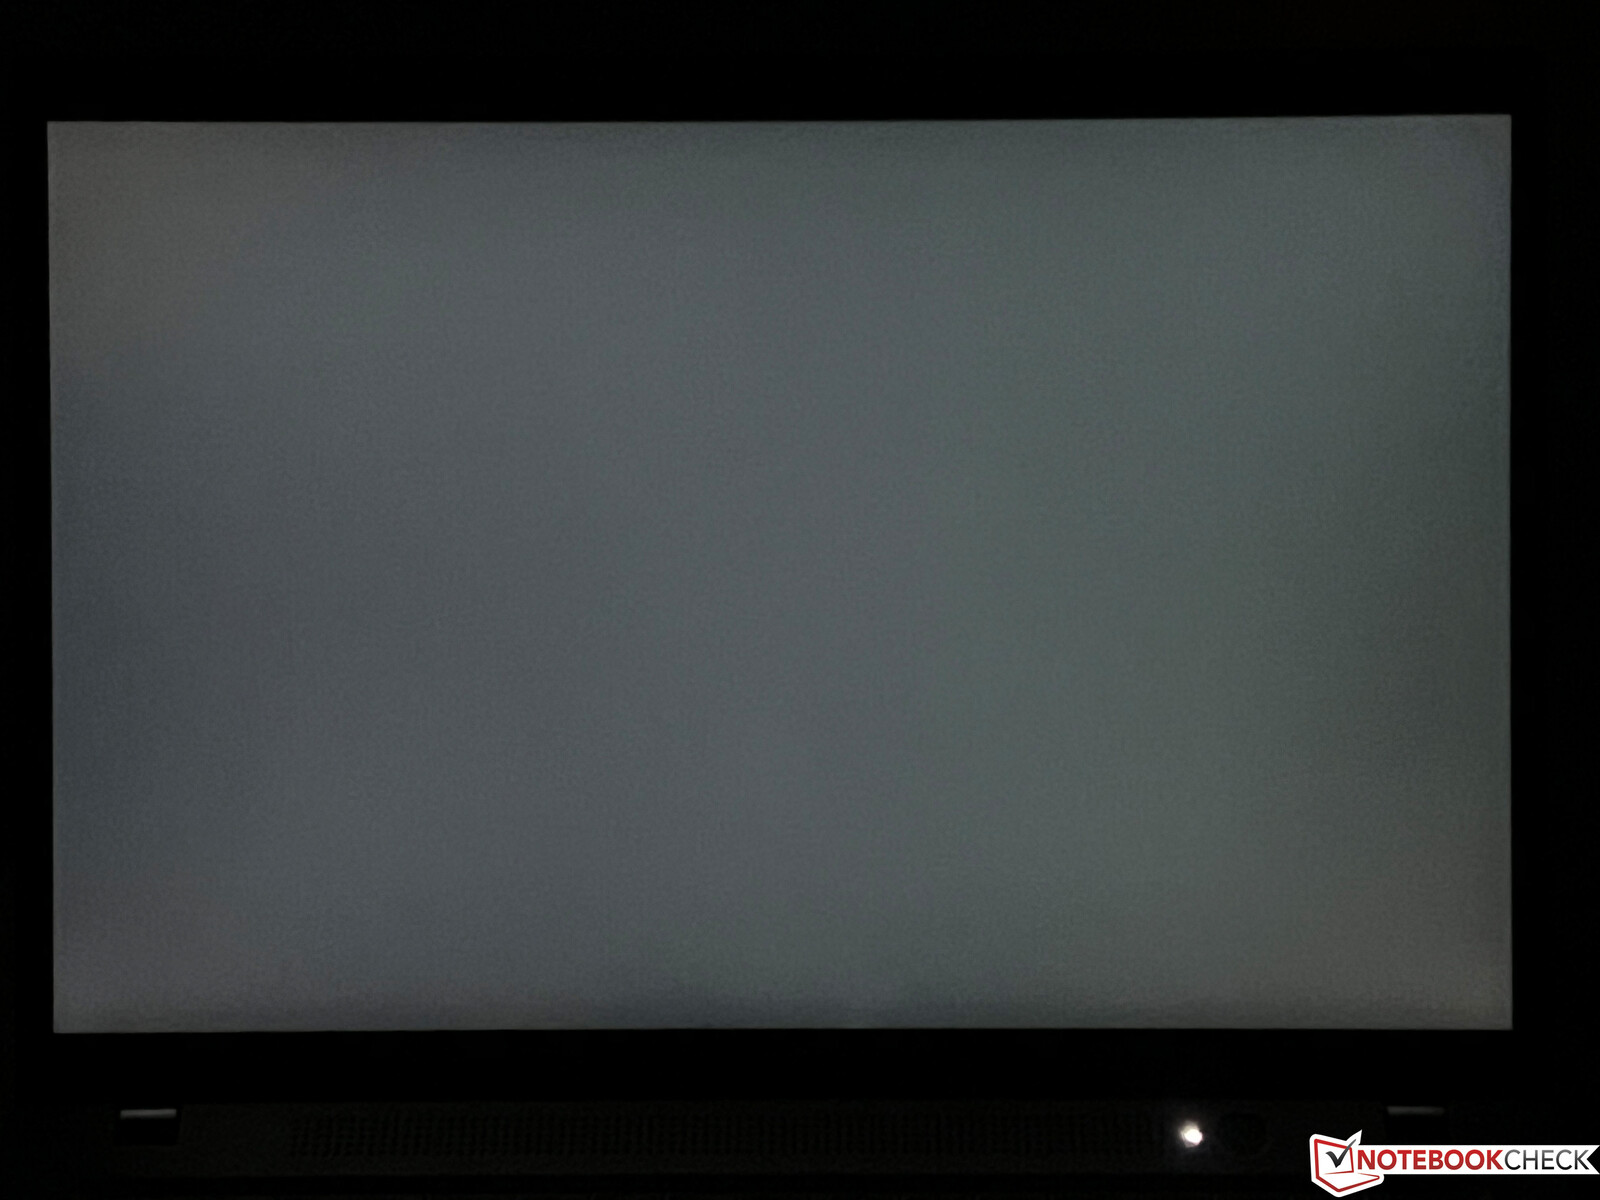
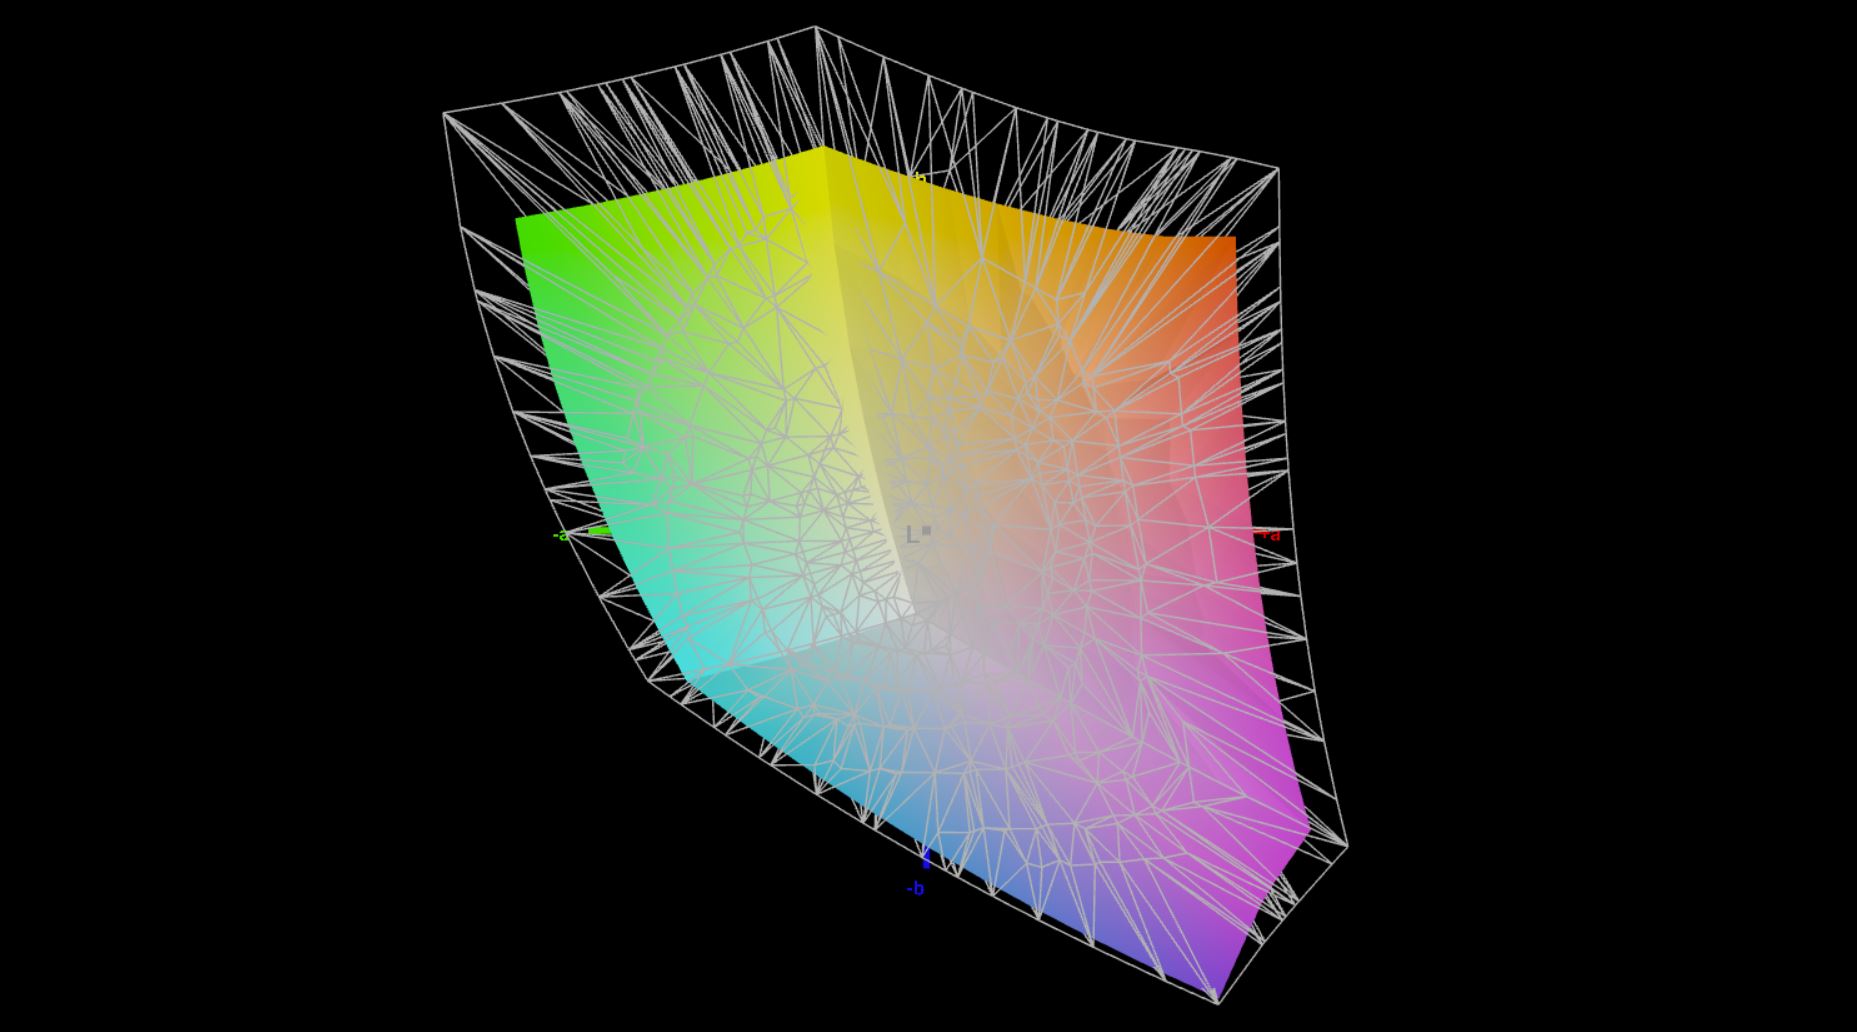
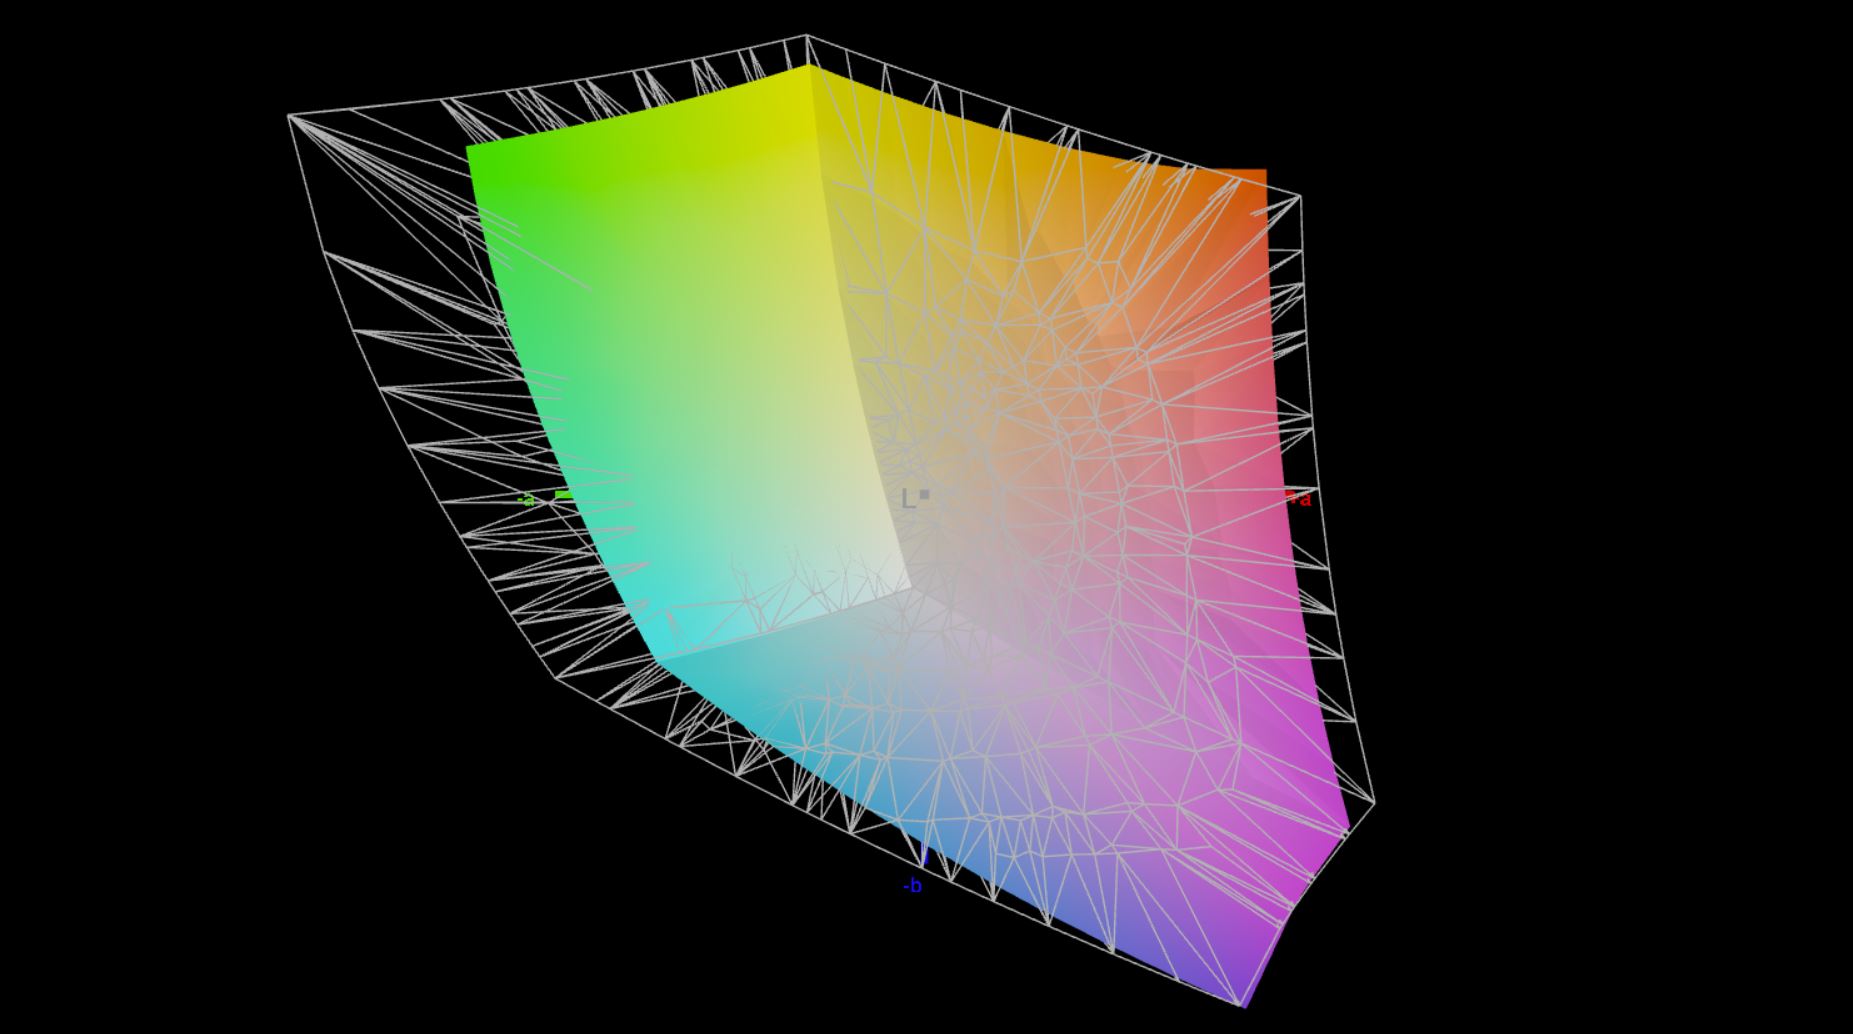
正如在以前的ThinkPad型号中已经出现的那样,联想也为当前的型号使用了不同的面板制造商。尽管我们的两台测试机都配备了14英寸低功耗全高清面板,但即使保留了两个版本(甚至更多,因为过去有多达4个版本)的基本技术规格,这里还是存在差异。与与我们以前的AMD测试装置的LG面板相比我们目前的英特尔测试设备使用的是友达的面板,主观上并不完全令人信服,因为明亮的区域看起来略有颗粒感。这里的响应时间也明显较慢,而且有一些明显的重影效果,例如在移动鼠标指针时。然而,这里也没有使用PWM。
亮度也是如此,它比LG型号的亮度低。然而,它仍然达到了宣传的400cd/m²。由于黑值较低,对比度没有理由抱怨。我们的测试设备没有任何混浊或屏幕出血的问题,即使在最高亮度水平也没有。
| |||||||||||||||||||||||||
Brightness Distribution: 91 %
Center on Battery: 399 cd/m²
Contrast: 2105:1 (Black: 0.19 cd/m²)
ΔE ColorChecker Calman: 3.5 | ∀{0.5-29.43 Ø4.71}
calibrated: 1.6
ΔE Greyscale Calman: 4.8 | ∀{0.09-98 Ø4.96}
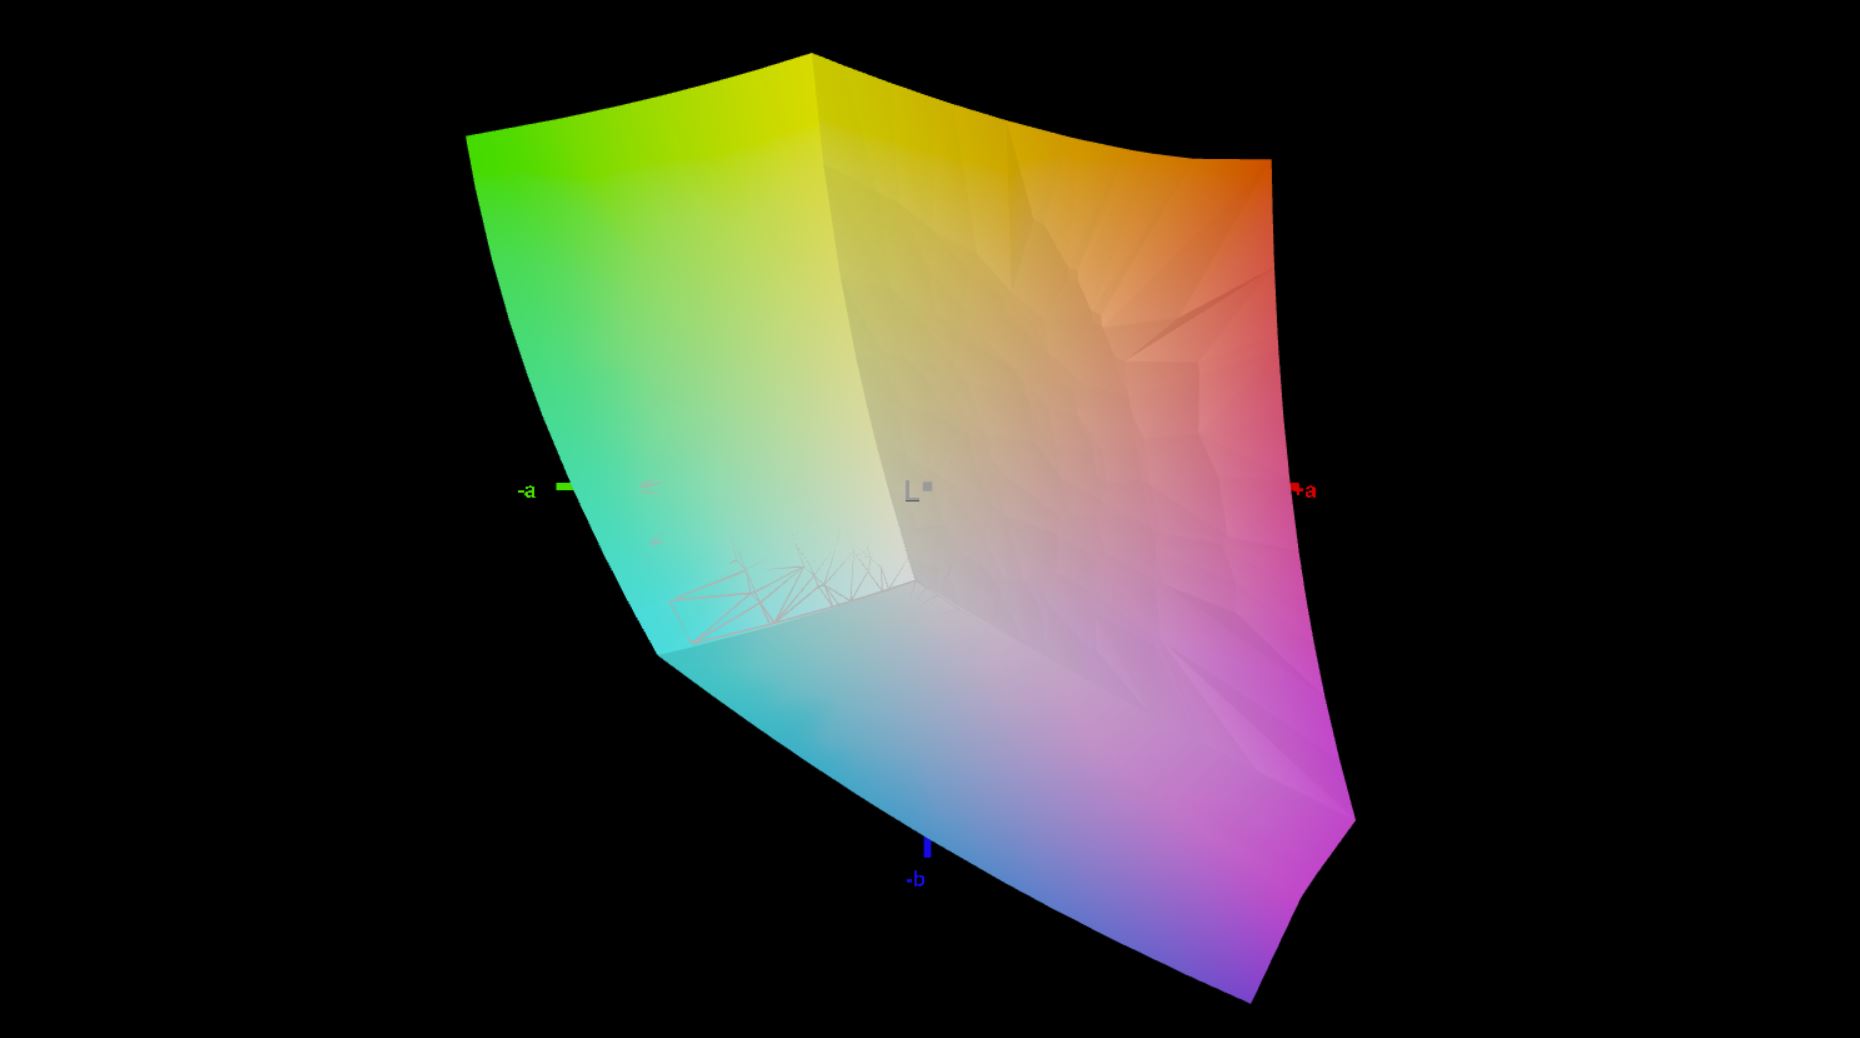
77.9% AdobeRGB 1998 (Argyll 3D)
100% sRGB (Argyll 3D)
76.3% Display P3 (Argyll 3D)
Gamma: 2.11
CCT: 6662 K
| Lenovo ThinkPad T14 G3-21AJS00400 B140UAN02.1, IPS, 1920x1200, 14" | Lenovo ThinkPad T14 G3-21CF004NGE LP140WU1-SPB2, IPS, 1920x1200, 14" | HP EliteBook 840 G9 Chi Mei CMN1435, IPS, 1920x1200, 14" | Schenker Vision 14 2022 RTX 3050 Ti MNE007ZA1-1, IPS, 2880x1800, 14" | Huawei MateBook X Pro 2022 TMX1422, IPS, 3120x2080, 14.2" | |
|---|---|---|---|---|---|
| Display | -7% | -8% | -3% | 12% | |
| Display P3 Coverage (%) | 76.3 | 69.2 -9% | 67.6 -11% | 74.1 -3% | 94.6 24% |
| sRGB Coverage (%) | 100 | 97.4 -3% | 98.7 -1% | 97.4 -3% | 99.5 0% |
| AdobeRGB 1998 Coverage (%) | 77.9 | 71.5 -8% | 69.7 -11% | 75.3 -3% | 86.5 11% |
| Response Times | 40% | -19% | 54% | 55% | |
| Response Time Grey 50% / Grey 80% * (ms) | 62.6 ? | 41.4 ? 34% | 66 ? -5% | 31.5 ? 50% | 25.4 ? 59% |
| Response Time Black / White * (ms) | 34.9 ? | 19.2 ? 45% | 46.4 ? -33% | 14.5 ? 58% | 17.1 ? 51% |
| PWM Frequency (Hz) | |||||
| Screen | 16% | 14% | -6% | 22% | |
| Brightness middle (cd/m²) | 400 | 451 13% | 391.3 -2% | 421 5% | 603 51% |
| Brightness (cd/m²) | 395 | 435 10% | 368 -7% | 416 5% | 586 48% |
| Brightness Distribution (%) | 91 | 94 3% | 86 -5% | 89 -2% | 91 0% |
| Black Level * (cd/m²) | 0.19 | 0.21 -11% | 0.32 -68% | 0.28 -47% | 0.39 -105% |
| Contrast (:1) | 2105 | 2148 2% | 1223 -42% | 1504 -29% | 1546 -27% |
| Colorchecker dE 2000 * | 3.5 | 2.4 31% | 1.49 57% | 3.2 9% | 1.1 69% |
| Colorchecker dE 2000 max. * | 7.2 | 4.1 43% | 3.29 54% | 5.5 24% | 2.2 69% |
| Colorchecker dE 2000 calibrated * | 1.6 | 1.3 19% | 0.44 73% | 2 -25% | 1.2 25% |
| Greyscale dE 2000 * | 4.8 | 3.3 31% | 1.7 65% | 4.4 8% | 1.5 69% |
| Gamma | 2.11 104% | 2.13 103% | 2.12 104% | 2.22 99% | 2.17 101% |
| CCT | 6662 98% | 6848 95% | 6488 100% | 6384 102% | 6549 99% |
| Total Average (Program / Settings) | 16% /
14% | -4% /
5% | 15% /
3% | 30% /
25% |
* ... smaller is better
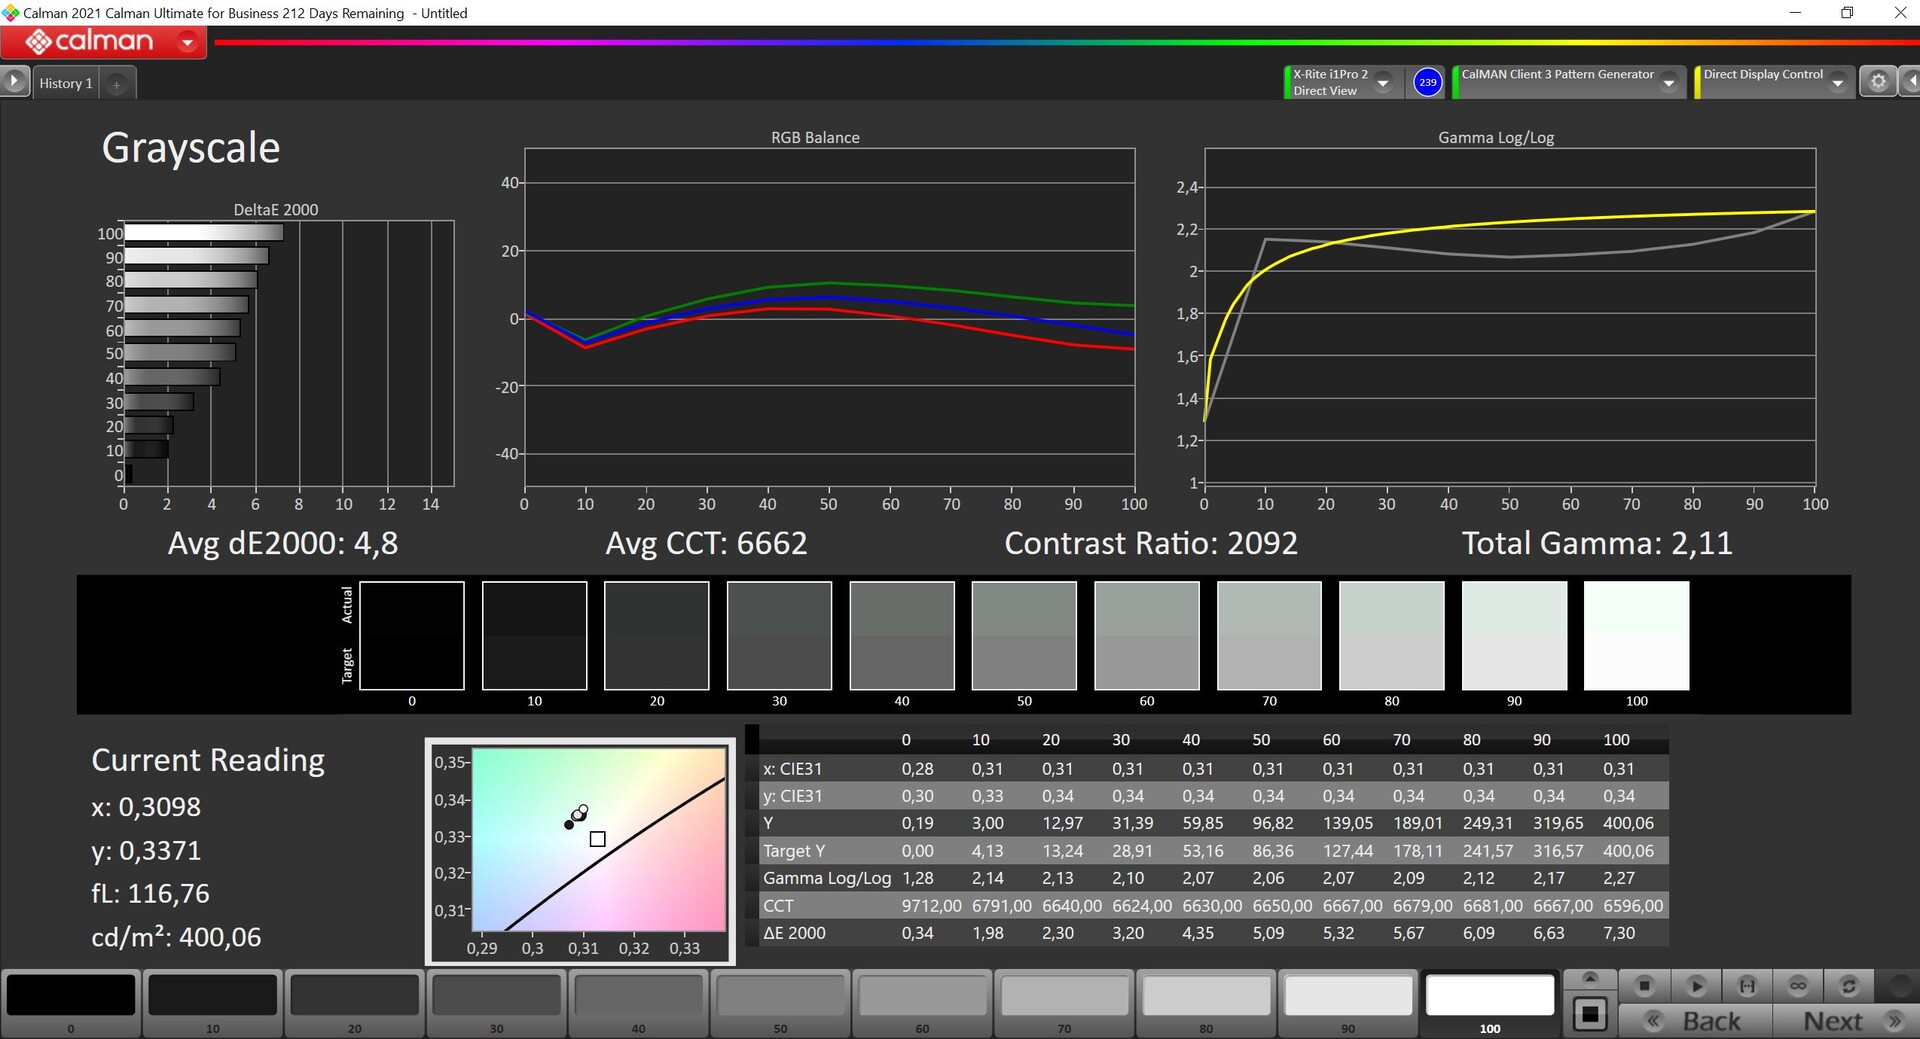
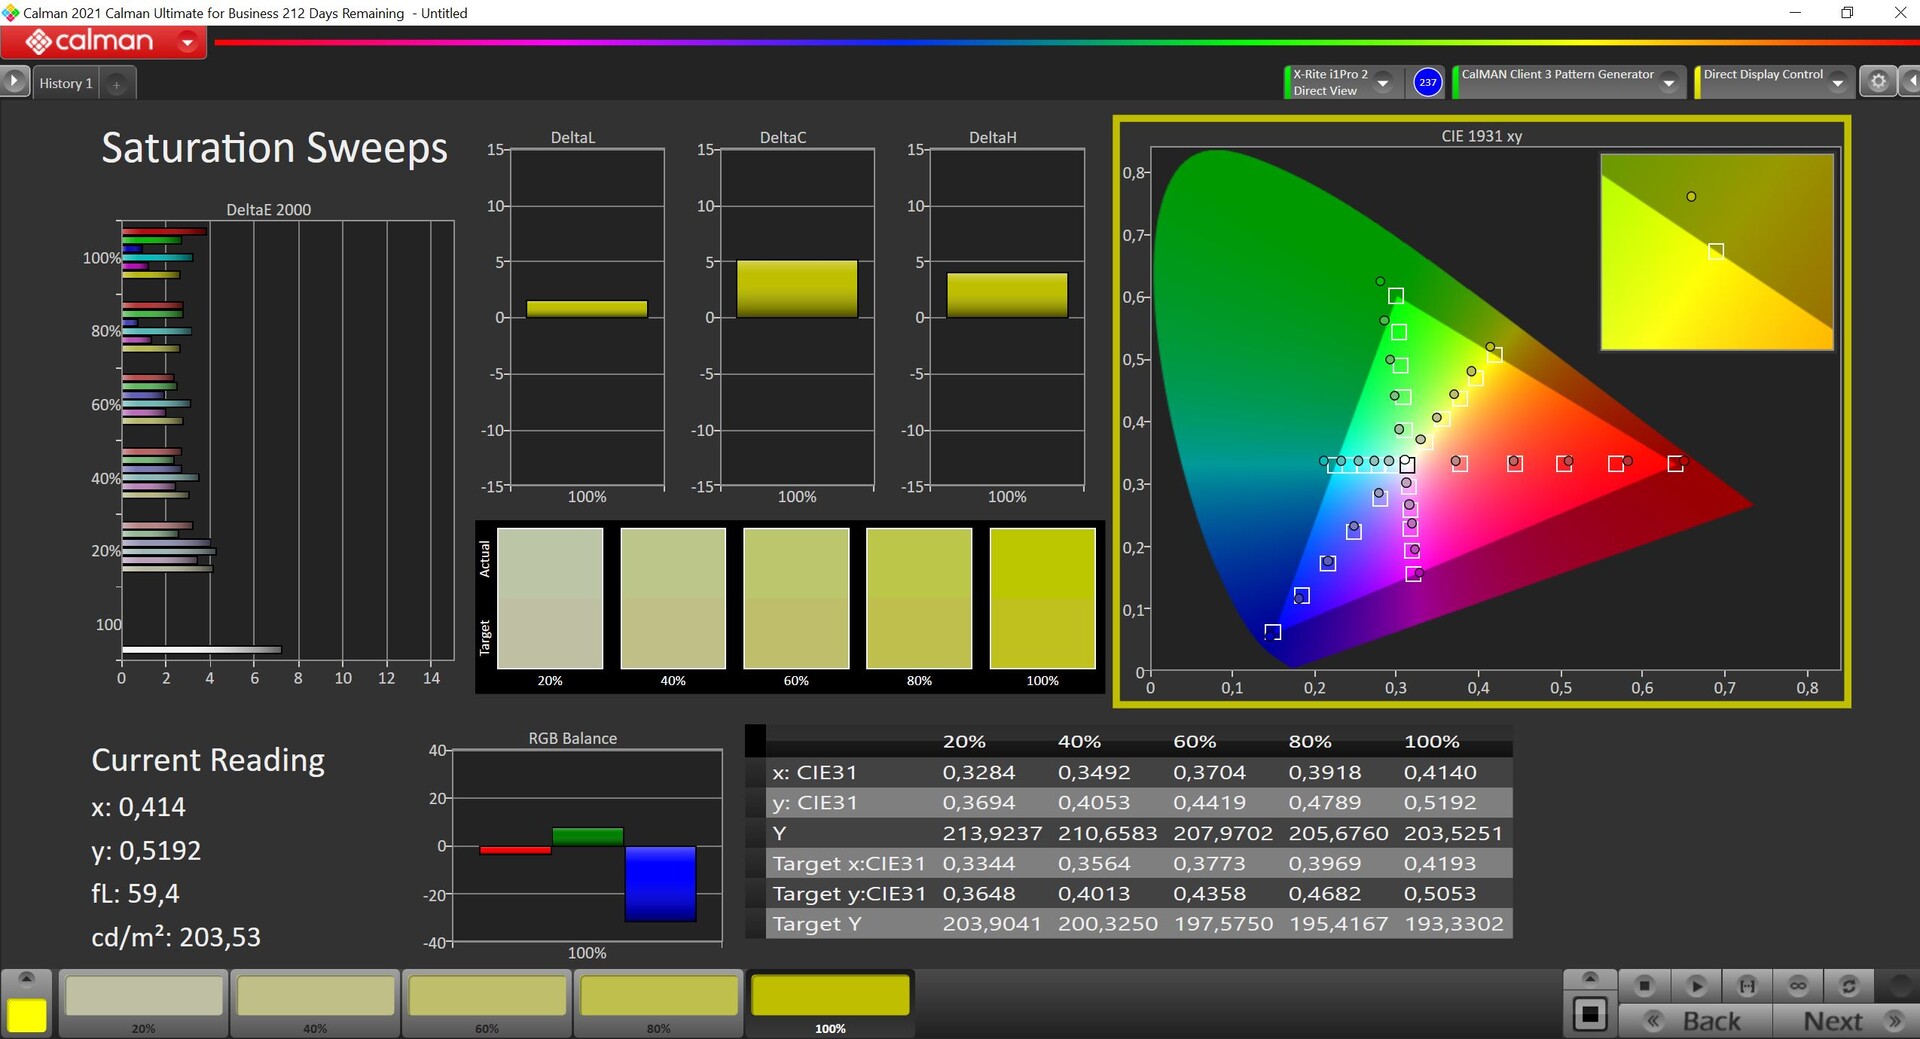
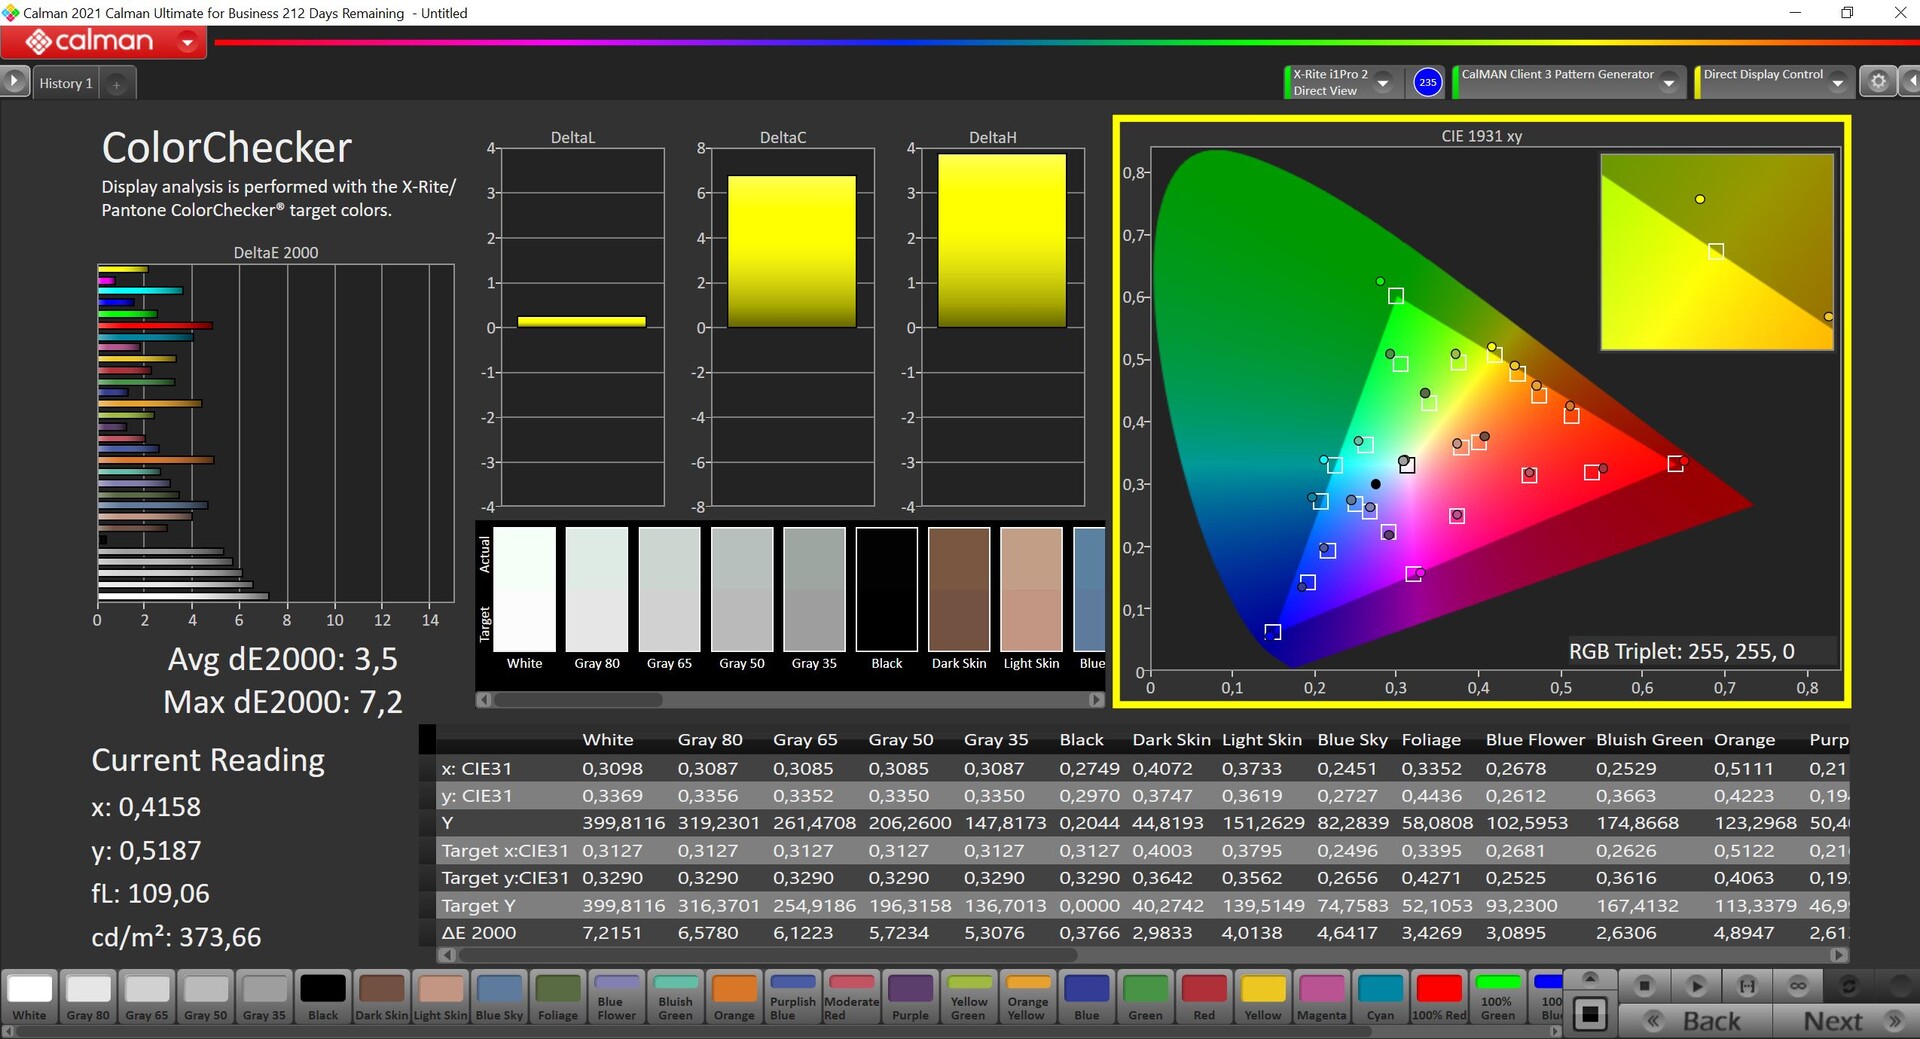
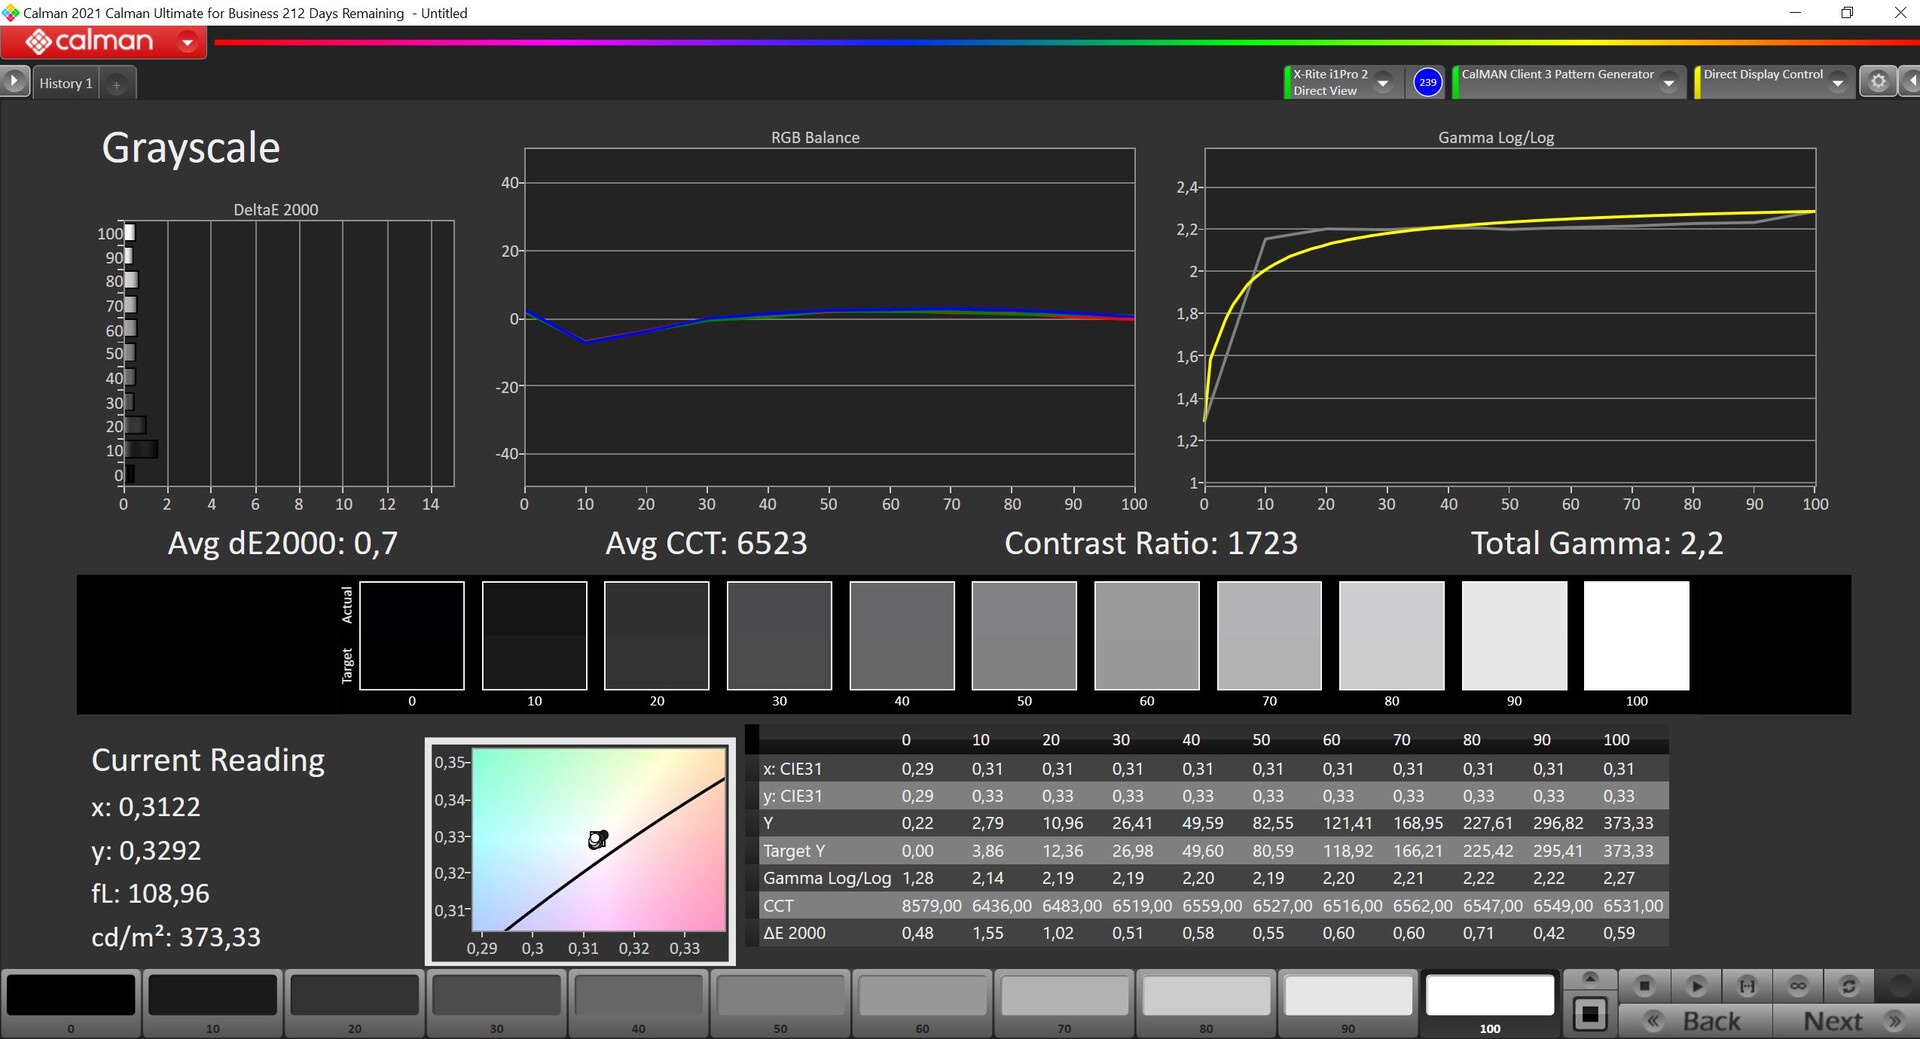
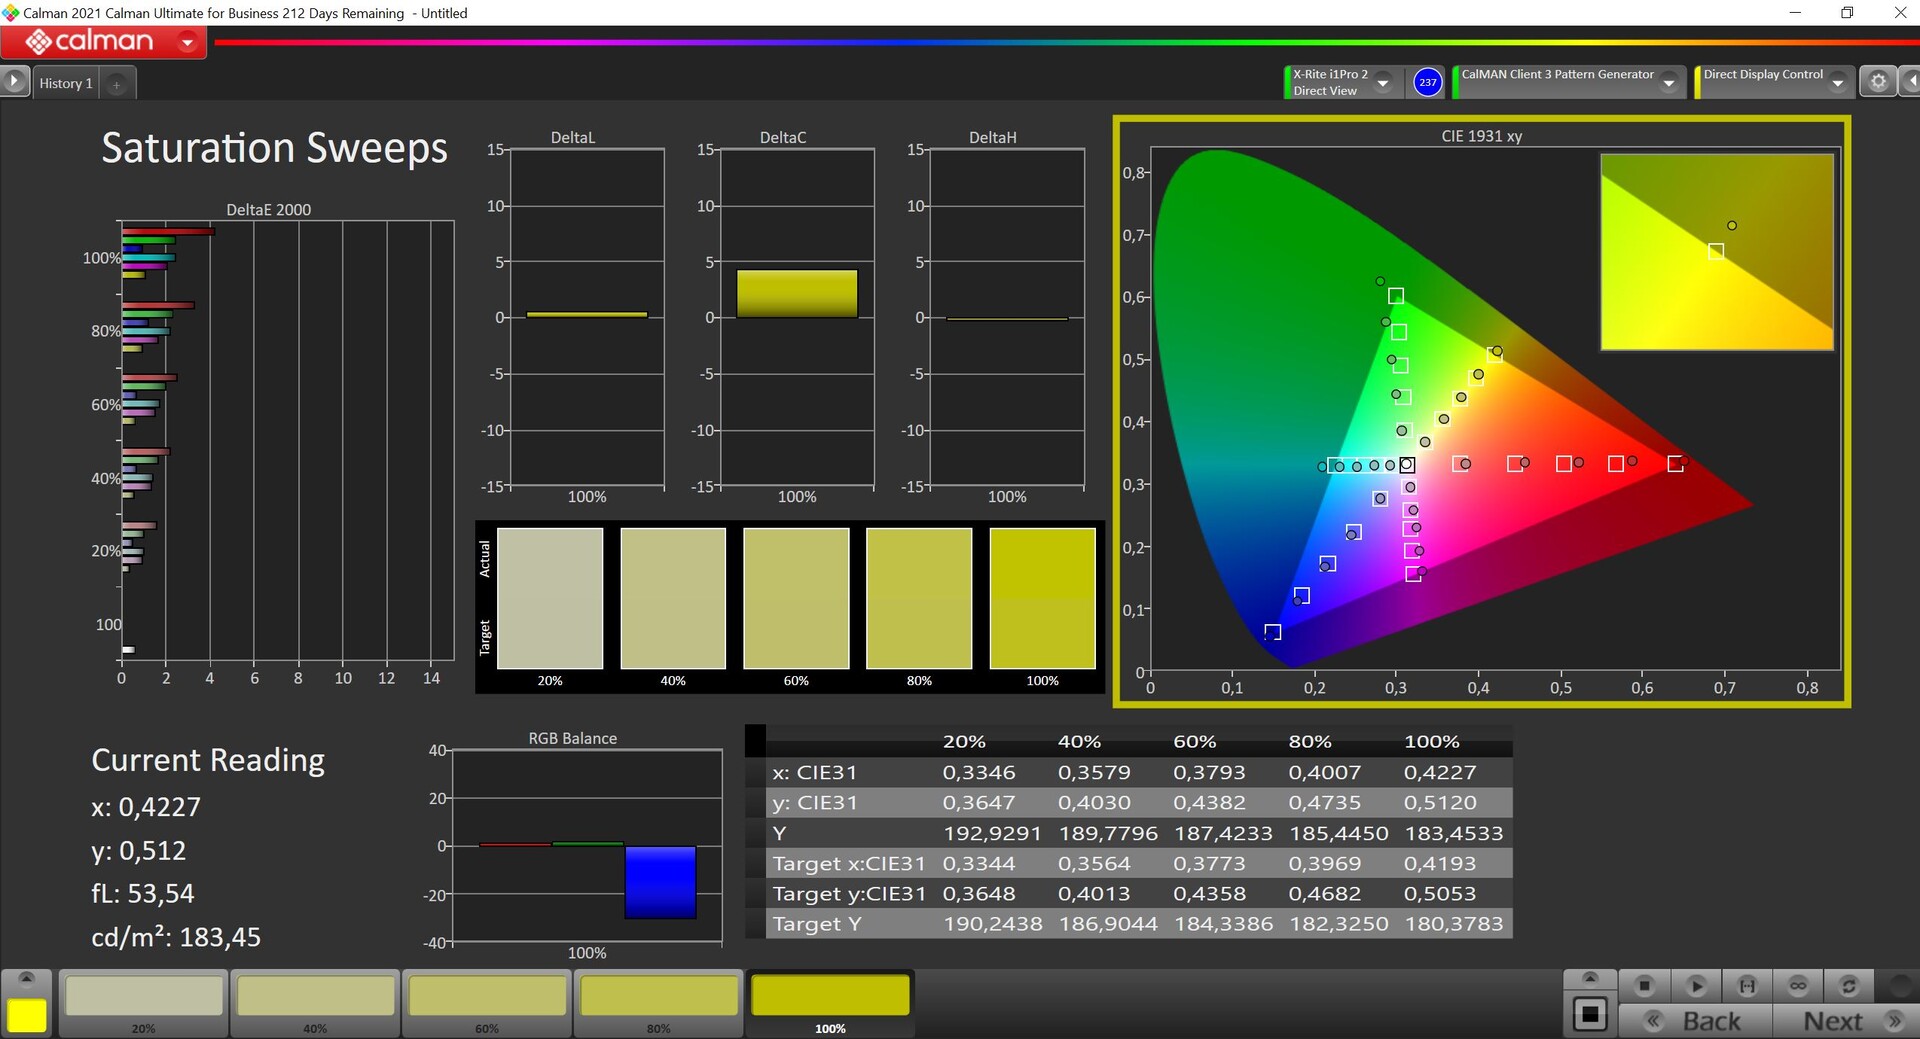
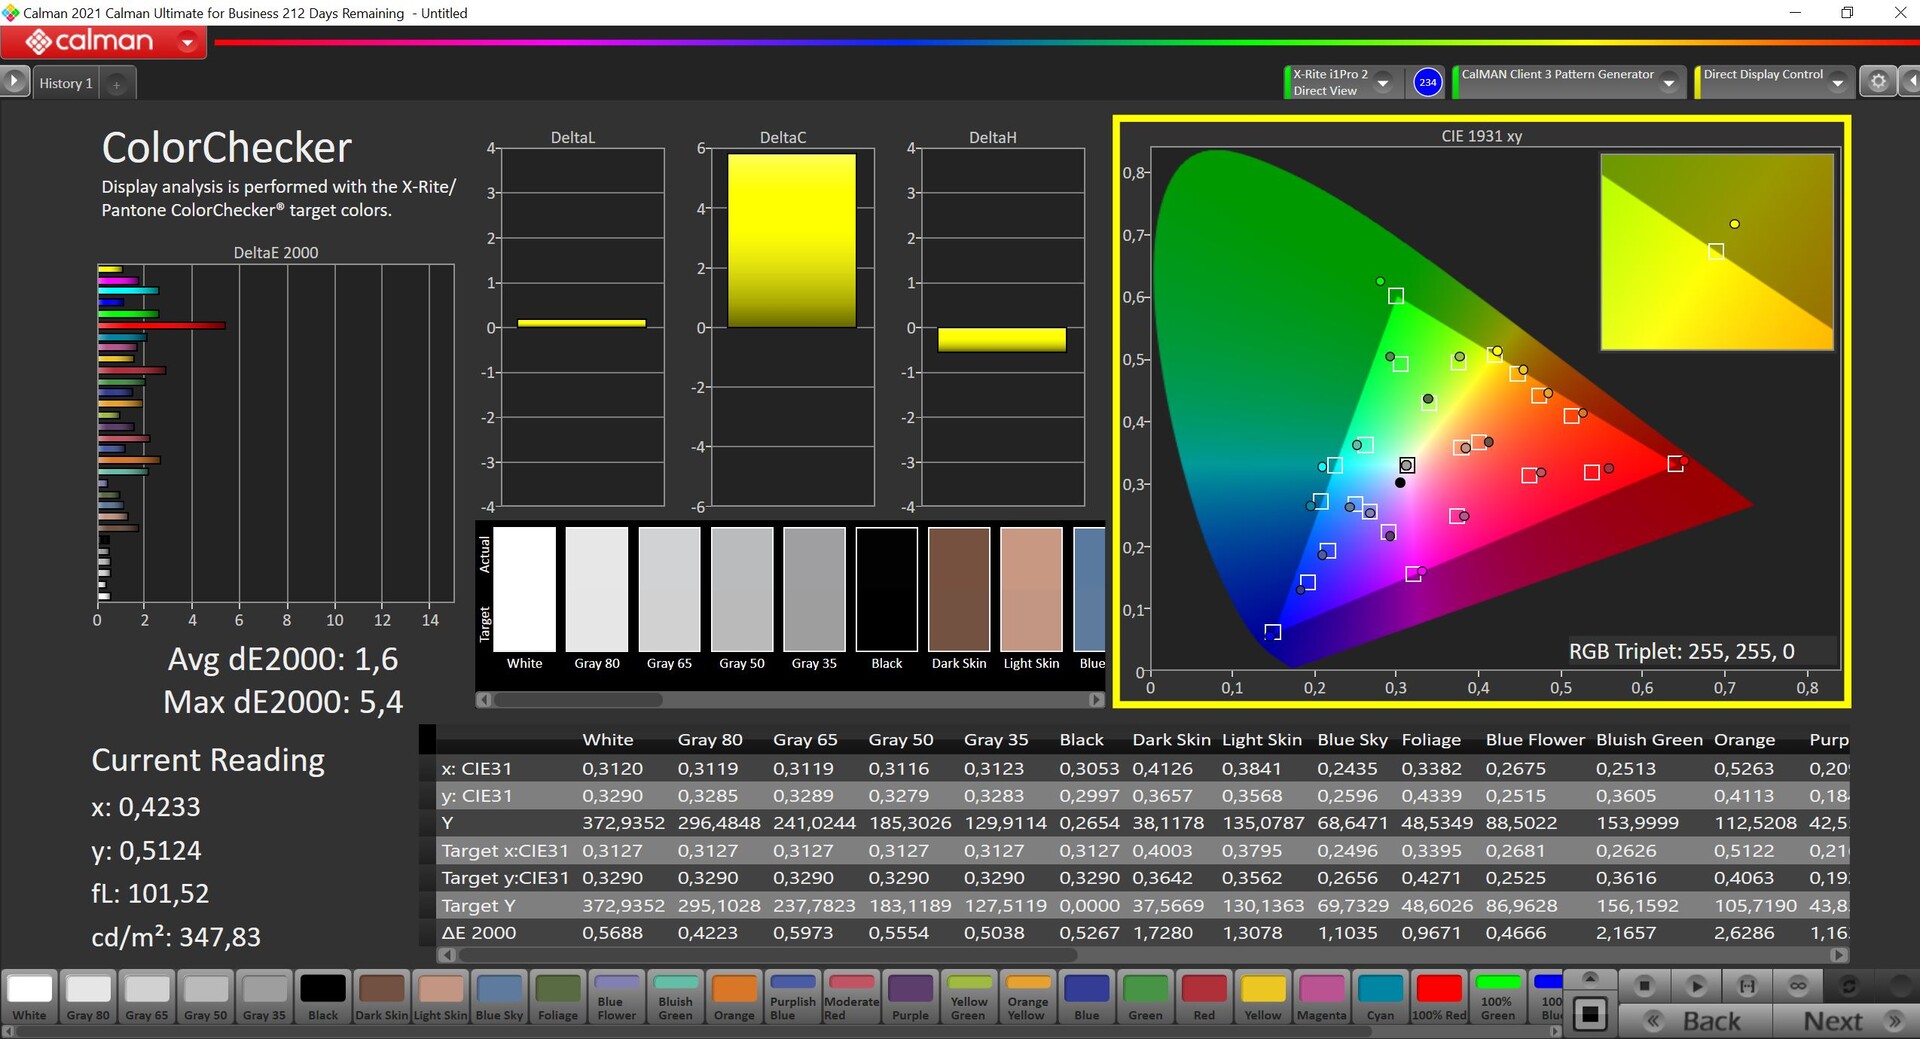
我们用专业的CalMAN软件(X-Rite i1 Pro 2)测量了该面板。尽管在交付状态下有轻微的绿色/蓝色色调,但这在日常操作中并不十分明显,对于一台商务笔记本电脑来说,结果已经很不错了。通过我们自己的校准(可从上面的链接免费下载颜色配置文件),我们能够进一步改善颜色的再现。结合完整的sRGB色彩空间覆盖,该面板相当适用于偶尔的图像或视频处理任务。
Display Response Times
| ↔ Response Time Black to White | ||
|---|---|---|
| 34.9 ms ... rise ↗ and fall ↘ combined | ↗ 16.5 ms rise | 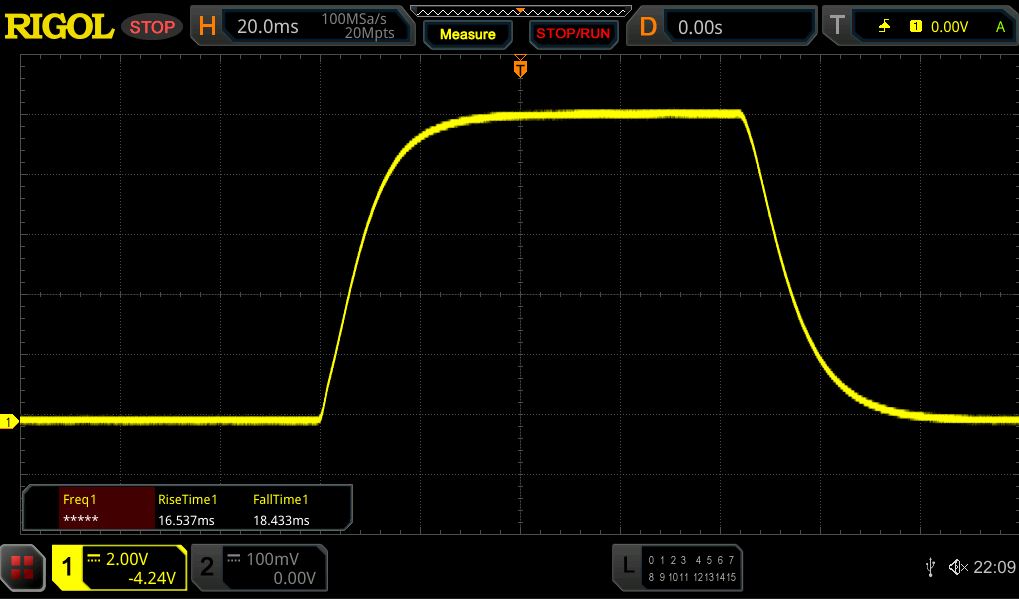 |
| ↘ 18.4 ms fall | ||
| The screen shows slow response rates in our tests and will be unsatisfactory for gamers. In comparison, all tested devices range from 0.1 (minimum) to 240 (maximum) ms. » 92 % of all devices are better. This means that the measured response time is worse than the average of all tested devices (19.8 ms). | ||
| ↔ Response Time 50% Grey to 80% Grey | ||
| 62.6 ms ... rise ↗ and fall ↘ combined | ↗ 28.2 ms rise | 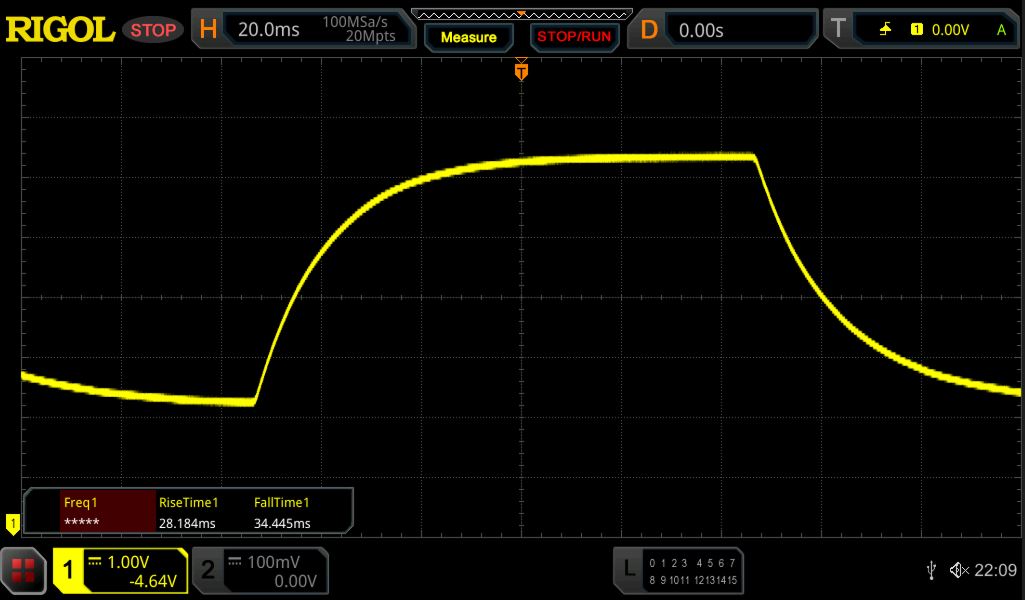 |
| ↘ 34.4 ms fall | ||
| The screen shows slow response rates in our tests and will be unsatisfactory for gamers. In comparison, all tested devices range from 0.165 (minimum) to 636 (maximum) ms. » 97 % of all devices are better. This means that the measured response time is worse than the average of all tested devices (31 ms). | ||
Screen Flickering / PWM (Pulse-Width Modulation)
| Screen flickering / PWM not detected |  | ||
In comparison: 52 % of all tested devices do not use PWM to dim the display. If PWM was detected, an average of 7754 (minimum: 5 - maximum: 343500) Hz was measured. | |||
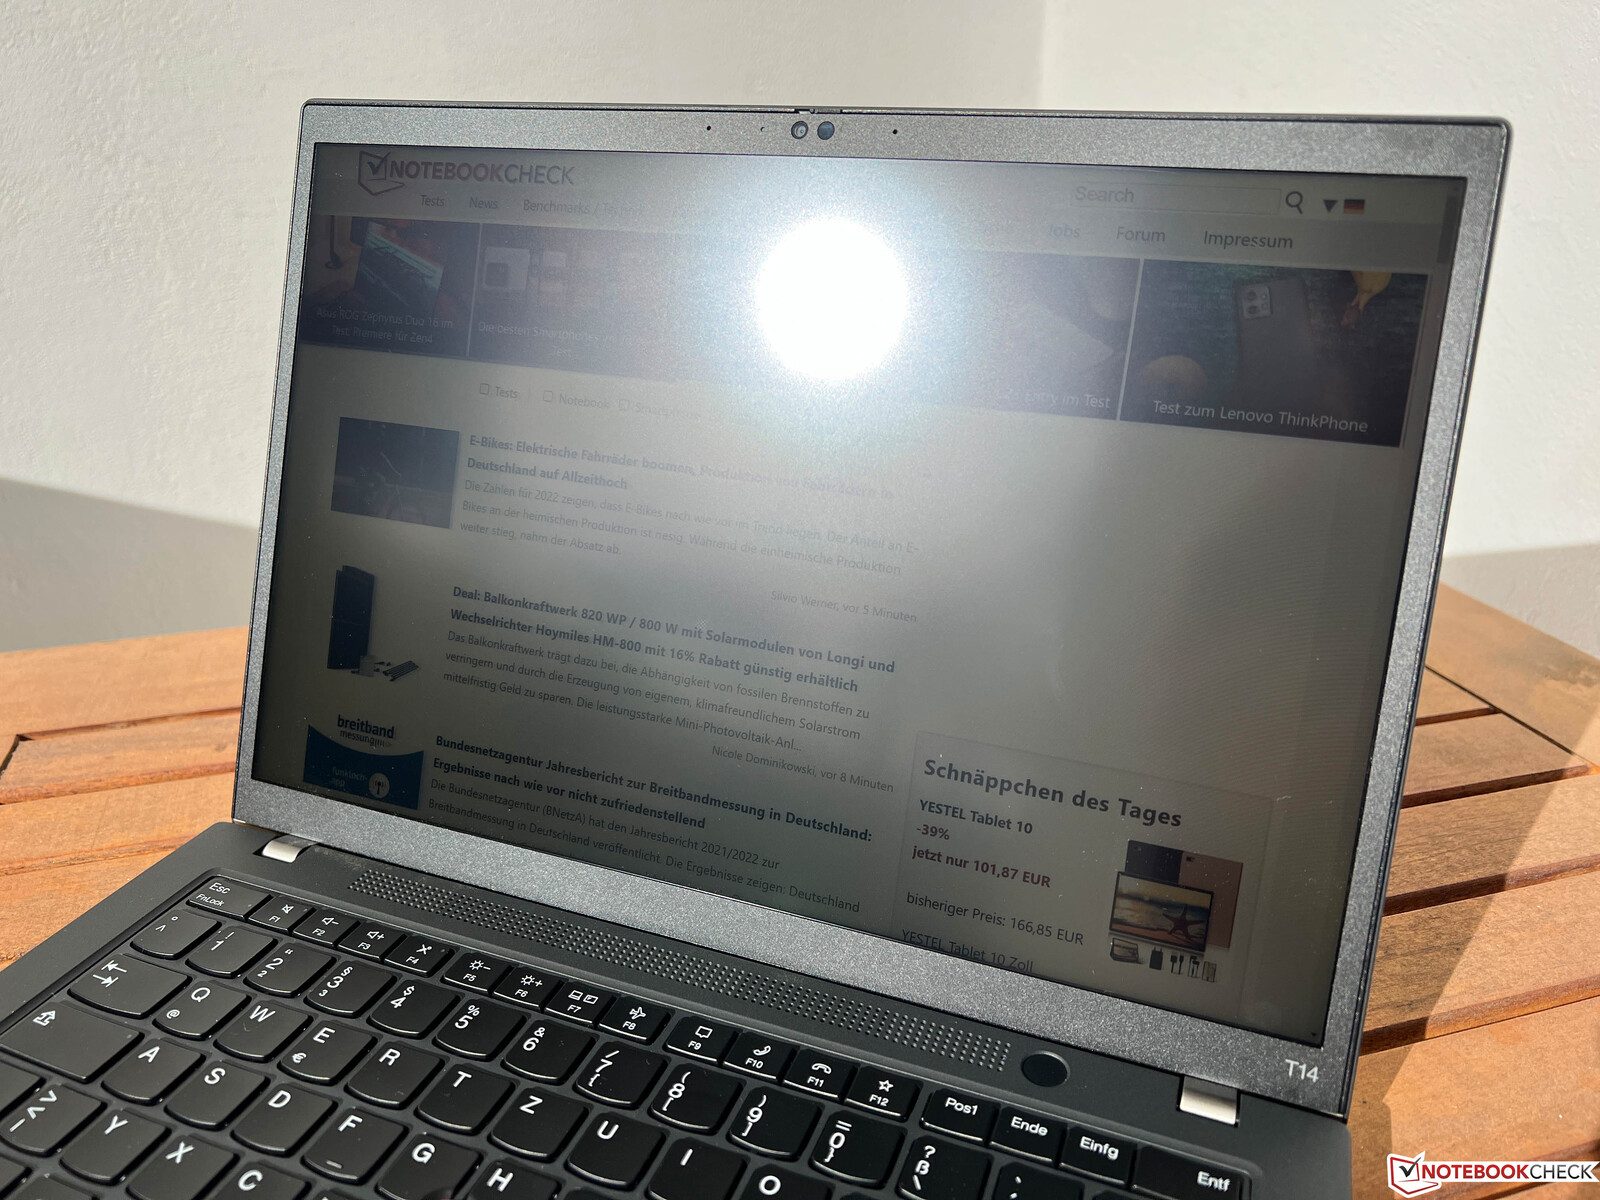
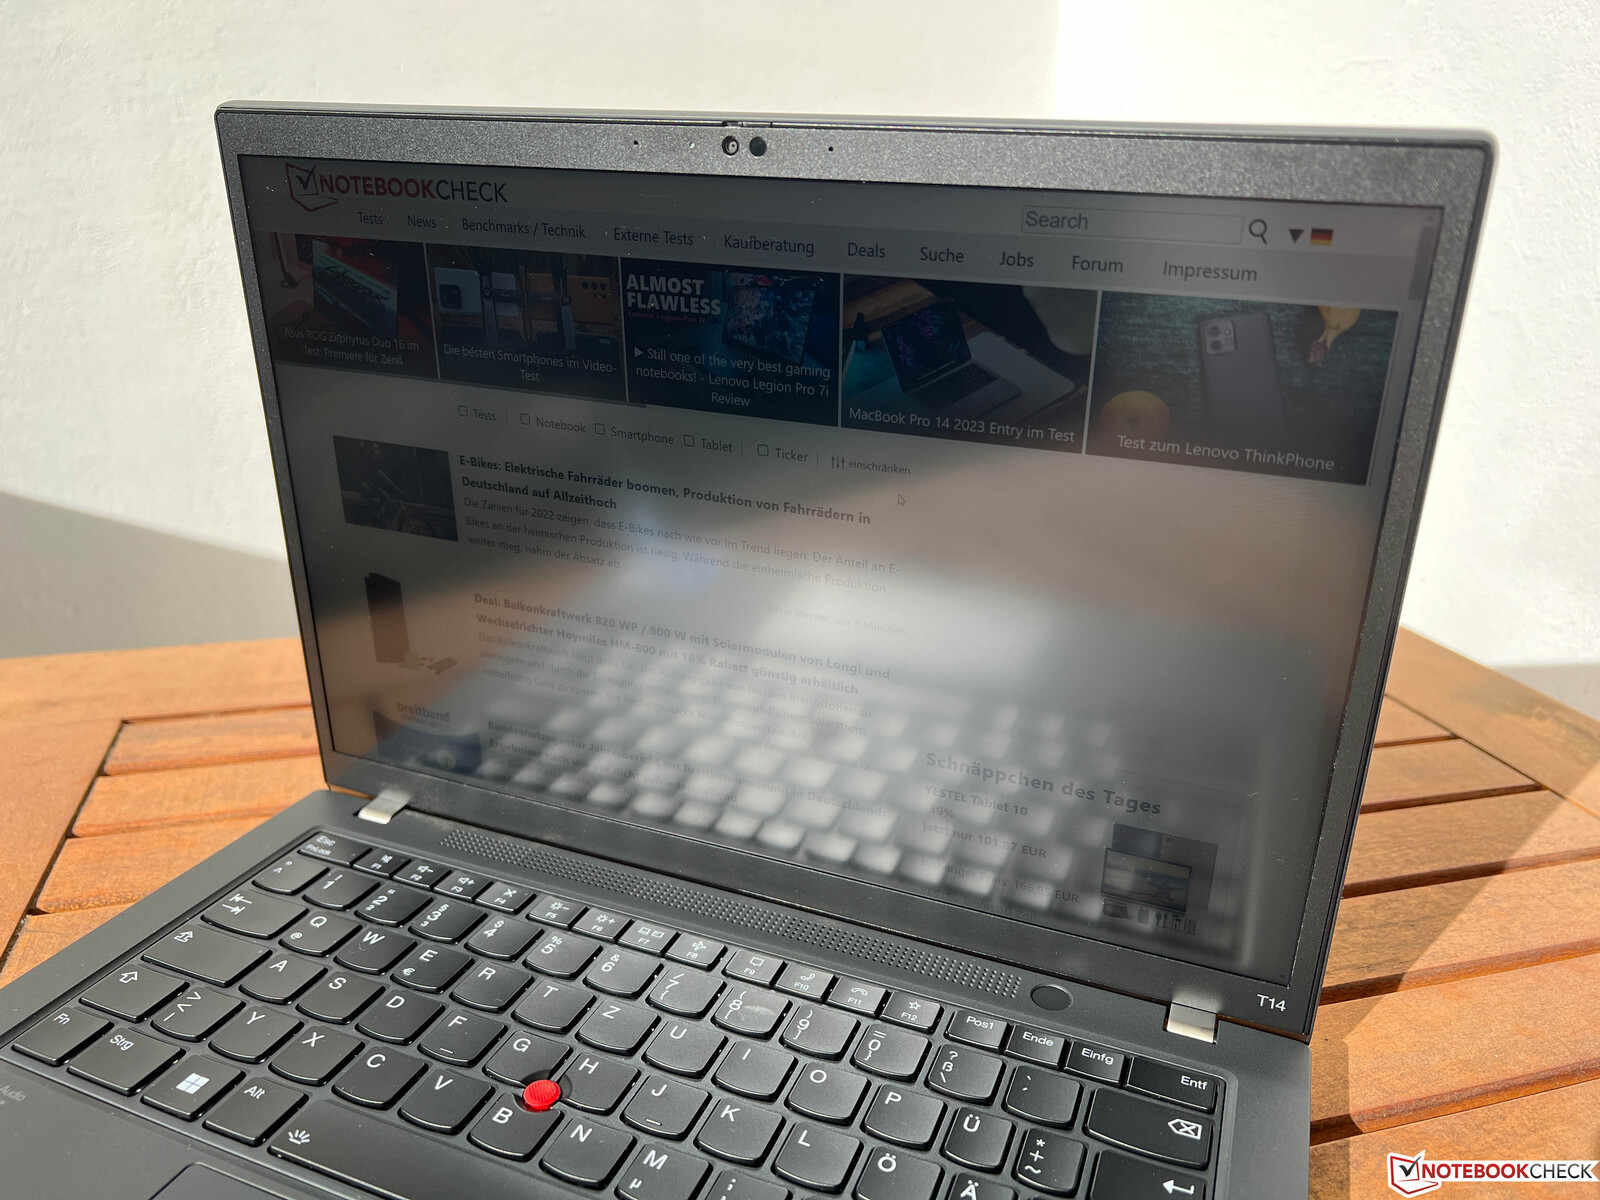
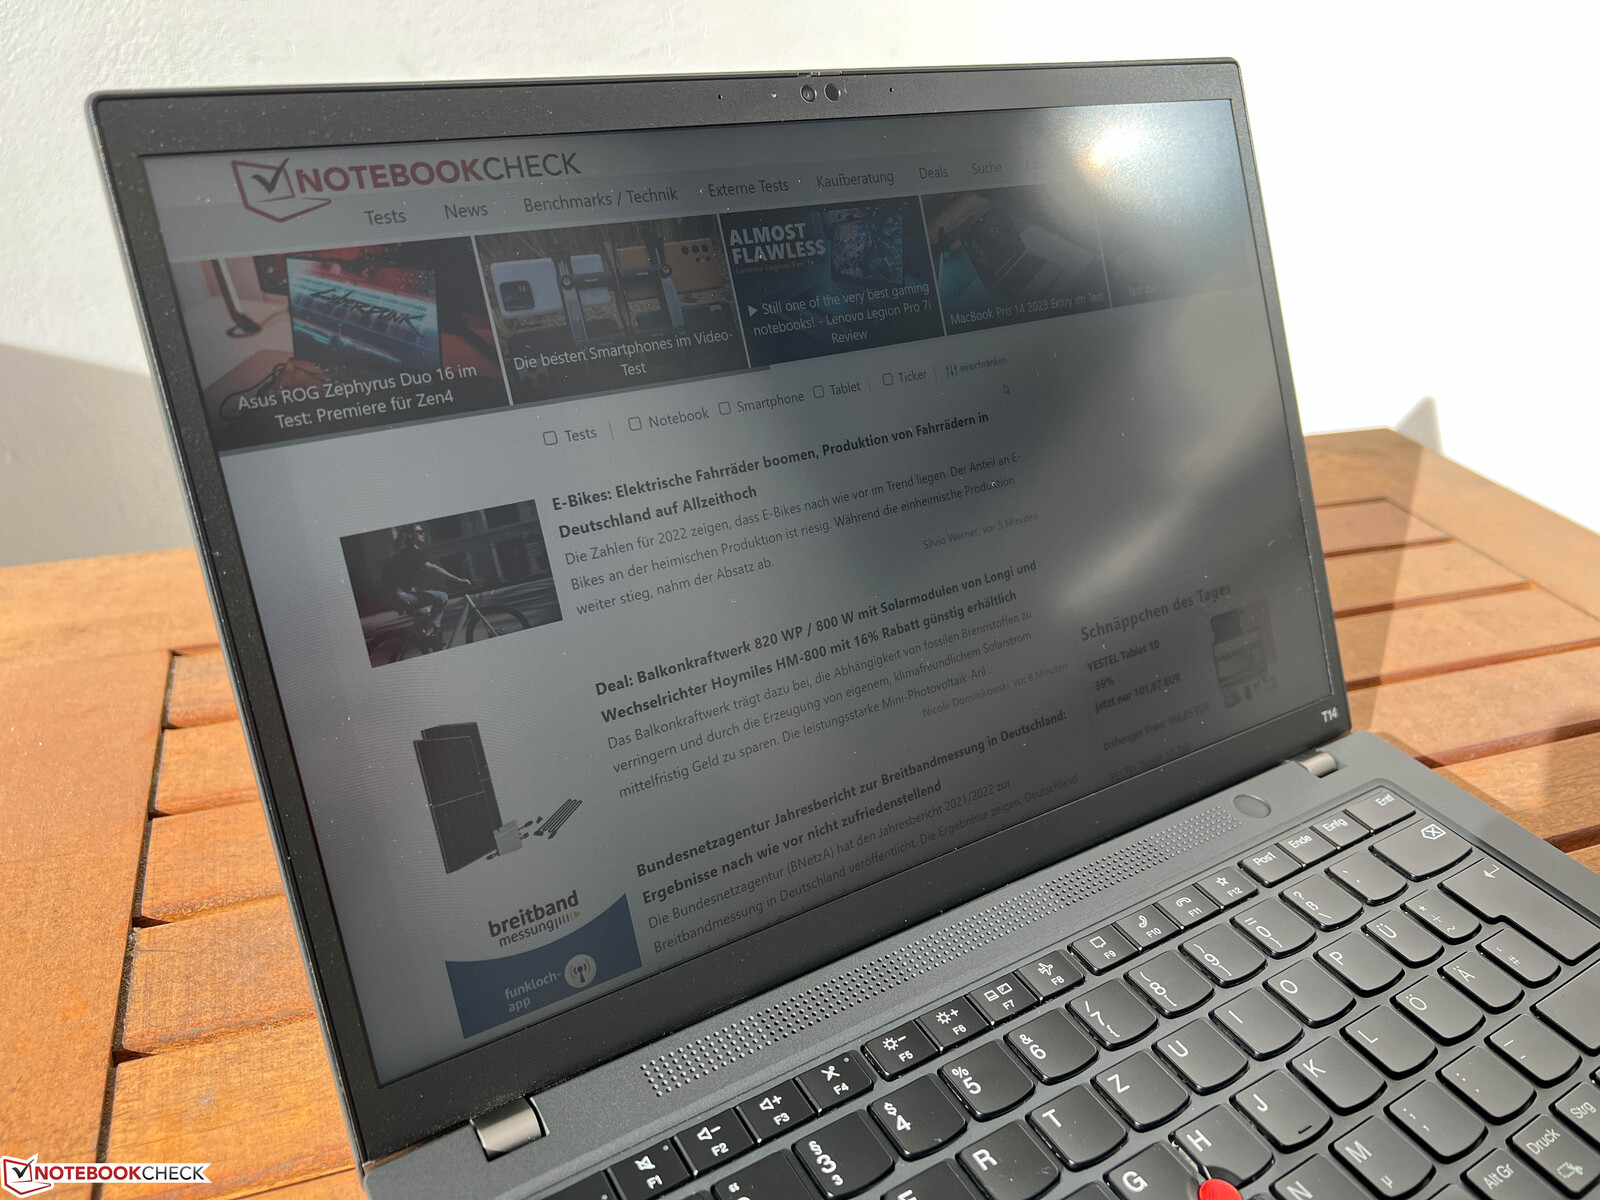
该面板在户外表现尚可,但你仍应避免直接光源的反射。IPS面板的可视角度稳定性非常好。
性能 - Alder Lake和GeForce MX550
测试条件
联想Vantage应用程序提供了一个 "智能冷却 "模式,但在我们的测试中,这个模式在短时间内对性能产生了负面影响。因此,在我们的基准测试和测量中,我们停用了这种模式(通过应用程序或使用Fn+T组合键)。
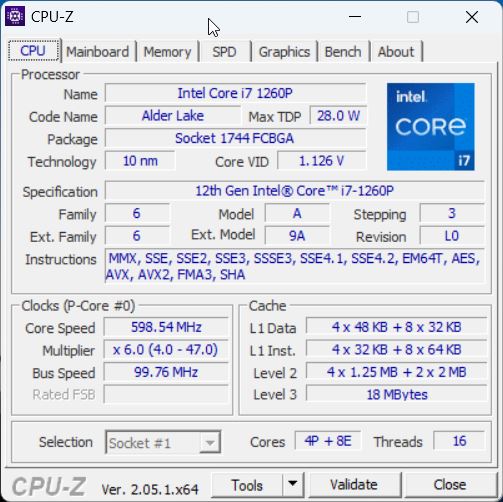
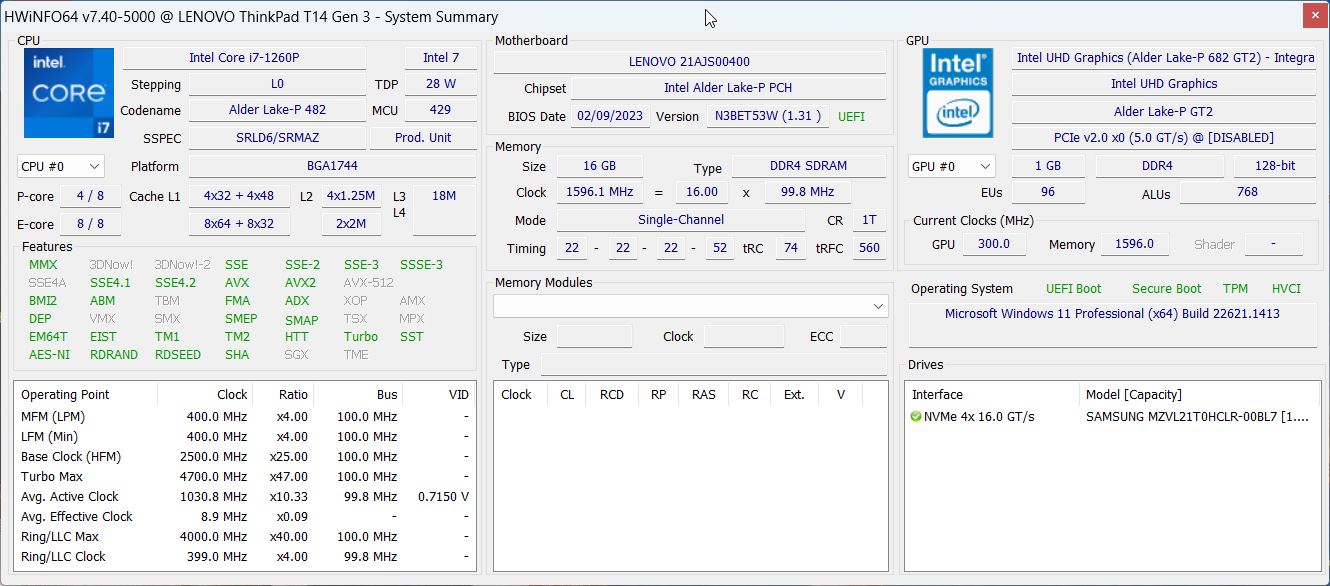
处理器 - 酷睿i7-1260P
我们已经知道酷睿i7-1260P的Alder Lake一代,凭借其4个快速性能核心和8个效率核心,性能非常好,但英特尔处理器也因此消耗了大量的电力。在ThinkPad T14 G3中,该处理器允许消耗的最大功率达58瓦,恒定功率为42瓦。单核性能优于AMD机型,而多核性能则不相上下。
Cinebench R15 Multi Constant Load Test
在Cinebench循环中,整体性能保持相对稳定。这里还有一个有趣的现象是与新的 猛禽湖酷睿i7-1360P的比较。的比较,它在第一次运行中具有优势,但随后下降到旧的Alder Lake处理器的水平。只有单核性能仍然略胜一筹,但总体而言,你也可以毫无顾虑地选择酷睿i7-1260P。
在电池运行时,允许处理器最大消耗32瓦,导致多核测试中的性能下降约30%。你可以在我们的技术部分找到更多的基准测试 我们的技术部分.
Cinebench R23: Multi Core | Single Core
Cinebench R20: CPU (Multi Core) | CPU (Single Core)
Cinebench R15: CPU Multi 64Bit | CPU Single 64Bit
Blender: v2.79 BMW27 CPU
7-Zip 18.03: 7z b 4 | 7z b 4 -mmt1
Geekbench 5.5: Multi-Core | Single-Core
HWBOT x265 Benchmark v2.2: 4k Preset
LibreOffice : 20 Documents To PDF
R Benchmark 2.5: Overall mean
| CPU Performance rating | |
| Schenker Vision 14 2022 RTX 3050 Ti | |
| Lenovo Yoga 9 14IRP G8 | |
| HP EliteBook 840 G9 | |
| Lenovo ThinkPad T14 G3-21AJS00400 | |
| Average of class Office | |
| Huawei MateBook X Pro 2022 | |
| Lenovo ThinkPad T14 G3-21CF004NGE | |
| Average Intel Core i7-1260P | |
| Cinebench R23 / Multi Core | |
| Schenker Vision 14 2022 RTX 3050 Ti | |
| Lenovo ThinkPad T14 G3-21AJS00400 | |
| Lenovo Yoga 9 14IRP G8 | |
| Average of class Office (1673 - 22808, n=76, last 2 years) | |
| Lenovo ThinkPad T14 G3-21CF004NGE | |
| HP EliteBook 840 G9 | |
| Average Intel Core i7-1260P (3173 - 12150, n=27) | |
| Huawei MateBook X Pro 2022 | |
| Cinebench R23 / Single Core | |
| Lenovo Yoga 9 14IRP G8 | |
| Lenovo ThinkPad T14 G3-21AJS00400 | |
| HP EliteBook 840 G9 | |
| Average of class Office (708 - 2130, n=76, last 2 years) | |
| Schenker Vision 14 2022 RTX 3050 Ti | |
| Average Intel Core i7-1260P (1155 - 1812, n=25) | |
| Huawei MateBook X Pro 2022 | |
| Lenovo ThinkPad T14 G3-21CF004NGE | |
| Cinebench R20 / CPU (Multi Core) | |
| Schenker Vision 14 2022 RTX 3050 Ti | |
| Lenovo ThinkPad T14 G3-21AJS00400 | |
| Average of class Office (648 - 8840, n=75, last 2 years) | |
| Lenovo Yoga 9 14IRP G8 | |
| HP EliteBook 840 G9 | |
| Lenovo ThinkPad T14 G3-21CF004NGE | |
| Huawei MateBook X Pro 2022 | |
| Average Intel Core i7-1260P (1234 - 4748, n=25) | |
| Cinebench R20 / CPU (Single Core) | |
| Lenovo Yoga 9 14IRP G8 | |
| Schenker Vision 14 2022 RTX 3050 Ti | |
| Lenovo ThinkPad T14 G3-21AJS00400 | |
| Huawei MateBook X Pro 2022 | |
| Average of class Office (345 - 816, n=75, last 2 years) | |
| Average Intel Core i7-1260P (448 - 698, n=25) | |
| HP EliteBook 840 G9 | |
| Lenovo ThinkPad T14 G3-21CF004NGE | |
| Cinebench R15 / CPU Multi 64Bit | |
| Schenker Vision 14 2022 RTX 3050 Ti | |
| Lenovo Yoga 9 14IRP G8 | |
| HP EliteBook 840 G9 | |
| Huawei MateBook X Pro 2022 | |
| Huawei MateBook X Pro 2022 | |
| Lenovo ThinkPad T14 G3-21AJS00400 | |
| Average of class Office (250 - 3380, n=77, last 2 years) | |
| Lenovo ThinkPad T14 G3-21CF004NGE | |
| Average Intel Core i7-1260P (549 - 2034, n=29) | |
| Cinebench R15 / CPU Single 64Bit | |
| Lenovo Yoga 9 14IRP G8 | |
| Schenker Vision 14 2022 RTX 3050 Ti | |
| HP EliteBook 840 G9 | |
| Average of class Office (99.5 - 316, n=77, last 2 years) | |
| Huawei MateBook X Pro 2022 | |
| Lenovo ThinkPad T14 G3-21AJS00400 | |
| Lenovo ThinkPad T14 G3-21CF004NGE | |
| Average Intel Core i7-1260P (165.4 - 260, n=27) | |
| Blender / v2.79 BMW27 CPU | |
| Average Intel Core i7-1260P (264 - 906, n=26) | |
| Average of class Office (158 - 1940, n=76, last 2 years) | |
| Huawei MateBook X Pro 2022 | |
| Lenovo ThinkPad T14 G3-21AJS00400 | |
| Lenovo ThinkPad T14 G3-21CF004NGE | |
| Lenovo Yoga 9 14IRP G8 | |
| HP EliteBook 840 G9 | |
| Schenker Vision 14 2022 RTX 3050 Ti | |
| 7-Zip 18.03 / 7z b 4 | |
| Schenker Vision 14 2022 RTX 3050 Ti | |
| Lenovo ThinkPad T14 G3-21CF004NGE | |
| HP EliteBook 840 G9 | |
| Lenovo Yoga 9 14IRP G8 | |
| Average of class Office (7098 - 76886, n=77, last 2 years) | |
| Huawei MateBook X Pro 2022 | |
| Lenovo ThinkPad T14 G3-21AJS00400 | |
| Average Intel Core i7-1260P (16146 - 47064, n=25) | |
| 7-Zip 18.03 / 7z b 4 -mmt1 | |
| HP EliteBook 840 G9 | |
| Lenovo Yoga 9 14IRP G8 | |
| Schenker Vision 14 2022 RTX 3050 Ti | |
| Lenovo ThinkPad T14 G3-21AJS00400 | |
| Average of class Office (3387 - 6469, n=77, last 2 years) | |
| Huawei MateBook X Pro 2022 | |
| Lenovo ThinkPad T14 G3-21CF004NGE | |
| Average Intel Core i7-1260P (4064 - 5791, n=25) | |
| Geekbench 5.5 / Multi-Core | |
| HP EliteBook 840 G9 | |
| Schenker Vision 14 2022 RTX 3050 Ti | |
| Lenovo Yoga 9 14IRP G8 | |
| Huawei MateBook X Pro 2022 | |
| Average of class Office (1483 - 16999, n=73, last 2 years) | |
| Average Intel Core i7-1260P (3866 - 10570, n=25) | |
| Lenovo ThinkPad T14 G3-21CF004NGE | |
| Lenovo ThinkPad T14 G3-21AJS00400 | |
| Geekbench 5.5 / Single-Core | |
| Average of class Office (811 - 2175, n=73, last 2 years) | |
| Lenovo Yoga 9 14IRP G8 | |
| Schenker Vision 14 2022 RTX 3050 Ti | |
| HP EliteBook 840 G9 | |
| Huawei MateBook X Pro 2022 | |
| Average Intel Core i7-1260P (1436 - 1786, n=25) | |
| Lenovo ThinkPad T14 G3-21AJS00400 | |
| Lenovo ThinkPad T14 G3-21CF004NGE | |
| HWBOT x265 Benchmark v2.2 / 4k Preset | |
| Schenker Vision 14 2022 RTX 3050 Ti | |
| Lenovo ThinkPad T14 G3-21AJS00400 | |
| Average of class Office (2.21 - 26, n=76, last 2 years) | |
| Lenovo ThinkPad T14 G3-21CF004NGE | |
| Lenovo Yoga 9 14IRP G8 | |
| HP EliteBook 840 G9 | |
| Huawei MateBook X Pro 2022 | |
| Average Intel Core i7-1260P (3.45 - 13.6, n=26) | |
| LibreOffice / 20 Documents To PDF | |
| Average of class Office (39.9 - 102.3, n=76, last 2 years) | |
| Lenovo ThinkPad T14 G3-21CF004NGE | |
| Average Intel Core i7-1260P (40.2 - 65.7, n=25) | |
| Lenovo Yoga 9 14IRP G8 | |
| HP EliteBook 840 G9 | |
| Schenker Vision 14 2022 RTX 3050 Ti | |
| Lenovo ThinkPad T14 G3-21AJS00400 | |
| Huawei MateBook X Pro 2022 | |
| R Benchmark 2.5 / Overall mean | |
| Lenovo ThinkPad T14 G3-21CF004NGE | |
| Average of class Office (0.393 - 0.888, n=76, last 2 years) | |
| Average Intel Core i7-1260P (0.4559 - 0.727, n=25) | |
| Huawei MateBook X Pro 2022 | |
| Lenovo ThinkPad T14 G3-21AJS00400 | |
| HP EliteBook 840 G9 | |
| Lenovo Yoga 9 14IRP G8 | |
| Schenker Vision 14 2022 RTX 3050 Ti | |
* ... smaller is better
AIDA64: FP32 Ray-Trace | FPU Julia | CPU SHA3 | CPU Queen | FPU SinJulia | FPU Mandel | CPU AES | CPU ZLib | FP64 Ray-Trace | CPU PhotoWorxx
| Performance rating | |
| Schenker Vision 14 2022 RTX 3050 Ti | |
| Lenovo ThinkPad T14 G3-21CF004NGE | |
| Average of class Office | |
| HP EliteBook 840 G9 | |
| Lenovo ThinkPad T14 G3-21AJS00400 | |
| Huawei MateBook X Pro 2022 | |
| Average Intel Core i7-1260P | |
| AIDA64 / FP32 Ray-Trace | |
| Average of class Office (2083 - 31245, n=83, last 2 years) | |
| Schenker Vision 14 2022 RTX 3050 Ti | |
| Lenovo ThinkPad T14 G3-21CF004NGE | |
| Lenovo ThinkPad T14 G3-21AJS00400 | |
| HP EliteBook 840 G9 | |
| Average Intel Core i7-1260P (2176 - 10898, n=26) | |
| Huawei MateBook X Pro 2022 | |
| AIDA64 / FPU Julia | |
| Lenovo ThinkPad T14 G3-21CF004NGE | |
| Average of class Office (8191 - 125394, n=83, last 2 years) | |
| Schenker Vision 14 2022 RTX 3050 Ti | |
| Lenovo ThinkPad T14 G3-21AJS00400 | |
| HP EliteBook 840 G9 | |
| Average Intel Core i7-1260P (11015 - 56906, n=26) | |
| Huawei MateBook X Pro 2022 | |
| AIDA64 / CPU SHA3 | |
| Average of class Office (433 - 5755, n=83, last 2 years) | |
| Schenker Vision 14 2022 RTX 3050 Ti | |
| Lenovo ThinkPad T14 G3-21AJS00400 | |
| Lenovo ThinkPad T14 G3-21CF004NGE | |
| HP EliteBook 840 G9 | |
| Average Intel Core i7-1260P (669 - 2709, n=26) | |
| Huawei MateBook X Pro 2022 | |
| AIDA64 / CPU Queen | |
| HP EliteBook 840 G9 | |
| Schenker Vision 14 2022 RTX 3050 Ti | |
| Lenovo ThinkPad T14 G3-21CF004NGE | |
| Lenovo ThinkPad T14 G3-21AJS00400 | |
| Huawei MateBook X Pro 2022 | |
| Average Intel Core i7-1260P (42571 - 82493, n=26) | |
| Average of class Office (22784 - 115197, n=67, last 2 years) | |
| AIDA64 / FPU SinJulia | |
| Lenovo ThinkPad T14 G3-21CF004NGE | |
| Schenker Vision 14 2022 RTX 3050 Ti | |
| Average of class Office (1378 - 18321, n=83, last 2 years) | |
| HP EliteBook 840 G9 | |
| Lenovo ThinkPad T14 G3-21AJS00400 | |
| Huawei MateBook X Pro 2022 | |
| Average Intel Core i7-1260P (2901 - 6975, n=26) | |
| AIDA64 / FPU Mandel | |
| Lenovo ThinkPad T14 G3-21CF004NGE | |
| Average of class Office (4601 - 66922, n=83, last 2 years) | |
| Schenker Vision 14 2022 RTX 3050 Ti | |
| Lenovo ThinkPad T14 G3-21AJS00400 | |
| HP EliteBook 840 G9 | |
| Average Intel Core i7-1260P (5950 - 26376, n=26) | |
| Huawei MateBook X Pro 2022 | |
| AIDA64 / CPU AES | |
| Schenker Vision 14 2022 RTX 3050 Ti | |
| Huawei MateBook X Pro 2022 | |
| Lenovo ThinkPad T14 G3-21AJS00400 | |
| Average of class Office (4854 - 155900, n=83, last 2 years) | |
| HP EliteBook 840 G9 | |
| Lenovo ThinkPad T14 G3-21CF004NGE | |
| Average Intel Core i7-1260P (16041 - 92356, n=26) | |
| AIDA64 / CPU ZLib | |
| Schenker Vision 14 2022 RTX 3050 Ti | |
| Lenovo ThinkPad T14 G3-21AJS00400 | |
| Average of class Office (114.6 - 1366, n=83, last 2 years) | |
| HP EliteBook 840 G9 | |
| Lenovo ThinkPad T14 G3-21CF004NGE | |
| Huawei MateBook X Pro 2022 | |
| Average Intel Core i7-1260P (259 - 771, n=26) | |
| AIDA64 / FP64 Ray-Trace | |
| Average of class Office (1109 - 17834, n=83, last 2 years) | |
| Schenker Vision 14 2022 RTX 3050 Ti | |
| Lenovo ThinkPad T14 G3-21CF004NGE | |
| Lenovo ThinkPad T14 G3-21AJS00400 | |
| HP EliteBook 840 G9 | |
| Average Intel Core i7-1260P (1237 - 5858, n=26) | |
| Huawei MateBook X Pro 2022 | |
| AIDA64 / CPU PhotoWorxx | |
| Average of class Office (11090 - 65229, n=83, last 2 years) | |
| Huawei MateBook X Pro 2022 | |
| HP EliteBook 840 G9 | |
| Average Intel Core i7-1260P (13261 - 43652, n=26) | |
| Schenker Vision 14 2022 RTX 3050 Ti | |
| Lenovo ThinkPad T14 G3-21CF004NGE | |
| Lenovo ThinkPad T14 G3-21AJS00400 | |
系统性能
实际上,英特尔版本的ThinkPad T14 G3也是一台反应非常灵敏的笔记本电脑,我们无法注意到任何问题。然而,我们的测试装置在合成基准测试中只显示了平均性能。这主要是由于存储性能不好,因为工作内存只在单通道配置下运行。
CrossMark: Overall | Productivity | Creativity | Responsiveness
| PCMark 10 / Score | |
| Average of class Office (2601 - 9298, n=68, last 2 years) | |
| Schenker Vision 14 2022 RTX 3050 Ti | |
| Huawei MateBook X Pro 2022 | |
| Lenovo ThinkPad T14 G3-21CF004NGE | |
| Average Intel Core i7-1260P, NVIDIA GeForce MX550 (5870 - 6235, n=2) | |
| HP EliteBook 840 G9 | |
| Lenovo ThinkPad T14 G3-21AJS00400 | |
| PCMark 10 / Essentials | |
| HP EliteBook 840 G9 | |
| Huawei MateBook X Pro 2022 | |
| Schenker Vision 14 2022 RTX 3050 Ti | |
| Average of class Office (3245 - 11594, n=68, last 2 years) | |
| Average Intel Core i7-1260P, NVIDIA GeForce MX550 (9729 - 10132, n=2) | |
| Lenovo ThinkPad T14 G3-21CF004NGE | |
| Lenovo ThinkPad T14 G3-21AJS00400 | |
| PCMark 10 / Productivity | |
| Average of class Office (5336 - 17243, n=68, last 2 years) | |
| Average Intel Core i7-1260P, NVIDIA GeForce MX550 (8189 - 9245, n=2) | |
| Huawei MateBook X Pro 2022 | |
| Schenker Vision 14 2022 RTX 3050 Ti | |
| Lenovo ThinkPad T14 G3-21CF004NGE | |
| Lenovo ThinkPad T14 G3-21AJS00400 | |
| HP EliteBook 840 G9 | |
| PCMark 10 / Digital Content Creation | |
| Schenker Vision 14 2022 RTX 3050 Ti | |
| Average of class Office (2049 - 13541, n=68, last 2 years) | |
| Lenovo ThinkPad T14 G3-21CF004NGE | |
| HP EliteBook 840 G9 | |
| Average Intel Core i7-1260P, NVIDIA GeForce MX550 (6891 - 7021, n=2) | |
| Lenovo ThinkPad T14 G3-21AJS00400 | |
| Huawei MateBook X Pro 2022 | |
| CrossMark / Overall | |
| Huawei MateBook X Pro 2022 | |
| HP EliteBook 840 G9 | |
| Schenker Vision 14 2022 RTX 3050 Ti | |
| Average of class Office (381 - 2010, n=75, last 2 years) | |
| Lenovo ThinkPad T14 G3-21AJS00400 | |
| Average Intel Core i7-1260P, NVIDIA GeForce MX550 (n=1) | |
| Lenovo ThinkPad T14 G3-21CF004NGE | |
| CrossMark / Productivity | |
| Huawei MateBook X Pro 2022 | |
| HP EliteBook 840 G9 | |
| Schenker Vision 14 2022 RTX 3050 Ti | |
| Lenovo ThinkPad T14 G3-21AJS00400 | |
| Average Intel Core i7-1260P, NVIDIA GeForce MX550 (n=1) | |
| Average of class Office (464 - 1880, n=75, last 2 years) | |
| Lenovo ThinkPad T14 G3-21CF004NGE | |
| CrossMark / Creativity | |
| Huawei MateBook X Pro 2022 | |
| HP EliteBook 840 G9 | |
| Schenker Vision 14 2022 RTX 3050 Ti | |
| Average of class Office (319 - 2361, n=75, last 2 years) | |
| Lenovo ThinkPad T14 G3-21AJS00400 | |
| Average Intel Core i7-1260P, NVIDIA GeForce MX550 (n=1) | |
| Lenovo ThinkPad T14 G3-21CF004NGE | |
| CrossMark / Responsiveness | |
| Huawei MateBook X Pro 2022 | |
| HP EliteBook 840 G9 | |
| Schenker Vision 14 2022 RTX 3050 Ti | |
| Lenovo ThinkPad T14 G3-21AJS00400 | |
| Average Intel Core i7-1260P, NVIDIA GeForce MX550 (n=1) | |
| Average of class Office (360 - 1820, n=75, last 2 years) | |
| Lenovo ThinkPad T14 G3-21CF004NGE | |
| PCMark 10 Score | 5870 points | |
Help | ||
| AIDA64 / Memory Copy | |
| Average of class Office (20075 - 110930, n=80, last 2 years) | |
| Huawei MateBook X Pro 2022 | |
| HP EliteBook 840 G9 | |
| Average Intel Core i7-1260P (25125 - 71544, n=25) | |
| Lenovo ThinkPad T14 G3-21CF004NGE | |
| Schenker Vision 14 2022 RTX 3050 Ti | |
| Lenovo ThinkPad T14 G3-21AJS00400 | |
| AIDA64 / Memory Read | |
| Huawei MateBook X Pro 2022 | |
| Average of class Office (10084 - 128030, n=81, last 2 years) | |
| HP EliteBook 840 G9 | |
| Average Intel Core i7-1260P (24983 - 72065, n=25) | |
| Lenovo ThinkPad T14 G3-21CF004NGE | |
| Schenker Vision 14 2022 RTX 3050 Ti | |
| Lenovo ThinkPad T14 G3-21AJS00400 | |
| AIDA64 / Memory Write | |
| Average of class Office (20073 - 119858, n=81, last 2 years) | |
| Huawei MateBook X Pro 2022 | |
| HP EliteBook 840 G9 | |
| Average Intel Core i7-1260P (23512 - 66799, n=25) | |
| Lenovo ThinkPad T14 G3-21CF004NGE | |
| Schenker Vision 14 2022 RTX 3050 Ti | |
| Lenovo ThinkPad T14 G3-21AJS00400 | |
| AIDA64 / Memory Latency | |
| Lenovo ThinkPad T14 G3-21CF004NGE | |
| Huawei MateBook X Pro 2022 | |
| Average of class Office (7.6 - 162.9, n=76, last 2 years) | |
| HP EliteBook 840 G9 | |
| Lenovo ThinkPad T14 G3-21AJS00400 | |
| Schenker Vision 14 2022 RTX 3050 Ti | |
| Average Intel Core i7-1260P (77.9 - 118.4, n=21) | |
* ... smaller is better
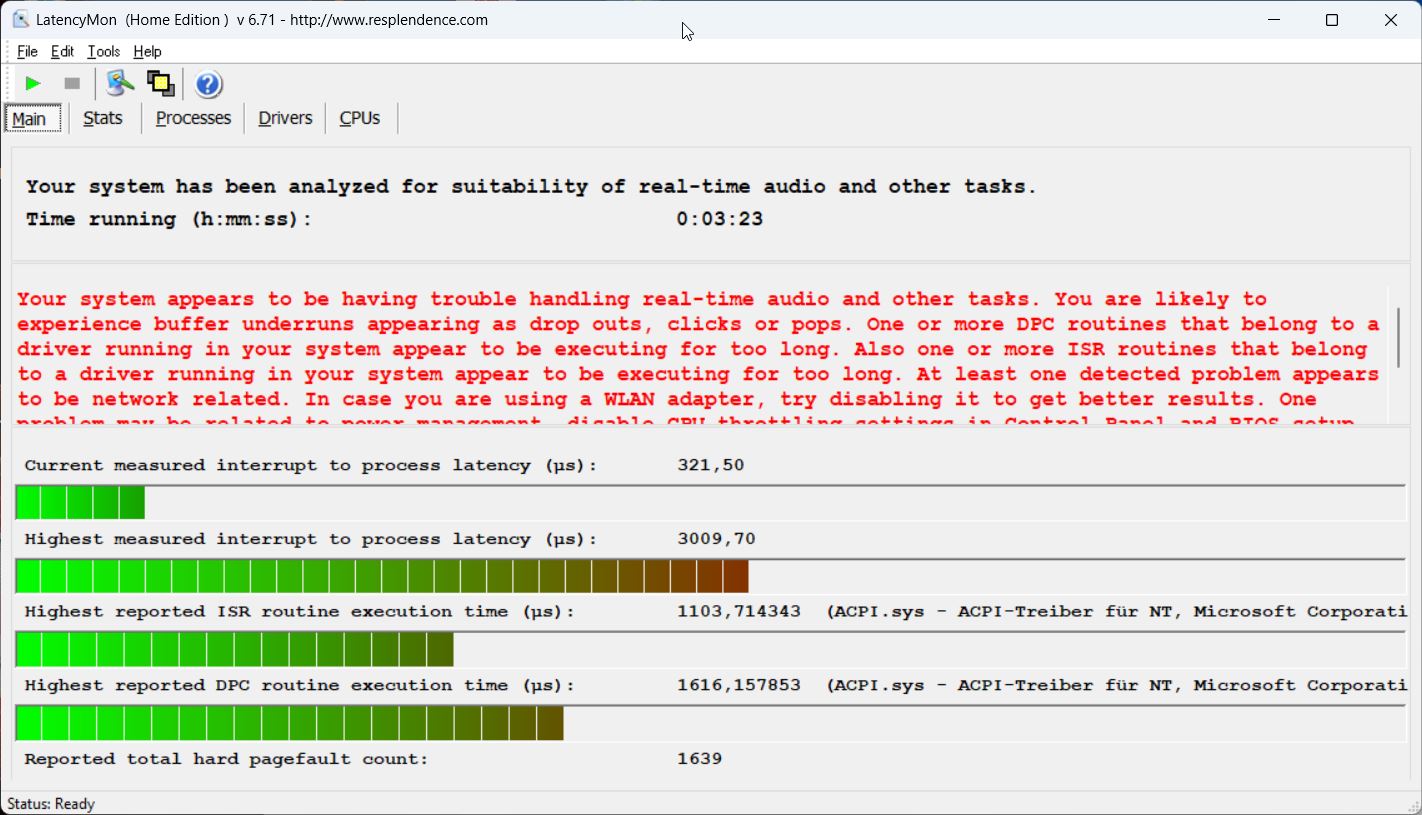
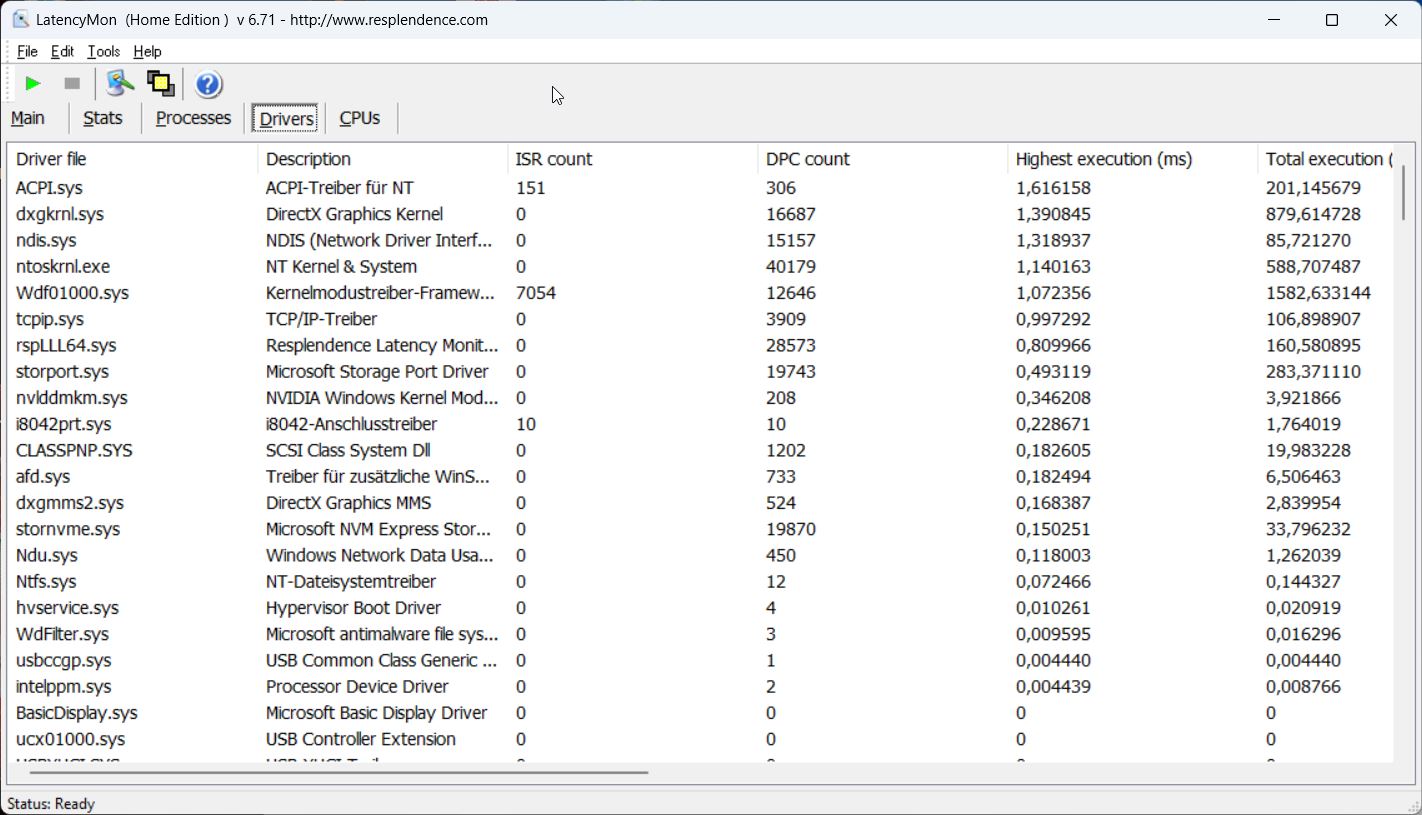
DPC延迟
在我们的标准化延迟测试中(上网冲浪、4K YouTube视频复制和CPU负载),当前BIOS版本的测试装置在实时音频应用中的使用显示出一些明显的限制。 但也可能有一些限制是由Nvidia驱动造成的,因为几个驱动版本在这方面都存在问题。在 AMD型号的T14 G3在这方面没有任何问题。
| DPC Latencies / LatencyMon - interrupt to process latency (max), Web, Youtube, Prime95 | |
| HP EliteBook 840 G9 | |
| Lenovo ThinkPad T14 G3-21AJS00400 | |
| Huawei MateBook X Pro 2022 | |
| Schenker Vision 14 2022 RTX 3050 Ti | |
| Lenovo ThinkPad T14 G3-21CF004NGE | |
* ... smaller is better
存储解决方案
我们的测试装置使用的是1TB版本的三星PM9A1,这是980 Pro的OEM变体。虽然PCIe 4.0固态硬盘提供了非常好的传输速率,但在持续负载下一段时间后,速率会下降。然而,这在日常业务操作中没有影响。第一次启动后,有904GB的存储空间可供用户使用。你可以找到更多的SSD基准测试 这里.

* ... smaller is better
Disk Throttling: DiskSpd Read Loop, Queue Depth 8
图形卡
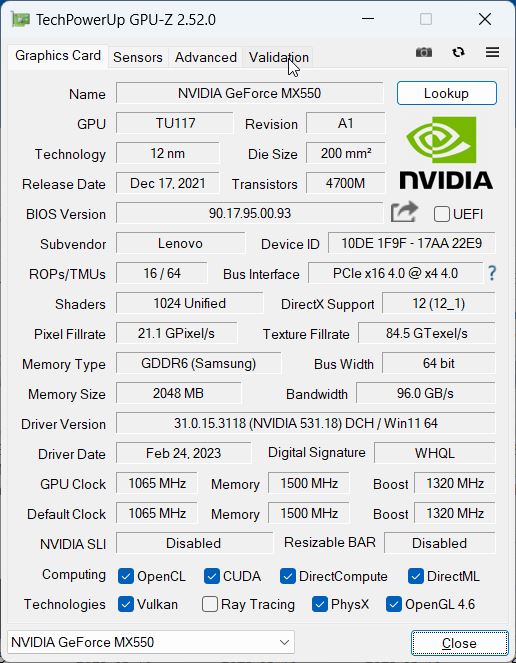
除了集成的 Iris Xe Graphics G7处理器,联想还为我们的测试配置配备了一个专用的 GeForce MX550具备2GB的VRAM。该显卡允许最大消耗30瓦,与英特尔略显过时的iGPU相比,在基准测试中也有明显的优势。然而,集成的 Radeon 680M在AMD型号中表现出相同的水平,至少在合成测试中是如此。因此,我们必须问一个问题,为什么你在这里需要额外的显卡。
另一方面,在实际的游戏基准测试中,GeForce GPU与集成的Radeon 680M相比有一点优势,但这一优势并不明显。那些喜欢在结束工作后在工作用笔记本电脑上玩一轮游戏的人,明显更适合使用 申科视界14和德 RTX 3050 Ti,比如说。
在持续负载和电池运行的情况下,图形性能保持稳定。你可以在我们的技术部分找到更多的GPU基准测试 我们的技术部分.
| 3DMark 11 Performance | 10068 points | |
| 3DMark Fire Strike Score | 5764 points | |
| 3DMark Time Spy Score | 2695 points | |
Help | ||
| Blender / v3.3 Classroom OPTIX/RTX | |
| Lenovo ThinkPad T14 G3-21AJS00400 | |
| Average NVIDIA GeForce MX550 (n=1) | |
| Average of class Office (29 - 242, n=2, last 2 years) | |
| Schenker Vision 14 2022 RTX 3050 Ti | |
| Blender / v3.3 Classroom CUDA | |
| Lenovo ThinkPad T14 G3-21AJS00400 | |
| Average NVIDIA GeForce MX550 (n=1) | |
| Average of class Office (53 - 214, n=3, last 2 years) | |
| Schenker Vision 14 2022 RTX 3050 Ti | |
| Blender / v3.3 Classroom CPU | |
| HP EliteBook 840 G9 | |
| Lenovo ThinkPad T14 G3-21AJS00400 | |
| Average NVIDIA GeForce MX550 (n=1) | |
| Huawei MateBook X Pro 2022 | |
| Average of class Office (245 - 3219, n=75, last 2 years) | |
| Lenovo ThinkPad T14 G3-21CF004NGE | |
| Schenker Vision 14 2022 RTX 3050 Ti | |
| Blender / v3.3 Classroom HIP/AMD | |
| Average of class Office (296 - 507, n=5, last 2 years) | |
| Lenovo ThinkPad T14 G3-21CF004NGE | |
* ... smaller is better
| Performance rating - Percent | |
| Schenker Vision 14 2022 RTX 3050 Ti | |
| Lenovo ThinkPad T14 G3-21AJS00400 | |
| Lenovo ThinkPad T14 G3-21CF004NGE | |
| Average of class Office | |
| HP EliteBook 840 G9 | |
| Huawei MateBook X Pro 2022 | |
| The Witcher 3 - 1920x1080 Ultra Graphics & Postprocessing (HBAO+) | |
| Schenker Vision 14 2022 RTX 3050 Ti | |
| Lenovo ThinkPad T14 G3-21AJS00400 | |
| Lenovo ThinkPad T14 G3-21CF004NGE | |
| Average of class Office (14.8 - 28.1, n=3, last 2 years) | |
| HP EliteBook 840 G9 | |
| Huawei MateBook X Pro 2022 | |
| GTA V - 1920x1080 Highest AA:4xMSAA + FX AF:16x | |
| Schenker Vision 14 2022 RTX 3050 Ti | |
| Lenovo ThinkPad T14 G3-21AJS00400 | |
| Lenovo ThinkPad T14 G3-21CF004NGE | |
| Average of class Office (5.77 - 45.3, n=69, last 2 years) | |
| Huawei MateBook X Pro 2022 | |
| HP EliteBook 840 G9 | |
| Final Fantasy XV Benchmark - 1920x1080 High Quality | |
| Schenker Vision 14 2022 RTX 3050 Ti | |
| Lenovo ThinkPad T14 G3-21CF004NGE | |
| Average of class Office (8.09 - 79.5, n=71, last 2 years) | |
| Lenovo ThinkPad T14 G3-21AJS00400 | |
| Huawei MateBook X Pro 2022 | |
| HP EliteBook 840 G9 | |
| Strange Brigade - 1920x1080 ultra AA:ultra AF:16 | |
| Schenker Vision 14 2022 RTX 3050 Ti | |
| Lenovo ThinkPad T14 G3-21AJS00400 | |
| Lenovo ThinkPad T14 G3-21CF004NGE | |
| Average of class Office (12.9 - 142.1, n=53, last 2 years) | |
| Huawei MateBook X Pro 2022 | |
| HP EliteBook 840 G9 | |
| Dota 2 Reborn - 1920x1080 ultra (3/3) best looking | |
| Schenker Vision 14 2022 RTX 3050 Ti | |
| Lenovo ThinkPad T14 G3-21AJS00400 | |
| Lenovo ThinkPad T14 G3-21CF004NGE | |
| HP EliteBook 840 G9 | |
| Huawei MateBook X Pro 2022 | |
| Average of class Office (14.6 - 135, n=77, last 2 years) | |
The Witcher 3 FPS Chart
| low | med. | high | ultra | 4K | |
|---|---|---|---|---|---|
| GTA V (2015) | 159.9 | 152.3 | 73.4 | 33.7 | |
| The Witcher 3 (2015) | 149 | 89 | 48 | 24 | |
| Dota 2 Reborn (2015) | 142.1 | 127 | 110.4 | 101.1 | |
| Final Fantasy XV Benchmark (2018) | 69.2 | 34.3 | 20.8 | ||
| X-Plane 11.11 (2018) | 109.9 | 95.2 | 73.4 | ||
| Far Cry 5 (2018) | 95 | 40 | 32 | 30 | |
| Strange Brigade (2018) | 147 | 59 | 51 | 45 | |
| F1 2021 (2021) | 152.7 | 53.5 | 47.4 | 25.7 | |
| F1 22 (2022) | 59.4 | 51.3 | 41.2 | 28.1 |
排放和电源管理
噪声水平
ThinkPad T14 G3的英特尔型号在低负载下是一个非常安静的伙伴,但风扇的高速旋转有点令人讨厌。 即使速度迅速降低,风扇最初的转速也非常明显。在更大的负载下,该设备的整体噪音也比AMD版本略大,我们在游戏和压力测试中测得的最大噪音几乎达到40 dB(A)。我们的测试设备不产生任何其他电子噪音。
Noise level
| Idle |
| 23.6 / 23.6 / 23.6 dB(A) |
| Load |
| 35.1 / 39.6 dB(A) |
 | ||
30 dB silent 40 dB(A) audible 50 dB(A) loud |
||
min: | ||
| Lenovo ThinkPad T14 G3-21AJS00400 GeForce MX550, i7-1260P, Samsung PM9A1 MZVL21T0HCLR | Lenovo ThinkPad T14 G3-21CF004NGE Radeon 680M, R7 PRO 6850U, Kioxia BG5 KBG5AZNV512G | HP EliteBook 840 G9 Iris Xe G7 96EUs, i7-1280P, SK hynix PC801 HFS512GEJ9X101N BF | Schenker Vision 14 2022 RTX 3050 Ti GeForce RTX 3050 Ti Laptop GPU, i7-12700H, Samsung SSD 980 Pro 1TB MZ-V8P1T0BW | Huawei MateBook X Pro 2022 Iris Xe G7 96EUs, i7-1260P, Silicon Motion PCIe-8 SSD 1TB | |
|---|---|---|---|---|---|
| Noise | 1% | -3% | -14% | 0% | |
| off / environment * (dB) | 23.6 | 24.2 -3% | 24.3 -3% | 24.4 -3% | 23.5 -0% |
| Idle Minimum * (dB) | 23.6 | 24.2 -3% | 24.5 -4% | 24.4 -3% | 23.5 -0% |
| Idle Average * (dB) | 23.6 | 24.2 -3% | 24.5 -4% | 24.4 -3% | 23.5 -0% |
| Idle Maximum * (dB) | 23.6 | 25.8 -9% | 26 -10% | 27.8 -18% | 25.9 -10% |
| Load Average * (dB) | 35.1 | 32.2 8% | 32.3 8% | 43.3 -23% | 33.8 4% |
| Witcher 3 ultra * (dB) | 39.6 | 34.1 14% | 39 2% | 48.2 -22% | 35.4 11% |
| Load Maximum * (dB) | 39.6 | 38.8 2% | 44.7 -13% | 48.8 -23% | 40.6 -3% |
* ... smaller is better
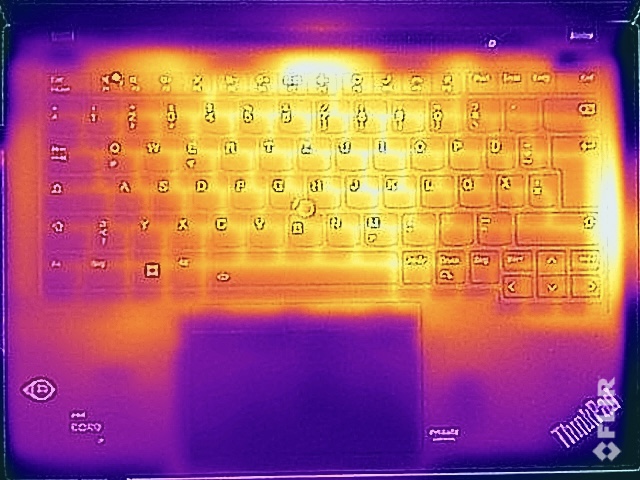
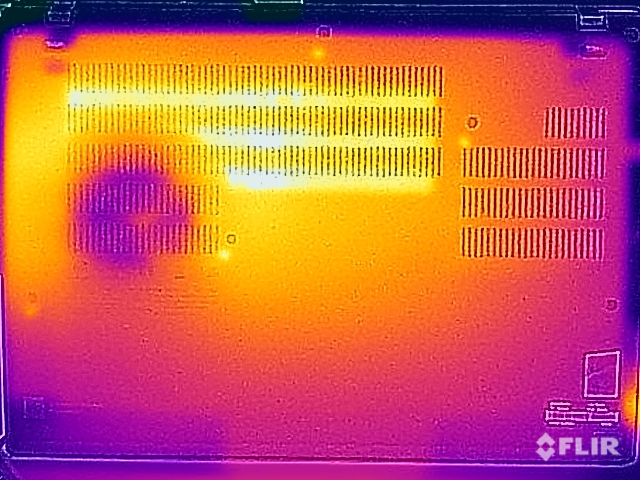
温度
联想对ThinkPad T14 G3的表面温度总体上有很好的把握,但在低负载下,不幸的是,该设备已经比AMD型号的温度略高。在更大的负载下,我们测量的最高温度略高于40℃(104°F),所以这并不导致任何限制,你仍然可以舒适地打字,也可以把设备放在腿上。
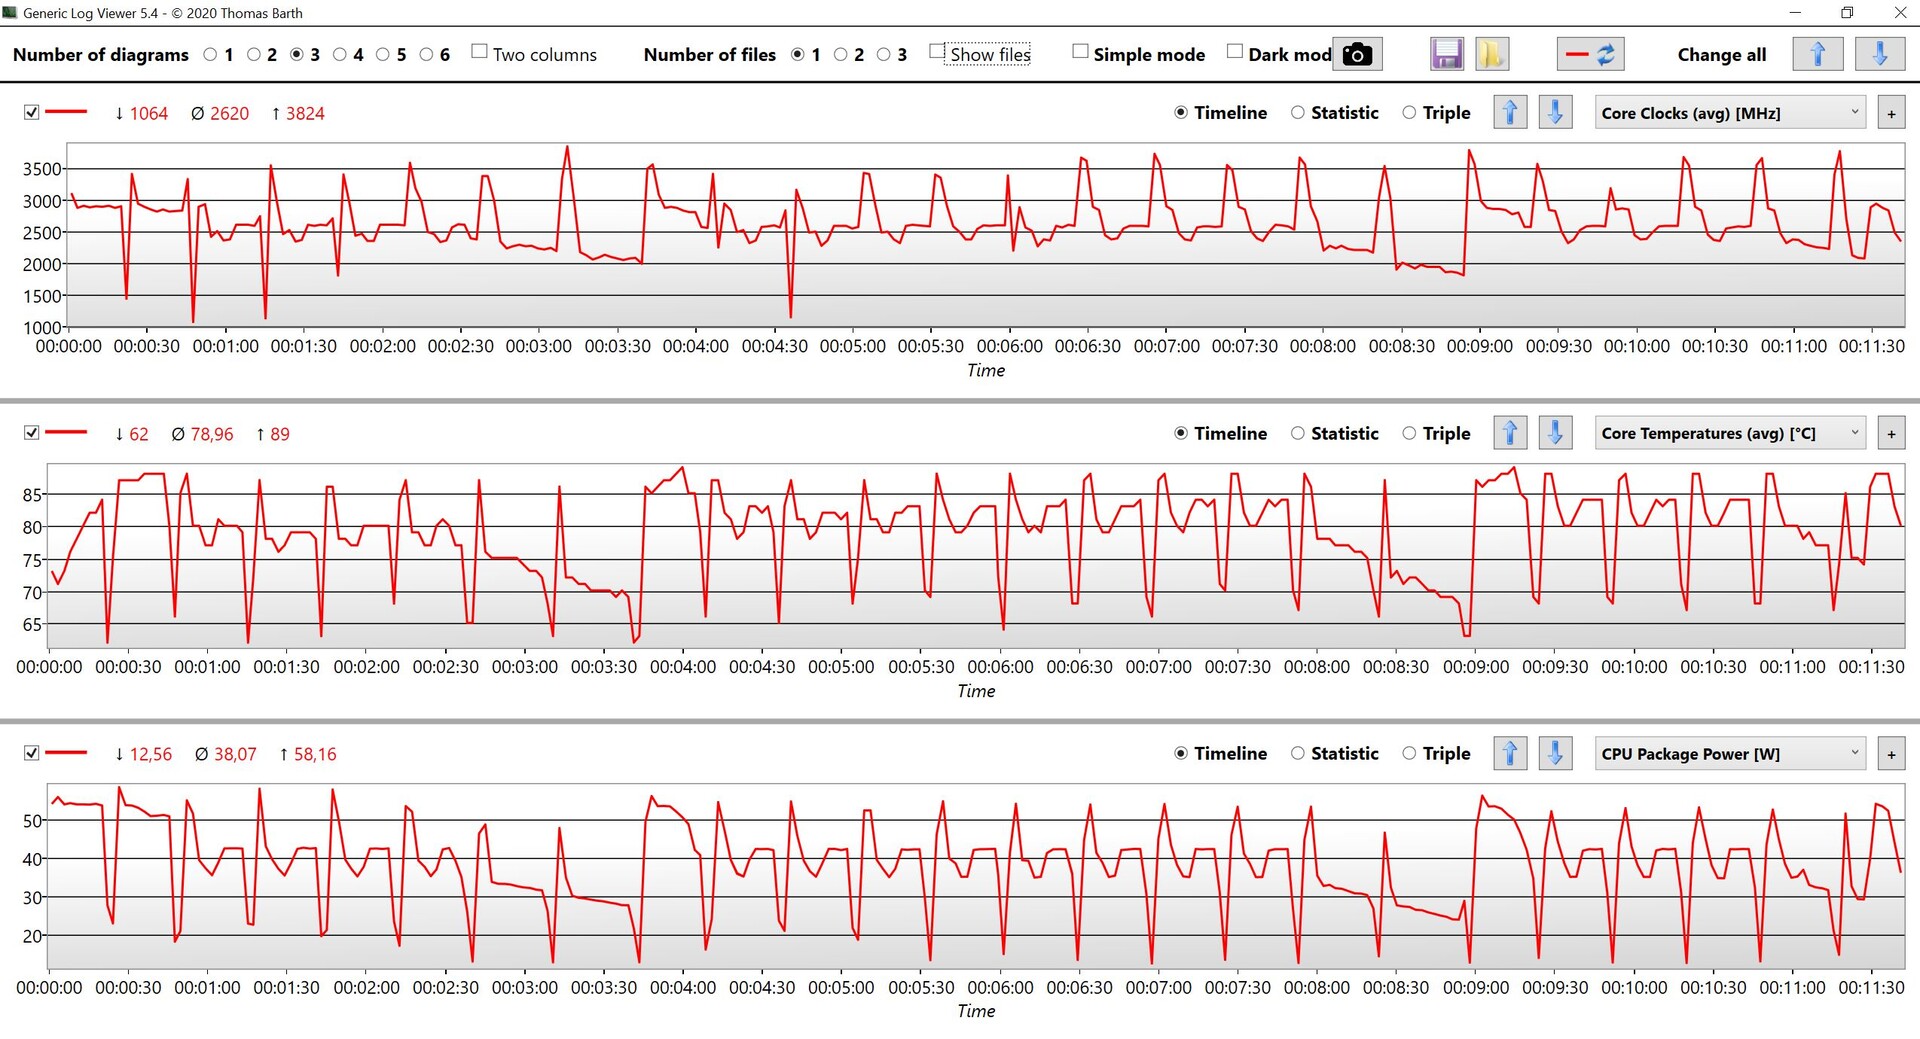
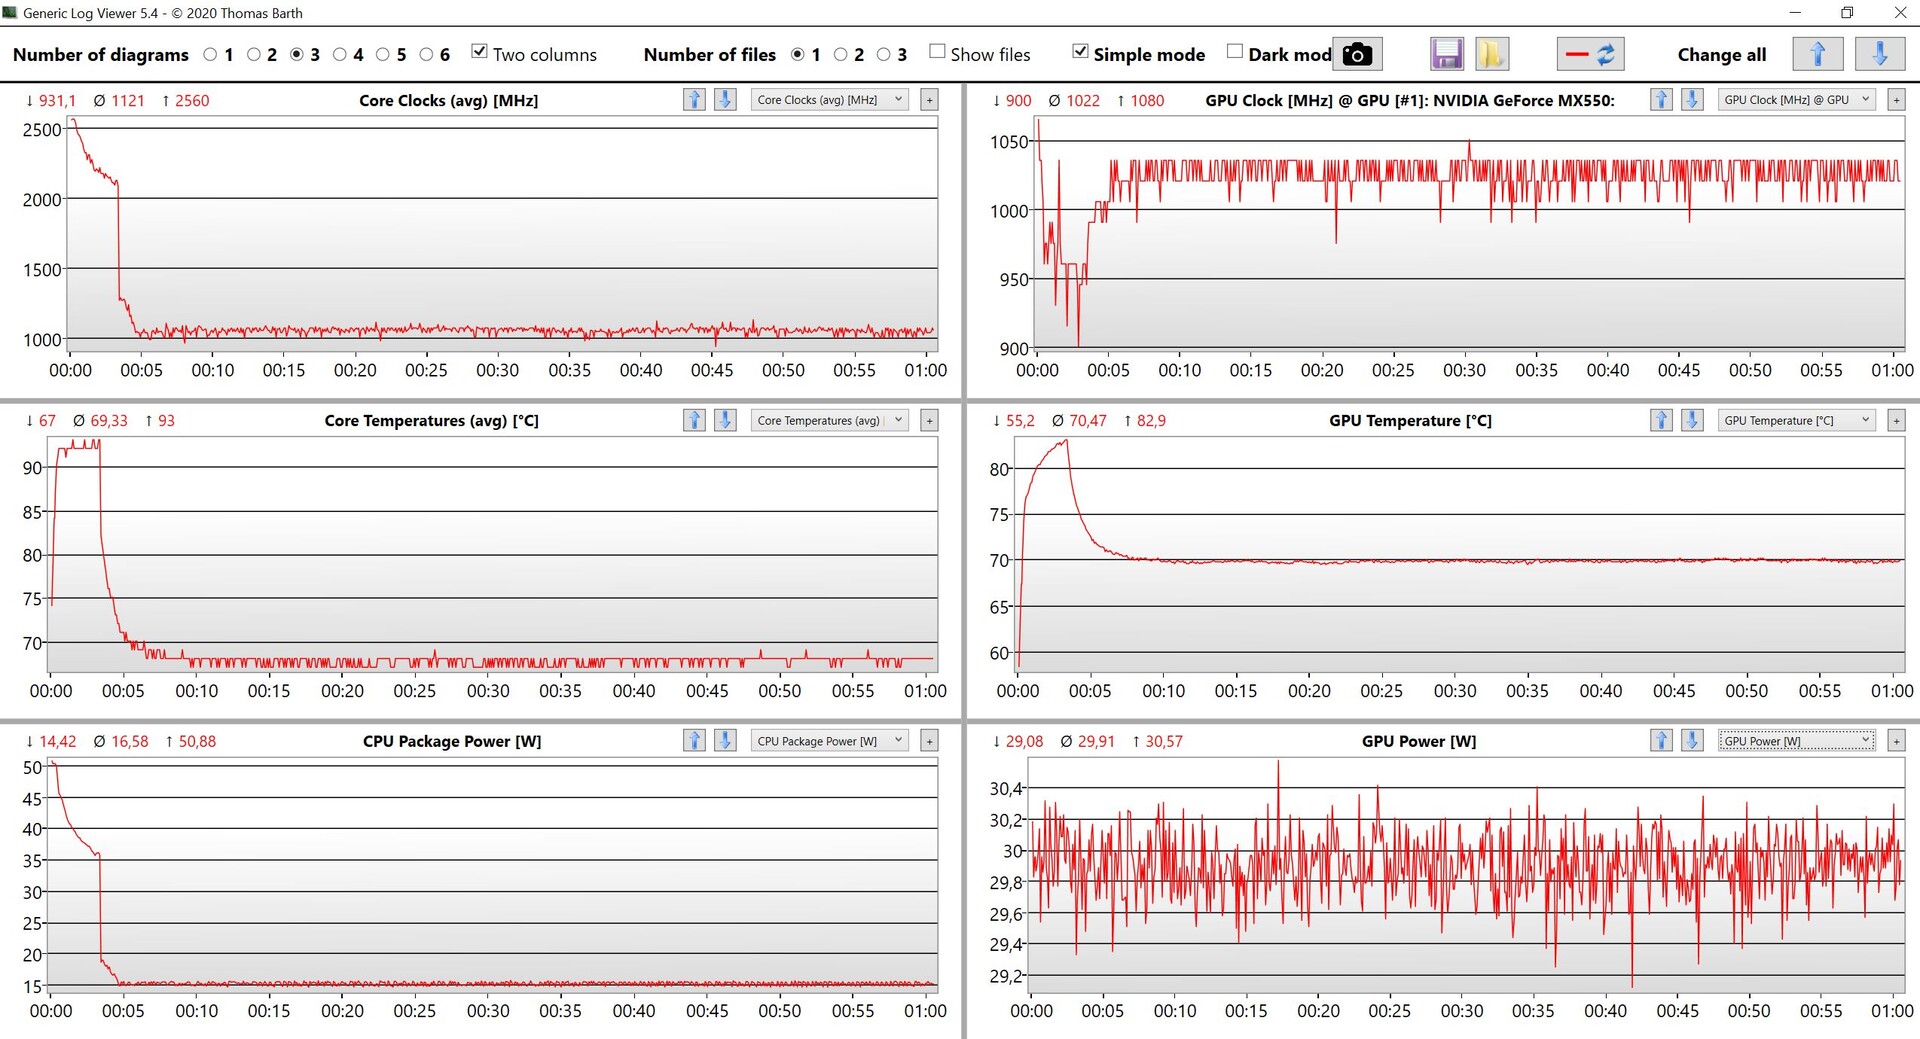
在压力测试期间,GPU性能保持稳定,约为30瓦,但处理器在几分钟后不得不大规模地节制其性能,从最高50瓦下降到只有15瓦。如果你看一下消耗量,你也可以立即看到,65瓦的电源在这里永远无法提供足够的功率,但后面会有更多的内容。
(-) The maximum temperature on the upper side is 46.4 °C / 116 F, compared to the average of 34.3 °C / 94 F, ranging from 21.2 to 62.5 °C for the class Office.
(±) The bottom heats up to a maximum of 43.1 °C / 110 F, compared to the average of 36.8 °C / 98 F
(+) In idle usage, the average temperature for the upper side is 29.9 °C / 86 F, compared to the device average of 29.5 °C / 85 F.
(±) Playing The Witcher 3, the average temperature for the upper side is 37.5 °C / 100 F, compared to the device average of 29.5 °C / 85 F.
(+) The palmrests and touchpad are reaching skin temperature as a maximum (34.5 °C / 94.1 F) and are therefore not hot.
(-) The average temperature of the palmrest area of similar devices was 27.5 °C / 81.5 F (-7 °C / -12.6 F).
| Lenovo ThinkPad T14 G3-21AJS00400 Intel Core i7-1260P, NVIDIA GeForce MX550 | Lenovo ThinkPad T14 G3-21CF004NGE AMD Ryzen 7 PRO 6850U, AMD Radeon 680M | HP EliteBook 840 G9 Intel Core i7-1280P, Intel Iris Xe Graphics G7 96EUs | Schenker Vision 14 2022 RTX 3050 Ti Intel Core i7-12700H, NVIDIA GeForce RTX 3050 Ti Laptop GPU | Huawei MateBook X Pro 2022 Intel Core i7-1260P, Intel Iris Xe Graphics G7 96EUs | |
|---|---|---|---|---|---|
| Heat | 6% | 27% | -3% | 7% | |
| Maximum Upper Side * (°C) | 46.4 | 48.2 -4% | 32.8 29% | 48.4 -4% | 43.1 7% |
| Maximum Bottom * (°C) | 43.1 | 52.8 -23% | 36.6 15% | 57.1 -32% | 42 3% |
| Idle Upper Side * (°C) | 33.9 | 24.4 28% | 21.6 36% | 28.1 17% | 29.4 13% |
| Idle Bottom * (°C) | 31.4 | 24.5 22% | 22.2 29% | 29 8% | 29.4 6% |
* ... smaller is better
发言人
Lenovo ThinkPad T14 G3-21AJS00400 audio analysis
(±) | speaker loudness is average but good (77.8 dB)
Bass 100 - 315 Hz
(-) | nearly no bass - on average 24.9% lower than median
(±) | linearity of bass is average (11.7% delta to prev. frequency)
Mids 400 - 2000 Hz
(+) | balanced mids - only 2.4% away from median
(+) | mids are linear (4% delta to prev. frequency)
Highs 2 - 16 kHz
(+) | balanced highs - only 2.5% away from median
(+) | highs are linear (3.8% delta to prev. frequency)
Overall 100 - 16.000 Hz
(±) | linearity of overall sound is average (18% difference to median)
Compared to same class
» 30% of all tested devices in this class were better, 7% similar, 62% worse
» The best had a delta of 7%, average was 21%, worst was 53%
Compared to all devices tested
» 38% of all tested devices were better, 8% similar, 54% worse
» The best had a delta of 4%, average was 23%, worst was 134%
Huawei MateBook X Pro 2022 audio analysis
(+) | speakers can play relatively loud (85.5 dB)
Bass 100 - 315 Hz
(±) | reduced bass - on average 5% lower than median
(+) | bass is linear (5.3% delta to prev. frequency)
Mids 400 - 2000 Hz
(+) | balanced mids - only 1.5% away from median
(+) | mids are linear (2.5% delta to prev. frequency)
Highs 2 - 16 kHz
(+) | balanced highs - only 2.1% away from median
(+) | highs are linear (5.3% delta to prev. frequency)
Overall 100 - 16.000 Hz
(+) | overall sound is linear (5% difference to median)
Compared to same class
» 0% of all tested devices in this class were better, 0% similar, 100% worse
» The best had a delta of 5%, average was 18%, worst was 53%
Compared to all devices tested
» 0% of all tested devices were better, 0% similar, 100% worse
» The best had a delta of 4%, average was 23%, worst was 134%
消耗功率

英特尔型号的耗电量比 AMD版本在所有情况下,甚至在空闲运行时也是如此(但不同的面板也可能在这里起作用)。此外,65瓦的电源在负载下的尺寸不够大,因为设备在这里的前三分钟必须从电池中吸取电能,电池容量也下降到~95%。只有在处理器达到15瓦的水平后(见上文),电源才能够在压力测试期间提供足够的电力。
我们不得不说,联想显然限制了这种情况下的性能。使用100瓦的电源,我们能够在压力测试开始时测量到101瓦的最大消耗量,然后在~85瓦时趋于平缓。有了这个,CPU的性能也会更好,但另一方面,这也会对风扇噪音和表面温度产生影响。
| Off / Standby | |
| Idle | |
| Load |
|
Key:
min: | |
| Lenovo ThinkPad T14 G3-21AJS00400 GeForce MX550, i7-1260P, Samsung PM9A1 MZVL21T0HCLR | Lenovo ThinkPad T14 G3-21CF004NGE Radeon 680M, R7 PRO 6850U, Kioxia BG5 KBG5AZNV512G | HP EliteBook 840 G9 Iris Xe G7 96EUs, i7-1280P, SK hynix PC801 HFS512GEJ9X101N BF | Schenker Vision 14 2022 RTX 3050 Ti GeForce RTX 3050 Ti Laptop GPU, i7-12700H, Samsung SSD 980 Pro 1TB MZ-V8P1T0BW | Huawei MateBook X Pro 2022 Iris Xe G7 96EUs, i7-1260P, Silicon Motion PCIe-8 SSD 1TB | |
|---|---|---|---|---|---|
| Power Consumption | 26% | 10% | -63% | -55% | |
| Idle Minimum * (Watt) | 4.3 | 2.4 44% | 2.2 49% | 7.5 -74% | 6.5 -51% |
| Idle Average * (Watt) | 6.2 | 5.3 15% | 5.3 15% | 10.4 -68% | 13.7 -121% |
| Idle Maximum * (Watt) | 7 | 5.6 20% | 8.5 -21% | 11.4 -63% | 14.4 -106% |
| Load Average * (Watt) | 63.5 | 39.7 37% | 54.3 14% | 83.3 -31% | 64.6 -2% |
| Witcher 3 ultra * (Watt) | 52.5 | 42.8 18% | 51 3% | 92.7 -77% | 57.2 -9% |
| Load Maximum * (Watt) | 66.1 | 50.6 23% | 67.3 -2% | 110.3 -67% | 90.9 -38% |
* ... smaller is better
Power Consumption The Witcher 3 / Stress Test
Power Consumption with External Monitor
电池寿命
同样的行为在电池测试中继续,在我们的两次WLAN测试中,英特尔型号明显超过了AMD版本(一次在全亮度,然后在150cd/m²)。我们测量了冲浪时的7-8小时,而AMD型号持续了约9.5-13小时。
Pros
Cons
结论--ThinkPad T14 G3的AMD性能更好
单看ThinkPad T14 G3,它是一款不错的商务笔记本电脑,同样是英特尔/英伟达的组合,其图形性能略高于英特尔的老化iGPU。相较于 AMD版本,有几个优势,如英特尔处理器的单核性能更高,专用的GeForce MX550的游戏性能略好。此外,英特尔型号还提供Thunderbolt 4,并有一个SO-DIMM插槽,允许你扩展工作内存。
另一方面,也有一些缺点,如负载下的功耗明显较高,附带的65瓦电源太弱,导致在CPU/GPU综合负载下性能被人为扼杀。风扇的声音也变大了,电池寿命也变短了。同时,AMD处理器在多核测试中表现出相同的水平,而消耗的电量更少。
由于增加了显卡,ThinkPad T14 G3也消耗了更多的电力,而与AMD版本相比,额外的性能却非常小。因此,额外的模块几乎不值得,那些可以不使用雷电4的人如果选择AMD版的ThinkPad T14 G3,将获得更好的商务笔记本电脑,而且电池寿命更长。
另一个问题是面板情况,但这也适用于ThinkPad T14 G3的所有型号。例如,LG的面板在测试中比友达光电的型号留下了更好的印象,尽管在这两种情况下都是14英寸低功率显示屏。我们已经在早期的机型中看到了这种面板的抽奖活动,不幸的是,你永远无法提前知道使用的是哪种面板。
即使T14 G3已经在市场上销售了一段时间,英特尔 ,新的移动
Raptor Lake CPU是一个相当令人失望的整体更新,在这一点上,我们不知道AMD的新机型何时会到来。至少,我们不期望在未来几个月内有更新。</p>价格和可用性
联想ThinkPad T14 G3的英特尔版本从1012.32美元起售,Nvidia配置从1067.52美元起售。
Lenovo ThinkPad T14 G3-21AJS00400
- 03/21/2023 v7 (old)
Andreas Osthoff
Transparency
The selection of devices to be reviewed is made by our editorial team. The test sample was provided to the author as a loan by the manufacturer or retailer for the purpose of this review. The lender had no influence on this review, nor did the manufacturer receive a copy of this review before publication. There was no obligation to publish this review. As an independent media company, Notebookcheck is not subjected to the authority of manufacturers, retailers or publishers.
This is how Notebookcheck is testing
Every year, Notebookcheck independently reviews hundreds of laptops and smartphones using standardized procedures to ensure that all results are comparable. We have continuously developed our test methods for around 20 years and set industry standards in the process. In our test labs, high-quality measuring equipment is utilized by experienced technicians and editors. These tests involve a multi-stage validation process. Our complex rating system is based on hundreds of well-founded measurements and benchmarks, which maintains objectivity. Further information on our test methods can be found here.
Price comparison

