联想IdeaPad S340(i7-8565U,FHD)笔记本电脑评测
| SD Card Reader | |
| average JPG Copy Test (av. of 3 runs) | |
| Average of class Multimedia (23 - 531, n=43, last 2 years) | |
| Dell Latitude 14 5495 (Toshiba Exceria Pro SDXC 64 GB UHS-II) | |
| HP ProBook 445 G6 (Toshiba Exceria Pro SDXC 64 GB UHS-II) | |
| Lenovo Ideapad S340-14IWL-81N70056GE (Toshiba Exceria Pro SDXC 64 GB UHS-II) | |
| Asus VivoBook 14 F412FJ-EB084T (Toshiba Exceria Pro M501 microSDXC 64GB) | |
| maximum AS SSD Seq Read Test (1GB) | |
| Dell Latitude 14 5495 (Toshiba Exceria Pro SDXC 64 GB UHS-II) | |
| Average of class Multimedia (27.9 - 1455, n=42, last 2 years) | |
| HP ProBook 445 G6 (Toshiba Exceria Pro SDXC 64 GB UHS-II) | |
| Lenovo Ideapad S340-14IWL-81N70056GE (Toshiba Exceria Pro SDXC 64 GB UHS-II) | |
| Asus VivoBook 14 F412FJ-EB084T (Toshiba Exceria Pro M501 microSDXC 64GB) | |
| Networking | |
| iperf3 transmit AX12 | |
| Asus VivoBook 14 F412FJ-EB084T | |
| Huawei MateBook D 14 W50F | |
| Dell Latitude 14 5495 | |
| HP ProBook 445 G6 | |
| Lenovo Ideapad S340-14IWL-81N70056GE | |
| iperf3 receive AX12 | |
| Asus VivoBook 14 F412FJ-EB084T | |
| HP ProBook 445 G6 | |
| Huawei MateBook D 14 W50F | |
| Dell Latitude 14 5495 | |
| Lenovo Ideapad S340-14IWL-81N70056GE | |
| |||||||||||||||||||||||||
Brightness Distribution: 87 %
Center on Battery: 260 cd/m²
Contrast: 897:1 (Black: 0.29 cd/m²)
ΔE ColorChecker Calman: 6.29 | ∀{0.5-29.43 Ø4.73}
calibrated: 4.51
ΔE Greyscale Calman: 4.65 | ∀{0.09-98 Ø4.97}
58% sRGB (Argyll 1.6.3 3D)
37% AdobeRGB 1998 (Argyll 1.6.3 3D)
39.68% AdobeRGB 1998 (Argyll 3D)
57.8% sRGB (Argyll 3D)
38.41% Display P3 (Argyll 3D)
Gamma: 2.73
CCT: 7331 K
| Lenovo Ideapad S340-14IWL-81N70056GE LG Philips LP140WFA-SPD1, , 1920x1080, 14" | Dell Latitude 14 5495 CMN14C9, , 1920x1080, 14" | Asus VivoBook 14 F412FJ-EB084T AU Optronics AUO403D B140HAN04.0, , 1920x1080, 14" | HP ProBook 445 G6 Chi Mei CMN14D4, , 1920x1080, 14" | Huawei MateBook D 14 W50F BOE0764 / TV140FHM-NH0, , 1920x1080, 14" | |
|---|---|---|---|---|---|
| Display | 7% | 3% | 8% | 12% | |
| Display P3 Coverage (%) | 38.41 | 40.94 7% | 39.71 3% | 41.53 8% | 43.19 12% |
| sRGB Coverage (%) | 57.8 | 61.4 6% | 59.6 3% | 62 7% | 64 11% |
| AdobeRGB 1998 Coverage (%) | 39.68 | 42.32 7% | 41.04 3% | 42.94 8% | 44.62 12% |
| Response Times | -13% | -9% | -4% | -26% | |
| Response Time Grey 50% / Grey 80% * (ms) | 36 ? | 41 ? -14% | 40 ? -11% | 40 ? -11% | 41 ? -14% |
| Response Time Black / White * (ms) | 27 ? | 30 ? -11% | 29 ? -7% | 26 ? 4% | 37 ? -37% |
| PWM Frequency (Hz) | 25000 ? | 208 ? | 200 ? | ||
| Screen | 11% | 22% | 12% | 5% | |
| Brightness middle (cd/m²) | 260 | 212 -18% | 267 3% | 200 -23% | 291 12% |
| Brightness (cd/m²) | 250 | 200 -20% | 257 3% | 196 -22% | 276 10% |
| Brightness Distribution (%) | 87 | 89 2% | 91 5% | 67 -23% | 85 -2% |
| Black Level * (cd/m²) | 0.29 | 0.23 21% | 0.2 31% | 0.17 41% | 0.46 -59% |
| Contrast (:1) | 897 | 922 3% | 1335 49% | 1176 31% | 633 -29% |
| Colorchecker dE 2000 * | 6.29 | 4.34 31% | 3.79 40% | 4.26 32% | 4.3 32% |
| Colorchecker dE 2000 max. * | 14.77 | 9.01 39% | 8.18 45% | 9.7 34% | 10.01 32% |
| Colorchecker dE 2000 calibrated * | 4.51 | 4.71 -4% | 3.18 29% | ||
| Greyscale dE 2000 * | 4.65 | 2.81 40% | 1.49 68% | 3.15 32% | 4.21 9% |
| Gamma | 2.73 81% | 2.22 99% | 2.48 89% | 2.31 95% | 2.46 89% |
| CCT | 7331 89% | 6286 103% | 6659 98% | 6882 94% | 6867 95% |
| Color Space (Percent of AdobeRGB 1998) (%) | 37 | 39 5% | 38 3% | 40 8% | 41 11% |
| Color Space (Percent of sRGB) (%) | 58 | 61 5% | 59 2% | 62 7% | 64 10% |
| Total Average (Program / Settings) | 2% /
7% | 5% /
15% | 5% /
9% | -3% /
2% |
* ... smaller is better
Display Response Times
| ↔ Response Time Black to White | ||
|---|---|---|
| 27 ms ... rise ↗ and fall ↘ combined | ↗ 16 ms rise | 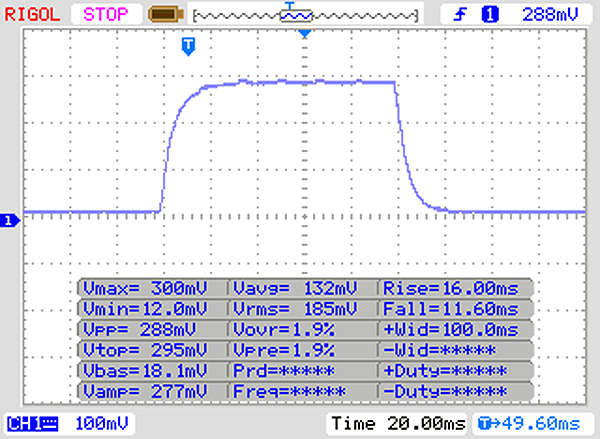 |
| ↘ 11 ms fall | ||
| The screen shows relatively slow response rates in our tests and may be too slow for gamers. In comparison, all tested devices range from 0.1 (minimum) to 240 (maximum) ms. » 67 % of all devices are better. This means that the measured response time is worse than the average of all tested devices (19.9 ms). | ||
| ↔ Response Time 50% Grey to 80% Grey | ||
| 36 ms ... rise ↗ and fall ↘ combined | ↗ 20 ms rise | 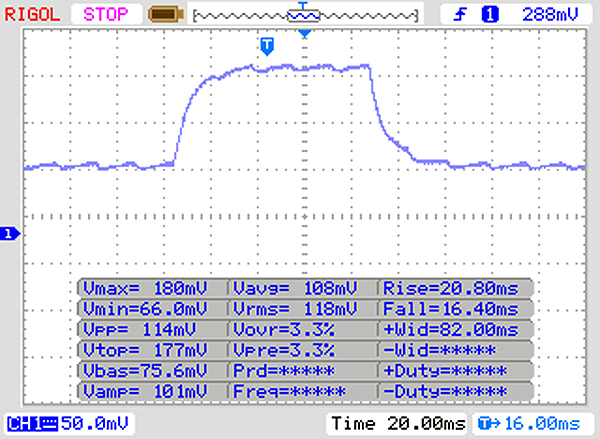 |
| ↘ 16 ms fall | ||
| The screen shows slow response rates in our tests and will be unsatisfactory for gamers. In comparison, all tested devices range from 0.165 (minimum) to 636 (maximum) ms. » 50 % of all devices are better. This means that the measured response time is worse than the average of all tested devices (31.1 ms). | ||
Screen Flickering / PWM (Pulse-Width Modulation)
| Screen flickering / PWM not detected | 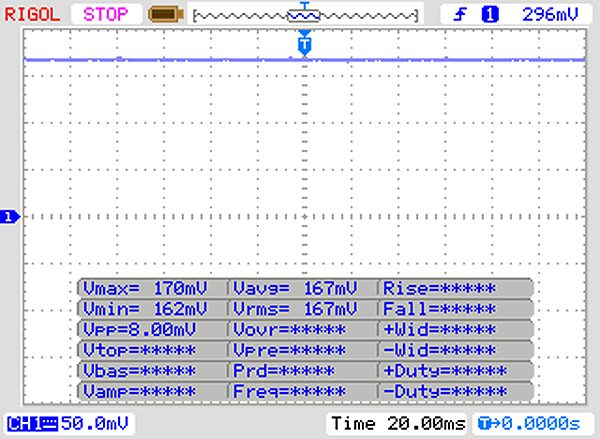 | ||
In comparison: 52 % of all tested devices do not use PWM to dim the display. If PWM was detected, an average of 7794 (minimum: 5 - maximum: 343500) Hz was measured. | |||
| Cinebench R15 | |
| CPU Single 64Bit | |
| Average of class Multimedia (184.8 - 326, n=66, last 2 years) | |
| Acer Swift 3 SF314-55G-768V | |
| Huawei Matebook 13-53010FYW | |
| Lenovo Ideapad S340-14IWL-81N70056GE | |
| Average Intel Core i7-8565U (138.3 - 193, n=51) | |
| Asus VivoBook 14 F412FJ-EB084T | |
| Dell Latitude 14 5495 | |
| Huawei MateBook D 14 W50F | |
| HP ProBook 445 G6 | |
| CPU Multi 64Bit | |
| Average of class Multimedia (856 - 5224, n=68, last 2 years) | |
| Lenovo Ideapad S340-14IWL-81N70056GE | |
| Huawei Matebook 13-53010FYW | |
| Dell Latitude 14 5495 | |
| Asus VivoBook 14 F412FJ-EB084T | |
| HP ProBook 445 G6 | |
| Average Intel Core i7-8565U (452 - 815, n=52) | |
| Huawei MateBook D 14 W50F | |
| Acer Swift 3 SF314-55G-768V | |
| PCMark 8 | |
| Home Score Accelerated v2 | |
| Average of class Multimedia (n=1last 2 years) | |
| Lenovo Ideapad S340-14IWL-81N70056GE | |
| Average Intel Core i7-8565U, NVIDIA GeForce MX230 (n=1) | |
| Huawei Matebook 13-53010FYW | |
| Acer Swift 3 SF314-55G-768V | |
| Dell Latitude 14 5495 | |
| HP ProBook 445 G6 | |
| Work Score Accelerated v2 | |
| Acer Swift 3 SF314-55G-768V | |
| Lenovo Ideapad S340-14IWL-81N70056GE | |
| Average Intel Core i7-8565U, NVIDIA GeForce MX230 (n=1) | |
| Huawei Matebook 13-53010FYW | |
| HP ProBook 445 G6 | |
| Dell Latitude 14 5495 | |
| PCMark 8 Home Score Accelerated v2 | 3641 points | |
| PCMark 8 Work Score Accelerated v2 | 5133 points | |
| PCMark 10 Score | 4011 points | |
Help | ||
| Lenovo Ideapad S340-14IWL-81N70056GE WDC PC SN520 SDAPNUW-512G | Dell Latitude 14 5495 Intel SSDSCKKF256G8 | HP ProBook 445 G6 SK Hynix BC501 NVMe 256 GB | Huawei Matebook 13-53010FYW WDC PC SN520 SDAPNUW-512G | Acer Swift 3 SF314-55G-768V WDC PC SN520 SDAPNUW-512G | Average WDC PC SN520 SDAPNUW-512G | |
|---|---|---|---|---|---|---|
| CrystalDiskMark 5.2 / 6 | -63% | -29% | 39% | 3% | -8% | |
| Write 4K (MB/s) | 160.8 | 48.45 -70% | 110.4 -31% | 191.2 19% | 185.5 15% | 138.5 ? -14% |
| Read 4K (MB/s) | 50.5 | 25.11 -50% | 39.46 -22% | 53.1 5% | 50.2 -1% | 44.2 ? -12% |
| Write Seq (MB/s) | 1458 | 341.2 -77% | 808 -45% | 1768 21% | 1175 -19% | 1265 ? -13% |
| Read Seq (MB/s) | 1447 | 521 -64% | 1130 -22% | 1710 18% | 1132 -22% | 1237 ? -15% |
| Write 4K Q32T1 (MB/s) | 406.5 | 202 -50% | 260.8 -36% | 575 41% | 472.6 16% | 404 ? -1% |
| Read 4K Q32T1 (MB/s) | 476.8 | 243.5 -49% | 308 -35% | 654 37% | 642 35% | 421 ? -12% |
| Write Seq Q32T1 (MB/s) | 1458 | 320.8 -78% | 816 -44% | 2544 74% | 1453 0% | 1491 ? 2% |
| Read Seq Q32T1 (MB/s) | 1743 | 555 -68% | 1783 2% | 3433 97% | 1738 0% | 1741 ? 0% |
| Write 4K Q8T8 (MB/s) | 247.5 | 715 ? | ||||
| Read 4K Q8T8 (MB/s) | 253.4 | 1027 ? | ||||
| AS SSD | -90% | -36% | 33% | 3% | -8% | |
| Seq Read (MB/s) | 1583 | 507 -68% | 1546 -2% | 2934 85% | 1438 -9% | 1363 ? -14% |
| Seq Write (MB/s) | 1345 | 286.5 -79% | 708 -47% | 2407 79% | 1352 1% | 1227 ? -9% |
| 4K Read (MB/s) | 44.47 | 19.76 -56% | 34.12 -23% | 48.31 9% | 47.35 6% | 40.8 ? -8% |
| 4K Write (MB/s) | 136.1 | 34.58 -75% | 76.7 -44% | 179.7 32% | 167.9 23% | 127.3 ? -6% |
| 4K-64 Read (MB/s) | 1038 | 238.4 -77% | 528 -49% | 1296 25% | 1051 1% | 957 ? -8% |
| 4K-64 Write (MB/s) | 1113 | 225.2 -80% | 588 -47% | 1459 31% | 1211 9% | 1081 ? -3% |
| Access Time Read * (ms) | 0.086 | 0.128 -49% | 0.062 28% | 0.103 -20% | 0.07744 ? 10% | |
| Access Time Write * (ms) | 0.027 | 0.101 -274% | 0.048 -78% | 0.021 22% | 0.03 -11% | 0.03671 ? -36% |
| Score Read (Points) | 1241 | 309 -75% | 717 -42% | 1638 32% | 1242 0% | 1134 ? -9% |
| Score Write (Points) | 1383 | 288 -79% | 735 -47% | 1879 36% | 1514 9% | 1331 ? -4% |
| Score Total (Points) | 3255 | 751 -77% | 1785 -45% | 4334 33% | 3397 4% | 3046 ? -6% |
| Copy ISO MB/s (MB/s) | 441.3 | 576 | 1169 ? | |||
| Copy Program MB/s (MB/s) | 152.1 | 159.8 | 446 ? | |||
| Copy Game MB/s (MB/s) | 260 | 330.8 | 874 ? | |||
| Total Average (Program / Settings) | -77% /
-79% | -33% /
-33% | 36% /
36% | 3% /
3% | -8% /
-8% |
* ... smaller is better

| 3DMark 11 - 1280x720 Performance GPU | |
| Average of class Multimedia (3765 - 60002, n=62, last 2 years) | |
| Acer Swift 3 SF314-55G-768V | |
| Lenovo Ideapad S340-14IWL-81N70056GE | |
| Average NVIDIA GeForce MX230 (3180 - 3582, n=6) | |
| Asus VivoBook 14 F412FJ-EB084T | |
| HP ProBook 445 G6 | |
| Dell Latitude 14 5495 | |
| Huawei Matebook 13-53010FYW | |
| Huawei MateBook D 14 W50F | |
| 3DMark | |
| 1280x720 Cloud Gate Standard Graphics | |
| Average of class Multimedia (16765 - 143501, n=34, last 2 years) | |
| Acer Swift 3 SF314-55G-768V | |
| Lenovo Ideapad S340-14IWL-81N70056GE | |
| Average NVIDIA GeForce MX230 (13376 - 17999, n=6) | |
| Asus VivoBook 14 F412FJ-EB084T | |
| HP ProBook 445 G6 | |
| Dell Latitude 14 5495 | |
| Huawei Matebook 13-53010FYW | |
| Huawei MateBook D 14 W50F | |
| 1920x1080 Fire Strike Graphics | |
| Average of class Multimedia (2328 - 48907, n=66, last 2 years) | |
| Acer Swift 3 SF314-55G-768V | |
| Lenovo Ideapad S340-14IWL-81N70056GE | |
| Average NVIDIA GeForce MX230 (2168 - 2755, n=6) | |
| Asus VivoBook 14 F412FJ-EB084T | |
| HP ProBook 445 G6 | |
| Dell Latitude 14 5495 | |
| Huawei Matebook 13-53010FYW | |
| Huawei MateBook D 14 W50F | |
| 2560x1440 Time Spy Graphics | |
| Average of class Multimedia (696 - 19403, n=67, last 2 years) | |
| Average NVIDIA GeForce MX230 (698 - 837, n=4) | |
| Asus VivoBook 14 F412FJ-EB084T | |
| HP ProBook 445 G6 | |
| 3DMark 11 Performance | 3719 points | |
| 3DMark Cloud Gate Standard Score | 8886 points | |
| 3DMark Fire Strike Score | 2476 points | |
Help | ||
| BioShock Infinite | |
| 1920x1080 Ultra Preset, DX11 (DDOF) | |
| Acer Swift 3 SF314-55G-768V | |
| Lenovo Ideapad S340-14IWL-81N70056GE | |
| Average NVIDIA GeForce MX230 (26.2 - 31.2, n=5) | |
| Asus VivoBook 14 F412FJ-EB084T | |
| Dell Latitude 14 5495 | |
| HP ProBook 445 G6 | |
| Huawei Matebook 13-53010FYW | |
| 1366x768 High Preset | |
| Acer Swift 3 SF314-55G-768V | |
| Lenovo Ideapad S340-14IWL-81N70056GE | |
| Average NVIDIA GeForce MX230 (61.8 - 79.8, n=5) | |
| Asus VivoBook 14 F412FJ-EB084T | |
| HP ProBook 445 G6 | |
| Huawei Matebook 13-53010FYW | |
| Thief | |
| 1920x1080 Very High Preset AA:FXAA & High SS AF:8x | |
| Lenovo Ideapad S340-14IWL-81N70056GE | |
| Average NVIDIA GeForce MX230 (n=1) | |
| 1366x768 High Preset AA:FXAA & Low SS AF:4x | |
| Lenovo Ideapad S340-14IWL-81N70056GE | |
| Average NVIDIA GeForce MX230 (n=1) | |
| Huawei Matebook 13-53010FYW | |
| Dota 2 Reborn | |
| 1920x1080 ultra (3/3) best looking | |
| Average of class Multimedia (29 - 179.9, n=68, last 2 years) | |
| Acer Swift 3 SF314-55G-768V | |
| Lenovo Ideapad S340-14IWL-81N70056GE | |
| Average NVIDIA GeForce MX230 (n=1) | |
| Huawei Matebook 13-53010FYW | |
| 1920x1080 high (2/3) | |
| Average of class Multimedia (31.1 - 196.9, n=68, last 2 years) | |
| Acer Swift 3 SF314-55G-768V | |
| Lenovo Ideapad S340-14IWL-81N70056GE | |
| Average NVIDIA GeForce MX230 (n=1) | |
| Huawei Matebook 13-53010FYW | |
| low | med. | high | ultra | |
|---|---|---|---|---|
| BioShock Infinite (2013) | 170.7 | 81.9 | 79.2 | 31.21 |
| Thief (2014) | 58.7 | 39.4 | 35.6 | 18.3 |
| Dota 2 Reborn (2015) | 126.7 | 113 | 58 | 43.2 |
Noise level
| Idle |
| 30.6 / 30.6 / 31.2 dB(A) |
| Load |
| 36.5 / 39.7 dB(A) |
 | ||
30 dB silent 40 dB(A) audible 50 dB(A) loud |
||
min: | ||
(-) The maximum temperature on the upper side is 45.2 °C / 113 F, compared to the average of 36.8 °C / 98 F, ranging from 21 to 71 °C for the class Multimedia.
(±) The bottom heats up to a maximum of 43.8 °C / 111 F, compared to the average of 39.1 °C / 102 F
(+) In idle usage, the average temperature for the upper side is 25.6 °C / 78 F, compared to the device average of 31.3 °C / 88 F.
(+) The palmrests and touchpad are cooler than skin temperature with a maximum of 29.4 °C / 84.9 F and are therefore cool to the touch.
(±) The average temperature of the palmrest area of similar devices was 28.7 °C / 83.7 F (-0.7 °C / -1.2 F).
Lenovo Ideapad S340-14IWL-81N70056GE audio analysis
(-) | not very loud speakers (67.8 dB)
Bass 100 - 315 Hz
(-) | nearly no bass - on average 20.1% lower than median
(±) | linearity of bass is average (11.5% delta to prev. frequency)
Mids 400 - 2000 Hz
(+) | balanced mids - only 3.9% away from median
(±) | linearity of mids is average (7.1% delta to prev. frequency)
Highs 2 - 16 kHz
(+) | balanced highs - only 2.6% away from median
(+) | highs are linear (5.9% delta to prev. frequency)
Overall 100 - 16.000 Hz
(±) | linearity of overall sound is average (23.1% difference to median)
Compared to same class
» 82% of all tested devices in this class were better, 5% similar, 14% worse
» The best had a delta of 5%, average was 17%, worst was 45%
Compared to all devices tested
» 69% of all tested devices were better, 5% similar, 26% worse
» The best had a delta of 4%, average was 24%, worst was 134%
Apple MacBook 12 (Early 2016) 1.1 GHz audio analysis
(+) | speakers can play relatively loud (83.6 dB)
Bass 100 - 315 Hz
(±) | reduced bass - on average 11.3% lower than median
(±) | linearity of bass is average (14.2% delta to prev. frequency)
Mids 400 - 2000 Hz
(+) | balanced mids - only 2.4% away from median
(+) | mids are linear (5.5% delta to prev. frequency)
Highs 2 - 16 kHz
(+) | balanced highs - only 2% away from median
(+) | highs are linear (4.5% delta to prev. frequency)
Overall 100 - 16.000 Hz
(+) | overall sound is linear (10.2% difference to median)
Compared to same class
» 7% of all tested devices in this class were better, 2% similar, 91% worse
» The best had a delta of 5%, average was 18%, worst was 53%
Compared to all devices tested
» 5% of all tested devices were better, 1% similar, 94% worse
» The best had a delta of 4%, average was 24%, worst was 134%
| Off / Standby | |
| Idle | |
| Load |
|
Key:
min: | |
| Lenovo Ideapad S340-14IWL-81N70056GE i7-8565U, GeForce MX230, WDC PC SN520 SDAPNUW-512G, IPS, 1920x1080, 14" | Dell Latitude 14 5495 R7 2700U, Vega 10, Intel SSDSCKKF256G8, IPS LED, 1920x1080, 14" | Asus VivoBook 14 F412FJ-EB084T i5-8265U, GeForce MX230, Kingston RBU-SNS8180DS3512GJ, IPS, 1920x1080, 14" | Acer Swift 3 SF314-55G-768V i7-8565U, GeForce MX250, WDC PC SN520 SDAPNUW-512G, IPS, 1920x1080, 14" | Huawei Matebook 13-53010FYW i7-8565U, UHD Graphics 620, WDC PC SN520 SDAPNUW-512G, IPS, 2160x1440, 13" | Average NVIDIA GeForce MX230 | Average of class Multimedia | |
|---|---|---|---|---|---|---|---|
| Power Consumption | -14% | -21% | -68% | -33% | -20% | -92% | |
| Idle Minimum * (Watt) | 2.5 | 4.3 -72% | 3.7 -48% | 7.4 -196% | 3.84 -54% | 3.77 ? -51% | 5.71 ? -128% |
| Idle Average * (Watt) | 5.1 | 6.6 -29% | 6.1 -20% | 9.9 -94% | 7.68 -51% | 6.16 ? -21% | 10.1 ? -98% |
| Idle Maximum * (Watt) | 5.6 | 7.7 -38% | 8.3 -48% | 11.7 -109% | 9.36 -67% | 7.06 ? -26% | 12.4 ? -121% |
| Load Average * (Watt) | 47.5 | 32 33% | 43 9% | 29 39% | 43.2 9% | 49.6 ? -4% | 65 ? -37% |
| Load Maximum * (Watt) | 64.5 | 40 38% | 61.6 4% | 52 19% | 64.8 -0% | 63.3 ? 2% | 112.2 ? -74% |
* ... smaller is better
| Lenovo Ideapad S340-14IWL-81N70056GE i7-8565U, GeForce MX230, 52.5 Wh | Dell Latitude 14 5495 R7 2700U, Vega 10, 61 Wh | Asus VivoBook 14 F412FJ-EB084T i5-8265U, GeForce MX230, 37 Wh | Acer Swift 3 SF314-55G-768V i7-8565U, GeForce MX250, 50.7 Wh | Huawei Matebook 13-53010FYW i7-8565U, UHD Graphics 620, 41.7 Wh | Apple MacBook 12 (Early 2016) 1.1 GHz 6Y30, HD Graphics 515, 41.4 Wh | Average of class Multimedia | |
|---|---|---|---|---|---|---|---|
| Battery runtime | 33% | -8% | 8% | 9% | 110% | 43% | |
| Reader / Idle (h) | 23.2 | 18.2 -22% | 16.1 -31% | 23.6 2% | 25.2 ? 9% | ||
| WiFi v1.3 (h) | 6 | 9.4 57% | 5.5 -8% | 8.1 35% | 7 17% | 8.4 40% | 12 ? 100% |
| Load (h) | 1.4 | 2.3 64% | 1.7 21% | 1.5 7% | 3.9 179% | 1.675 ? 20% |
Pros
Cons
Verdict - A solid companion with a mediocre battery life
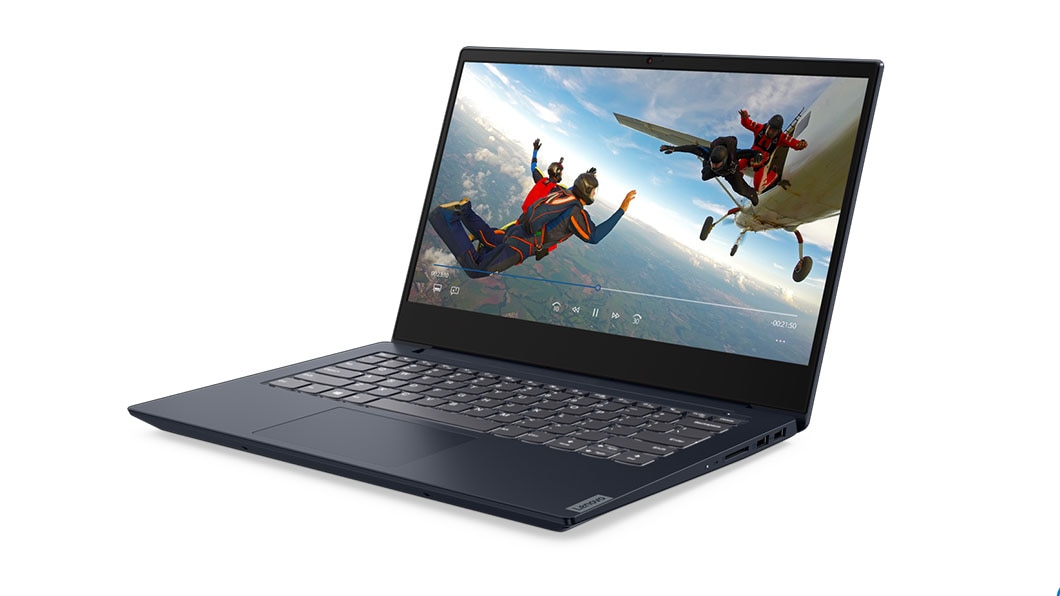
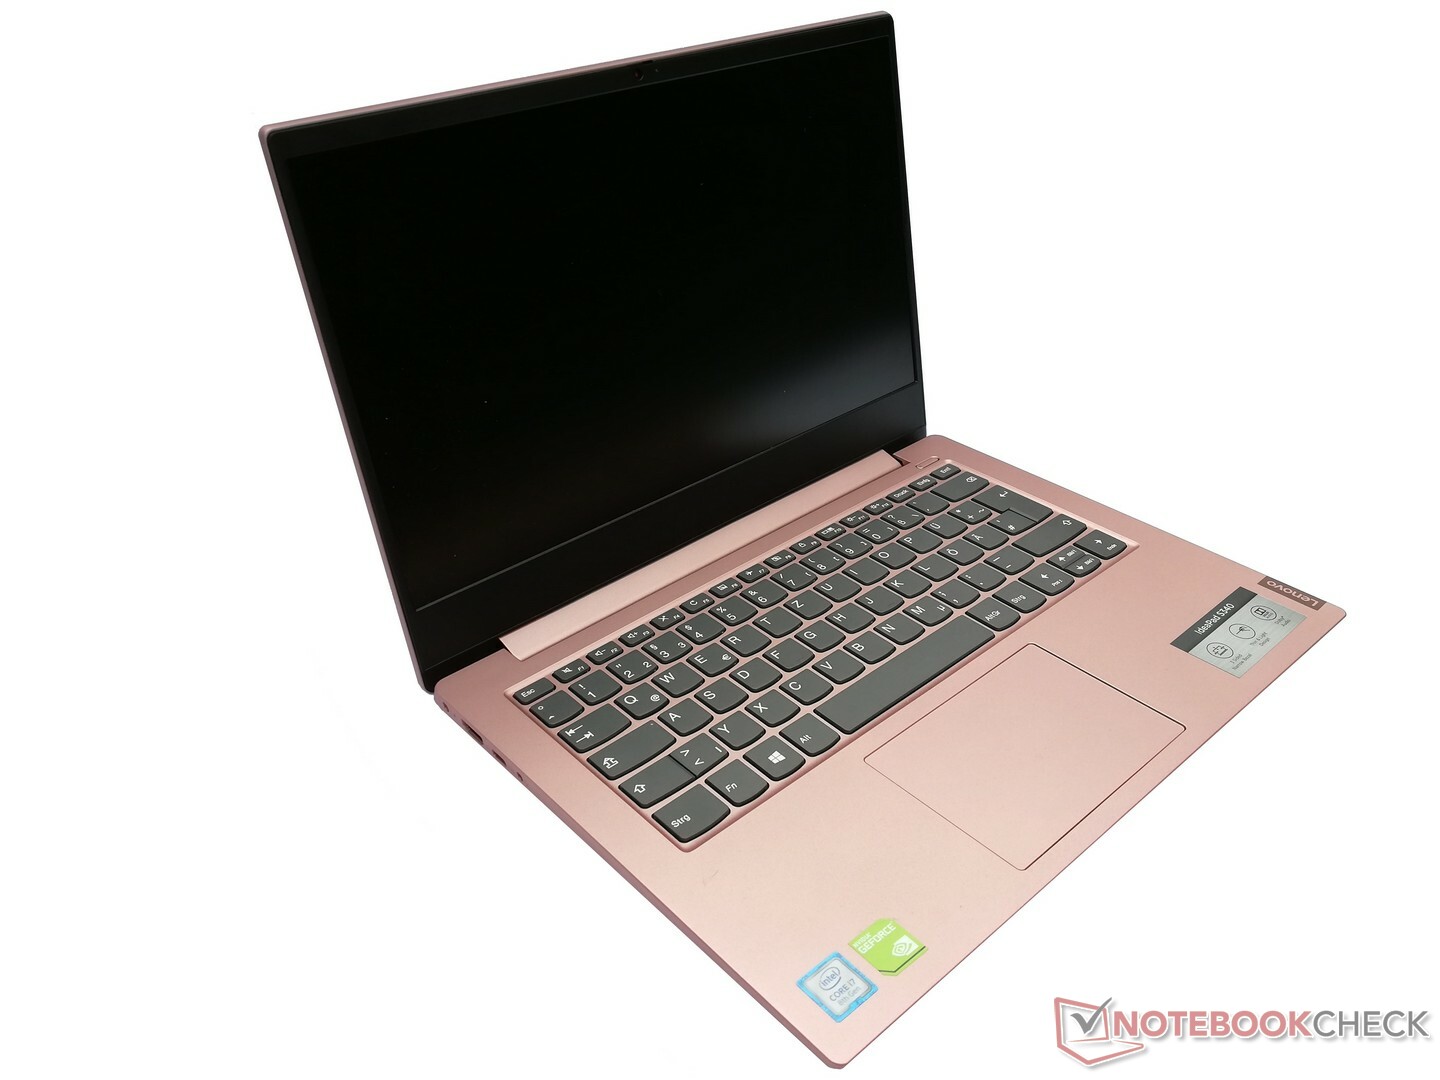
在我们的测试中,联想IdeaPad S340表现为一个坚实可靠的伴侣,其坚固的外壳和适度的设计适合任何商业环境。系统性能非常好,用户不仅可以通过更换SSD而且还可以添加SATA驱动器来增加存储空间。 然而,运行内存不能被扩展或替换的事实非常受我们诟病。
联想IdeaPad S340是一款具有良好系统性能的可靠伴侣。 但是,续航时间仍低于我们的预期。
屏幕对于大多数任务来说已经足够了,并且也适用于眼睛敏感的用户,因为它不使用PWM调光。良好的输入设备使使用IdeaPad成为一项令人愉快的事。 另一方面,只有六个小时的续航时间对于轻薄设备而言非常短暂。 总的来说,联想IdeaPad S340是日常工作的好伴侣,如果你总能在附近找到一个充电口。
Lenovo Ideapad S340-14IWL-81N70056GE
- 06/11/2019 v6 (old)
Mike Wobker
Price comparison

