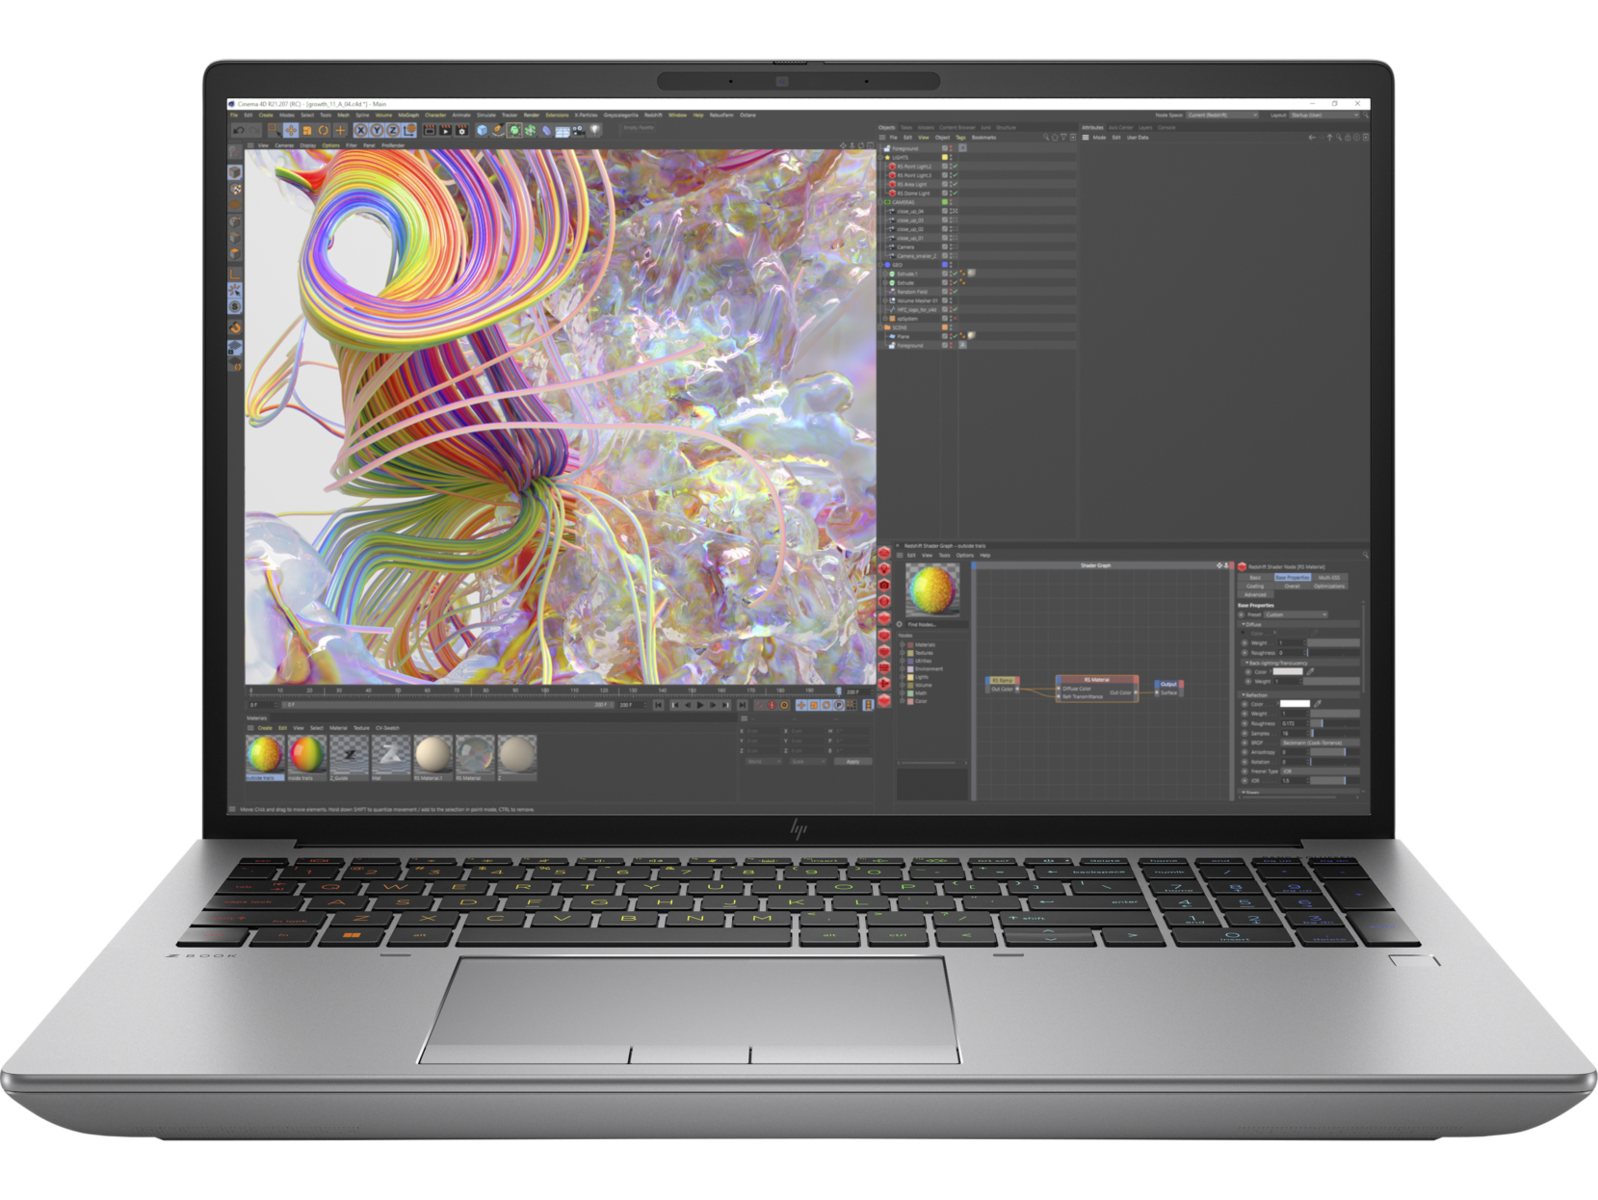
惠普ZBook Fury 16 G9工作站回顾:戴尔Precision 7670和ThinkPad P16 G1替代品

ZBook Fury系列是惠普性能最高的移动工作站,与中档的 ZBook Studio系列和超薄的 ZBook Firefly系列.
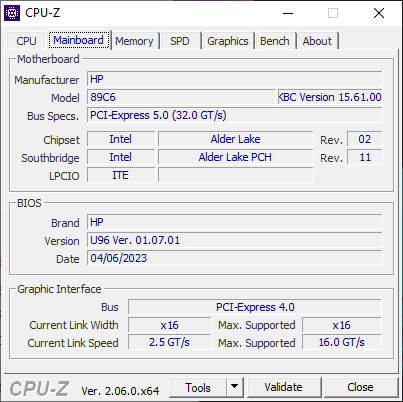
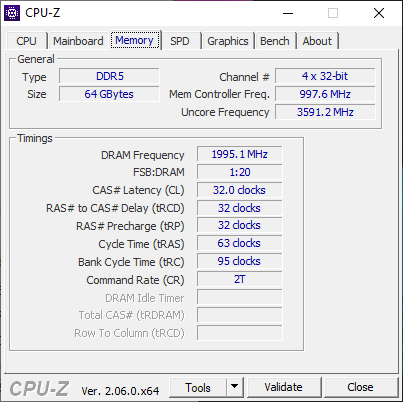
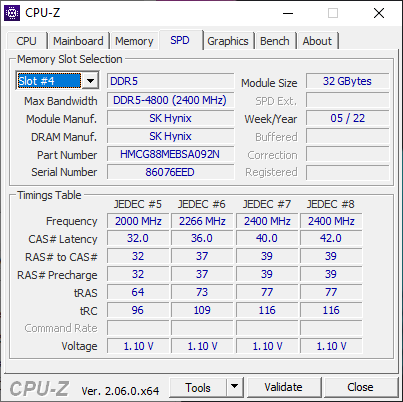
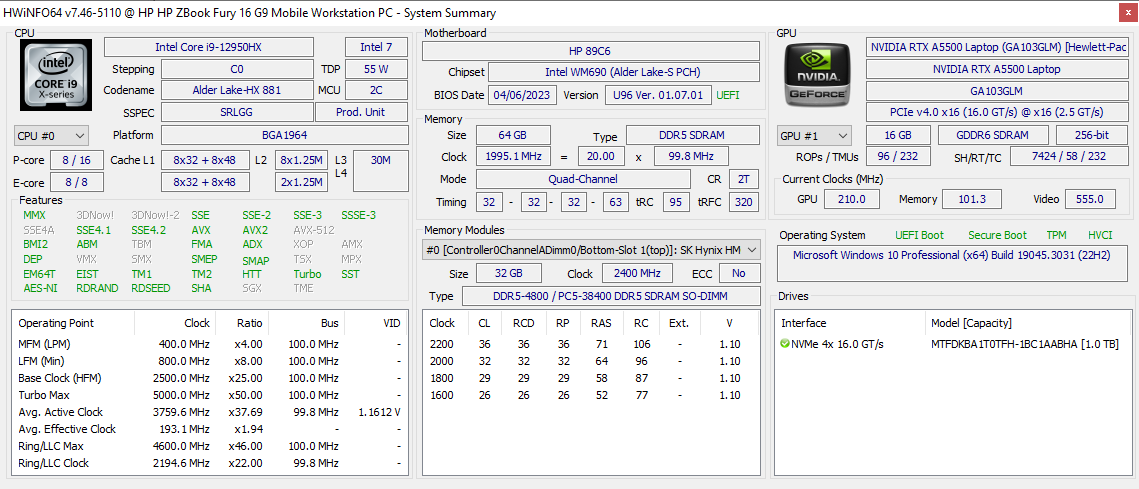
我们的评测单位是Fury 16 G9的高端配置,配备第12代Alder Lake-H Core i9-12950HX CPU、RTX A5500 Ampere GPU、64GB内存和3840 x 2400 IPS显示屏,零售价略高于4000美元。可配置的选项非常多,有LTE、5G、甚至OLED面板,这里列出https://www.hp.com/us-en/shop/pdp/hp-zbook-fury-16-g9-customizable-609l4av-mb#techSpecs.请注意,ZBook Fury G10也有较新的13代英特尔选项,但机箱仍然与我们的Fury G9相同。
ZBook Fury 16 G9的替代品包括其他旗舰的16英寸移动工作站,如 戴尔Precision 7670, 微星CreatorPro Z16P, 华硕ProArt StudioBook 16, 或 联想ThinkPad P16 G1.
更多惠普评论:
潜在的竞争对手比较
Rating | Date | Model | Weight | Height | Size | Resolution | Price |
|---|---|---|---|---|---|---|---|
| 91 % v7 (old) | 06 / 2023 | HP ZBook Fury 16 G9 i9-12950HX, RTX A5500 Laptop GPU | 2.6 kg | 28.5 mm | 16.00" | 3840x2400 | |
| 90.1 % v7 (old) | 11 / 2022 | HP ZBook Studio 16 G9 62U04EA i7-12800H, RTX A2000 Laptop GPU | 1.8 kg | 19 mm | 16.00" | 3840x2400 | |
| 82.9 % v7 (old) | 10 / 2022 | HP ZBook Firefly 16 G9-6B897EA i7-1265U, T550 Laptop GPU | 2 kg | 19.2 mm | 16.00" | 1920x1200 | |
| 91 % v7 (old) | 02 / 2023 | Lenovo ThinkPad P16 G1 RTX A5500 i9-12950HX, RTX A5500 Laptop GPU | 3 kg | 30.23 mm | 16.00" | 3840x2400 | |
| 89.1 % v7 (old) | 12 / 2022 | Dell Precision 7000 7670 Performance i9-12950HX, RTX A5500 Laptop GPU | 2.8 kg | 25.95 mm | 16.00" | 3840x2400 | |
| 84.3 % v7 (old) | 11 / 2022 | MSI CreatorPro Z16P B12UKST i7-12700H, RTX A3000 Laptop GPU | 2.4 kg | 19 mm | 16.00" | 2560x1600 |
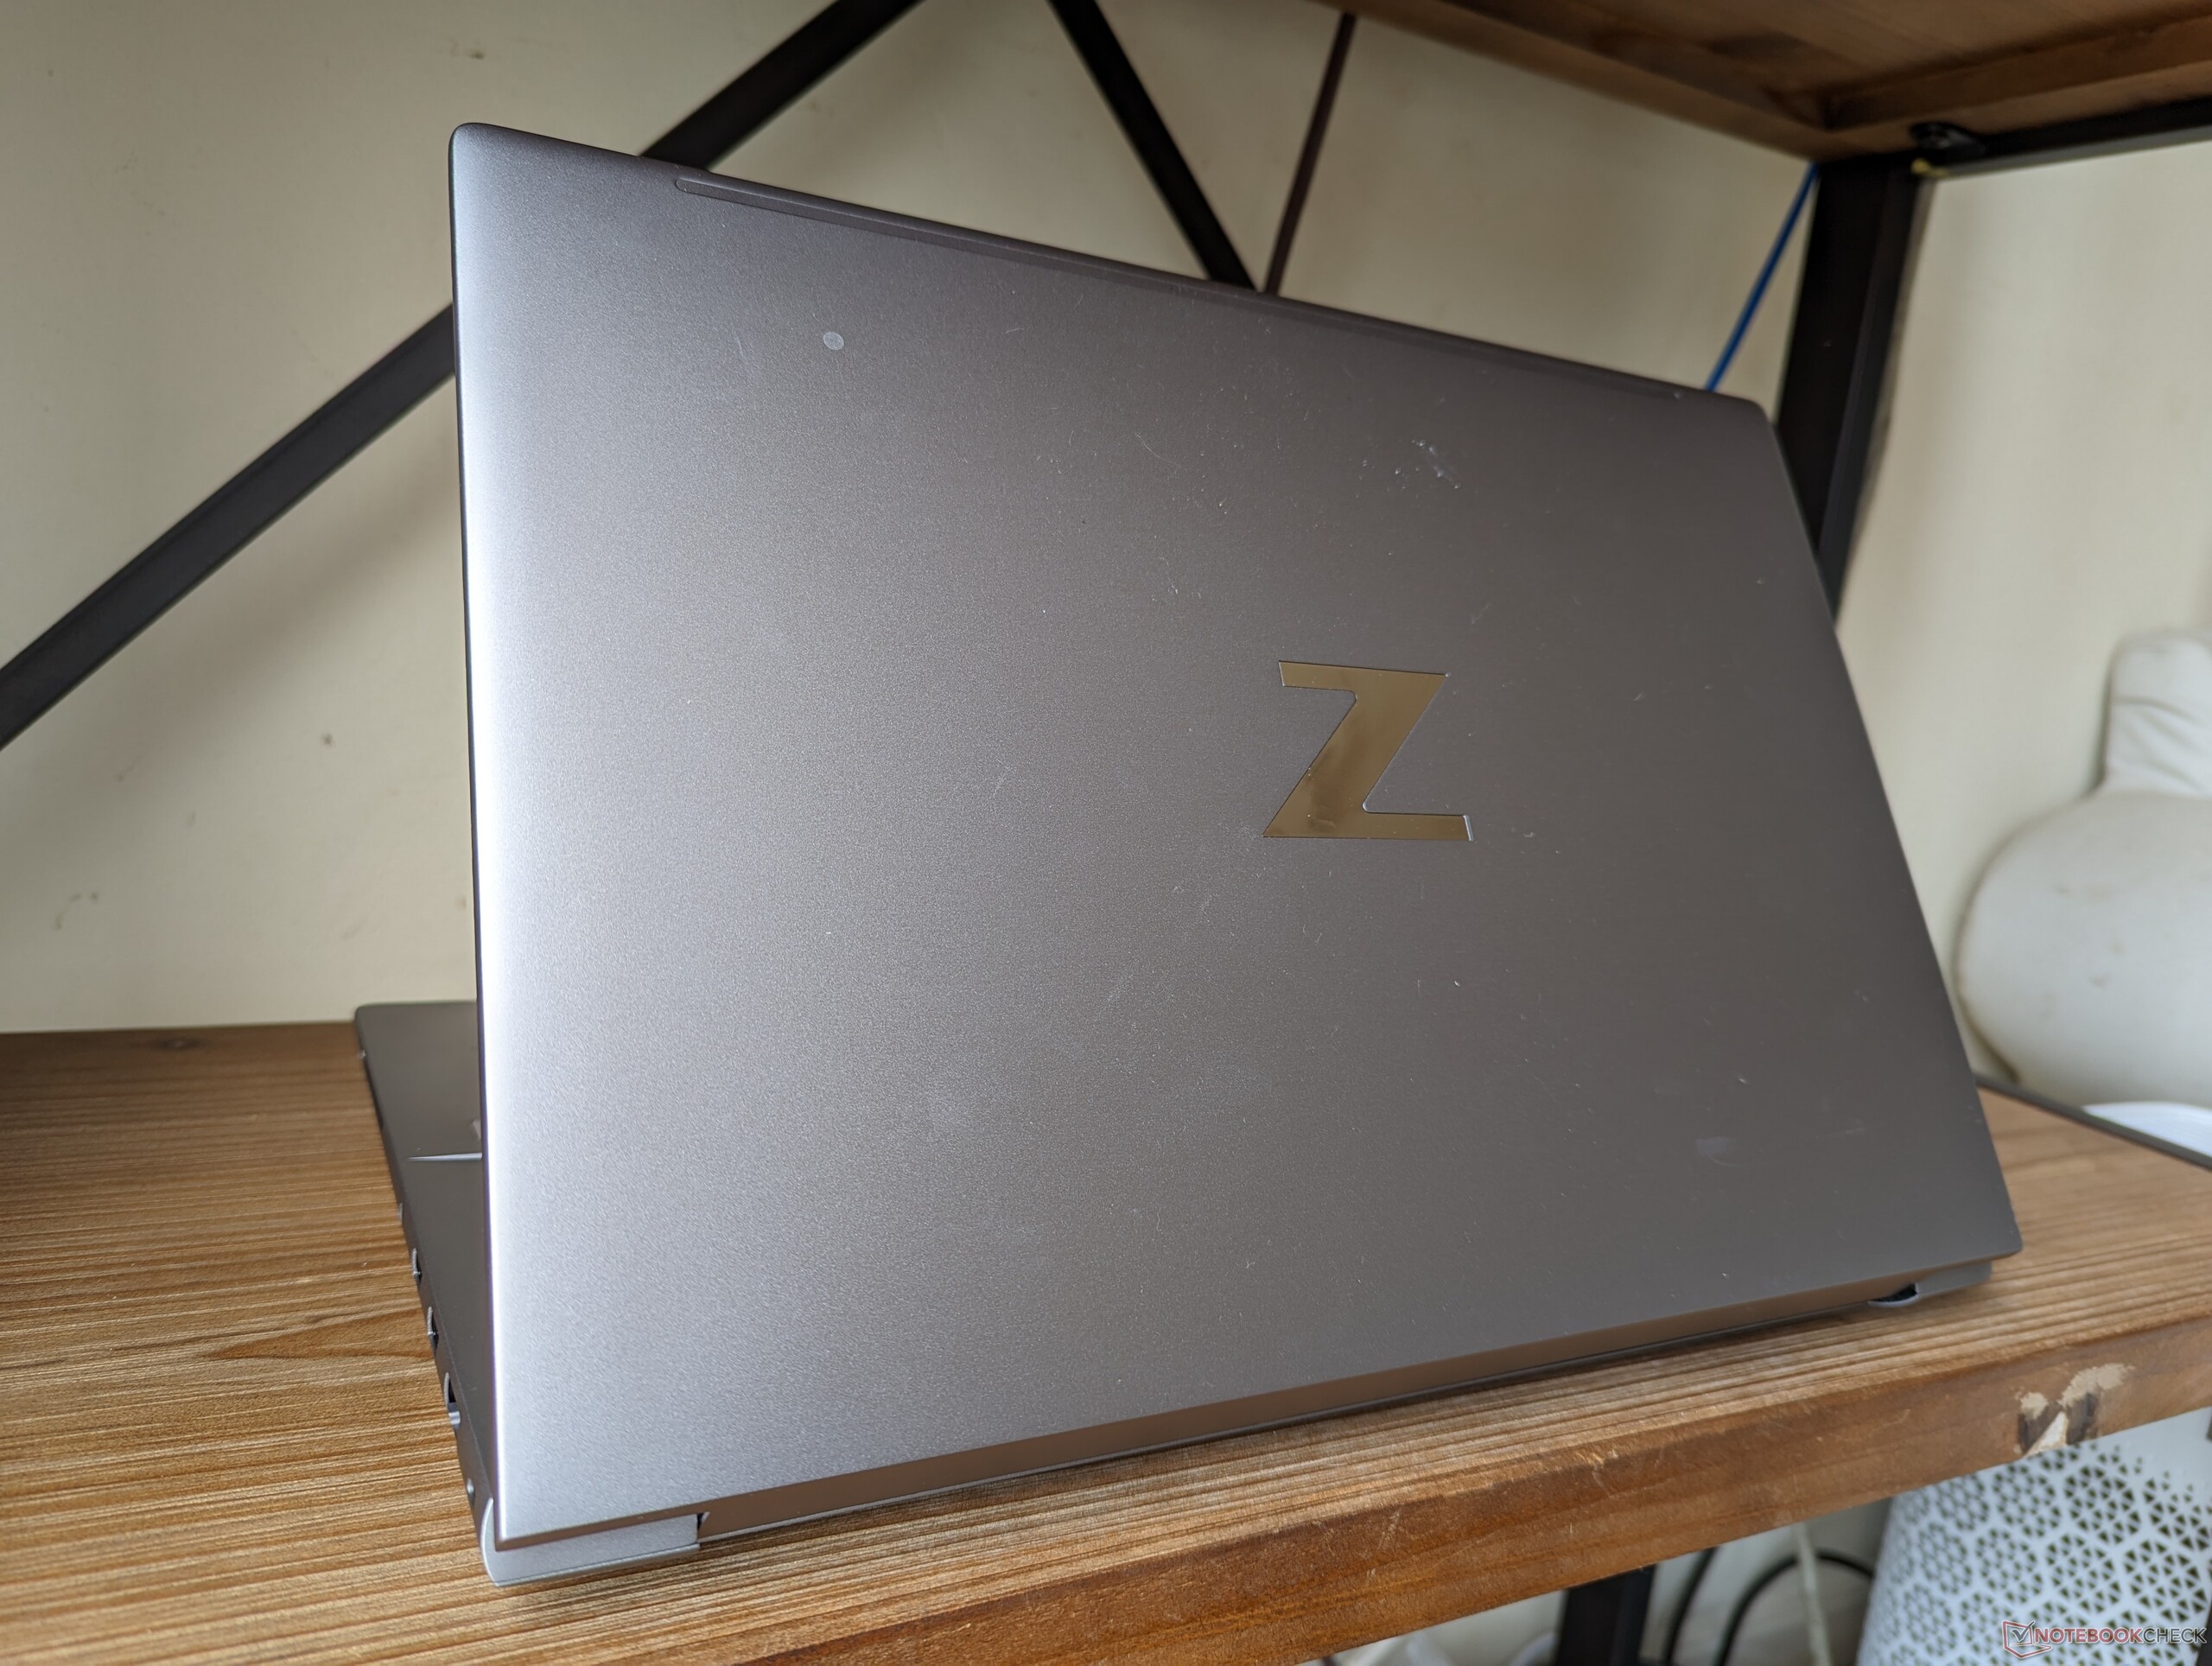
案例 - 经典ZBook
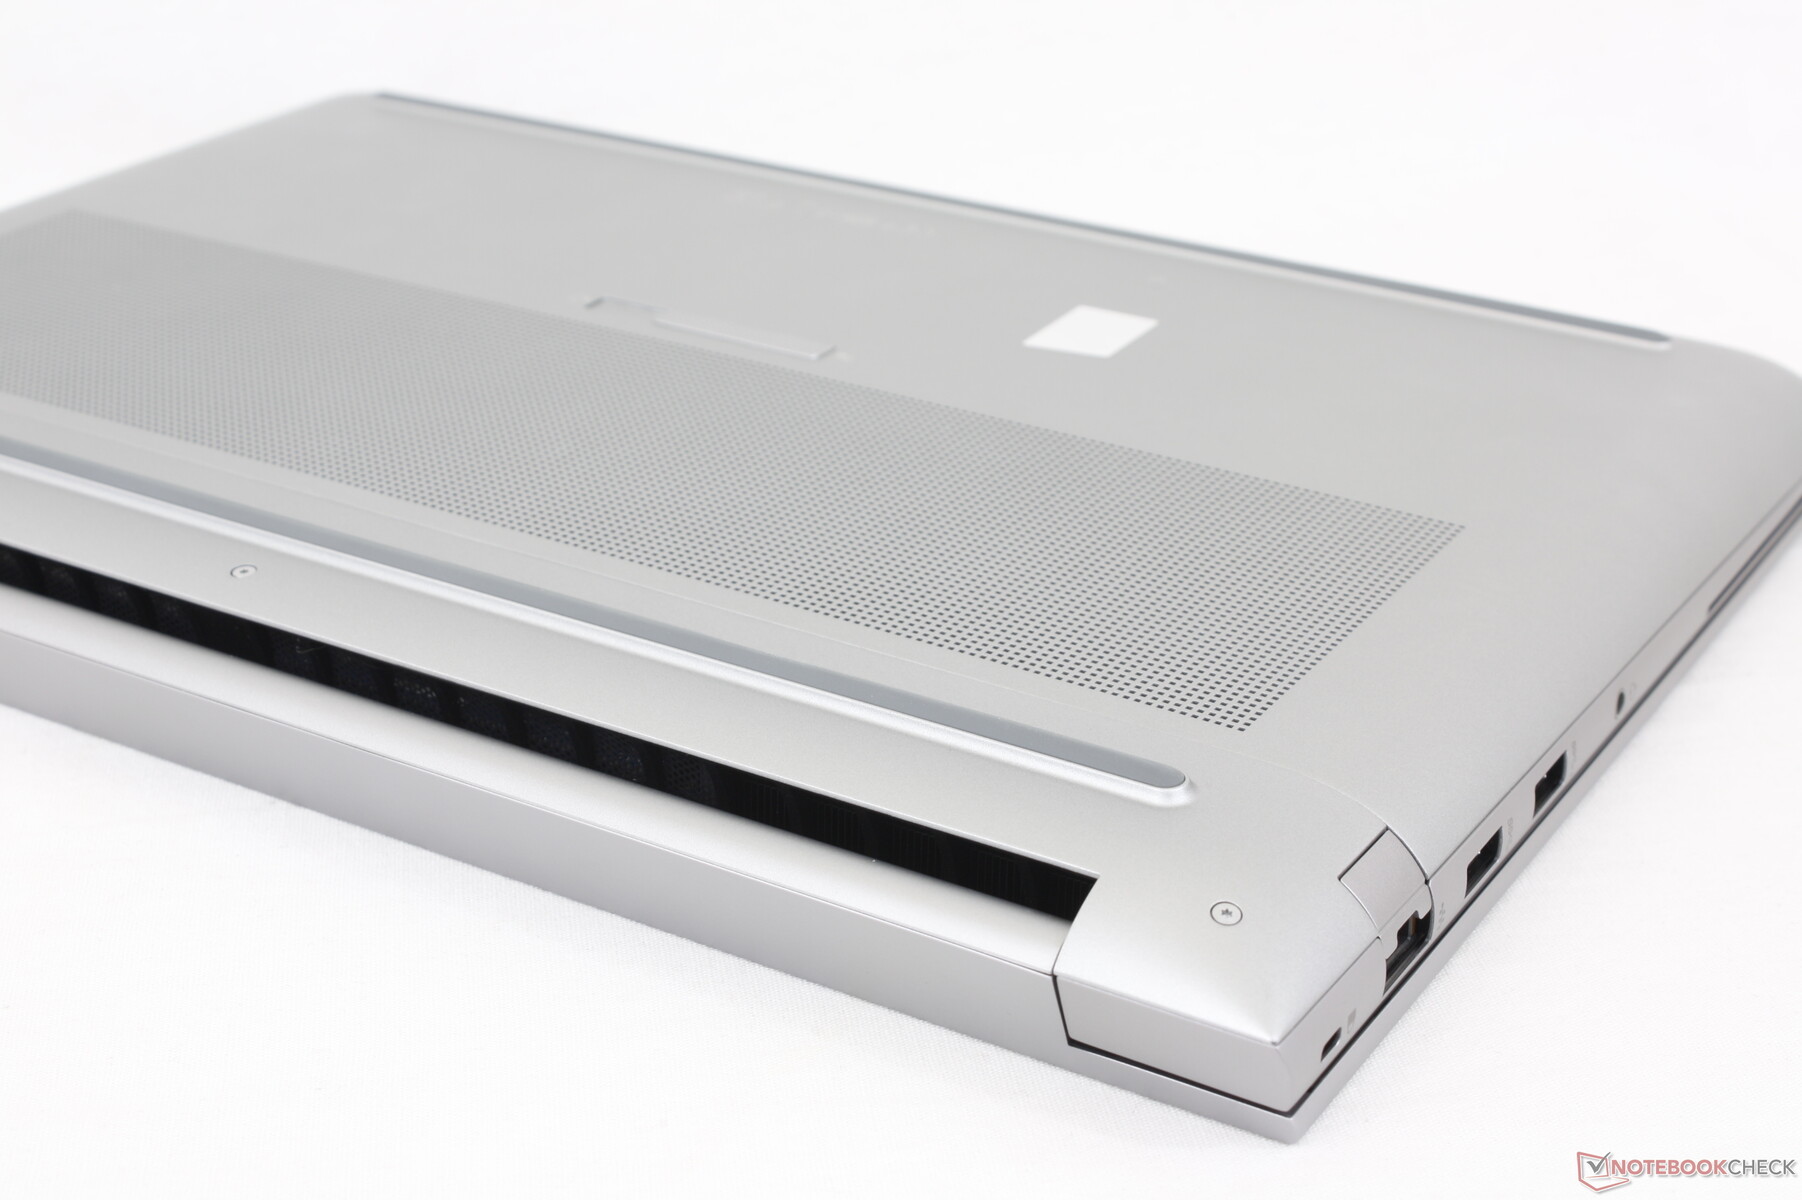
机箱由ZBook用户已经熟悉的相同的铝合金材料组成。扭曲、翘曲和吱吱作响的情况很少,可以与 Precision 7670给人以强烈的第一印象,没有问题的地方。当对外盖中心的 "Z "标志所在的位置施加压力时,弯曲是最明显的,但这并不是造成任何长期担忧的原因。
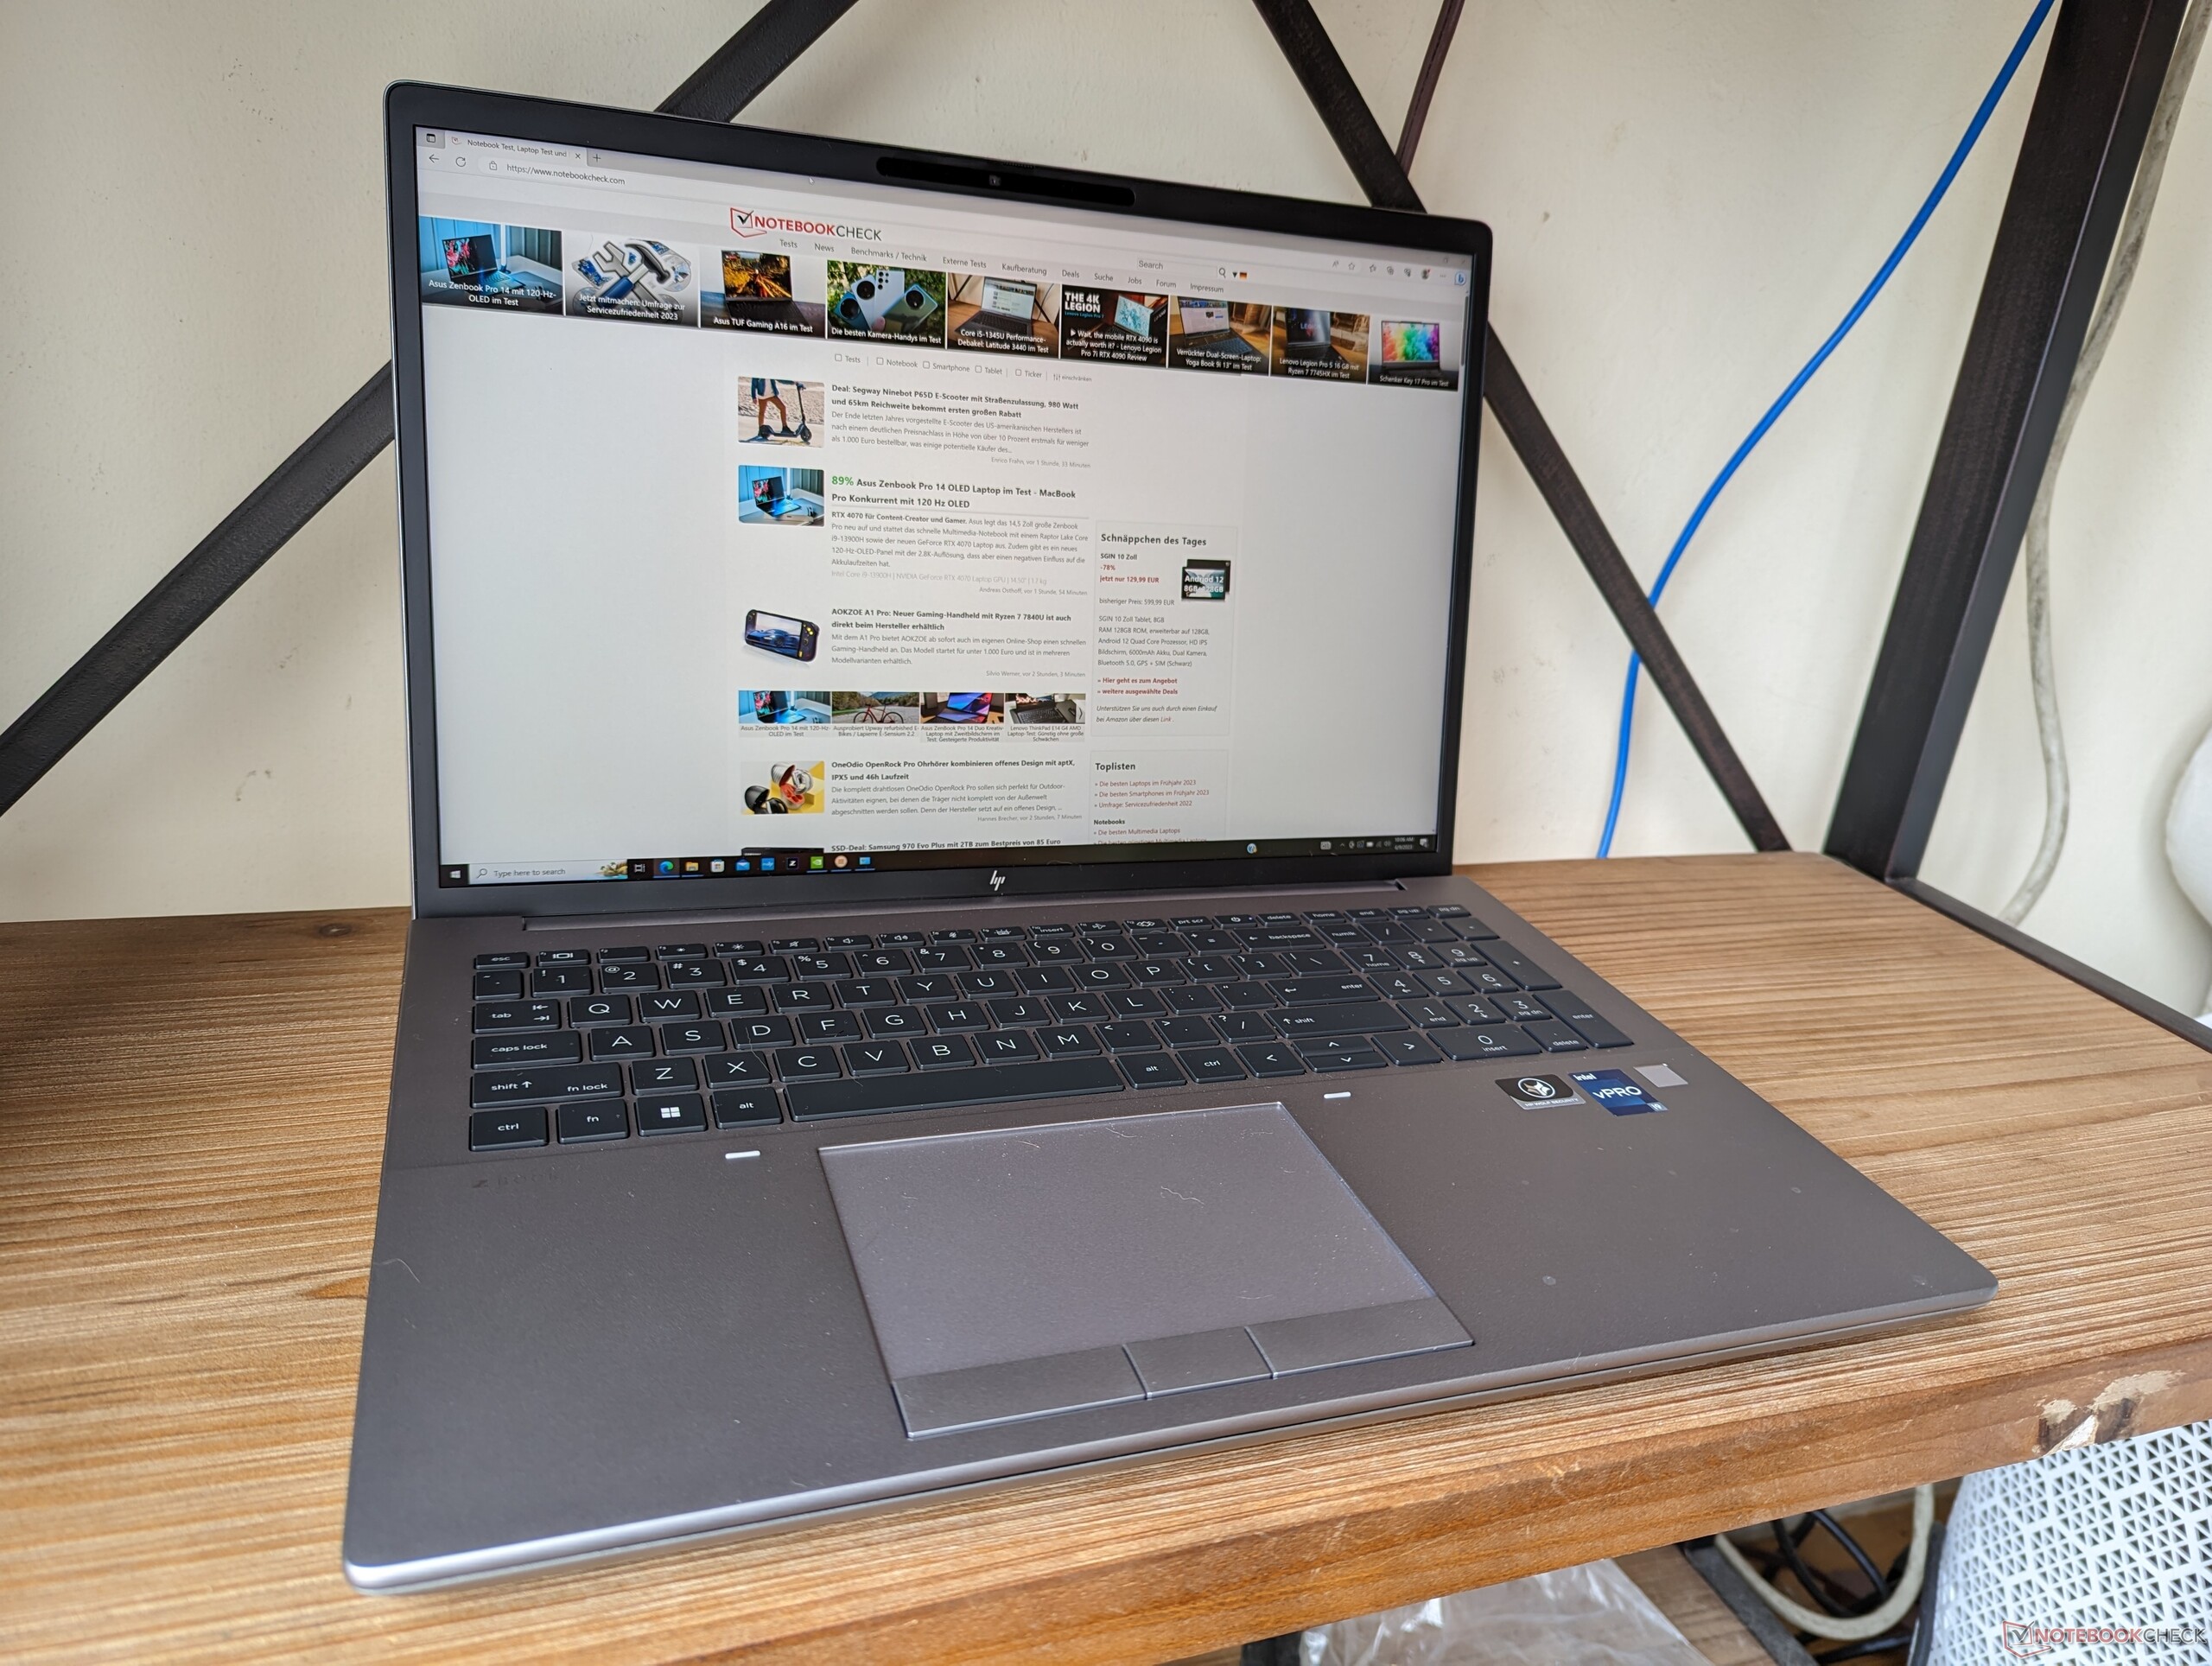
惠普的重量明显比两款产品都要轻。ThinkPad P16 G1和Precision 7670,尽管它们都有类似的CPU和GPU选项。然而,这是以性能为代价的,正如我们下面的基准比较所显示的。如果想要更便携,用户可以考虑更薄的ZBook Firefly 16 G9或ZBook Studio 16 G9。
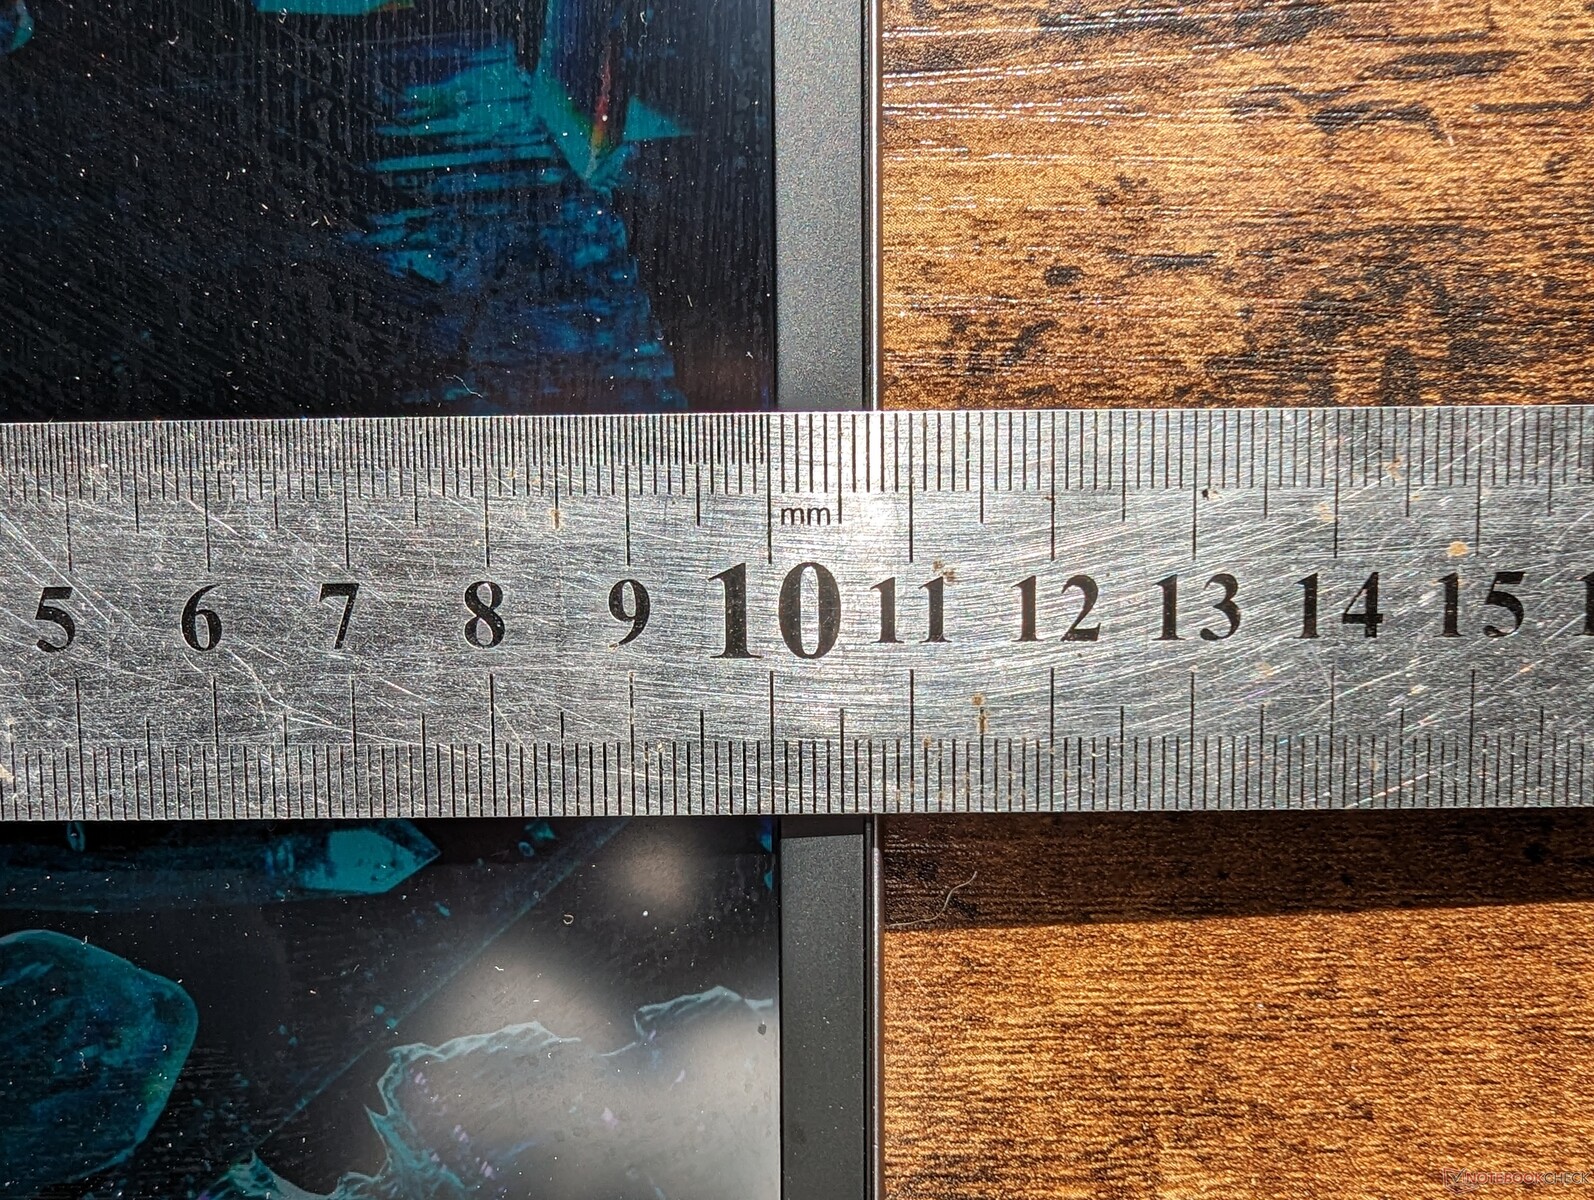
Fury G9的底边框对于工作站来说出乎意料地窄,这导致该机型的长度比其他大多数16英寸的替代品短。
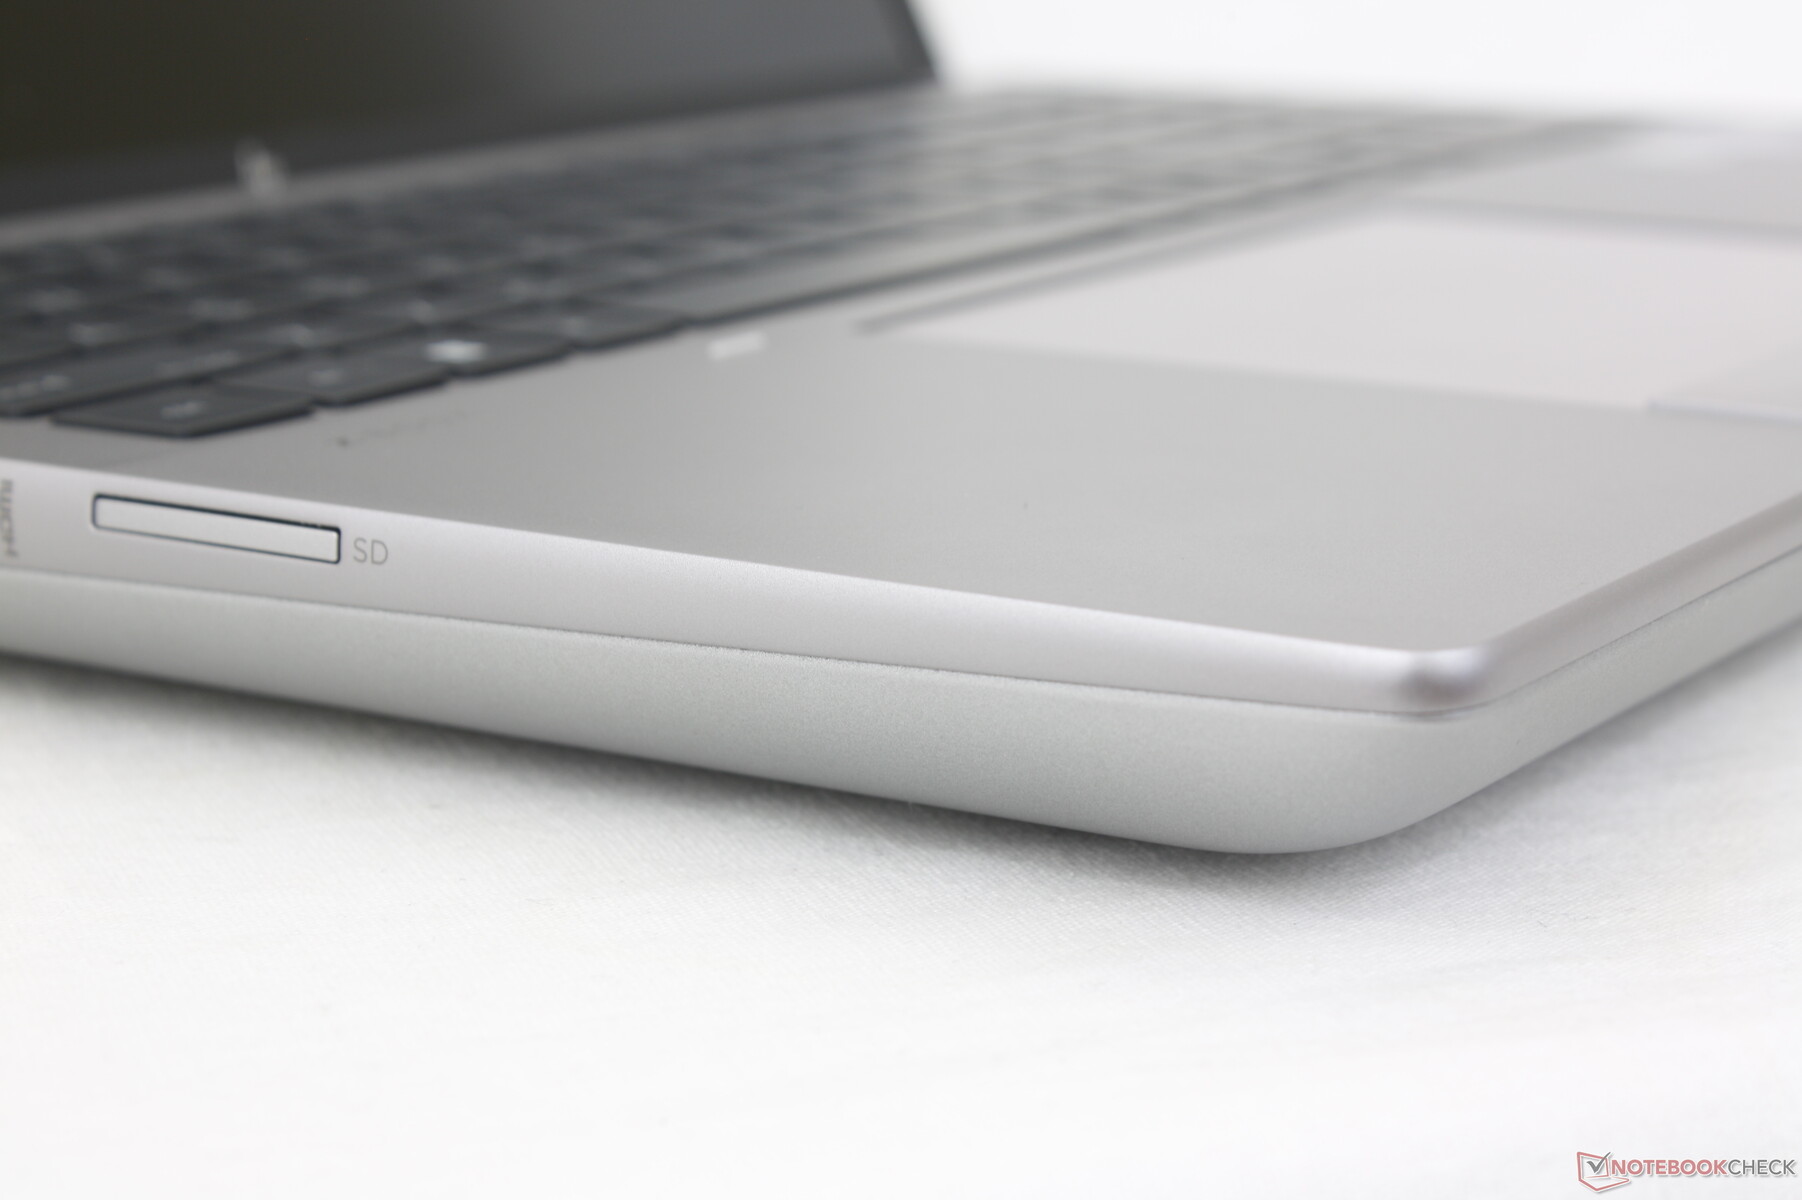
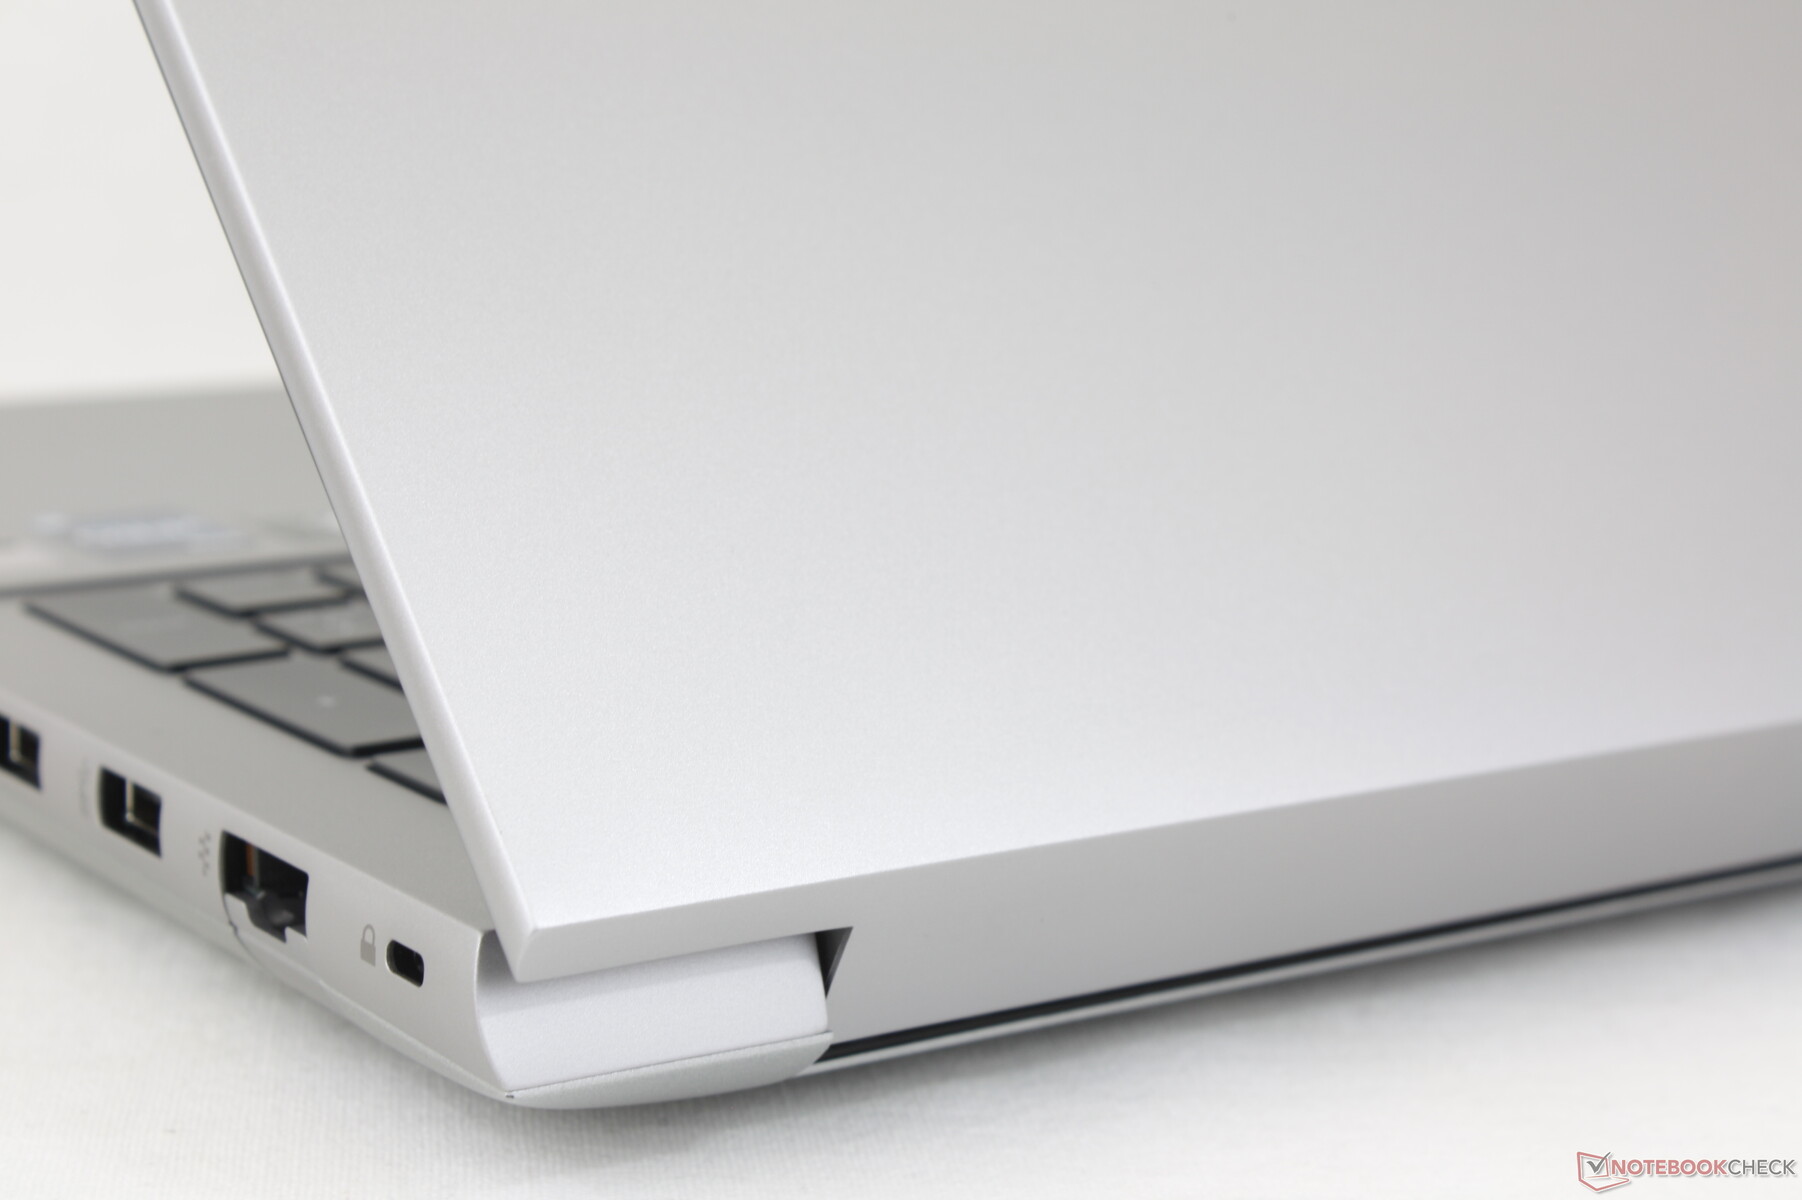
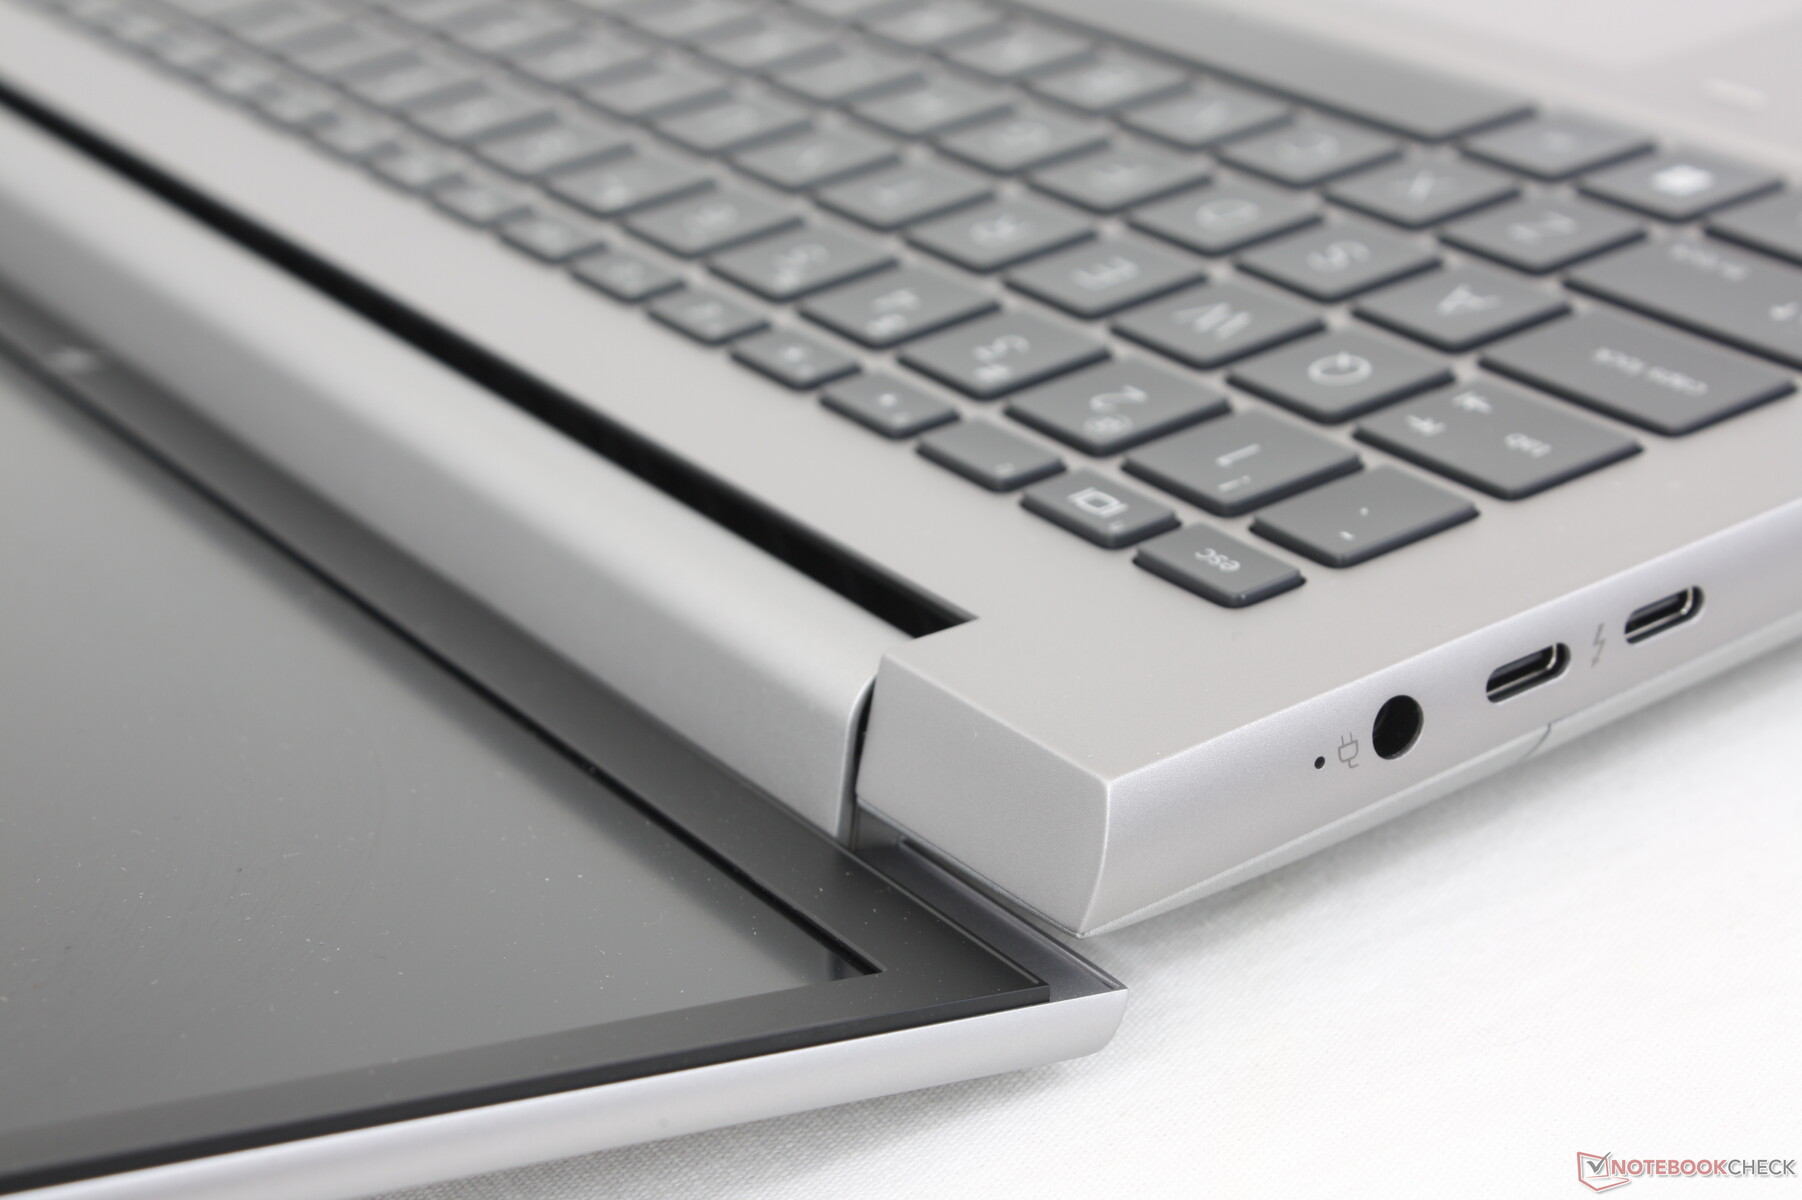
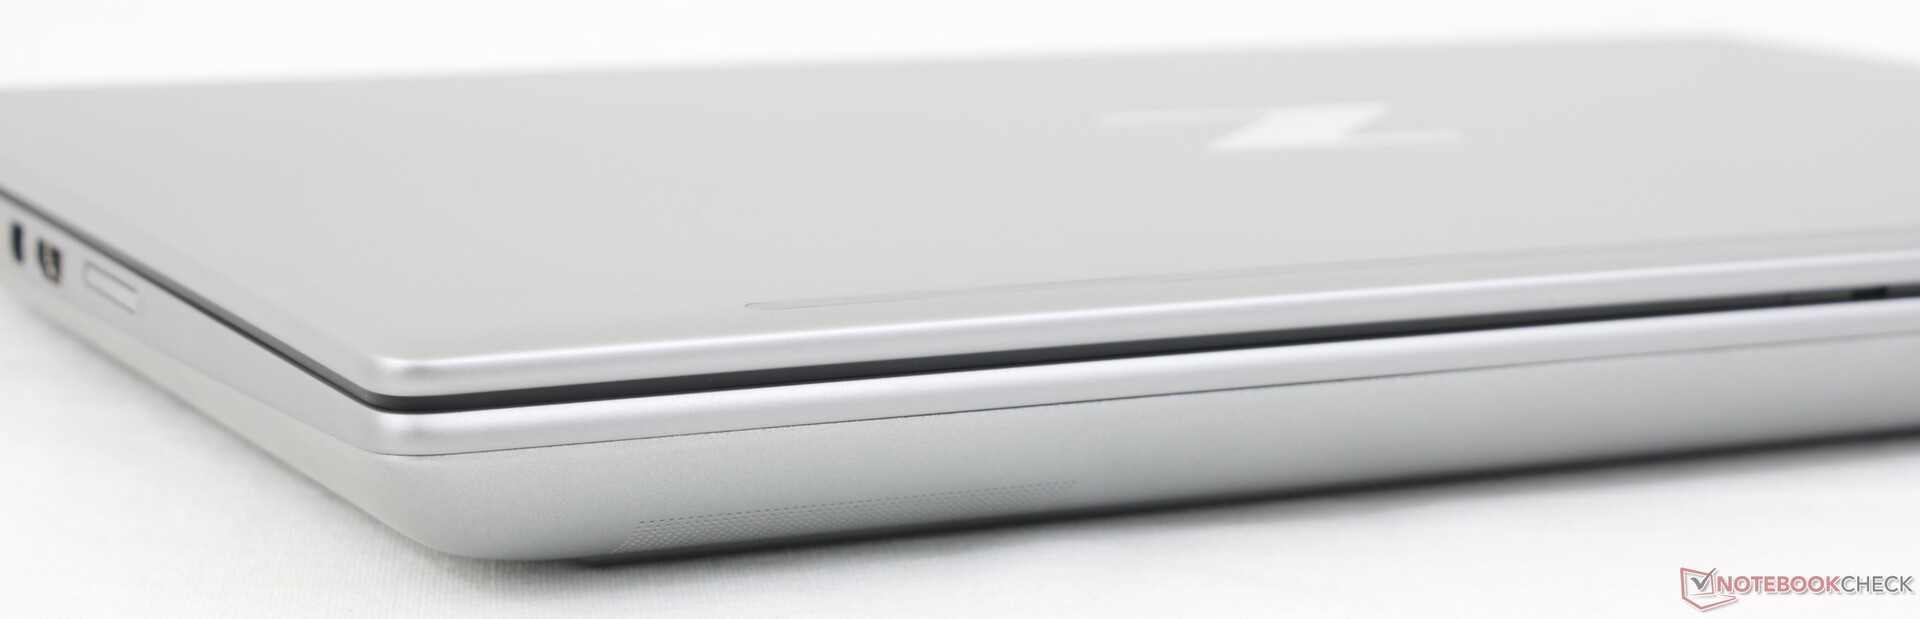
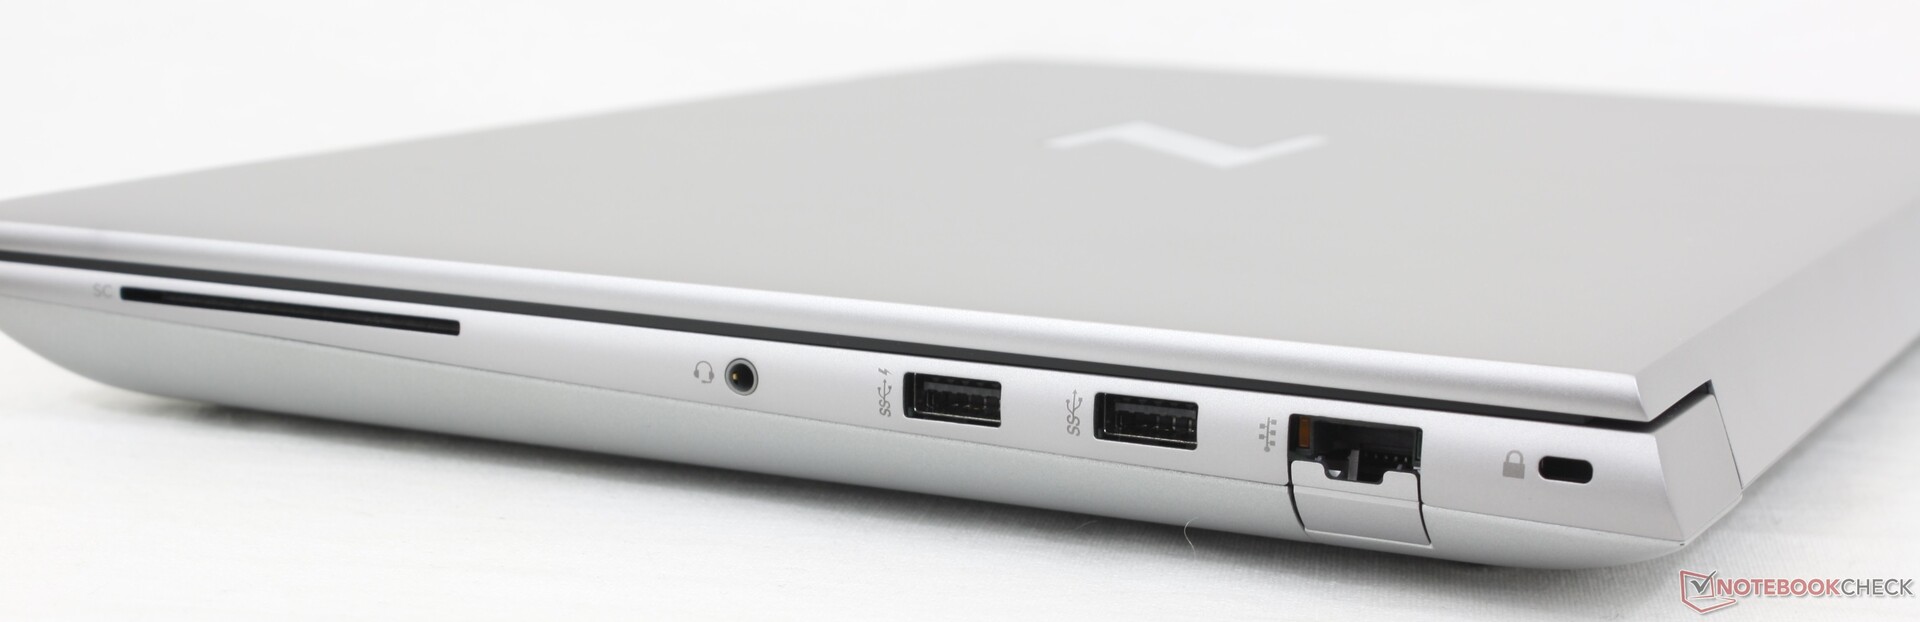
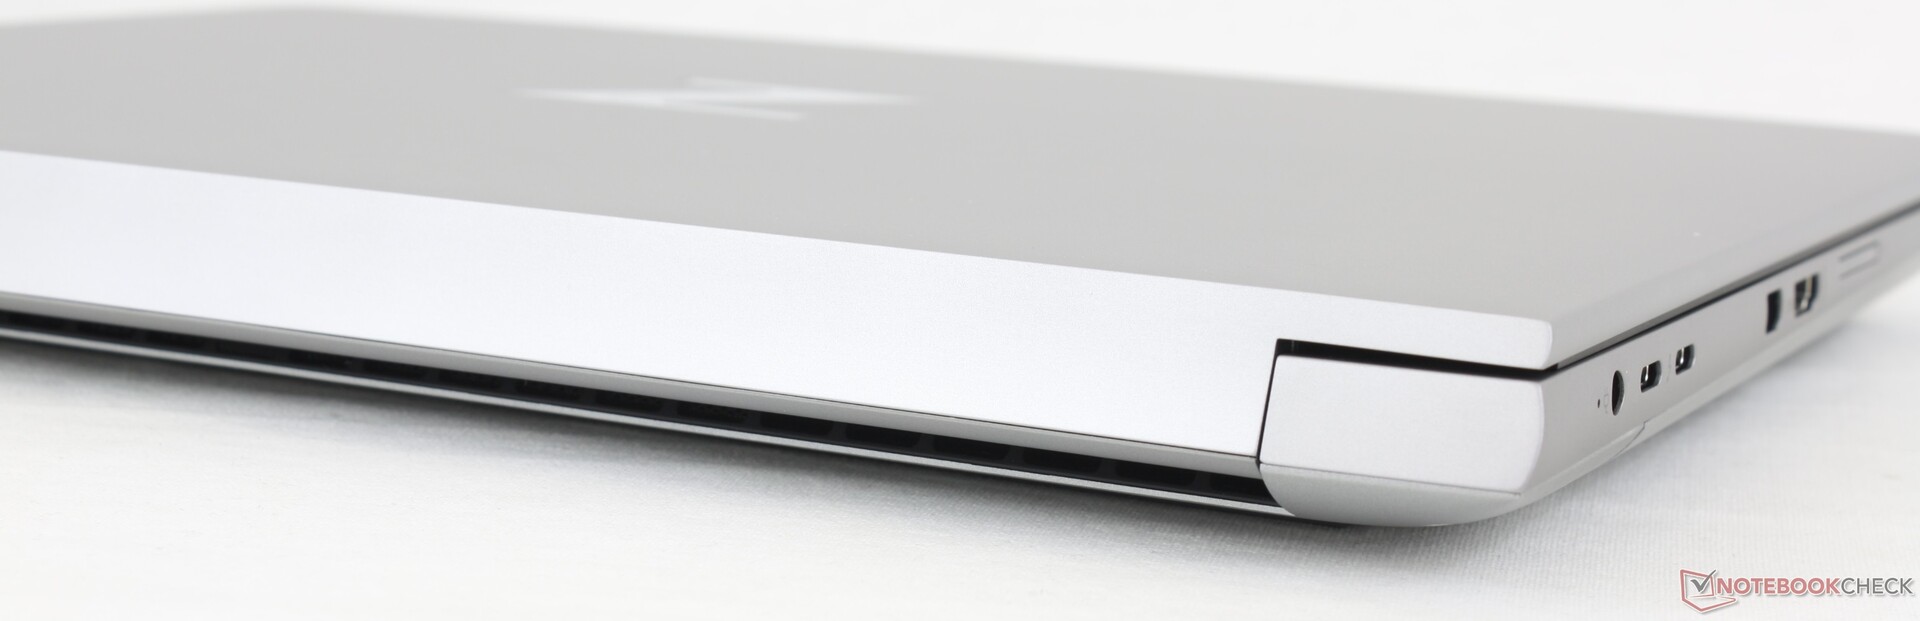
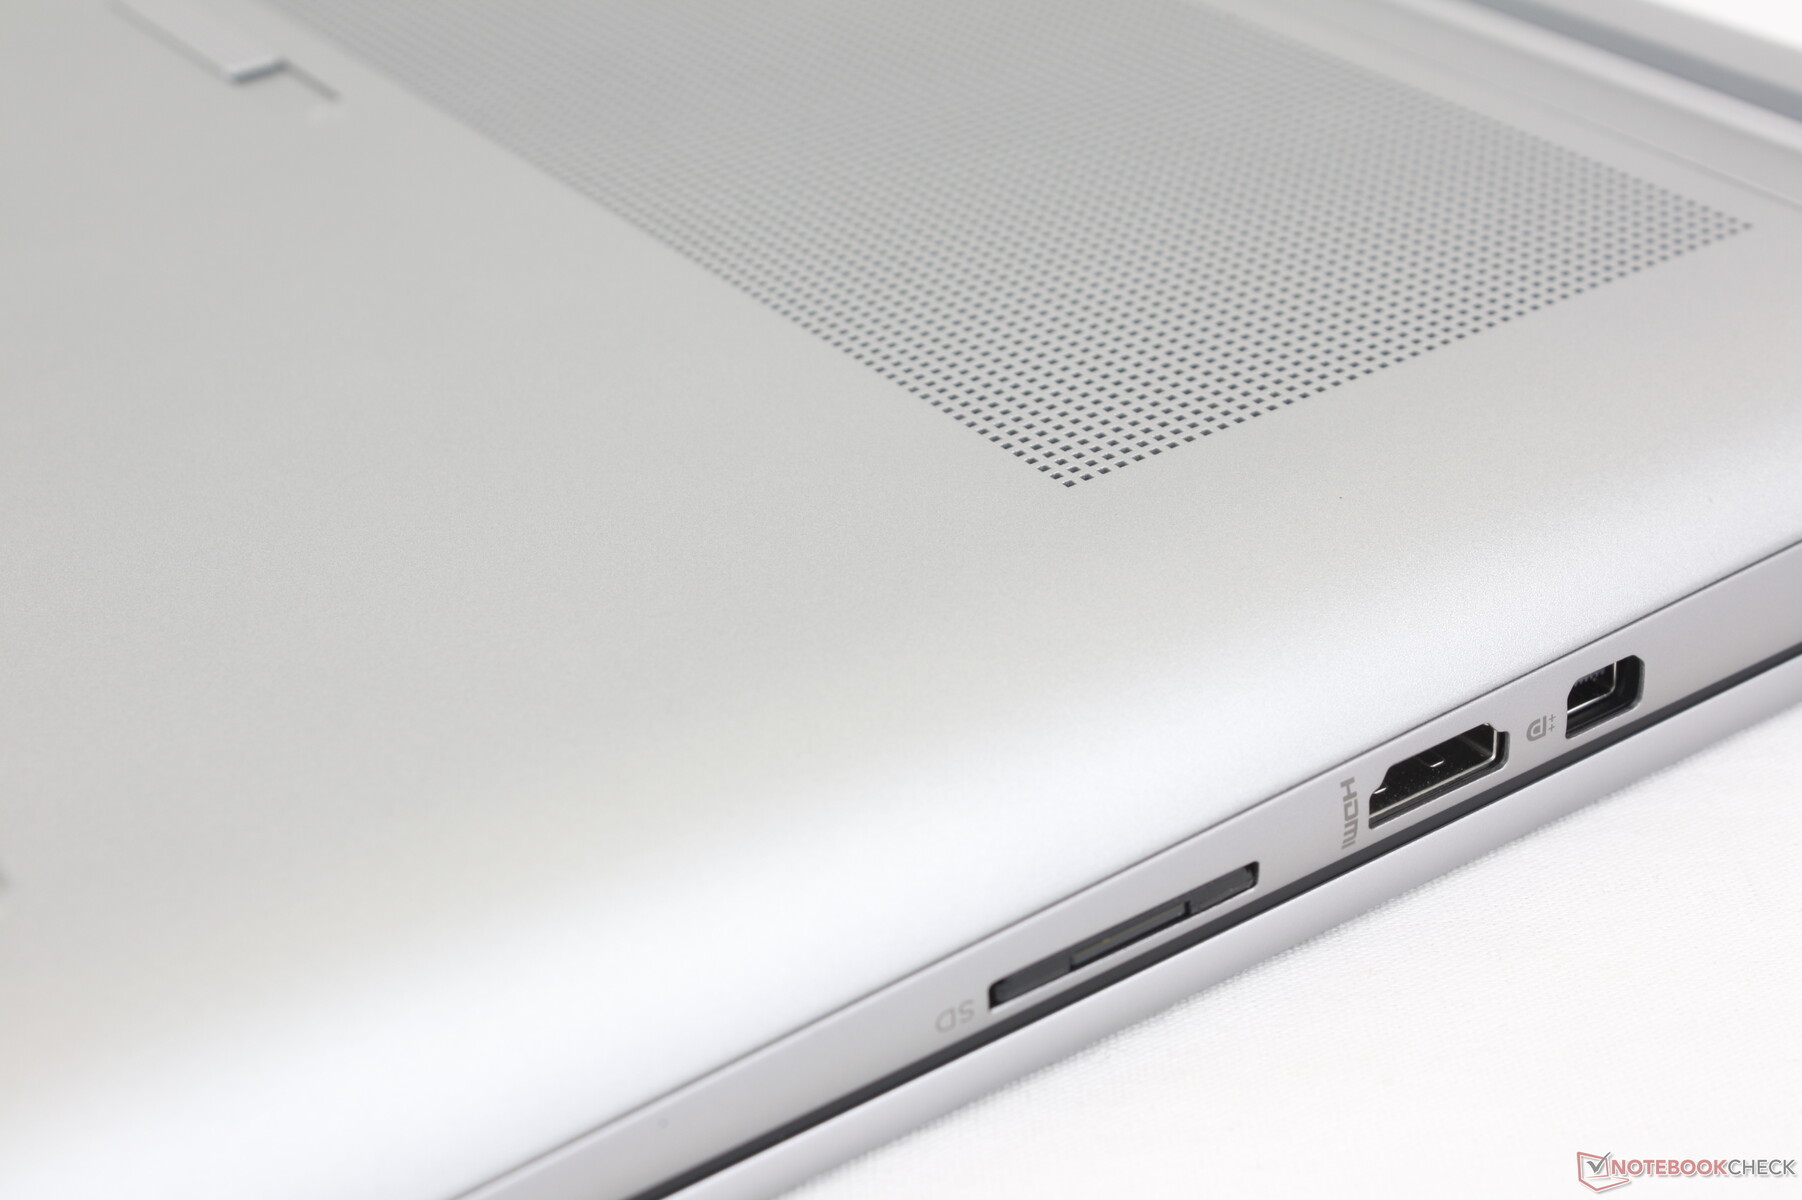
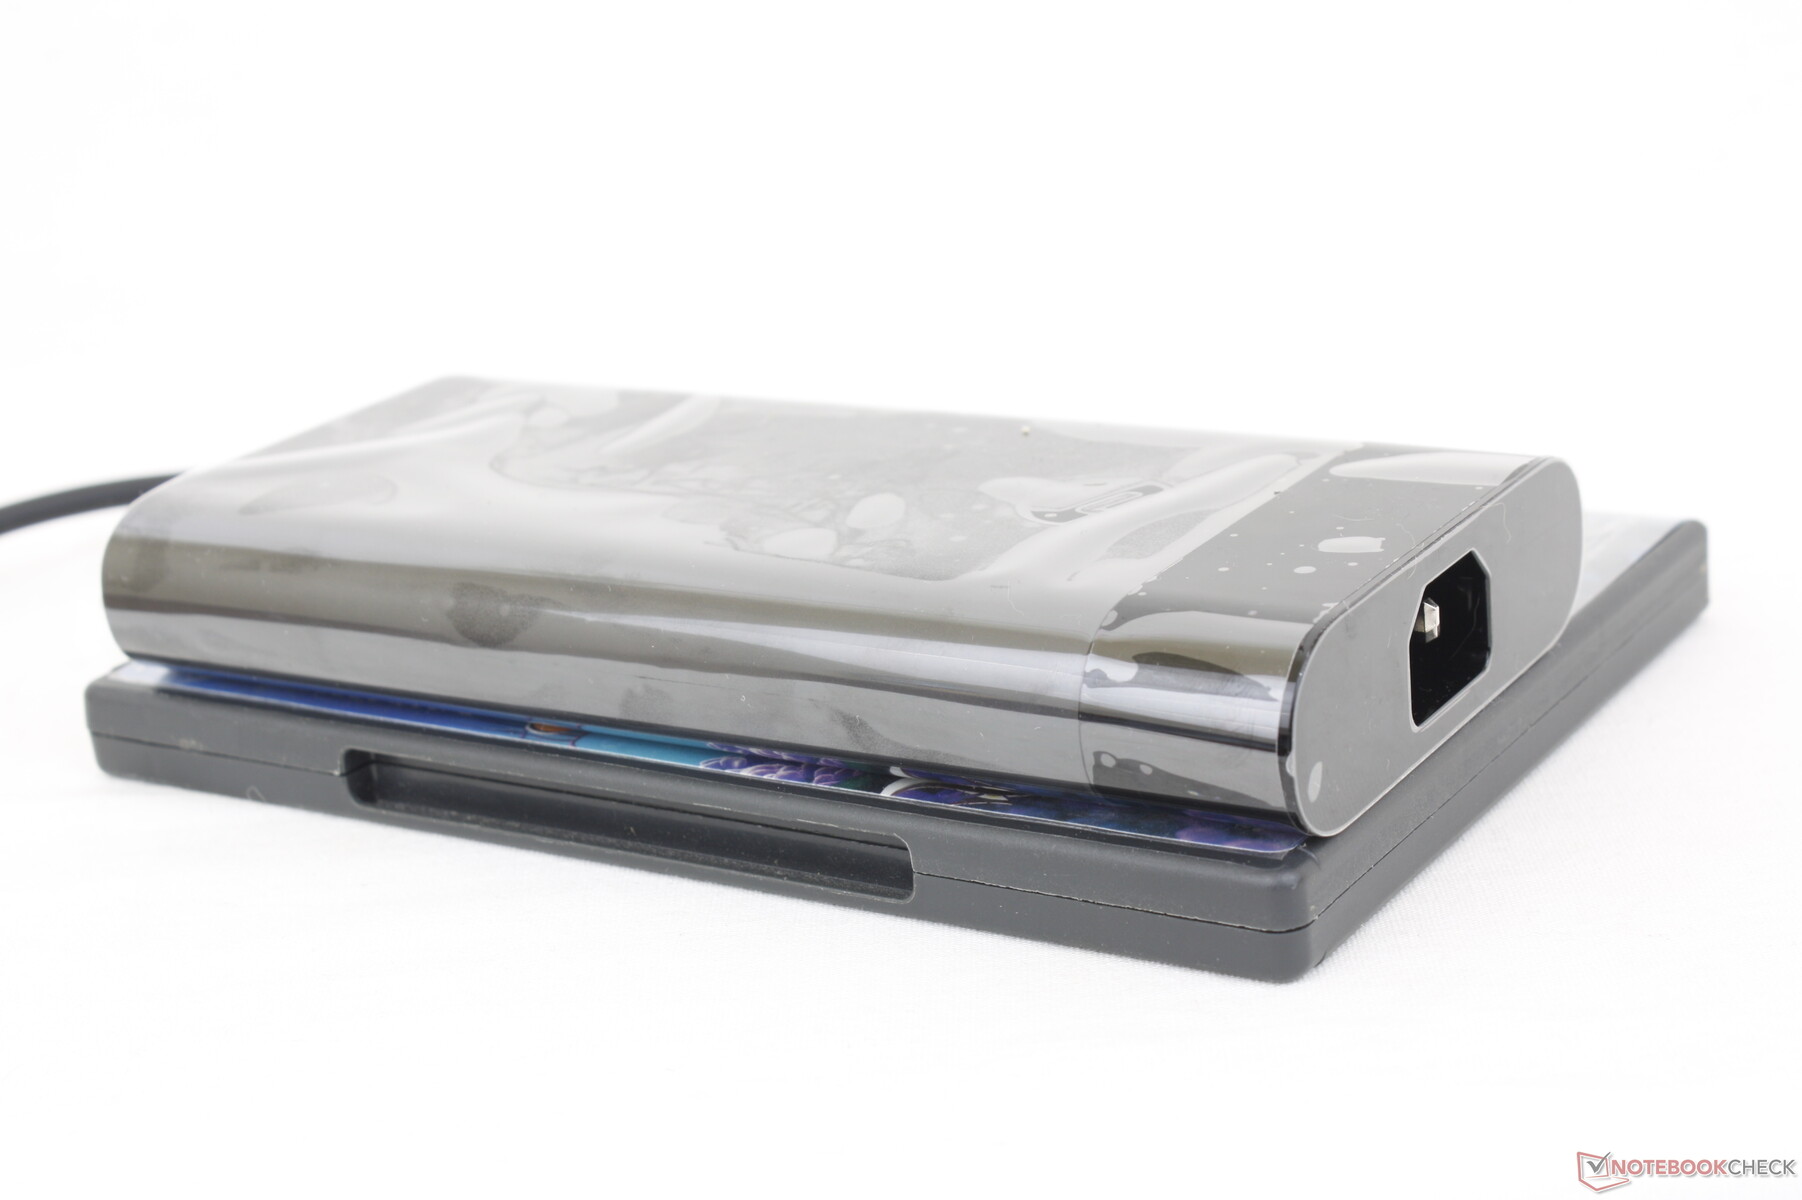
连接性
我们的惠普包括Precision 7670上的所有端口,但有一个集成的迷你显示端口来代替第三个USB-C端口。事实上,这是为数不多的具有迷你显示端口选项的移动工作站之一。
两个USB-C端口的位置本来可以做得更好,因为它们被紧紧地挤在交流适配器端口旁边。例如,在一个端口上插入某些适配器或电缆,有可能会阻碍其他两个端口的使用。
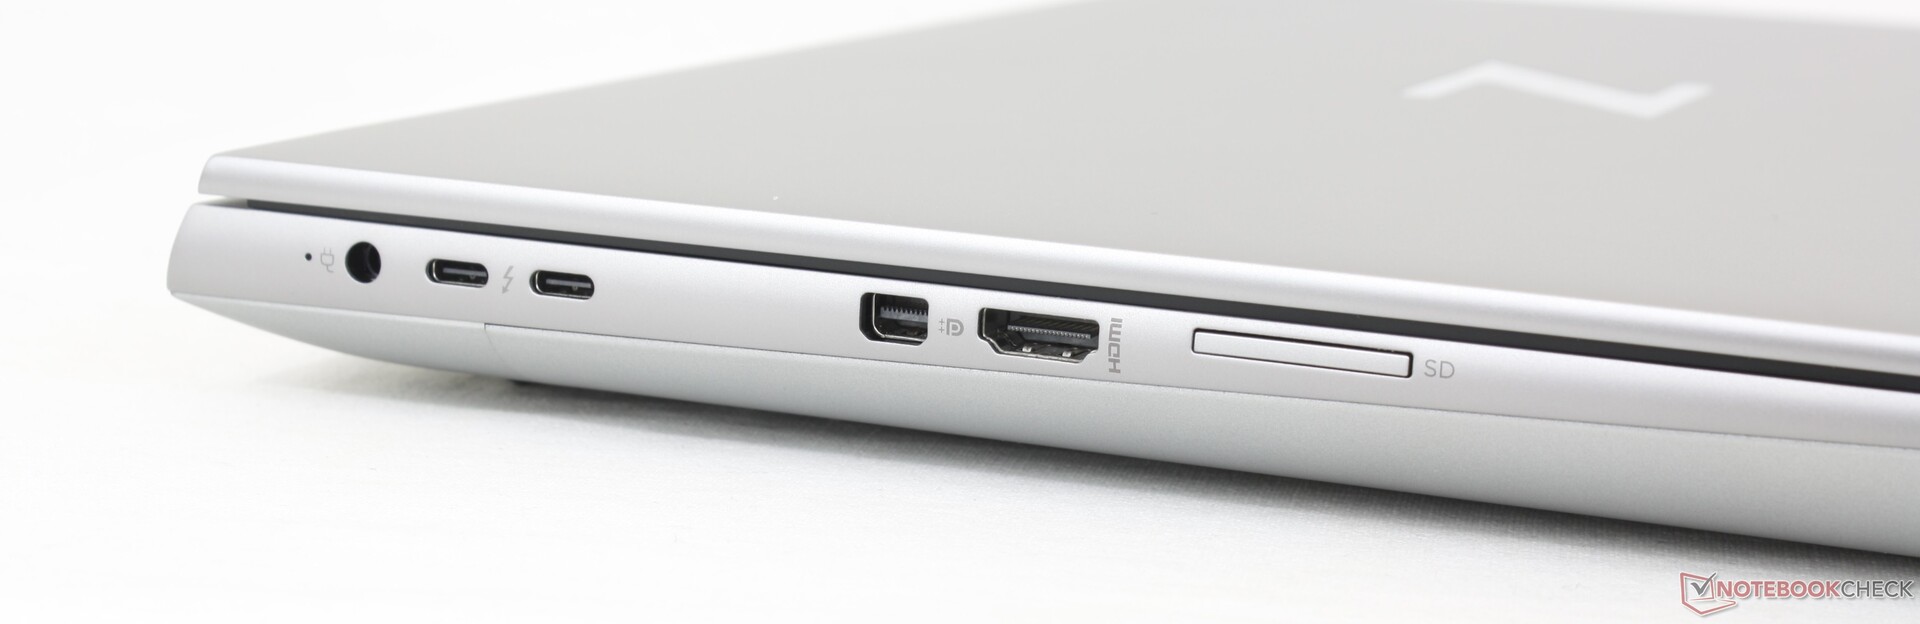
SD卡阅读器
我们的PNY EliteX-PRO60测试卡的传输速率最高约为80MB/s,尽管该卡的传输速率高达280MB/s。相比之下,Precision 7670上的集成SD读卡器要快2倍以上。依靠SD卡进行视频和文件传输的用户可能会对Fury 16 G9在这方面感到失望。
| SD Card Reader | |
| average JPG Copy Test (av. of 3 runs) | |
| Dell Precision 7000 7670 Performance (Toshiba Exceria Pro SDXC 64 GB UHS-II) | |
| MSI CreatorPro Z16P B12UKST (AV Pro V60) | |
| HP ZBook Fury 16 G9 (PNY EliteX-PRO60) | |
| Lenovo ThinkPad P16 G1 RTX A5500 (Toshiba Exceria Pro SDXC 64 GB UHS-II) | |
| HP ZBook Studio 16 G9 62U04EA (Angelbird AV PRO V60) | |
| maximum AS SSD Seq Read Test (1GB) | |
| Dell Precision 7000 7670 Performance (Toshiba Exceria Pro SDXC 64 GB UHS-II) | |
| HP ZBook Fury 16 G9 (PNY EliteX-PRO60) | |
| MSI CreatorPro Z16P B12UKST (AV Pro V60) | |
| Lenovo ThinkPad P16 G1 RTX A5500 (Toshiba Exceria Pro SDXC 64 GB UHS-II) | |
| HP ZBook Studio 16 G9 62U04EA (Angelbird AV PRO V60) | |
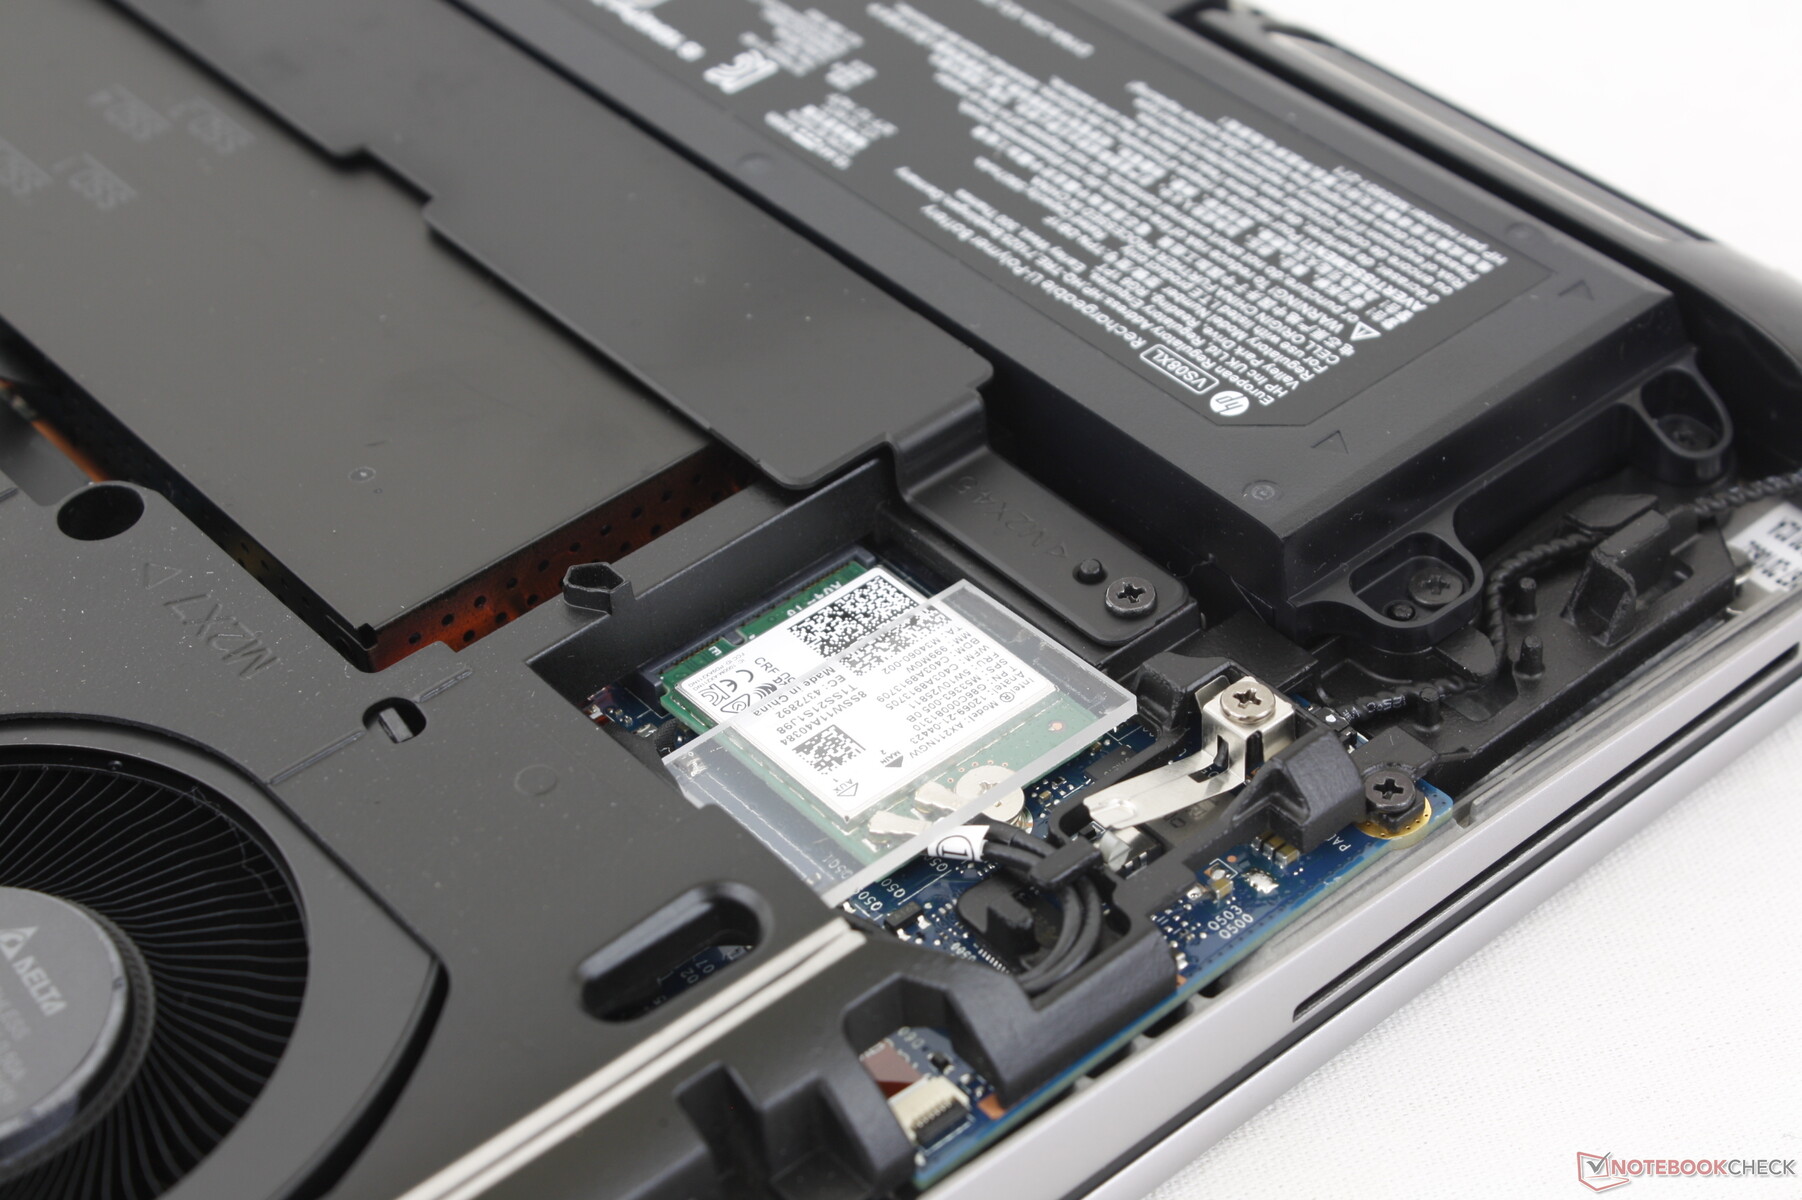
沟通
我们的Windows 10设备配备了英特尔AX211的Wi-Fi 6E和蓝牙5.2连接。不幸的是,Wi-Fi 6E在Windows 10上被禁用,因为微软已经(愚蠢地)使其为Windows 11所独有。因此,如果你想获得6GHz Wi-Fi的好处,你要用Windows 11进行配置。否则,当我们与常规Wi-Fi 6网络配对时,我们没有遇到任何性能问题。
网络摄像头
ZBook Fury 16 G9继承了最新的5MP网络摄像头。 和EliteBook 和EliteBook机型上的500万像素网络摄像头。与其他大多数笔记本电脑相比,图像质量更加清晰,其中100万像素和200万像素的传感器仍然很普遍,包括竞争者ThinkPad P16和Precision 7670。
滑动快门和红外传感器分别用于保护隐私和支持你好。


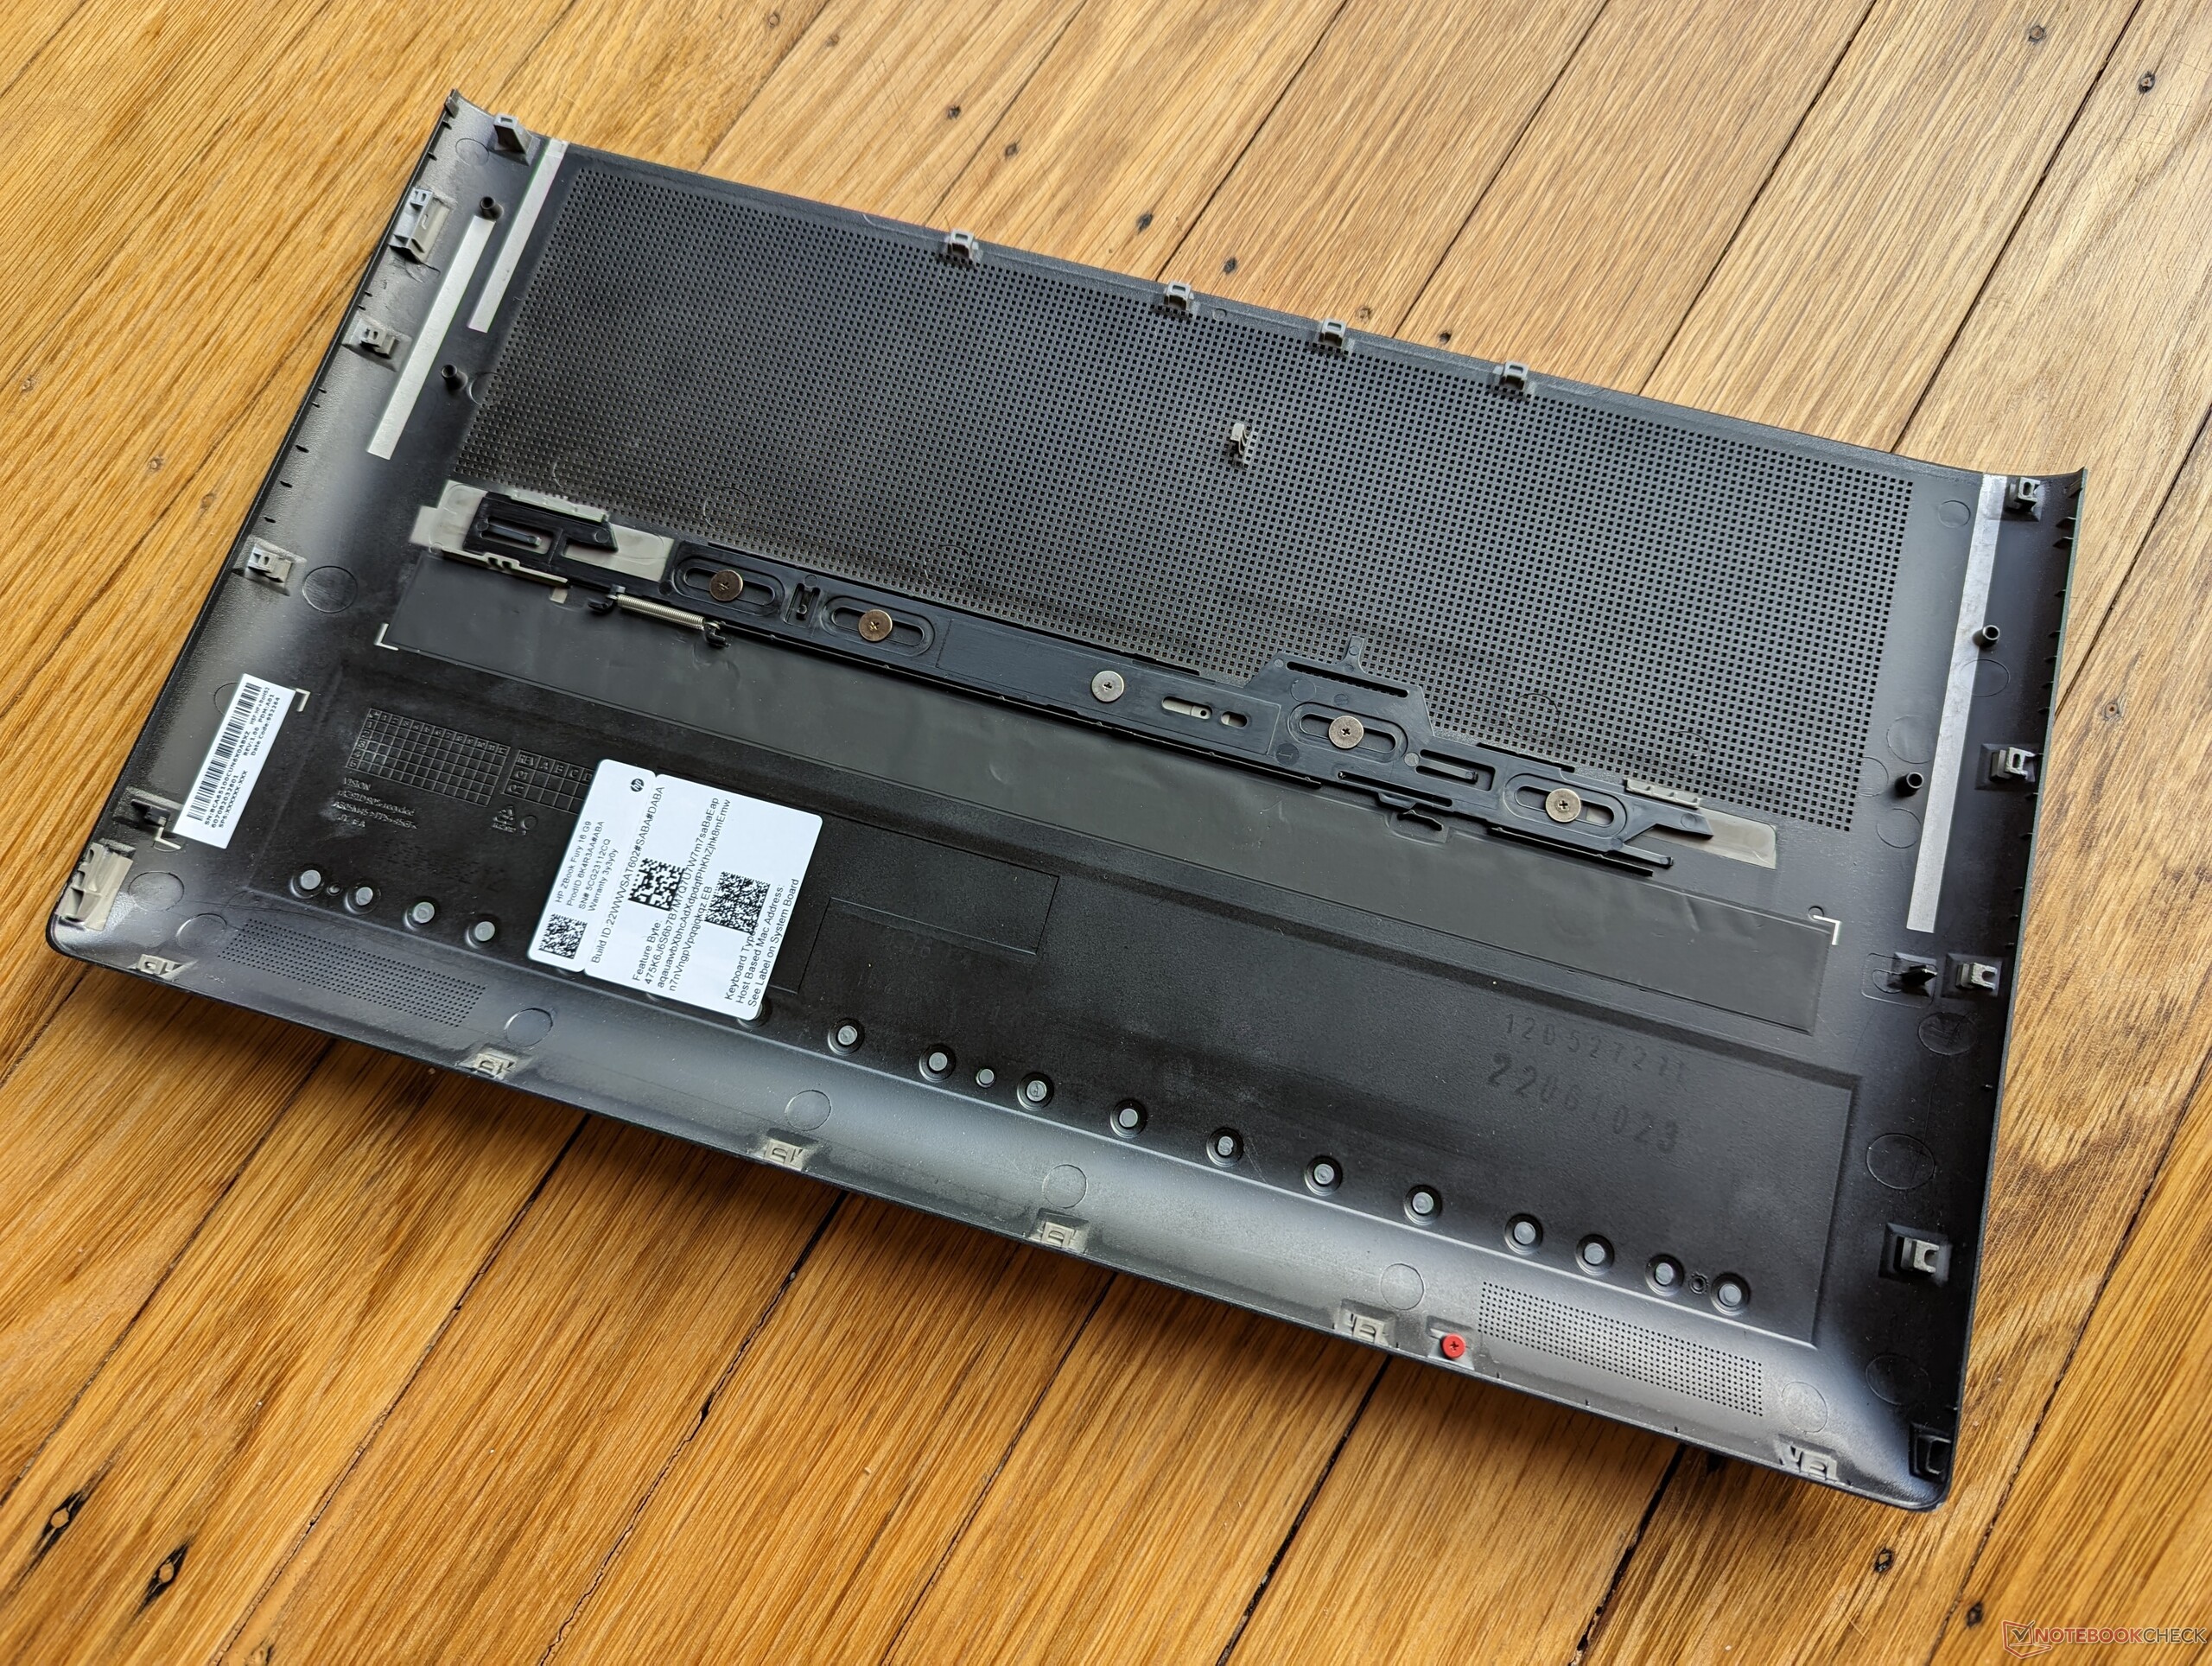
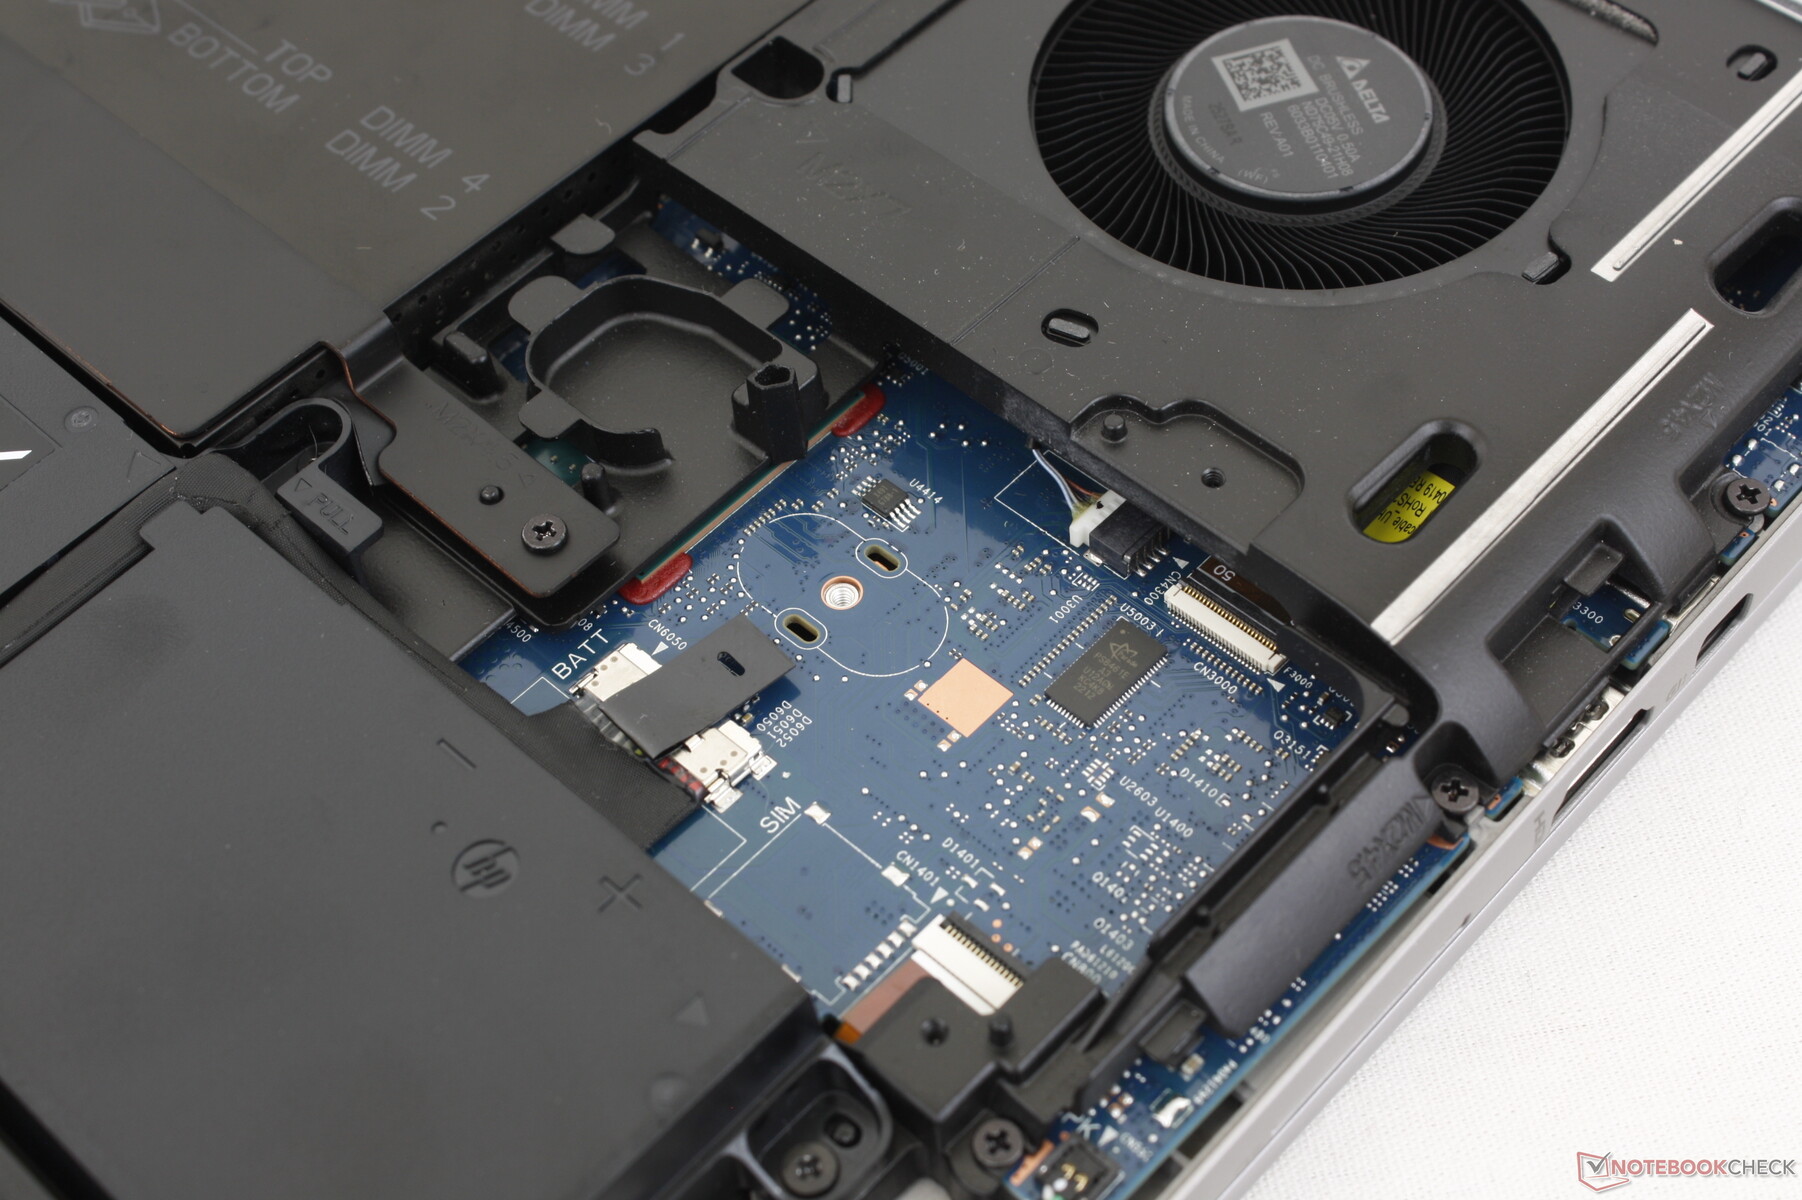
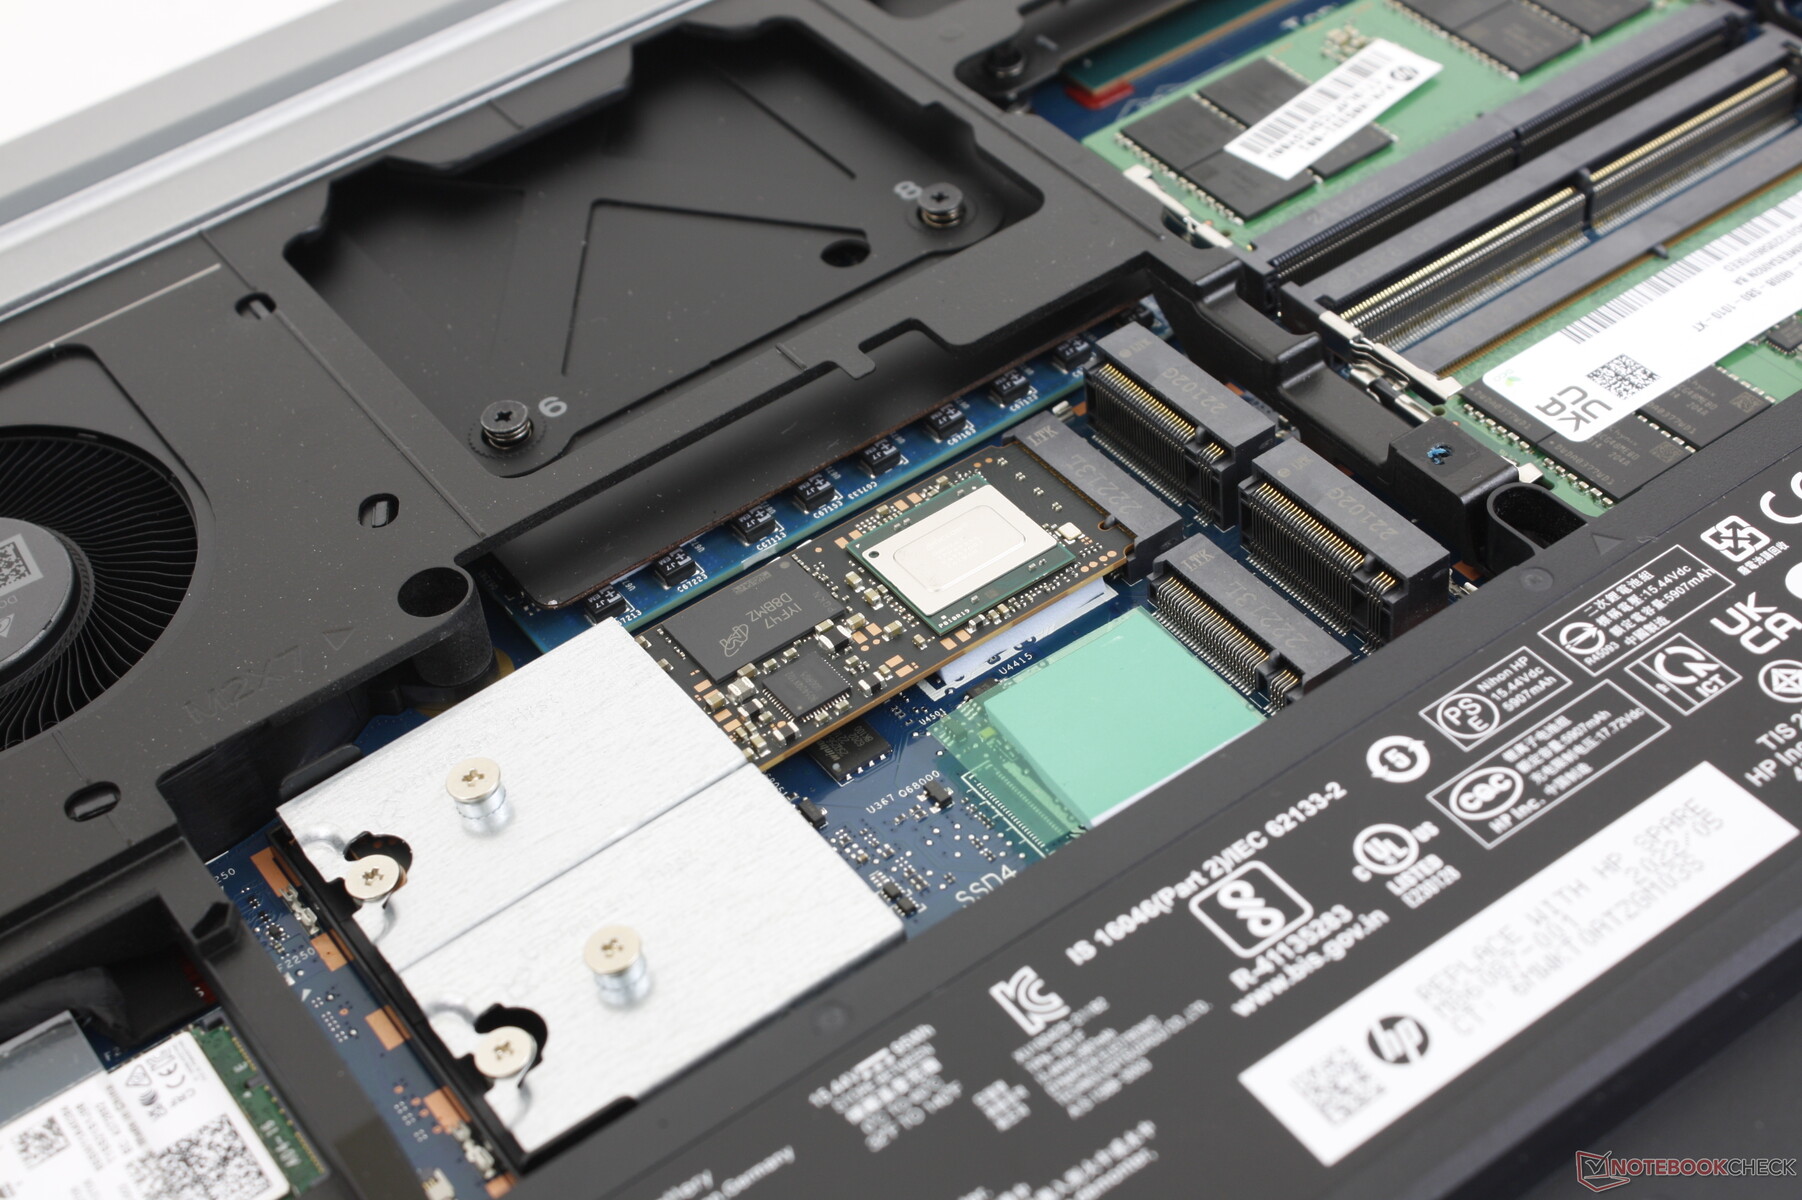
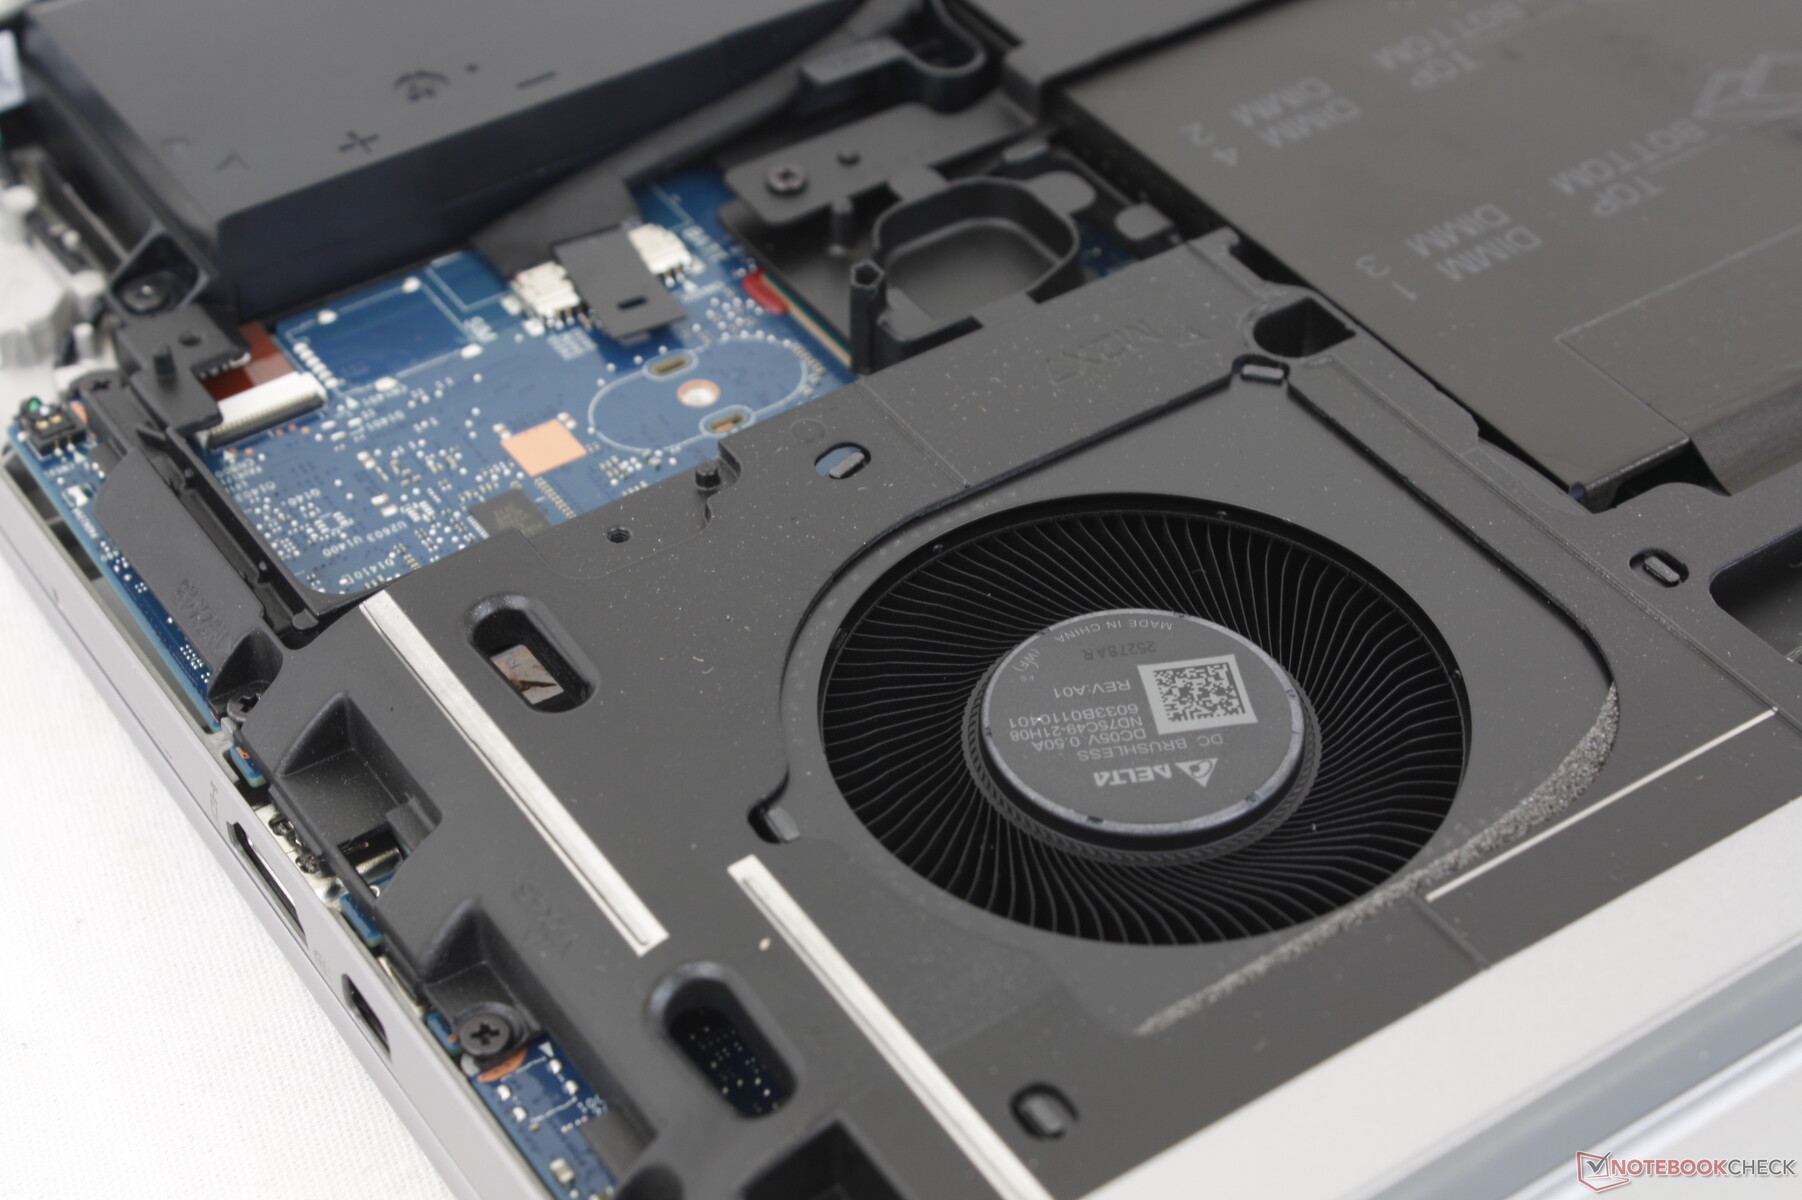
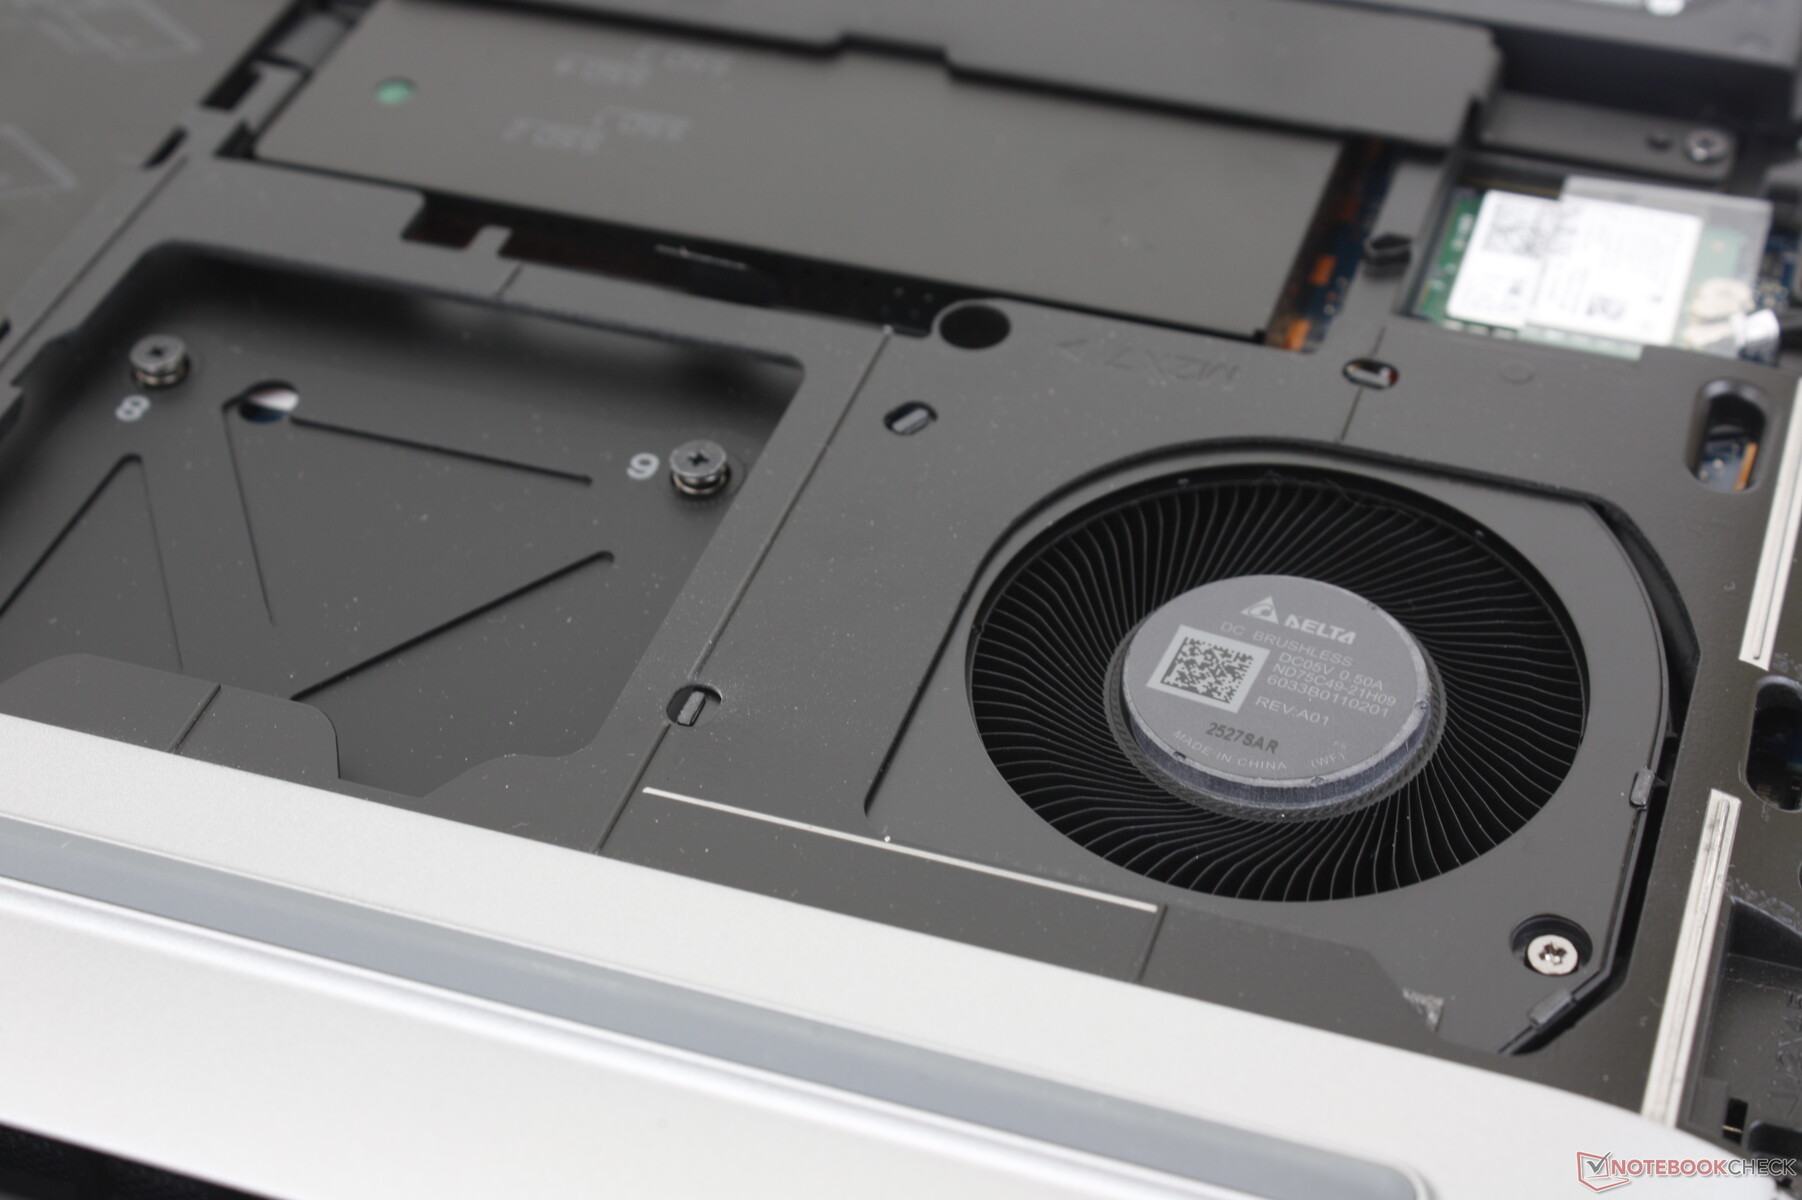
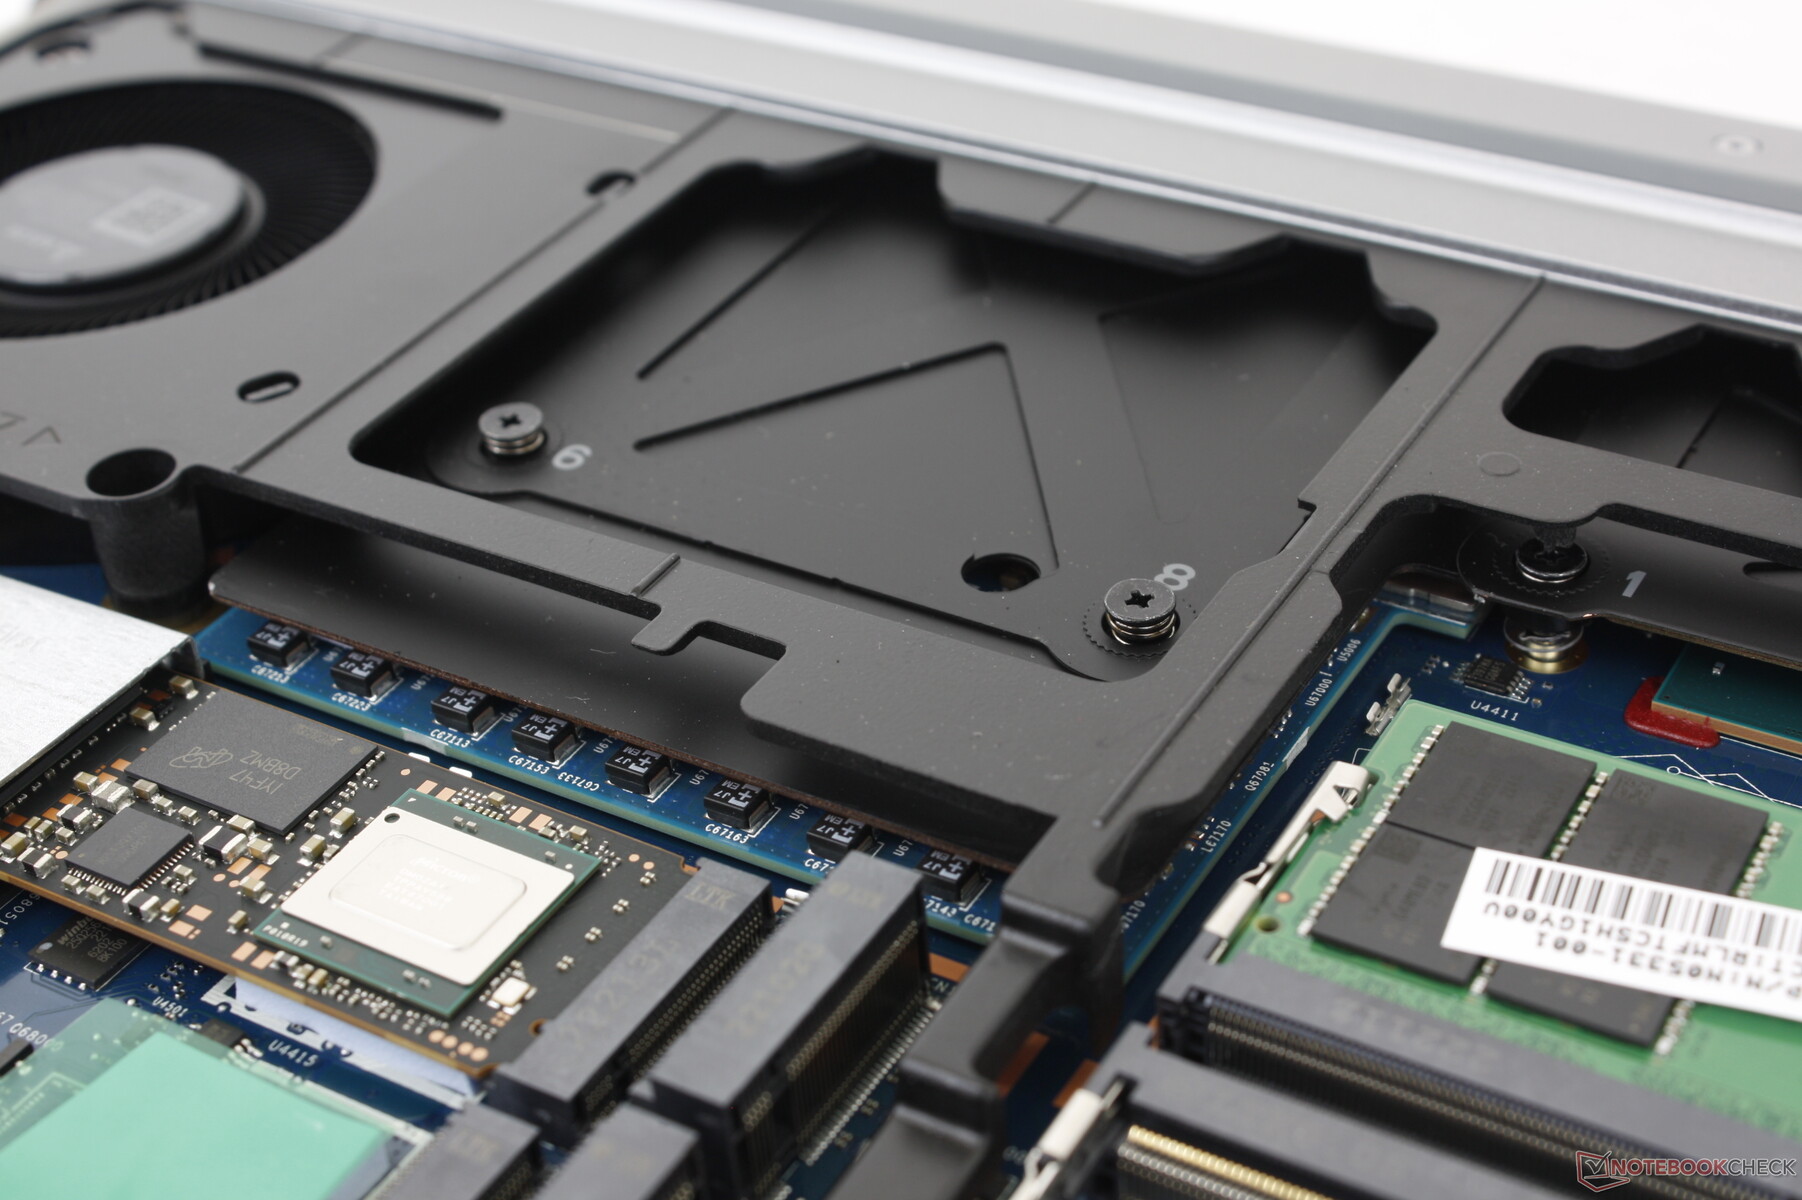
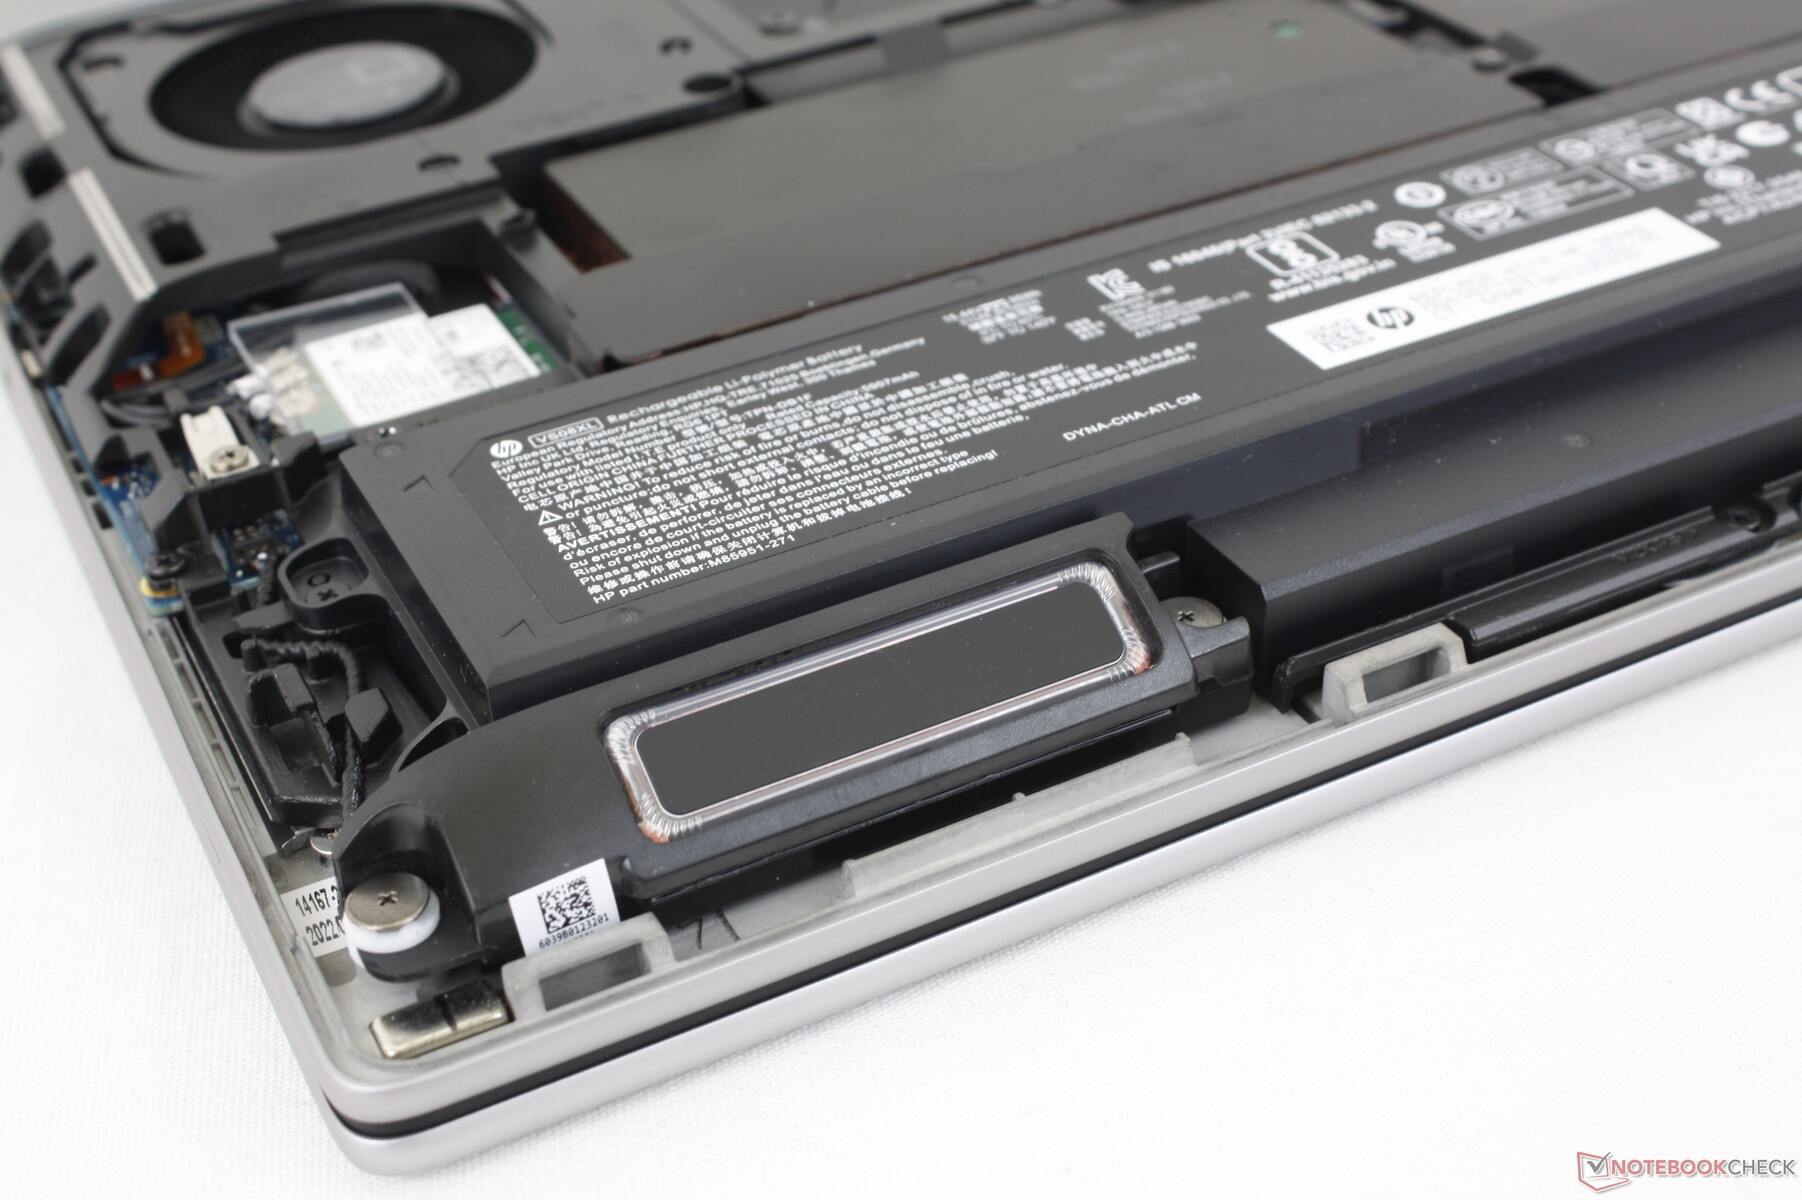
维护
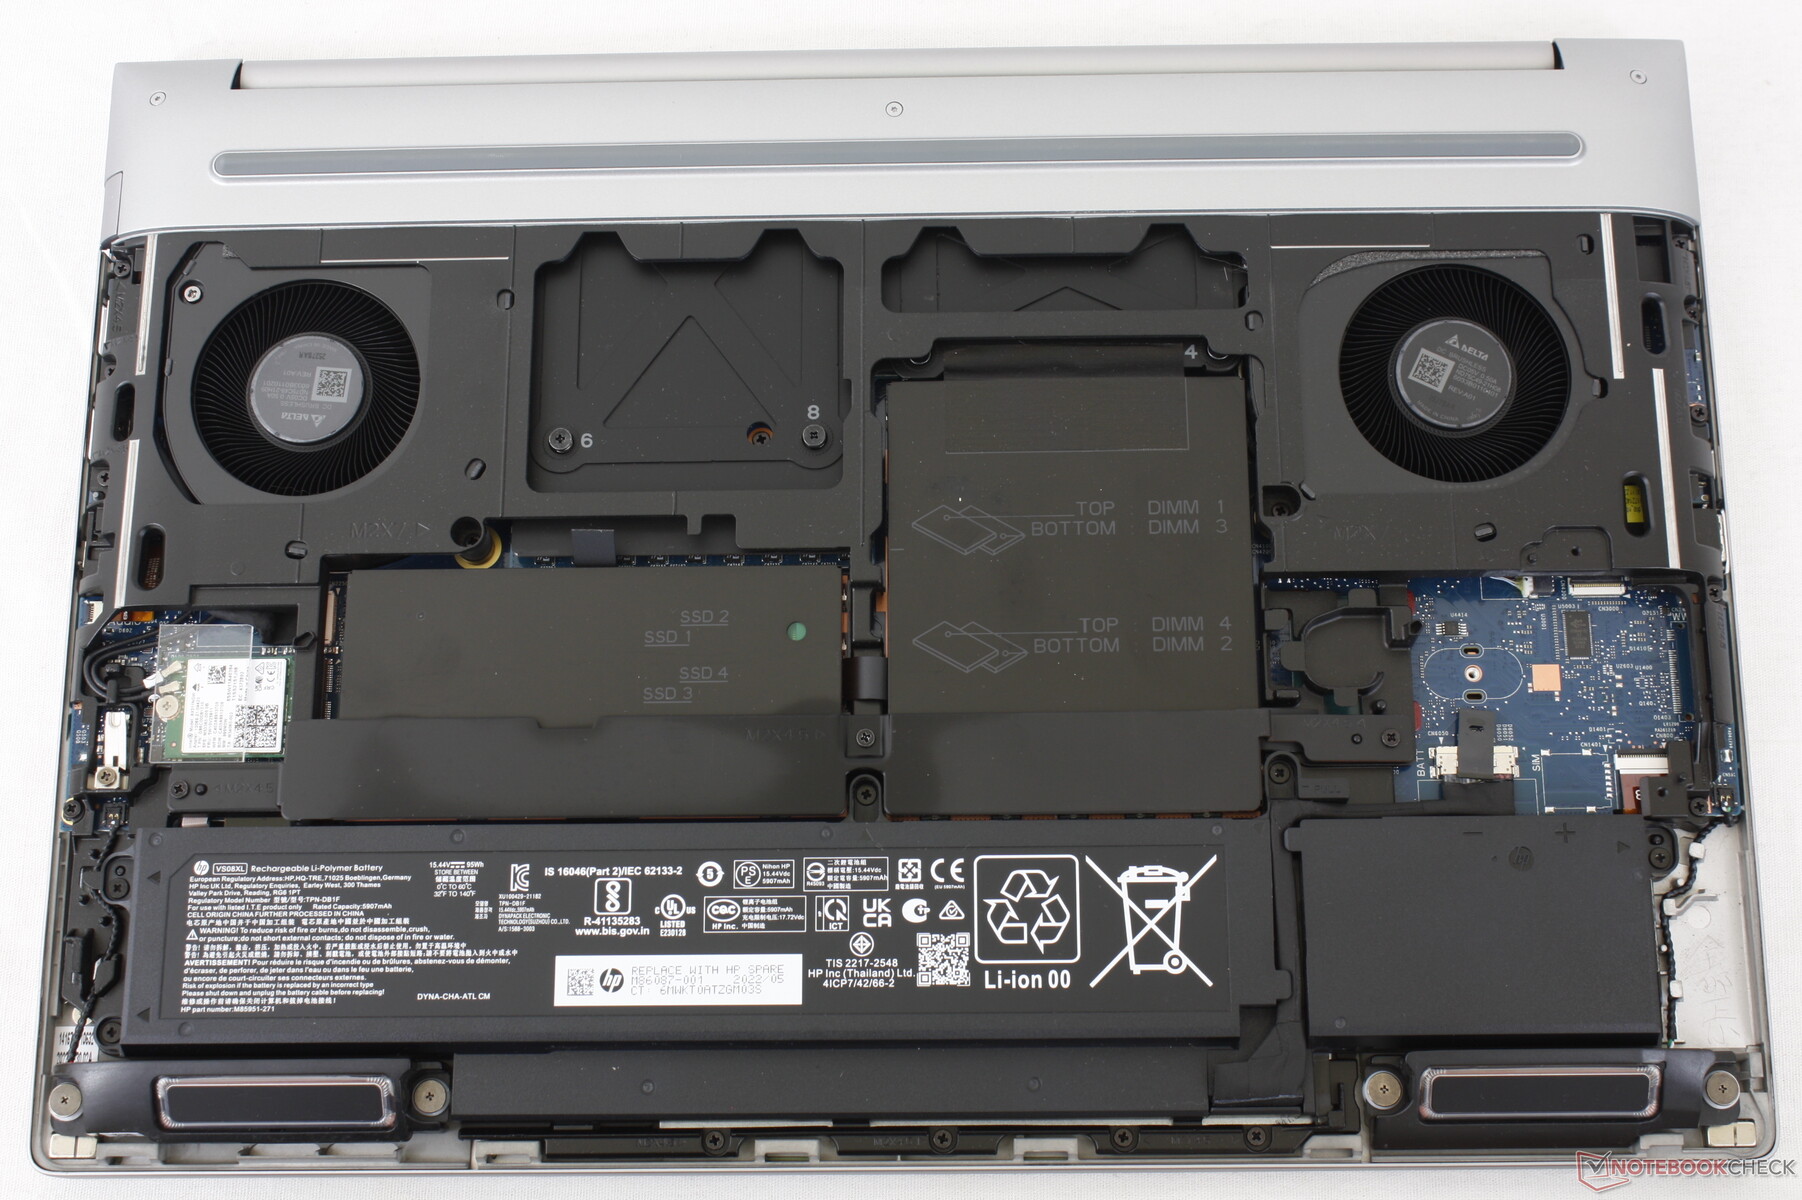
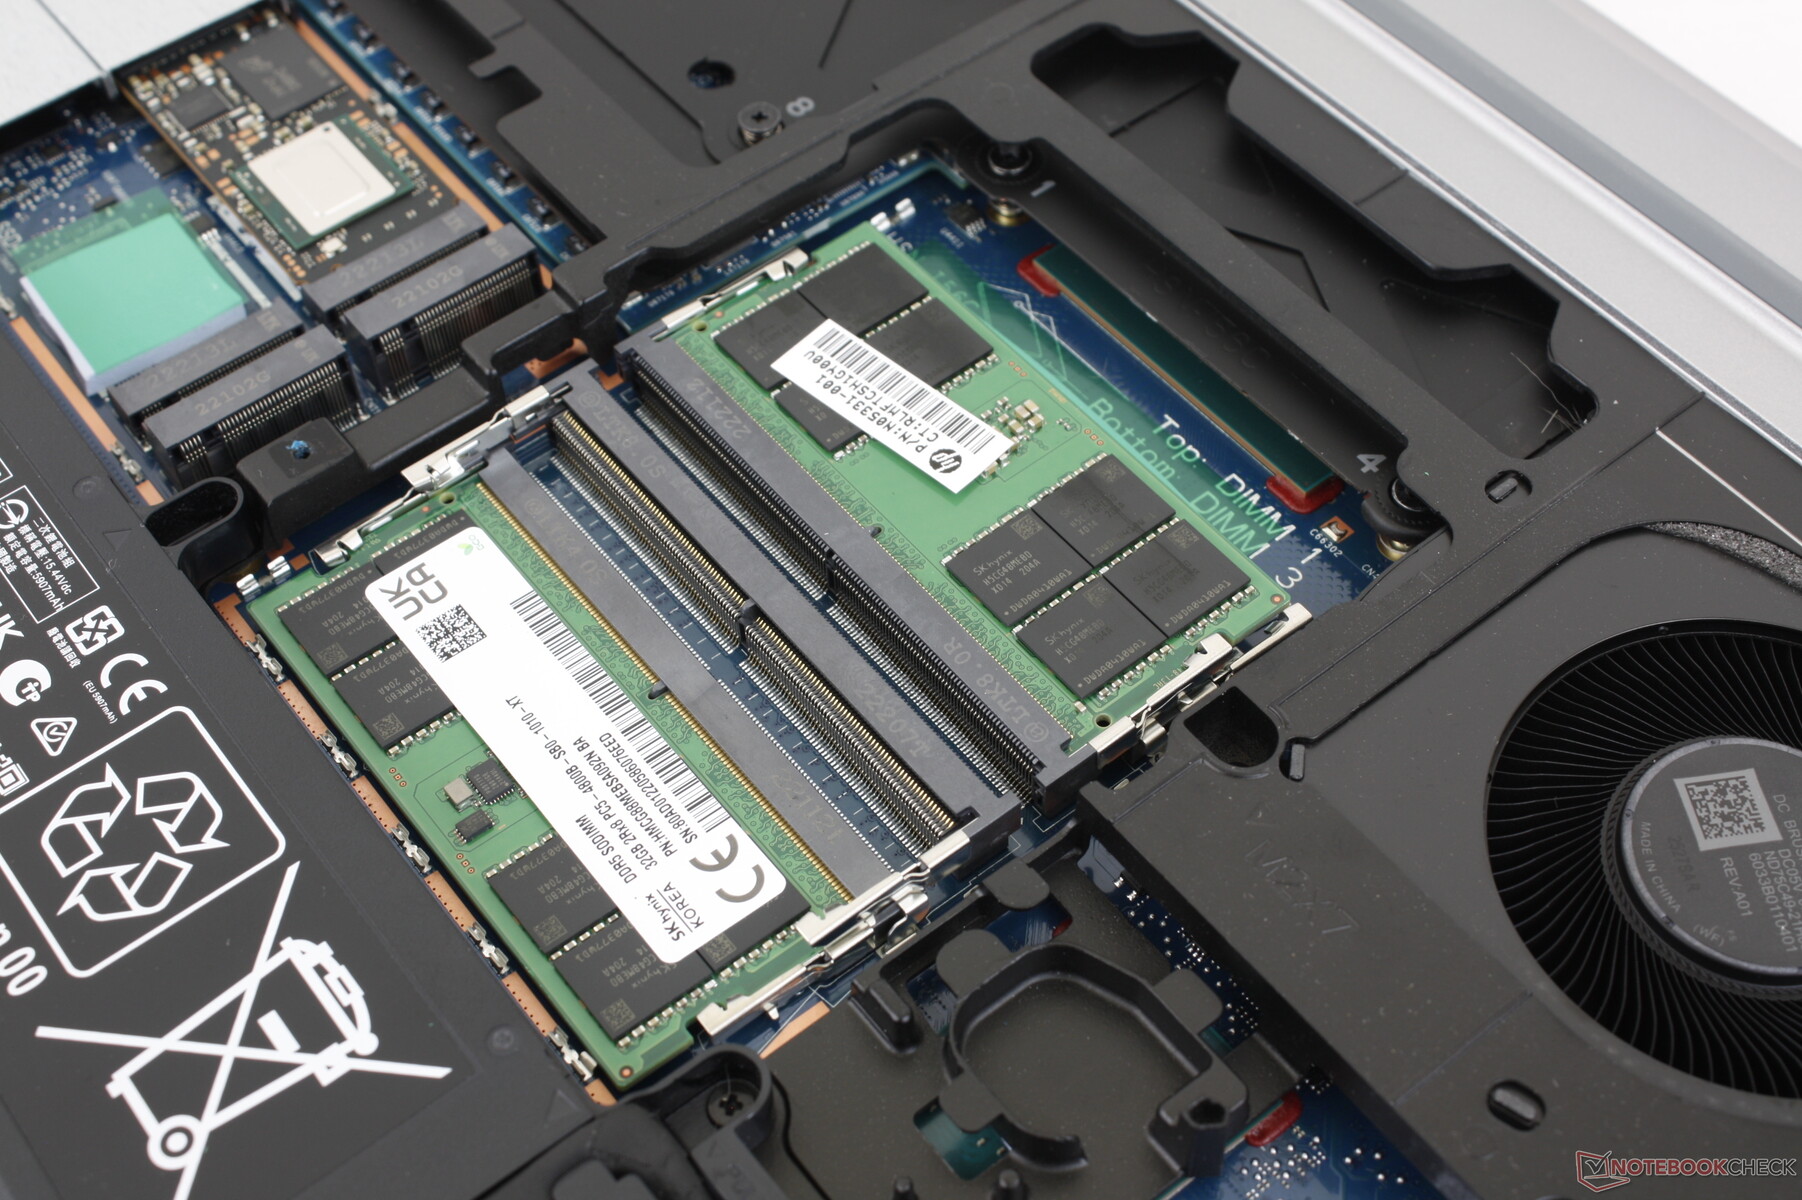
底部面板是 "无托 "的,因为它不需要任何工具就可以轻松滑落。不幸的是,仍然需要一把螺丝刀,因为存储托架和SODIMM插槽是由铝板保护的。该机型最多支持4个M.2 2280固态硬盘和4个DDR5内存模块,这比Precision 7670和ThinkPad P16所能提供的要多。
配件和保修
除了通常的交流适配器和文件外,零售盒中没有任何额外的东西。如果在美国购买,三年有限保修是标准的。
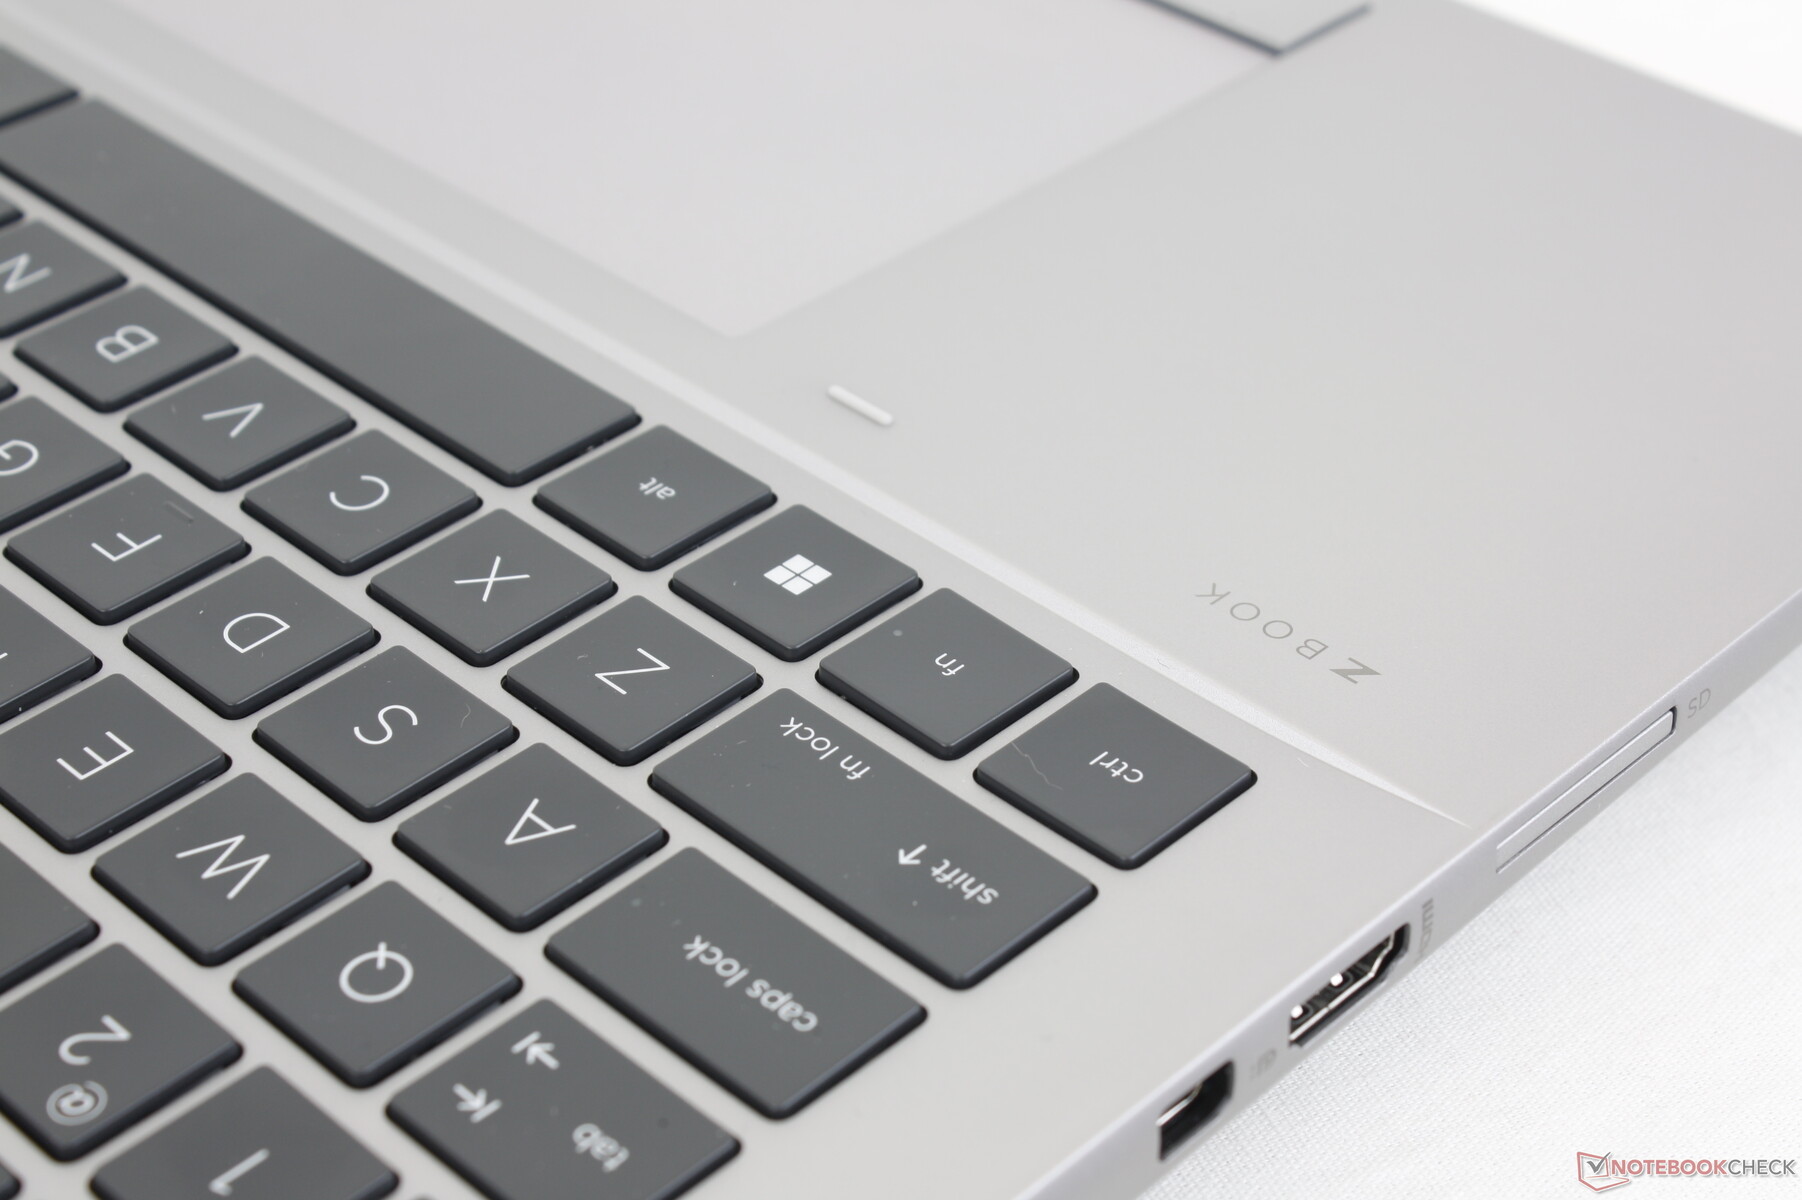
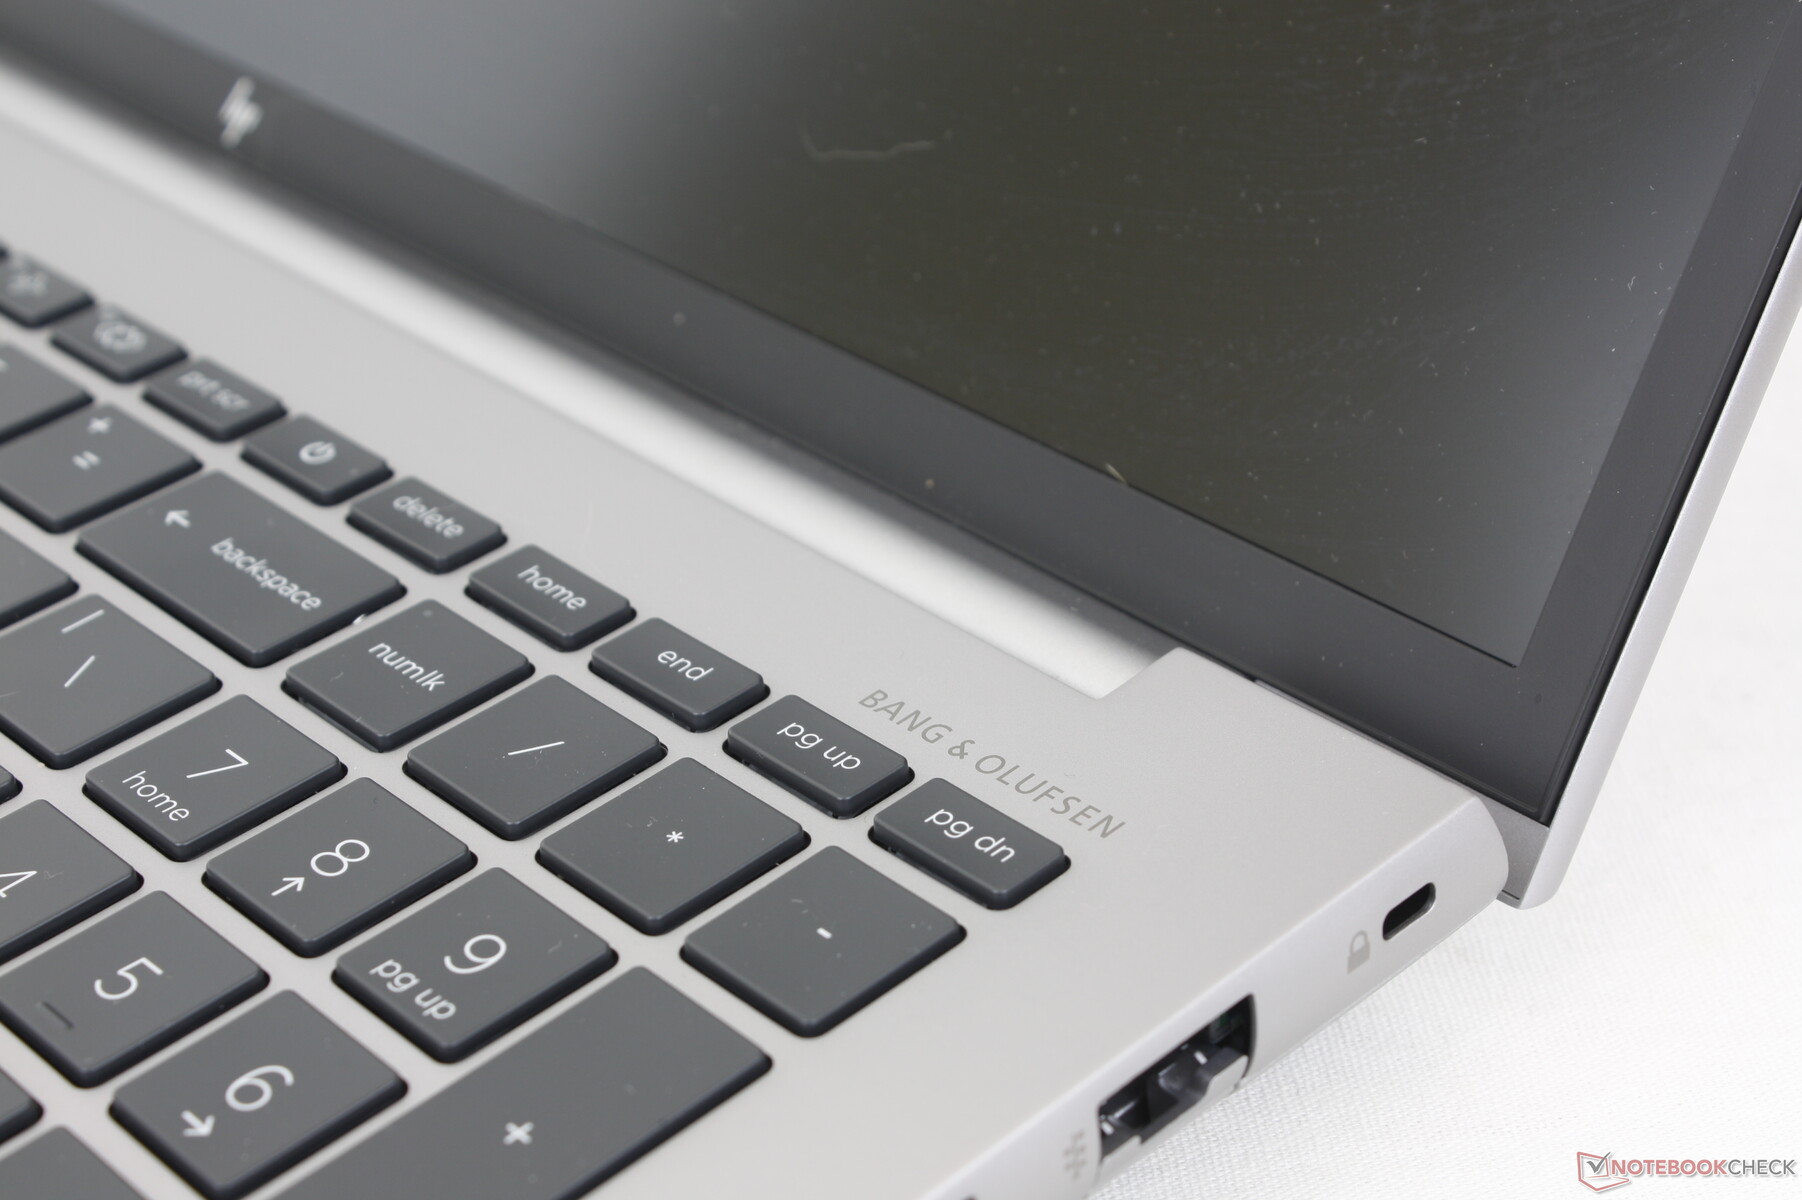
输入设备--宽敞而舒适
键盘
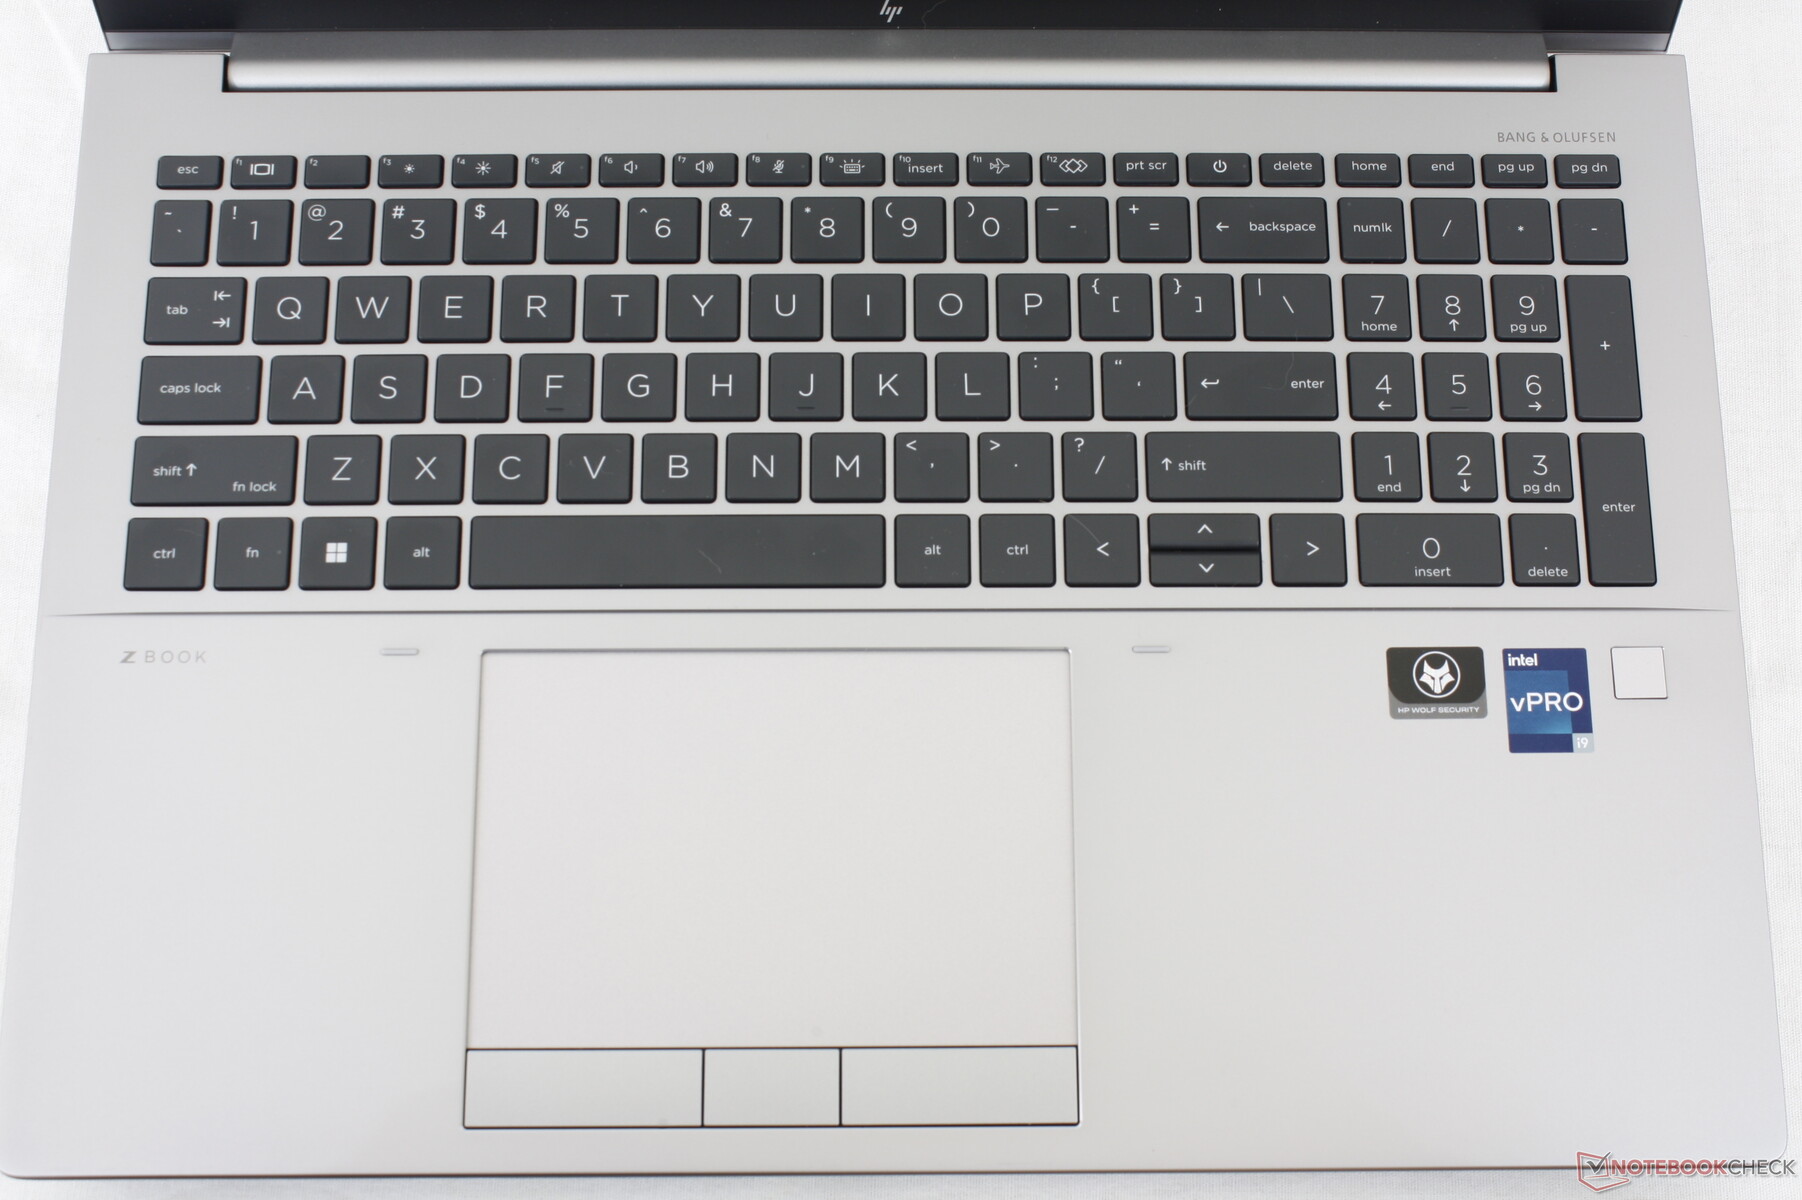
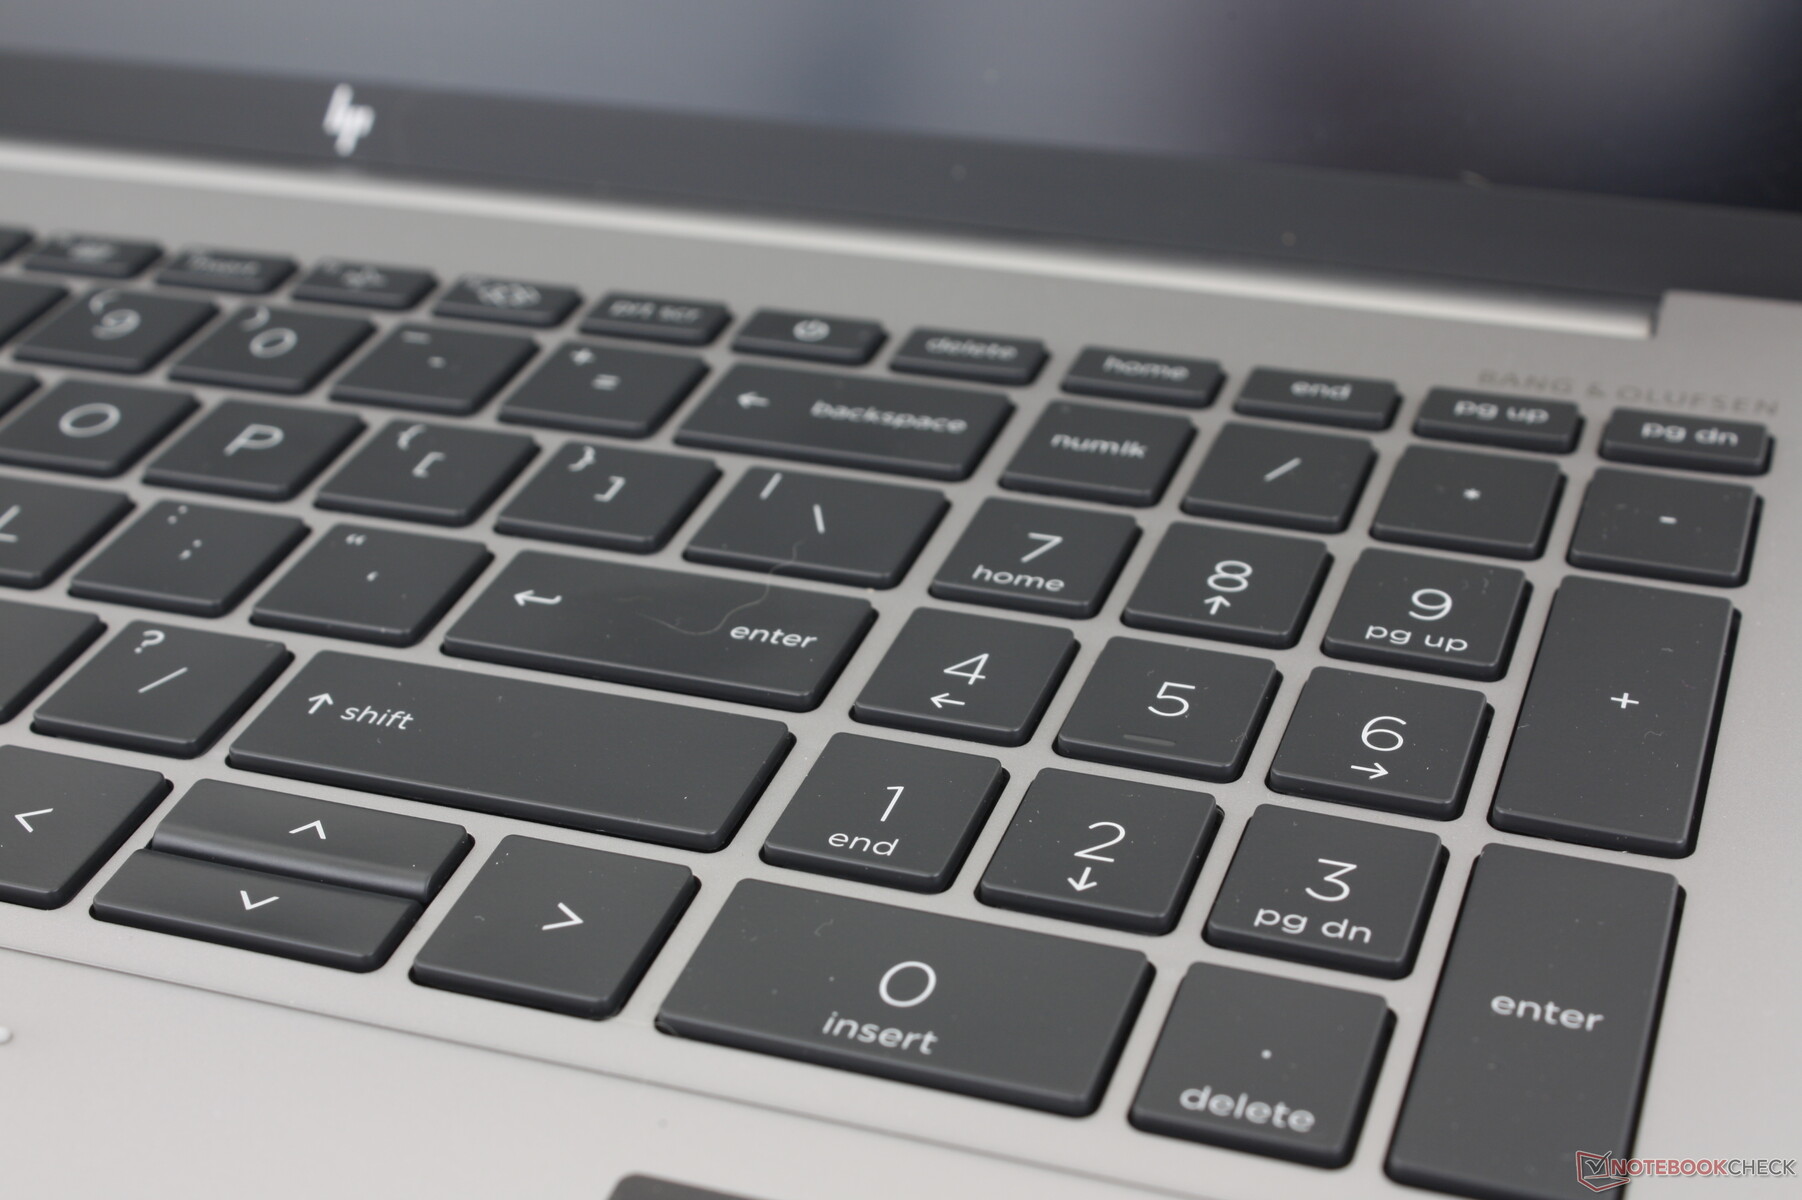
在反馈和行程方面,惠普Spectre、EliteBook和ZBook系列都拥有各自类别中最好的一些键盘。Fury 16 G9的按键很牢固,可以带来令人满意的打字体验。然而,与ThinkPad P16 G1或Precision 7670相比,噪音更大,特别是在按空格键或回车键时。喜欢更安静的按键的打字员可能要先试一下ZBook键盘,然后再做决定。
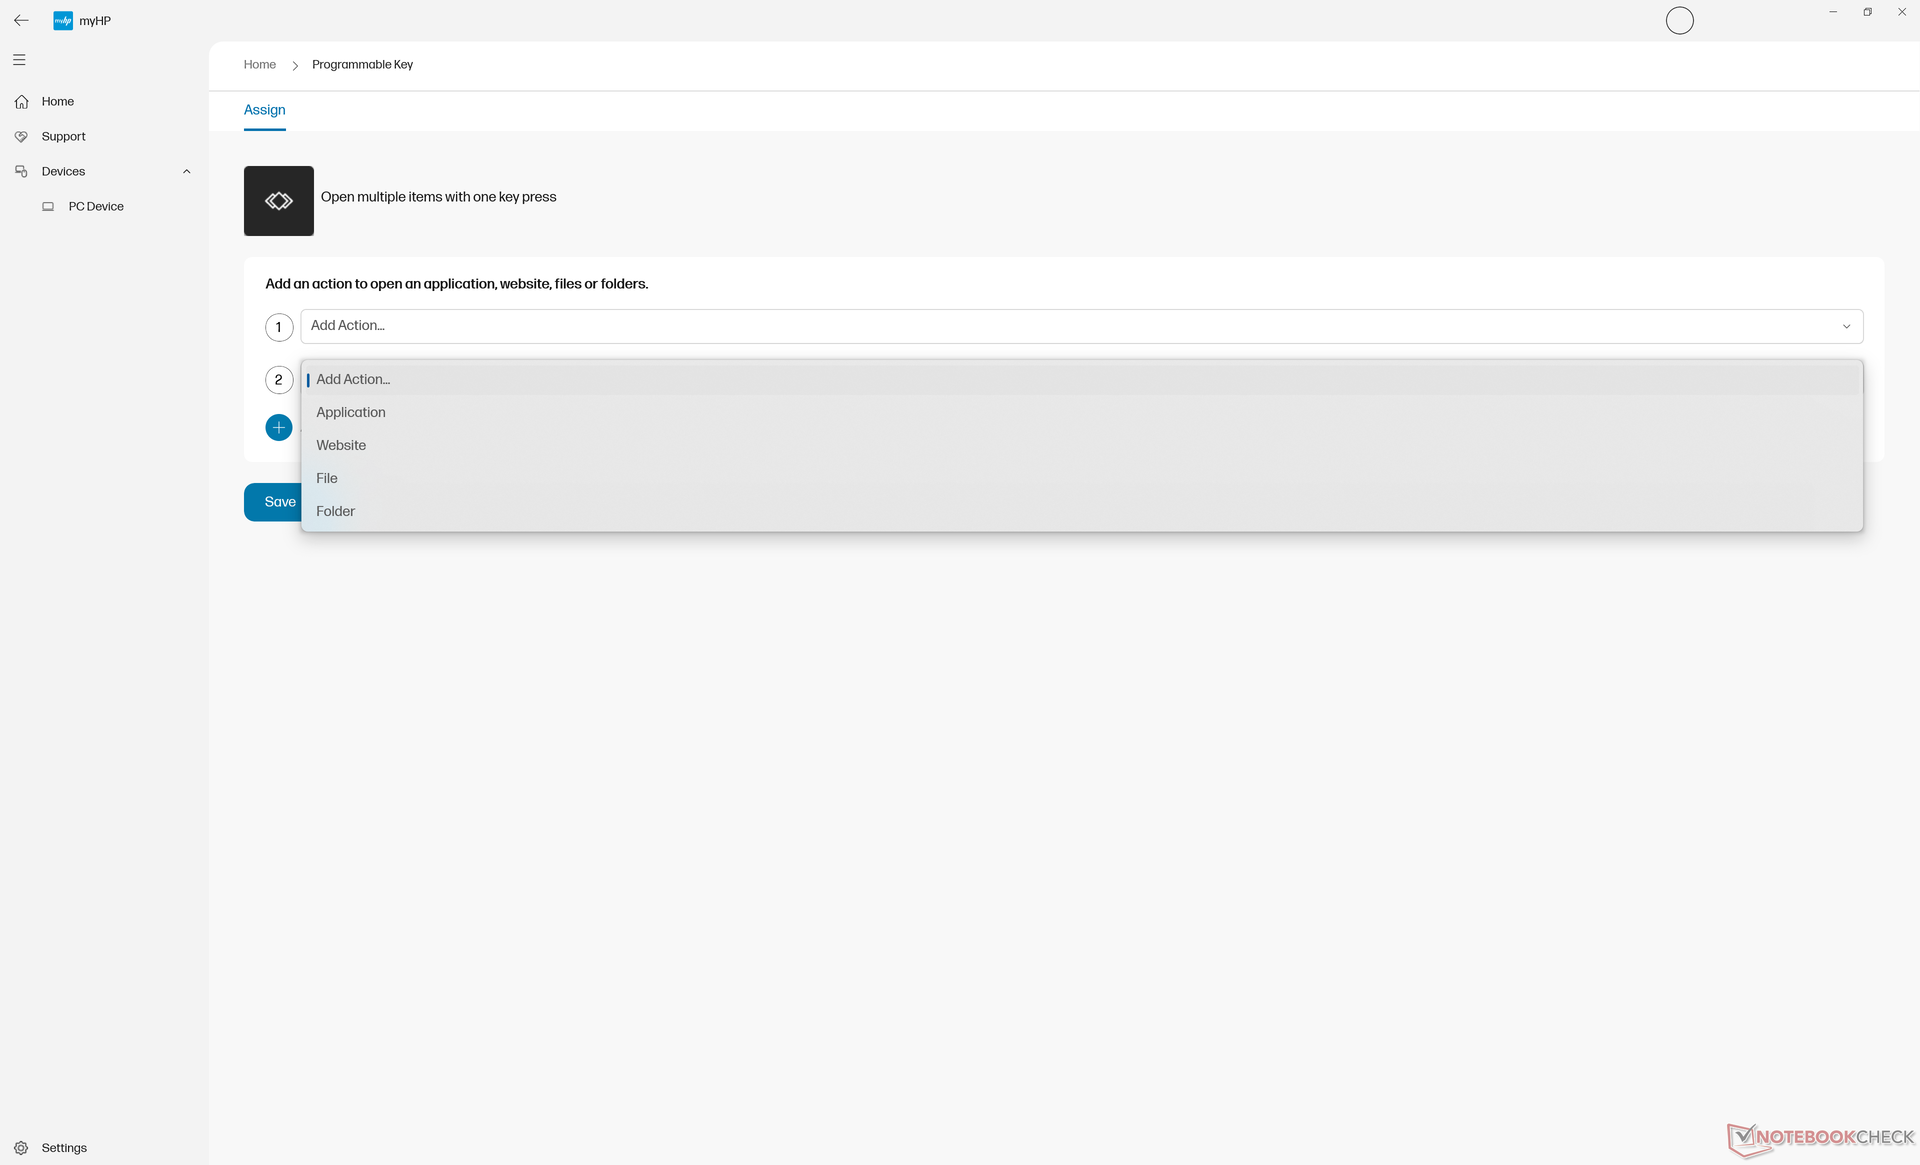
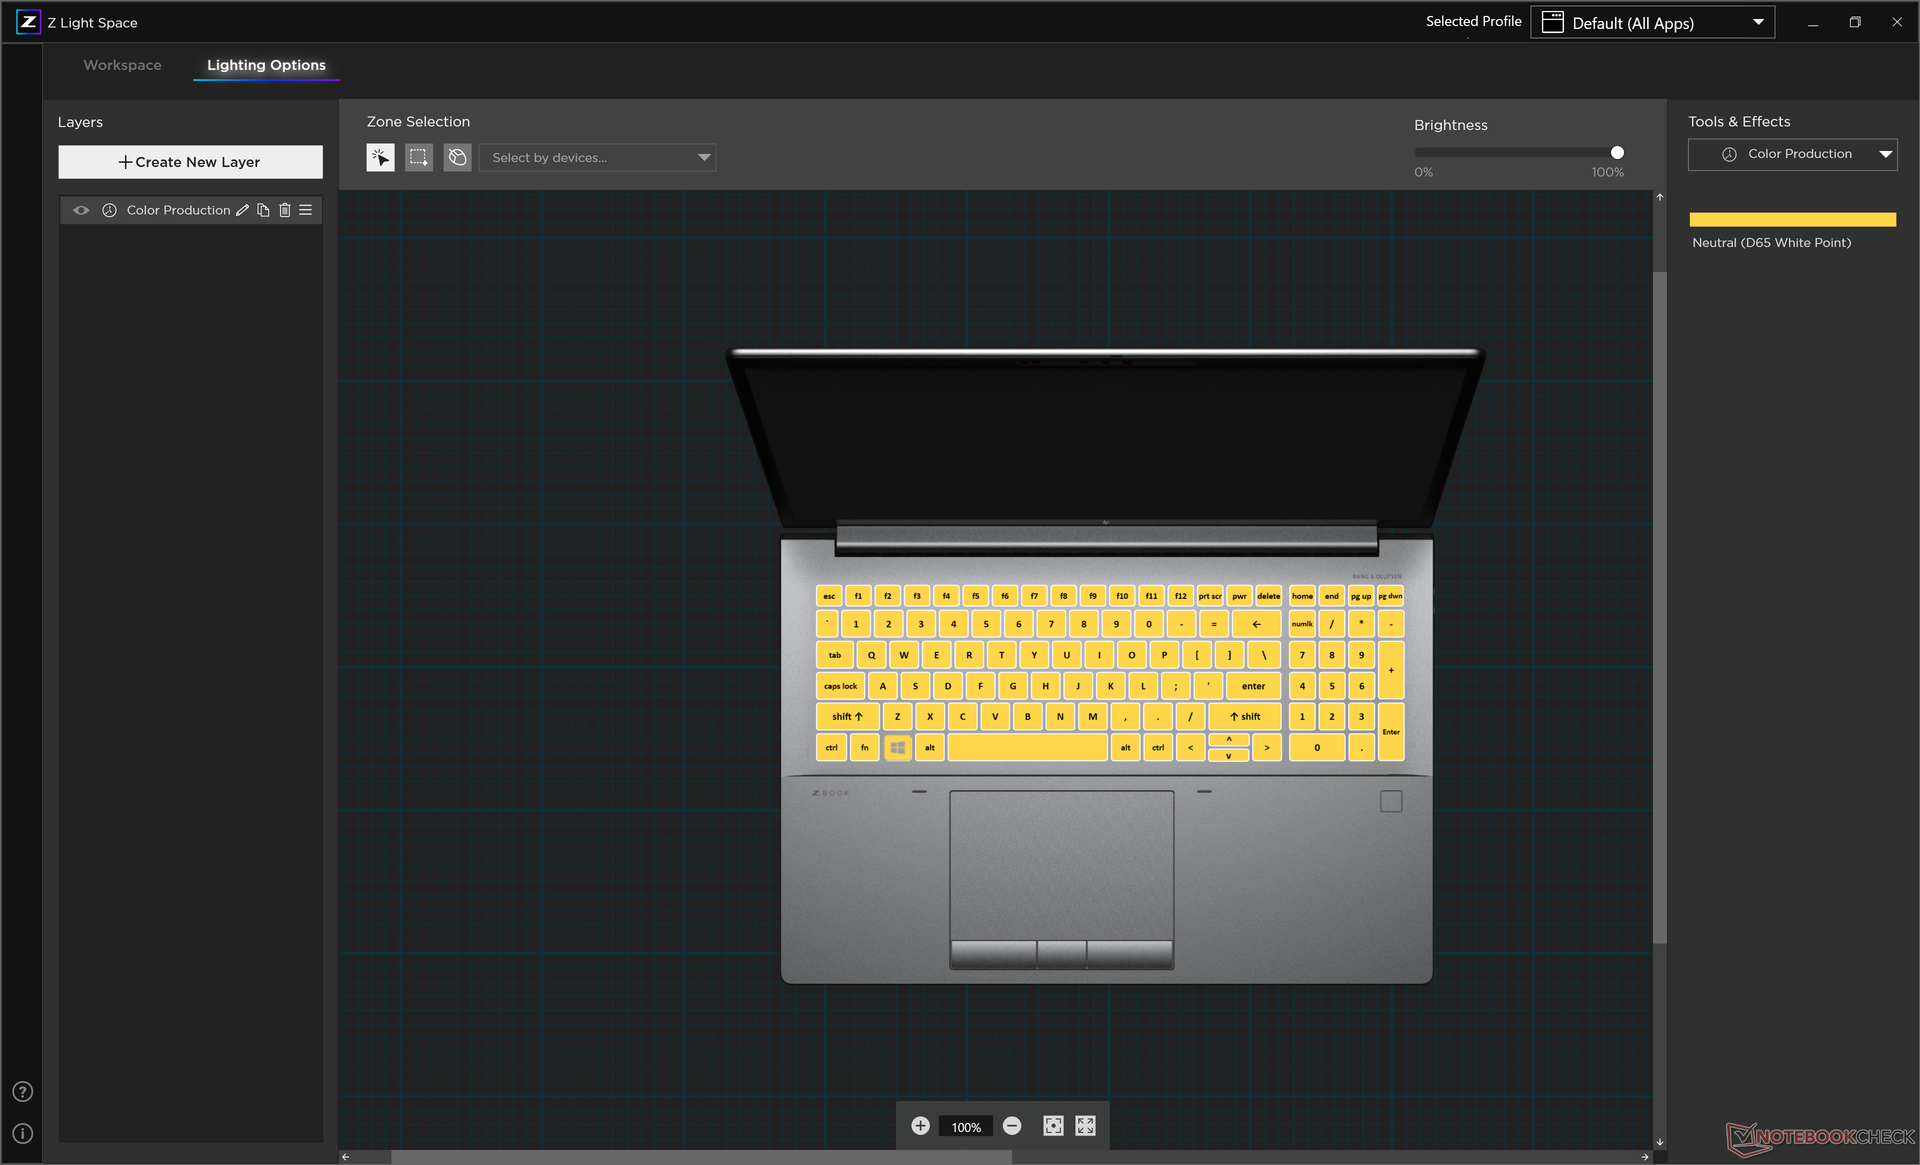
ZBook键盘的显著特点包括每个键的RGB背光和单一的可编程/可定制键。大多数其他工作站还没有类似的辅助功能。
触摸板
触摸板是我们在任何笔记本电脑上使用过的最好的触摸板之一,无论是工作站还是其他。它不仅比ThinkPad P16 G1(11.5 x 6.9厘米)或Precision 7670(11.5 x 8厘米)上的触摸板大(12.4 x 8.3厘米),而且其滑行特性很平稳,可以在任何速度下进行可靠的光标控制。同时,专用的鼠标按钮比大多数其他笔记本电脑的行程更深,同时在按下时保持令人满意的点击。相比之下,Precision 7670缺乏专用的鼠标按钮,而采用了点击板解决方案。


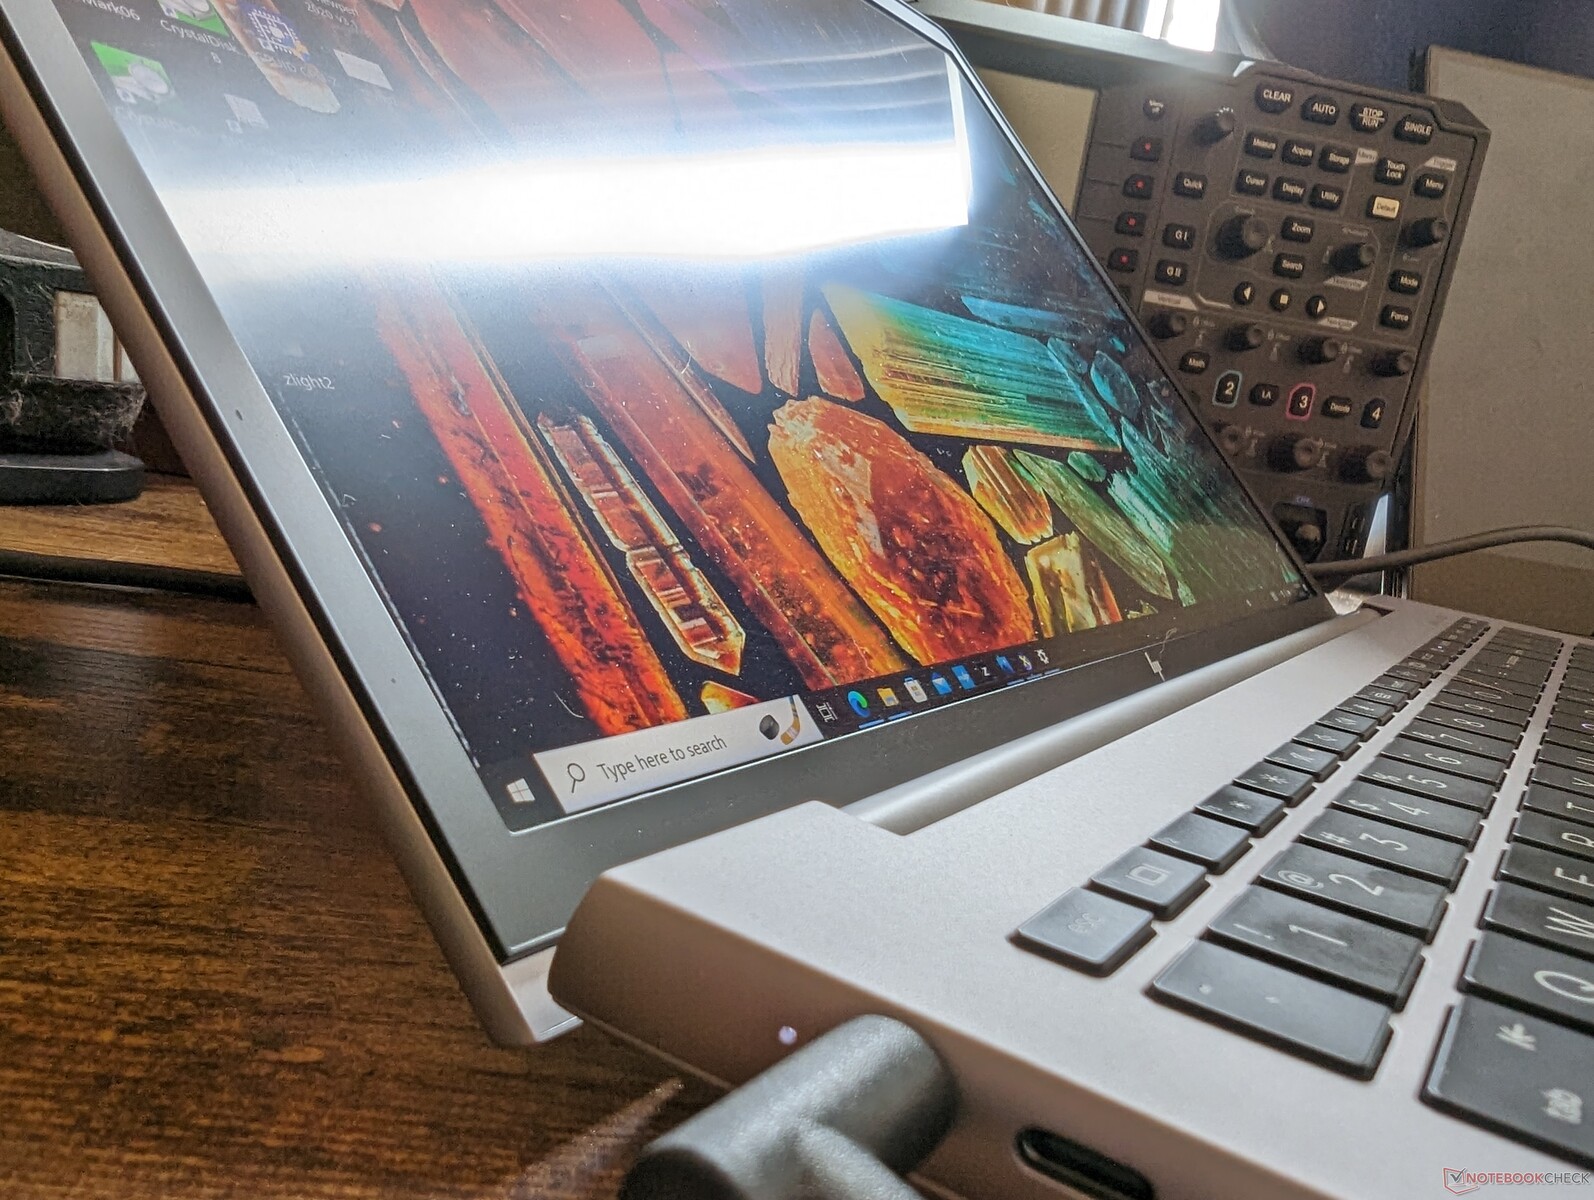
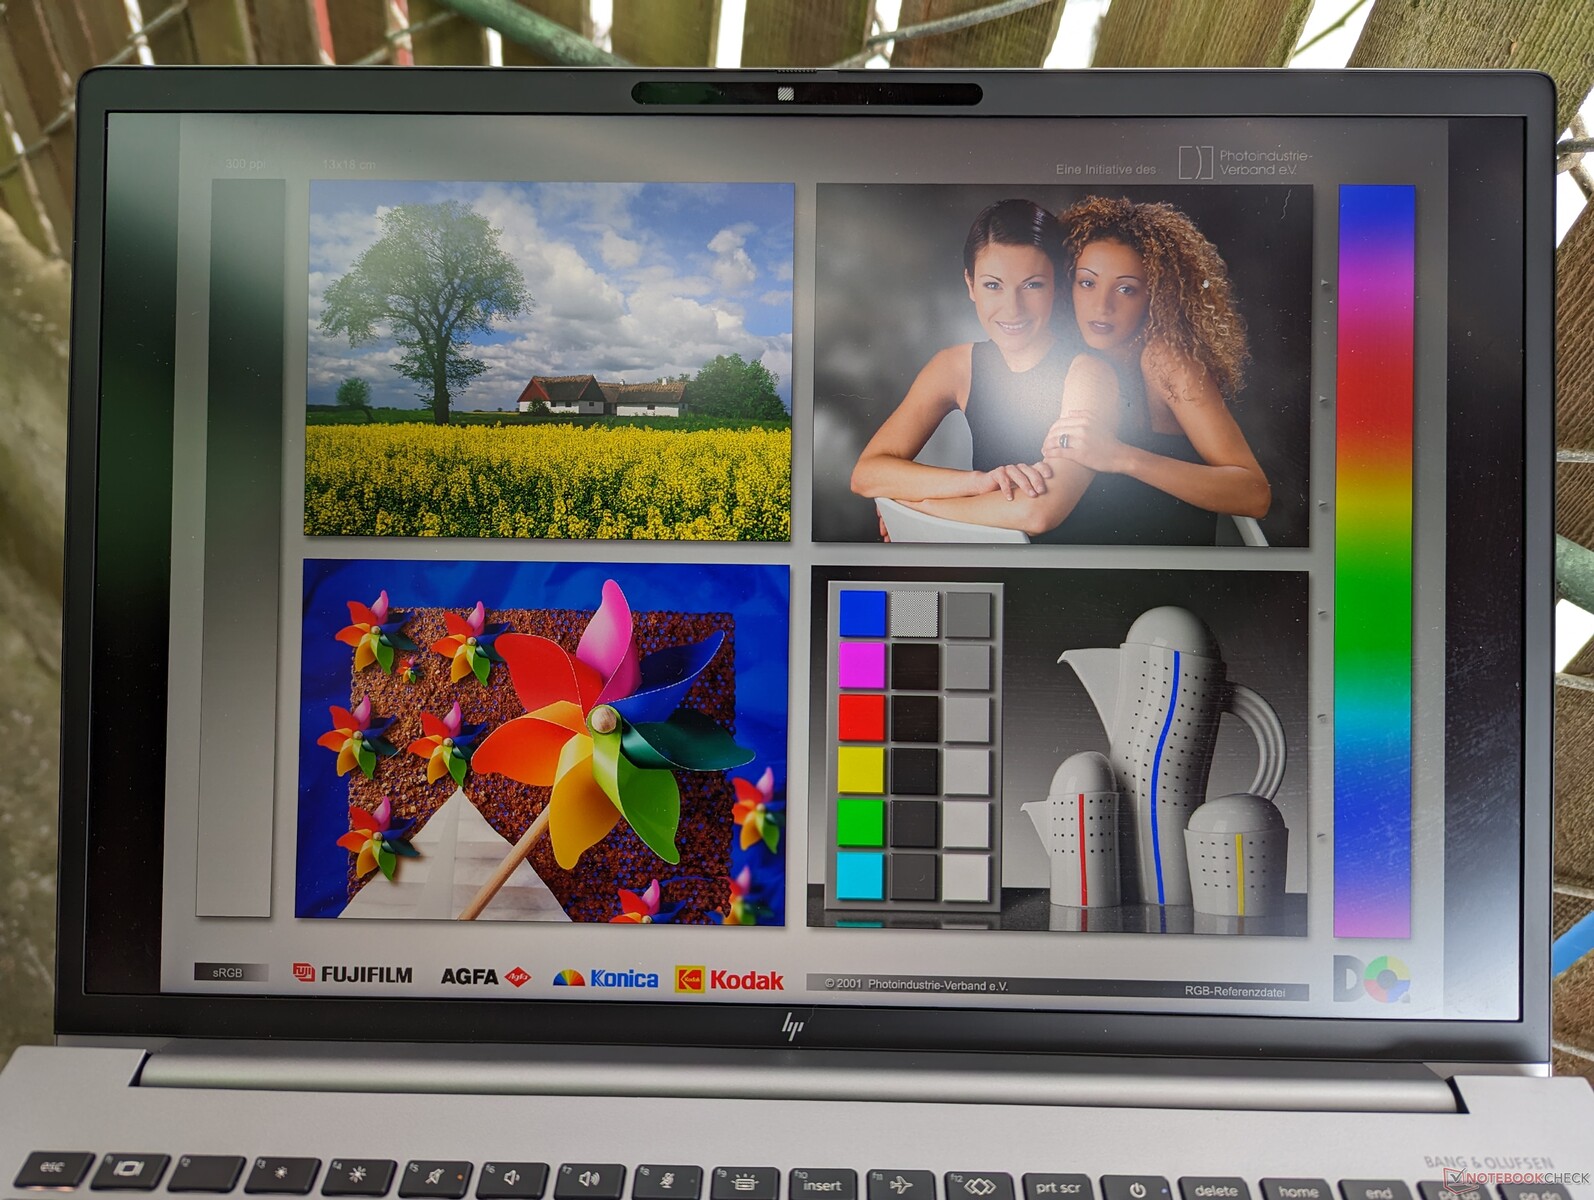
显示屏 - 优秀的色彩和良好的响应时间
惠普在其许多16英寸笔记本电脑中采用了相同的京东方面板选项。这款 ZBook Studio 16 G9例如,ZBook Studio 16 G9采用了与我们的ZBook Fury 16 G9相同的16:10 4K面板,下表中的类似属性就是例证。
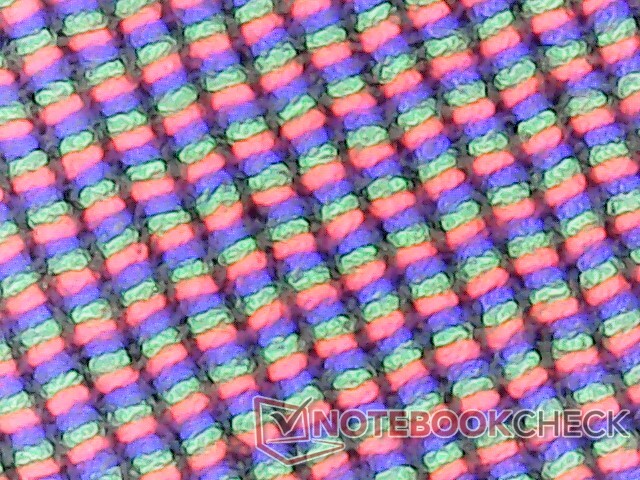
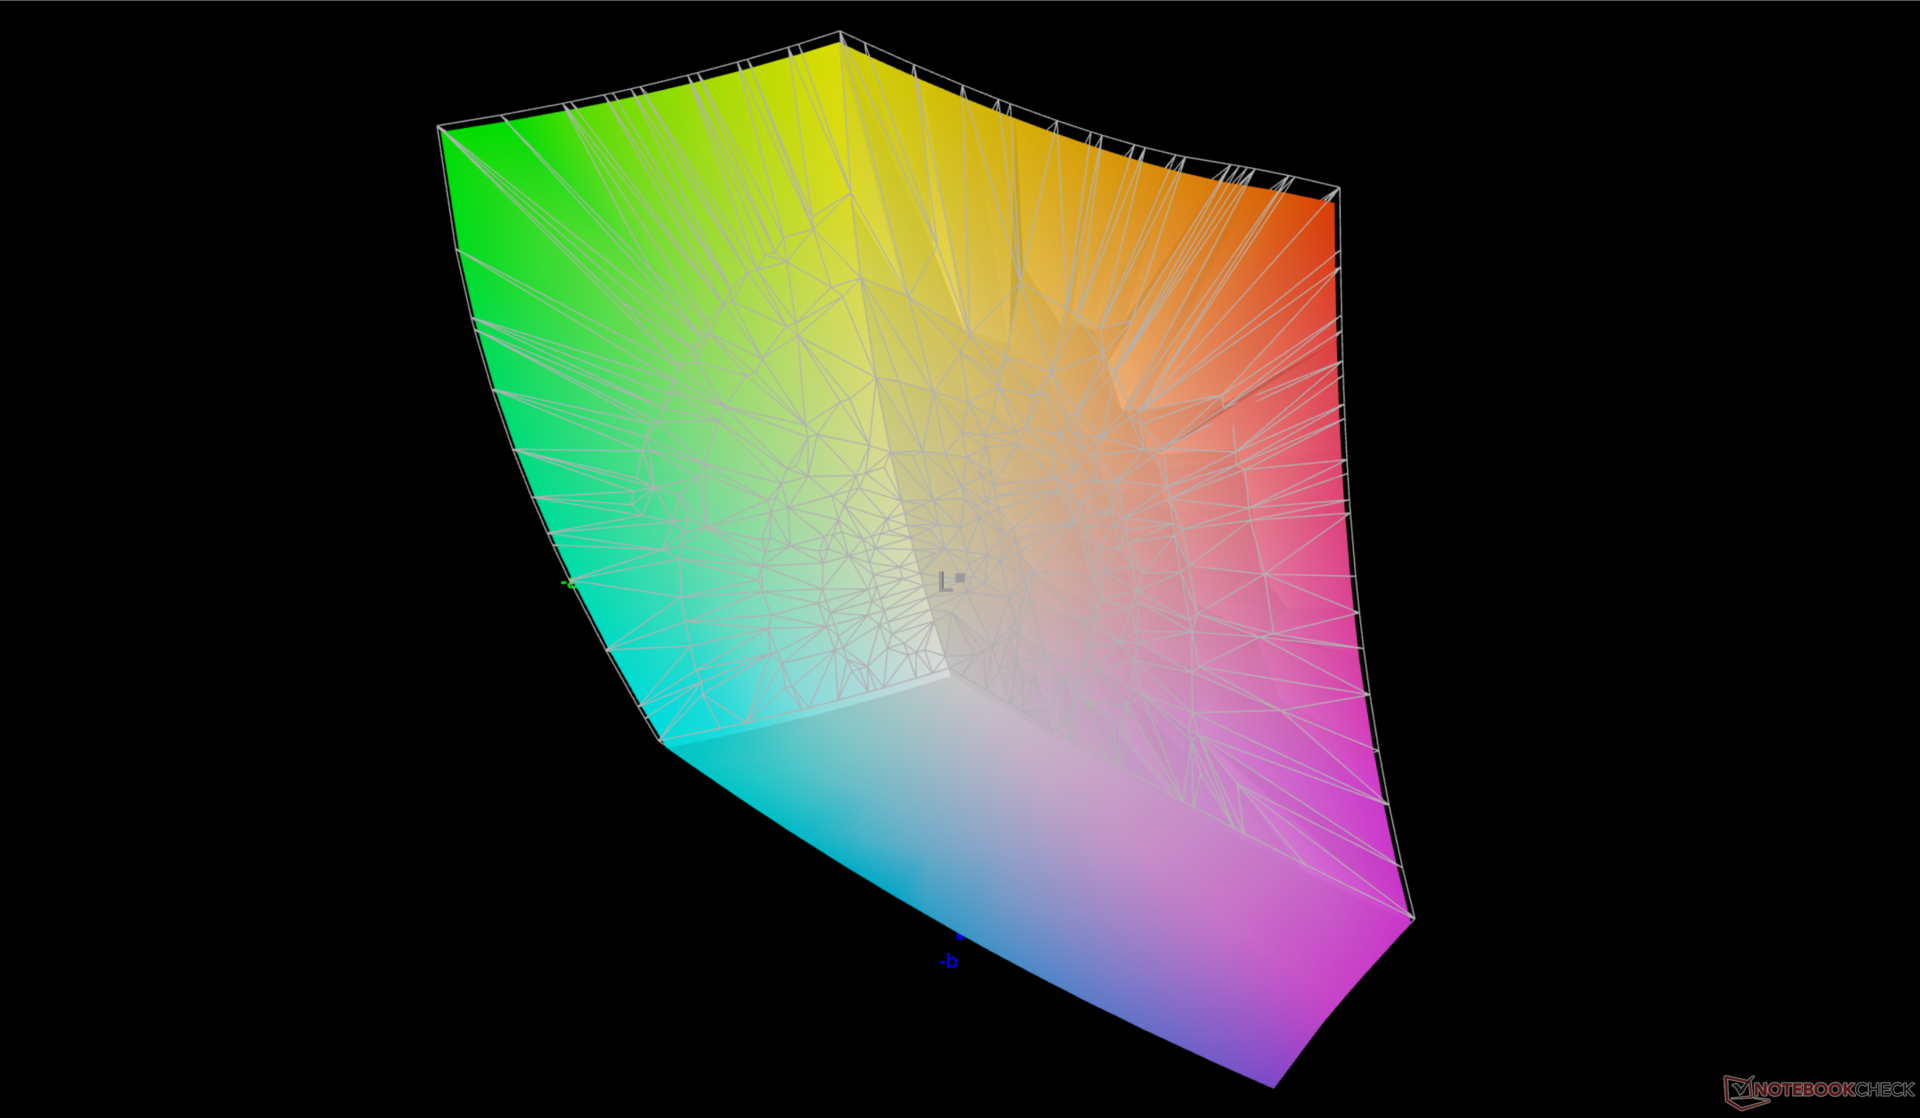
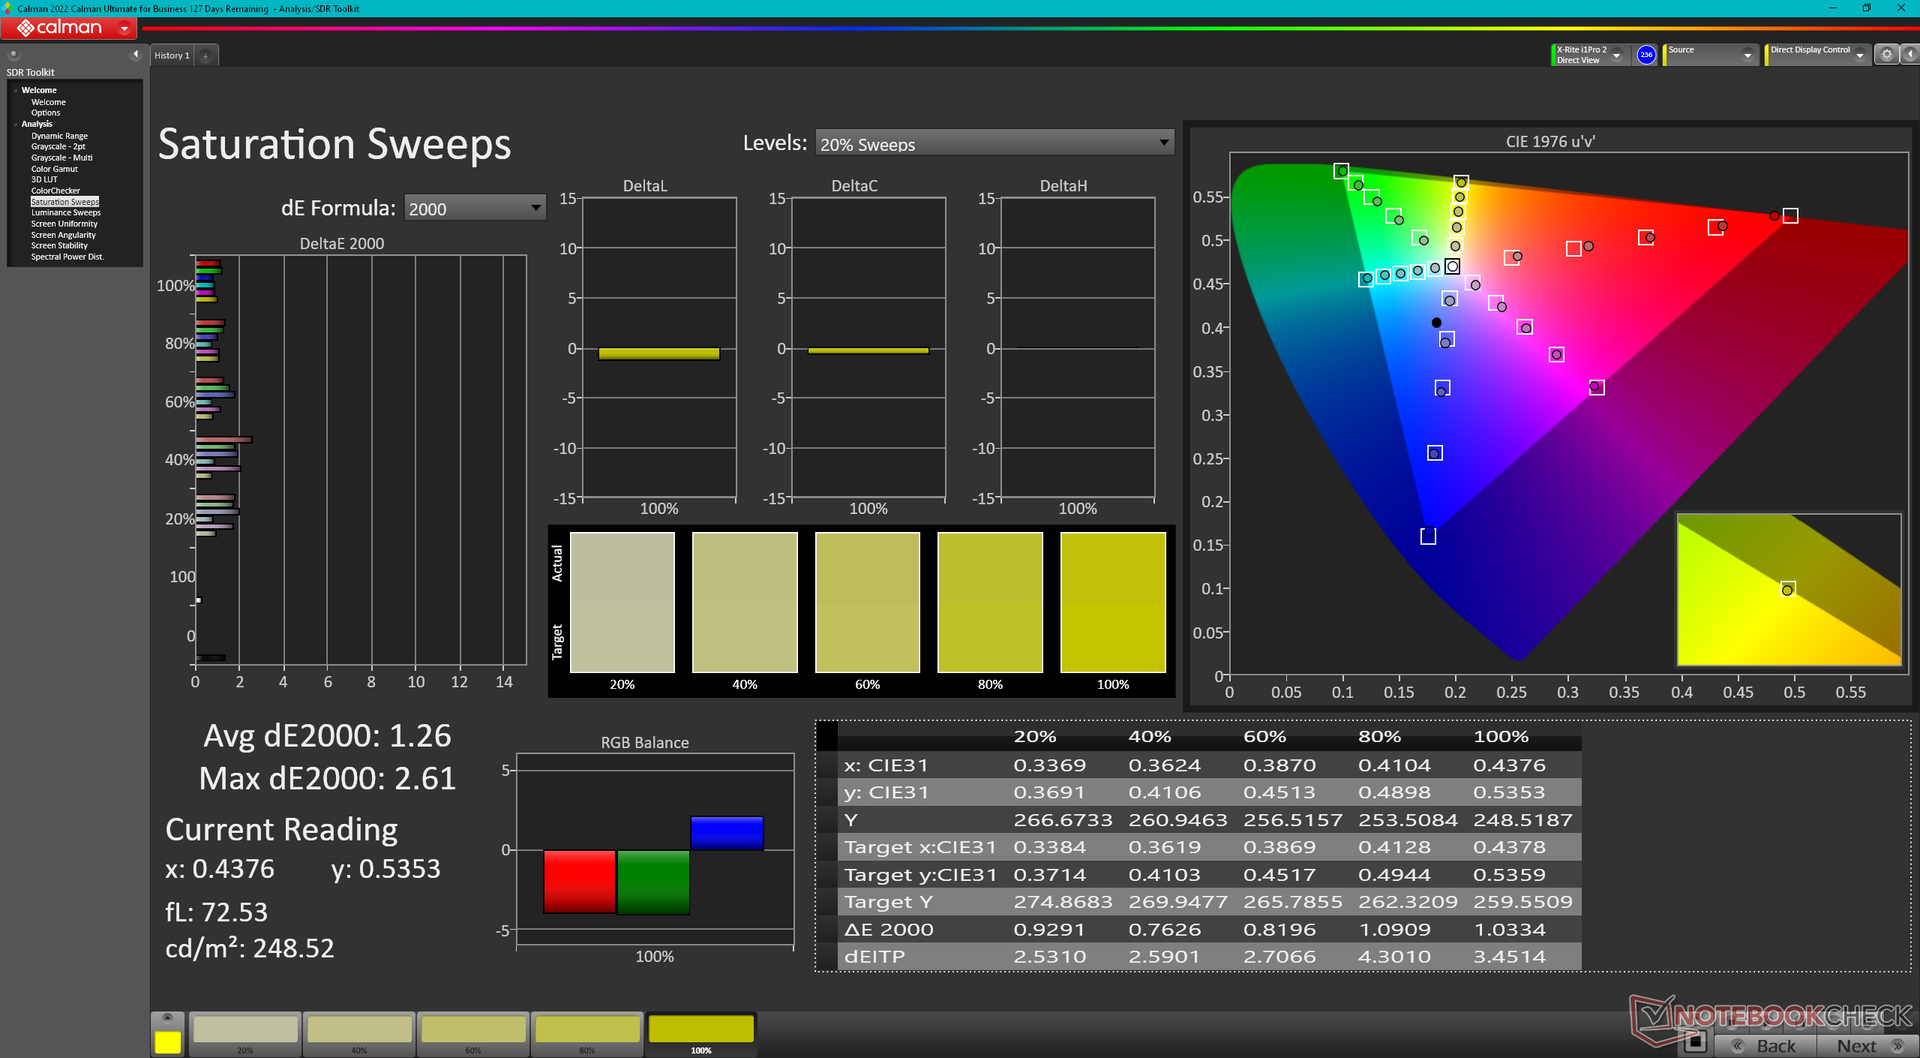
我们特定的4K IPS面板是一个高端产品,其宽P3颜色和良好的黑白灰响应时间,适合内容创作和游戏应用。然而,哑光覆盖层并不像光面替代品那样锐利,而且对比度也被限制在1000:1左右。幸运的是,惠普提供了一个OLED选项来直接解决这两个缺点。
| |||||||||||||||||||||||||
Brightness Distribution: 83 %
Center on Battery: 451.7 cd/m²
Contrast: 931:1 (Black: 0.57 cd/m²)
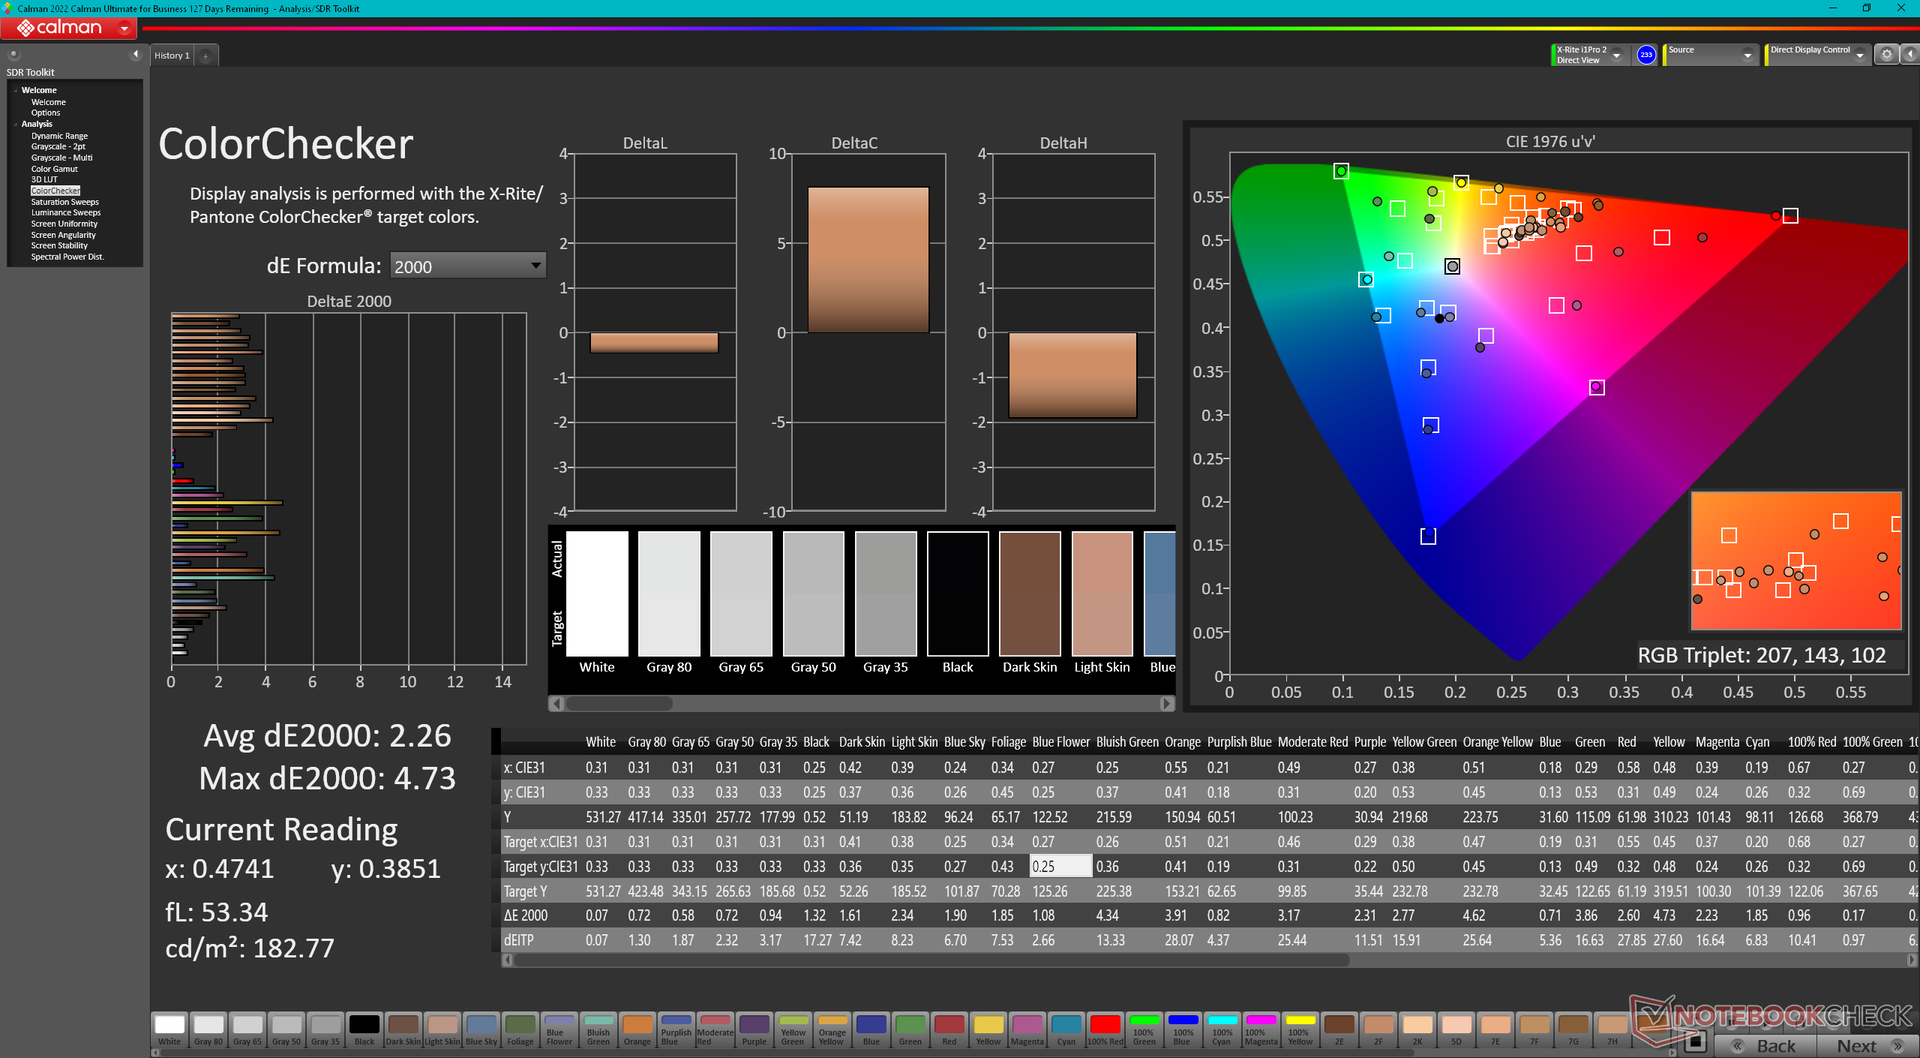
ΔE ColorChecker Calman: 2.26 | ∀{0.5-29.43 Ø4.71}
calibrated: 4.73
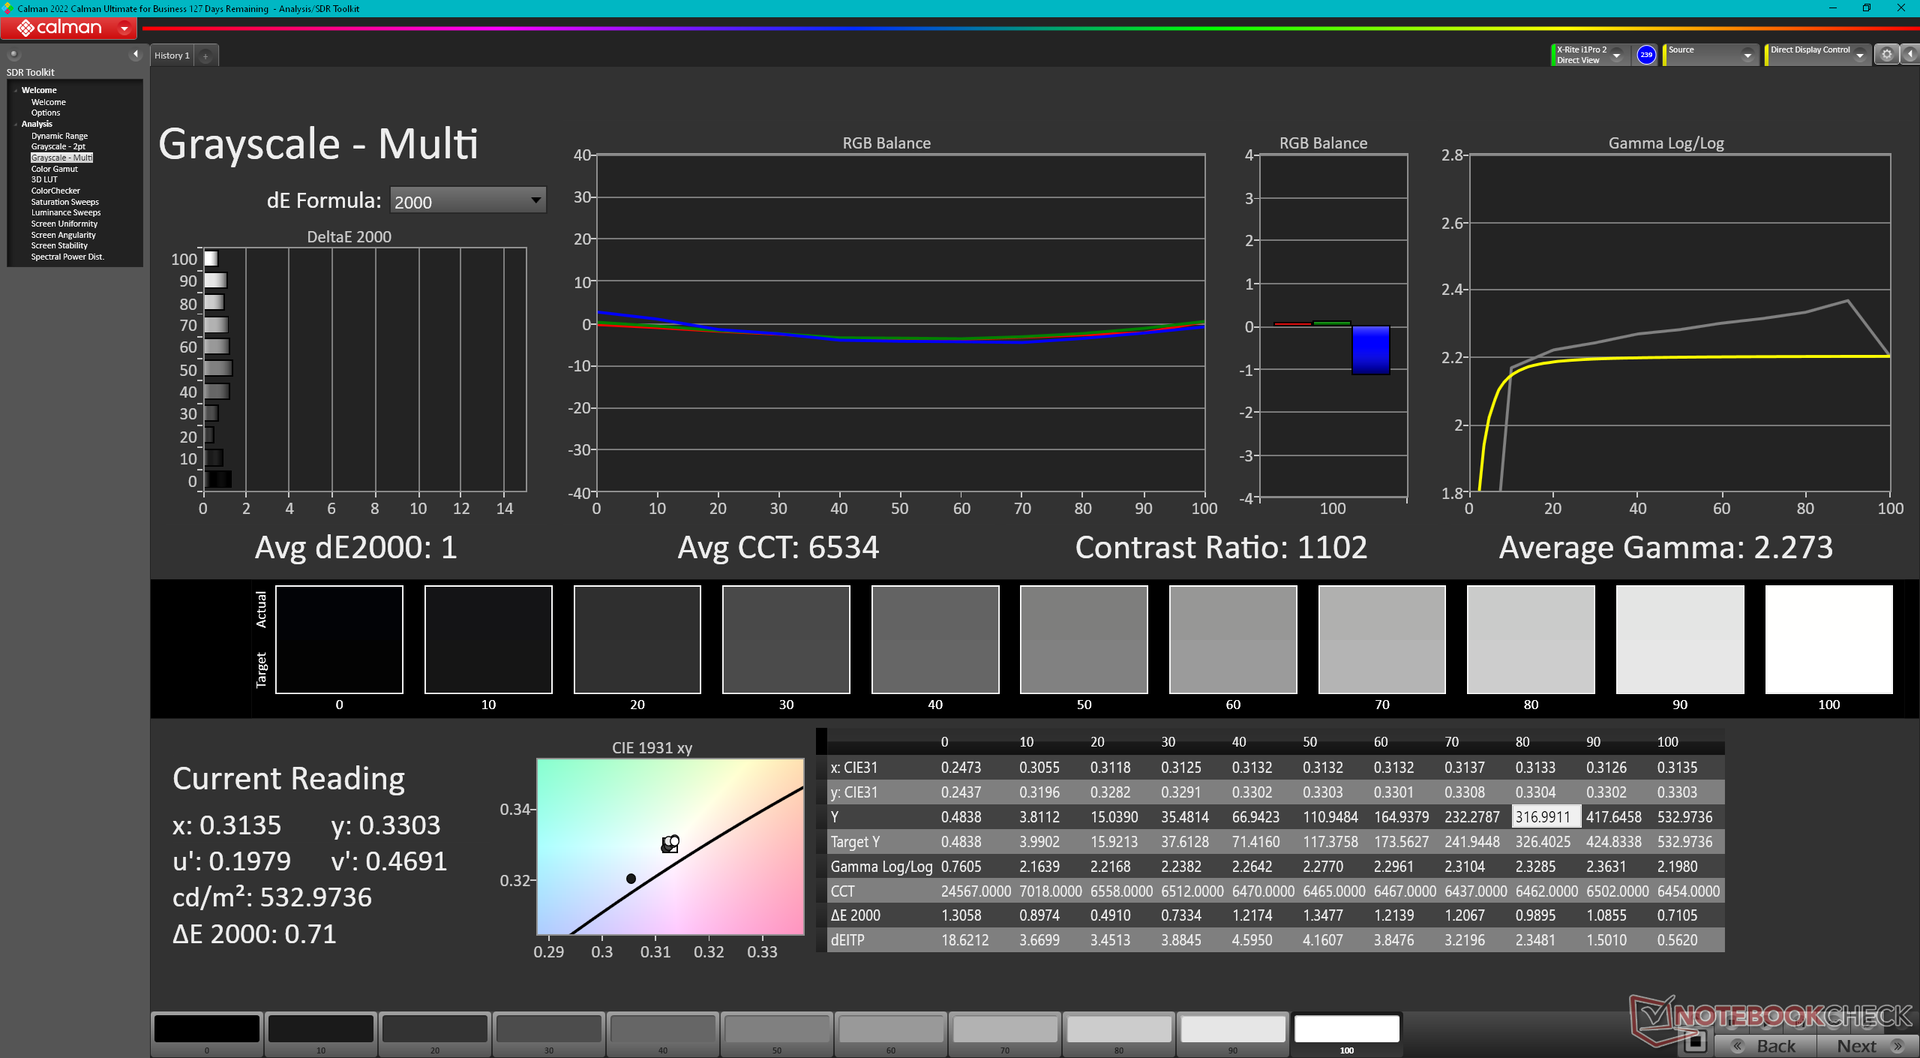
ΔE Greyscale Calman: 1 | ∀{0.09-98 Ø4.96}
86.3% AdobeRGB 1998 (Argyll 3D)
99.9% sRGB (Argyll 3D)
97.4% Display P3 (Argyll 3D)
Gamma: 2.28
CCT: 6543 K
| HP ZBook Fury 16 G9 BOE0A52, IPS, 3840x2400, 16" | HP ZBook Studio 16 G9 62U04EA BOE0A52, IPS, 3840x2400, 16" | HP ZBook Firefly 16 G9-6B897EA BOE0A02, IPS, 1920x1200, 16" | Lenovo ThinkPad P16 G1 RTX A5500 LP160UQ1-SPB1, IPS, 3840x2400, 16" | Dell Precision 7000 7670 Performance Samsung 160YV03, OLED, 3840x2400, 16" | MSI CreatorPro Z16P B12UKST B160QAN02.N, IPS, 2560x1600, 16" | |
|---|---|---|---|---|---|---|
| Display | 0% | -18% | -2% | 6% | 0% | |
| Display P3 Coverage (%) | 97.4 | 97.5 0% | 68.1 -30% | 82.9 -15% | 99.9 3% | 97.6 0% |
| sRGB Coverage (%) | 99.9 | 99.9 0% | 96.1 -4% | 98.9 -1% | 100 0% | 99.9 0% |
| AdobeRGB 1998 Coverage (%) | 86.3 | 86.3 0% | 70 -19% | 95.9 11% | 98.1 14% | 87.4 1% |
| Response Times | 9% | -206% | -281% | 83% | 11% | |
| Response Time Grey 50% / Grey 80% * (ms) | 13.7 ? | 15.3 ? -12% | 52.8 ? -285% | 45.6 ? -233% | 1.84 ? 87% | 12.8 ? 7% |
| Response Time Black / White * (ms) | 8.6 ? | 6.1 ? 29% | 19.5 ? -127% | 36.8 ? -328% | 1.92 ? 78% | 7.4 ? 14% |
| PWM Frequency (Hz) | 59.52 ? | |||||
| Screen | 18% | -40% | -12% | -61% | 5% | |
| Brightness middle (cd/m²) | 530.5 | 554 4% | 526 -1% | 601.9 13% | 325.2 -39% | 407 -23% |
| Brightness (cd/m²) | 476 | 516 8% | 499 5% | 569 20% | 328 -31% | 388 -18% |
| Brightness Distribution (%) | 83 | 84 1% | 93 12% | 77 -7% | 97 17% | 88 6% |
| Black Level * (cd/m²) | 0.57 | 0.47 18% | 0.31 46% | 0.47 18% | 0.36 37% | |
| Contrast (:1) | 931 | 1179 27% | 1697 82% | 1281 38% | 1131 21% | |
| Colorchecker dE 2000 * | 2.26 | 1 56% | 3.6 -59% | 2.45 -8% | 4.59 -103% | 1.3 42% |
| Colorchecker dE 2000 calibrated * | 4.73 | 0.6 87% | 2.6 45% | 0.7 85% | ||
| Greyscale dE 2000 * | 1 | 1.6 -60% | 5.5 -450% | 2.6 -160% | 2.5 -150% | 2.1 -110% |
| Gamma | 2.28 96% | 2.29 96% | 2.02 109% | 2.3 96% | 2.1 105% | 2.26 97% |
| CCT | 6543 99% | 6458 101% | 6527 100% | 6805 96% | 6541 99% | 6437 101% |
| Colorchecker dE 2000 max. * | 2.4 | 6.6 | 4.46 | 7.65 | 2.5 | |
| Total Average (Program / Settings) | 9% /
12% | -88% /
-60% | -98% /
-54% | 9% /
-12% | 5% /
5% |
* ... smaller is better
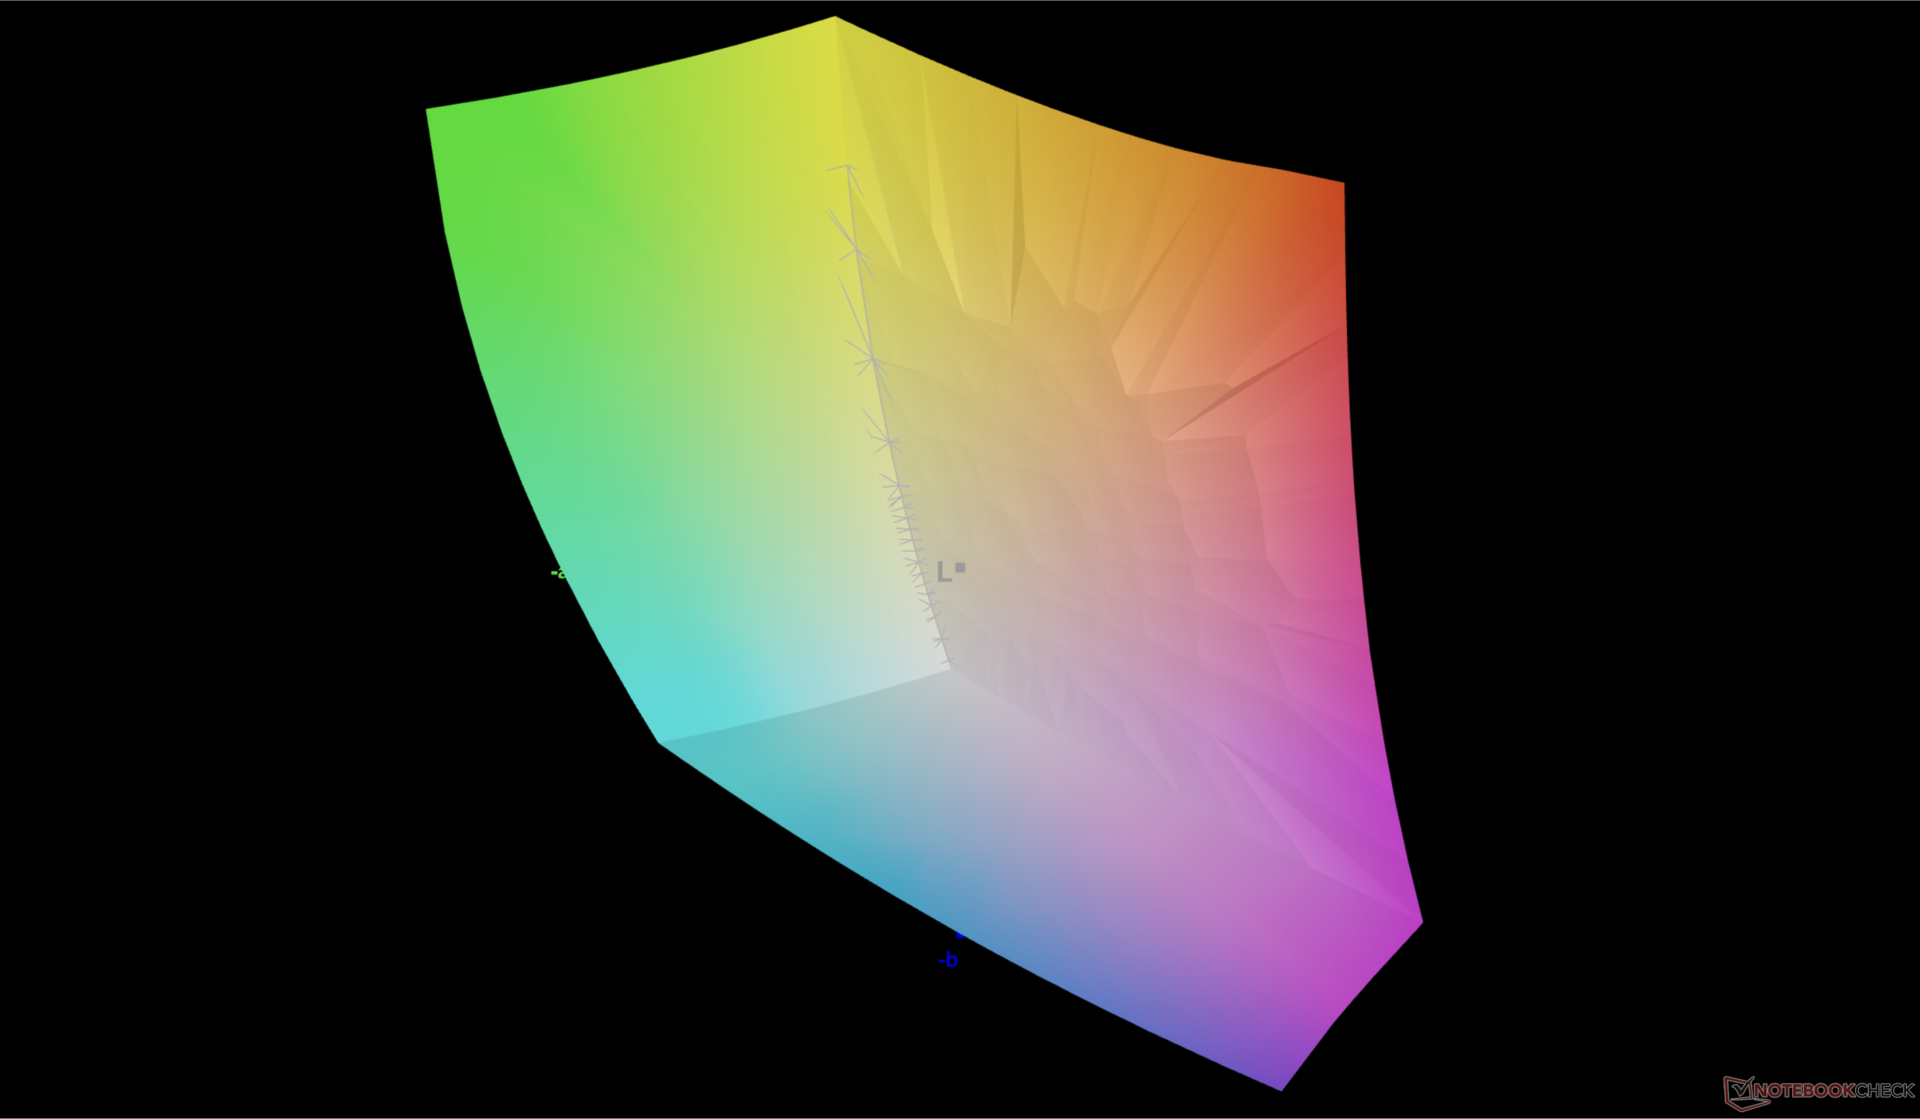
该显示器在开箱时就根据P3标准进行了校准,平均灰度和彩色DeltaE值分别仅为1.0和2.26。
Display Response Times
| ↔ Response Time Black to White | ||
|---|---|---|
| 8.6 ms ... rise ↗ and fall ↘ combined | ↗ 4.7 ms rise | 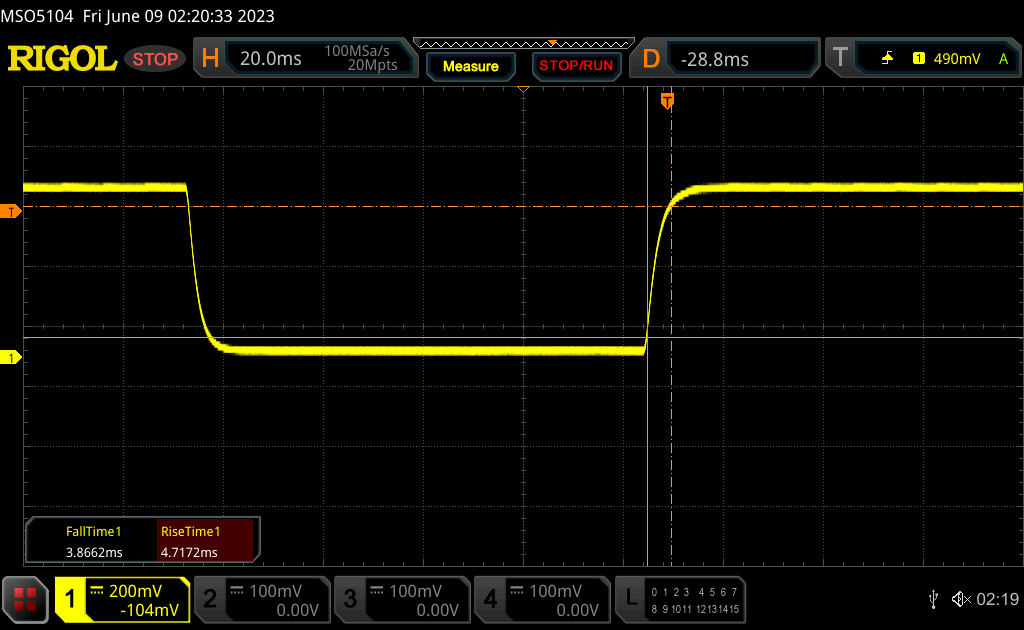 |
| ↘ 3.9 ms fall | ||
| The screen shows fast response rates in our tests and should be suited for gaming. In comparison, all tested devices range from 0.1 (minimum) to 240 (maximum) ms. » 24 % of all devices are better. This means that the measured response time is better than the average of all tested devices (19.8 ms). | ||
| ↔ Response Time 50% Grey to 80% Grey | ||
| 13.7 ms ... rise ↗ and fall ↘ combined | ↗ 6.6 ms rise | 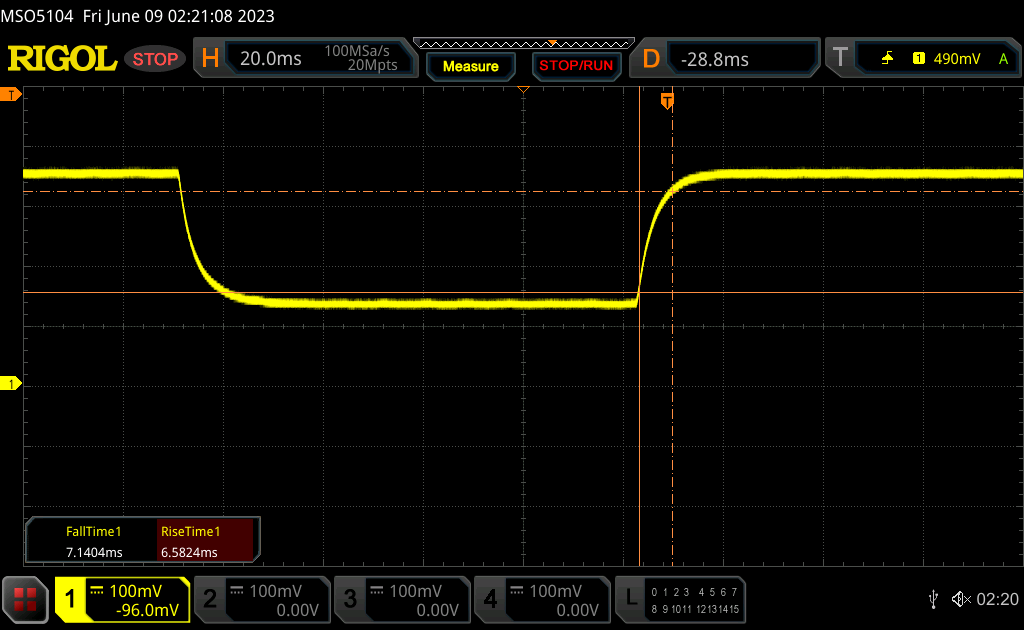 |
| ↘ 7.1 ms fall | ||
| The screen shows good response rates in our tests, but may be too slow for competitive gamers. In comparison, all tested devices range from 0.165 (minimum) to 636 (maximum) ms. » 28 % of all devices are better. This means that the measured response time is better than the average of all tested devices (31 ms). | ||
Screen Flickering / PWM (Pulse-Width Modulation)
| Screen flickering / PWM not detected | 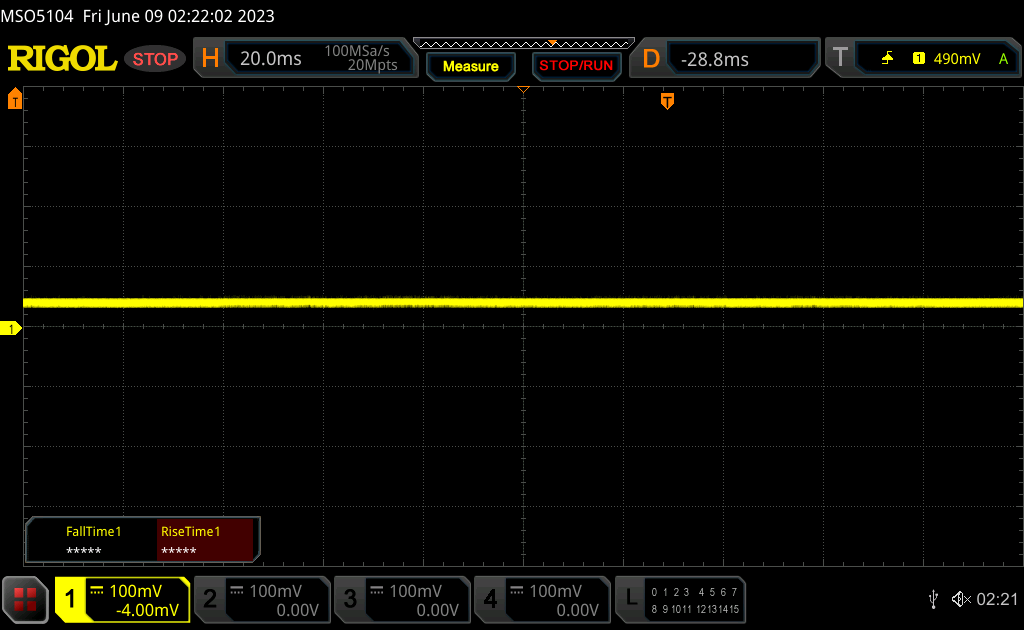 | ||
In comparison: 52 % of all tested devices do not use PWM to dim the display. If PWM was detected, an average of 7754 (minimum: 5 - maximum: 343500) Hz was measured. | |||
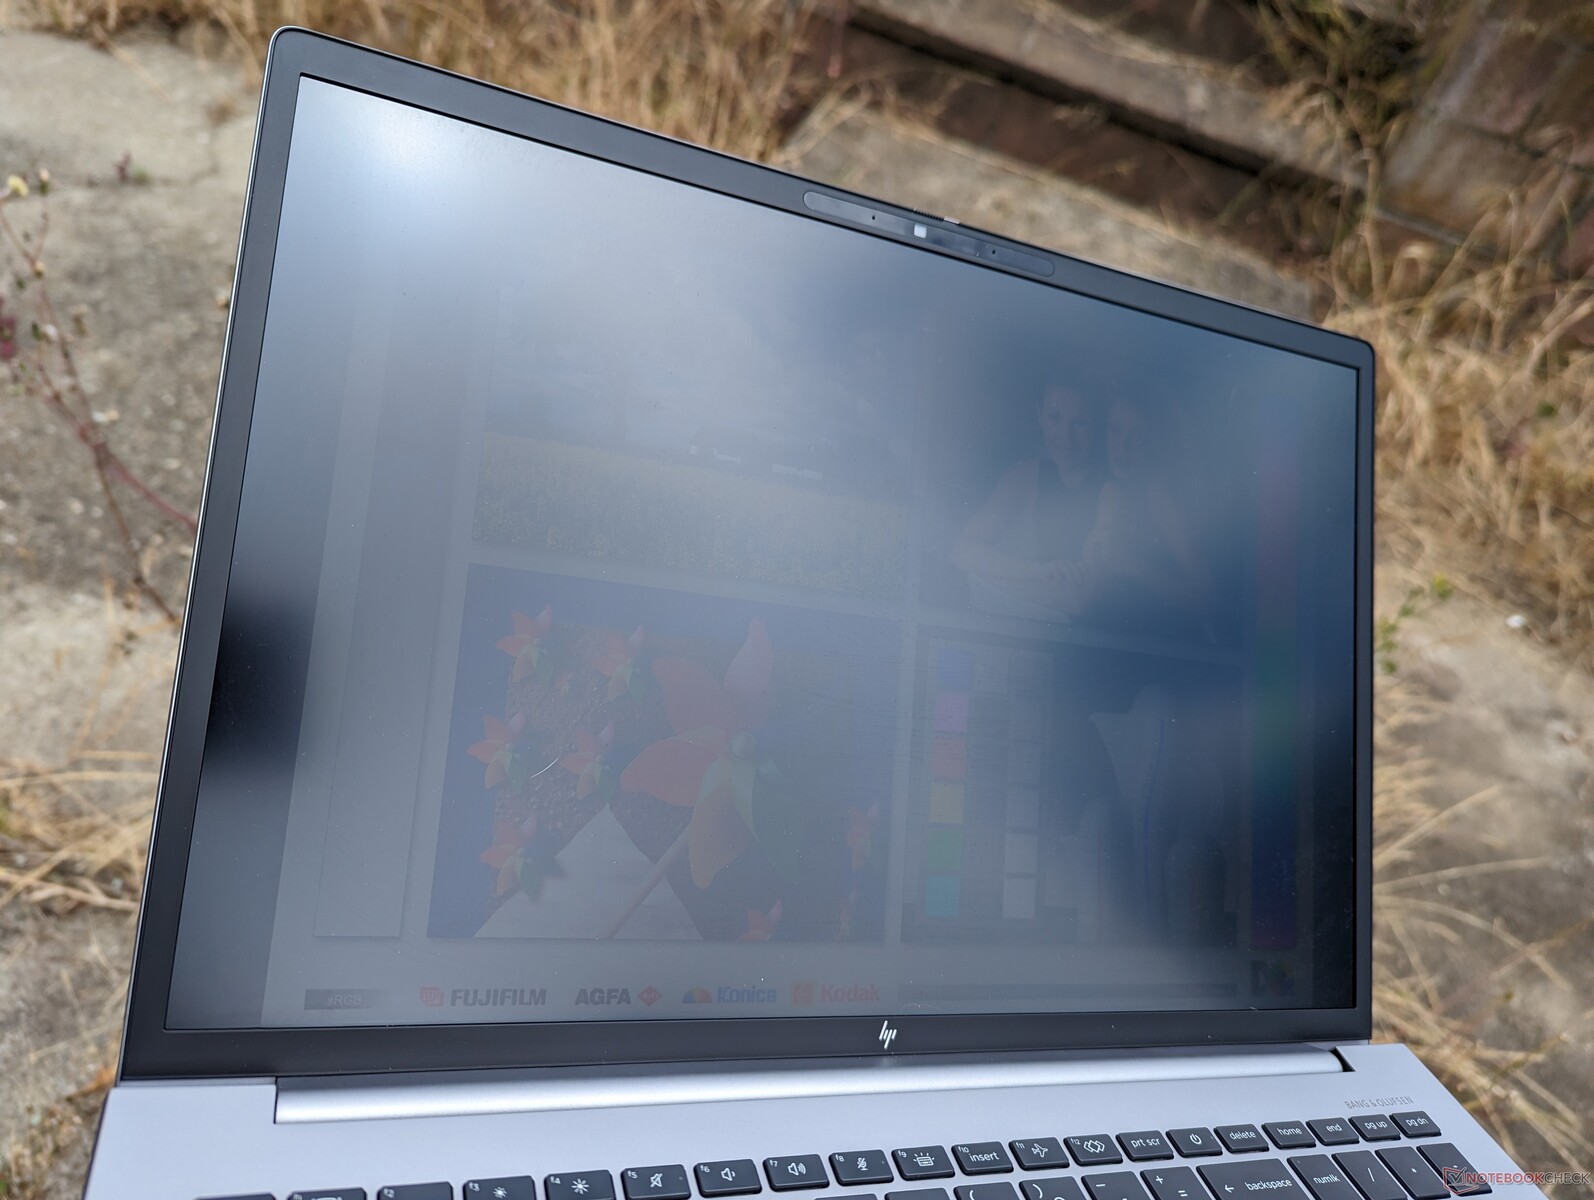
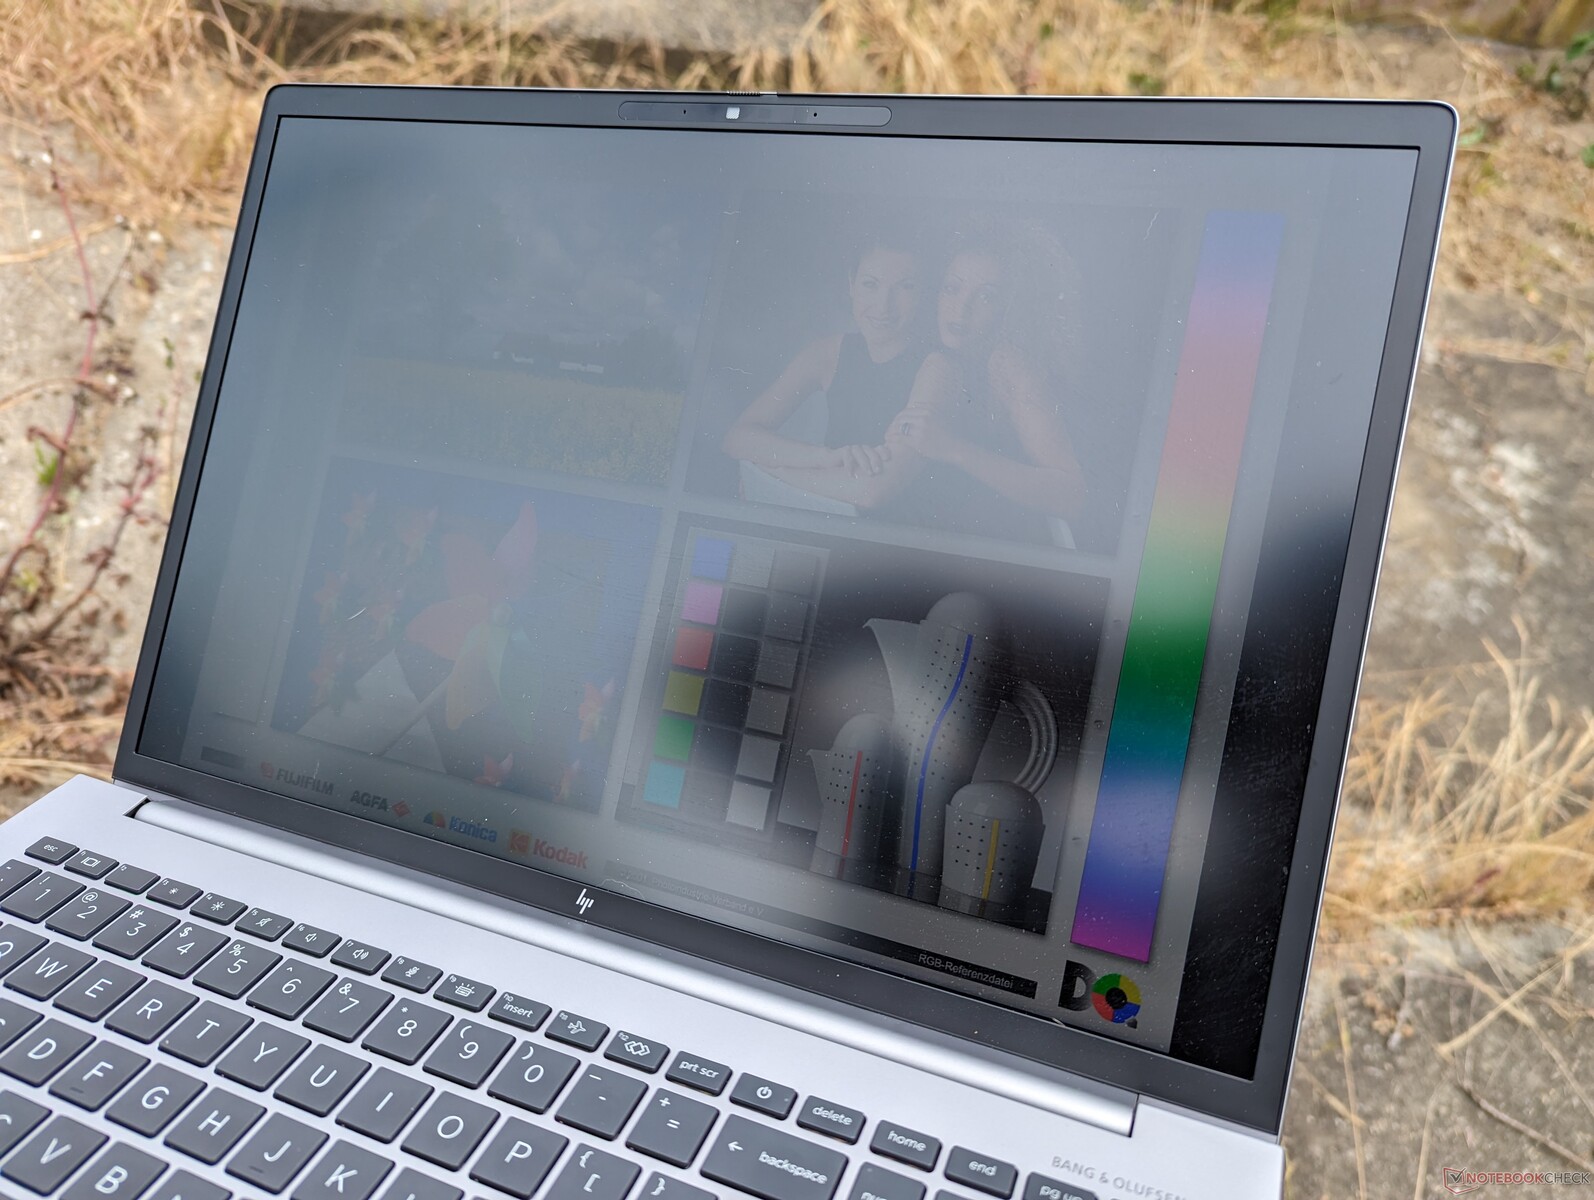
室外能见度在树荫下还算不错,与许多消费类超极本相当,因为400尼特是一个常见的目标。如果室外能见度是一个优先事项,惠普提供了一个更明亮的1000尼特选项,但目前面板仅限于IPS和分辨率只有1920 x 1200。
值得注意的是,默认情况下启用了显示电源节省功能,这意味着如果用电池供电,显示器的最大亮度将下降80尼特之多。为了防止这种情况,请启动英特尔图形命令中心,并进入系统和电源子菜单,以切换关闭显示节能功能。
性能--第12代英特尔Alder Lake-H与Nvidia RTX Ampere的关系
测试条件
在运行下面的基准测试之前,我们将我们的设备设置为性能模式。除了标准的Windows模式外,惠普没有额外的电源配置文件,也不支持Optimus 2.0或MUX等高级功能。
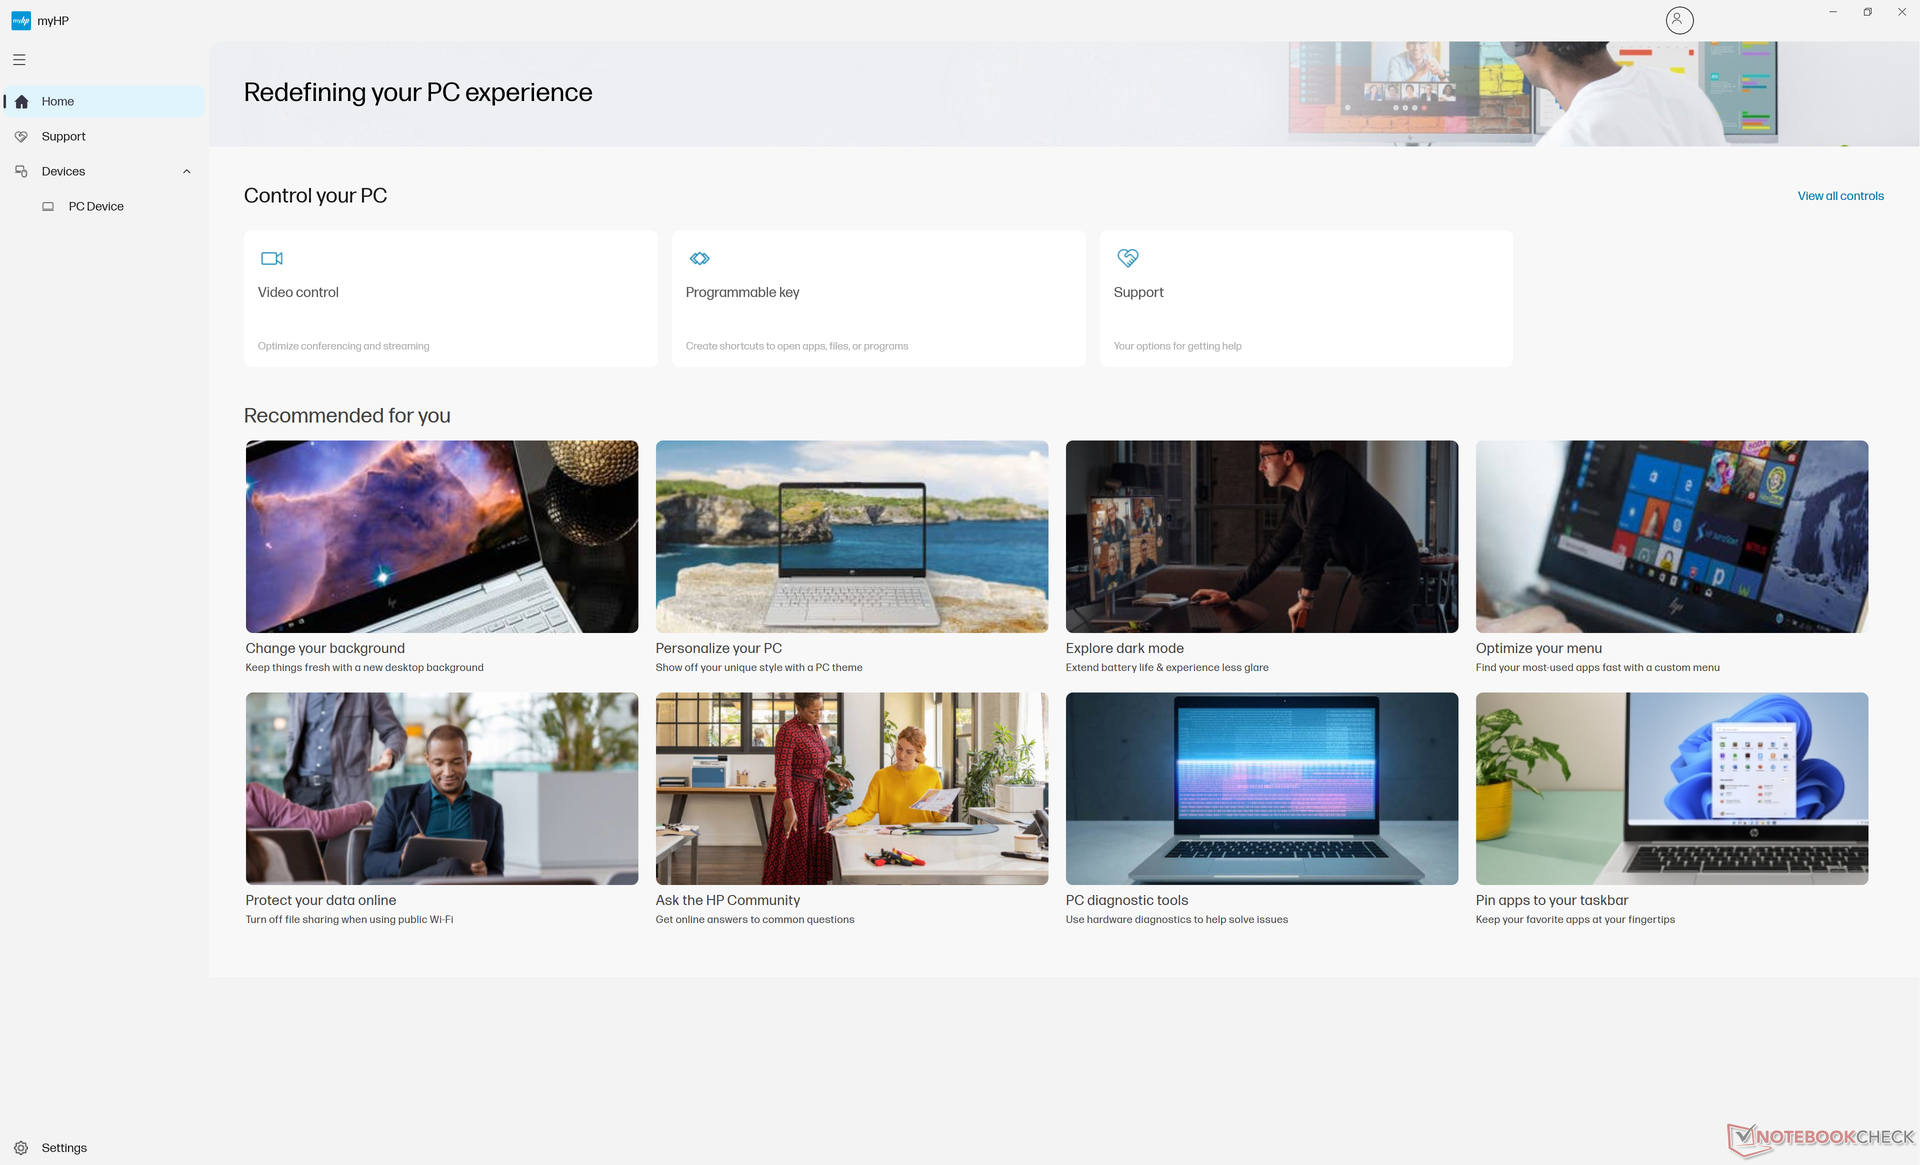
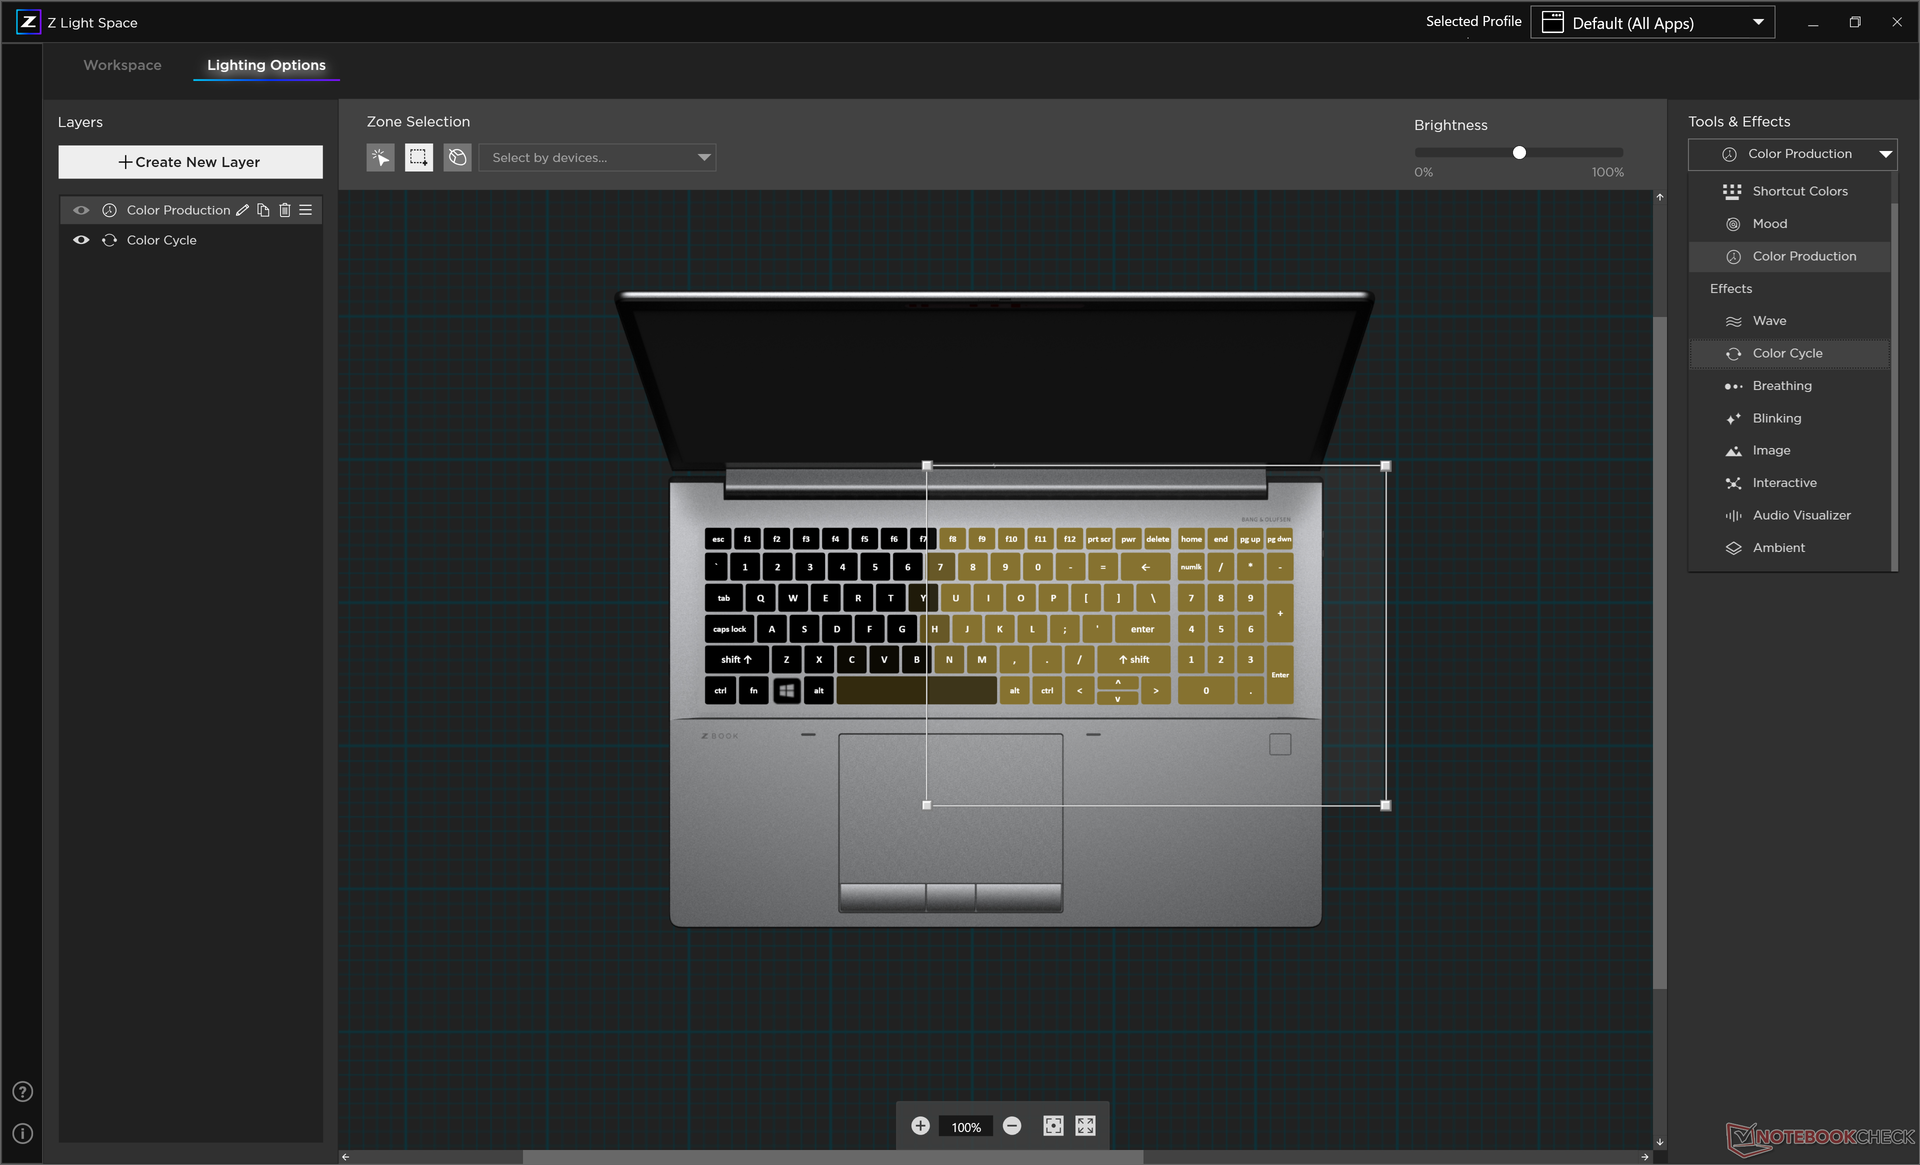
建议用户熟悉MyHP和Z Light Space,分别用于惠普特定的软件更新和RGB键盘设置。
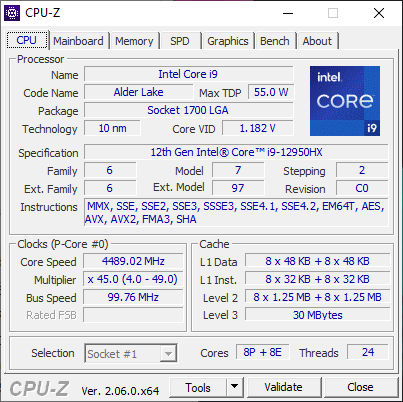
处理器
第12代 酷睿i9-12950HX是目前最快的移动CPU之一,同时支持vPro和ECC,直到推出第13代 酷睿i9-13950HX.对于第13代的选择,Fury 16 G10最近已经开始出货。
与我们数据库中配备相同的酷睿i9-12950HX CPU的普通笔记本电脑相比,我们的惠普的处理器表现略差约5%。更糟糕的是,当受到长时间的压力时,CPU出现了更剧烈的跳动。例如,在循环运行CineBench R15 xT时,性能在第7或第8次循环后会下降约20%。ThinkPad P16 G1 的CPU节流程度较浅,如我们下面的对比图所示。
从Core i9-12950HX降级到Core i7-12850HX 配置,预计会对单线程和多线程性能产生约15%至20%的影响。
Cinebench R15 Multi Loop
Cinebench R23: Multi Core | Single Core
Cinebench R20: CPU (Multi Core) | CPU (Single Core)
Cinebench R15: CPU Multi 64Bit | CPU Single 64Bit
Blender: v2.79 BMW27 CPU
7-Zip 18.03: 7z b 4 | 7z b 4 -mmt1
Geekbench 5.5: Multi-Core | Single-Core
HWBOT x265 Benchmark v2.2: 4k Preset
LibreOffice : 20 Documents To PDF
R Benchmark 2.5: Overall mean
* ... smaller is better
AIDA64: FP32 Ray-Trace | FPU Julia | CPU SHA3 | CPU Queen | FPU SinJulia | FPU Mandel | CPU AES | CPU ZLib | FP64 Ray-Trace | CPU PhotoWorxx
| Performance rating | |
| Average Intel Core i9-12950HX | |
| Lenovo ThinkPad P16 G1 RTX A5500 | |
| HP ZBook Fury 16 G9 | |
| MSI CreatorPro Z16P B12UKST | |
| HP ZBook Studio 16 G9 62U04EA | |
| Dell Precision 7000 7670 Performance | |
| HP ZBook Firefly 16 G9-6B897EA | |
| AIDA64 / FP32 Ray-Trace | |
| Lenovo ThinkPad P16 G1 RTX A5500 | |
| Average Intel Core i9-12950HX (15499 - 22868, n=7) | |
| HP ZBook Fury 16 G9 | |
| Dell Precision 7000 7670 Performance | |
| HP ZBook Studio 16 G9 62U04EA | |
| MSI CreatorPro Z16P B12UKST | |
| HP ZBook Firefly 16 G9-6B897EA | |
| AIDA64 / FPU Julia | |
| HP ZBook Fury 16 G9 | |
| Lenovo ThinkPad P16 G1 RTX A5500 | |
| Average Intel Core i9-12950HX (77846 - 115907, n=7) | |
| HP ZBook Studio 16 G9 62U04EA | |
| Dell Precision 7000 7670 Performance | |
| MSI CreatorPro Z16P B12UKST | |
| HP ZBook Firefly 16 G9-6B897EA | |
| AIDA64 / CPU SHA3 | |
| Lenovo ThinkPad P16 G1 RTX A5500 | |
| Average Intel Core i9-12950HX (3426 - 5069, n=7) | |
| HP ZBook Fury 16 G9 | |
| HP ZBook Studio 16 G9 62U04EA | |
| MSI CreatorPro Z16P B12UKST | |
| Dell Precision 7000 7670 Performance | |
| HP ZBook Firefly 16 G9-6B897EA | |
| AIDA64 / CPU Queen | |
| HP ZBook Studio 16 G9 62U04EA | |
| Average Intel Core i9-12950HX (102752 - 104726, n=7) | |
| Lenovo ThinkPad P16 G1 RTX A5500 | |
| Dell Precision 7000 7670 Performance | |
| HP ZBook Fury 16 G9 | |
| MSI CreatorPro Z16P B12UKST | |
| HP ZBook Firefly 16 G9-6B897EA | |
| AIDA64 / FPU SinJulia | |
| Lenovo ThinkPad P16 G1 RTX A5500 | |
| HP ZBook Fury 16 G9 | |
| Average Intel Core i9-12950HX (10134 - 12823, n=7) | |
| Dell Precision 7000 7670 Performance | |
| HP ZBook Studio 16 G9 62U04EA | |
| MSI CreatorPro Z16P B12UKST | |
| HP ZBook Firefly 16 G9-6B897EA | |
| AIDA64 / FPU Mandel | |
| HP ZBook Fury 16 G9 | |
| Lenovo ThinkPad P16 G1 RTX A5500 | |
| Average Intel Core i9-12950HX (37146 - 57340, n=7) | |
| HP ZBook Studio 16 G9 62U04EA | |
| Dell Precision 7000 7670 Performance | |
| MSI CreatorPro Z16P B12UKST | |
| HP ZBook Firefly 16 G9-6B897EA | |
| AIDA64 / CPU AES | |
| MSI CreatorPro Z16P B12UKST | |
| Average Intel Core i9-12950HX (72599 - 181128, n=7) | |
| HP ZBook Fury 16 G9 | |
| Lenovo ThinkPad P16 G1 RTX A5500 | |
| HP ZBook Studio 16 G9 62U04EA | |
| Dell Precision 7000 7670 Performance | |
| HP ZBook Firefly 16 G9-6B897EA | |
| AIDA64 / CPU ZLib | |
| Lenovo ThinkPad P16 G1 RTX A5500 | |
| HP ZBook Fury 16 G9 | |
| Average Intel Core i9-12950HX (996 - 1417, n=7) | |
| HP ZBook Studio 16 G9 62U04EA | |
| MSI CreatorPro Z16P B12UKST | |
| Dell Precision 7000 7670 Performance | |
| HP ZBook Firefly 16 G9-6B897EA | |
| AIDA64 / FP64 Ray-Trace | |
| Lenovo ThinkPad P16 G1 RTX A5500 | |
| Average Intel Core i9-12950HX (8455 - 12432, n=7) | |
| HP ZBook Fury 16 G9 | |
| HP ZBook Studio 16 G9 62U04EA | |
| Dell Precision 7000 7670 Performance | |
| MSI CreatorPro Z16P B12UKST | |
| HP ZBook Firefly 16 G9-6B897EA | |
| AIDA64 / CPU PhotoWorxx | |
| MSI CreatorPro Z16P B12UKST | |
| Dell Precision 7000 7670 Performance | |
| Average Intel Core i9-12950HX (35479 - 42655, n=7) | |
| Lenovo ThinkPad P16 G1 RTX A5500 | |
| HP ZBook Fury 16 G9 | |
| HP ZBook Studio 16 G9 62U04EA | |
| HP ZBook Firefly 16 G9-6B897EA | |
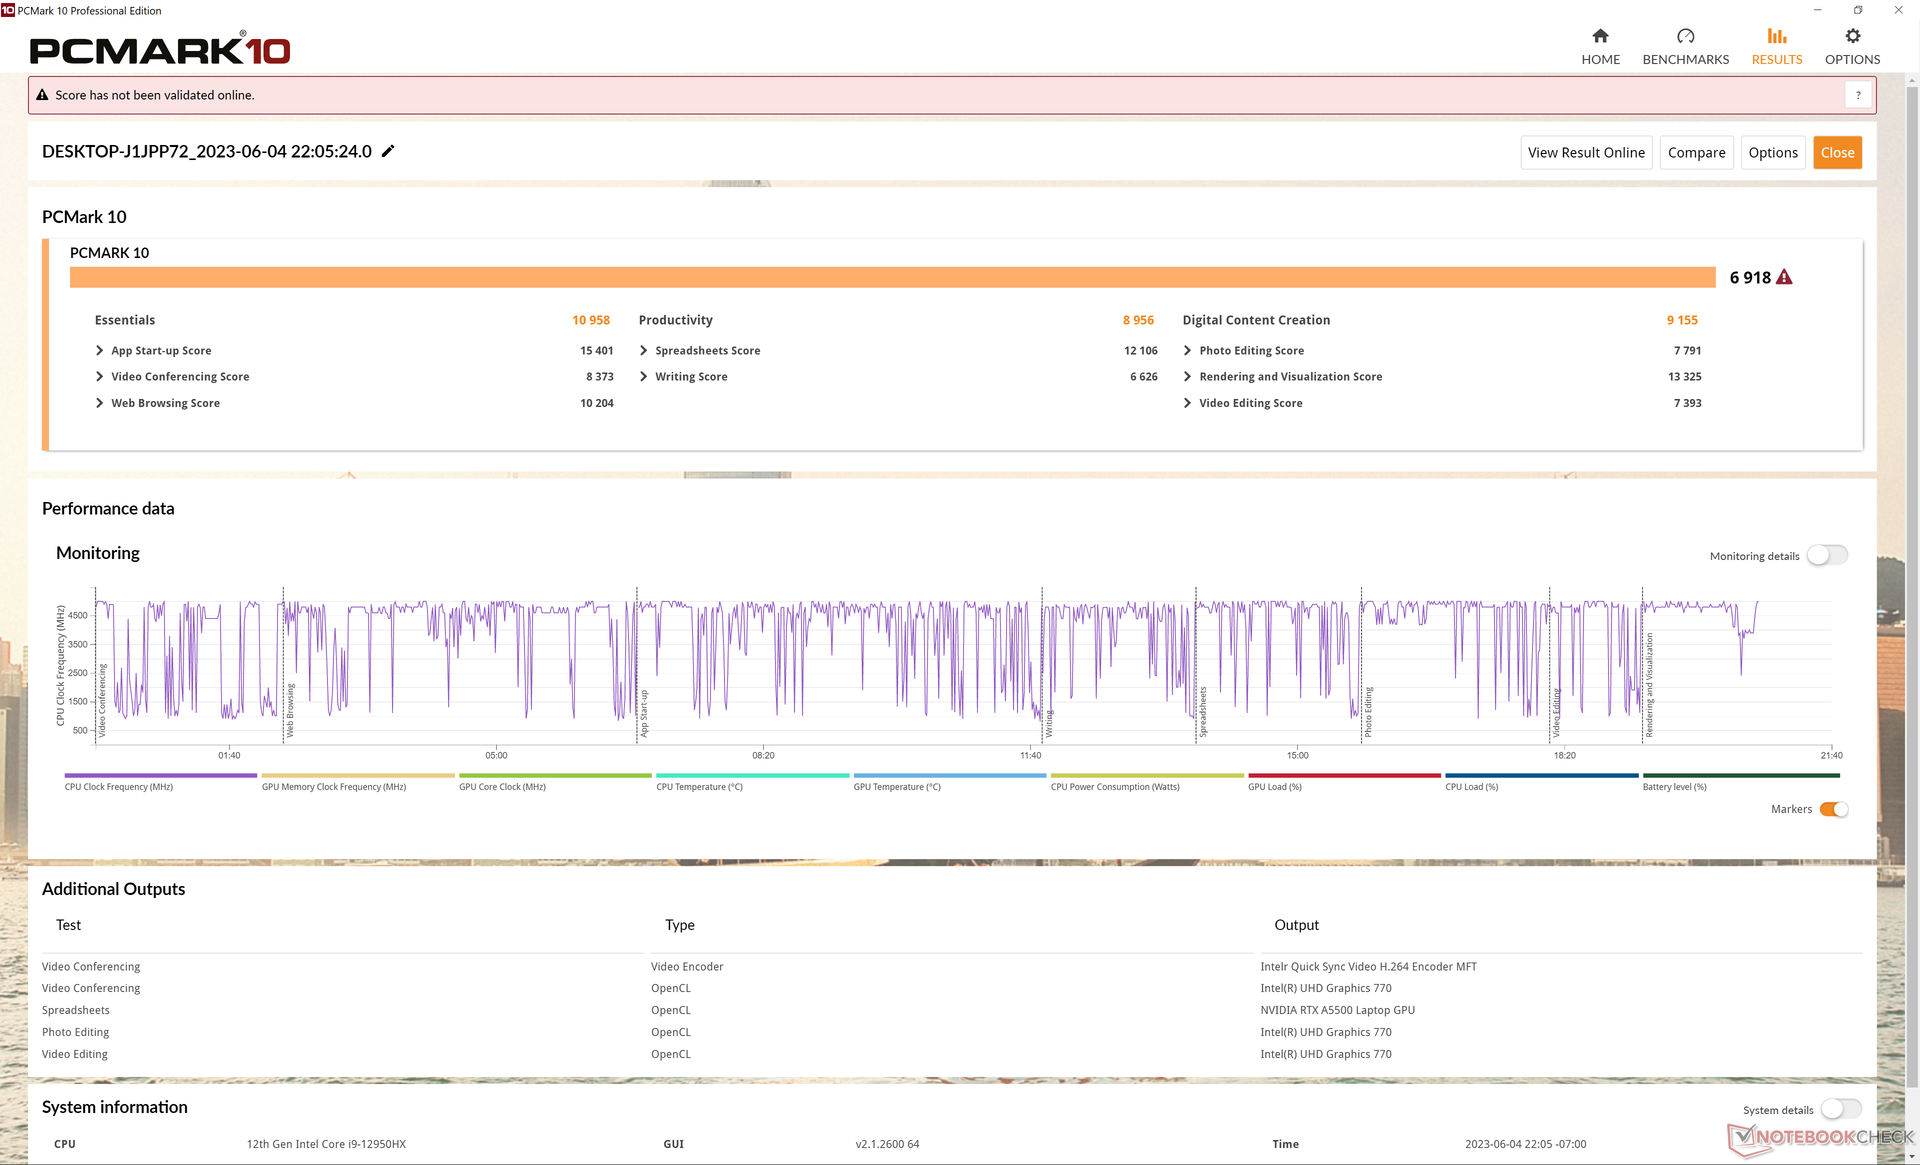
系统性能
PCMark结果与戴尔Precision 7670和联想ThinkPad P16 G1都相当。请注意,与较小的 ZBook Firefly 16 G9在数字内容创作分测试中,由于我们的Fury 16 G9中的RTX A5500 GPU速度更快,因此具有明显的优势。
CrossMark: Overall | Productivity | Creativity | Responsiveness
| PCMark 10 / Score | |
| Lenovo ThinkPad P16 G1 RTX A5500 | |
| MSI CreatorPro Z16P B12UKST | |
| Average Intel Core i9-12950HX, NVIDIA RTX A5500 Laptop GPU (6883 - 7236, n=3) | |
| HP ZBook Fury 16 G9 | |
| Dell Precision 7000 7670 Performance | |
| HP ZBook Studio 16 G9 62U04EA | |
| HP ZBook Firefly 16 G9-6B897EA | |
| PCMark 10 / Essentials | |
| Dell Precision 7000 7670 Performance | |
| Average Intel Core i9-12950HX, NVIDIA RTX A5500 Laptop GPU (10898 - 11465, n=3) | |
| HP ZBook Fury 16 G9 | |
| Lenovo ThinkPad P16 G1 RTX A5500 | |
| MSI CreatorPro Z16P B12UKST | |
| HP ZBook Firefly 16 G9-6B897EA | |
| HP ZBook Studio 16 G9 62U04EA | |
| PCMark 10 / Productivity | |
| Lenovo ThinkPad P16 G1 RTX A5500 | |
| MSI CreatorPro Z16P B12UKST | |
| HP ZBook Fury 16 G9 | |
| Average Intel Core i9-12950HX, NVIDIA RTX A5500 Laptop GPU (8054 - 9489, n=3) | |
| HP ZBook Firefly 16 G9-6B897EA | |
| Dell Precision 7000 7670 Performance | |
| HP ZBook Studio 16 G9 62U04EA | |
| PCMark 10 / Digital Content Creation | |
| Lenovo ThinkPad P16 G1 RTX A5500 | |
| MSI CreatorPro Z16P B12UKST | |
| Dell Precision 7000 7670 Performance | |
| Average Intel Core i9-12950HX, NVIDIA RTX A5500 Laptop GPU (9155 - 9944, n=3) | |
| HP ZBook Studio 16 G9 62U04EA | |
| HP ZBook Fury 16 G9 | |
| HP ZBook Firefly 16 G9-6B897EA | |
| CrossMark / Overall | |
| MSI CreatorPro Z16P B12UKST | |
| HP ZBook Fury 16 G9 | |
| Lenovo ThinkPad P16 G1 RTX A5500 | |
| Average Intel Core i9-12950HX, NVIDIA RTX A5500 Laptop GPU (1801 - 1889, n=3) | |
| HP ZBook Studio 16 G9 62U04EA | |
| Dell Precision 7000 7670 Performance | |
| HP ZBook Firefly 16 G9-6B897EA | |
| CrossMark / Productivity | |
| MSI CreatorPro Z16P B12UKST | |
| HP ZBook Fury 16 G9 | |
| Lenovo ThinkPad P16 G1 RTX A5500 | |
| Average Intel Core i9-12950HX, NVIDIA RTX A5500 Laptop GPU (1684 - 1785, n=3) | |
| HP ZBook Studio 16 G9 62U04EA | |
| Dell Precision 7000 7670 Performance | |
| HP ZBook Firefly 16 G9-6B897EA | |
| CrossMark / Creativity | |
| Lenovo ThinkPad P16 G1 RTX A5500 | |
| HP ZBook Fury 16 G9 | |
| Average Intel Core i9-12950HX, NVIDIA RTX A5500 Laptop GPU (2042 - 2192, n=3) | |
| HP ZBook Studio 16 G9 62U04EA | |
| MSI CreatorPro Z16P B12UKST | |
| Dell Precision 7000 7670 Performance | |
| HP ZBook Firefly 16 G9-6B897EA | |
| CrossMark / Responsiveness | |
| MSI CreatorPro Z16P B12UKST | |
| HP ZBook Fury 16 G9 | |
| HP ZBook Studio 16 G9 62U04EA | |
| Average Intel Core i9-12950HX, NVIDIA RTX A5500 Laptop GPU (1501 - 1585, n=3) | |
| Dell Precision 7000 7670 Performance | |
| Lenovo ThinkPad P16 G1 RTX A5500 | |
| HP ZBook Firefly 16 G9-6B897EA | |
| PCMark 10 Score | 6918 points | |
Help | ||
| AIDA64 / Memory Copy | |
| Dell Precision 7000 7670 Performance | |
| Average Intel Core i9-12950HX (59731 - 64732, n=7) | |
| Lenovo ThinkPad P16 G1 RTX A5500 | |
| MSI CreatorPro Z16P B12UKST | |
| HP ZBook Studio 16 G9 62U04EA | |
| HP ZBook Fury 16 G9 | |
| HP ZBook Firefly 16 G9-6B897EA | |
| AIDA64 / Memory Read | |
| Dell Precision 7000 7670 Performance | |
| Average Intel Core i9-12950HX (59744 - 70359, n=7) | |
| MSI CreatorPro Z16P B12UKST | |
| HP ZBook Studio 16 G9 62U04EA | |
| Lenovo ThinkPad P16 G1 RTX A5500 | |
| HP ZBook Fury 16 G9 | |
| HP ZBook Firefly 16 G9-6B897EA | |
| AIDA64 / Memory Write | |
| MSI CreatorPro Z16P B12UKST | |
| Dell Precision 7000 7670 Performance | |
| HP ZBook Studio 16 G9 62U04EA | |
| Average Intel Core i9-12950HX (57750 - 67899, n=7) | |
| HP ZBook Firefly 16 G9-6B897EA | |
| Lenovo ThinkPad P16 G1 RTX A5500 | |
| HP ZBook Fury 16 G9 | |
| AIDA64 / Memory Latency | |
| MSI CreatorPro Z16P B12UKST | |
| HP ZBook Fury 16 G9 | |
| Lenovo ThinkPad P16 G1 RTX A5500 | |
| HP ZBook Firefly 16 G9-6B897EA | |
| HP ZBook Studio 16 G9 62U04EA | |
| Average Intel Core i9-12950HX (84.5 - 92.2, n=7) | |
| Dell Precision 7000 7670 Performance | |
* ... smaller is better
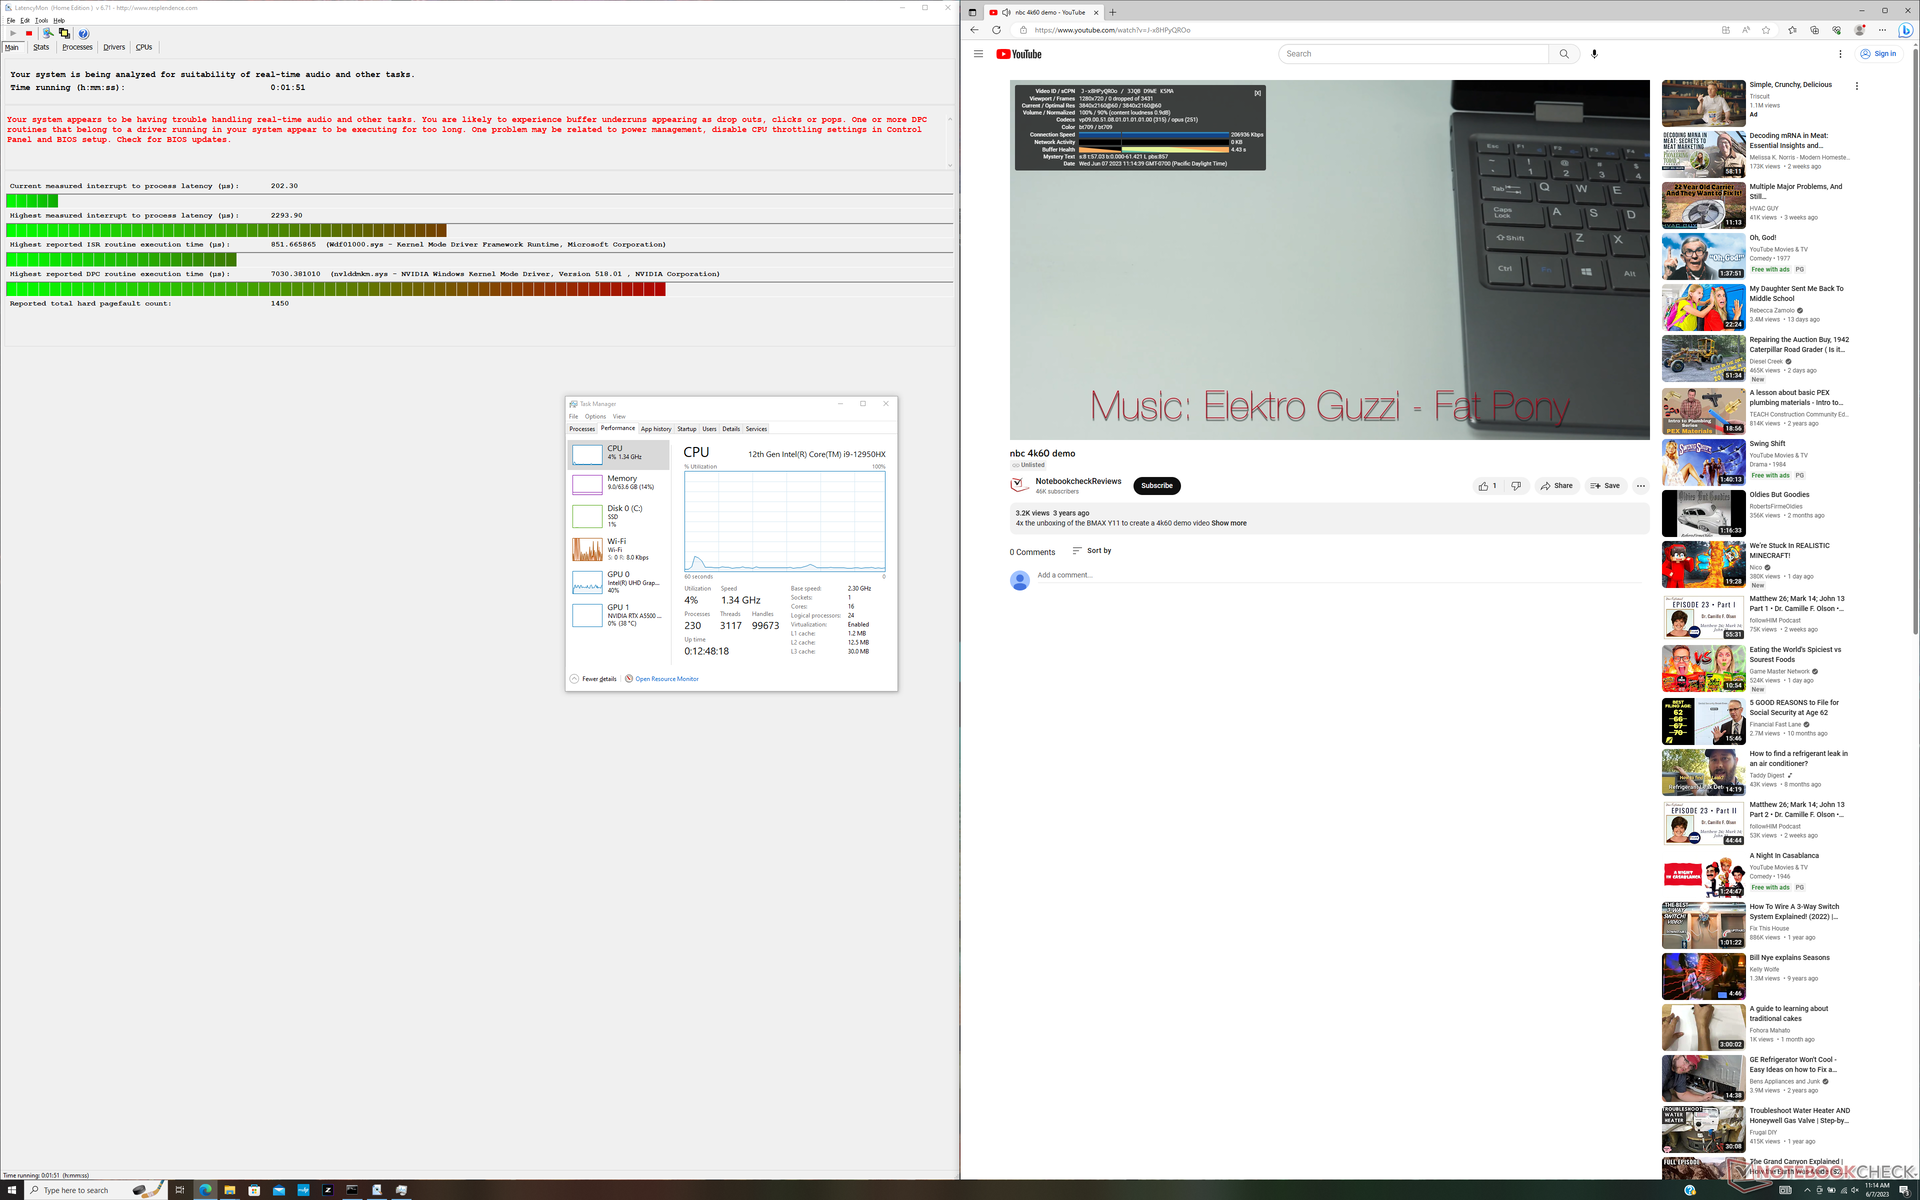
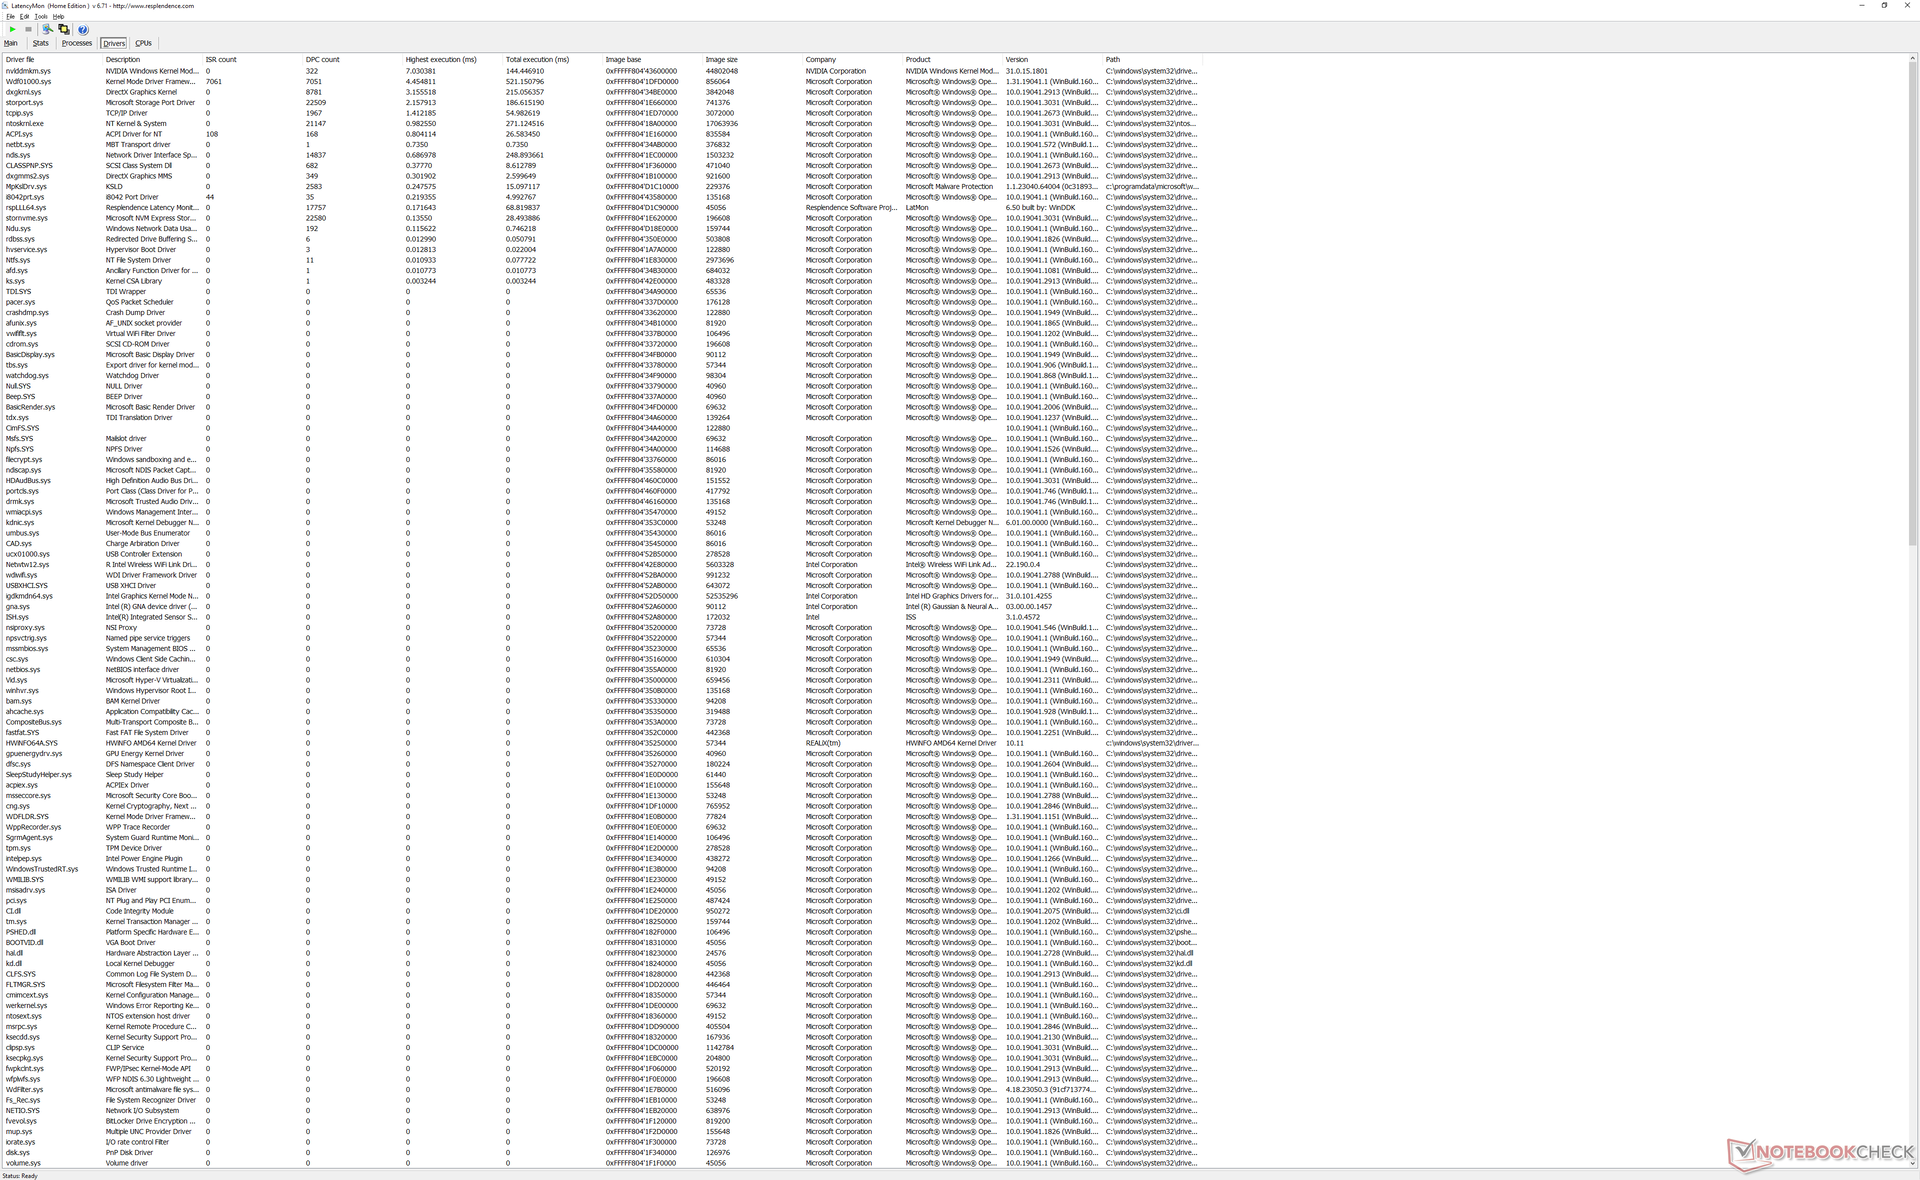
DPC延时
LatencyMon显示了在打开我们的主页的多个浏览器标签时的DPC问题。在测试期间,以60 FPS播放4K视频是完美的,没有掉帧。
| DPC Latencies / LatencyMon - interrupt to process latency (max), Web, Youtube, Prime95 | |
| HP ZBook Fury 16 G9 | |
| Dell Precision 7000 7670 Performance | |
| Lenovo ThinkPad P16 G1 RTX A5500 | |
| HP ZBook Studio 16 G9 62U04EA | |
| HP ZBook Firefly 16 G9-6B897EA | |
| MSI CreatorPro Z16P B12UKST | |
* ... smaller is better
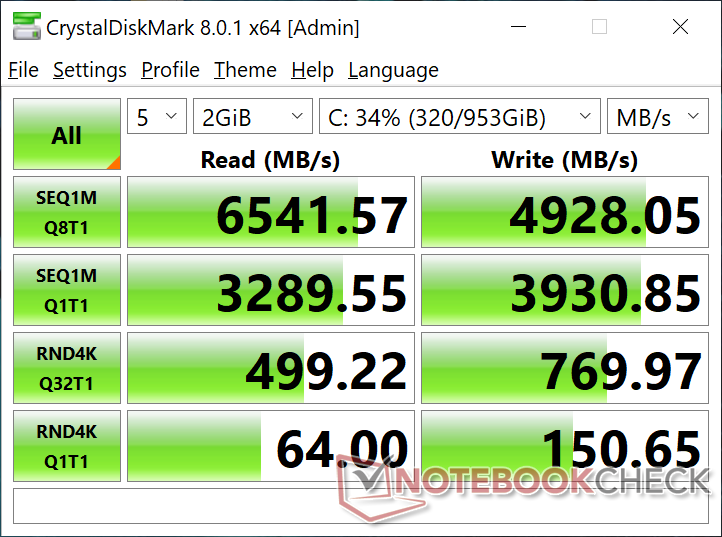
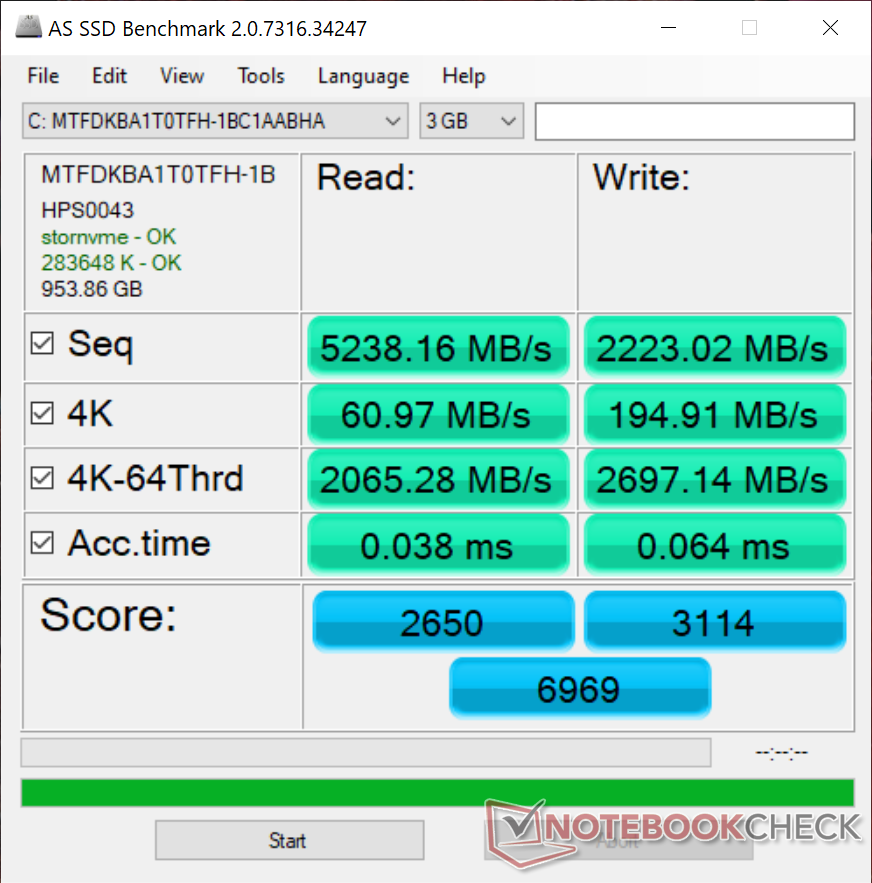
存储设备 - 潜在的性能节流
我们的测试设备配备了相同的1TB美光3400 MTFDKBA1T0TFHSSD,与联想ThinkPad X1 Extreme G5上的联想ThinkPad X1 Extreme G5.不幸的是,正如下面的对比图所示,我们惠普的固态硬盘似乎遭受了重大的性能节流问题。当循环运行DiskSpd时,传输率偶尔会从6500MB/s骤降至1700MB/s,而联想的同一块硬盘会无限期地运行在6500MB/s。这表明,Fury 16可能有冷却固态硬盘的问题。即使经过多次重测,结果也不会改善。

* ... smaller is better
Disk Throttling: DiskSpd Read Loop, Queue Depth 8
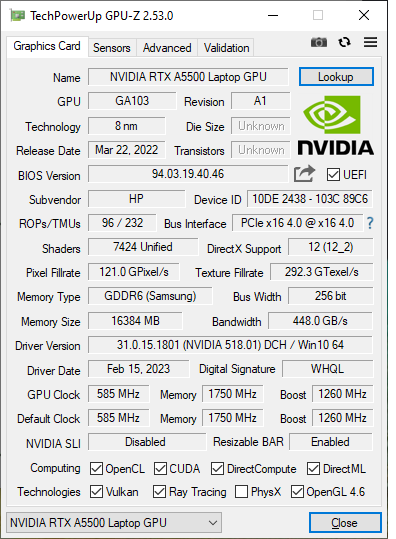
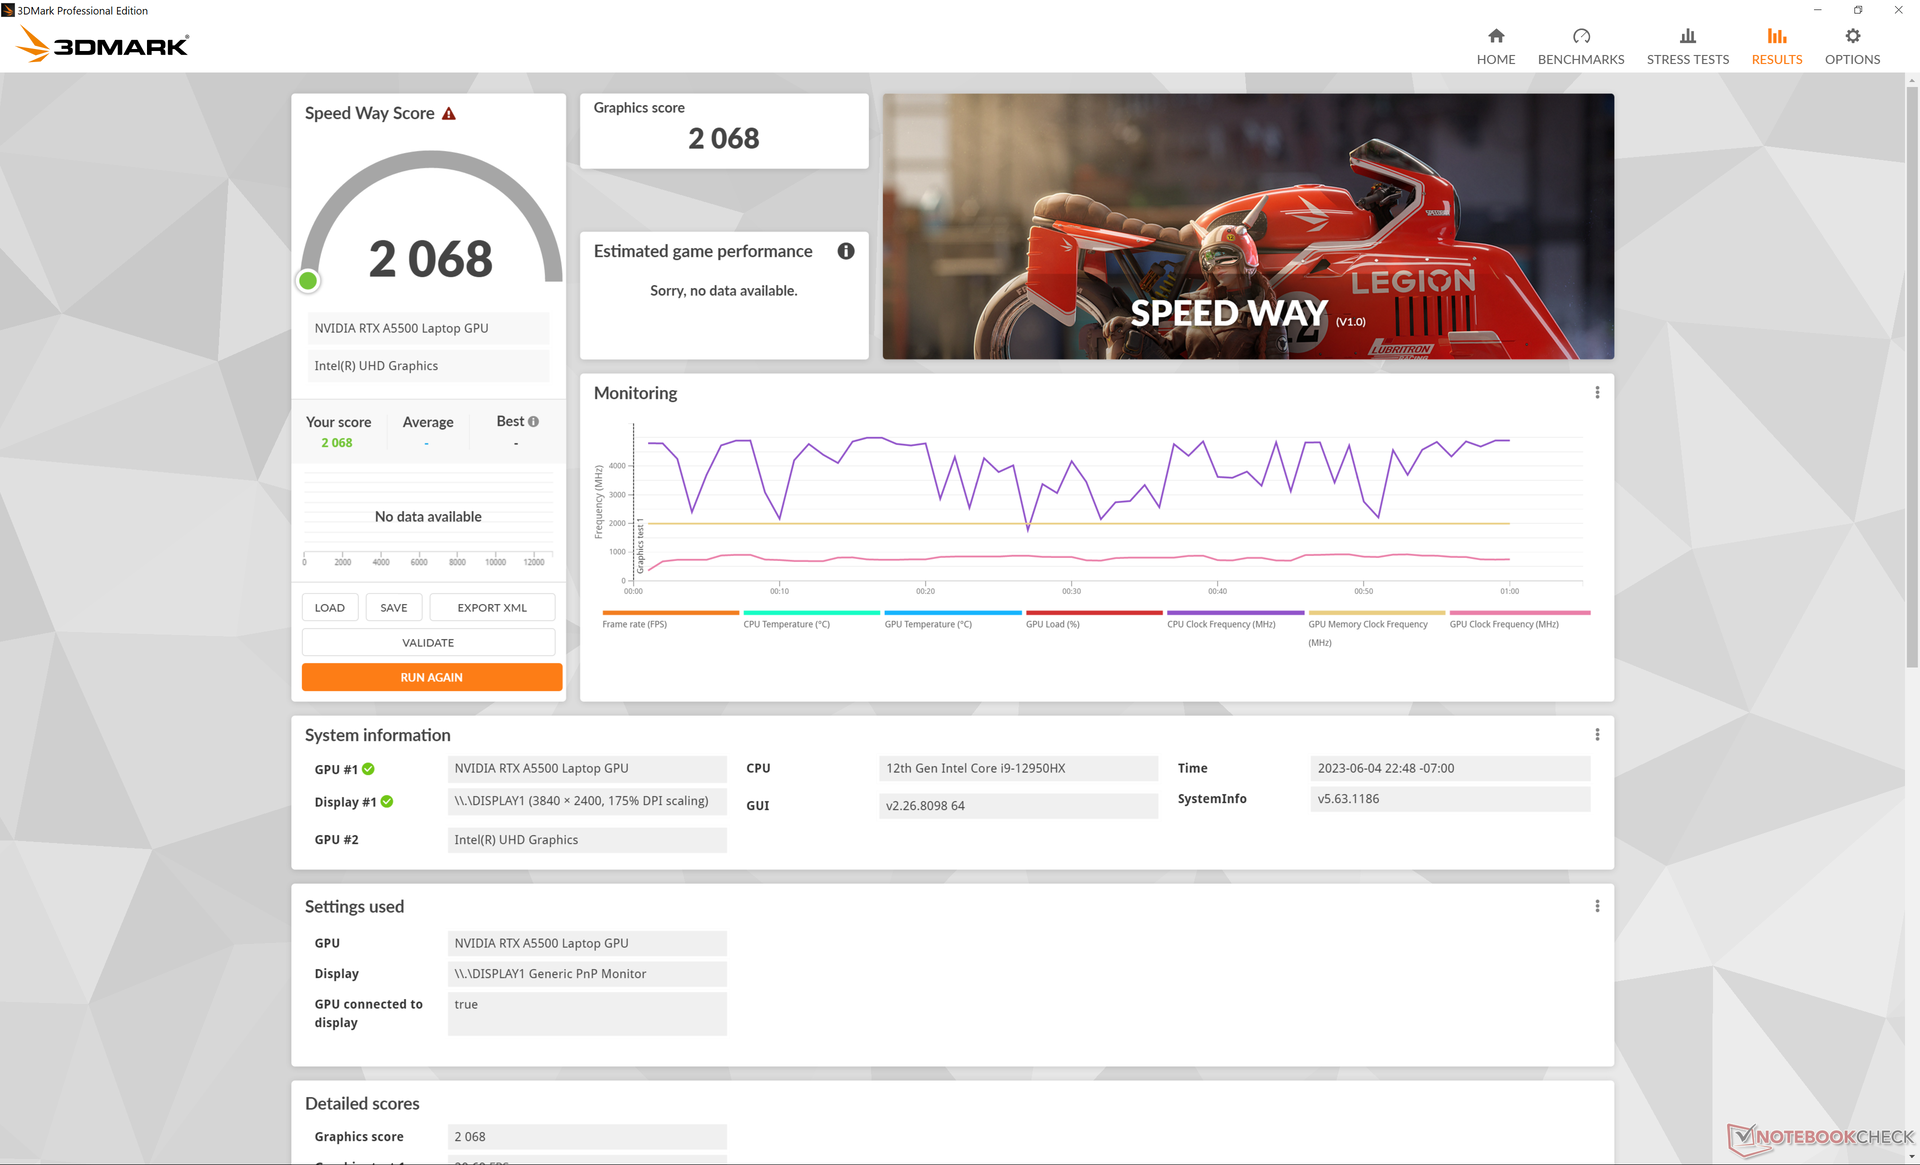
GPU性能 - 100 W TGP
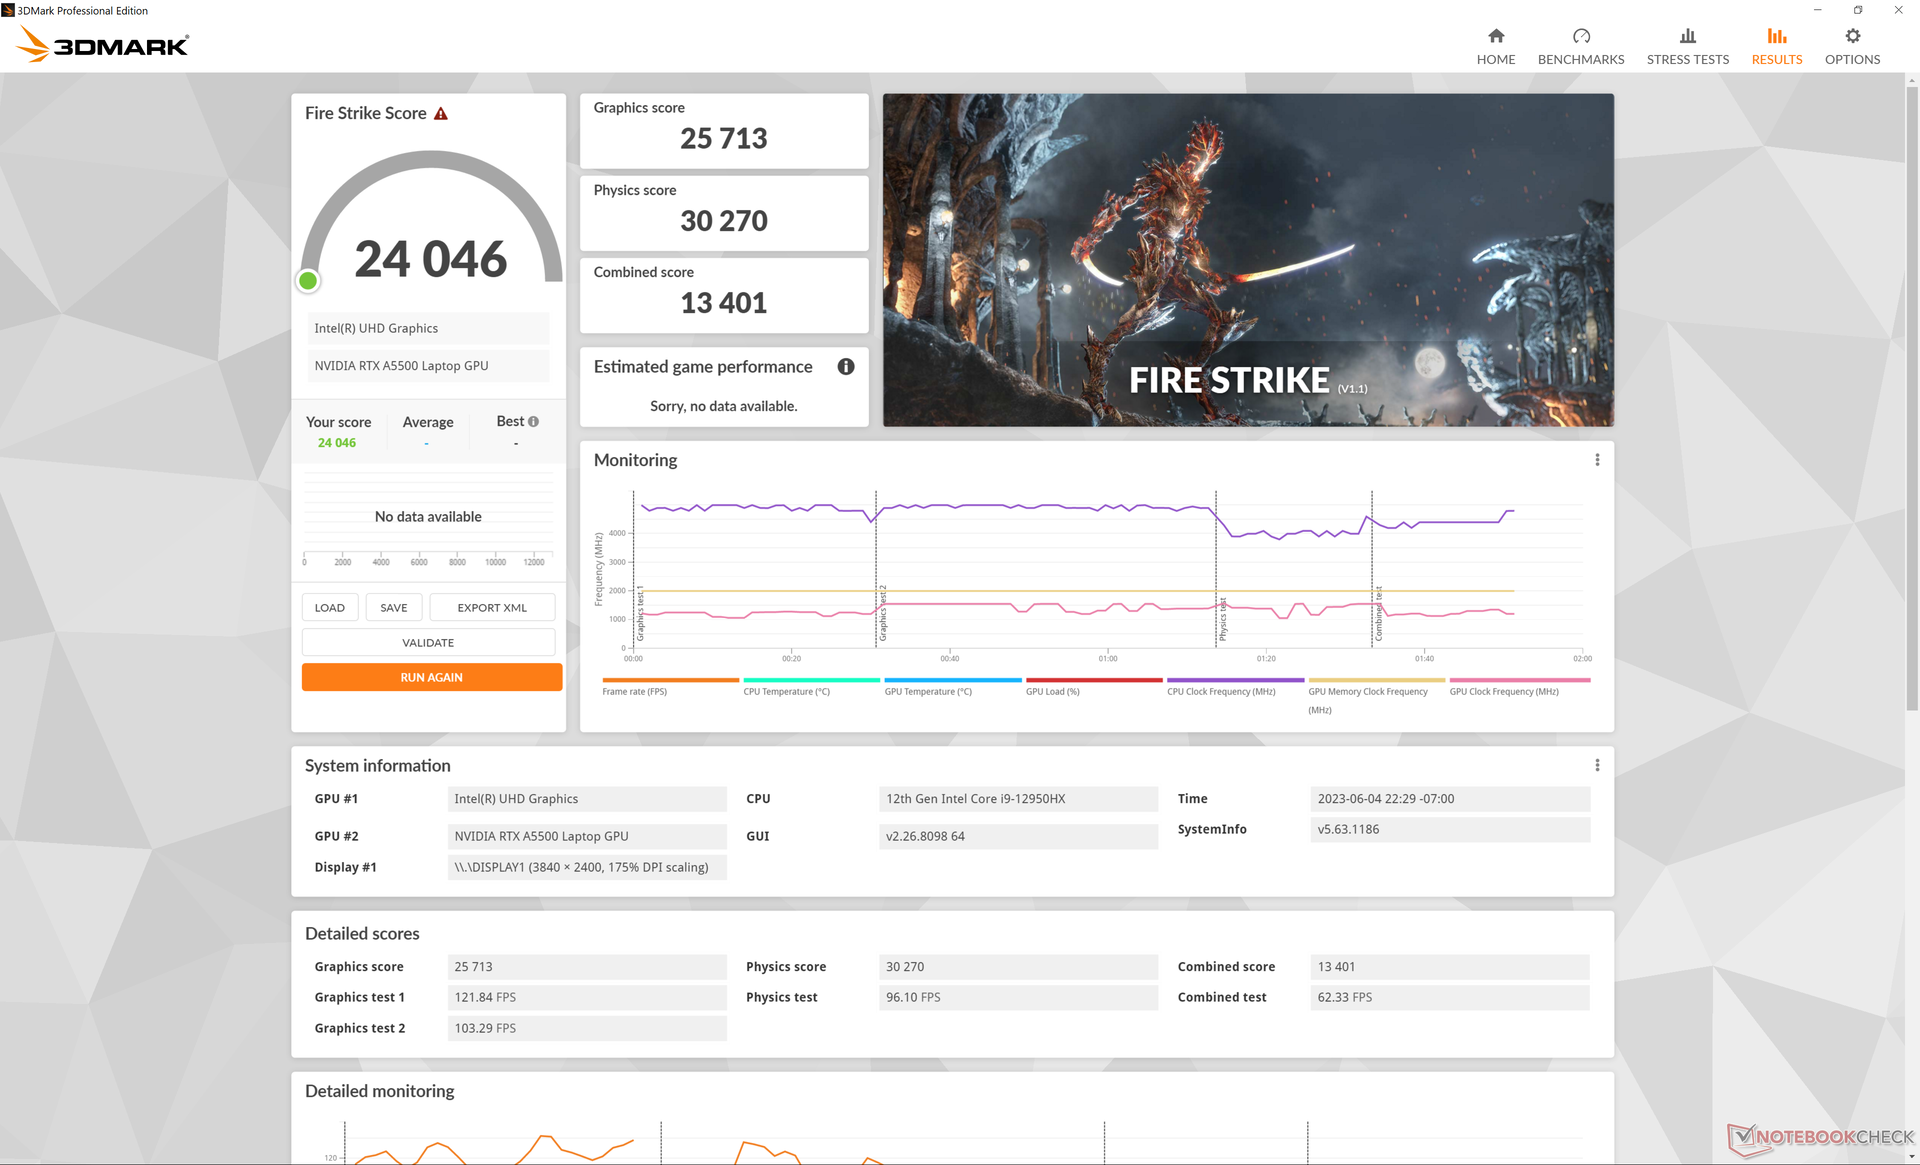
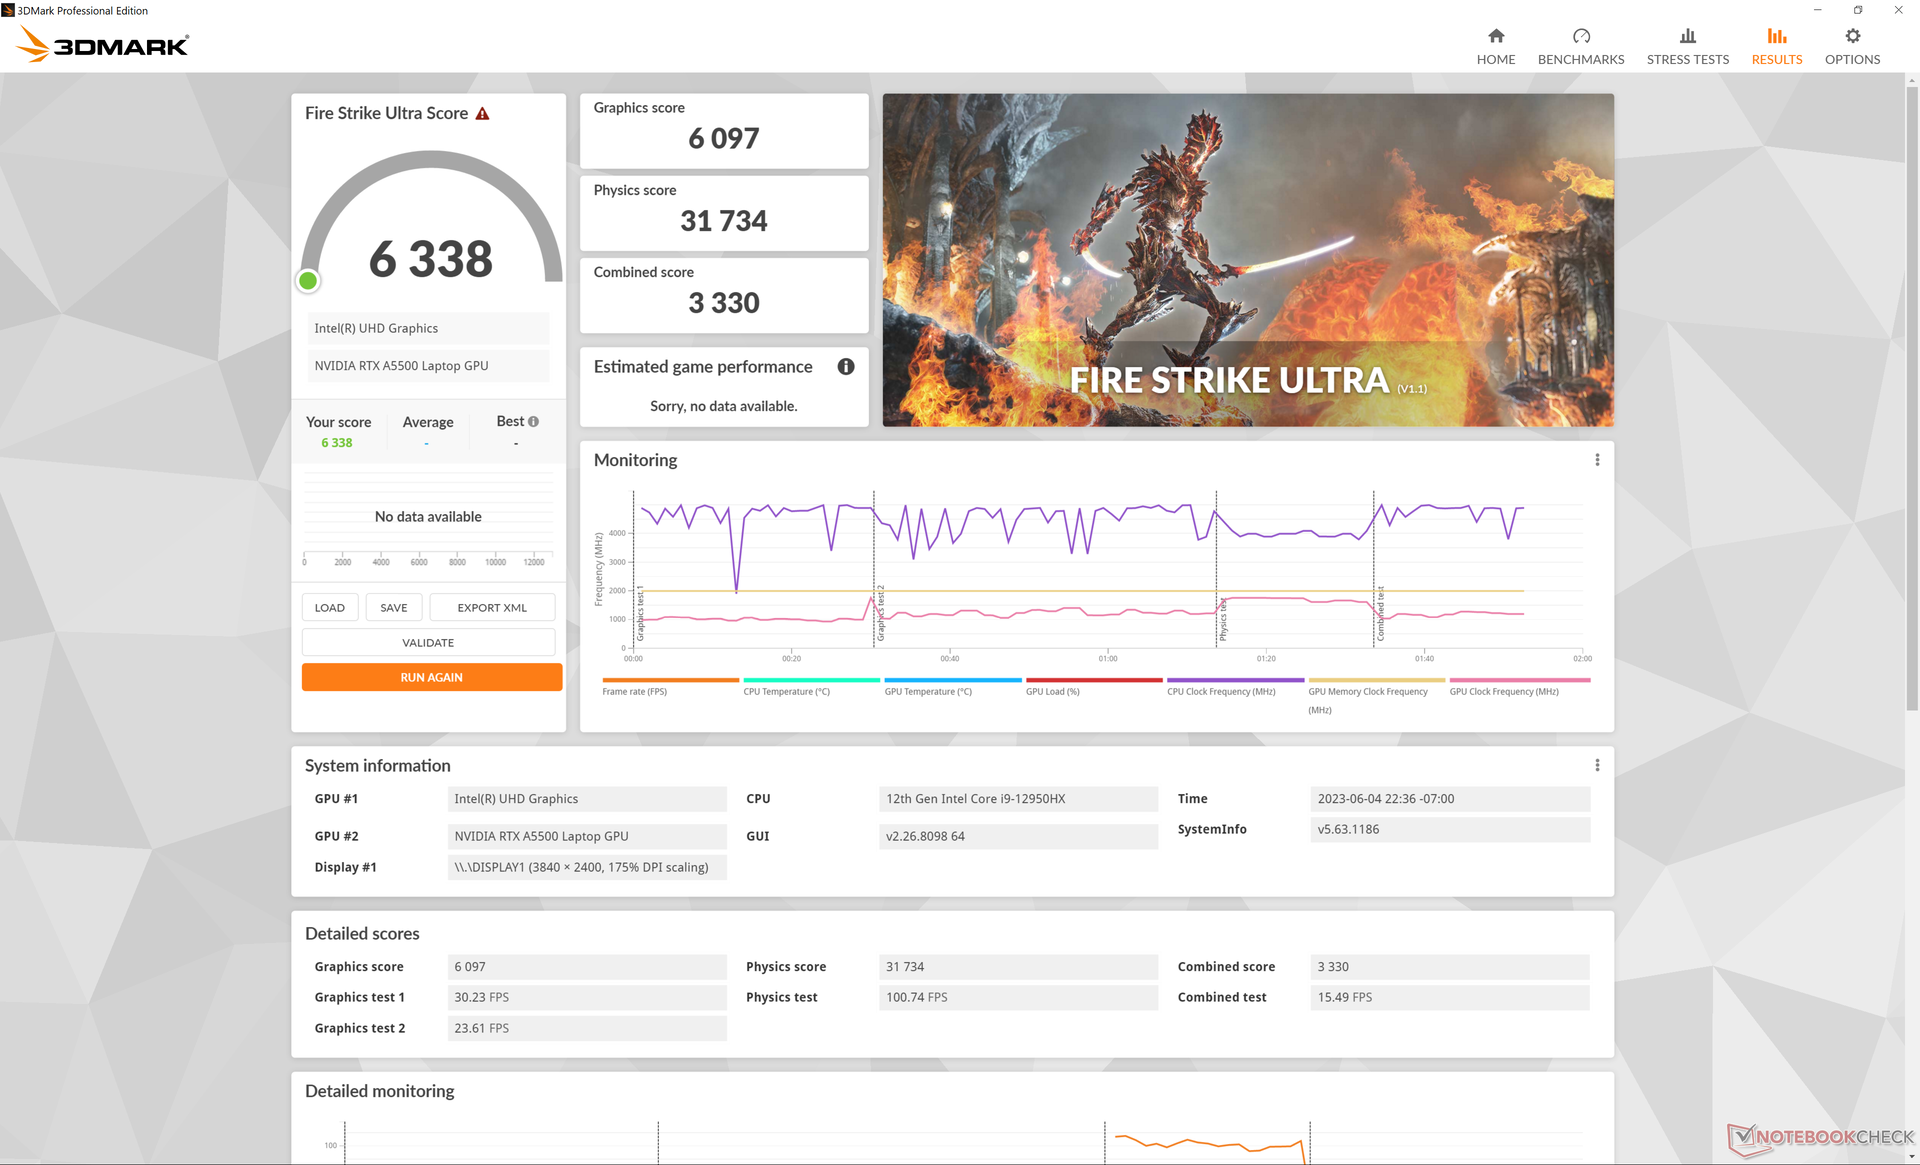
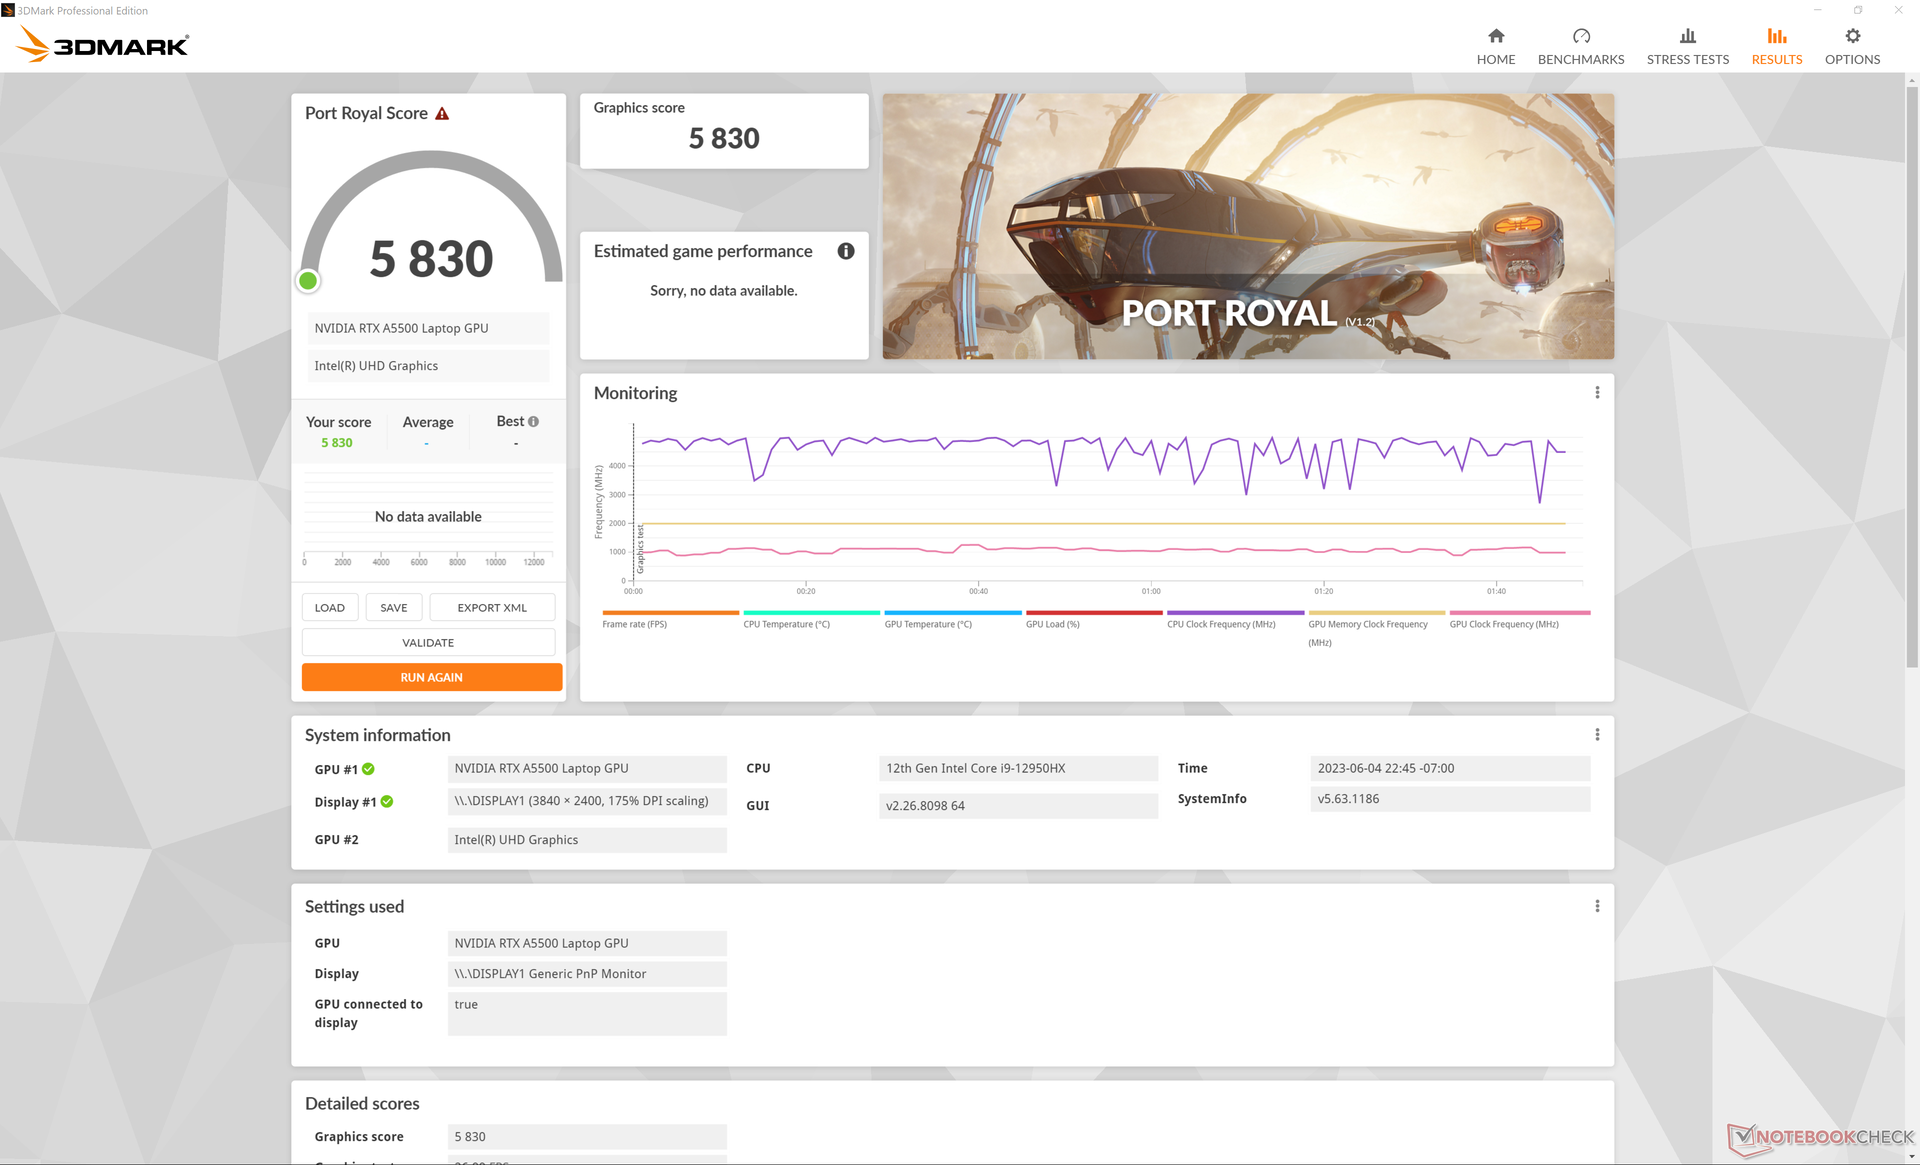
ǞǞǞ RTX A5500我们惠普的目标是100W的TGP,而ThinkPad P16 G1和7670的目标是130W和135W。 Precision 7670分别为130W和135W。因此,即使所有三个系统都使用相同的RTX A5500 GPU,惠普上的图形性能应该略微慢一些。3DMark和SpecViewPerf的结果证实了这一点,因为我们的惠普在某些情况下会一直落后于戴尔和联想的机型,差距高达15%。当然,它仍然是一个非常快的工作站,但它不是目前最快的选择。
降级到 RTX A3000配置,预计图形性能会降低20%至30%。
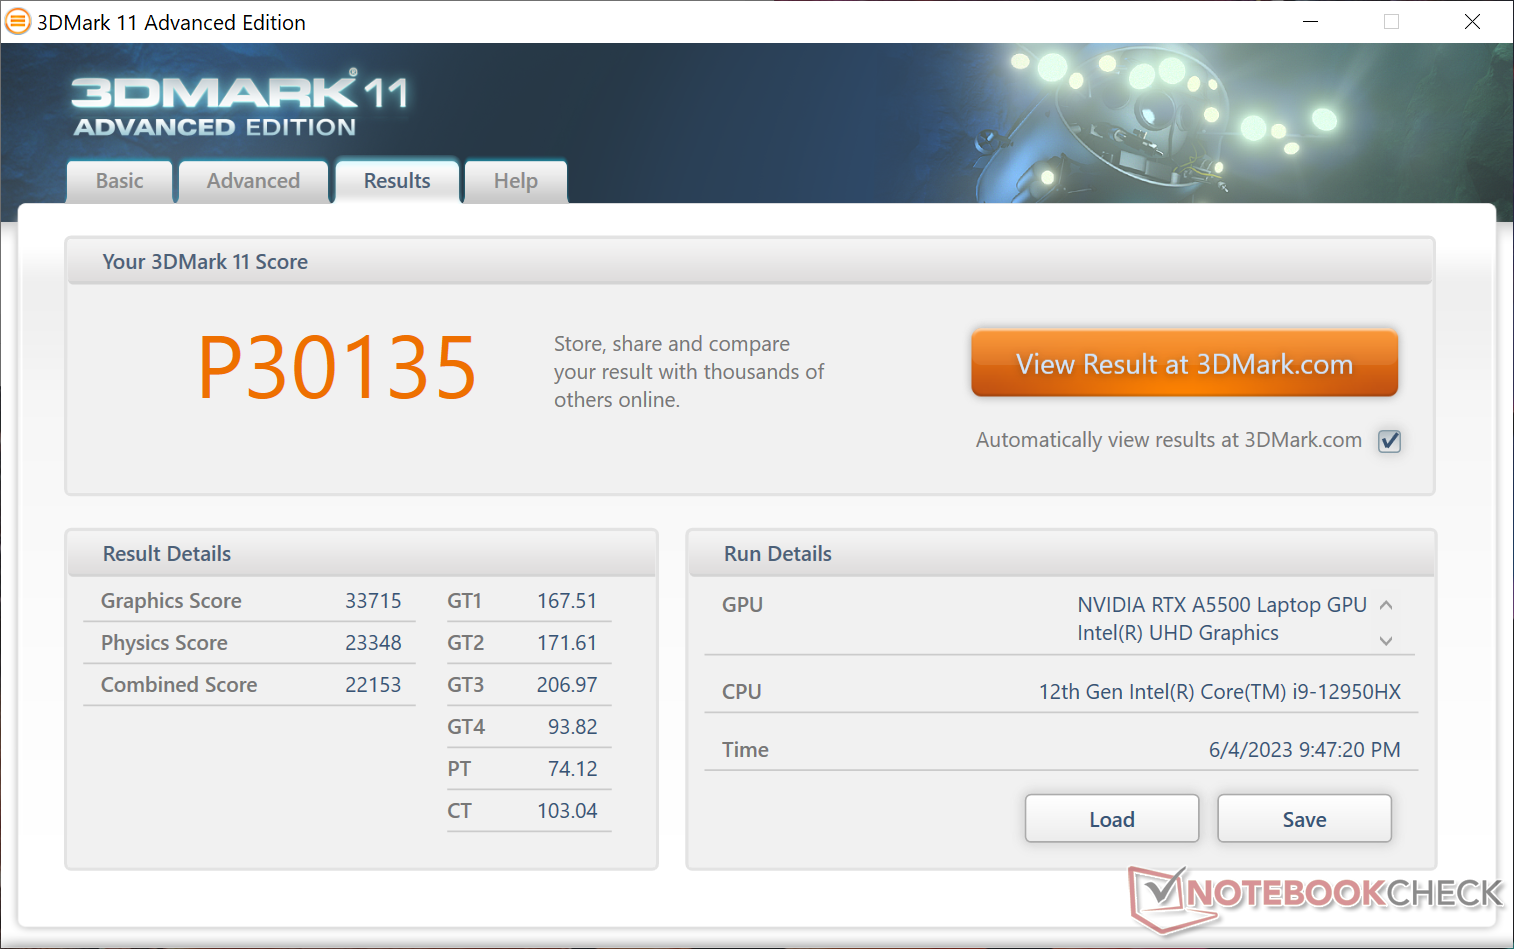
| 3DMark 11 Performance | 30135 points | |
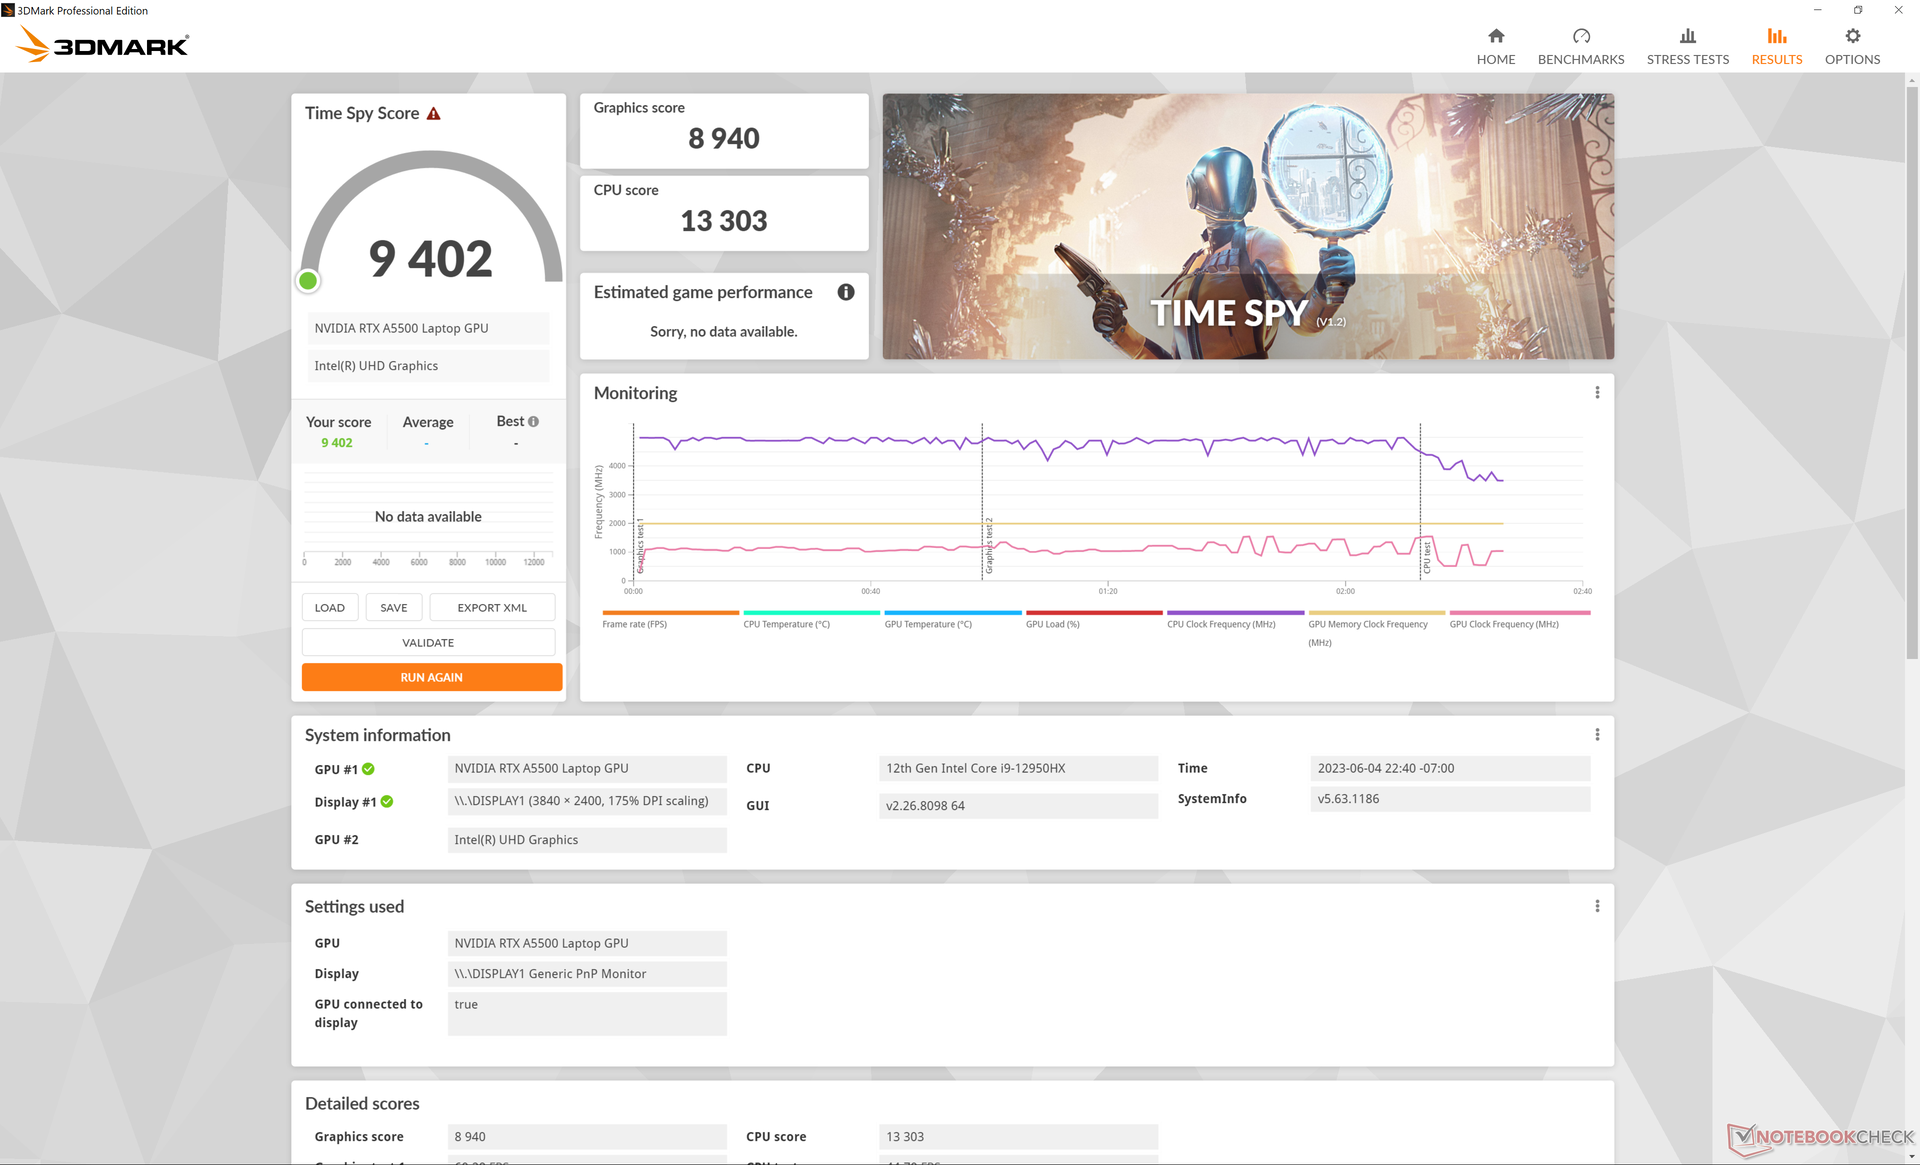
| 3DMark Fire Strike Score | 24046 points | |
| 3DMark Time Spy Score | 9402 points | |
Help | ||
* ... smaller is better
游戏性能
虽然它不是一个游戏GPU,但RTX A5500有能力在高分辨率和设置下玩最新的游戏。用户可以预期游戏性能将与 移动GeForce RTX 4070.
| Tiny Tina's Wonderlands | |
| 1920x1080 Low Preset (DX12) | |
| Lenovo Legion Pro 5 16IRX8 | |
| HP ZBook Fury 16 G9 | |
| Average NVIDIA RTX A5500 Laptop GPU (n=1) | |
| Dell XPS 17 9730 RTX 4070 | |
| 1920x1080 Medium Preset (DX12) | |
| Lenovo Legion Pro 5 16IRX8 | |
| HP ZBook Fury 16 G9 | |
| Average NVIDIA RTX A5500 Laptop GPU (n=1) | |
| Dell XPS 17 9730 RTX 4070 | |
| 1920x1080 High Preset (DX12) | |
| Lenovo Legion Pro 5 16IRX8 | |
| HP ZBook Fury 16 G9 | |
| Average NVIDIA RTX A5500 Laptop GPU (n=1) | |
| Dell XPS 17 9730 RTX 4070 | |
| 1920x1080 Badass Preset (DX12) | |
| Asus Zephyrus Duo 16 GX650PY-NM006W | |
| Lenovo Legion Pro 5 16IRX8 | |
| HP ZBook Fury 16 G9 | |
| Average NVIDIA RTX A5500 Laptop GPU (n=1) | |
| Dell XPS 17 9730 RTX 4070 | |
| 2560x1440 Badass Preset (DX12) | |
| Asus Zephyrus Duo 16 GX650PY-NM006W | |
| Lenovo Legion Pro 5 16IRX8 | |
| HP ZBook Fury 16 G9 | |
| Average NVIDIA RTX A5500 Laptop GPU (n=1) | |
| Dell XPS 17 9730 RTX 4070 | |
| 3840x2160 Badass Preset (DX12) | |
| Lenovo Legion Pro 5 16IRX8 | |
| HP ZBook Fury 16 G9 | |
| Average NVIDIA RTX A5500 Laptop GPU (n=1) | |
| Dell XPS 17 9730 RTX 4070 | |
Witcher 3 FPS Chart
| low | med. | high | ultra | QHD | 4K | |
|---|---|---|---|---|---|---|
| GTA V (2015) | 185.4 | 182.7 | 170.7 | 118.5 | 97.5 | 97.1 |
| The Witcher 3 (2015) | 447 | 308.5 | 169.3 | 92.8 | 62.2 | |
| Dota 2 Reborn (2015) | 191.3 | 173.1 | 162.4 | 150.7 | 116.1 | |
| Final Fantasy XV Benchmark (2018) | 180.1 | 131.6 | 103.5 | 75.1 | 39.4 | |
| X-Plane 11.11 (2018) | 151.3 | 130.9 | 103.6 | 81.9 | ||
| Strange Brigade (2018) | 447 | 235 | 190.2 | 168.6 | 122 | 67.6 |
| Cyberpunk 2077 1.6 (2022) | 128.7 | 114.4 | 87.6 | 69.8 | 41.4 | 18.1 |
| Tiny Tina's Wonderlands (2022) | 193.7 | 158.6 | 109.5 | 87.5 | 57.9 | 29.6 |
| F1 22 (2022) | 224 | 209 | 170.2 | 60.9 | 37.2 | 17.6 |
| Returnal (2023) | 70 | 68 | 64 | 59 | 42 | 20 |
排放--低负荷下的静音
系统噪音
在运行要求不高的负载时,风扇噪音很低。在低至中度负载时,它往往在29 dB(A)和35 dB(A)之间徘徊,在大多数办公环境中几乎听不到。
运行要求更高的负载,如游戏,可能会引起最大的风扇噪音,略低于50 dB(A),这与我们在ThinkPad P16 G1或Precision 7670上记录的情况接近。尽管如此,笔记本P16 G1能够在更长时间内保持安静。例如,在运行3DMark 06时,惠普的风扇噪音在第一个基准场景结束时最高达到36分贝(A),而联想的风扇噪音只有29分贝(A)。
Noise level
| Idle |
| 22.7 / 22.7 / 28.8 dB(A) |
| Load |
| 36.2 / 49.3 dB(A) |
 | ||
30 dB silent 40 dB(A) audible 50 dB(A) loud |
||
min: | ||
| HP ZBook Fury 16 G9 RTX A5500 Laptop GPU, i9-12950HX, Micron 3400 1TB MTFDKBA1T0TFH | HP ZBook Studio 16 G9 62U04EA RTX A2000 Laptop GPU, i7-12800H, Micron 3400 1TB MTFDKBA1T0TFH | HP ZBook Firefly 16 G9-6B897EA T550 Laptop GPU, i7-1265U, Samsung PM9A1 MZVL21T0HCLR | Lenovo ThinkPad P16 G1 RTX A5500 RTX A5500 Laptop GPU, i9-12950HX, WDC PC SN810 2TB | Dell Precision 7000 7670 Performance RTX A5500 Laptop GPU, i9-12950HX | MSI CreatorPro Z16P B12UKST RTX A3000 Laptop GPU, i7-12700H, Samsung PM9A1 MZVL21T0HCLR | |
|---|---|---|---|---|---|---|
| Noise | -4% | 4% | 4% | -9% | -6% | |
| off / environment * (dB) | 22.6 | 24 -6% | 23.8 -5% | 23.1 -2% | 23.9 -6% | 24.1 -7% |
| Idle Minimum * (dB) | 22.7 | 24 -6% | 23.8 -5% | 23.1 -2% | 24 -6% | 27.1 -19% |
| Idle Average * (dB) | 22.7 | 27.7 -22% | 23.8 -5% | 23.1 -2% | 24 -6% | 27.1 -19% |
| Idle Maximum * (dB) | 28.8 | 27.7 4% | 23.8 17% | 23.1 20% | 38 -32% | 27.1 6% |
| Load Average * (dB) | 36.2 | 39.8 -10% | 39.4 -9% | 28.9 20% | 46.3 -28% | 42.9 -19% |
| Witcher 3 ultra * (dB) | 49.5 | 44.3 11% | 40.5 18% | 51.6 -4% | 41.9 15% | 44 11% |
| Load Maximum * (dB) | 49.3 | 47.7 3% | 41.4 16% | 51.4 -4% | 47.9 3% | 47 5% |
* ... smaller is better
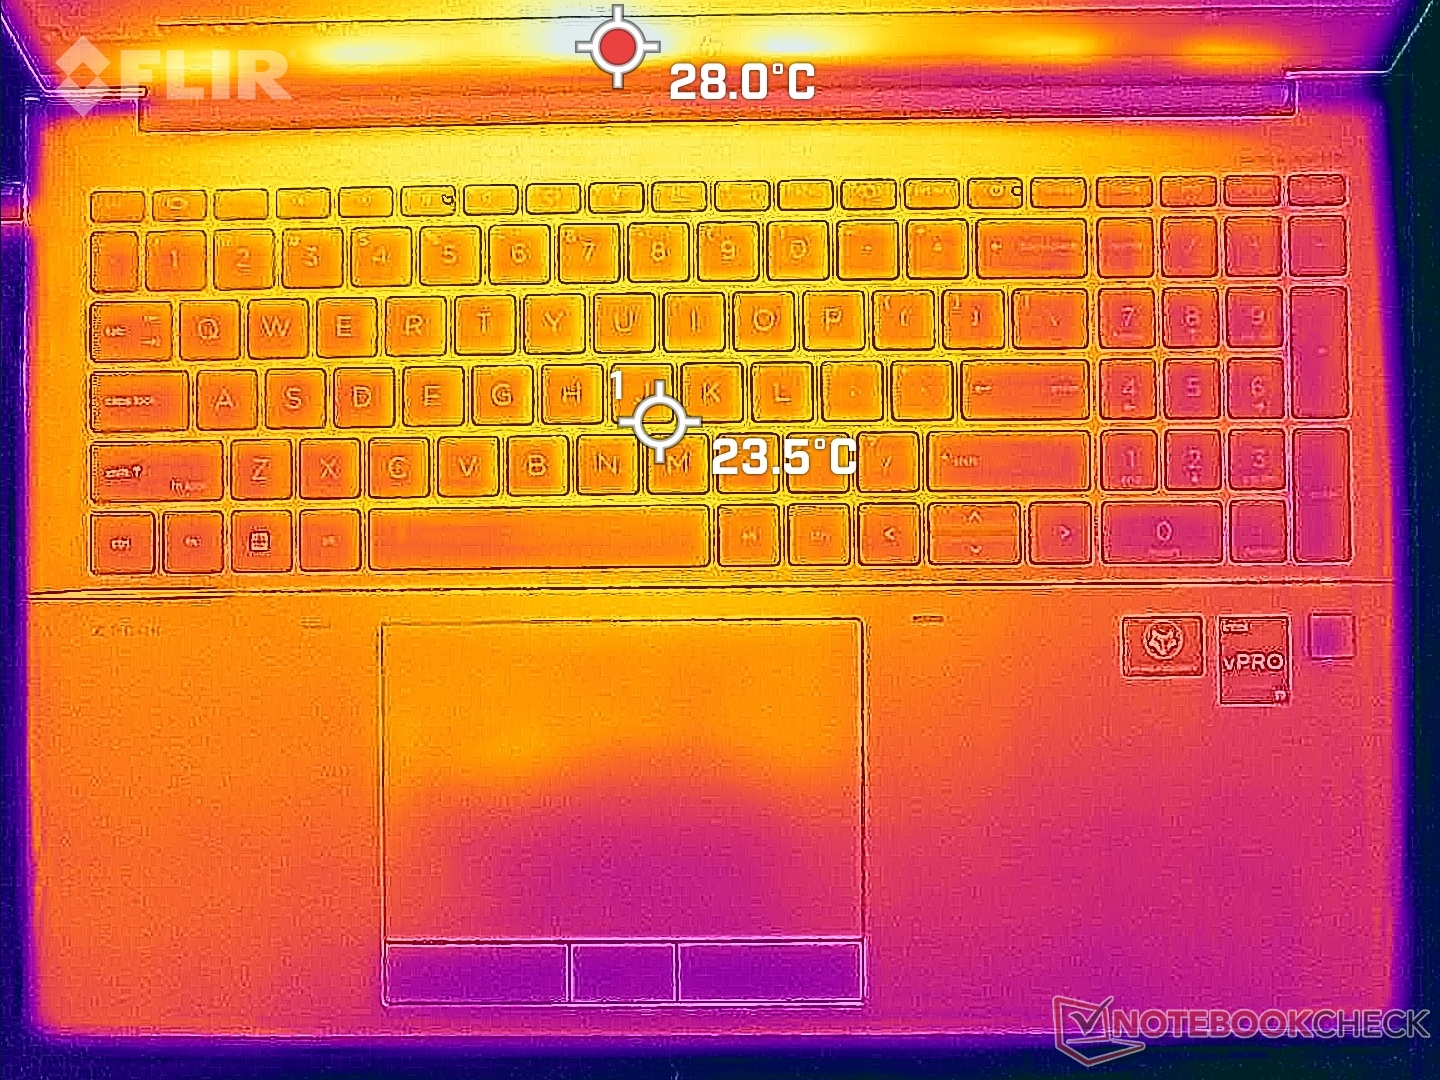
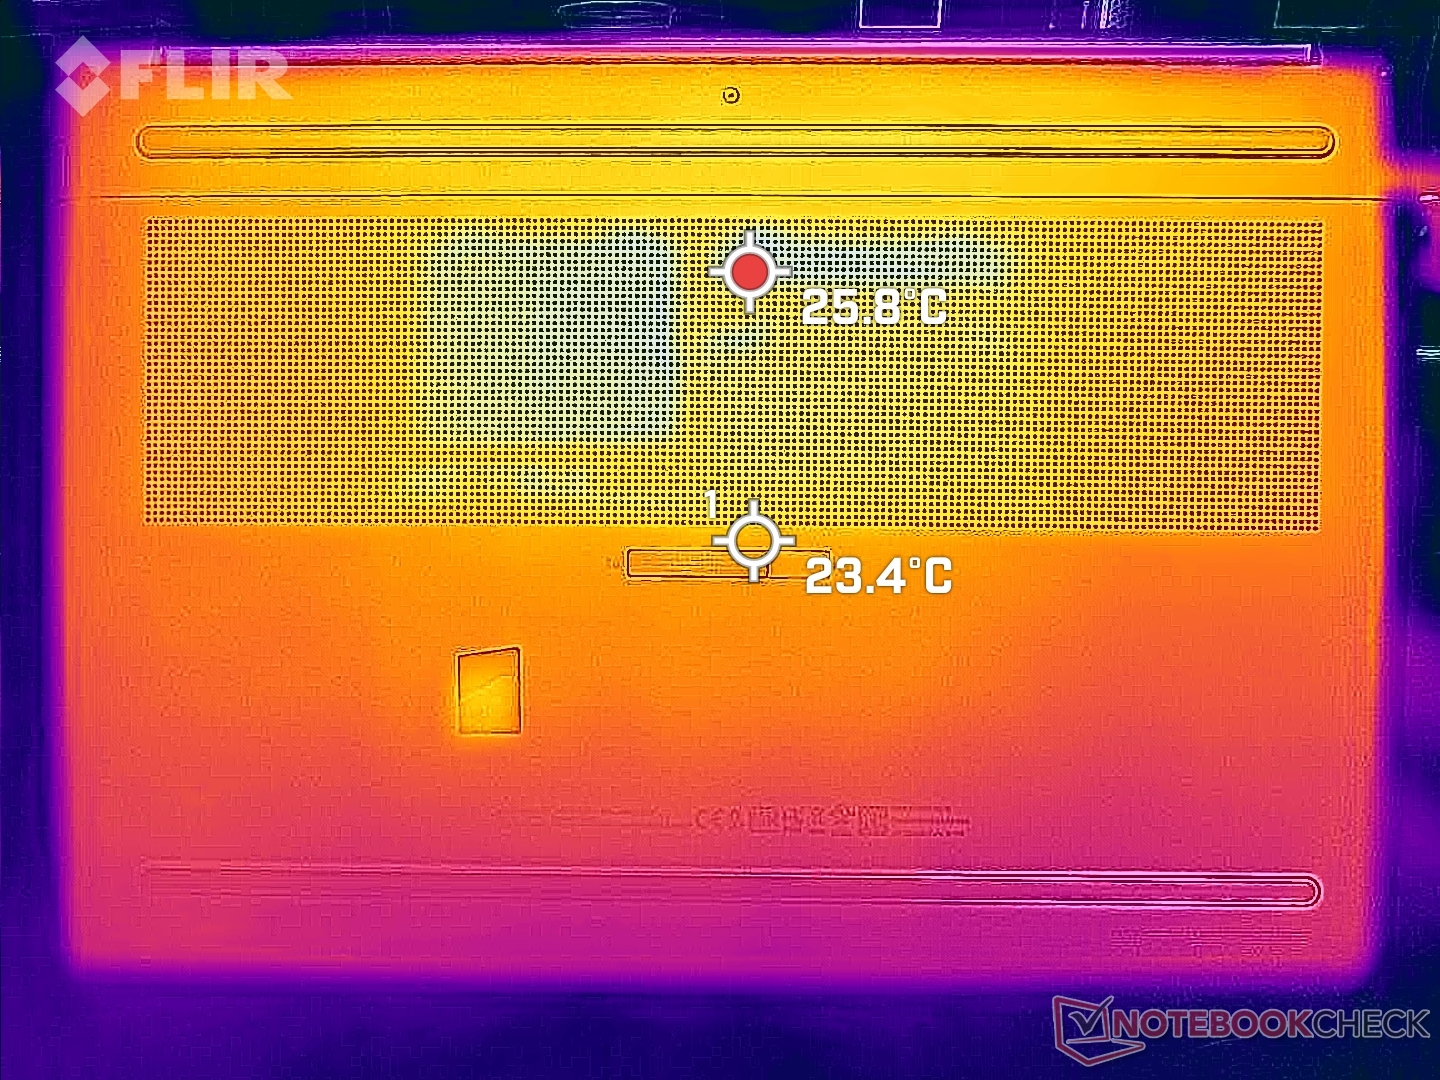
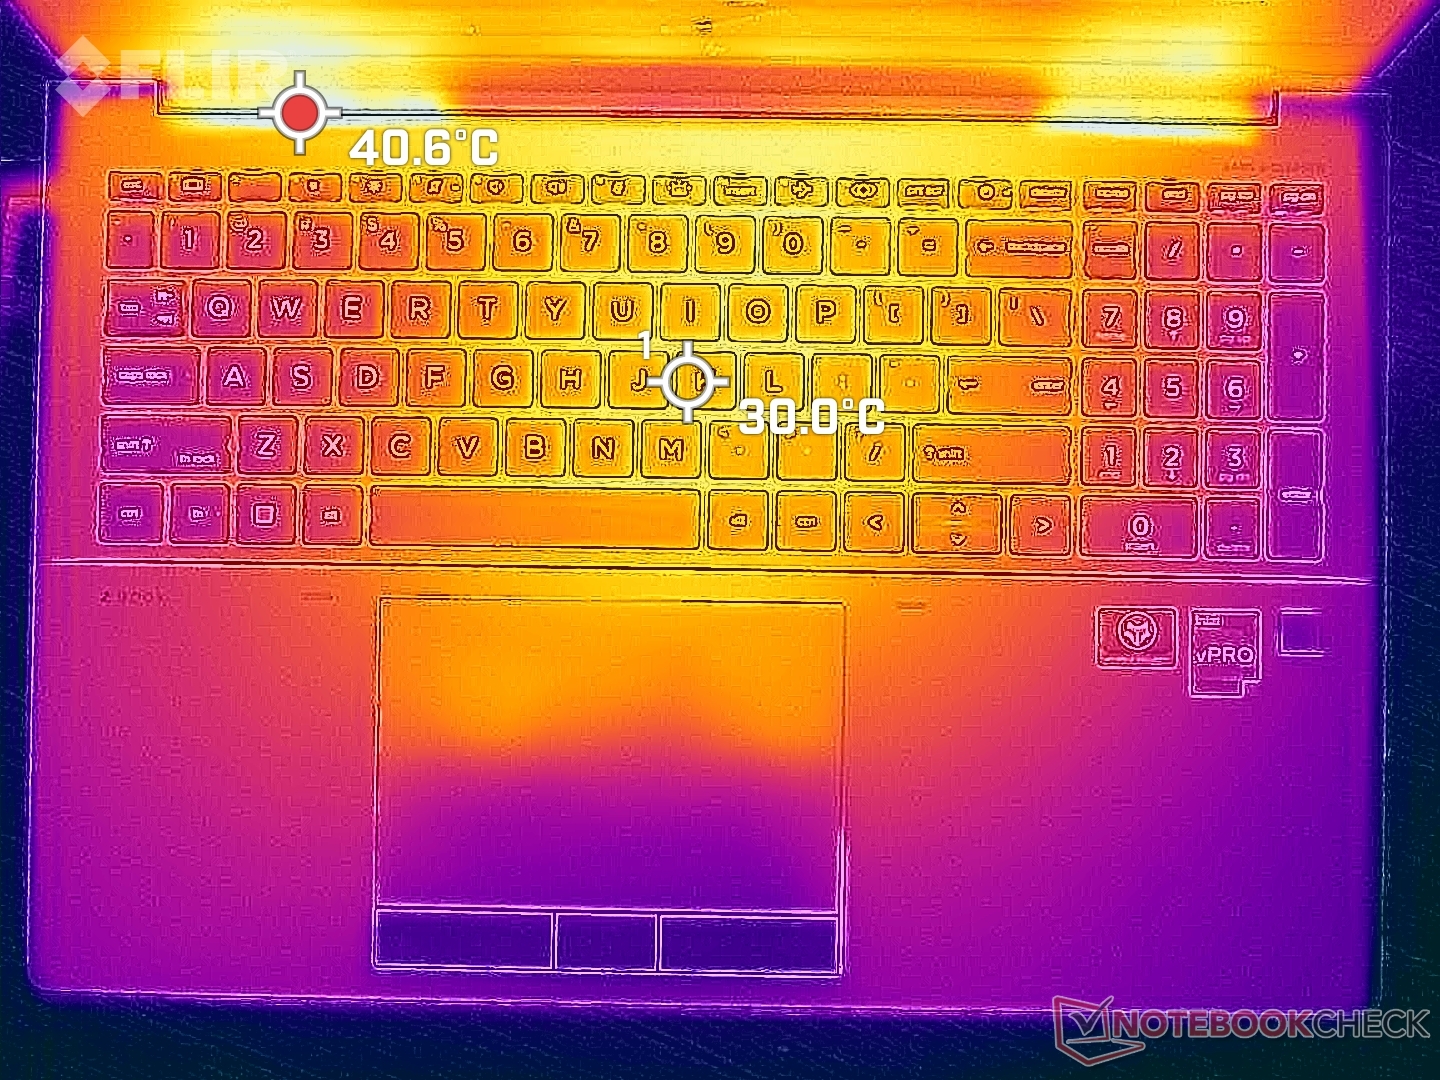
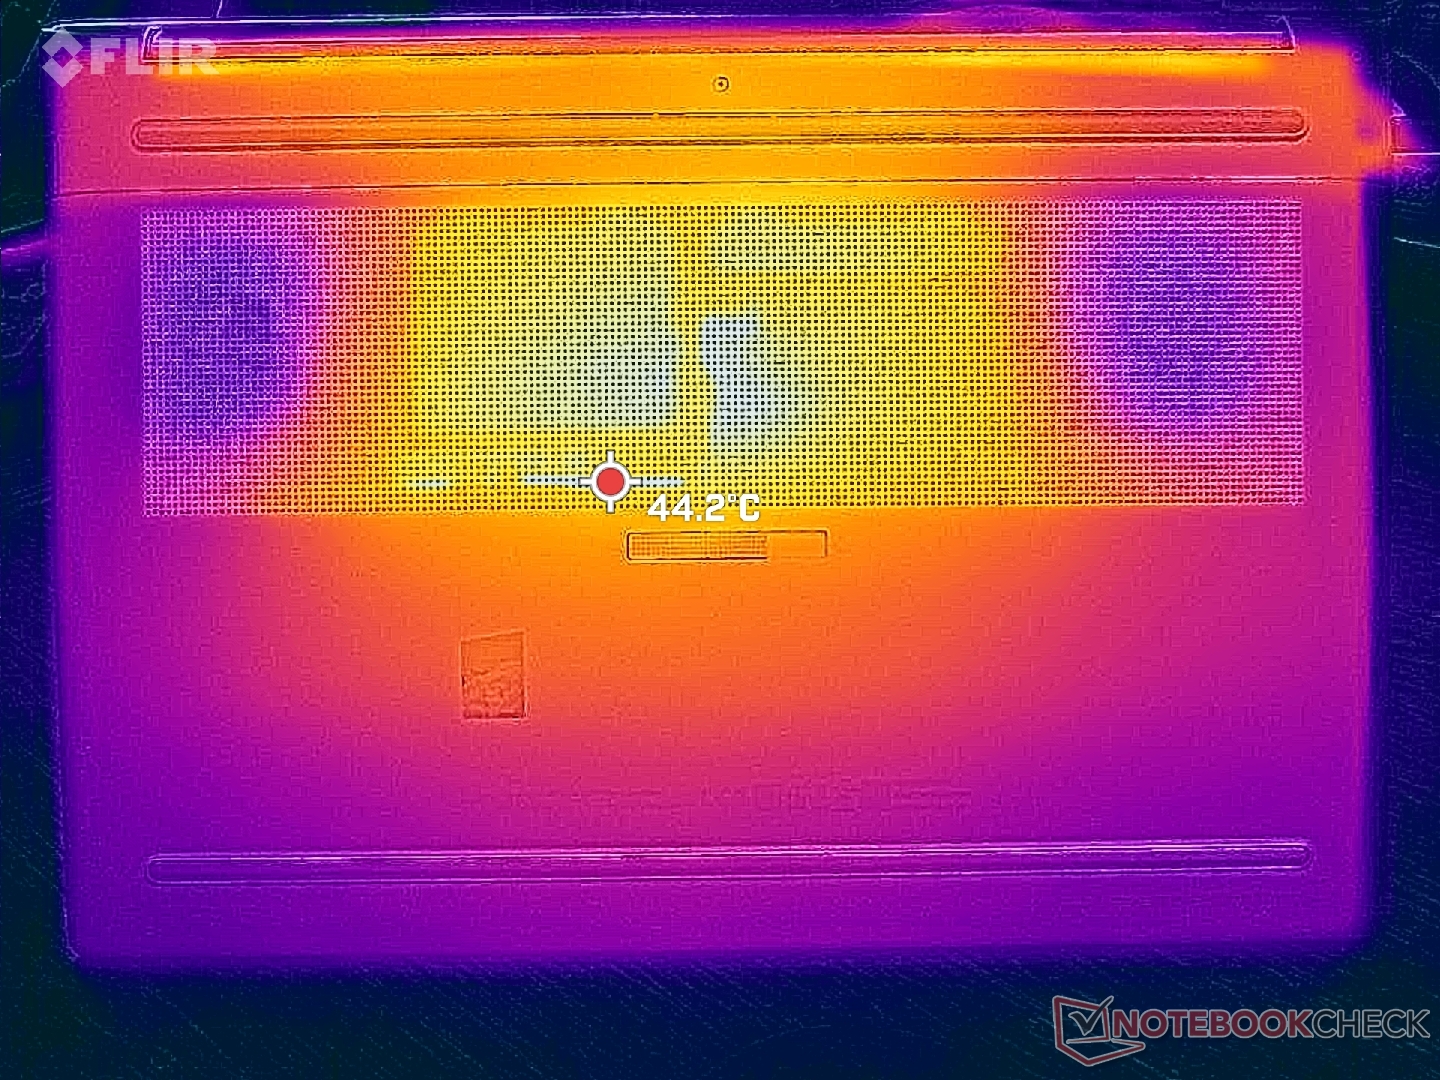
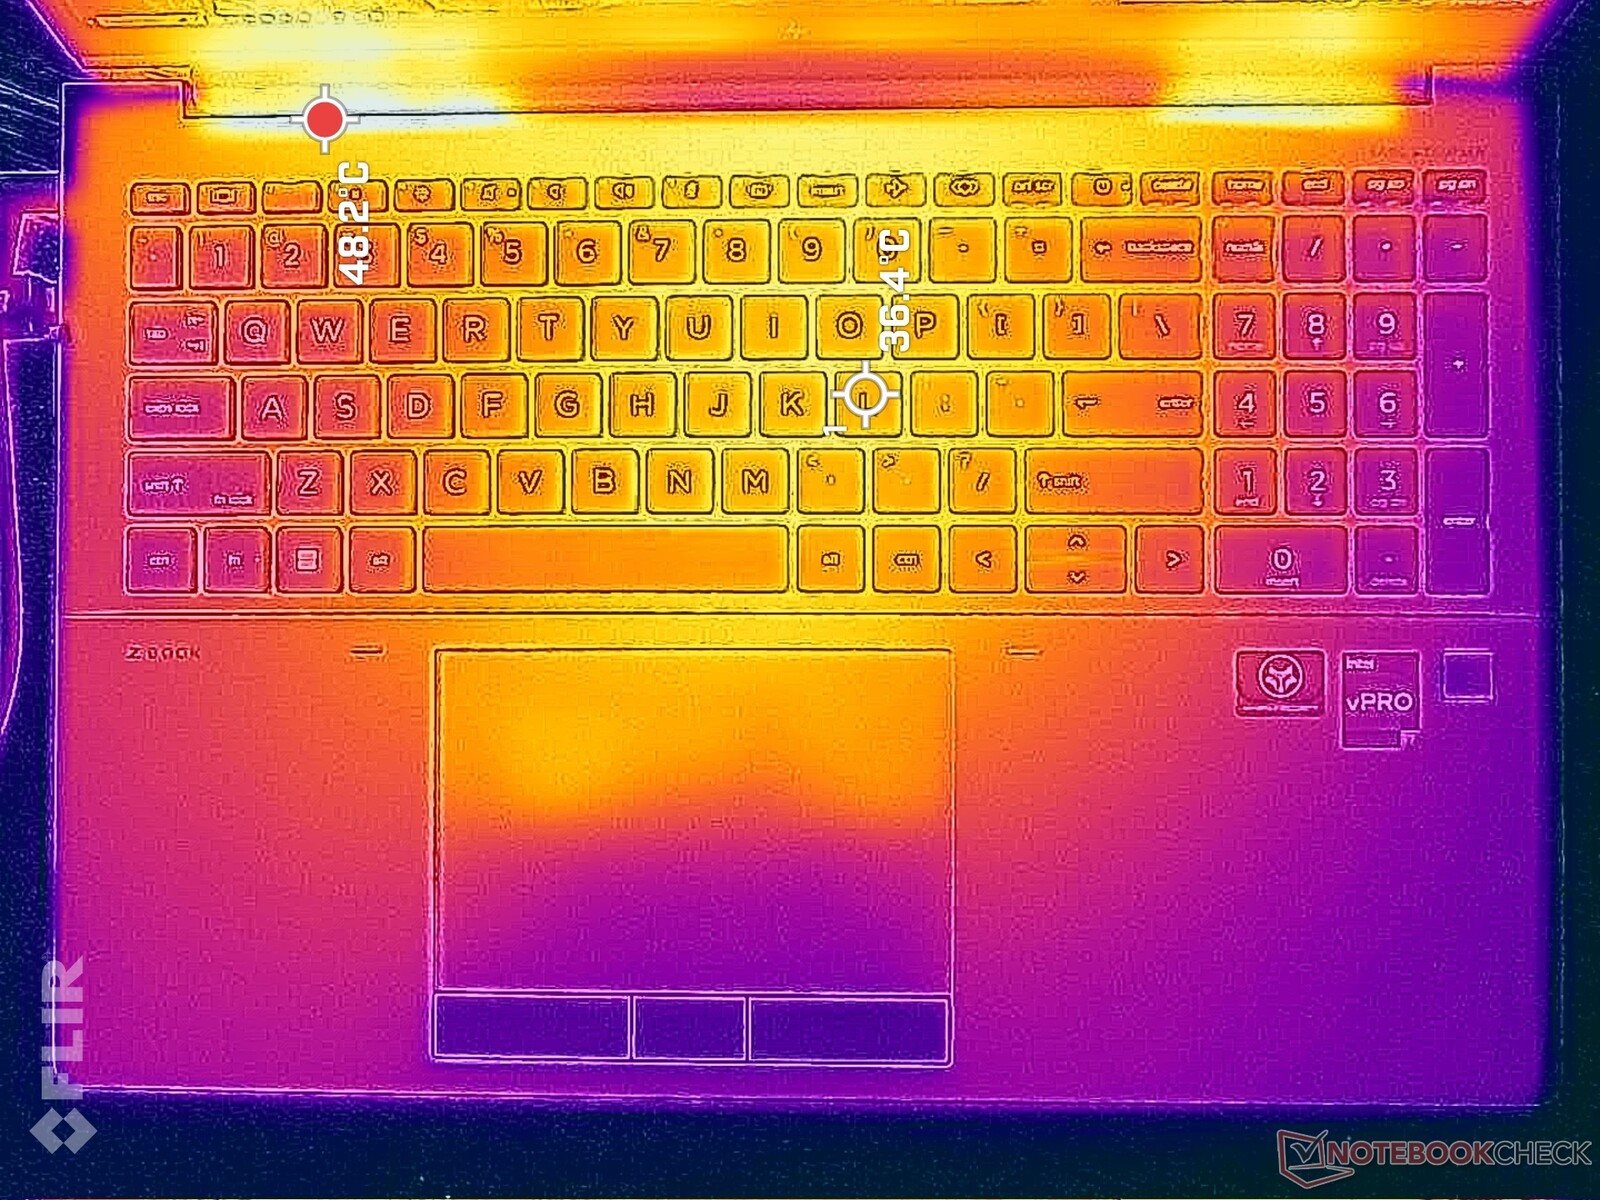
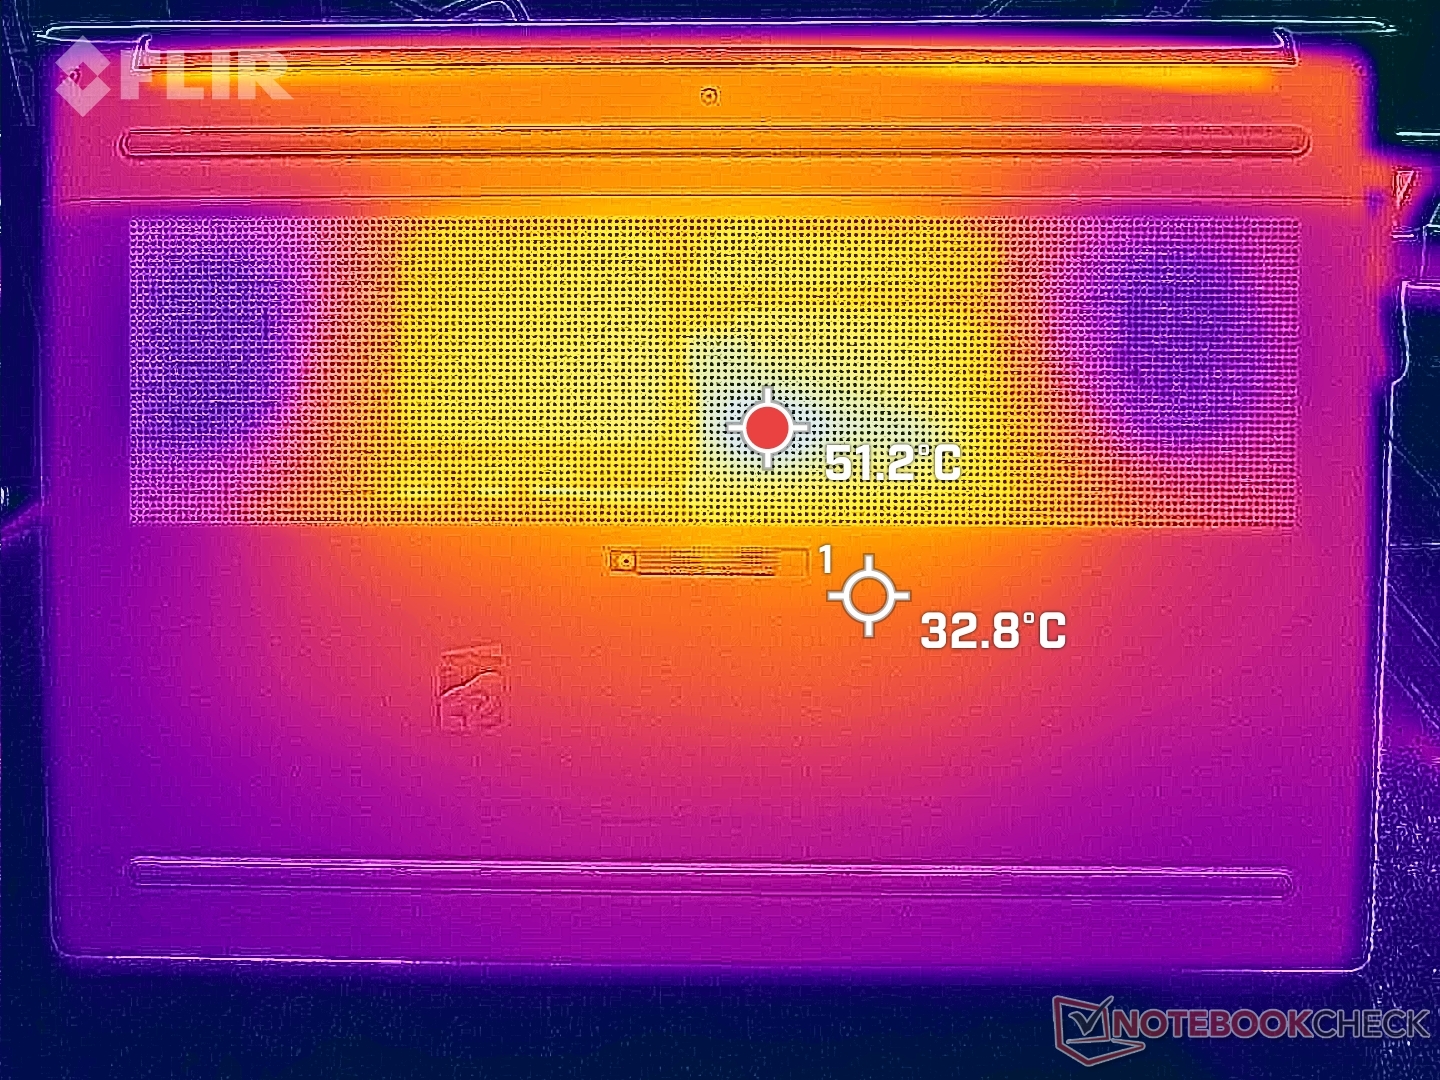
温度 - 负载下温暖的掌托
表面温度倾向于向键盘中心偏高,在极端的处理负荷下,温度可以达到36℃以上。温度发展比Precision 7670或ThinkPad P16更对称,但触摸板和掌托的温度可能比我们希望的要高。例如,当运行苛刻的负载时,惠普的触摸板可以达到35℃以上,而上述联想和戴尔的替代品则为30℃或更低。
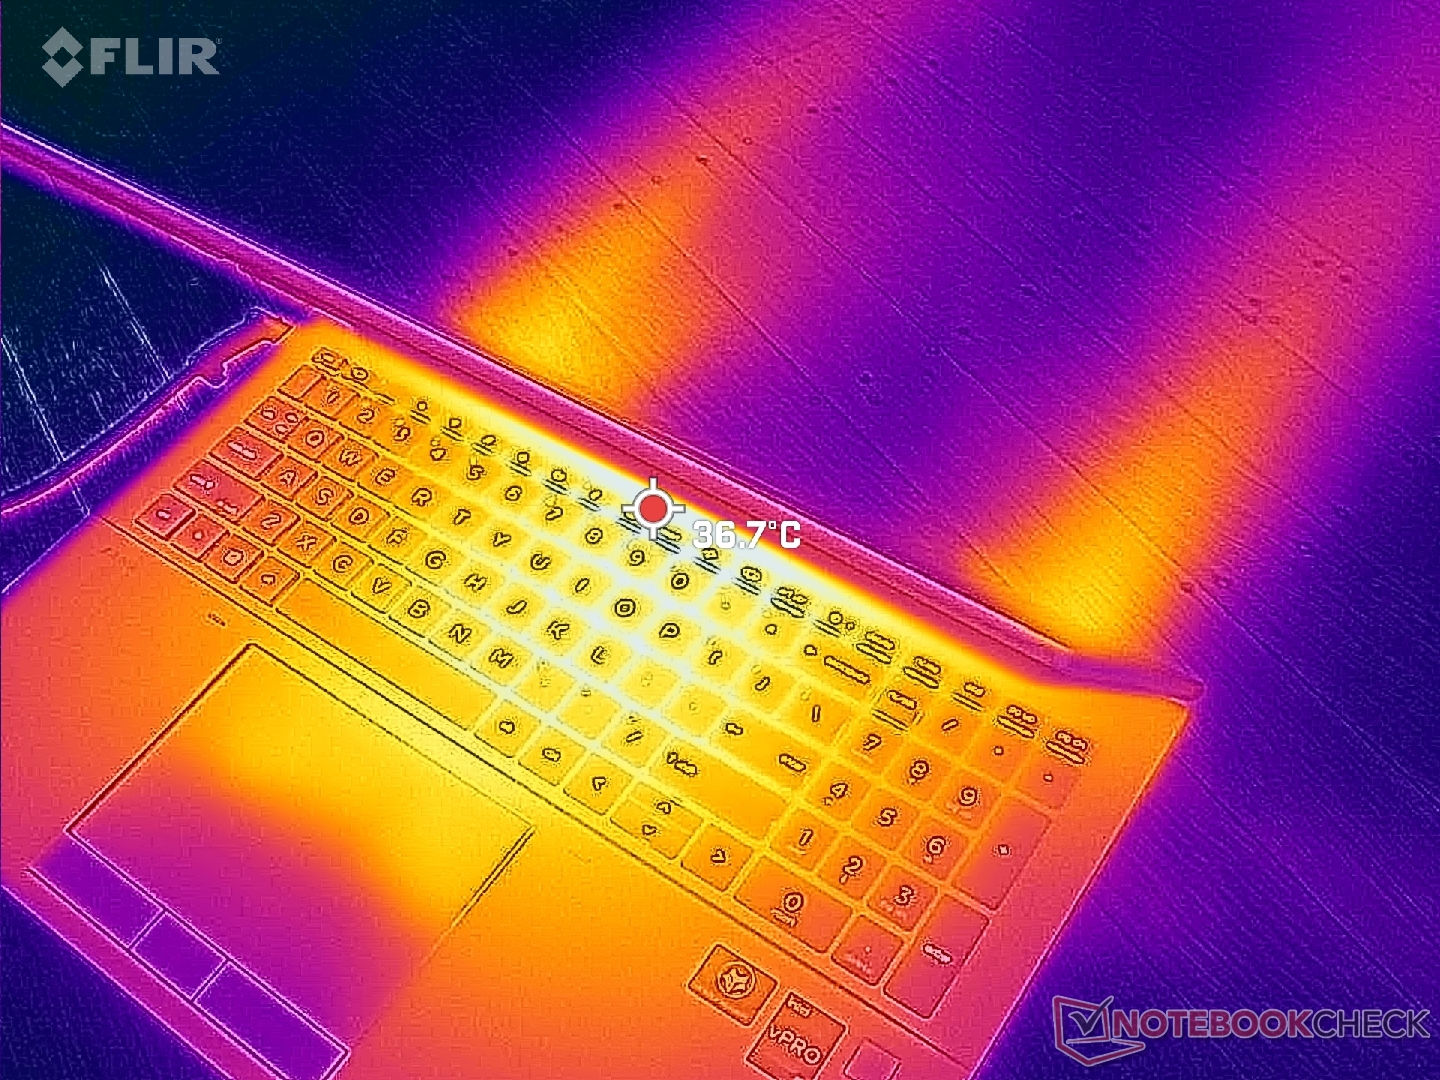
(±) The maximum temperature on the upper side is 43.2 °C / 110 F, compared to the average of 38.2 °C / 101 F, ranging from 22.2 to 69.8 °C for the class Workstation.
(-) The bottom heats up to a maximum of 50.4 °C / 123 F, compared to the average of 41.1 °C / 106 F
(+) In idle usage, the average temperature for the upper side is 27.1 °C / 81 F, compared to the device average of 32 °C / 90 F.
(±) Playing The Witcher 3, the average temperature for the upper side is 34 °C / 93 F, compared to the device average of 32 °C / 90 F.
(+) The palmrests and touchpad are reaching skin temperature as a maximum (35.6 °C / 96.1 F) and are therefore not hot.
(-) The average temperature of the palmrest area of similar devices was 27.8 °C / 82 F (-7.8 °C / -14.1 F).
| HP ZBook Fury 16 G9 Intel Core i9-12950HX, NVIDIA RTX A5500 Laptop GPU | HP ZBook Studio 16 G9 62U04EA Intel Core i7-12800H, NVIDIA RTX A2000 Laptop GPU | HP ZBook Firefly 16 G9-6B897EA Intel Core i7-1265U, NVIDIA T550 Laptop GPU | Lenovo ThinkPad P16 G1 RTX A5500 Intel Core i9-12950HX, NVIDIA RTX A5500 Laptop GPU | Dell Precision 7000 7670 Performance Intel Core i9-12950HX, NVIDIA RTX A5500 Laptop GPU | MSI CreatorPro Z16P B12UKST Intel Core i7-12700H, NVIDIA RTX A3000 Laptop GPU | |
|---|---|---|---|---|---|---|
| Heat | -1% | -4% | -12% | -15% | -12% | |
| Maximum Upper Side * (°C) | 43.2 | 38.7 10% | 42.1 3% | 44.8 -4% | 53 -23% | 56.3 -30% |
| Maximum Bottom * (°C) | 50.4 | 53.4 -6% | 48 5% | 49.8 1% | 43.2 14% | 68.3 -36% |
| Idle Upper Side * (°C) | 28.6 | 27.3 5% | 29.9 -5% | 30.6 -7% | 36.8 -29% | 25.2 12% |
| Idle Bottom * (°C) | 28.2 | 31.6 -12% | 32.9 -17% | 38.6 -37% | 33.8 -20% | 25.9 8% |
* ... smaller is better
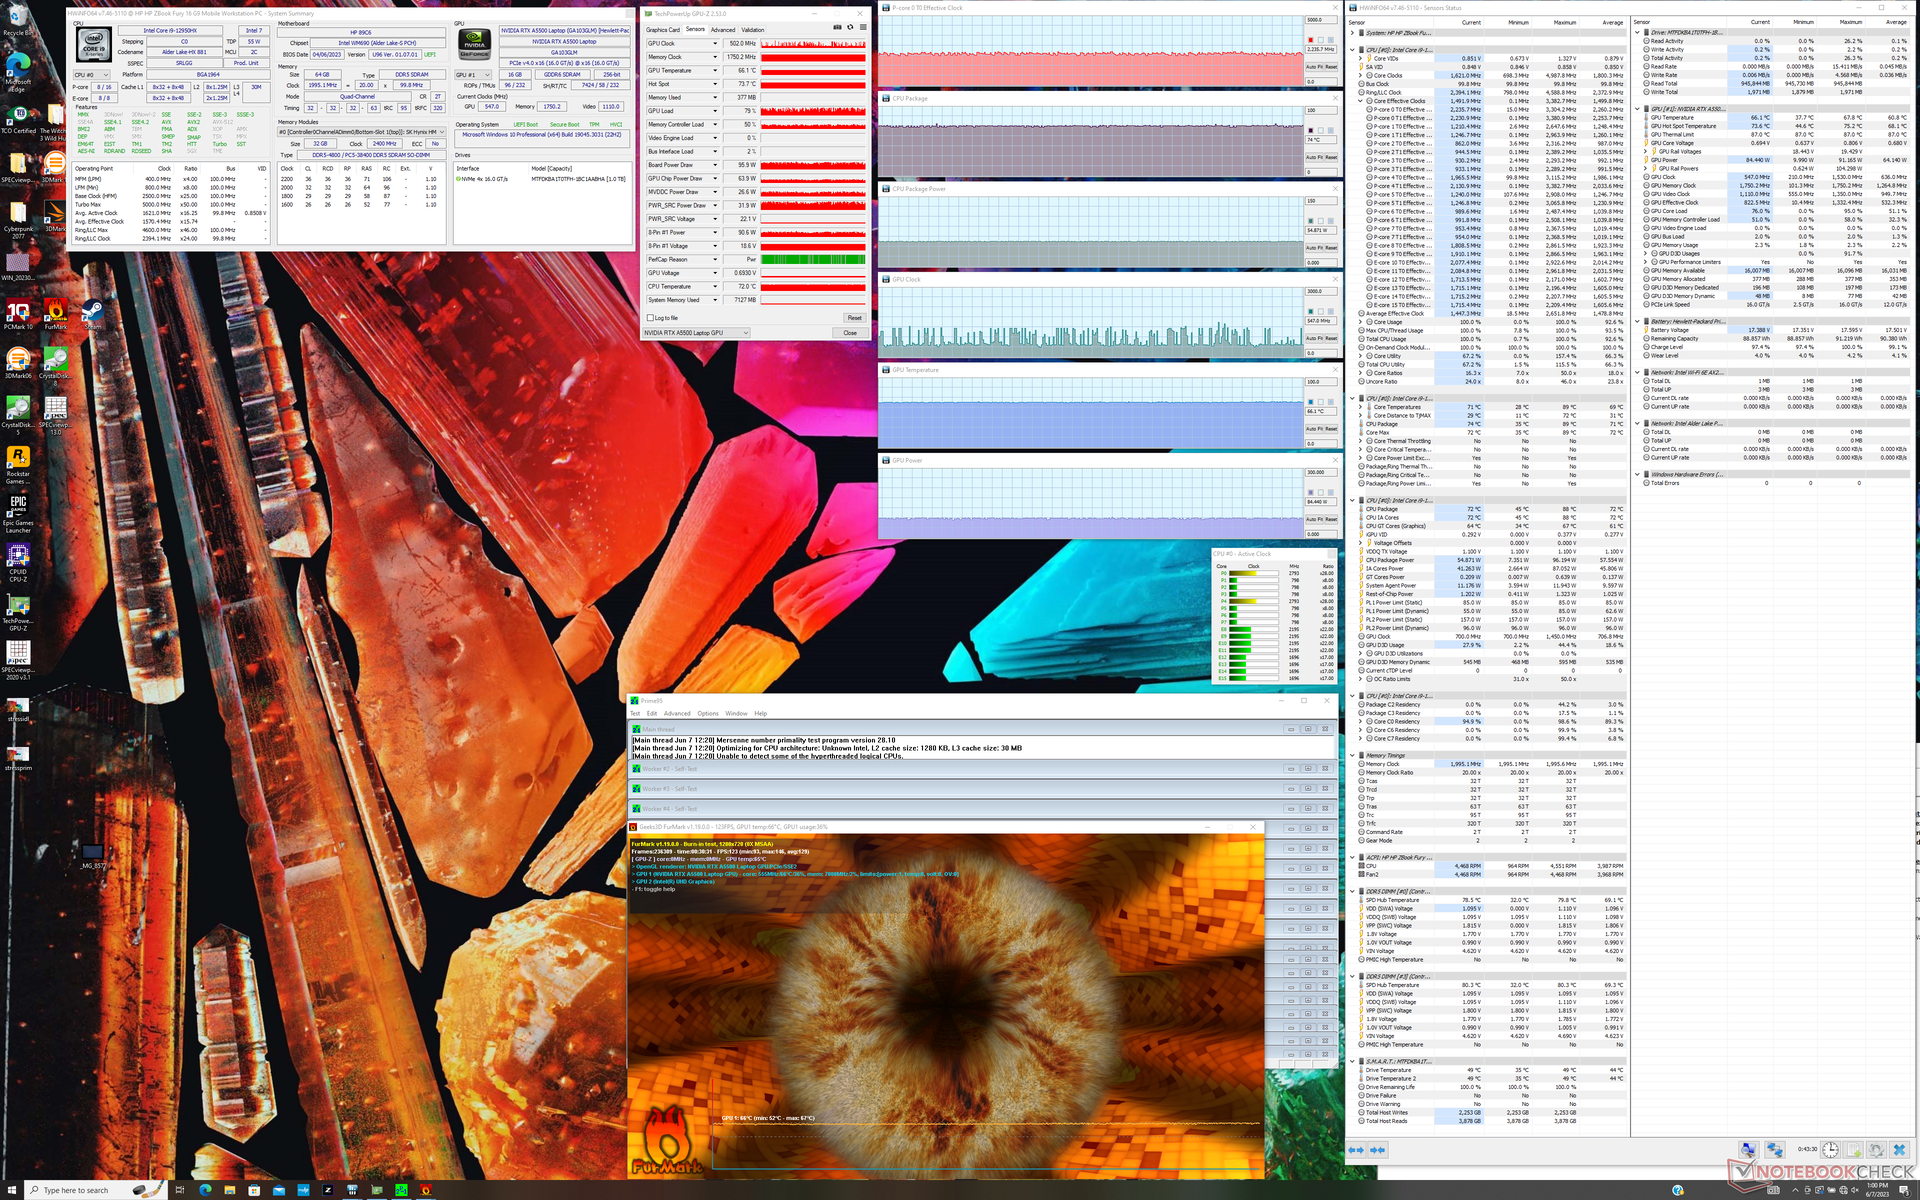
压力测试
当运行Prime95对CPU施加压力时,时钟频率和电路板功耗将分别飙升至3.1 GHz和96 W,仅持续几分钟或直到核心温度达到89 C。 酷睿i9-12950HX CPU将导致更高的稳定时钟频率(3.0 GHz)和功耗(81 W),代价是更高的核心温度(100 C)。惠普在这方面采取了更多的保留方法,这与我们上面的CineBench结果相一致。
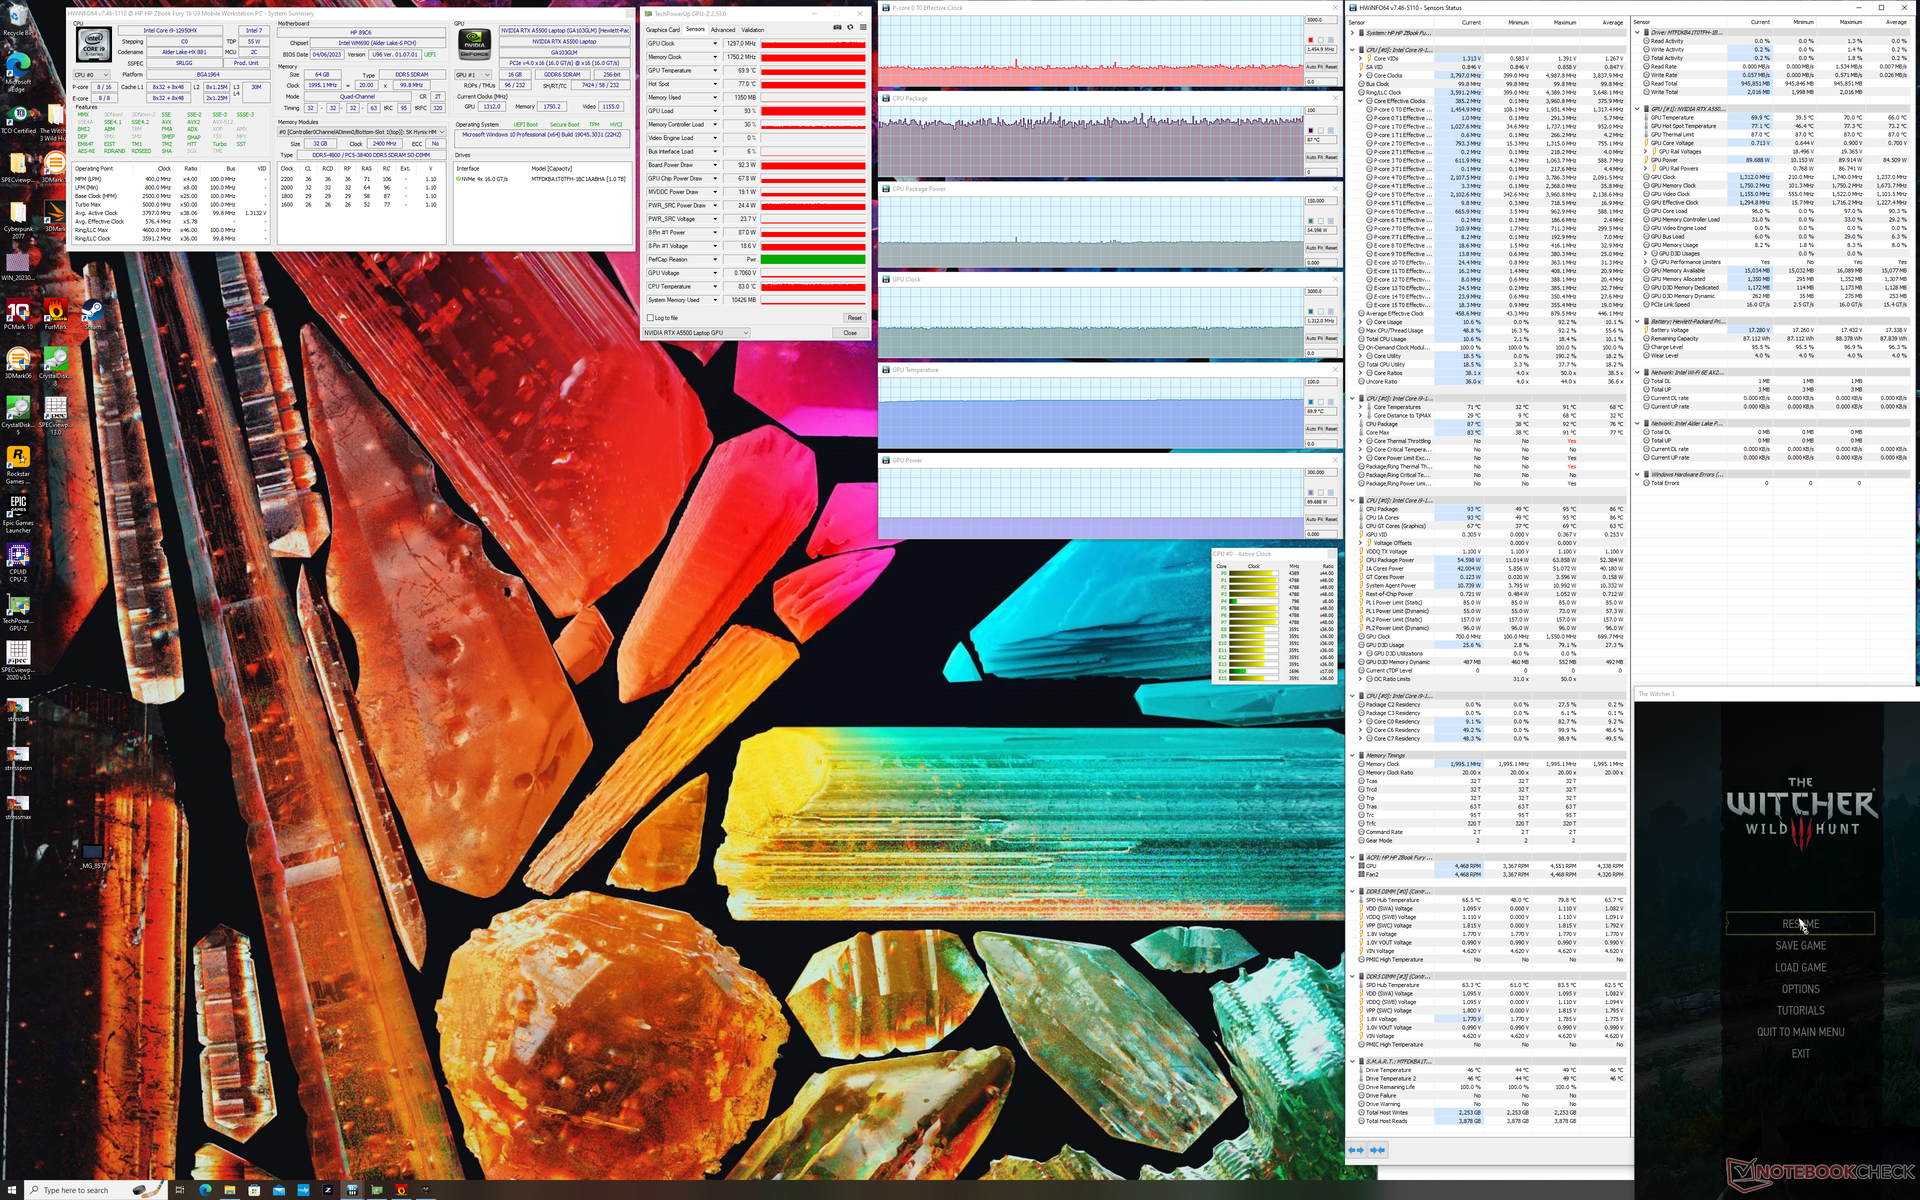
运行 Witcher 3代表高图形负载,将导致稳定的GPU时钟频率、温度和电路板功耗分别为1297 MHz、70 C和92 W。在ThinkPad P16 G1上重复这一测试将导致更高的稳定值,即1477 MHz、78 C和129 W。
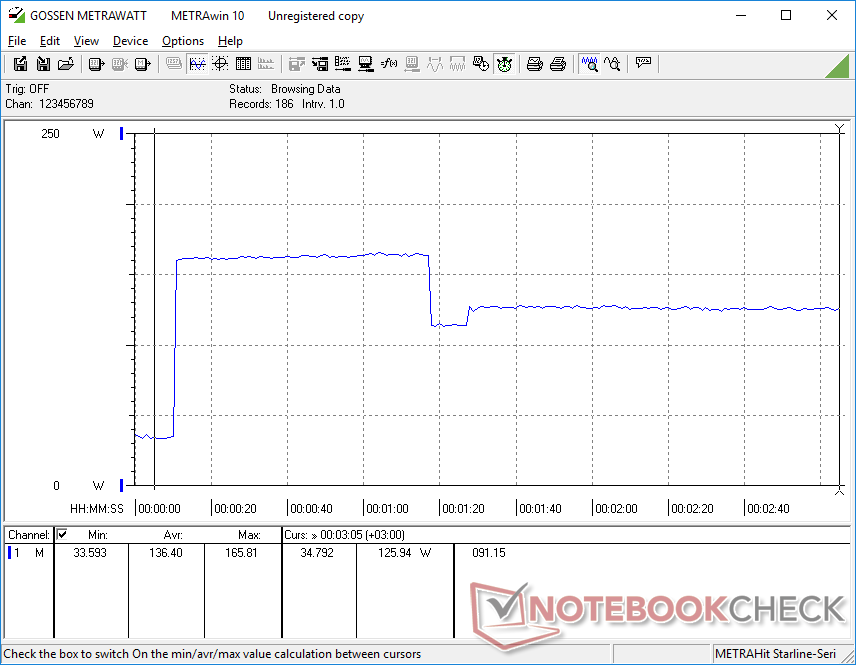
在电池上运行限制了性能,即使是在性能配置文件上。在电池上进行的Fire Strike ,物理和图形的得分分别为22837和5625分,而在主电源上则为30270和25713分。
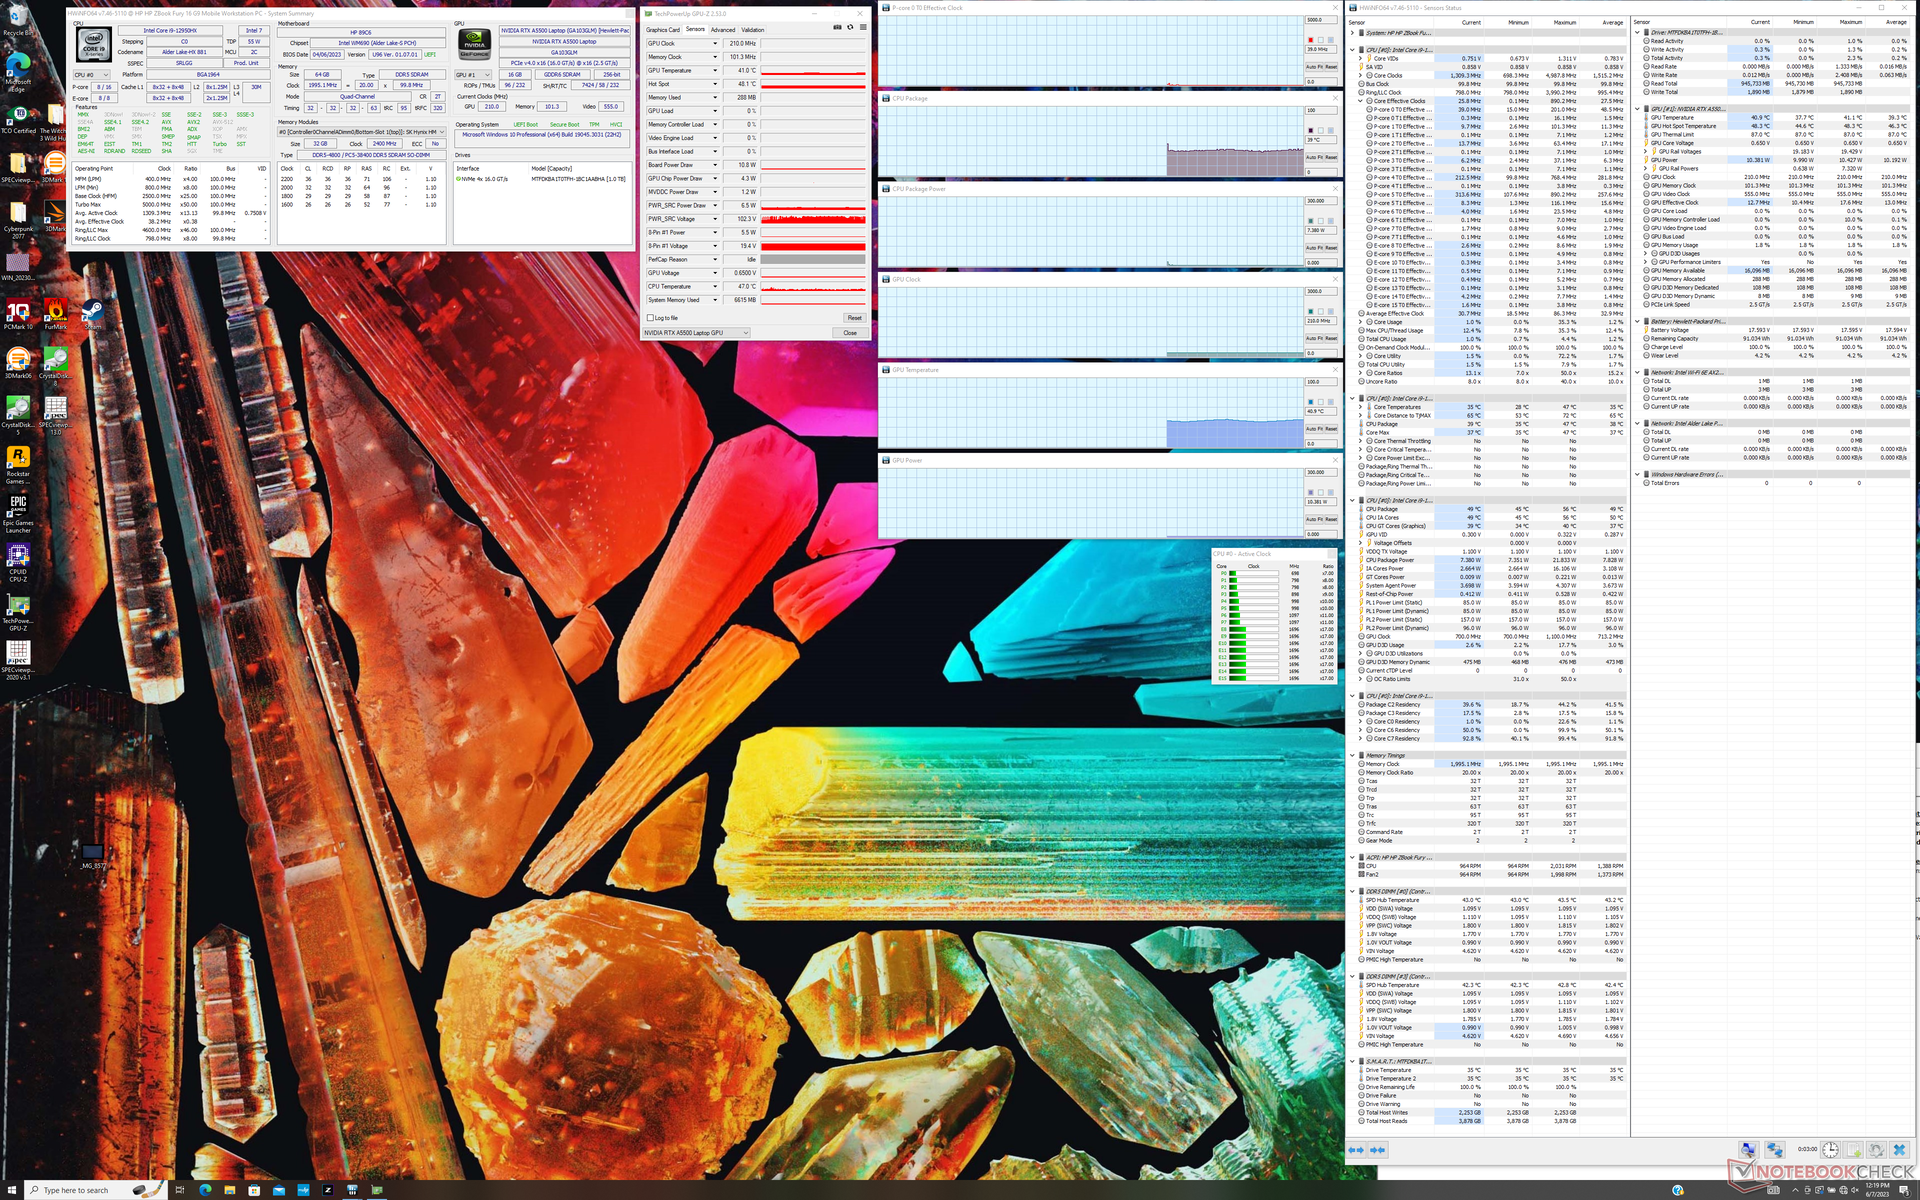
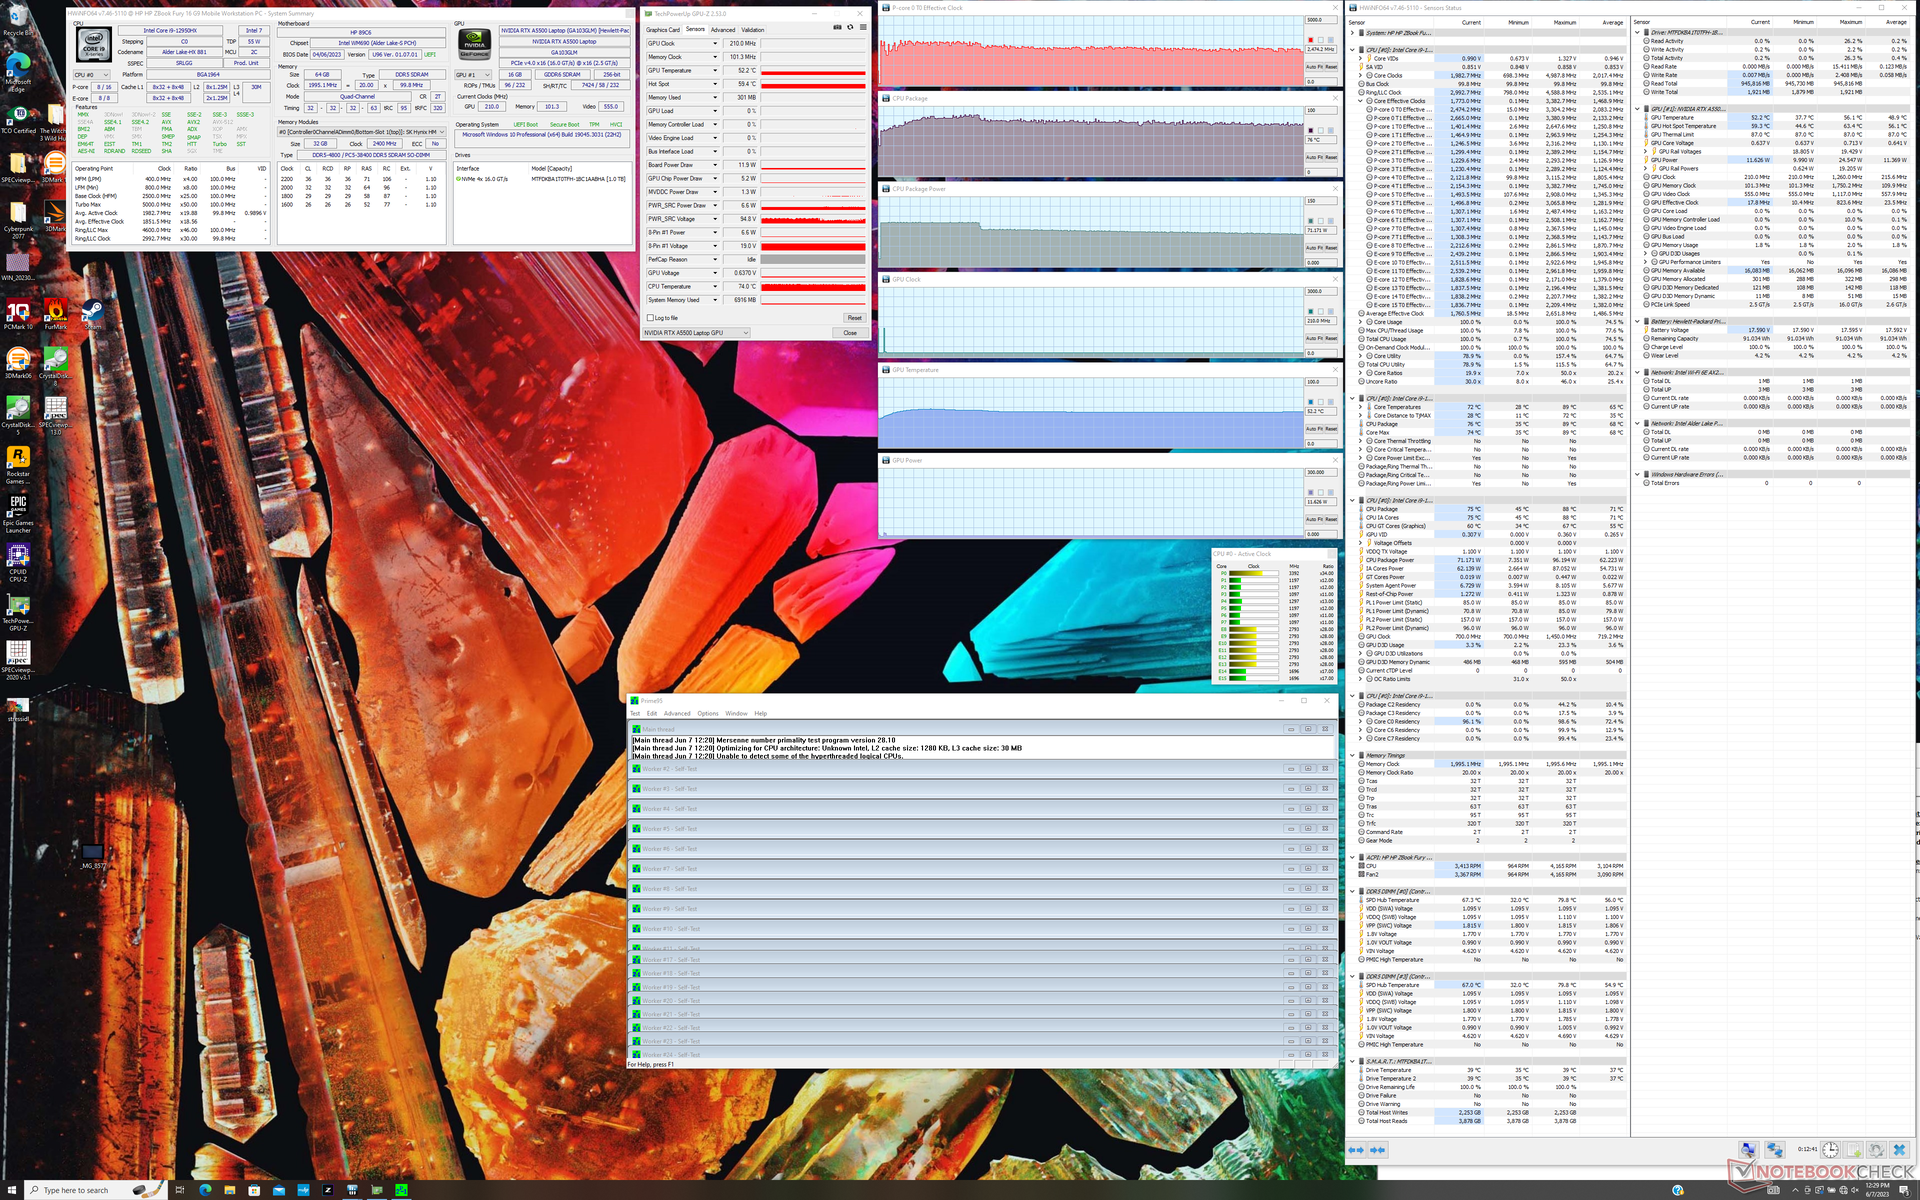
| CPU时钟(GHz) | GPU时钟(MHz) | CPU平均温度(℃) | GPU平均温度(℃) | |
| 系统空闲 | -- | -- | 39 | 41 |
| Prime95压力 | 2.5 - 2.7 | -- | 76 | 52 |
| Prime95 + FurMark 压力 | 2.2 - 2.3 | 547 - 1200 | 74 | 66 |
| Witcher 3 应力 | ~1.4 | 1297 | 87 | 70 |
发言人
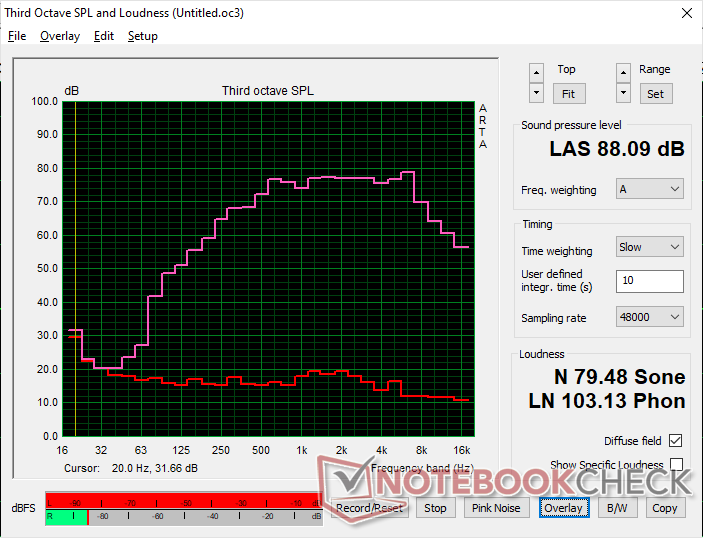
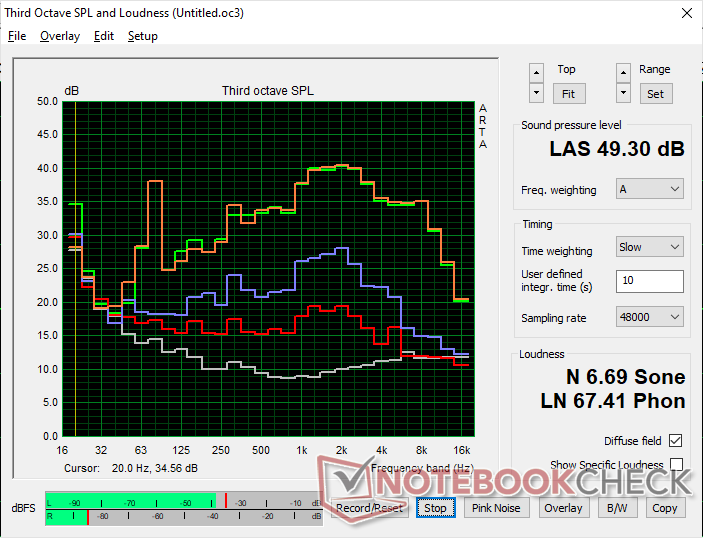
HP ZBook Fury 16 G9 audio analysis
(+) | speakers can play relatively loud (88.1 dB)
Bass 100 - 315 Hz
(-) | nearly no bass - on average 16.1% lower than median
(±) | linearity of bass is average (7.5% delta to prev. frequency)
Mids 400 - 2000 Hz
(+) | balanced mids - only 2.7% away from median
(+) | mids are linear (3.2% delta to prev. frequency)
Highs 2 - 16 kHz
(+) | balanced highs - only 4.2% away from median
(+) | highs are linear (4.9% delta to prev. frequency)
Overall 100 - 16.000 Hz
(+) | overall sound is linear (13.5% difference to median)
Compared to same class
» 26% of all tested devices in this class were better, 5% similar, 70% worse
» The best had a delta of 7%, average was 17%, worst was 35%
Compared to all devices tested
» 14% of all tested devices were better, 4% similar, 82% worse
» The best had a delta of 4%, average was 23%, worst was 134%
Apple MacBook Pro 16 2021 M1 Pro audio analysis
(+) | speakers can play relatively loud (84.7 dB)
Bass 100 - 315 Hz
(+) | good bass - only 3.8% away from median
(+) | bass is linear (5.2% delta to prev. frequency)
Mids 400 - 2000 Hz
(+) | balanced mids - only 1.3% away from median
(+) | mids are linear (2.1% delta to prev. frequency)
Highs 2 - 16 kHz
(+) | balanced highs - only 1.9% away from median
(+) | highs are linear (2.7% delta to prev. frequency)
Overall 100 - 16.000 Hz
(+) | overall sound is linear (4.6% difference to median)
Compared to same class
» 0% of all tested devices in this class were better, 0% similar, 100% worse
» The best had a delta of 5%, average was 17%, worst was 45%
Compared to all devices tested
» 0% of all tested devices were better, 0% similar, 100% worse
» The best had a delta of 4%, average was 23%, worst was 134%
能源管理
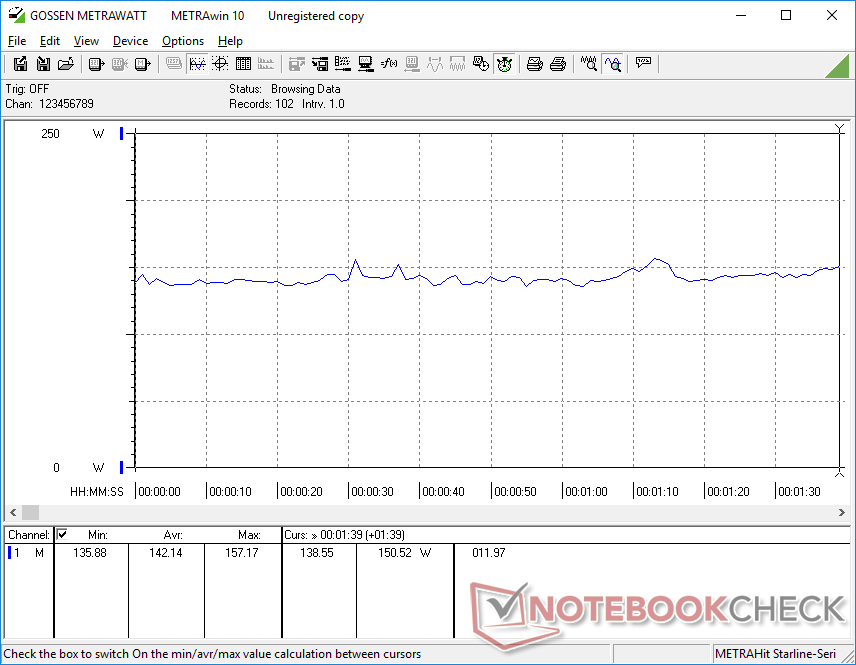
消耗功率
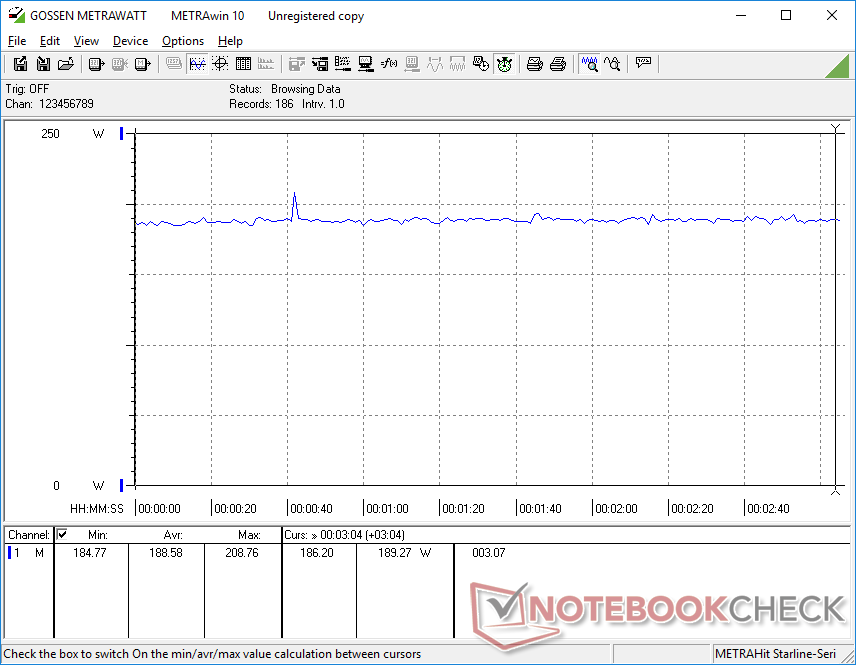
耗电量相对较高。例如,在桌面上空转,即使是在省电模式和最低亮度设置下,耗电量也刚刚超过19W,而ThinkPad P16 G1或Precision 7670的耗电量分别为7W或16W。运行要求更高的负载,如 Witcher 3将消耗189瓦或比Precision 7670多出近30瓦,尽管戴尔提供的图形性能略快。
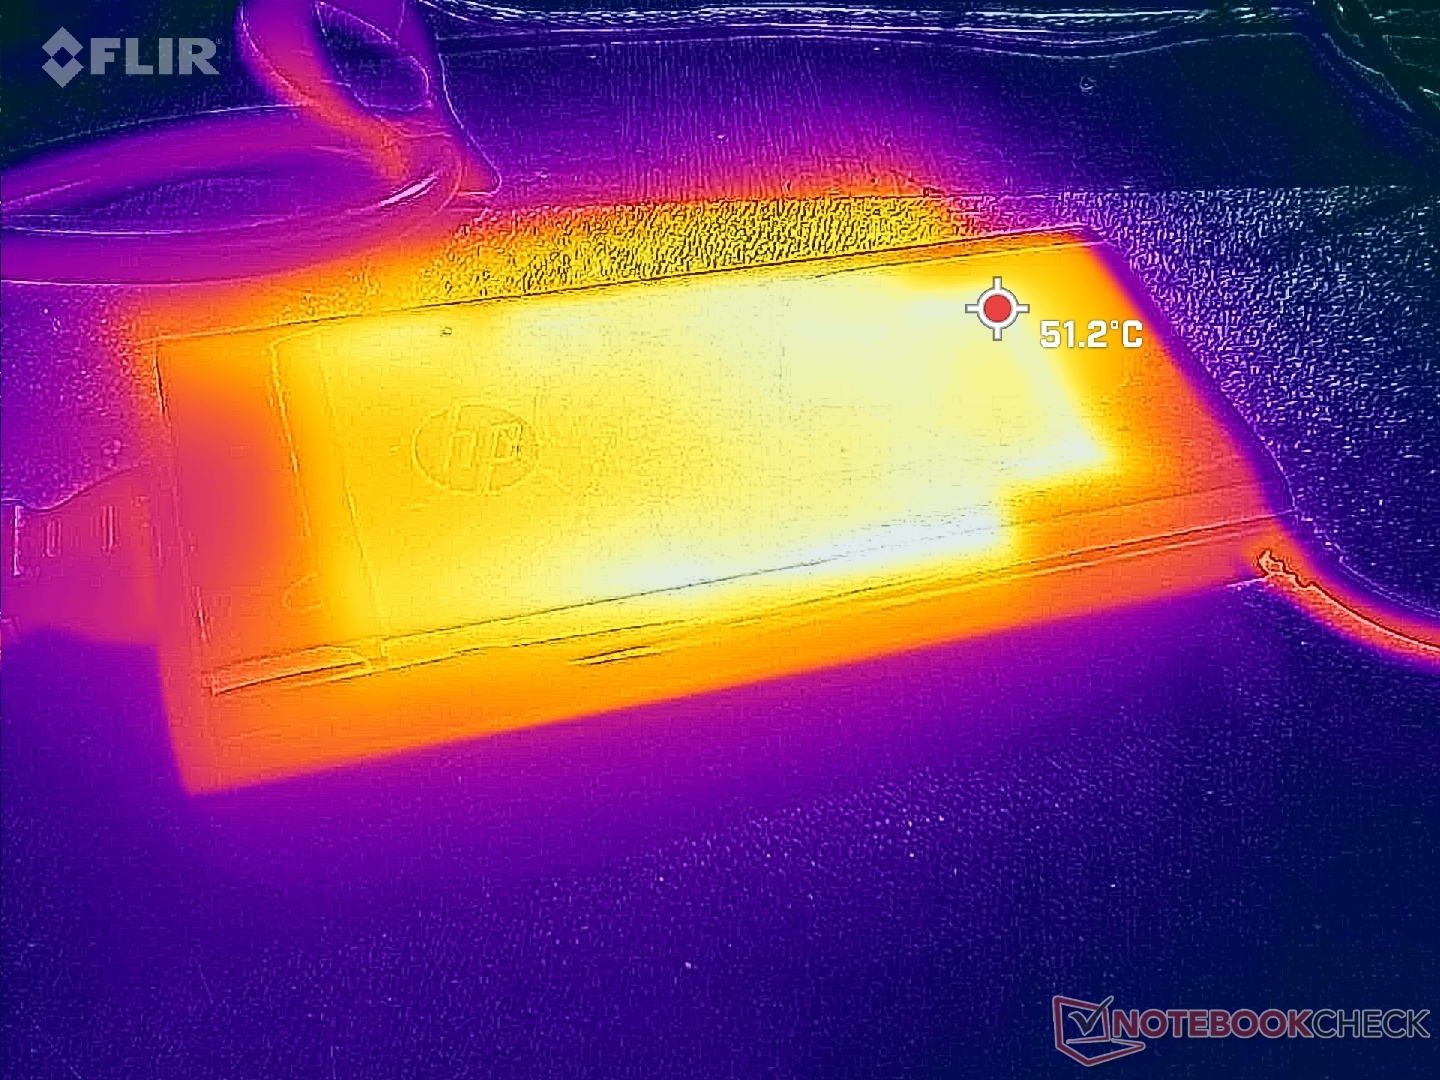
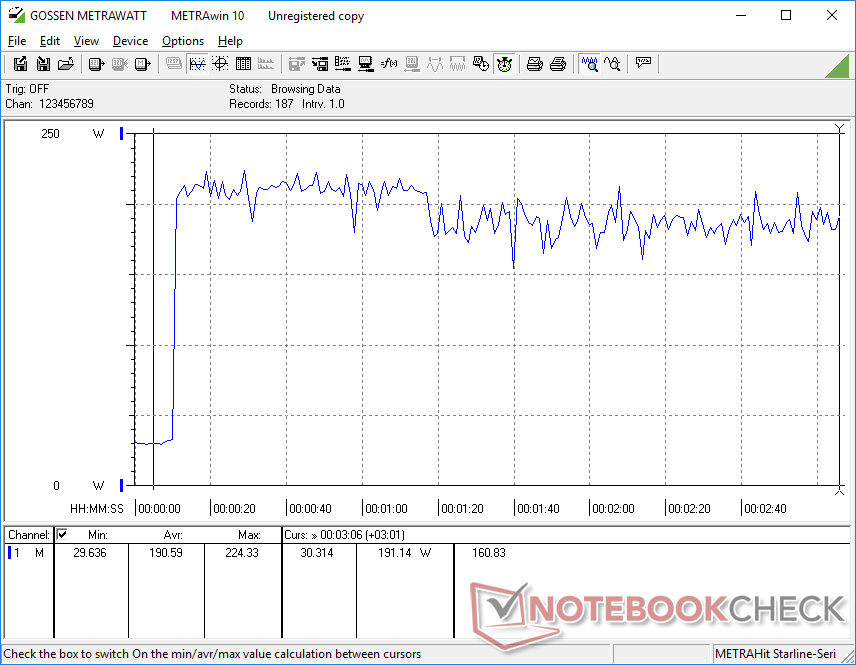
当CPU和GPU的利用率为100%时,我们能够从中等大小(约18 x 8.9 x 2.7厘米)的230瓦交流适配器上记录到224瓦的临时最大耗电量。因此,如果同时运行如此高的负载,充电速度会慢到极点。在Precision 7670或ThinkPad P16 G1上重复这一测试将导致更高的临时功耗水平,大约为300W,因为它们都有更高的TGP/TDP目标,因此有更高的Turbo Boost上限。
| Off / Standby | |
| Idle | |
| Load |
|
Key:
min: | |
| HP ZBook Fury 16 G9 i9-12950HX, RTX A5500 Laptop GPU, Micron 3400 1TB MTFDKBA1T0TFH, IPS, 3840x2400, 16" | HP ZBook Studio 16 G9 62U04EA i7-12800H, RTX A2000 Laptop GPU, Micron 3400 1TB MTFDKBA1T0TFH, IPS, 3840x2400, 16" | HP ZBook Firefly 16 G9-6B897EA i7-1265U, T550 Laptop GPU, Samsung PM9A1 MZVL21T0HCLR, IPS, 1920x1200, 16" | Lenovo ThinkPad P16 G1 RTX A5500 i9-12950HX, RTX A5500 Laptop GPU, WDC PC SN810 2TB, IPS, 3840x2400, 16" | Dell Precision 7000 7670 Performance i9-12950HX, RTX A5500 Laptop GPU, , OLED, 3840x2400, 16" | MSI CreatorPro Z16P B12UKST i7-12700H, RTX A3000 Laptop GPU, Samsung PM9A1 MZVL21T0HCLR, IPS, 2560x1600, 16" | |
|---|---|---|---|---|---|---|
| Power Consumption | 40% | 71% | 10% | -8% | 35% | |
| Idle Minimum * (Watt) | 19.5 | 7.2 63% | 4.5 77% | 7.5 62% | 16.4 16% | 10.8 45% |
| Idle Average * (Watt) | 29 | 18.1 38% | 8 72% | 20.1 31% | 35.9 -24% | 16.3 44% |
| Idle Maximum * (Watt) | 40.7 | 18.5 55% | 8.7 79% | 40 2% | 47 -15% | 16.9 58% |
| Load Average * (Watt) | 142.1 | 112.8 21% | 48.3 66% | 137 4% | 147.1 -4% | 111.7 21% |
| Witcher 3 ultra * (Watt) | 188.6 | 106.7 43% | 45.3 76% | 208 -10% | 158.8 16% | 152.1 19% |
| Load Maximum * (Watt) | 224.4 | 186 17% | 94.7 58% | 285.9 -27% | 311 -39% | 177.4 21% |
* ... smaller is better
Power Consumption Witcher 3 / Stresstest
Power Consumption external Monitor
电池寿命--有问题的运行时间
6小时的无线局域网运行时间与ZBook Studio 16 G9和ThinkPad P16 G1相当,而比Precision 7670长一个多小时。更薄的ZBook Firefly 16 G9可以持续近2倍的时间,因为它采用了较慢的Core U系列CPU。
使用随附的交流适配器对95Wh电池从空到满的充电速度很快,仅超过一个小时。该系统也可以通过第三方USB-C适配器进行充电,但对于较小的容量来说,兼容性得不到保证。例如,将我们的65瓦USB-C适配器连接到Fury 16 G9上,会返回一个Windows弹出窗口,声称充电功率不足。另一方面,我们的130W USB-C交流适配器可以为系统充电,没有任何问题。如果通过USB-C充电,性能会降低,这是可以预期的。
奇怪的是,即使经过多次重测,在省电模式和最低亮度设置下空转的电池寿命会比我们的平衡无线网络设置短。这很可能是该模型的一个错误,它指向不良的后台资源管理或与Windows电源配置文件设置有关的错误CPU状态。
| HP ZBook Fury 16 G9 i9-12950HX, RTX A5500 Laptop GPU, 95 Wh | HP ZBook Studio 16 G9 62U04EA i7-12800H, RTX A2000 Laptop GPU, 86 Wh | HP ZBook Firefly 16 G9-6B897EA i7-1265U, T550 Laptop GPU, 76 Wh | Lenovo ThinkPad P16 G1 RTX A5500 i9-12950HX, RTX A5500 Laptop GPU, 94 Wh | Dell Precision 7000 7670 Performance i9-12950HX, RTX A5500 Laptop GPU, 93 Wh | MSI CreatorPro Z16P B12UKST i7-12700H, RTX A3000 Laptop GPU, 90 Wh | |
|---|---|---|---|---|---|---|
| Battery runtime | -2% | 92% | -3% | -22% | -3% | |
| Reader / Idle (h) | 5.3 | |||||
| WiFi v1.3 (h) | 6 | 6.3 5% | 13 117% | 5.8 -3% | 4.7 -22% | 5.8 -3% |
| Load (h) | 1.2 | 1.1 -8% | 2 67% | |||
| H.264 (h) | 8.5 | 18.4 |
Pros
Cons
评语--性能良好,但联想和戴尔做得更快
ZBook Fury 16 G9提供了大多数其他移动工作站所没有的功能。超亮的1000尼特面板,可选的OLED,每个键的RGB照明,专用的可编程键,以及支持多达4个SSD和4个SODIMM模块,都是发烧友可以欣赏的功能。同时,舒适的键盘和触摸板是我们希望其他制造商能够模仿的东西。
阻止ZBook Fury 16 G9成为即时推荐产品的主要缺点是它的性能节流比较严重,当与 联想ThinkPad P16 G1或 戴尔Precision 7670.虽然惠普确实可以支持4倍的内部驱动器,但这些驱动器的性能在受到压力时往往会被扼杀。同样令人失望的是,RTX A5500的目标是TGP只有100W,而上述联想和戴尔型号的目标都是~130W,性能更快。与其他具有相同处理器选项的机型相比,甚至CPU的性能也略显不足。
惠普ZBook Fury 16 G9比许多其他16英寸工作站更轻,功能更丰富。然而,由于较低的TGP和TDP目标以及SSD冷却不足,性能略微受到影响。
如果你对上述辅助功能不感兴趣,那么你最好选择ThinkPad P16 G1或Precision 7670,以最大限度地提高性能。不过,如果你不介意为了这些功能而减掉一些性能,那么更轻的惠普Fury可能值得考虑。
价格和可用性
惠普现在正在运送其ZBook Fury 16 G9,基本配置从1490美元起,到我们的审查配置超过4000美元。Fury 16 G10也已上市。
HP ZBook Fury 16 G9
- 06/09/2023 v7 (old)
Allen Ngo
Transparency
The selection of devices to be reviewed is made by our editorial team. The test sample was provided to the author as a loan by the manufacturer or retailer for the purpose of this review. The lender had no influence on this review, nor did the manufacturer receive a copy of this review before publication. There was no obligation to publish this review. As an independent media company, Notebookcheck is not subjected to the authority of manufacturers, retailers or publishers.
This is how Notebookcheck is testing
Every year, Notebookcheck independently reviews hundreds of laptops and smartphones using standardized procedures to ensure that all results are comparable. We have continuously developed our test methods for around 20 years and set industry standards in the process. In our test labs, high-quality measuring equipment is utilized by experienced technicians and editors. These tests involve a multi-stage validation process. Our complex rating system is based on hundreds of well-founded measurements and benchmarks, which maintains objectivity. Further information on our test methods can be found here.
Price comparison

