华硕ROG Zephyrus S GX502GW (Core i7-9750H, RTX 2070) 笔记本电脑评测
| |||||||||||||||||||||||||
Brightness Distribution: 90 %
Center on Battery: 286 cd/m²
Contrast: 773:1 (Black: 0.37 cd/m²)
ΔE ColorChecker Calman: 2.19 | ∀{0.5-29.43 Ø4.71}
calibrated: 2.27
ΔE Greyscale Calman: 2.2 | ∀{0.09-98 Ø4.96}
91% sRGB (Argyll 1.6.3 3D)
59% AdobeRGB 1998 (Argyll 1.6.3 3D)
65.9% AdobeRGB 1998 (Argyll 3D)
91% sRGB (Argyll 3D)
64.9% Display P3 (Argyll 3D)
Gamma: 2.41
CCT: 6405 K
| Asus Zephyrus S GX502GW AU Optronics B156HAN08.2 (AUO82ED), IPS, 1920x1080 | Asus Zephyrus S GX531GX AU Optronics B156HAN08.2, IPS, 1920x1080 | Acer Predator Triton 500 AU Optronics B156HAN08.2 (AUO82ED), IPS, 1920x1080 | Razer Blade 15 RTX 2070 Max-Q LG Philips LGD05C0, IPS, 1920x1080 | Gigabyte Aero 15-X9 LGD05C0, IPS, 1920x1080 | |
|---|---|---|---|---|---|
| Display | 1% | 0% | 2% | -1% | |
| Display P3 Coverage (%) | 64.9 | 65.6 1% | 64.2 -1% | 65.3 1% | 63.5 -2% |
| sRGB Coverage (%) | 91 | 92.2 1% | 92.6 2% | 94.9 4% | 93.1 2% |
| AdobeRGB 1998 Coverage (%) | 65.9 | 66.9 2% | 65.7 0% | 66.3 1% | 64.5 -2% |
| Response Times | -3% | -19% | -83% | -92% | |
| Response Time Grey 50% / Grey 80% * (ms) | 7.2 ? | 7 ? 3% | 8 ? -11% | 16.8 ? -133% | 16.4 ? -128% |
| Response Time Black / White * (ms) | 8.8 ? | 9.6 ? -9% | 11.2 ? -27% | 11.6 ? -32% | 13.6 ? -55% |
| PWM Frequency (Hz) | |||||
| Screen | -3% | -24% | -2% | 12% | |
| Brightness middle (cd/m²) | 286 | 323.6 13% | 304 6% | 314.7 10% | 250 -13% |
| Brightness (cd/m²) | 275 | 315 15% | 299 9% | 312 13% | 235 -15% |
| Brightness Distribution (%) | 90 | 91 1% | 89 -1% | 90 0% | 85 -6% |
| Black Level * (cd/m²) | 0.37 | 0.29 22% | 0.27 27% | 0.38 -3% | 0.29 22% |
| Contrast (:1) | 773 | 1116 44% | 1126 46% | 828 7% | 862 12% |
| Colorchecker dE 2000 * | 2.19 | 3.31 -51% | 4.66 -113% | 2.56 -17% | 1.46 33% |
| Colorchecker dE 2000 max. * | 4.4 | 5.74 -30% | 9.65 -119% | 4.89 -11% | 2.47 44% |
| Colorchecker dE 2000 calibrated * | 2.27 | 2.73 -20% | 1.72 24% | 1.71 25% | |
| Greyscale dE 2000 * | 2.2 | 2.9 -32% | 5.53 -151% | 3.4 -55% | 1.27 42% |
| Gamma | 2.41 91% | 2.29 96% | 2.5 88% | 2.3 96% | 2.4 92% |
| CCT | 6405 101% | 6765 96% | 8028 81% | 6435 101% | 6749 96% |
| Color Space (Percent of AdobeRGB 1998) (%) | 59 | 59.7 1% | 60 2% | 60.7 3% | 60 2% |
| Color Space (Percent of sRGB) (%) | 91 | 91.8 1% | 93 2% | 94.6 4% | 93 2% |
| Total Average (Program / Settings) | -2% /
-2% | -14% /
-19% | -28% /
-11% | -27% /
-4% |
* ... smaller is better
Display Response Times
| ↔ Response Time Black to White | ||
|---|---|---|
| 8.8 ms ... rise ↗ and fall ↘ combined | ↗ 4.4 ms rise | 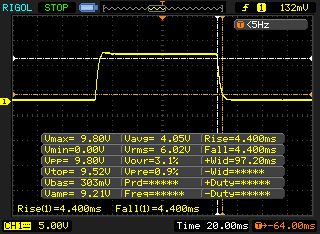 |
| ↘ 4.4 ms fall | ||
| The screen shows fast response rates in our tests and should be suited for gaming. In comparison, all tested devices range from 0.1 (minimum) to 240 (maximum) ms. » 25 % of all devices are better. This means that the measured response time is better than the average of all tested devices (19.8 ms). | ||
| ↔ Response Time 50% Grey to 80% Grey | ||
| 7.2 ms ... rise ↗ and fall ↘ combined | ↗ 3.8 ms rise | 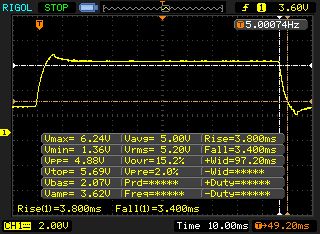 |
| ↘ 3.4 ms fall | ||
| The screen shows very fast response rates in our tests and should be very well suited for fast-paced gaming. In comparison, all tested devices range from 0.165 (minimum) to 636 (maximum) ms. » 20 % of all devices are better. This means that the measured response time is better than the average of all tested devices (30.9 ms). | ||
Screen Flickering / PWM (Pulse-Width Modulation)
| Screen flickering / PWM not detected | 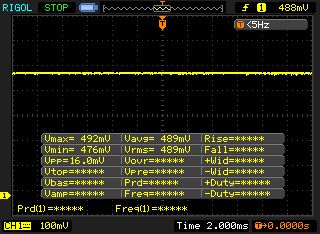 | ||
In comparison: 52 % of all tested devices do not use PWM to dim the display. If PWM was detected, an average of 7748 (minimum: 5 - maximum: 343500) Hz was measured. | |||
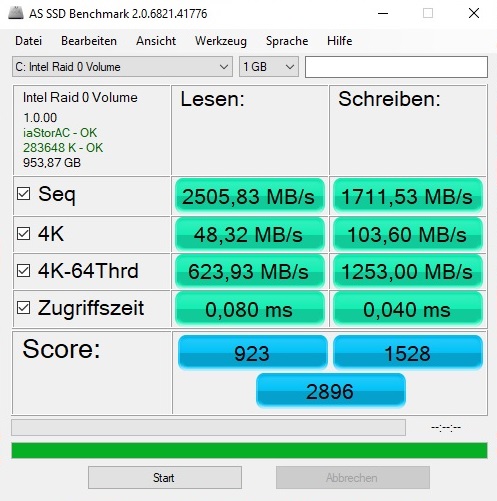
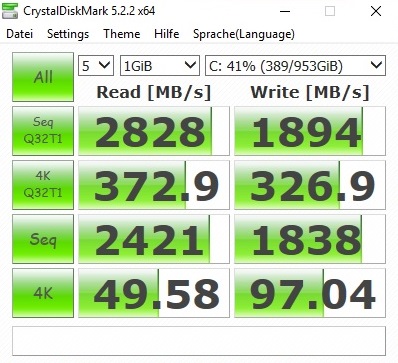
| Asus Zephyrus S GX502GW 2x Intel SSD 660p SSDPEKNW512G8 (RAID 0) | Asus Zephyrus S GX531GX Intel SSD 660p SSDPEKNW512G8 | Acer Predator Triton 500 2x WDC PC SN720 SDAPNTW-256G-1014 (RAID 0) | Razer Blade 15 RTX 2070 Max-Q Samsung SSD PM981 MZVLB512HAJQ | Gigabyte Aero 15-X9 Intel SSD 760p SSDPEKKW010T8 | |
|---|---|---|---|---|---|
| CrystalDiskMark 5.2 / 6 | -29% | 7% | -10% | -11% | |
| Write 4K (MB/s) | 97 | 93.9 -3% | 93.6 -4% | 93.9 -3% | 97.1 0% |
| Read 4K (MB/s) | 49.58 | 46.29 -7% | 38.82 -22% | 40.56 -18% | 53.7 8% |
| Write Seq (MB/s) | 1838 | 974 -47% | 2455 34% | 1468 -20% | 1526 -17% |
| Read Seq (MB/s) | 2421 | 1425 -41% | 2107 -13% | 1540 -36% | 2020 -17% |
| Write 4K Q32T1 (MB/s) | 326.9 | 259.4 -21% | 298.7 -9% | 293.5 -10% | 285.6 -13% |
| Read 4K Q32T1 (MB/s) | 372.9 | 296.5 -20% | 338.7 -9% | 346 -7% | 321.8 -14% |
| Write Seq Q32T1 (MB/s) | 1894 | 977 -48% | 2902 53% | 1941 2% | 1533 -19% |
| Read Seq Q32T1 (MB/s) | 2828 | 1666 -41% | 3536 25% | 3266 15% | 2351 -17% |

| 3DMark 11 Performance | 18686 points | |
| 3DMark Cloud Gate Standard Score | 30754 points | |
| 3DMark Fire Strike Score | 16290 points | |
| 3DMark Time Spy Score | 6890 points | |
Help | ||
| The Witcher 3 - 1920x1080 Ultra Graphics & Postprocessing (HBAO+) | |
| Average of class Gaming (104.7 - 240, n=7, last 2 years) | |
| Asus Zephyrus S GX531GX | |
| Acer Predator Triton 500 | |
| Asus Zephyrus S GX502GW | |
| Razer Blade 15 RTX 2070 Max-Q | |
| Gigabyte Aero 15-X9 | |
| low | med. | high | ultra | |
|---|---|---|---|---|
| The Witcher 3 (2015) | 130 | 70.2 | ||
| Shadow of the Tomb Raider (2018) | 91.3 | 86 | 80.3 | 74.2 |
| Apex Legends (2019) | 128 | 126 | ||
| Far Cry New Dawn (2019) | 91 | 83 | ||
| Metro Exodus (2019) | 91.1 | 82.6 | 66.3 | 54.6 |
| Anthem (2019) | 84 | 79 | ||
| Dirt Rally 2.0 (2019) | 121 | 75 | ||
| The Division 2 (2019) | 121 | 111 | 94 | 73 |
| Anno 1800 (2019) | 76.8 | 39.5 | ||
| Rage 2 (2019) | 180 | 122 | 103 | 101 |
| Control (2019) | 152 | 90 | 68 | |
| Borderlands 3 (2019) | 94 | 84 | 71 | 61 |
Noise level
| Idle |
| 31 / 33 / 38 dB(A) |
| Load |
| 50 / 56 dB(A) |
 | ||
30 dB silent 40 dB(A) audible 50 dB(A) loud |
||
min: | ||
| Asus Zephyrus S GX502GW GeForce RTX 2070 Mobile, i7-9750H | Asus Zephyrus S GX531GX GeForce RTX 2080 Max-Q, i7-8750H | Acer Predator Triton 500 GeForce RTX 2080 Max-Q, i7-8750H | Razer Blade 15 RTX 2070 Max-Q GeForce RTX 2070 Max-Q, i7-8750H | Gigabyte Aero 15-X9 GeForce RTX 2070 Max-Q, i7-8750H | Average of class Gaming | |
|---|---|---|---|---|---|---|
| Noise | 4% | 9% | 17% | 7% | 15% | |
| off / environment * (dB) | 30 | 28.7 4% | 29 3% | 28.8 4% | 30 -0% | 24.1 ? 20% |
| Idle Minimum * (dB) | 31 | 29.8 4% | 30 3% | 28.8 7% | 32 -3% | 26 ? 16% |
| Idle Average * (dB) | 33 | 32.4 2% | 32 3% | 28.8 13% | 34 -3% | 27.5 ? 17% |
| Idle Maximum * (dB) | 38 | 38 -0% | 34 11% | 29.4 23% | 36 5% | 30.1 ? 21% |
| Load Average * (dB) | 50 | 38.2 24% | 44 12% | 35.7 29% | 42 16% | 43.8 ? 12% |
| Witcher 3 ultra * (dB) | 53 | 56.6 -7% | 46 13% | 42.5 20% | 44 17% | |
| Load Maximum * (dB) | 56 | 56.6 -1% | 47 16% | 45 20% | 48 14% | 54.3 ? 3% |
* ... smaller is better
(-) The maximum temperature on the upper side is 54 °C / 129 F, compared to the average of 40.4 °C / 105 F, ranging from 21.2 to 68.8 °C for the class Gaming.
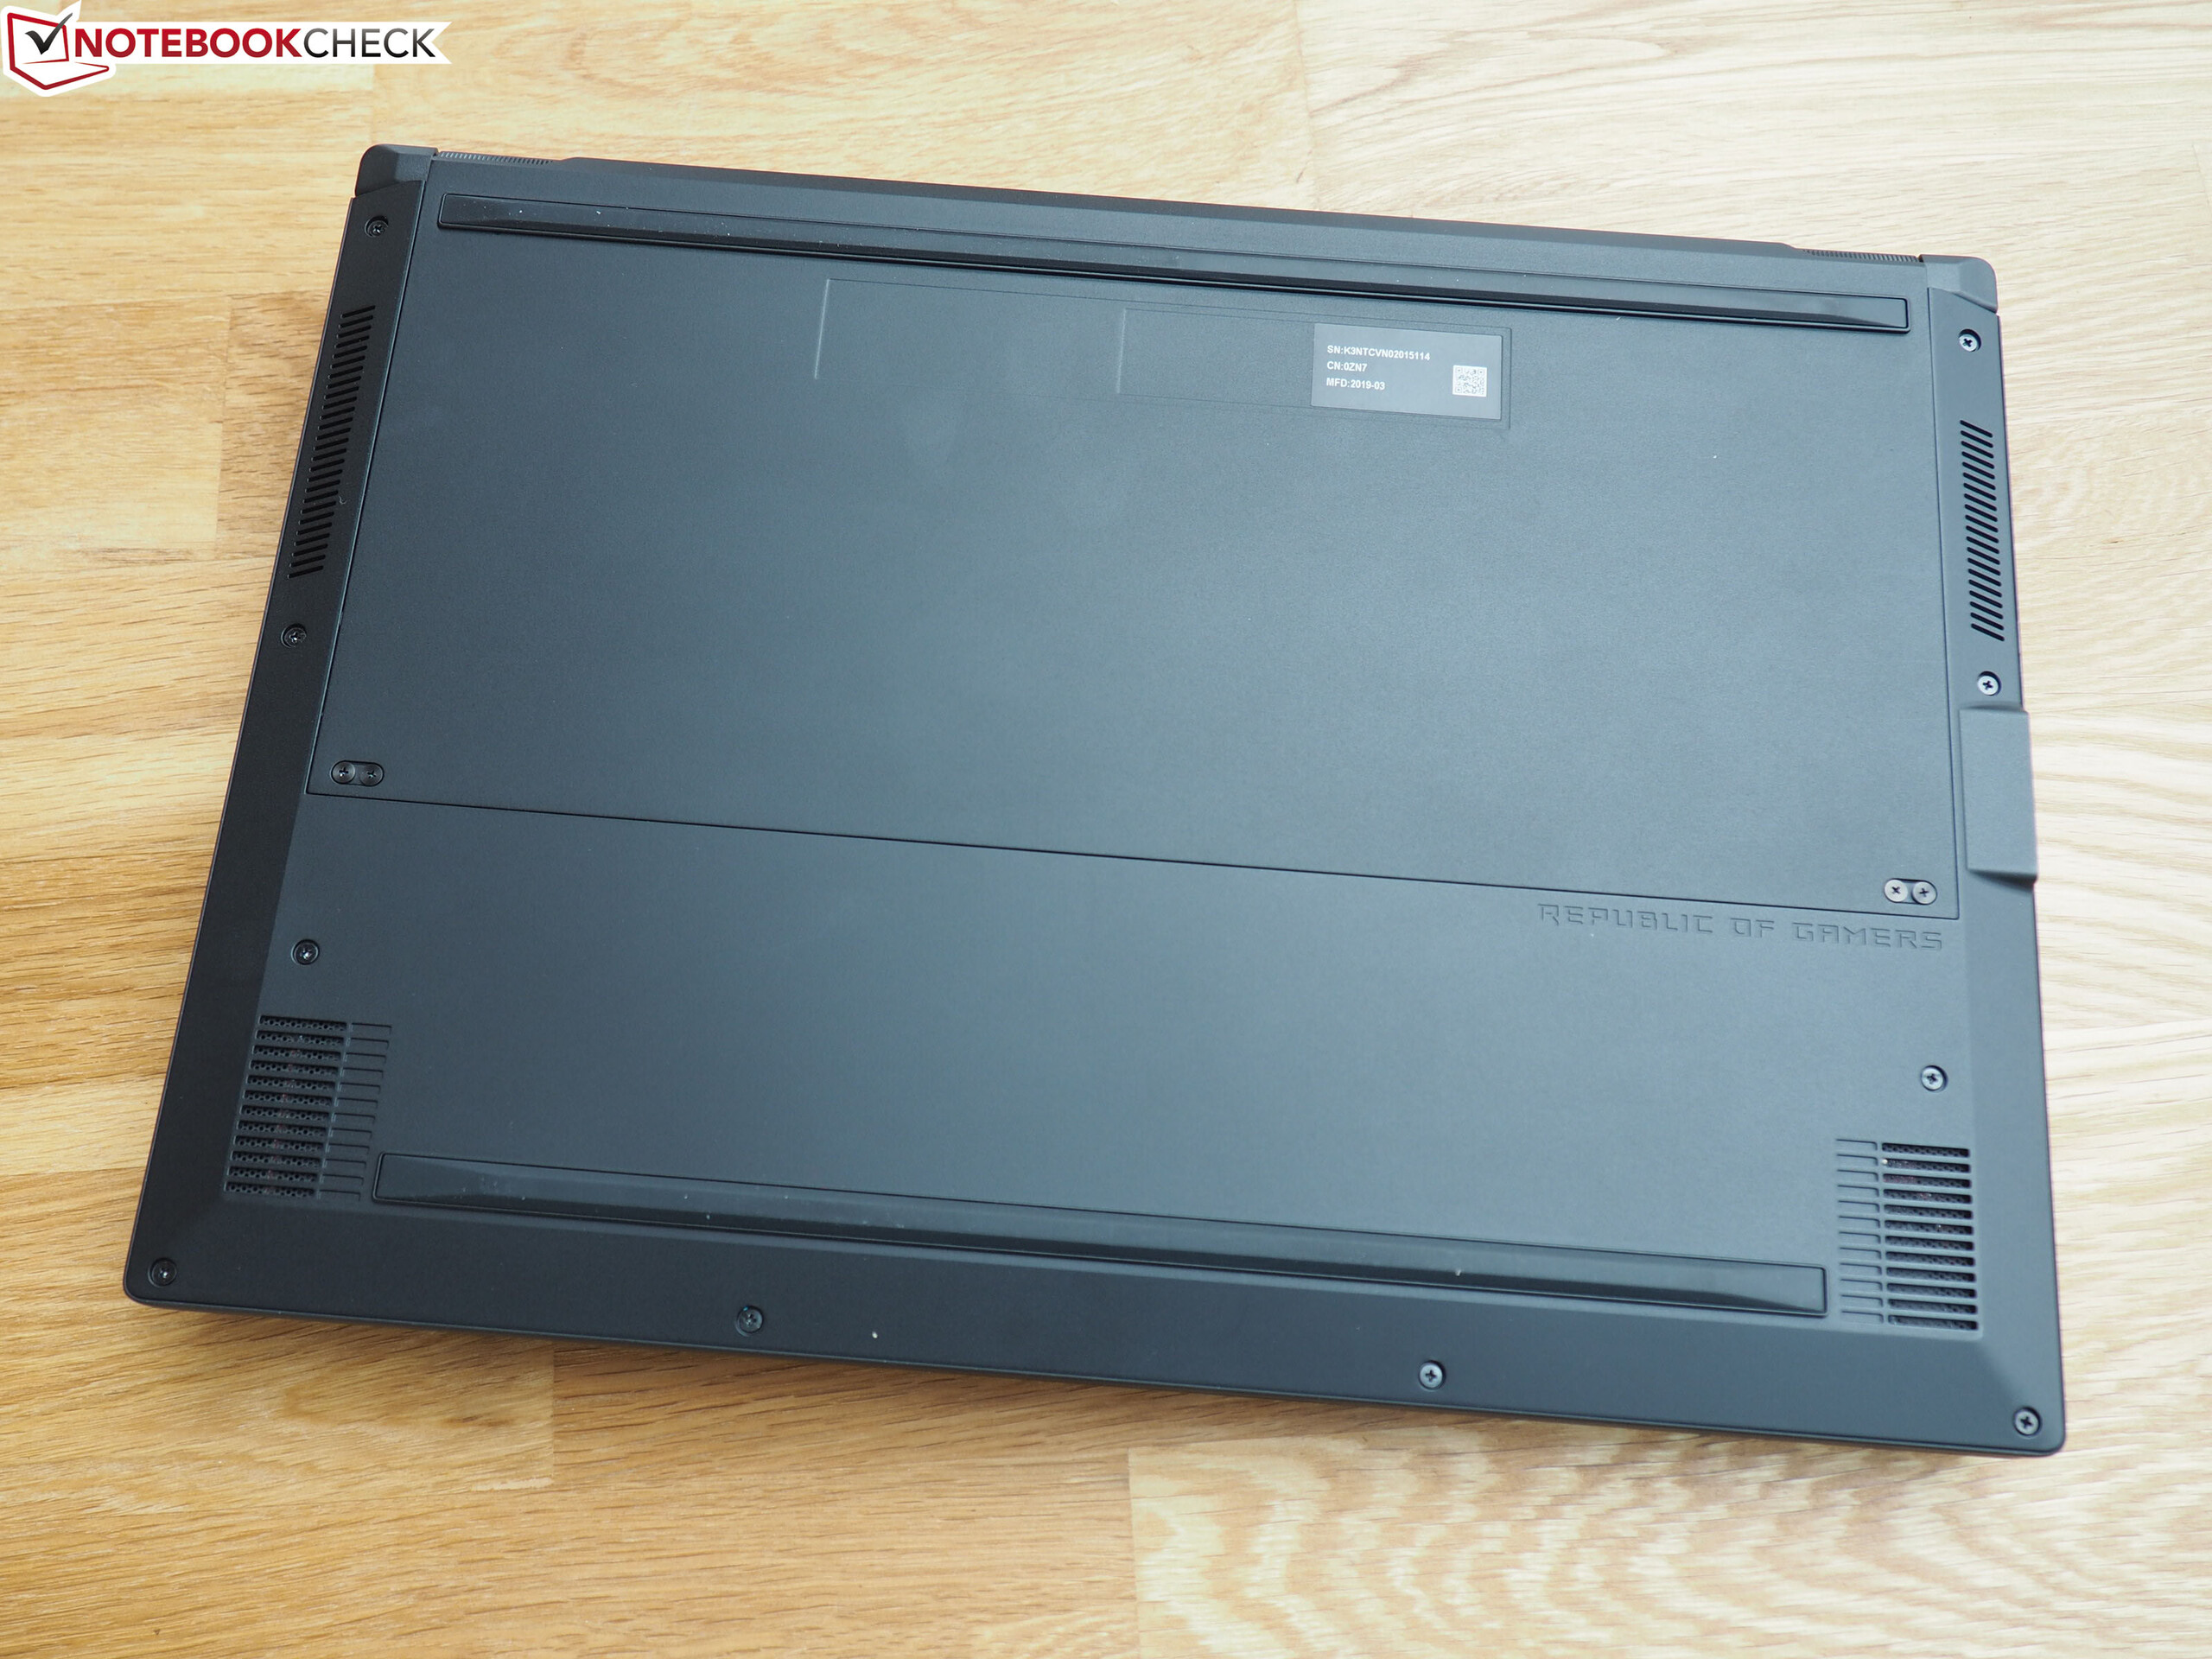
(-) The bottom heats up to a maximum of 47 °C / 117 F, compared to the average of 43.2 °C / 110 F
(+) In idle usage, the average temperature for the upper side is 31.2 °C / 88 F, compared to the device average of 33.9 °C / 93 F.
(-) Playing The Witcher 3, the average temperature for the upper side is 44.1 °C / 111 F, compared to the device average of 33.9 °C / 93 F.
(±) The palmrests and touchpad can get very hot to the touch with a maximum of 38 °C / 100.4 F.
(-) The average temperature of the palmrest area of similar devices was 28.8 °C / 83.8 F (-9.2 °C / -16.6 F).
| Asus Zephyrus S GX502GW GeForce RTX 2070 Mobile, i7-9750H | Asus Zephyrus S GX531GX GeForce RTX 2080 Max-Q, i7-8750H | Acer Predator Triton 500 GeForce RTX 2080 Max-Q, i7-8750H | Razer Blade 15 RTX 2070 Max-Q GeForce RTX 2070 Max-Q, i7-8750H | Gigabyte Aero 15-X9 GeForce RTX 2070 Max-Q, i7-8750H | Average of class Gaming | |
|---|---|---|---|---|---|---|
| Heat | 6% | -3% | 12% | -1% | 5% | |
| Maximum Upper Side * (°C) | 54 | 47 13% | 49 9% | 49 9% | 56 -4% | 45.2 ? 16% |
| Maximum Bottom * (°C) | 47 | 48.6 -3% | 58 -23% | 49 -4% | 66 -40% | 48.2 ? -3% |
| Idle Upper Side * (°C) | 33 | 28.8 13% | 33 -0% | 25.4 23% | 27 18% | 31 ? 6% |
| Idle Bottom * (°C) | 34 | 33.2 2% | 33 3% | 27.2 20% | 27 21% | 34.2 ? -1% |
* ... smaller is better
Asus Zephyrus S GX502GW audio analysis
(+) | speakers can play relatively loud (90 dB)
Bass 100 - 315 Hz
(±) | reduced bass - on average 12.7% lower than median
(±) | linearity of bass is average (8.5% delta to prev. frequency)
Mids 400 - 2000 Hz
(+) | balanced mids - only 4.5% away from median
(+) | mids are linear (4.1% delta to prev. frequency)
Highs 2 - 16 kHz
(±) | higher highs - on average 6.7% higher than median
(±) | linearity of highs is average (10.8% delta to prev. frequency)
Overall 100 - 16.000 Hz
(+) | overall sound is linear (14.6% difference to median)
Compared to same class
» 28% of all tested devices in this class were better, 8% similar, 65% worse
» The best had a delta of 6%, average was 18%, worst was 132%
Compared to all devices tested
» 19% of all tested devices were better, 4% similar, 77% worse
» The best had a delta of 4%, average was 23%, worst was 134%
Asus Zephyrus S GX531GX audio analysis
(±) | speaker loudness is average but good (73 dB)
Bass 100 - 315 Hz
(±) | reduced bass - on average 13.3% lower than median
(±) | linearity of bass is average (14.9% delta to prev. frequency)
Mids 400 - 2000 Hz
(+) | balanced mids - only 1.9% away from median
(+) | mids are linear (5.2% delta to prev. frequency)
Highs 2 - 16 kHz
(±) | higher highs - on average 5.6% higher than median
(±) | linearity of highs is average (10.8% delta to prev. frequency)
Overall 100 - 16.000 Hz
(±) | linearity of overall sound is average (18.3% difference to median)
Compared to same class
» 58% of all tested devices in this class were better, 9% similar, 33% worse
» The best had a delta of 6%, average was 18%, worst was 132%
Compared to all devices tested
» 40% of all tested devices were better, 8% similar, 52% worse
» The best had a delta of 4%, average was 23%, worst was 134%
| Off / Standby | |
| Idle | |
| Load |
|
Key:
min: | |
| Asus Zephyrus S GX502GW GeForce RTX 2070 Mobile, i7-9750H | Asus Zephyrus S GX531GX GeForce RTX 2080 Max-Q, i7-8750H | Acer Predator Triton 500 GeForce RTX 2080 Max-Q, i7-8750H | Razer Blade 15 RTX 2070 Max-Q GeForce RTX 2070 Max-Q, i7-8750H | Gigabyte Aero 15-X9 GeForce RTX 2070 Max-Q, i7-8750H | Average of class Gaming | |
|---|---|---|---|---|---|---|
| Power Consumption | 18% | 20% | 36% | 31% | 19% | |
| Idle Minimum * (Watt) | 24 | 16.1 33% | 16 33% | 10.4 57% | 16 33% | 13 ? 46% |
| Idle Average * (Watt) | 27 | 20.9 23% | 22 19% | 14.6 46% | 18 33% | 19 ? 30% |
| Idle Maximum * (Watt) | 33 | 27 18% | 32 3% | 16.3 51% | 23 30% | 24.5 ? 26% |
| Load Average * (Watt) | 129 | 93.4 28% | 89 31% | 88.5 31% | 88 32% | 111.1 ? 14% |
| Witcher 3 ultra * (Watt) | 176 | 168.2 4% | 147 16% | 155.4 12% | 120 32% | |
| Load Maximum * (Watt) | 216 | 215.3 -0% | 173 20% | 182.4 16% | 167 23% | 260 ? -20% |
* ... smaller is better
| Asus Zephyrus S GX502GW GeForce RTX 2070 Mobile, i7-9750H, 76 Wh | Asus Zephyrus S GX531GX GeForce RTX 2080 Max-Q, i7-8750H, 50 Wh | Acer Predator Triton 500 GeForce RTX 2080 Max-Q, i7-8750H, 82 Wh | Razer Blade 15 RTX 2070 Max-Q GeForce RTX 2070 Max-Q, i7-8750H, 80 Wh | Gigabyte Aero 15-X9 GeForce RTX 2070 Max-Q, i7-8750H, 94.24 Wh | Average of class Gaming | |
|---|---|---|---|---|---|---|
| Battery runtime | -19% | 7% | 73% | 106% | 61% | |
| Reader / Idle (h) | 5.9 | 5.6 -5% | 11.4 93% | 9.2 56% | 8.27 ? 40% | |
| WiFi v1.3 (h) | 3.7 | 3 -19% | 3.2 -14% | 6.5 76% | 6.4 73% | 7.11 ? 92% |
| Load (h) | 1 | 1.4 40% | 1.5 50% | 2.9 190% | 1.502 ? 50% | |
| H.264 (h) | 6.1 | 8.32 ? |
Pros
Cons
从表面上看,华硕ROG Zephyrus S GX502GW目前是您可以购买的最好的游戏笔记本电脑之一。尽管它有一些可能会让人失望的弱点。
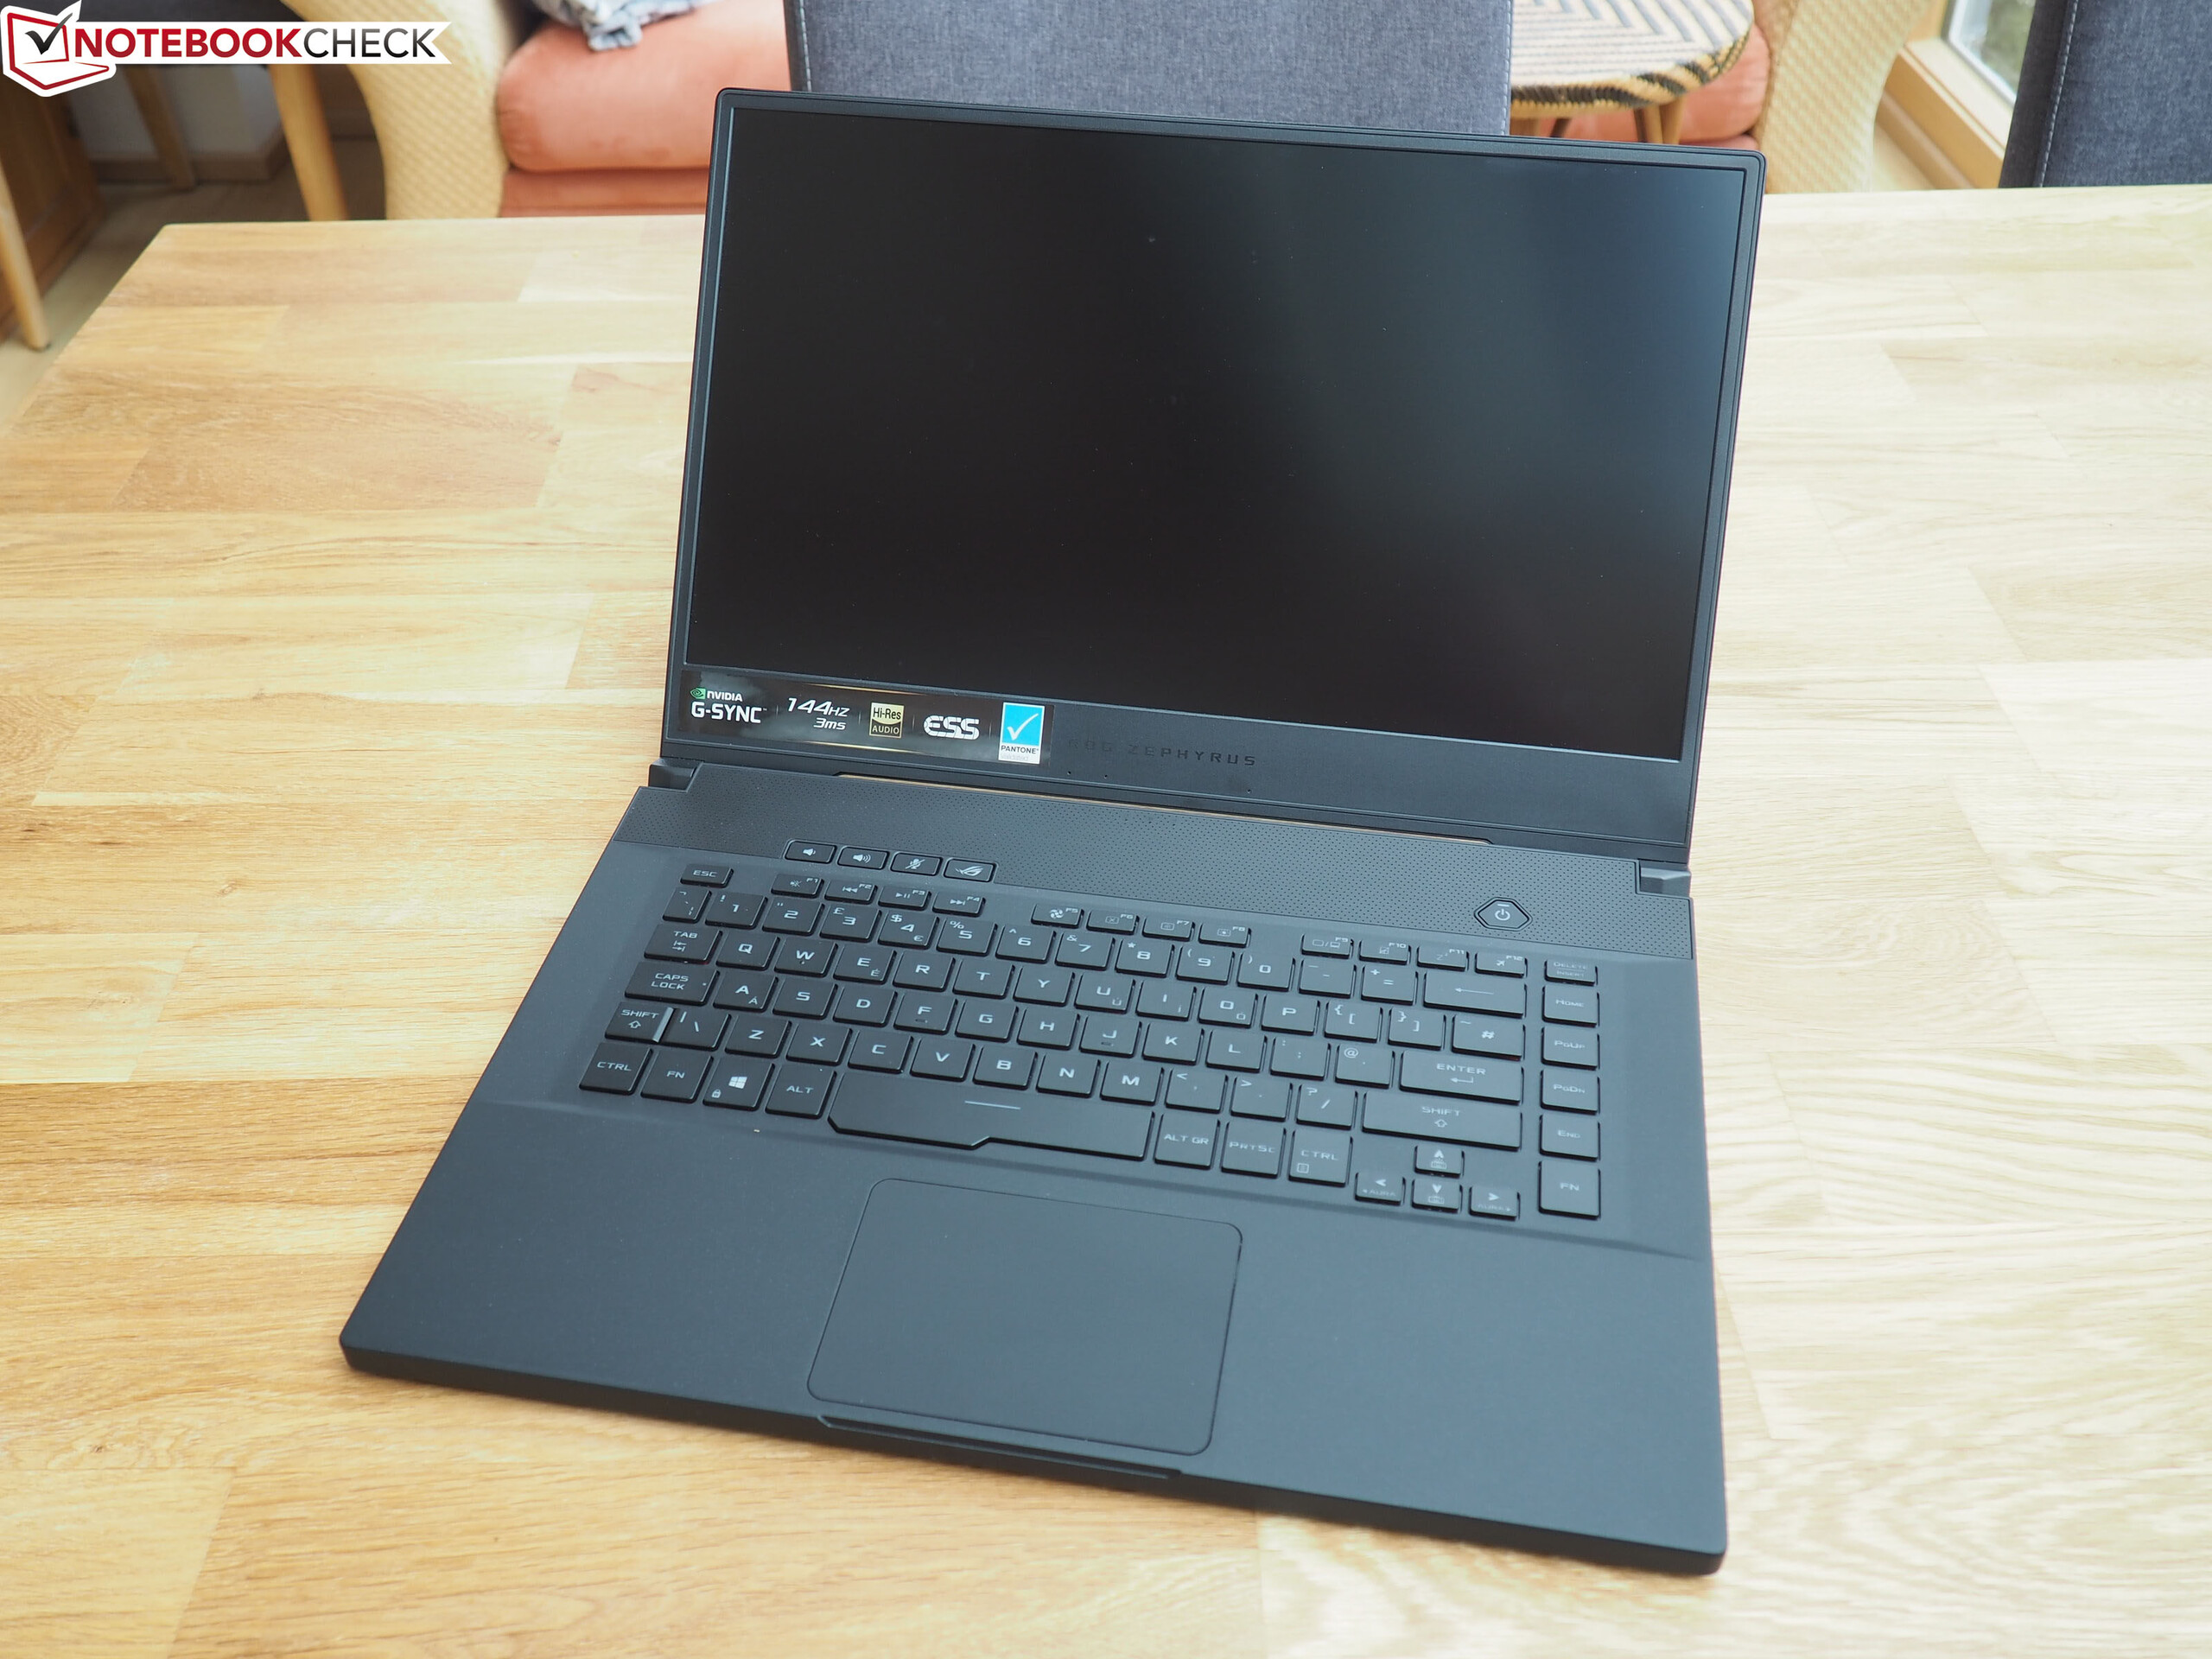
该设备采用轻薄的设计,但仍然塞入了功能强大的组件。它的高端CPU和GPU使其能够毫不费力地在高特效下运行近期的所有3A游戏。它的低响应时间,G-Sync,144 Hz刷新率使游戏看起来也很流畅。但是,你必须忍受低对比度的视觉效果和可怕的续航时间。我们仍然建议您在不玩游戏时激活Nvidia Optimus,因为如果始终启用GPU,电池将很快耗尽。
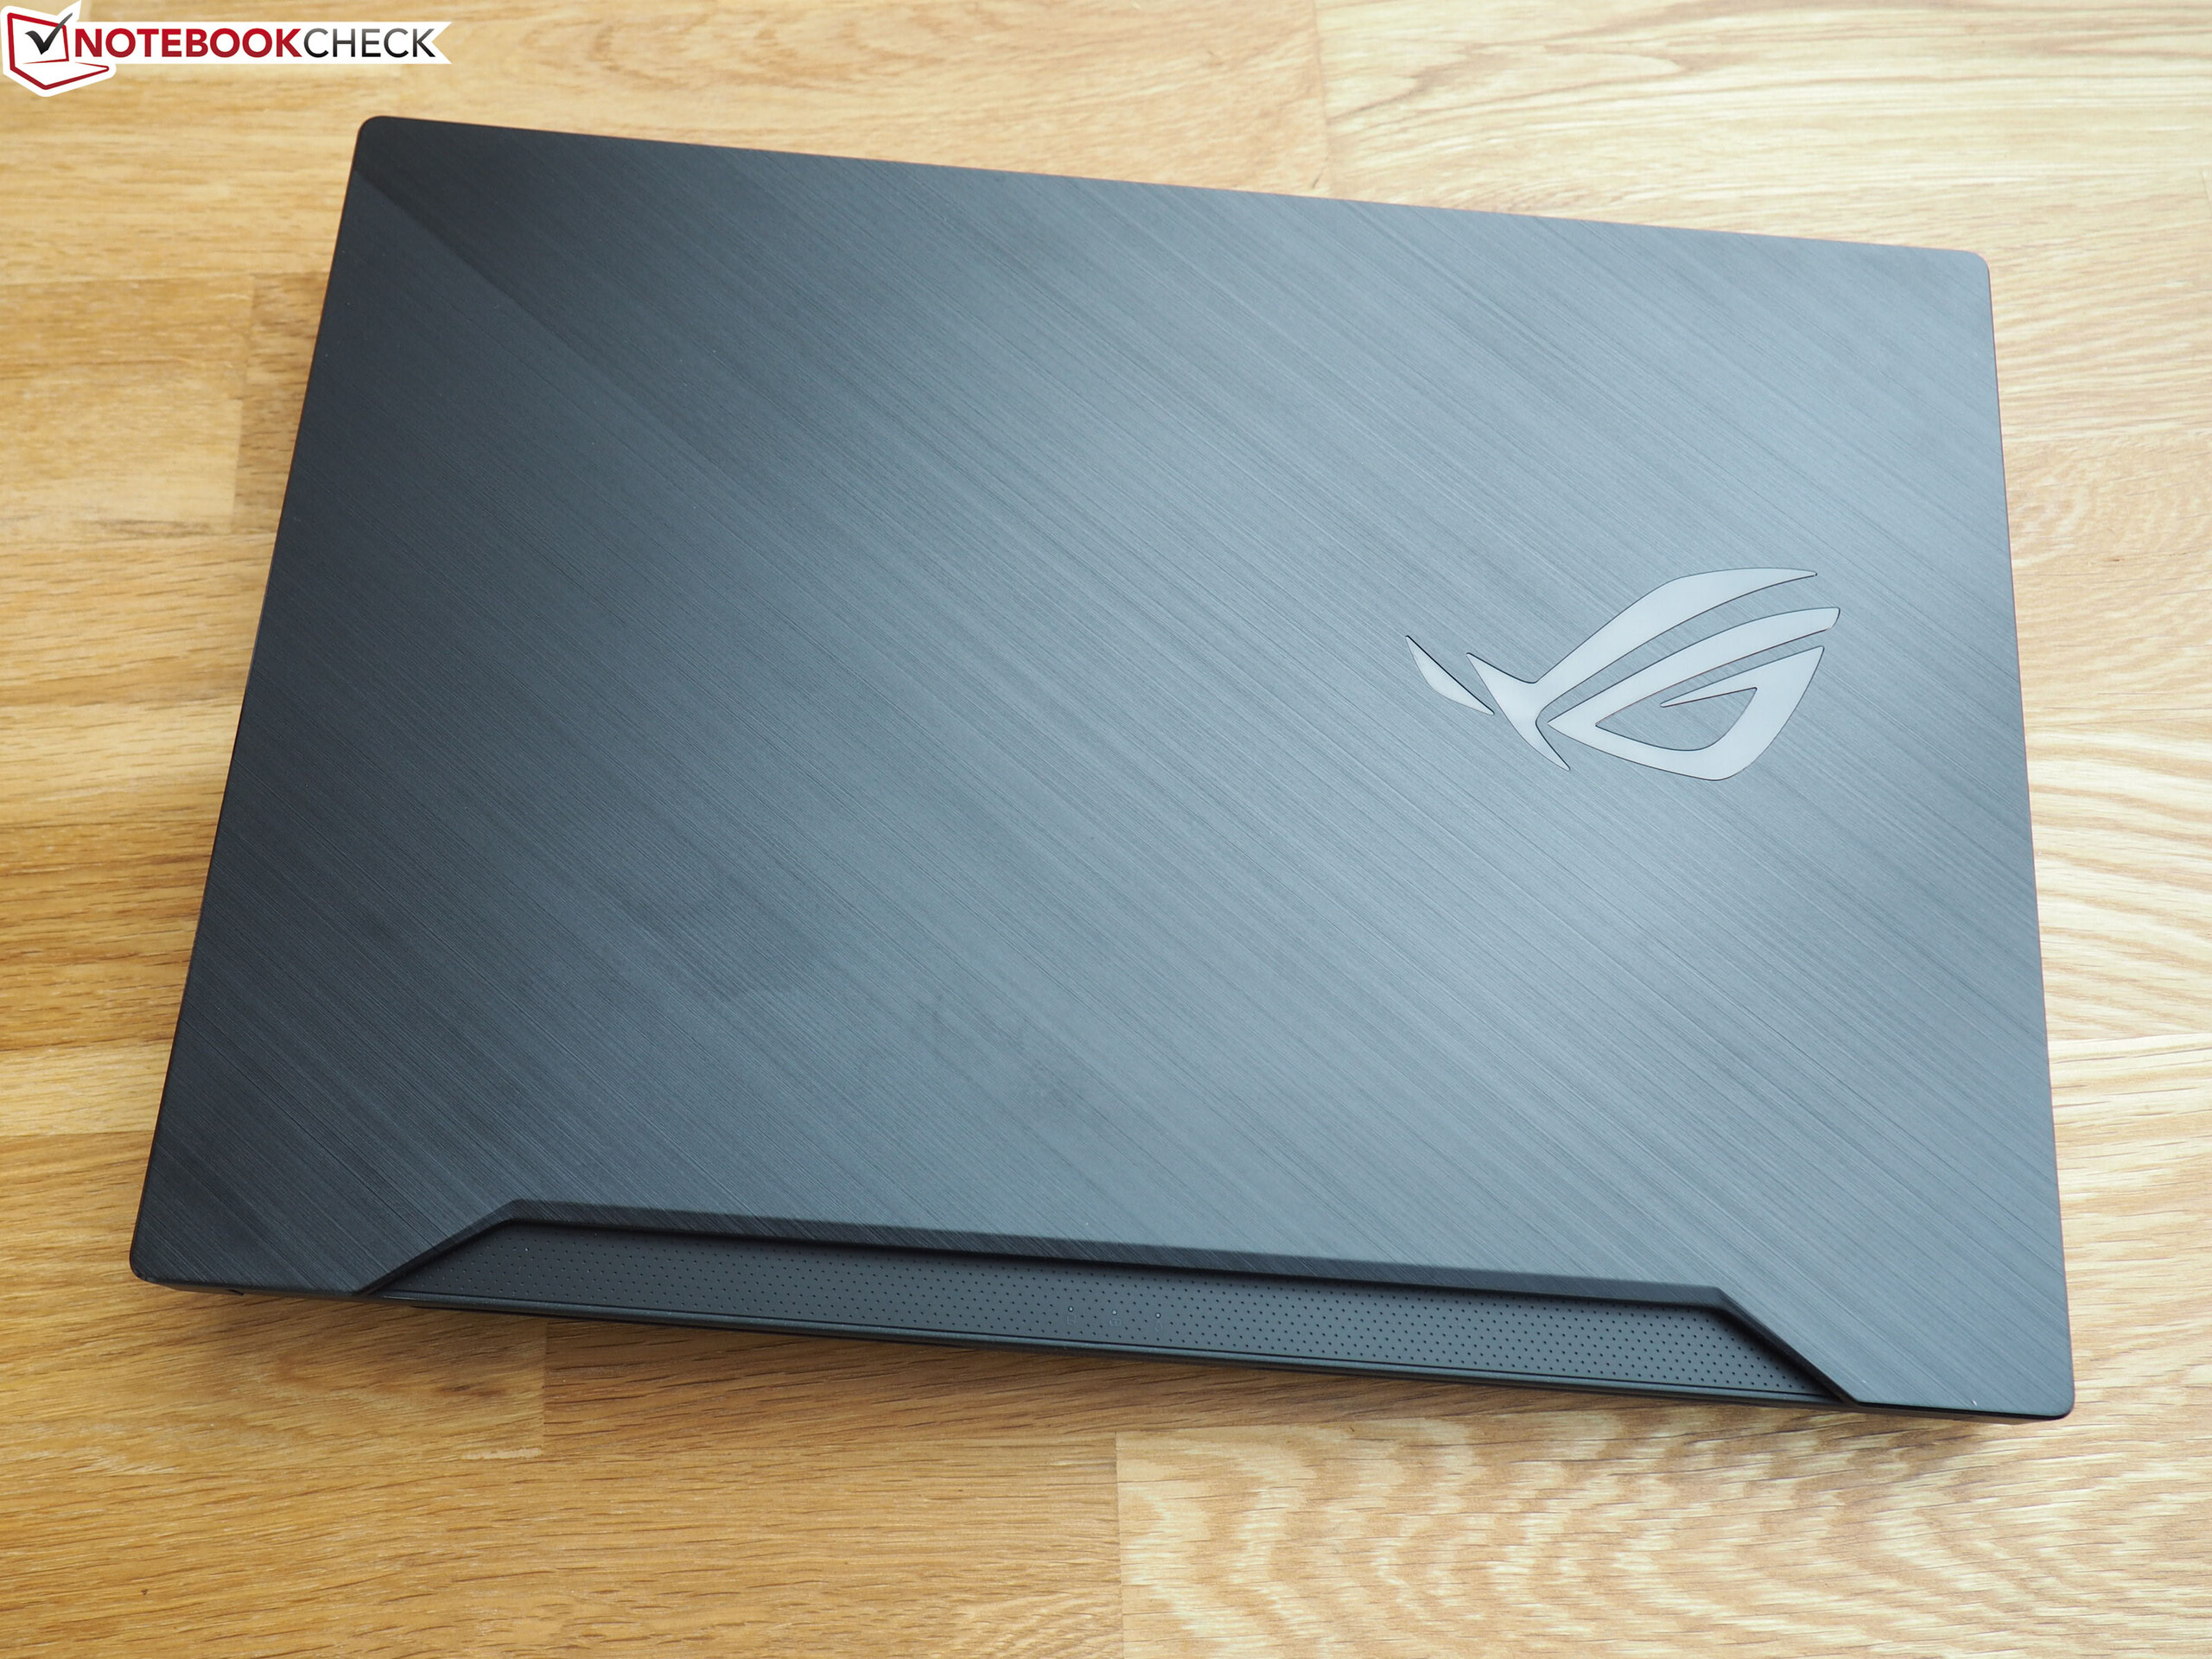
华硕ROG Zephyrus S GX502GW有很多功能。它时尚,紧凑,提供出色的游戏体验。然而,它运行起来很吵,缺少一些有用的接口,续航时间也很一般。
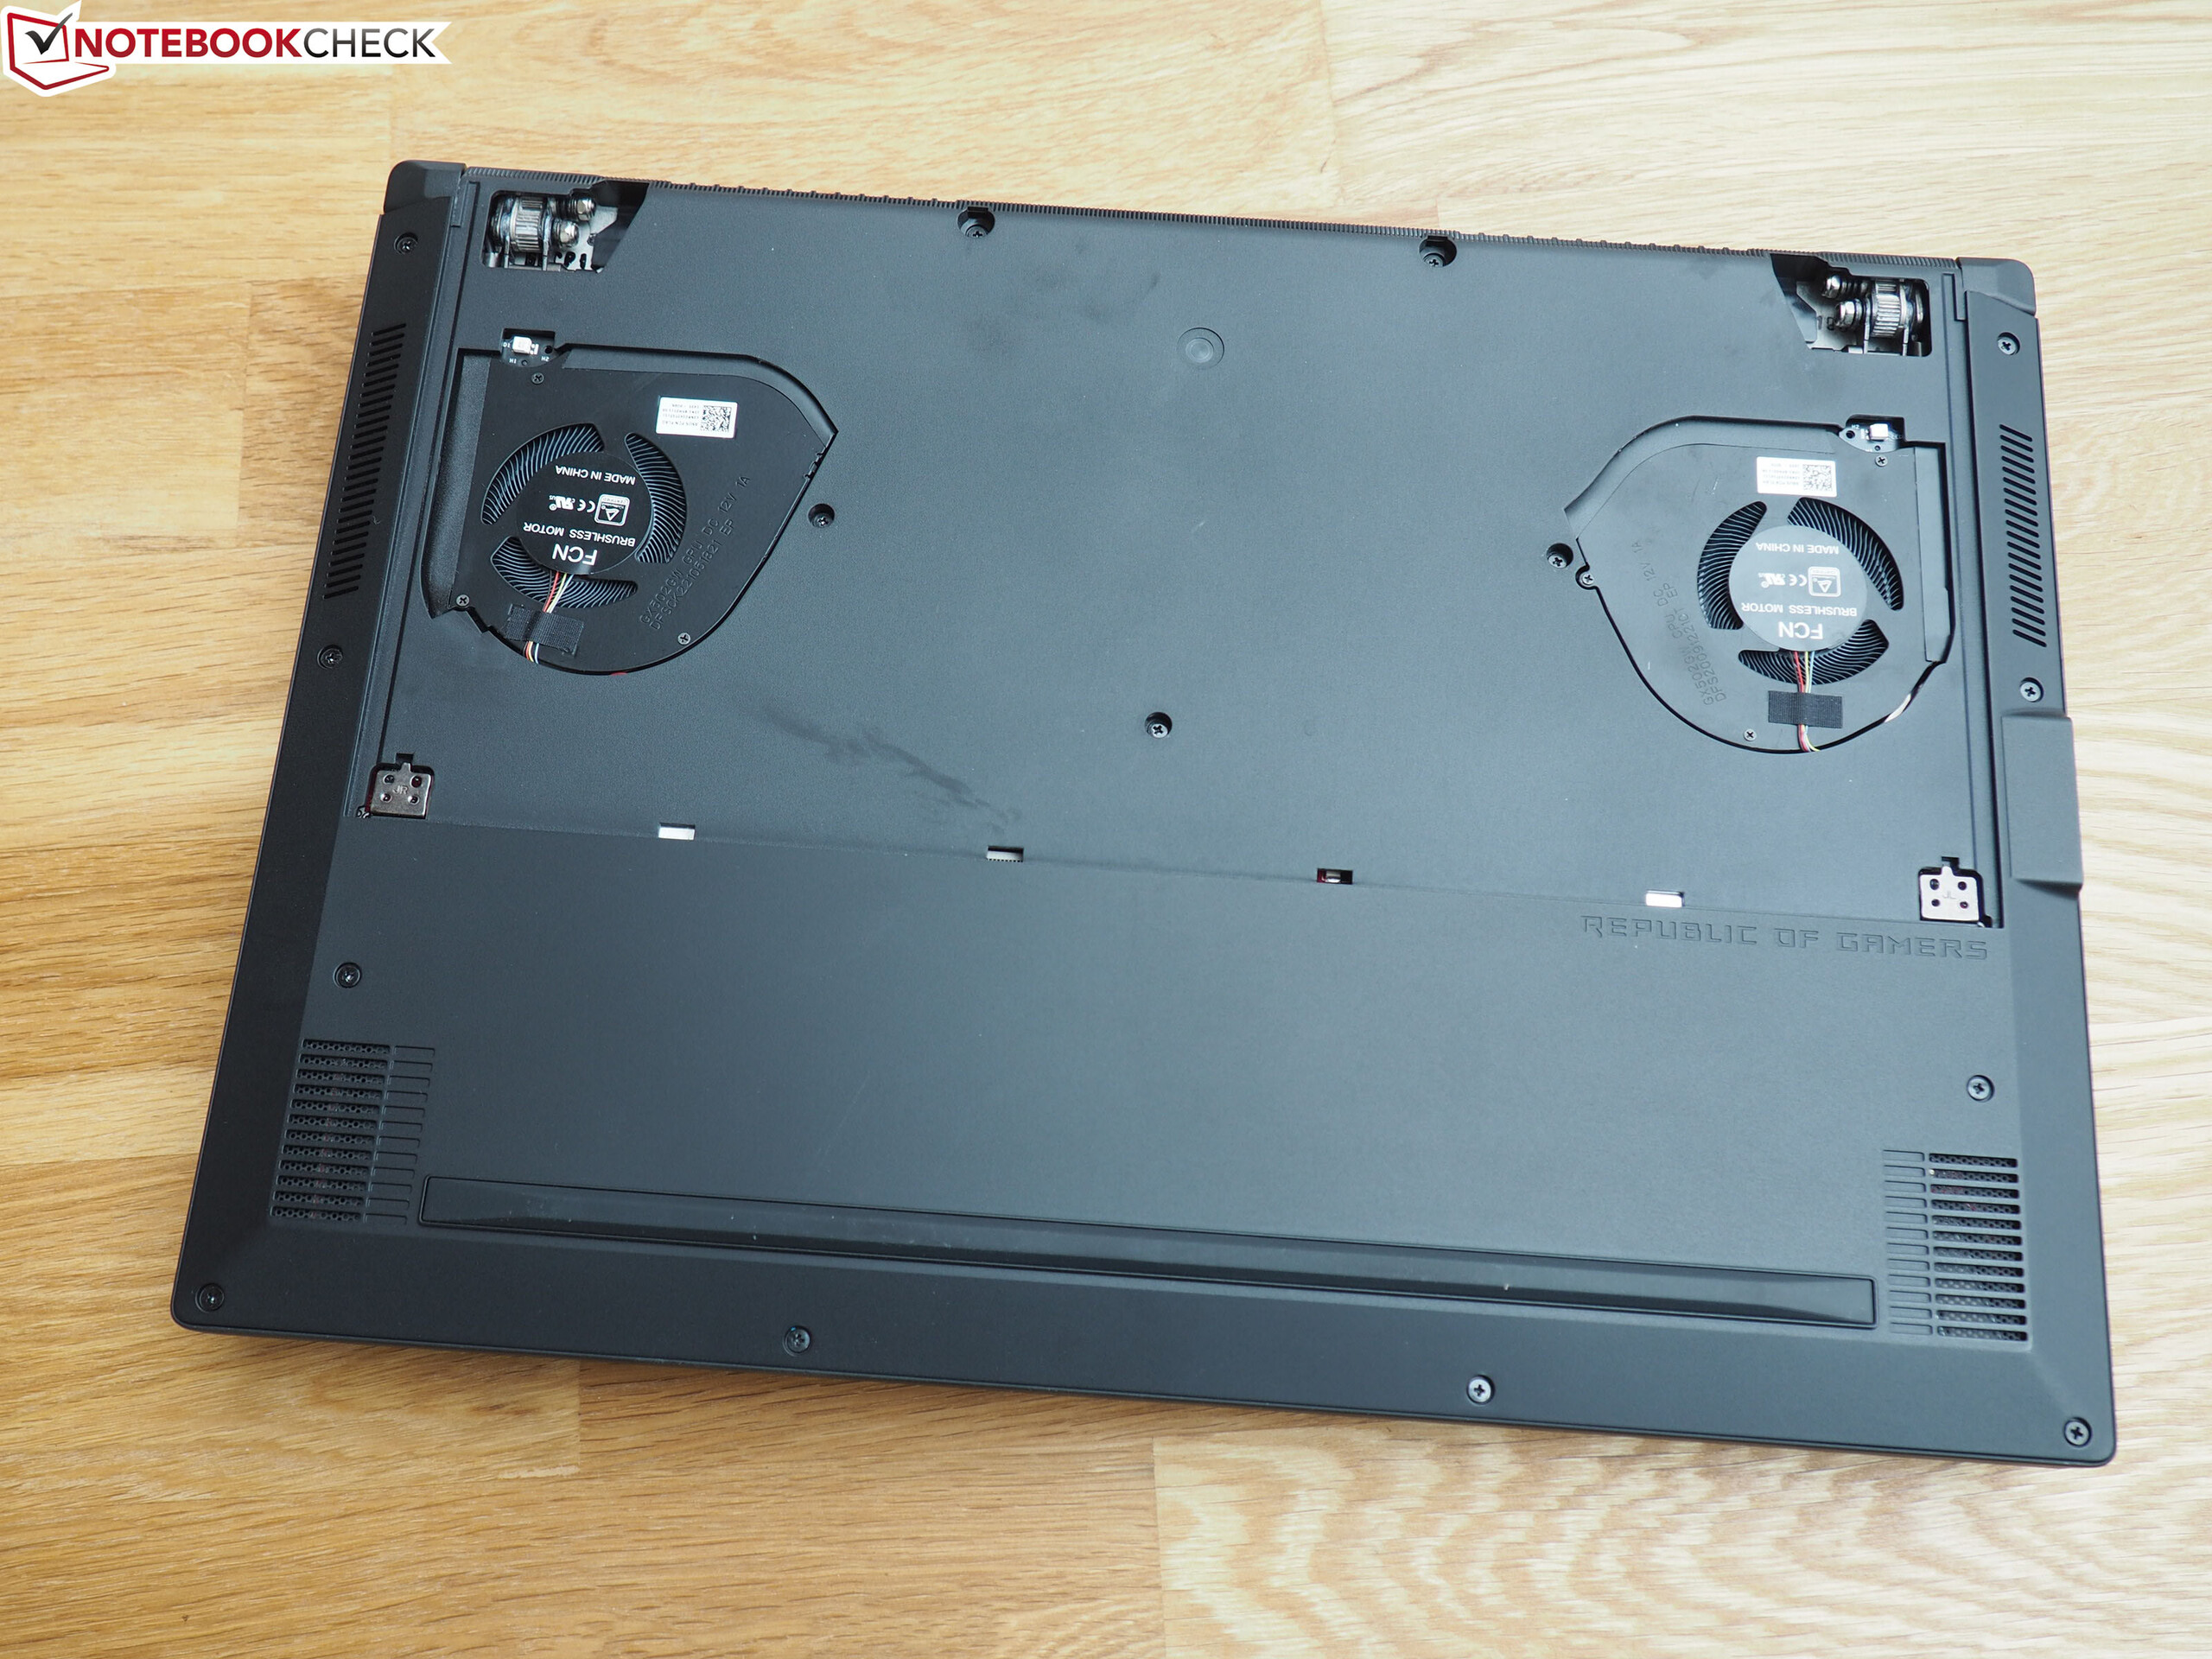
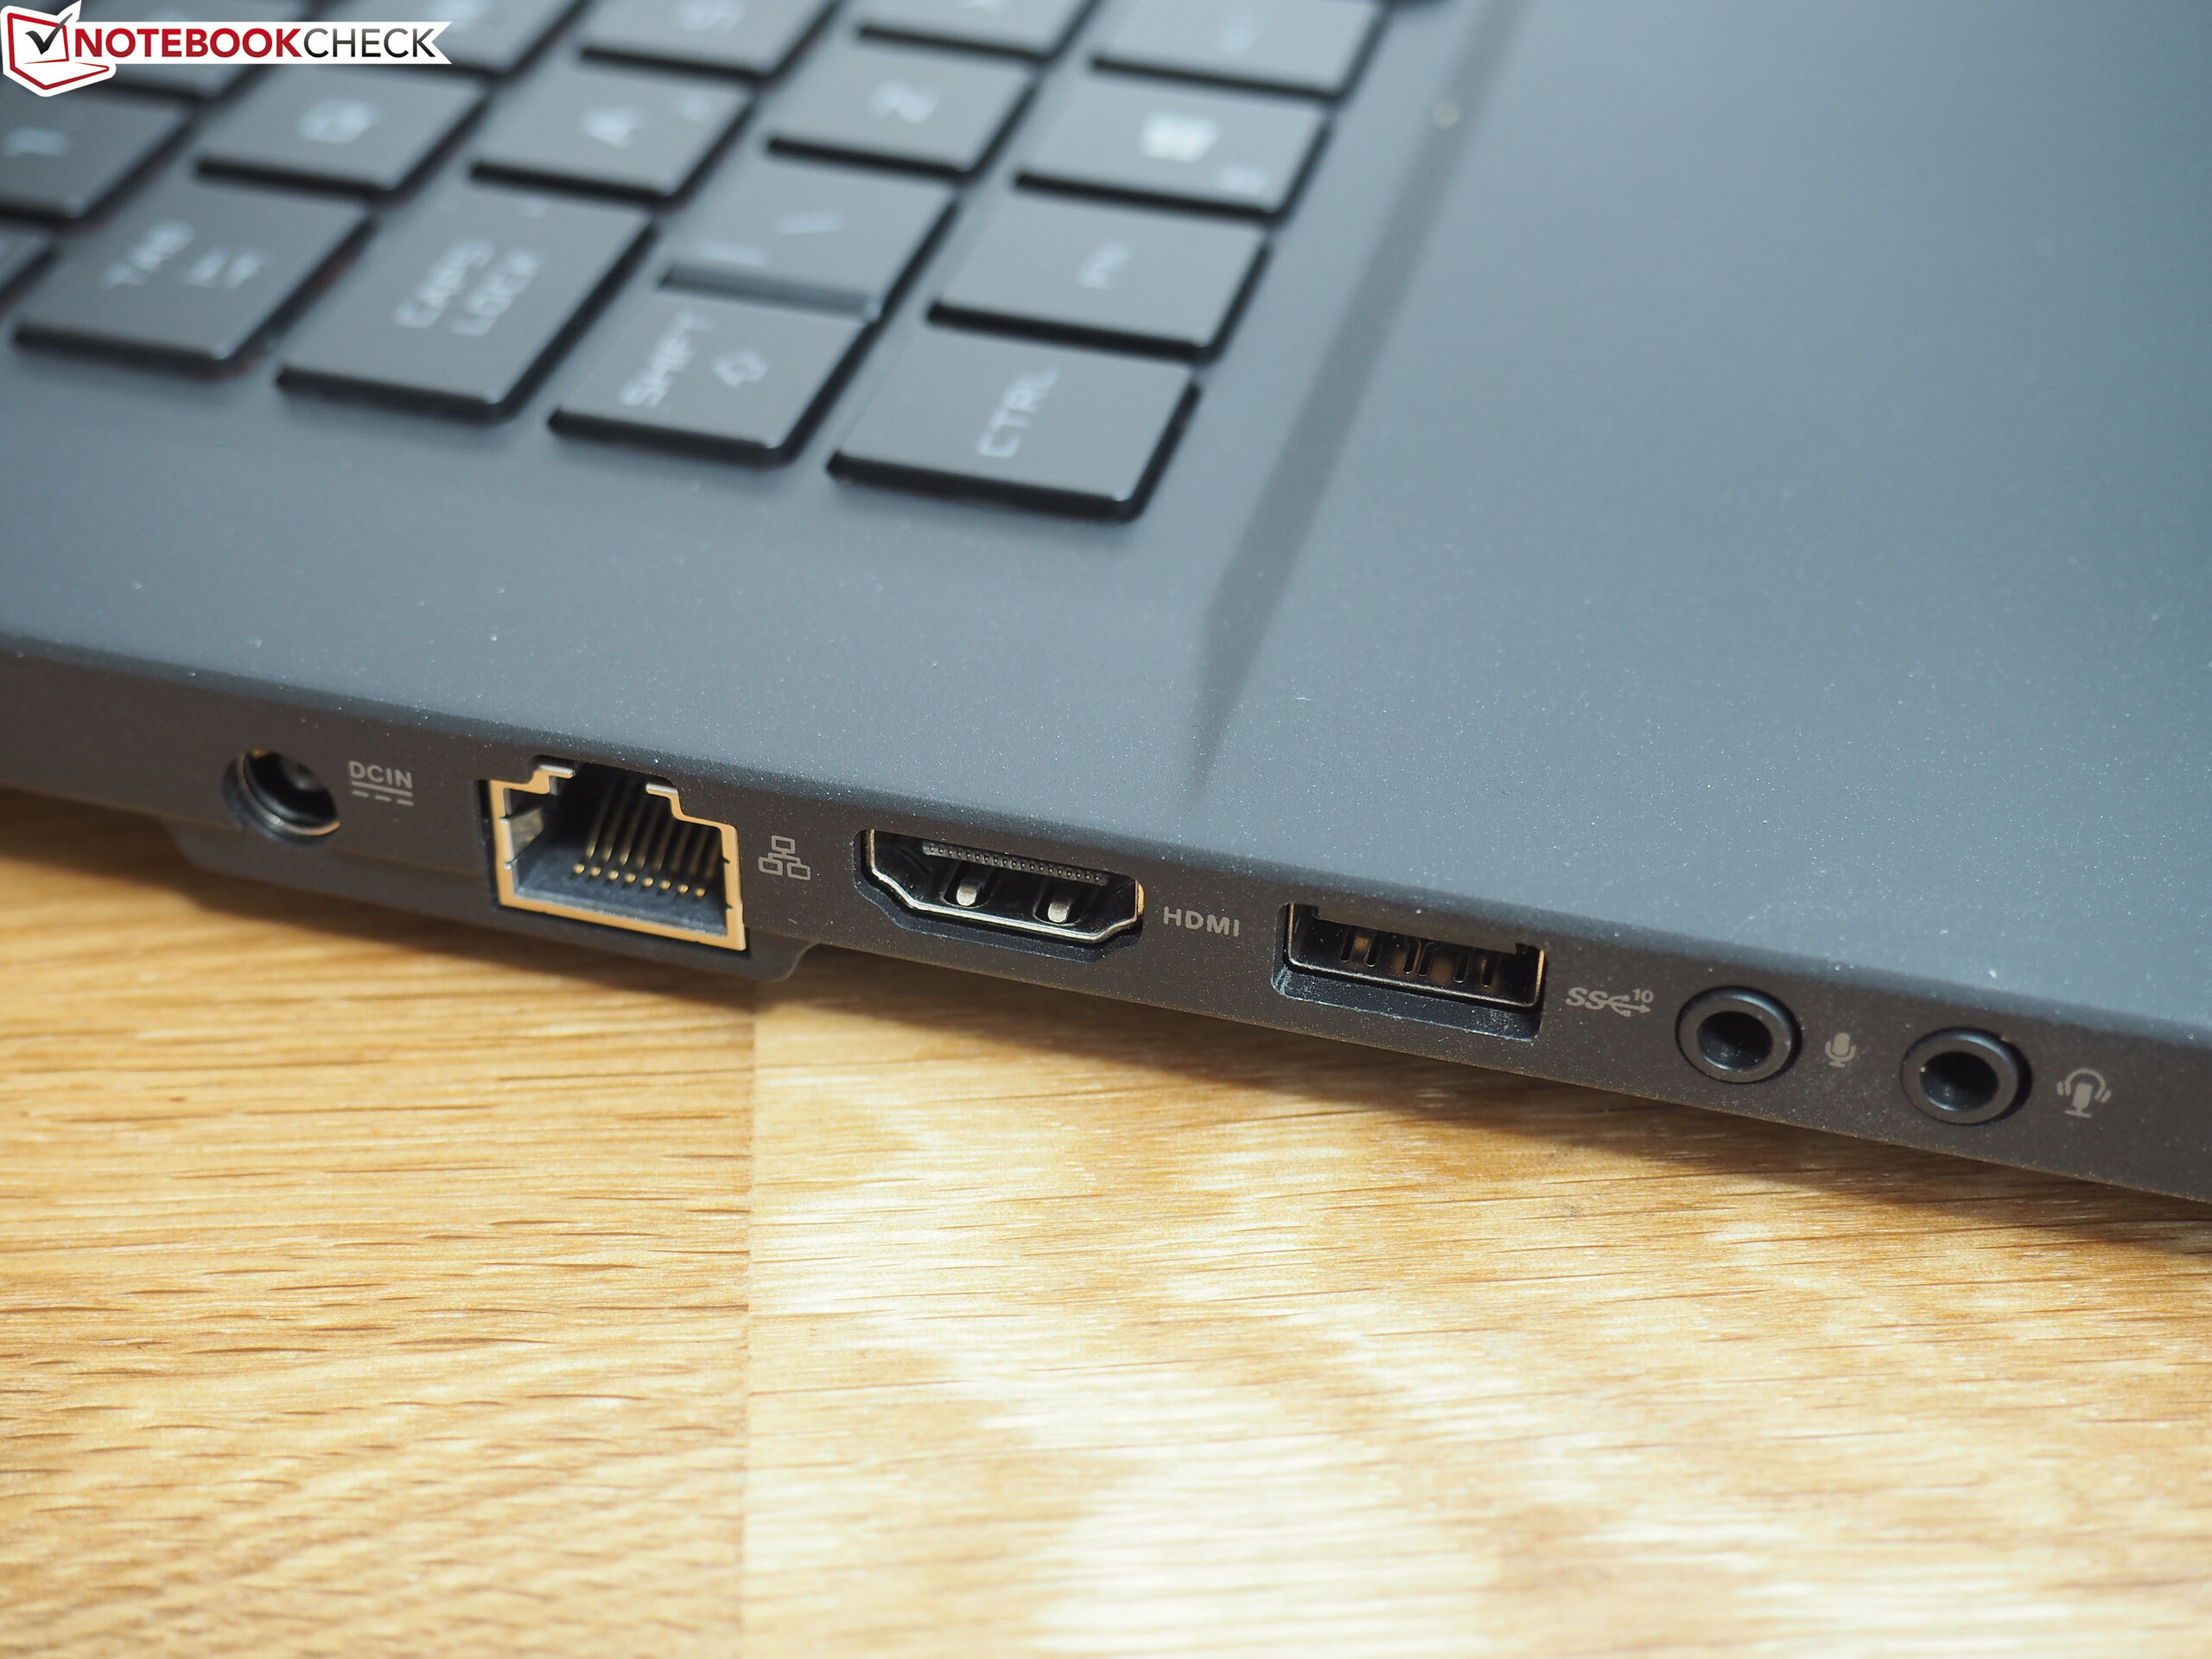
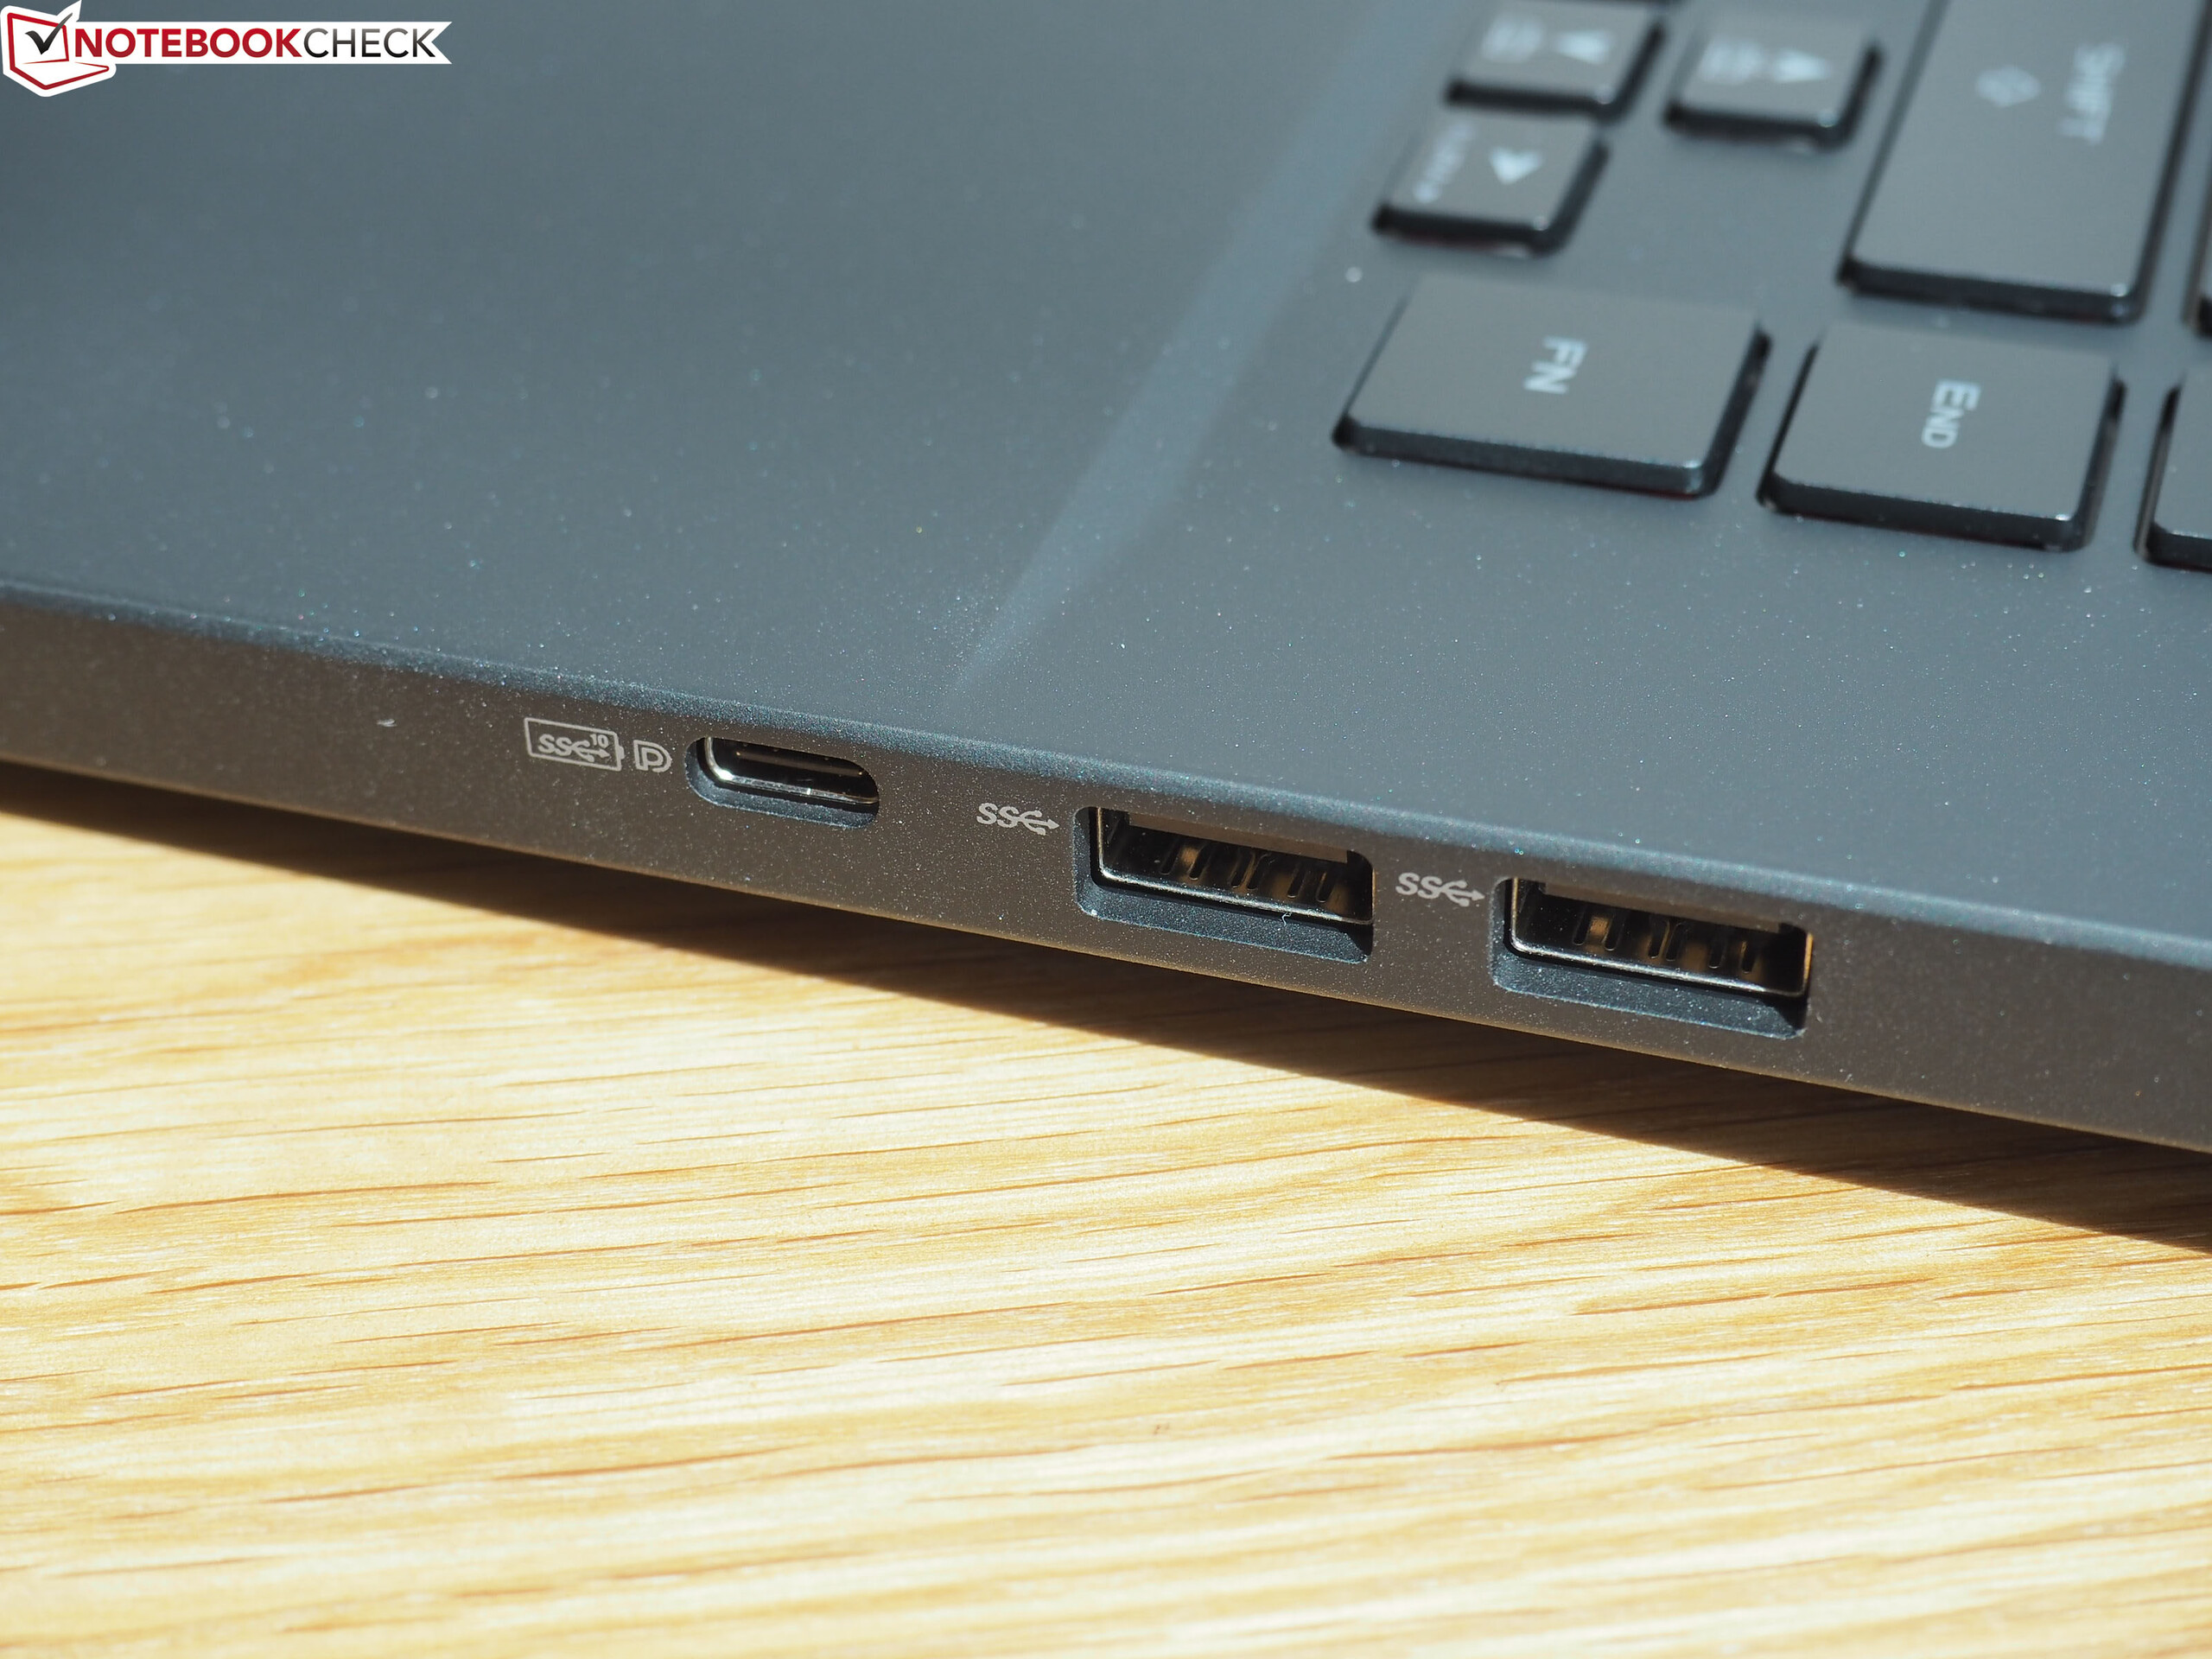
我们无法理解华硕所做出的一些决定。将一半的RAM焊接到主板似乎很傻,还没有配备读卡器,摄像头或雷电3端口。而且,GX502GW作为一台优质的轻薄游戏笔记本电脑,运行时声音太大而且太热。
简而言之,几乎没有理由考虑GX502系列,而是去选择Aero 15-X9或Razer Blade 15。可能你是为了那块非Max-Q GPU,但拥有满血RTX 20系列笔记本电脑也有其他牺牲。如果你正在寻找一台15.6英寸的游戏笔记本电脑,GX502GW仍然是一个不错的选择,但还是比不上技嘉和Razer的竞品。
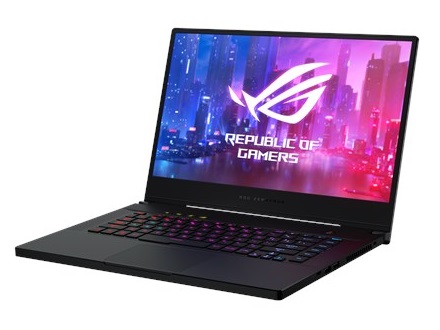
Asus Zephyrus S GX502GW
- 05/14/2020 v7 (old)
Florian Glaser
Price comparison