技嘉Aorus 15 (i7-8750H, RTX 2070) 笔记本电脑评测

| SD Card Reader | |
| average JPG Copy Test (av. of 3 runs) | |
| Gigabyte Aero 15-X9 (Toshiba Exceria Pro SDXC 64 GB UHS-II) | |
| Aorus X5 v8 (Toshiba Exceria Pro SDXC 64 GB UHS-II) | |
| Dell XPS 13 9380 2019 (Toshiba Exceria Pro SDXC 64 GB UHS-II) | |
| Aorus 15 X9 (Toshiba Exceria Pro M501 64 GB UHS-II) | |
| maximum AS SSD Seq Read Test (1GB) | |
| Gigabyte Aero 15-X9 (Toshiba Exceria Pro SDXC 64 GB UHS-II) | |
| Aorus X5 v8 (Toshiba Exceria Pro SDXC 64 GB UHS-II) | |
| Dell XPS 13 9380 2019 (Toshiba Exceria Pro SDXC 64 GB UHS-II) | |
| Aorus 15 X9 (Toshiba Exceria Pro M501 64 GB UHS-II) | |
| Networking | |
| iperf3 transmit AX12 | |
| Gigabyte Aero 15-X9 | |
| Razer Blade 15 RTX 2070 Max-Q | |
| Aorus 15 X9 | |
| Aorus X5 v8 | |
| iperf3 receive AX12 | |
| Razer Blade 15 RTX 2070 Max-Q | |
| Gigabyte Aero 15-X9 | |
| Aorus X5 v8 | |
| Aorus 15 X9 | |
| |||||||||||||||||||||||||
Brightness Distribution: 78 %
Center on Battery: 305.1 cd/m²
Contrast: 925:1 (Black: 0.33 cd/m²)
ΔE ColorChecker Calman: 2.58 | ∀{0.5-29.43 Ø4.72}
calibrated: 1.33
ΔE Greyscale Calman: 3.4 | ∀{0.09-98 Ø4.97}
95.2% sRGB (Argyll 1.6.3 3D)
60.7% AdobeRGB 1998 (Argyll 1.6.3 3D)
66.3% AdobeRGB 1998 (Argyll 3D)
95.6% sRGB (Argyll 3D)
64.9% Display P3 (Argyll 3D)
Gamma: 2.28
CCT: 6374 K
| Aorus 15 X9 LG Philips LP156WFG-SPB2, IPS, 15.6", 1920x1080 | Razer Blade 15 RTX 2070 Max-Q LG Philips LGD05C0, IPS, 15.6", 1920x1080 | Aorus X5 v8 AU Optronics B156HAN07.0 (AUO70ED), IPS, 15.6", 1920x1080 | Gigabyte Aero 15-X9 LGD05C0, IPS, 15.6", 1920x1080 | MSI GS65 Stealth Thin 8RE-051US AUO80ED, IPS, 15.6", 1920x1080 | Alienware m15 GTX 1070 Max-Q AU Optronics B156HAN, IPS, 15.6", 1920x1080 | |
|---|---|---|---|---|---|---|
| Display | 0% | 1% | -3% | -1% | -4% | |
| Display P3 Coverage (%) | 64.9 | 65.3 1% | 67.1 3% | 63.5 -2% | 65.8 1% | 63.5 -2% |
| sRGB Coverage (%) | 95.6 | 94.9 -1% | 93.4 -2% | 93.1 -3% | 92.1 -4% | 89.4 -6% |
| AdobeRGB 1998 Coverage (%) | 66.3 | 66.3 0% | 68.1 3% | 64.5 -3% | 67 1% | 64.5 -3% |
| Response Times | -3% | -11% | -9% | -15% | -8% | |
| Response Time Grey 50% / Grey 80% * (ms) | 15.2 ? | 16.8 ? -11% | 18.8 ? -24% | 16.4 ? -8% | 20 ? -32% | 18 ? -18% |
| Response Time Black / White * (ms) | 12.4 ? | 11.6 ? 6% | 12 ? 3% | 13.6 ? -10% | 12 ? 3% | 12 ? 3% |
| PWM Frequency (Hz) | ||||||
| Screen | -4% | 14% | 12% | -17% | -24% | |
| Brightness middle (cd/m²) | 305.1 | 314.7 3% | 271 -11% | 250 -18% | 250.9 -18% | 353.6 16% |
| Brightness (cd/m²) | 295 | 312 6% | 259 -12% | 235 -20% | 257 -13% | 346 17% |
| Brightness Distribution (%) | 78 | 90 15% | 87 12% | 85 9% | 83 6% | 86 10% |
| Black Level * (cd/m²) | 0.33 | 0.38 -15% | 0.27 18% | 0.29 12% | 0.32 3% | 0.3 9% |
| Contrast (:1) | 925 | 828 -10% | 1004 9% | 862 -7% | 784 -15% | 1179 27% |
| Colorchecker dE 2000 * | 2.58 | 2.56 1% | 1.81 30% | 1.46 43% | 2.77 -7% | 4.55 -76% |
| Colorchecker dE 2000 max. * | 4.32 | 4.89 -13% | 3.33 23% | 2.47 43% | 5.89 -36% | 7.91 -83% |
| Colorchecker dE 2000 calibrated * | 1.33 | 1.71 -29% | 2.5 -88% | 3.37 -153% | ||
| Greyscale dE 2000 * | 3.4 | 3.4 -0% | 1.09 68% | 1.27 63% | 4 -18% | 4.1 -21% |
| Gamma | 2.28 96% | 2.3 96% | 2.45 90% | 2.4 92% | 2.27 97% | 2.27 97% |
| CCT | 6374 102% | 6435 101% | 6435 101% | 6749 96% | 6901 94% | 7434 87% |
| Color Space (Percent of AdobeRGB 1998) (%) | 60.7 | 60.7 0% | 61 0% | 60 -1% | 60 -1% | 57.9 -5% |
| Color Space (Percent of sRGB) (%) | 95.2 | 94.6 -1% | 93 -2% | 93 -2% | 92 -3% | 88.9 -7% |
| Total Average (Program / Settings) | -2% /
-3% | 1% /
8% | 0% /
6% | -11% /
-14% | -12% /
-18% |
* ... smaller is better
Display Response Times
| ↔ Response Time Black to White | ||
|---|---|---|
| 12.4 ms ... rise ↗ and fall ↘ combined | ↗ 7.6 ms rise | 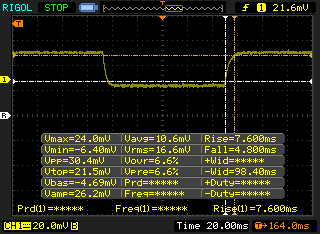 |
| ↘ 4.8 ms fall | ||
| The screen shows good response rates in our tests, but may be too slow for competitive gamers. In comparison, all tested devices range from 0.1 (minimum) to 240 (maximum) ms. » 33 % of all devices are better. This means that the measured response time is better than the average of all tested devices (19.8 ms). | ||
| ↔ Response Time 50% Grey to 80% Grey | ||
| 15.2 ms ... rise ↗ and fall ↘ combined | ↗ 8.4 ms rise | 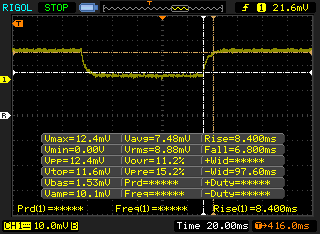 |
| ↘ 6.8 ms fall | ||
| The screen shows good response rates in our tests, but may be too slow for competitive gamers. In comparison, all tested devices range from 0.165 (minimum) to 636 (maximum) ms. » 29 % of all devices are better. This means that the measured response time is better than the average of all tested devices (31 ms). | ||
Screen Flickering / PWM (Pulse-Width Modulation)
| Screen flickering / PWM not detected | 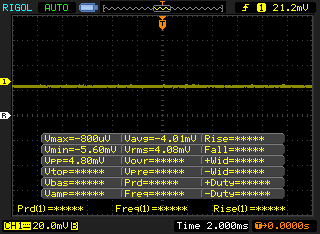 | ||
In comparison: 52 % of all tested devices do not use PWM to dim the display. If PWM was detected, an average of 7763 (minimum: 5 - maximum: 343500) Hz was measured. | |||
| Cinebench R15 | |
| CPU Single 64Bit | |
| Schenker XMG Ultra 15 Turing | |
| Gigabyte Aero 15-Y9 | |
| Aorus X5 v8 | |
| Huawei MateBook 13 i7 | |
| Alienware m15 GTX 1070 Max-Q | |
| Average Intel Core i7-8750H (163 - 177, n=86) | |
| Aorus 15 X9 | |
| MSI GV62 8RE-016US | |
| Asus Strix GL703VM-DB74 | |
| Xiaomi Mi Gaming Laptop 7300HQ 1060 | |
| CPU Multi 64Bit | |
| Schenker XMG Ultra 15 Turing | |
| Aorus X5 v8 | |
| Gigabyte Aero 15-Y9 | |
| Alienware m15 GTX 1070 Max-Q | |
| Average Intel Core i7-8750H (863 - 1251, n=93) | |
| Aorus 15 X9 | |
| MSI GV62 8RE-016US | |
| Asus Strix GL703VM-DB74 | |
| Huawei MateBook 13 i7 | |
| Xiaomi Mi Gaming Laptop 7300HQ 1060 | |
| Cinebench R10 | |
| Rendering Multiple CPUs 32Bit | |
| Schenker XMG Ultra 15 Turing | |
| Gigabyte Aero 15-Y9 | |
| Aorus X5 v8 | |
| Average Intel Core i7-8750H (29664 - 35307, n=25) | |
| MSI GV62 8RE-016US | |
| Asus Strix GL703VM-DB74 | |
| Rendering Single 32Bit | |
| Schenker XMG Ultra 15 Turing | |
| Gigabyte Aero 15-Y9 | |
| Aorus X5 v8 | |
| Average Intel Core i7-8750H (6236 - 6645, n=25) | |
| MSI GV62 8RE-016US | |
| Asus Strix GL703VM-DB74 | |
| wPrime 2.10 - 1024m | |
| Asus Strix GL703VM-DB74 | |
| MSI GV62 8RE-016US | |
| Average Intel Core i7-8750H (125.5 - 180.5, n=6) | |
* ... smaller is better
| PCMark 8 Home Score Accelerated v2 | 4843 points | |
| PCMark 8 Work Score Accelerated v2 | 5828 points | |
| PCMark 10 Score | 5870 points | |
Help | ||
| Aorus 15 X9 Intel SSD 760p SSDPEKKW512G8 | Razer Blade 15 RTX 2070 Max-Q Samsung SSD PM981 MZVLB512HAJQ | Aorus X5 v8 Toshiba NVMe THNSN5512GPU7 | Gigabyte Aero 15-X9 Intel SSD 760p SSDPEKKW010T8 | MSI GS65 Stealth Thin 8RE-051US Samsung SSD PM981 MZVLB256HAHQ | Alienware m15 GTX 1070 Max-Q Toshiba XG5 KXG50ZNV512G | |
|---|---|---|---|---|---|---|
| AS SSD | 38% | -34% | -6% | -23% | -27% | |
| Seq Read (MB/s) | 1912 | 1840 -4% | 1813 -5% | 2113 11% | 1612 -16% | 1967 3% |
| Seq Write (MB/s) | 1553 | 1822 17% | 966 -38% | 1471 -5% | 1475 -5% | 1135 -27% |
| 4K Read (MB/s) | 56.5 | 52.3 -7% | 23.21 -59% | 55 -3% | 43.09 -24% | 29.17 -48% |
| 4K Write (MB/s) | 119.6 | 110.7 -7% | 84.5 -29% | 107.1 -10% | 83.8 -30% | 93.4 -22% |
| 4K-64 Read (MB/s) | 869 | 1126 30% | 856 -1% | 914 5% | 611 -30% | 995 14% |
| 4K-64 Write (MB/s) | 584 | 1717 194% | 773 32% | 703 20% | 570 -2% | 656 12% |
| Access Time Read * (ms) | 0.049 | 0.047 4% | 0.166 -239% | 0.114 -133% | 0.071 -45% | 0.116 -137% |
| Access Time Write * (ms) | 0.031 | 0.033 -6% | 0.044 -42% | 0.034 -10% | 0.045 -45% | 0.063 -103% |
| Score Read (Points) | 1116 | 1362 22% | 1061 -5% | 1180 6% | 815 -27% | 1221 9% |
| Score Write (Points) | 859 | 2010 134% | 954 11% | 957 11% | 802 -7% | 862 0% |
| Score Total (Points) | 2544 | 4079 60% | 2515 -1% | 2722 7% | 2039 -20% | 2667 5% |
| Copy ISO MB/s (MB/s) | 1329 | 1975 49% | 1864 40% | 642 -52% | ||
| Copy Program MB/s (MB/s) | 404.3 | 526 30% | 362.6 -10% | 431.5 7% | ||
| Copy Game MB/s (MB/s) | 1071 | 1200 12% | 936 -13% | 706 -34% |
* ... smaller is better

| 3DMark | |
| 1920x1080 Fire Strike Graphics | |
| Alienware Area-51m i9-9900K RTX 2080 | |
| Asus ROG Strix RTX 2070 OC | |
| Asus Zephyrus S GX701GX | |
| Aorus X7 DT v8 | |
| Aorus 15 X9 | |
| Average NVIDIA GeForce RTX 2070 Mobile (18169 - 21138, n=19) | |
| Razer Blade 15 RTX 2070 Max-Q | |
| Aorus X5 v8 | |
| Alienware m15 GTX 1070 Max-Q | |
| MSI GL73 8SE-010US | |
| Aorus x3 Plus v7 | |
| 2560x1440 Time Spy Graphics | |
| Alienware Area-51m i9-9900K RTX 2080 | |
| Asus ROG Strix RTX 2070 OC | |
| Asus Zephyrus S GX701GX | |
| Aorus 15 X9 | |
| Average NVIDIA GeForce RTX 2070 Mobile (7006 - 8028, n=18) | |
| Razer Blade 15 RTX 2070 Max-Q | |
| MSI GL73 8SE-010US | |
| 2560x1440 Port Royal Graphics | |
| Alienware Area-51m i9-9900K RTX 2080 | |
| Asus Zephyrus S GX701GX | |
| Average NVIDIA GeForce RTX 2070 Mobile (3958 - 4627, n=13) | |
| Aorus 15 X9 | |
| Razer Blade 15 RTX 2070 Max-Q | |
| MSI GL73 8SE-010US | |
| 3840x2160 Fire Strike Ultra Graphics | |
| Alienware Area-51m i9-9900K RTX 2080 | |
| Asus ROG Strix RTX 2070 OC | |
| Average NVIDIA GeForce RTX 2070 Mobile (4391 - 4853, n=13) | |
| Aorus 15 X9 | |
| Razer Blade 15 RTX 2070 Max-Q | |
| MSI GL73 8SE-010US | |
| 3DMark 11 | |
| 1280x720 Performance GPU | |
| Alienware Area-51m i9-9900K RTX 2080 | |
| Asus ROG Strix RTX 2070 OC | |
| Asus Zephyrus S GX701GX | |
| Aorus 15 X9 | |
| Aorus X7 DT v8 | |
| Average NVIDIA GeForce RTX 2070 Mobile (23335 - 27298, n=21) | |
| Razer Blade 15 RTX 2070 Max-Q | |
| Aorus X5 v8 | |
| Alienware m15 GTX 1070 Max-Q | |
| MSI GL73 8SE-010US | |
| 1280x720 Performance Combined | |
| Alienware Area-51m i9-9900K RTX 2080 | |
| Asus ROG Strix RTX 2070 OC | |
| Average NVIDIA GeForce RTX 2070 Mobile (8716 - 16364, n=21) | |
| Aorus X5 v8 | |
| Aorus X7 DT v8 | |
| Asus Zephyrus S GX701GX | |
| Alienware m15 GTX 1070 Max-Q | |
| Razer Blade 15 RTX 2070 Max-Q | |
| MSI GL73 8SE-010US | |
| Aorus 15 X9 | |
| 3DMark 11 Performance | 19143 points | |
| 3DMark Cloud Gate Standard Score | 31987 points | |
| 3DMark Fire Strike Score | 16211 points | |
| 3DMark Time Spy Score | 7490 points | |
Help | ||
| The Witcher 3 - 1920x1080 Ultra Graphics & Postprocessing (HBAO+) | |
| Alienware Area-51m i9-9900K RTX 2080 | |
| Asus ROG Strix RTX 2070 OC | |
| Asus Zephyrus S GX701GX | |
| Average NVIDIA GeForce RTX 2070 Mobile (64 - 82.1, n=21) | |
| Aorus 15 X9 | |
| Razer Blade 15 RTX 2070 Max-Q | |
| Gigabyte Aero 15-Y9 | |
| MSI GL73 8SE-010US | |
| MSI GS65 Stealth Thin 8RE-051US | |
| Huawei MateBook 13 i7 | |
| low | med. | high | ultra | |
|---|---|---|---|---|
| BioShock Infinite (2013) | 304.5 | 249.3 | 229.8 | 154.3 |
| The Witcher 3 (2015) | 236.1 | 197 | 131.3 | 71.8 |
| Rise of the Tomb Raider (2016) | 211.8 | 145.3 | 132.8 | 115.2 |
| Aorus 15 X9 GeForce RTX 2070 Mobile, i7-8750H, Intel SSD 760p SSDPEKKW512G8 | Razer Blade 15 RTX 2070 Max-Q GeForce RTX 2070 Max-Q, i7-8750H, Samsung SSD PM981 MZVLB512HAJQ | Aorus X5 v8 GeForce GTX 1070 Mobile, i7-8850H, Toshiba NVMe THNSN5512GPU7 | Gigabyte Aero 15-X9 GeForce RTX 2070 Max-Q, i7-8750H, Intel SSD 760p SSDPEKKW010T8 | MSI GS65 Stealth Thin 8RE-051US GeForce GTX 1060 Mobile, i7-8750H, Samsung SSD PM981 MZVLB256HAHQ | Alienware m15 GTX 1070 Max-Q GeForce GTX 1070 Max-Q, i7-8750H, Toshiba XG5 KXG50ZNV512G | |
|---|---|---|---|---|---|---|
| Noise | 13% | -5% | 2% | 9% | 8% | |
| off / environment * (dB) | 28.2 | 28.8 -2% | 30 -6% | 30 -6% | 28.4 -1% | 28.6 -1% |
| Idle Minimum * (dB) | 32.6 | 28.8 12% | 33 -1% | 32 2% | 28.4 13% | 28.6 12% |
| Idle Average * (dB) | 32.7 | 28.8 12% | 35 -7% | 34 -4% | 28.4 13% | 28.6 13% |
| Idle Maximum * (dB) | 32.7 | 29.4 10% | 40 -22% | 36 -10% | 29.6 9% | 28.6 13% |
| Load Average * (dB) | 38.9 | 35.7 8% | 45 -16% | 42 -8% | 43.5 -12% | 40.8 -5% |
| Witcher 3 ultra * (dB) | 51.8 | 42.5 18% | 50 3% | 44 15% | 45.7 12% | 49.6 4% |
| Load Maximum * (dB) | 64.1 | 45 30% | 55 14% | 48 25% | 45.7 29% | 49.6 23% |
* ... smaller is better
Noise level
| Idle |
| 32.6 / 32.7 / 32.7 dB(A) |
| Load |
| 38.9 / 64.1 dB(A) |
 | ||
30 dB silent 40 dB(A) audible 50 dB(A) loud |
||
min: | ||
(+) The maximum temperature on the upper side is 36.6 °C / 98 F, compared to the average of 40.4 °C / 105 F, ranging from 21.2 to 68.8 °C for the class Gaming.
(-) The bottom heats up to a maximum of 56.8 °C / 134 F, compared to the average of 43.2 °C / 110 F
(+) In idle usage, the average temperature for the upper side is 26.6 °C / 80 F, compared to the device average of 33.9 °C / 93 F.
(±) Playing The Witcher 3, the average temperature for the upper side is 32.5 °C / 91 F, compared to the device average of 33.9 °C / 93 F.
(+) The palmrests and touchpad are cooler than skin temperature with a maximum of 29.4 °C / 84.9 F and are therefore cool to the touch.
(±) The average temperature of the palmrest area of similar devices was 28.8 °C / 83.8 F (-0.6 °C / -1.1 F).
Aorus 15 X9 audio analysis
(-) | not very loud speakers (69.3 dB)
Bass 100 - 315 Hz
(-) | nearly no bass - on average 19% lower than median
(-) | bass is not linear (15.9% delta to prev. frequency)
Mids 400 - 2000 Hz
(+) | balanced mids - only 2.4% away from median
(+) | mids are linear (6.6% delta to prev. frequency)
Highs 2 - 16 kHz
(+) | balanced highs - only 3.3% away from median
(±) | linearity of highs is average (8.7% delta to prev. frequency)
Overall 100 - 16.000 Hz
(±) | linearity of overall sound is average (22.6% difference to median)
Compared to same class
» 81% of all tested devices in this class were better, 5% similar, 14% worse
» The best had a delta of 6%, average was 18%, worst was 132%
Compared to all devices tested
» 67% of all tested devices were better, 6% similar, 28% worse
» The best had a delta of 4%, average was 23%, worst was 134%
Apple MacBook 12 (Early 2016) 1.1 GHz audio analysis
(+) | speakers can play relatively loud (83.6 dB)
Bass 100 - 315 Hz
(±) | reduced bass - on average 11.3% lower than median
(±) | linearity of bass is average (14.2% delta to prev. frequency)
Mids 400 - 2000 Hz
(+) | balanced mids - only 2.4% away from median
(+) | mids are linear (5.5% delta to prev. frequency)
Highs 2 - 16 kHz
(+) | balanced highs - only 2% away from median
(+) | highs are linear (4.5% delta to prev. frequency)
Overall 100 - 16.000 Hz
(+) | overall sound is linear (10.2% difference to median)
Compared to same class
» 7% of all tested devices in this class were better, 2% similar, 91% worse
» The best had a delta of 5%, average was 18%, worst was 53%
Compared to all devices tested
» 5% of all tested devices were better, 1% similar, 94% worse
» The best had a delta of 4%, average was 23%, worst was 134%
| Off / Standby | |
| Idle | |
| Load |
|
Key:
min: | |
| Aorus 15 X9 i7-8750H, GeForce RTX 2070 Mobile, Intel SSD 760p SSDPEKKW512G8, IPS, 1920x1080, 15.6" | Razer Blade 15 RTX 2070 Max-Q i7-8750H, GeForce RTX 2070 Max-Q, Samsung SSD PM981 MZVLB512HAJQ, IPS, 1920x1080, 15.6" | Aorus X5 v8 i7-8850H, GeForce GTX 1070 Mobile, Toshiba NVMe THNSN5512GPU7, IPS, 1920x1080, 15.6" | Gigabyte Aero 15-X9 i7-8750H, GeForce RTX 2070 Max-Q, Intel SSD 760p SSDPEKKW010T8, IPS, 1920x1080, 15.6" | MSI GS65 Stealth Thin 8RE-051US i7-8750H, GeForce GTX 1060 Mobile, Samsung SSD PM981 MZVLB256HAHQ, IPS, 1920x1080, 15.6" | Alienware m15 GTX 1070 Max-Q i7-8750H, GeForce GTX 1070 Max-Q, Toshiba XG5 KXG50ZNV512G, IPS, 1920x1080, 15.6" | |
|---|---|---|---|---|---|---|
| Power Consumption | 34% | -2% | 30% | 38% | 37% | |
| Idle Minimum * (Watt) | 26 | 10.4 60% | 25 4% | 16 38% | 8.7 67% | 7.6 71% |
| Idle Average * (Watt) | 30.8 | 14.6 53% | 31 -1% | 18 42% | 13 58% | 13.8 55% |
| Idle Maximum * (Watt) | 34.9 | 16.3 53% | 33 5% | 23 34% | 14.3 59% | 14.6 58% |
| Load Average * (Watt) | 90.7 | 88.5 2% | 102 -12% | 88 3% | 107.4 -18% | 97.6 -8% |
| Witcher 3 ultra * (Watt) | 175 | 155.4 11% | 194 -11% | 120 31% | 129 26% | 145.8 17% |
| Load Maximum * (Watt) | 241.2 | 182.4 24% | 239 1% | 167 31% | 151.5 37% | 172.5 28% |
* ... smaller is better
| Aorus 15 X9 i7-8750H, GeForce RTX 2070 Mobile, 62 Wh | Aorus X5 v7 i7-7820HK, GeForce GTX 1070 Mobile, 94 Wh | Razer Blade 15 RTX 2070 Max-Q i7-8750H, GeForce RTX 2070 Max-Q, 80 Wh | Gigabyte Aero 15-X9 i7-8750H, GeForce RTX 2070 Max-Q, 94.24 Wh | MSI GS65 Stealth Thin 8RE-051US i7-8750H, GeForce GTX 1060 Mobile, 82 Wh | Alienware m15 GTX 1070 Max-Q i7-8750H, GeForce GTX 1070 Max-Q, 90 Wh | |
|---|---|---|---|---|---|---|
| Battery runtime | 63% | 296% | 300% | 154% | 311% | |
| Reader / Idle (h) | 1.8 | 3.5 94% | 11.4 533% | 9.2 411% | 10.5 483% | |
| WiFi v1.3 (h) | 1.6 | 2.5 56% | 6.5 306% | 6.4 300% | 6.2 288% | 7.7 381% |
| Load (h) | 1 | 1.4 40% | 1.5 50% | 2.9 190% | 1.2 20% | 1.7 70% |
Pros
Cons

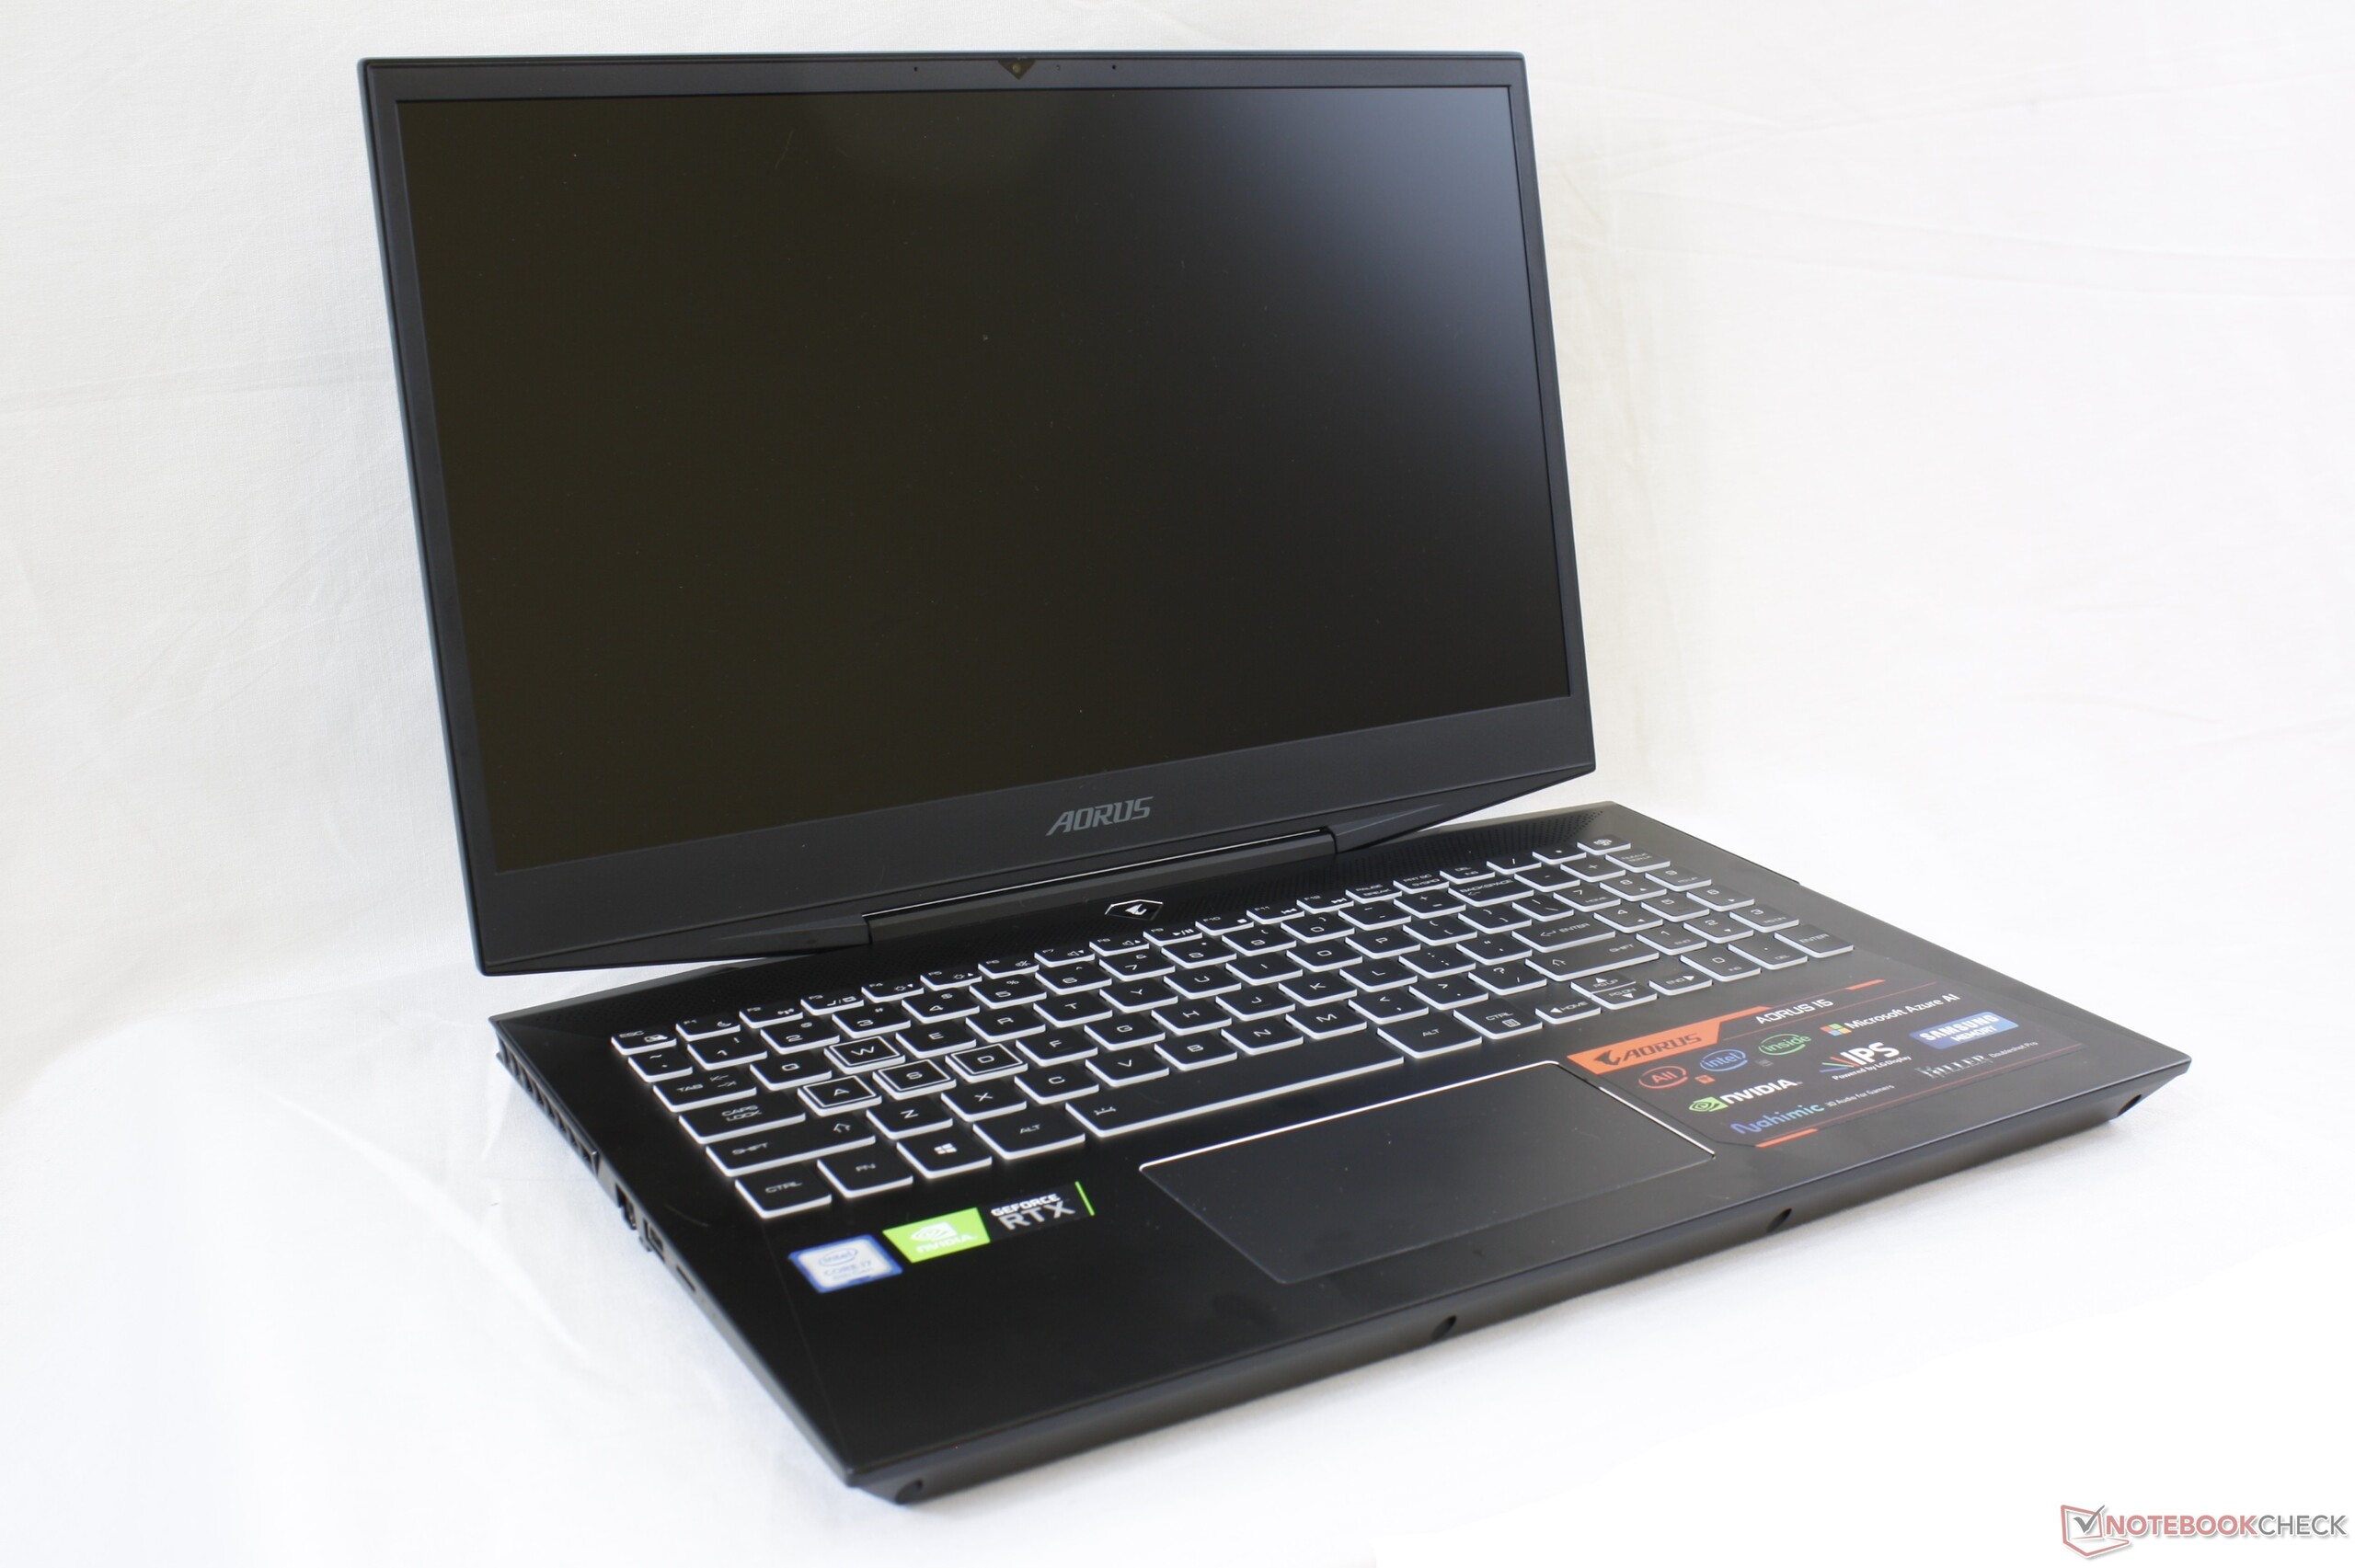
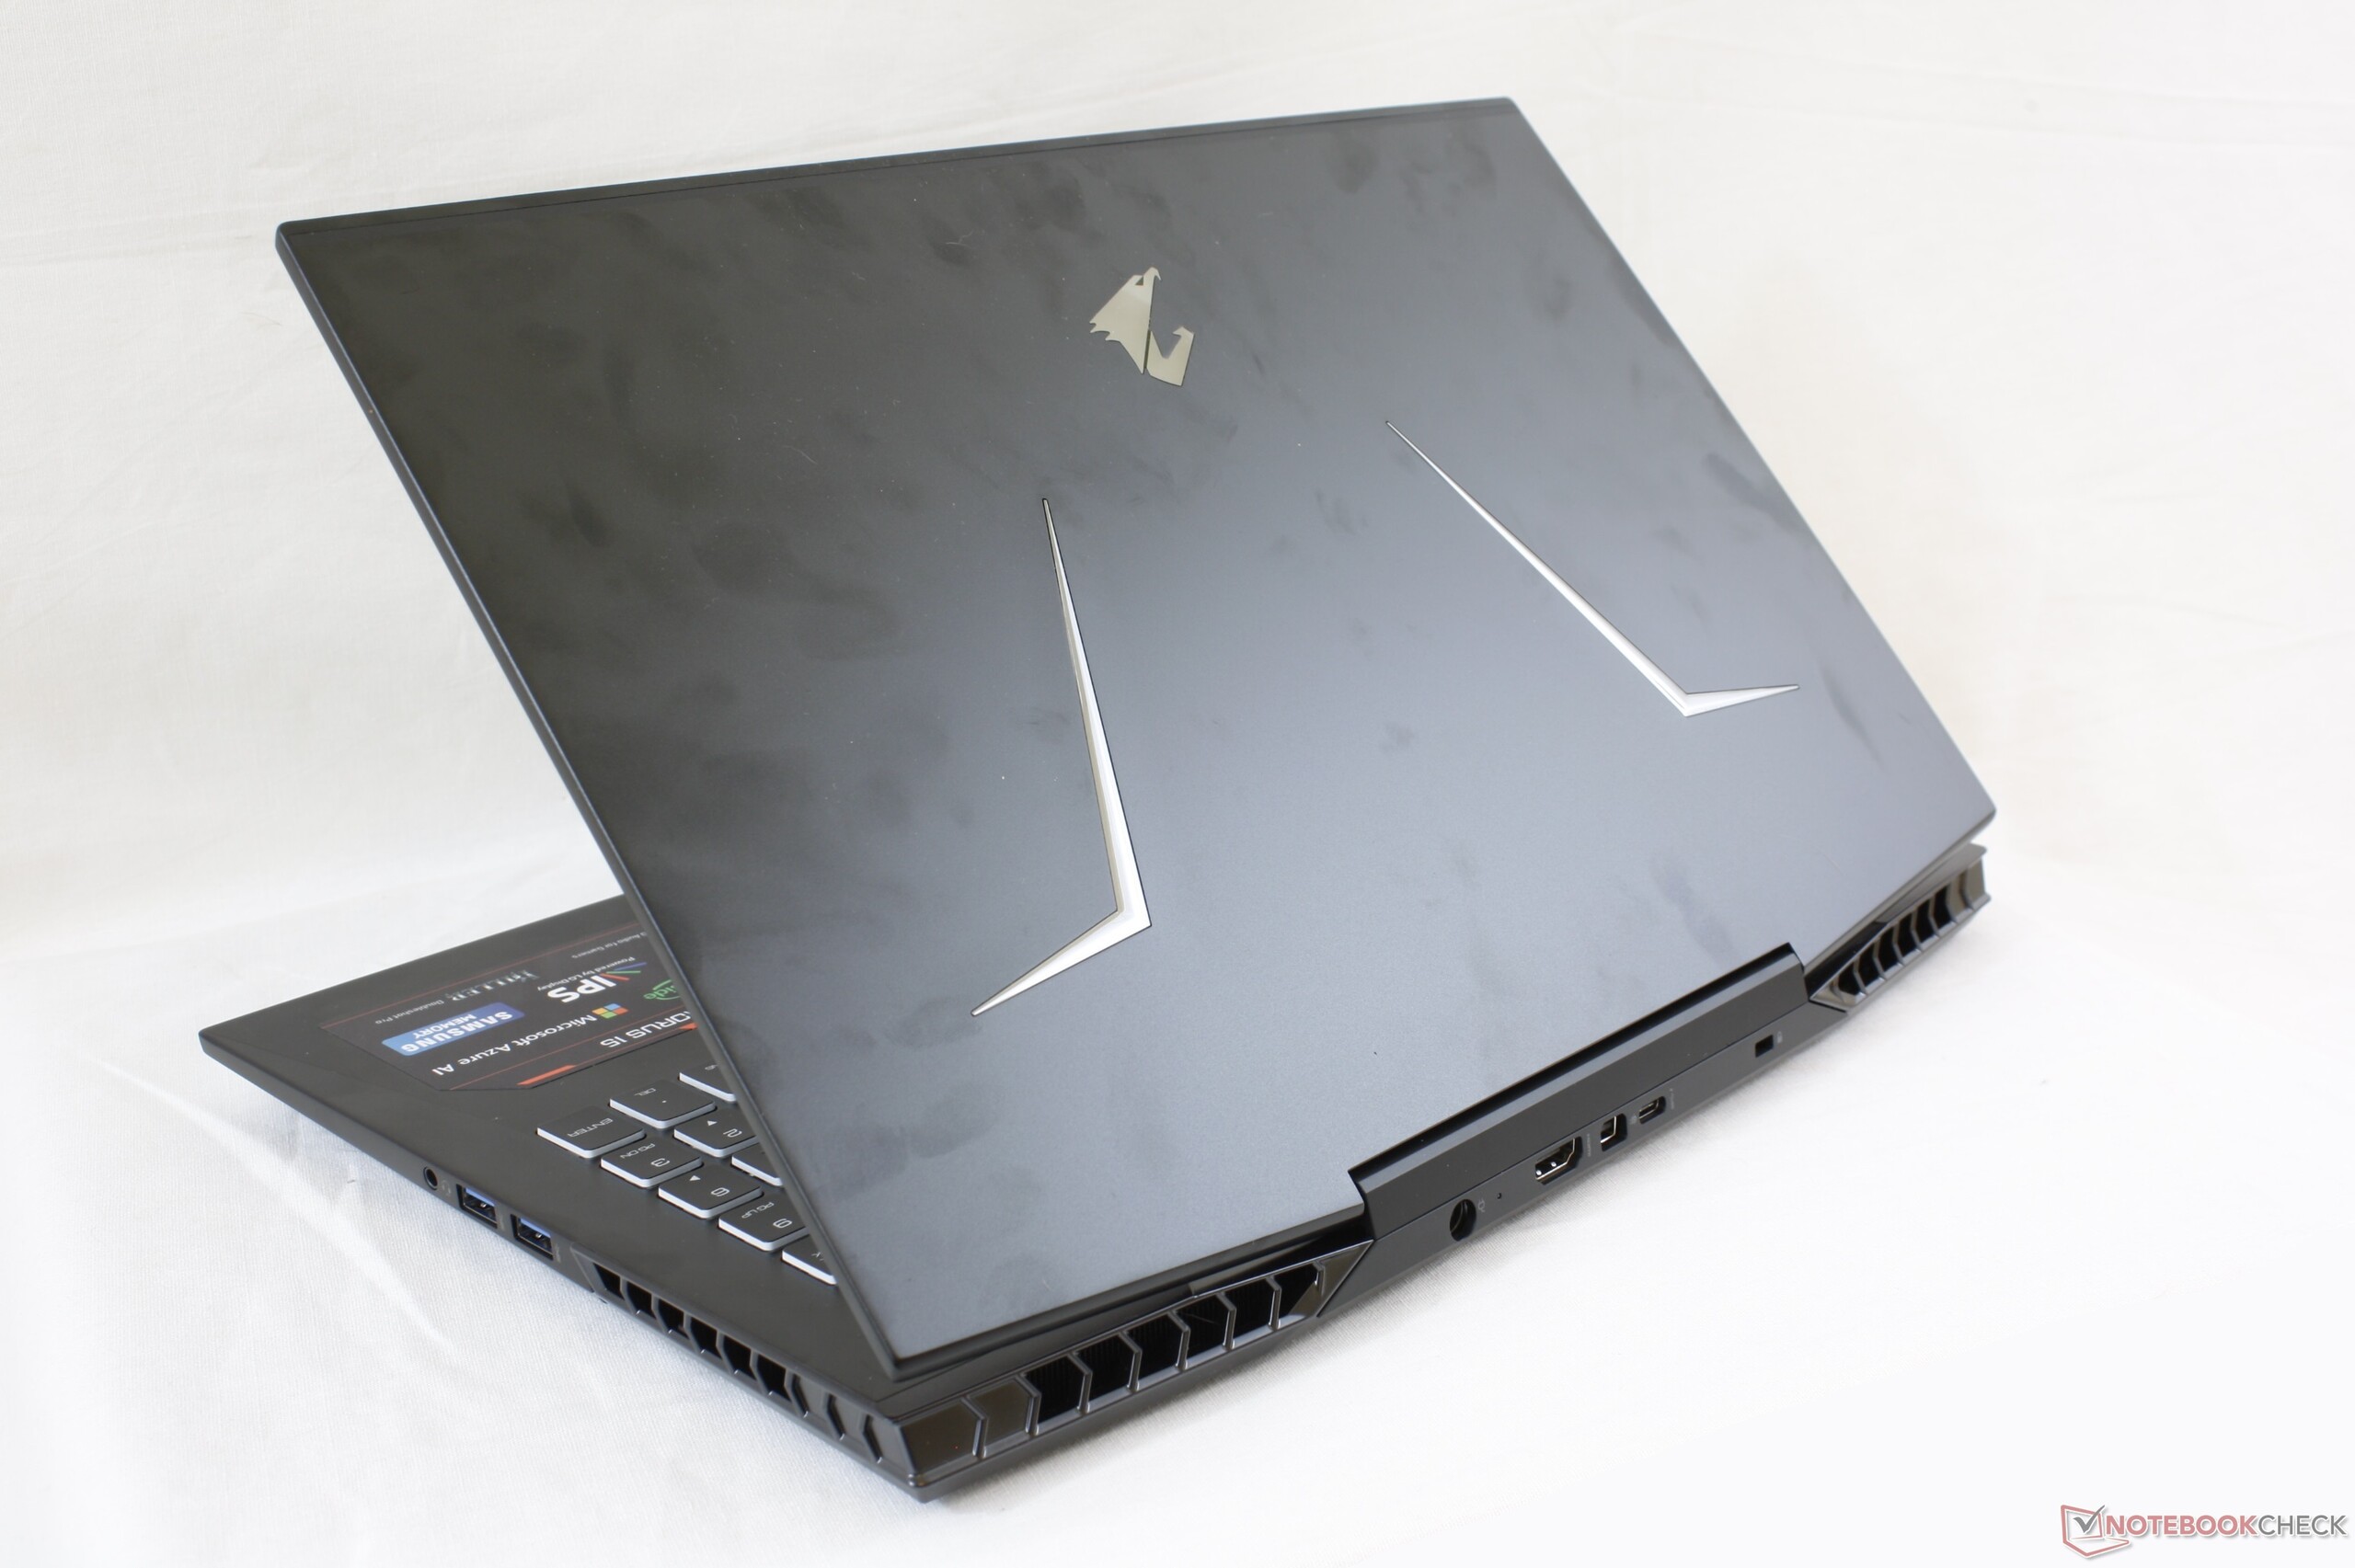
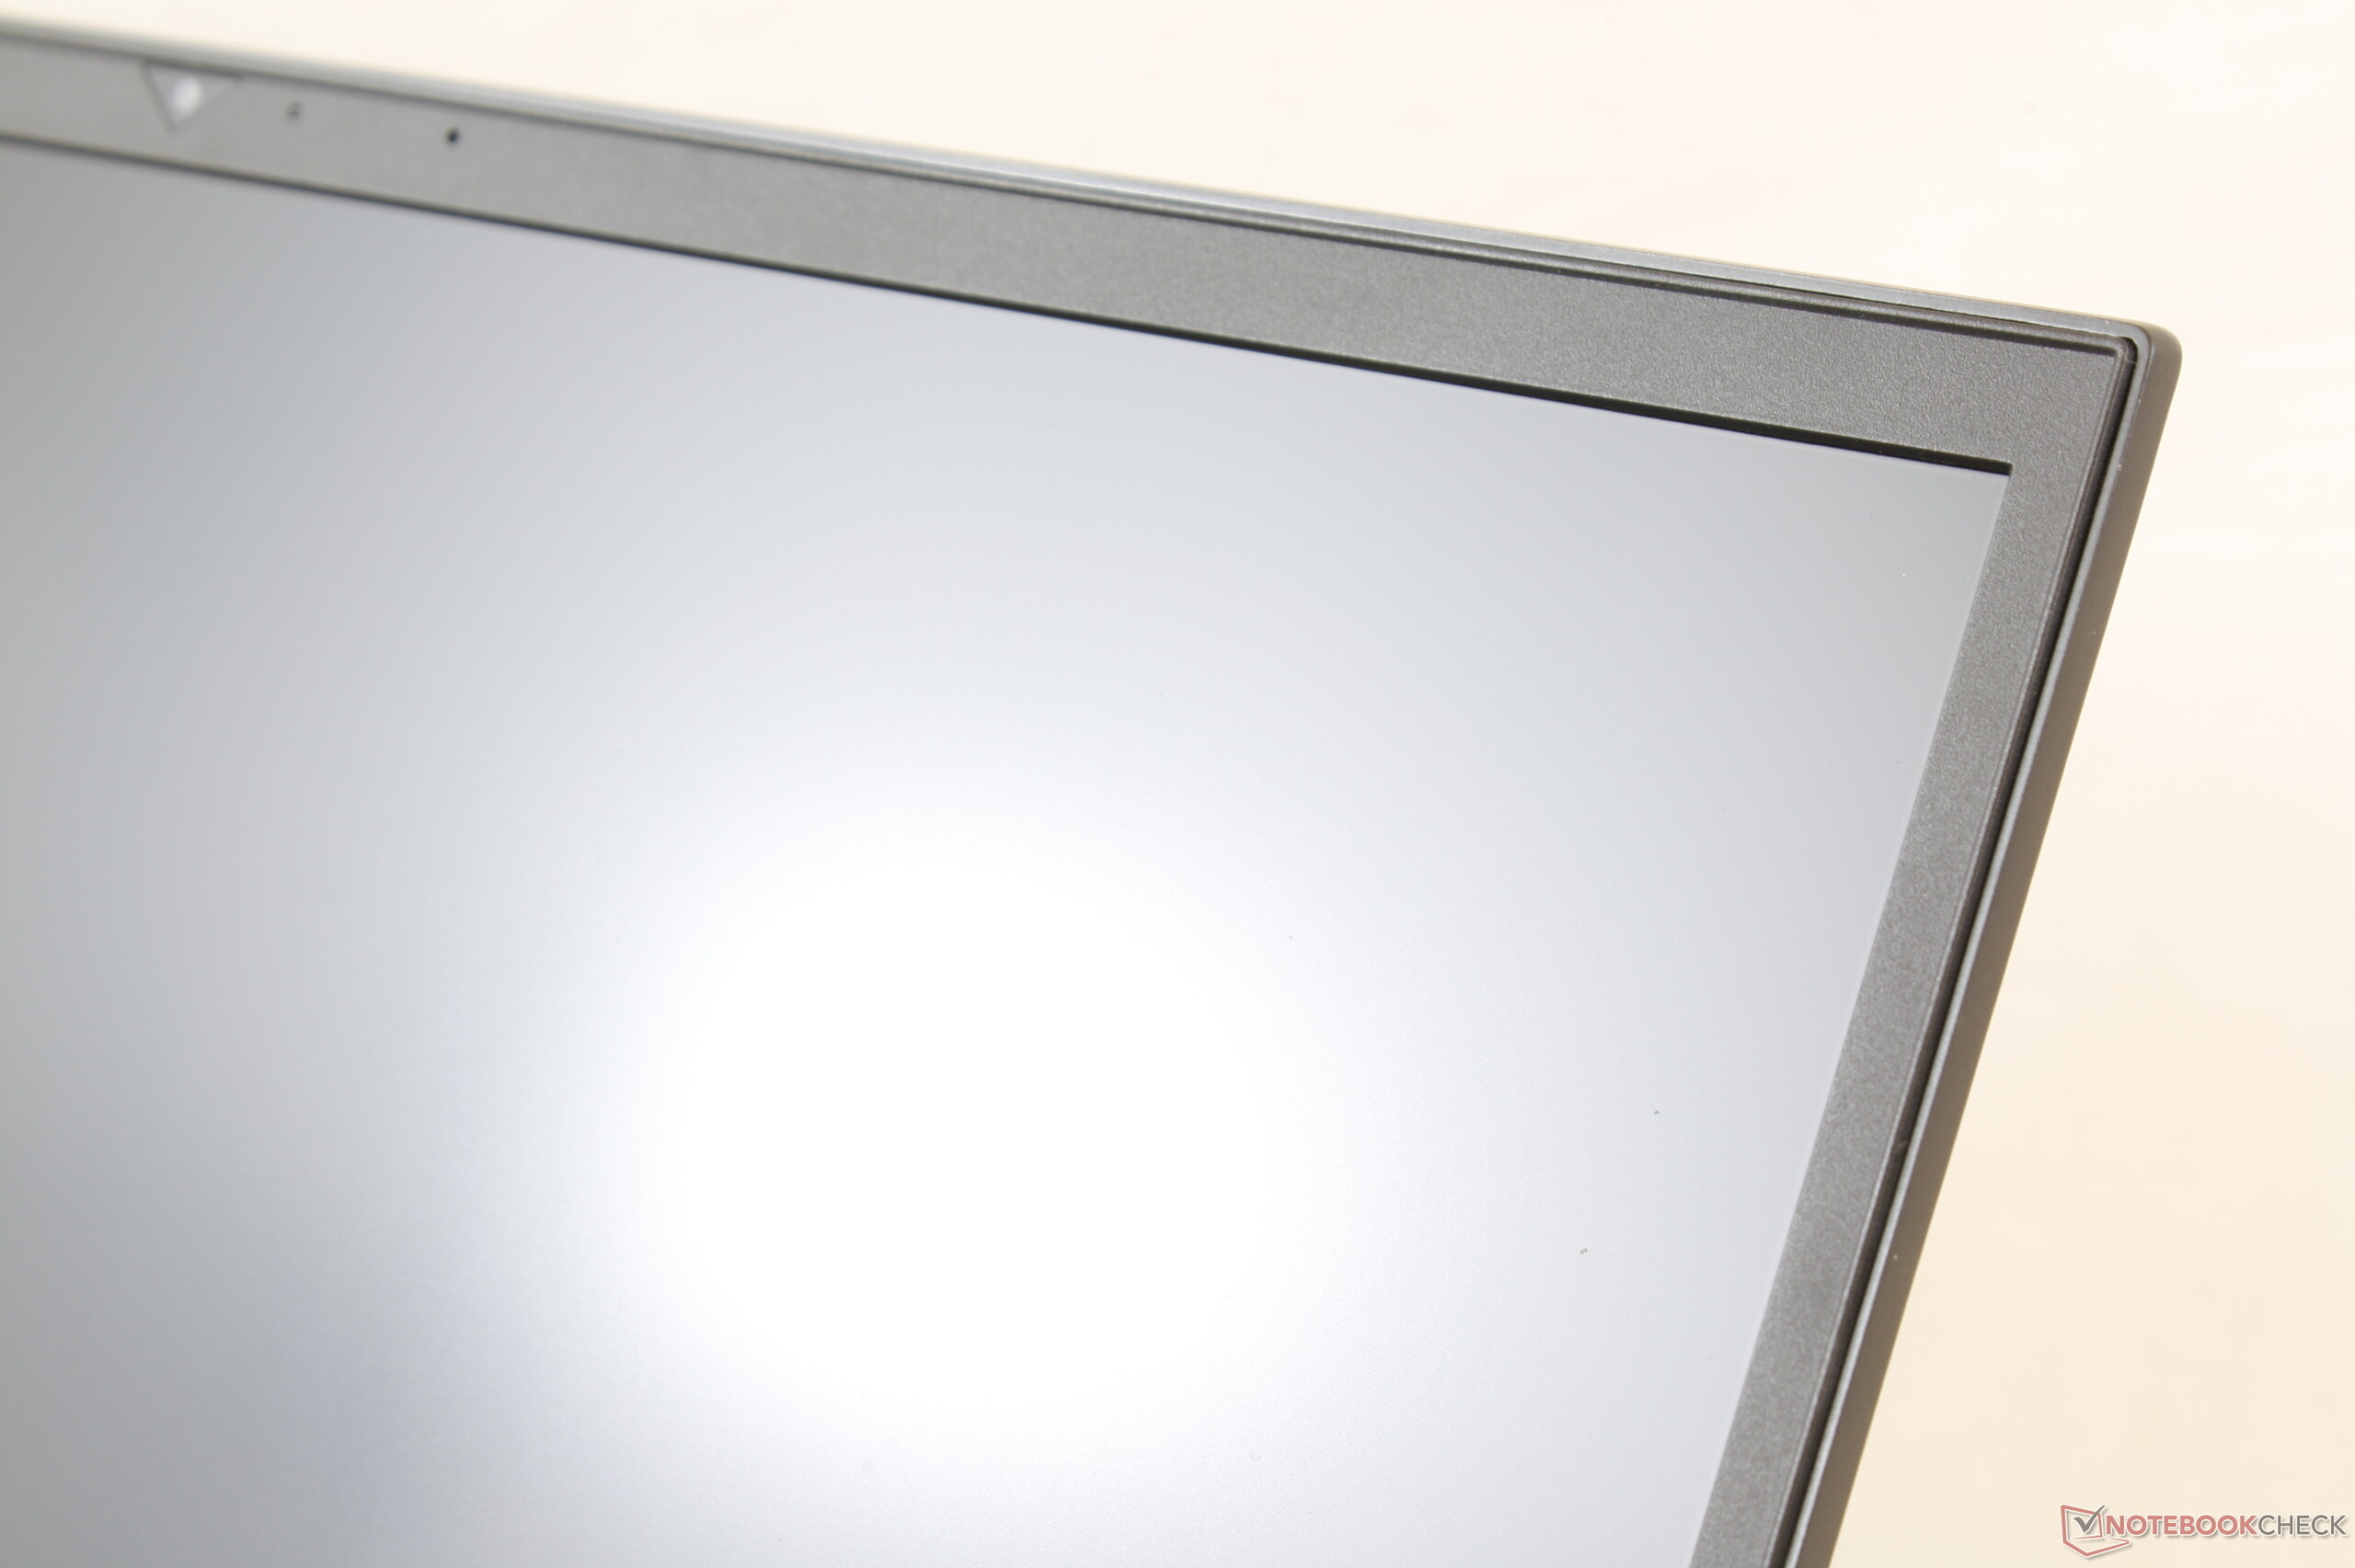
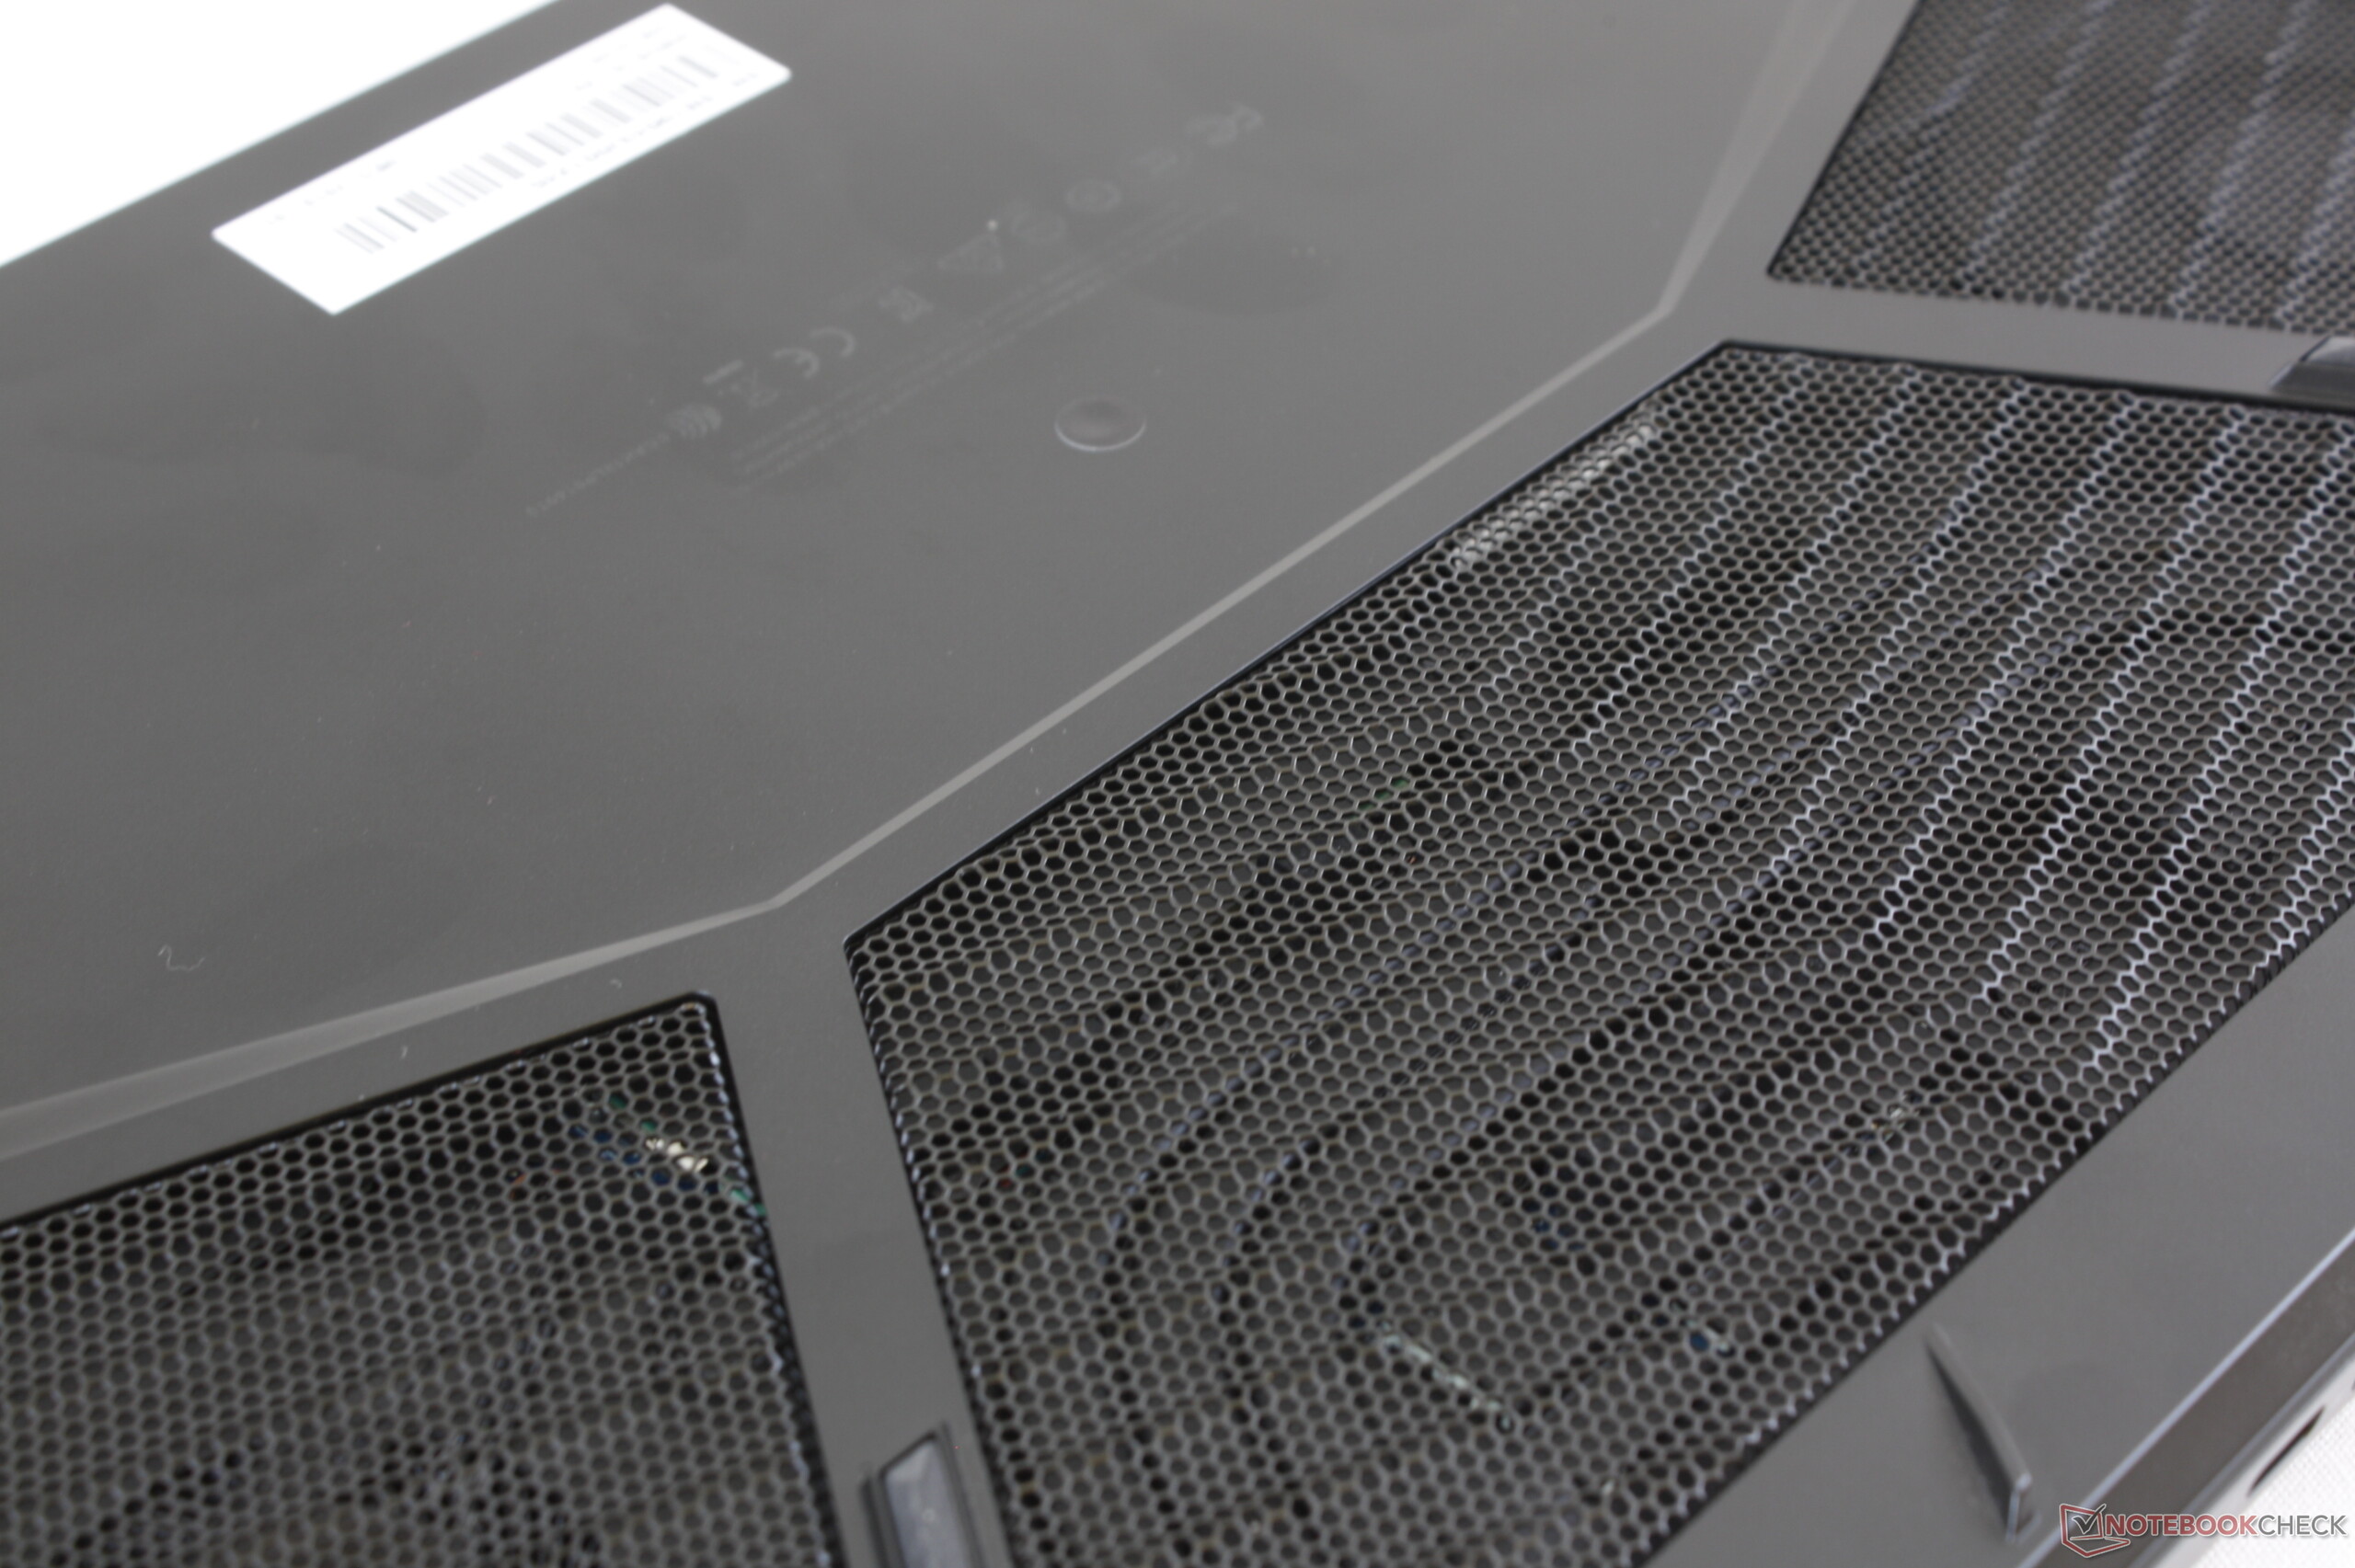
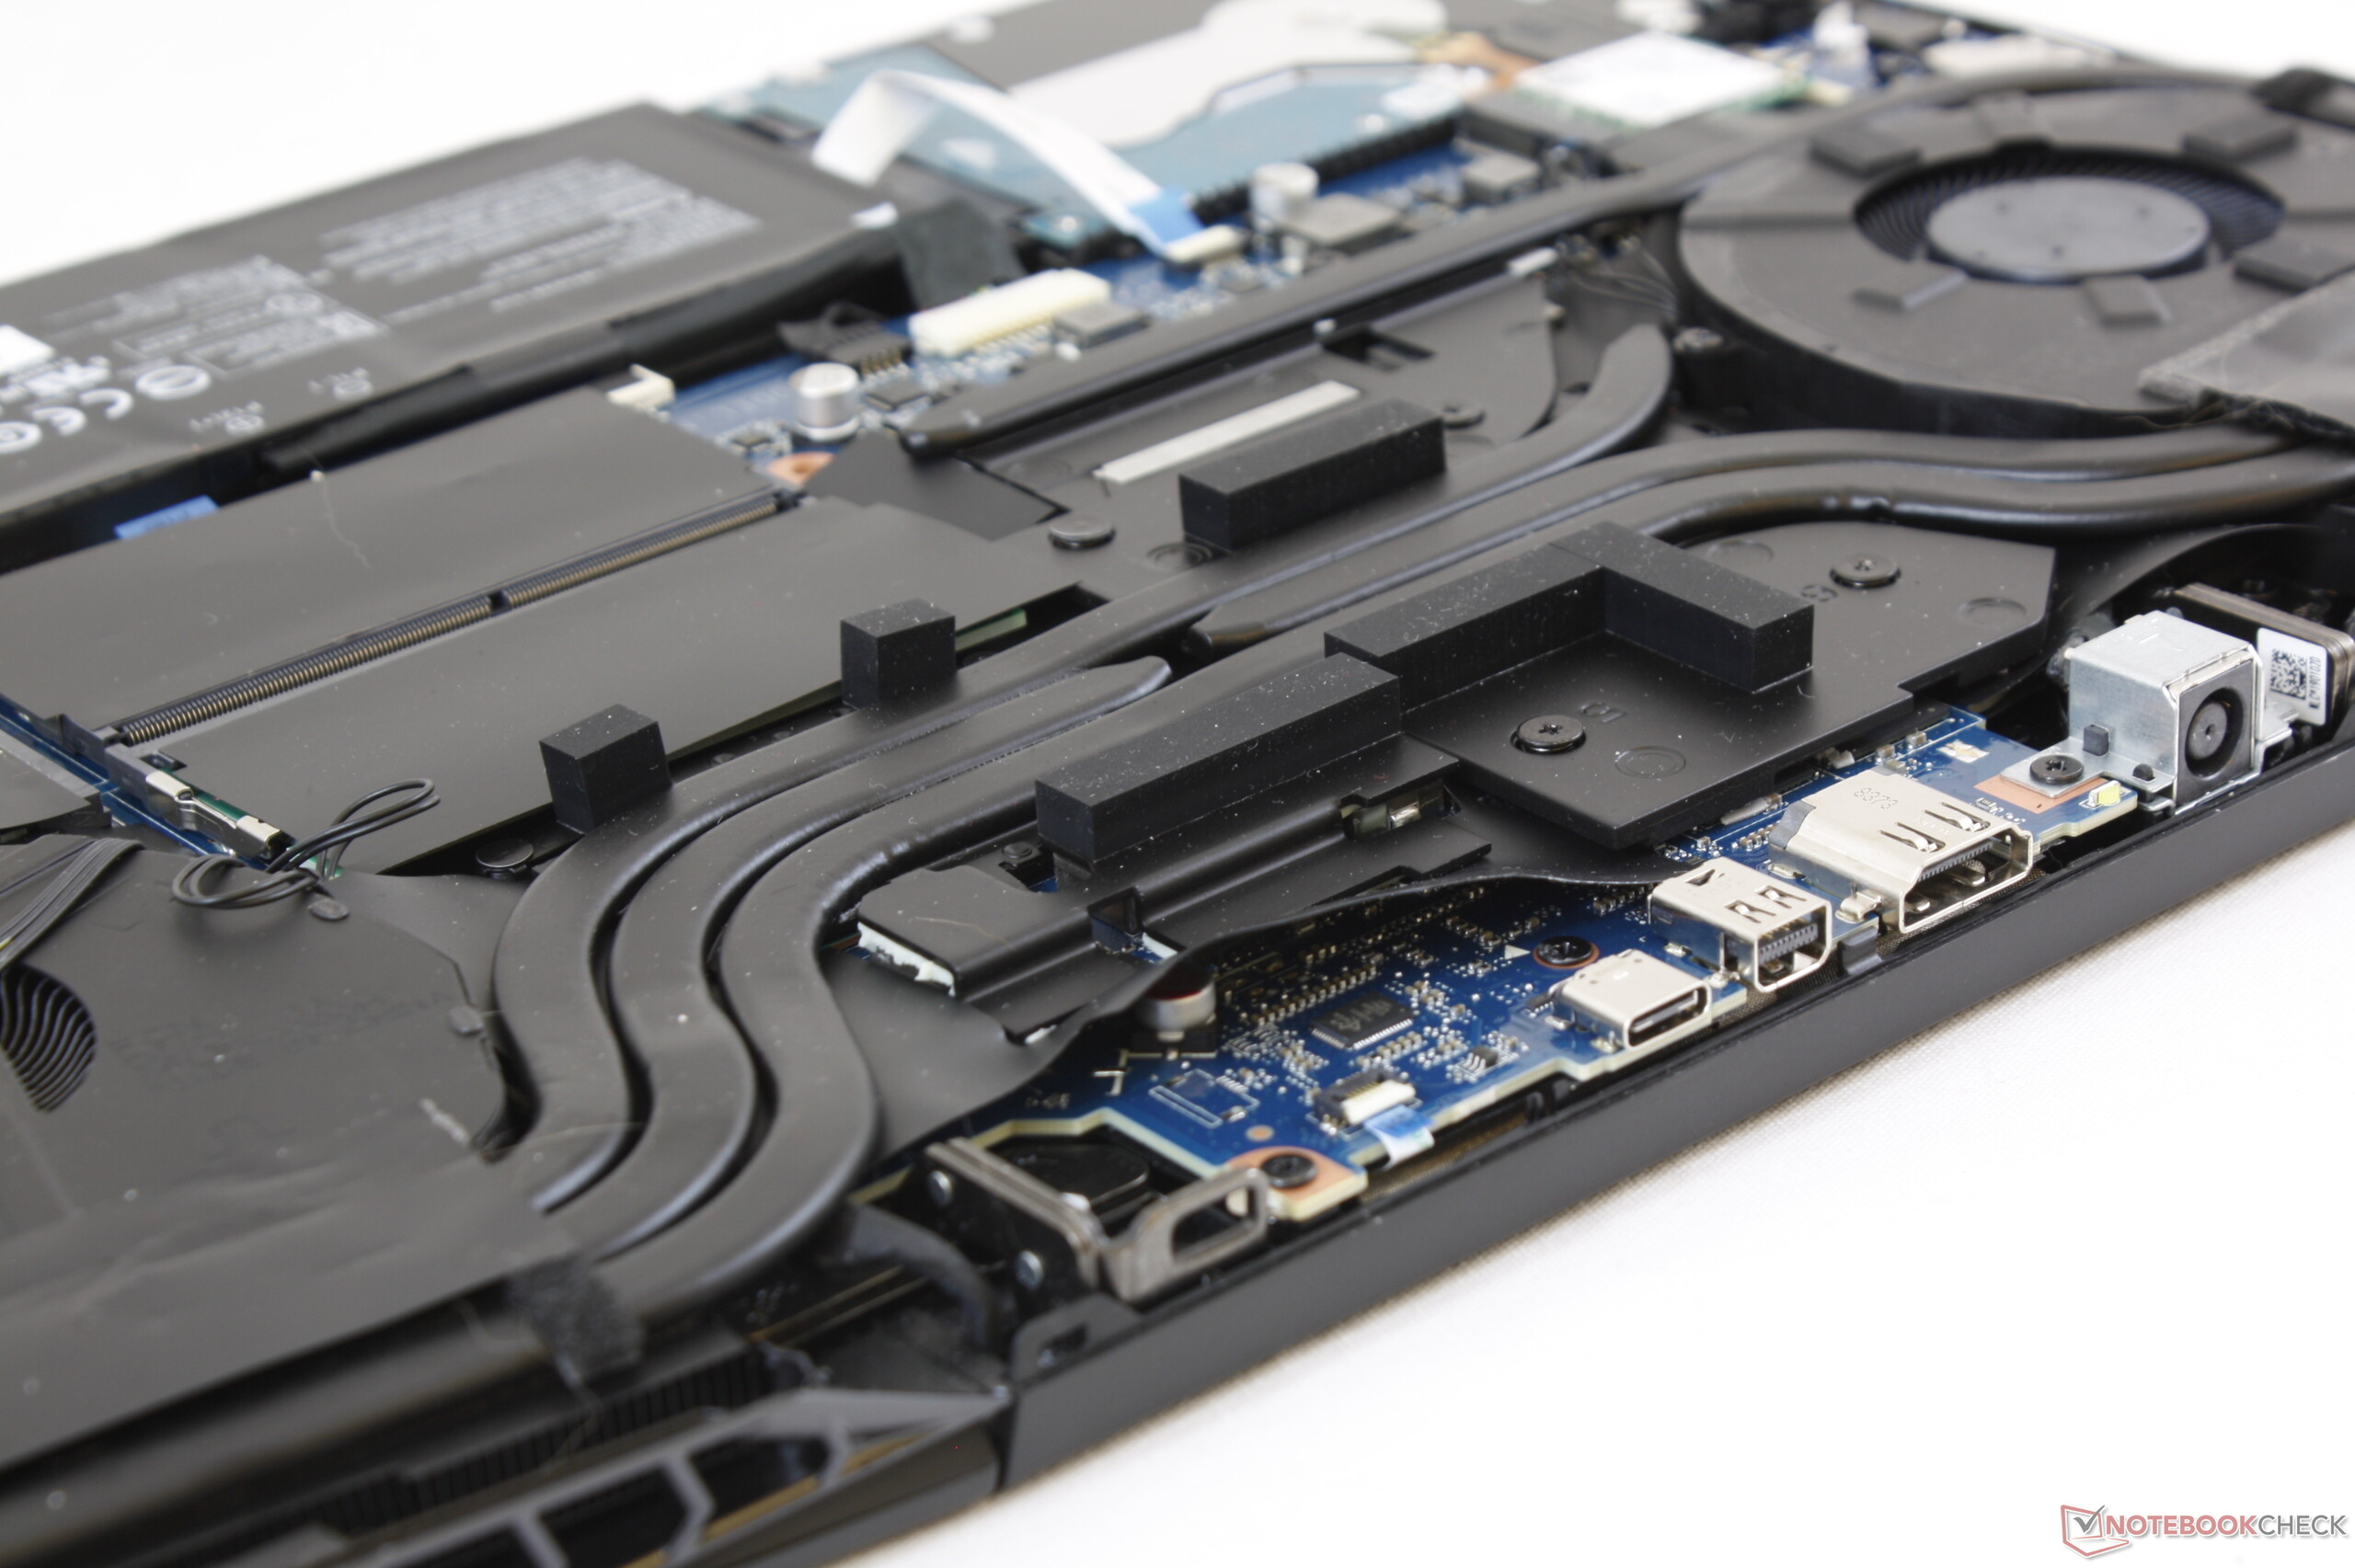
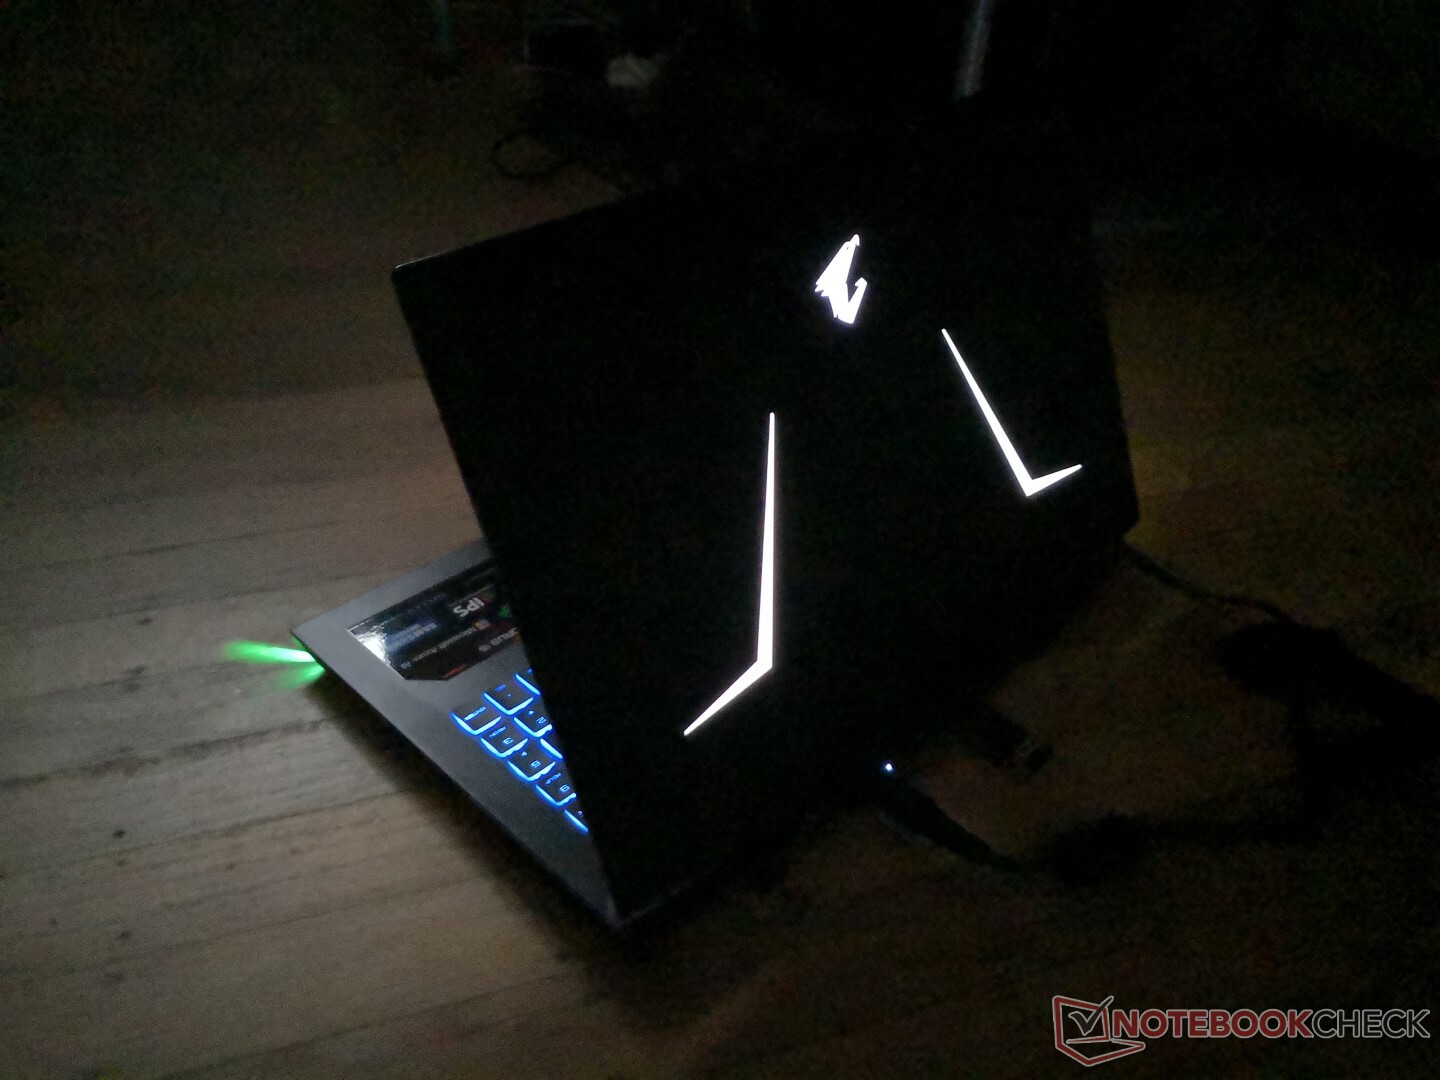
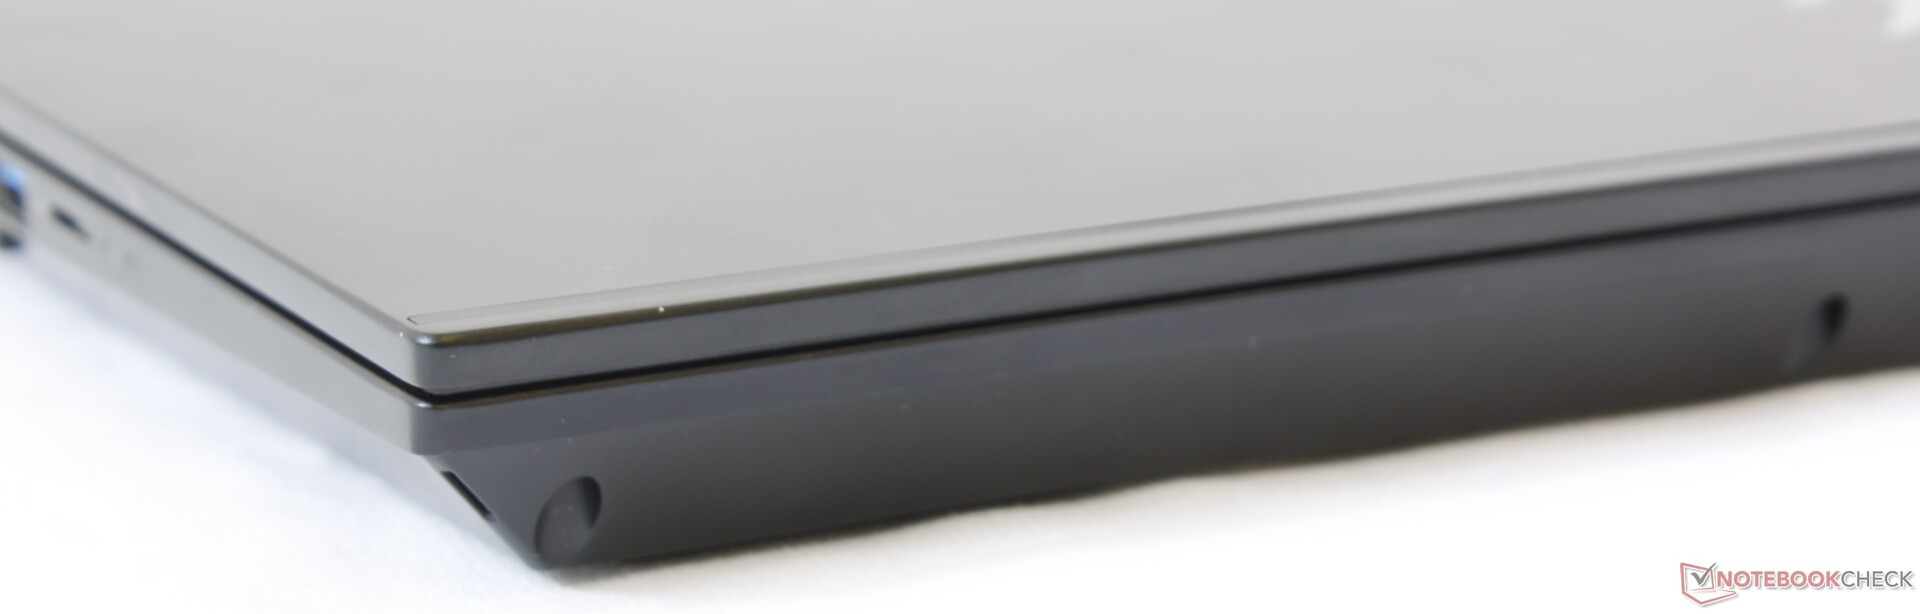
与旧款Aorus X5相比,Aorus 15有改进也有缺陷。它比上一代机型更小,更轻,更强大,运行温度更低,底盘更坚固。特别是触控板和A面的强度已经得到改进,更容易使用,并且散热更强。
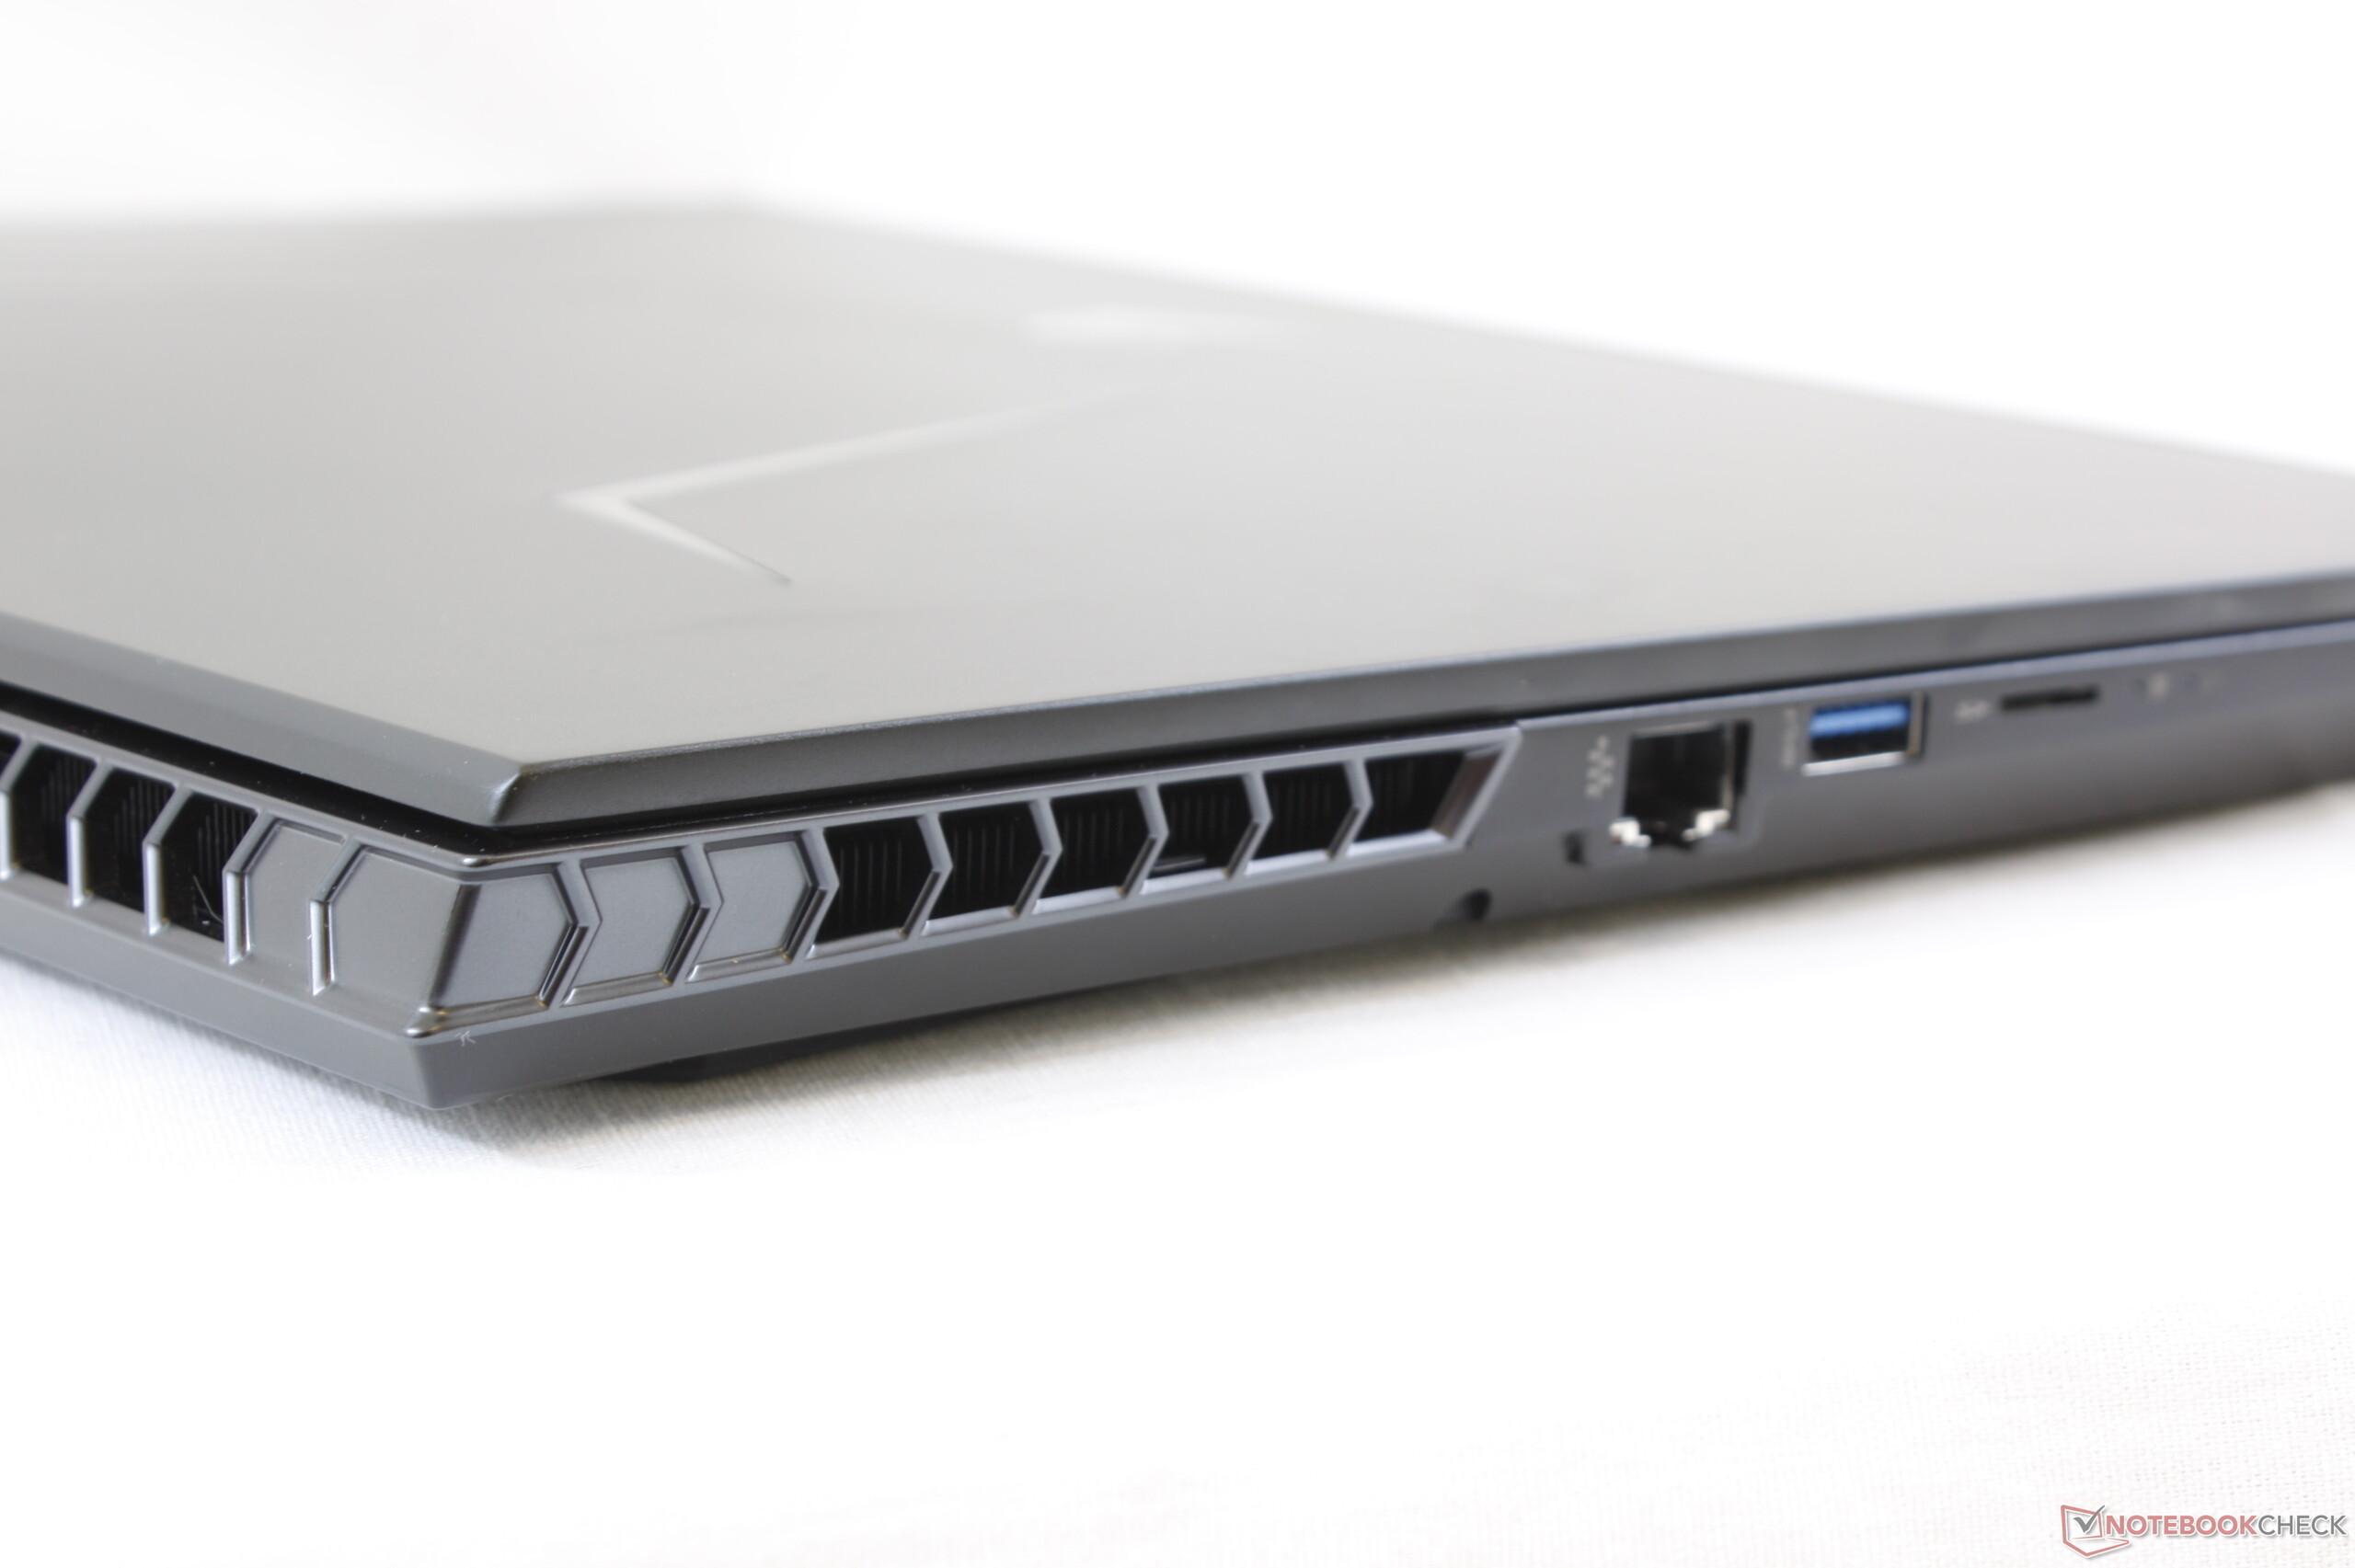
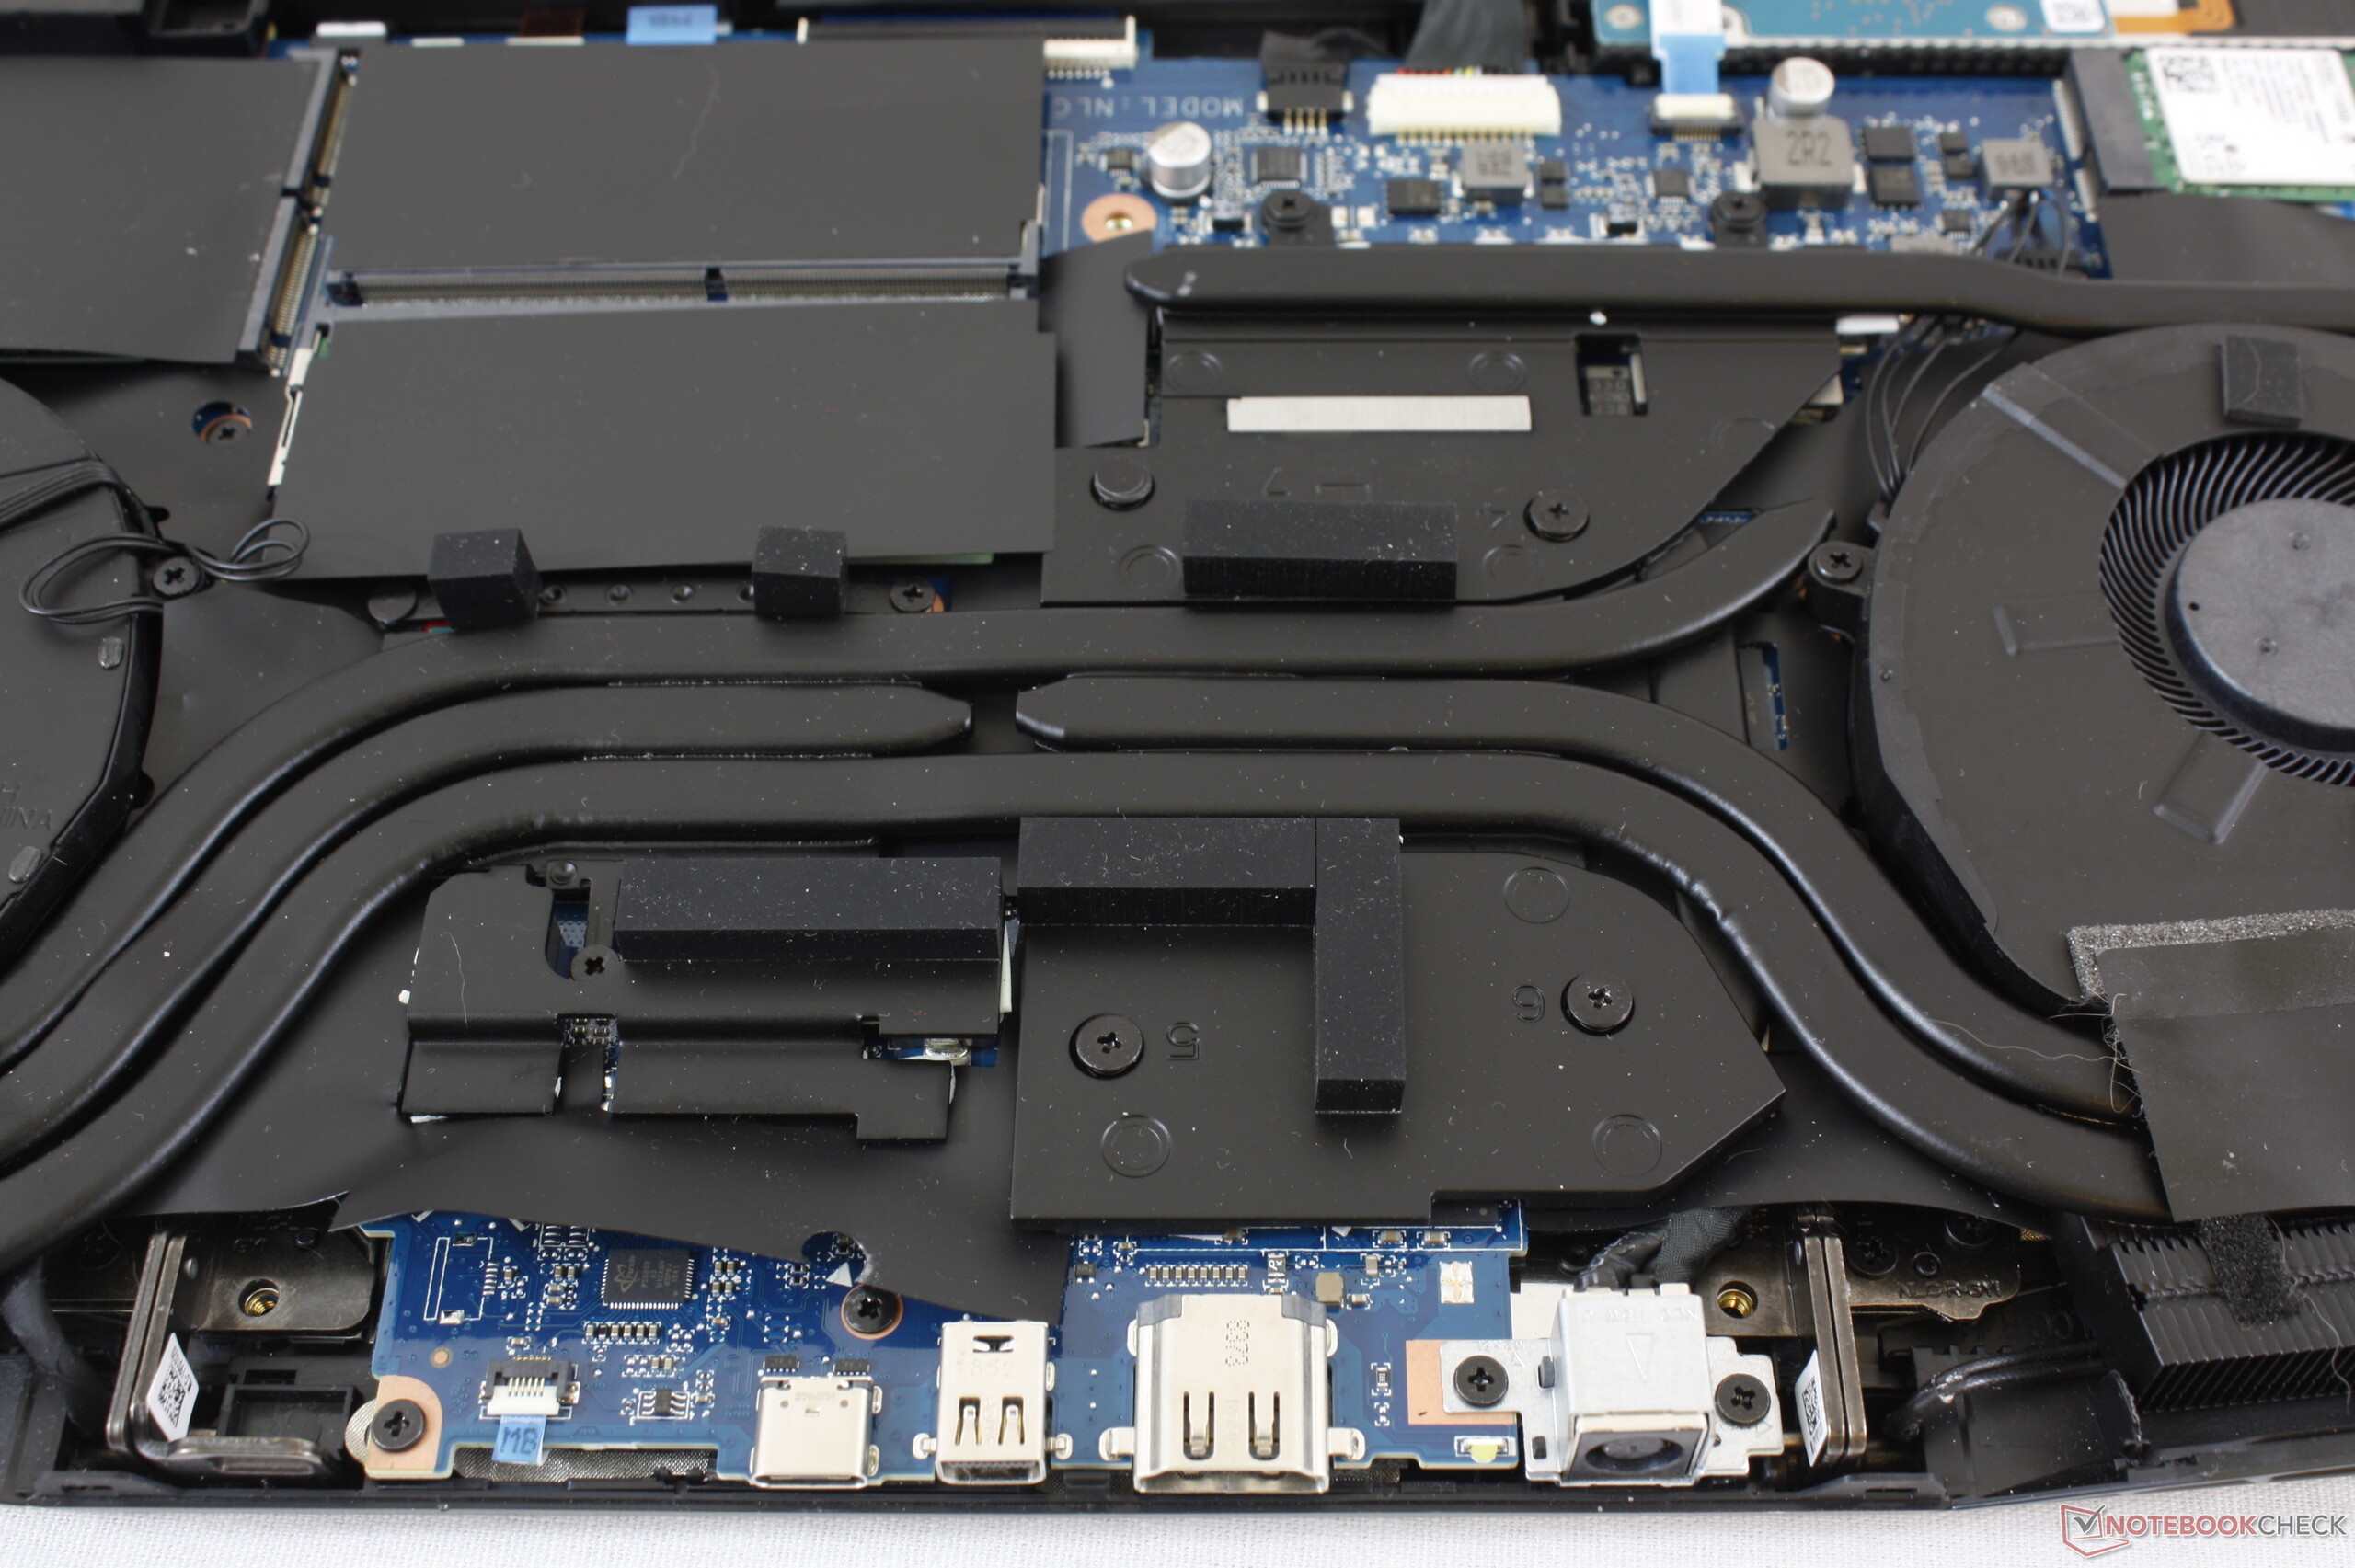
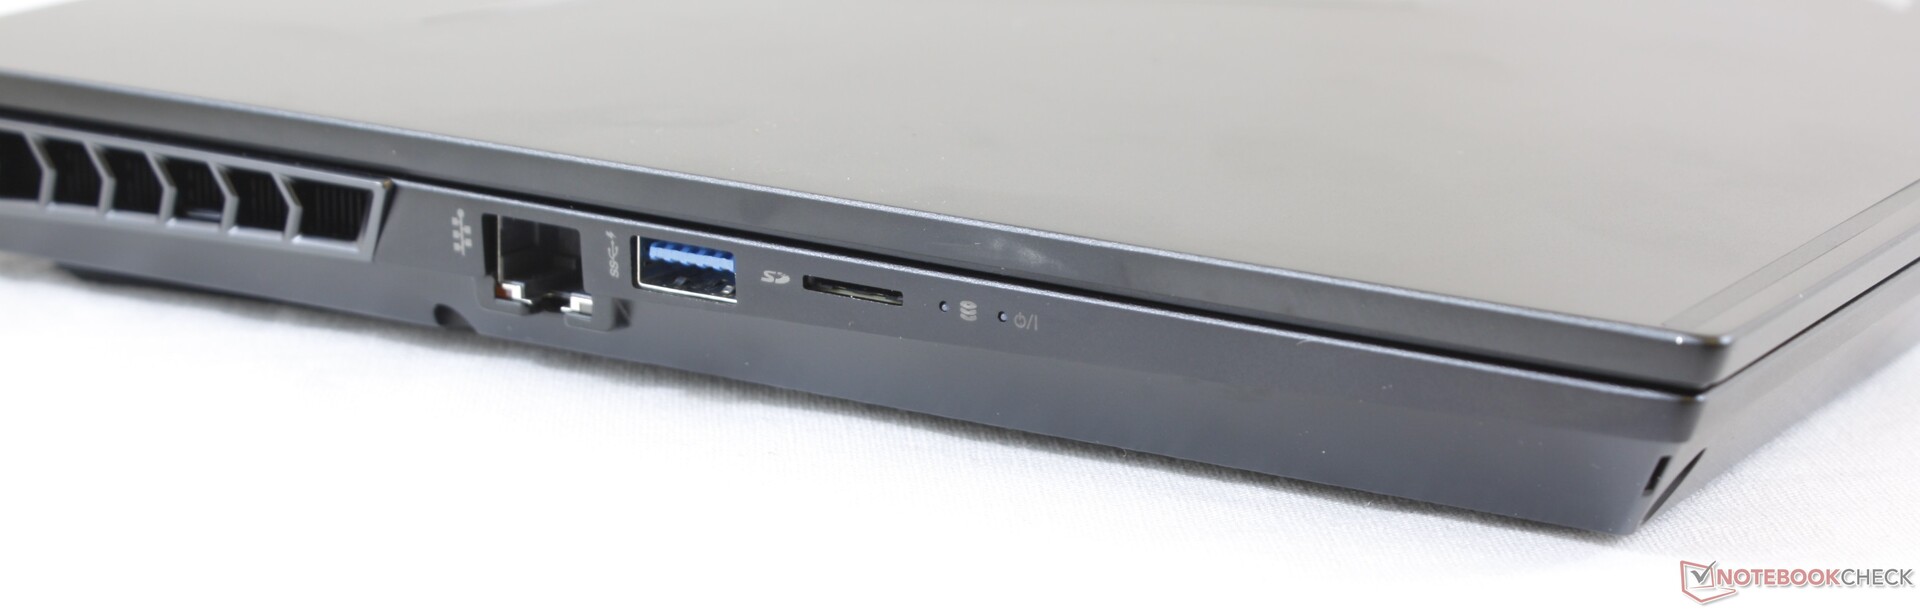
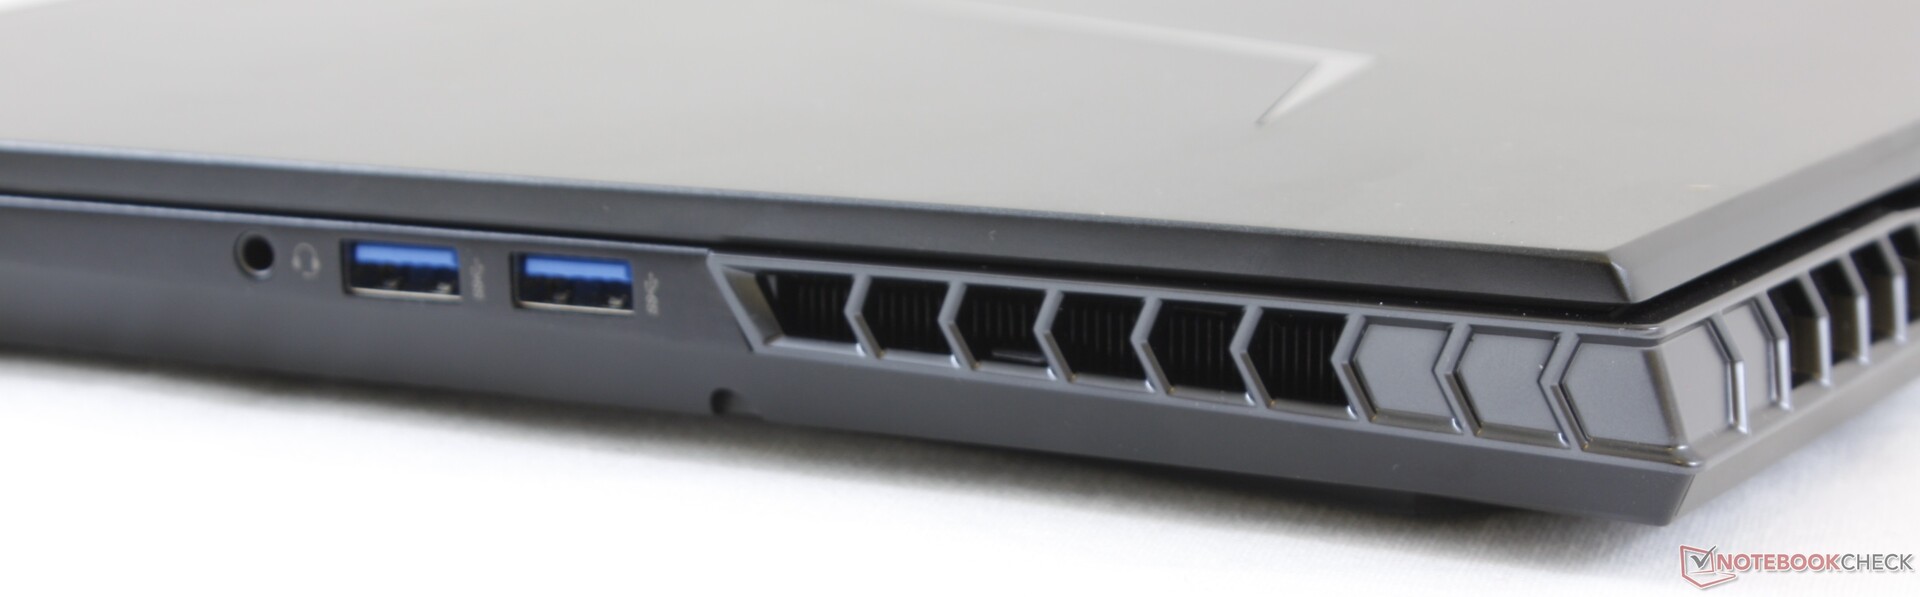
但是也有一些缺点。去年的Aorus X5集成了全尺寸SD读卡器,更多存储托架,单键RGB照明,G-Sync,更大的电池,更大的触控板和专用的宏键。而较新的Aorus 15上缺少的所有这些功能有点令人失望,因为我们已经习惯了Aorus产品的发烧友级别定位,其中包括通常与高端游戏笔记本电脑相关的所有花哨和噱头。在这方面,Aorus 15位于中档和高档之间。
Aorus X5的其他方面在Aorus 15上没有任何改进。在最新的迭代中,风扇噪音,电池寿命和Thunderbolt 3的缺乏仍然缺席甚至情况更糟。RTX 2070 Max-Q相较GTX 1070性能提升约为15%到25%,具体取决于游戏和分辨率。
Aorus 15的一大优势是它的价格。特别是我们的RTX 2070 SKU在Xotic PC上售价2000美元(14000元人民币),而MSI GS65售价2100美元,Razer Blade 15售价2400美元,且只有RTX 2060。华硕ROG Scar GL504GW比Aorus 15便宜,价格为1900美元,使用相同的CPU和GPU,也是一个非常引人注目的选择。
这是迄今为止最平衡的Aorus笔记本电脑。我们希望在未来的迭代中看到重拾一些缺失的功能,例如按键RGB照明,G-Sync和雷电3,以使Aorus 15在发烧友游戏领域更有价值。”
Aorus 15 X9
- 03/26/2019 v6 (old)
Allen Ngo
Price comparison

