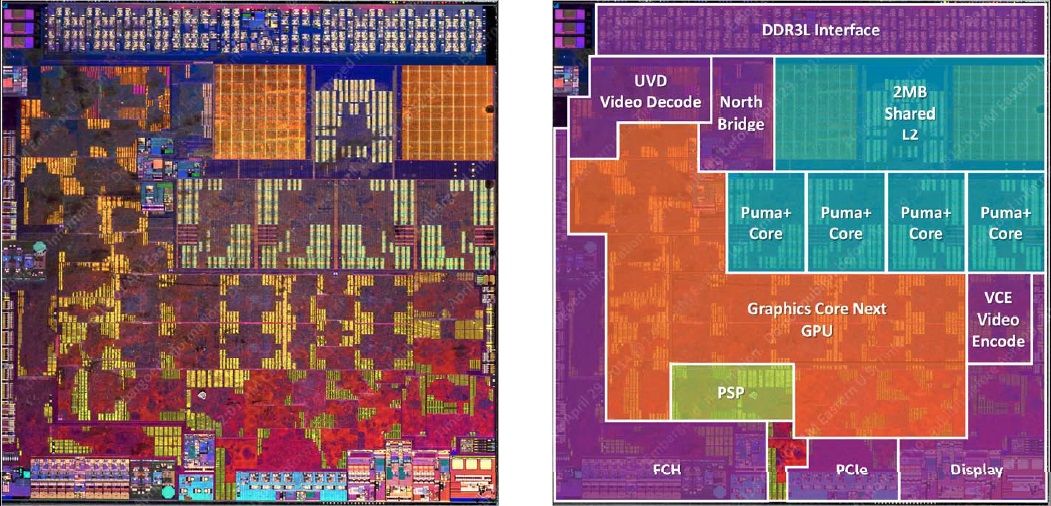
AMD Radeon R5 (Beema/Carrizo-L)
AMD Radeon R5是一款支持DirectX 11.2的集成显卡,使用于一部分AMD APU中(例如A8-6410)。它提供了128个着色核心和两个运算单元,基于GCN架构。主频最高可达800MHz。这款显卡没有独立的显存,需要使用系统内存(单通道DDR3L-1866)。
借助它的UVD芯片,这款显卡可以支持最高4K分辨率的视频硬解码。另外,它还集成了一个特别的视频编码器,名叫VCE。视频信号可以通过VGA,DVI,HDMI 1.4a和DisplayPort 1.2最多输出到两个外接显示器上。
Radeon R5的性能接近于Radeon HD 7470M或Intel HD Graphics 4200。通常情况下,要求较低的游戏如FIFA可以流畅运行。
Radeon R Series Codename Beema Architecture GCN 1.1 Pipelines 128 - unified Core Speed 850 (Boost) MHz Memory Bus Width 64 Bit Shared Memory yes API DirectX 12 (FL 12_0), Shader 5.0 technology 28 nm Date of Announcement 29.04.2014
CPU in Radeon R5 (Beema/Carrizo-L) GPU Base Speed GPU Boost / Turbo AMD A8-7410 4 x 2200 MHz, 12 - 25 W 300 MHz 850 MHz AMD A8-6410 4 x 2000 MHz, 15 W ? MHz 800 MHz min. - max. 300 - ? MHz 800 - 850 MHz
Benchmarks Performance Rating - 3DMark 11 + Fire Strike + Time Spy
0.2 pt (1%)
...
Intel HD Graphics (Broadwell)
AMD Radeon HD 8450G
AMD Radeon HD 8610G
AMD Radeon R2 (Stoney Ridge)
AMD Radeon HD 8450G + Radeon HD 8570M Dual Graphics
Intel UHD Graphics (Elkhart Lake 16 EU)
AMD Radeon R5 (Beema/Carrizo-L)
Intel HD Graphics 4400
AMD Radeon R4 (Stoney Ridge)
Intel HD Graphics 510
...
max:
3DMark - 3DMark Ice Storm Unlimited Graphics
36807 Points (4%)
...
AMD Radeon R4 (Kaveri)
AMD Radeon HD 8210
Intel UHD Graphics 600
Intel UHD Graphics (Elkhart Lake 16 EU)
AMD Radeon HD 8400
AMD Radeon R4 (Stoney Ridge)
AMD Radeon R5 (Beema/Carrizo-L)
Intel HD Graphics 4400
AMD Radeon R2 (Stoney Ridge)
Intel HD Graphics 4200
Intel UHD Graphics 610
NVIDIA GeForce 910M
Intel HD Graphics 510
Intel HD Graphics (Haswell)
...
max:
NVIDIA GeForce RTX 3070 Ti
3DMark - 3DMark Cloud Gate Score
min: 2071 avg: 2757 median: 2882 (3%) max: 3024 Points
Intel Graphics Media Accelerator (GMA) 4500MHD
...
Intel HD Graphics (Haswell)
AMD Radeon HD 8450G
AMD Radeon HD 8610G
AMD Radeon HD 8400
AMD Radeon HD 8450G + Radeon HD 8570M Dual Graphics
AMD Radeon R5 (Beema/Carrizo-L)
Intel HD Graphics 4200
Intel UHD Graphics (Elkhart Lake 16 EU)
Intel UHD Graphics 600
...
max:
3DMark - 3DMark Cloud Gate Graphics
min: 3225 avg: 3352 median: 3317 (1%) max: 3479 Points
Intel Graphics Media Accelerator (GMA) 4500MHD
...
AMD Radeon HD 8610G
AMD Radeon HD 8400
AMD Radeon HD 8350G
AMD Radeon R4 (Stoney Ridge)
AMD Radeon R2 (Stoney Ridge)
AMD Radeon R5 (Beema/Carrizo-L)
Intel UHD Graphics 600
AMD Radeon R4 (Kaveri)
Intel HD Graphics (Haswell)
Intel UHD Graphics 605
AMD Radeon HD 8450G
Intel UHD Graphics (Elkhart Lake 16 EU)
Intel HD Graphics 4200
...
max:
3DMark - 3DMark Fire Strike Standard Score
min: 480 avg: 503 median: 510 (1%) max: 522 Points
...
Intel HD Graphics (Broadwell)
AMD Radeon HD 8610G
AMD Radeon HD 8450G
Intel UHD Graphics 605
AMD Radeon R2 (Stoney Ridge)
Intel UHD Graphics (Elkhart Lake 16 EU)
AMD Radeon R5 (Beema/Carrizo-L)
Intel HD Graphics 4400
AMD Radeon HD 7640G + HD 7610M Dual Graphics
Intel HD Graphics 510
...
max:
3DMark - 3DMark Fire Strike Standard Graphics
min: 515 avg: 538 median: 539 (1%) max: 560 Points
...
Intel UHD Graphics 605
AMD Radeon HD 8610G
AMD Radeon HD 8450G
AMD Radeon R2 (Stoney Ridge)
AMD Radeon HD 8450G + Radeon HD 8570M Dual Graphics
Intel UHD Graphics (Elkhart Lake 16 EU)
AMD Radeon R5 (Beema/Carrizo-L)
AMD Radeon R4 (Stoney Ridge)
Intel HD Graphics 4400
Intel HD Graphics 510
...
max:
3DMark - 3DMark Ice Storm Graphics
min: 35815 avg: 36863 median: 36890 (4%) max: 38840 Points
Intel Graphics Media Accelerator (GMA) 4500MHD
...
Intel HD Graphics (Haswell)
AMD Radeon R4 (Stoney Ridge)
AMD Radeon R7 M260X
NVIDIA Quadro RTX 4000 Max-Q
AMD FirePro M4100
Intel UHD Graphics 610
AMD Radeon HD 8610G
AMD Radeon R5 (Beema/Carrizo-L)
Intel UHD Graphics Xe 16EUs (Tiger Lake-H)
NVIDIA Quadro K620M
Intel HD Graphics 4400
Intel UHD Graphics Xe 750 32EUs (Rocket Lake)
...
max:
3DMark 11 - 3DM11 Performance Score
min: 815 avg: 849 median: 831 (1%) max: 970 Points
...
AMD Radeon R2 (Stoney Ridge)
Intel UHD Graphics 605
Intel HD Graphics 4400
AMD Radeon R5 (Beema/Carrizo-L)
AMD Radeon R4 (Stoney Ridge)
AMD Radeon HD 8610G
...
max:
3DMark 11 - 3DM11 Performance GPU
min: 744 avg: 777 median: 764 (1%) max: 899 Points
...
Intel UHD Graphics 605
AMD Radeon R2 (Stoney Ridge)
Intel HD Graphics 4400
AMD Radeon R5 (Beema/Carrizo-L)
Intel HD Graphics 510
AMD Radeon R4 (Stoney Ridge)
...
max:
3DMark Vantage + 3DMark Vantage - 3DM Vant. Perf. total
2698 Points (1%)
...
Intel HD Graphics 4200
AMD Radeon R4 (Stoney Ridge)
NVIDIA GeForce 8800M GTS
Intel HD Graphics (Broadwell)
AMD Radeon R5 (Beema/Carrizo-L)
NVIDIA Quadro FX 2700M
ATI Mobility Radeon HD 4670
...
max:
NVIDIA T600
3DM Vant. Perf. GPU no PhysX + 3DMark Vantage - 3DM Vant. Perf. GPU no PhysX
2259 Points (1%)
...
Intel HD Graphics (Broadwell)
ATI Mobility Radeon HD 4650
AMD Radeon HD 8350G
NVIDIA GeForce 8800M GTS
AMD Radeon R4 (Stoney Ridge)
AMD Radeon R5 (Beema/Carrizo-L)
NVIDIA Quadro FX 2700M
NVIDIA GeForce 9700M GTS
ATI Mobility Radeon HD 4670
...
max:
3DMark 06 3DMark 06 - Standard 1280x1024 +
min: 4731 avg: 4956 median: 4956 (6%) max: 5181 Points
...
NVIDIA Quadro NVS 320M
NVIDIA GeForce 9650M GT
NVIDIA GeForce 9650M GS
NVIDIA GeForce 8700M GT
NVIDIA Quadro FX 1600M
AMD Radeon R5 (Beema/Carrizo-L)
NVIDIA GeForce 9600M GT
NVIDIA GeForce Go 7900 GS SLI
Intel HD Graphics (Broadwell)
Intel HD Graphics 4400
AMD Radeon HD 8350G
AMD Radeon R5 M230
...
max:
3DMark 06 - Standard 1024x768 +
5181 Points (7%)
Intel Graphics Media Accelerator (GMA) 500
...
ATI Mobility Radeon X2500
NVIDIA GeForce 8600M GS
Intel HD Graphics (Cherry Trail)
NVIDIA GeForce G 105M
NVIDIA GeForce 8600M GT
ATI Mobility Radeon HD 2600
AMD Radeon R5 (Beema/Carrizo-L)
NVIDIA GeForce 9600M GT
AMD Radeon RX Vega 6 (Ryzen 2000/3000)
NVIDIA GeForce GT 750M
Intel UHD Graphics G1 (Ice Lake 32 EU)
AMD Radeon RX Vega 8 (Ryzen 2000/3000)
AMD Radeon RX Vega 6 (Ryzen 4000/5000)
NVIDIA GeForce GTX 770M
...
Unigine Heaven 2.1 - Heaven 2.1 high
9.7 fps (2%)
...
AMD Radeon R4 (Stoney Ridge)
Intel UHD Graphics 605
AMD Radeon R5 (Beema/Carrizo-L)
AMD Radeon HD 8550G
AMD Radeon HD 8650G
...
Cinebench R10 Cinebench R10 Shading (32bit) + Cinebench R10 - Cinebench R10 Shading (32bit)
min: 1746 avg: 2576 median: 2779 (2%) max: 2860 points
Intel Graphics Media Accelerator (GMA) 500
...
NVIDIA GeForce 9200M GS
NVIDIA GeForce G 105M
ATI Mobility Radeon HD 3470
NVIDIA Quadro NVS 140M
AMD Radeon HD 8330
NVIDIA GeForce 910M
NVIDIA Quadro NVS 150M
AMD Radeon R5 (Beema/Carrizo-L)
NVIDIA GeForce G210M
NVIDIA GeForce G 102M
ATI Mobility Radeon HD 3450
NVIDIA GeForce 9300M GS
NVIDIA GeForce 9300M G
ATI Mobility Radeon HD 2400 XT
ATI Mobility Radeon HD 2600
...
Cinebench R11.5 Cinebench R11.5 OpenGL 64 Bit + Cinebench R11.5 - Cinebench R11.5 OpenGL 64 Bit
min: 14.51 avg: 15.5 median: 15.4 (5%) max: 16.29 fps
Intel Graphics Media Accelerator (GMA) 4500MHD
...
AMD Radeon R2 (Stoney Ridge)
AMD Radeon R5 (Beema/Carrizo-L)
NVIDIA GeForce GT 240M
AMD Radeon R4 (Stoney Ridge)
AMD Radeon HD 8350G
AMD Radeon HD 8450G
...
max:
Cinebench R15 + Cinebench R15 - Cinebench R15 OpenGL 64 Bit
min: 15.92 avg: 17 median: 17 (1%) max: 17.77 fps
Intel Graphics Media Accelerator (GMA) 4500MHD
...
Qualcomm Adreno 690
Intel UHD Graphics (Elkhart Lake 16 EU)
AMD Radeon R2 (Stoney Ridge)
Intel UHD Graphics 600
Intel HD Graphics 4200
AMD Radeon R5 (Beema/Carrizo-L)
AMD Radeon HD 8350G
Intel HD Graphics (Broadwell)
AMD Radeon R4 (Stoney Ridge)
Intel UHD Graphics 605
AMD Radeon HD 8450G
Intel HD Graphics 4400
...
Cinebench R15 OpenGL Ref. Match 64 Bit + Cinebench R15 - Cinebench R15 OpenGL Ref. Match 64 Bit
98 % (98%)
...
Intel Iris Plus Graphics G7 (Ice Lake 64 EU)
AMD Radeon 610M
AMD Radeon 680M
AMD Radeon 660M
Intel Iris Pro Graphics 580
AMD Radeon R5 (Beema/Carrizo-L)
Intel Iris Plus Graphics G4 (Ice Lake 48 EU)
Intel Iris Graphics 540
Intel Iris Plus Graphics 640
Intel UHD Graphics 617
...
GFXBench (DX / GLBenchmark) 2.7 + GFXBench (DX / GLBenchmark) 2.7 - GFXBench T-Rex HD Offscreen C24Z16
51 fps (0%)
Intel HD Graphics (Bay Trail)
...
AMD Radeon R2 (Stoney Ridge)
Intel UHD Graphics 605
Intel HD Graphics (Broadwell)
NVIDIA GeForce GT 720M
AMD Radeon R5 (Beema/Carrizo-L)
Intel HD Graphics (Haswell)
AMD Radeon R4 (Stoney Ridge)
Intel HD Graphics 4400
AMD Radeon HD 8450G
...
LuxMark v2.0 64Bit - LuxMark v2.0 Room GPU
88 Samples/s (0%)
...
AMD Radeon R4 (Kaveri)
Intel UHD Graphics 600
Intel UHD Graphics (Elkhart Lake 16 EU)
NVIDIA Quadro K1100M
Intel HD Graphics (Broadwell)
AMD Radeon R5 (Beema/Carrizo-L)
Intel HD Graphics (Haswell)
Intel UHD Graphics 605
NVIDIA GeForce 910M
AMD Radeon 610M
...
max:
4x NVIDIA RTX A6000
LuxMark v2.0 64Bit - LuxMark v2.0 Sala GPU
149 Samples/s (0%)
...
Intel UHD Graphics 600
AMD Radeon R4 (Kaveri)
Intel HD Graphics (Haswell)
Intel UHD Graphics 605
NVIDIA Quadro K1100M
Intel UHD Graphics (Elkhart Lake 16 EU)
AMD Radeon R5 (Beema/Carrizo-L)
NVIDIA Quadro K2100M
Intel HD Graphics 4200
AMD Radeon R4 (Stoney Ridge)
Intel HD Graphics (Broadwell)
AMD Radeon 610M
NVIDIA GeForce 910M
...
max:
4x NVIDIA RTX A6000
ComputeMark v2.1 - ComputeMark v2.1 Result
min: 445 avg: 494.5 median: 494.5 (1%) max: 544 points
...
AMD Radeon HD 8450G
AMD Radeon R2 (Stoney Ridge)
AMD Radeon R4 (Kaveri)
Intel UHD Graphics (Elkhart Lake 16 EU)
Intel UHD Graphics 610
Intel HD Graphics 4200
Intel UHD Graphics 605
AMD Radeon R5 (Beema/Carrizo-L)
Intel HD Graphics 510
NVIDIA GeForce GT 740M
Intel HD Graphics 4400
...
max:
- Range of benchmark values for this graphics card
- Average benchmark values for this graphics card
* Smaller numbers mean a higher performance
Game Benchmarks The following benchmarks stem from our benchmarks of review laptops. The performance depends on the used graphics memory, clock rate, processor, system settings, drivers, and operating systems. So the results don't have to be representative for all laptops with this GPU. For detailed information on the benchmark results, click on the fps number.
AMD Radeon R5 (Beema/Carrizo-L)
AMD Radeon R4 (Stoney Ridge)
Intel UHD Graphics 610
AMD Radeon R5 (Bristol Ridge)
NVIDIA GeForce GT 720M
Intel Iris Plus Graphics G4 (Ice Lake 48 EU)
Intel HD Graphics 630
AMD Radeon RX Vega 6 (Ryzen 2000/3000)
...
» The benchmarks indicate that the game is not playable in the tested settings.
AMD Radeon R5 (Beema/Carrizo-L)
Intel UHD Graphics 615
Intel HD Graphics 4400
AMD Radeon R4 (Stoney Ridge)
AMD Radeon R5 (Bristol Ridge)
Intel UHD Graphics Xe 16EUs (Tiger Lake-H)
Intel HD Graphics 630
...
max:
» The benchmarks indicate that the game is not playable in the tested settings.
AMD Radeon R5 (Beema/Carrizo-L)
Intel HD Graphics 4400
Intel UHD Graphics 615
AMD Radeon R4 (Stoney Ridge)
NVIDIA GeForce GT 720M
AMD Radeon R5 (Bristol Ridge)
NVIDIA GeForce 940M
...
max:
» The benchmarks indicate that the game is not playable in the tested settings.
...
Intel UHD Graphics 600
Intel UHD Graphics 605
AMD Radeon R5 (Beema/Carrizo-L)
Intel HD Graphics 4400
AMD Radeon R4 (Stoney Ridge)
Intel UHD Graphics 615
Intel UHD Graphics 610
AMD Radeon R5 (Bristol Ridge)
...
max:
NVIDIA GeForce GTX 1660 Super (Desktop)
» The benchmarks indicate that the game is not playable in the tested settings.
AMD Radeon R5 (Beema/Carrizo-L)
Intel UHD Graphics 605
Intel UHD Graphics 600
Intel HD Graphics 4400
AMD Radeon R4 (Stoney Ridge)
AMD Radeon R5 (Bristol Ridge)
Intel UHD Graphics 615
Intel UHD Graphics 610
...
max:
» The benchmarks indicate that the game is not playable in the tested settings.
AMD Radeon R5 (Beema/Carrizo-L)
Intel HD Graphics 4400
Intel UHD Graphics 600
Intel UHD Graphics 610
AMD Radeon R4 (Stoney Ridge)
Intel UHD Graphics 615
AMD Radeon R5 (Bristol Ridge)
...
max:
» The benchmarks indicate that the game is not playable in the tested settings.
Intel UHD Graphics 600
Intel UHD Graphics 615
AMD Radeon R5 (Beema/Carrizo-L)
Intel HD Graphics 4400
AMD Radeon RX Vega 6 (Ryzen 2000/3000)
NVIDIA GeForce GT 720M
Intel HD Graphics 630
...
max:
AMD Radeon RX 6700 XT
» The benchmarks indicate that the game is not playable in the tested settings.
Intel UHD Graphics 600
AMD Radeon R5 (Beema/Carrizo-L)
Intel UHD Graphics 615
Intel HD Graphics 4400
NVIDIA GeForce GT 720M
Intel UHD Graphics 610
NVIDIA GeForce 920M
AMD Radeon R4 (Stoney Ridge)
AMD Radeon R5 (Bristol Ridge)
...
max:
NVIDIA GeForce GTX 1660 Super (Desktop)
» The benchmarks indicate that the game is not playable in the tested settings.
AMD Radeon R5 (Beema/Carrizo-L)
AMD Radeon R5 (Bristol Ridge)
Intel HD Graphics 4400
AMD Radeon RX Vega 6 (Ryzen 2000/3000)
Intel HD Graphics 630
NVIDIA GeForce GT 720M
...
max:
» The benchmarks indicate that the game is not playable in the tested settings.
...
Intel UHD Graphics 600
Intel UHD Graphics 605
AMD Radeon R4 (Stoney Ridge)
AMD Radeon R5 (Beema/Carrizo-L)
Intel UHD Graphics 615
Intel UHD Graphics 610
Intel HD Graphics 4400
AMD Radeon R5 (Bristol Ridge)
...
max:
» The benchmarks indicate that the game is not playable in the tested settings.
...
AMD Radeon R5 (Beema/Carrizo-L)
Intel UHD Graphics 615
AMD Radeon R4 (Stoney Ridge)
NVIDIA GeForce GT 720M
AMD Radeon R5 (Bristol Ridge)
...
max:
» The benchmarks indicate that the game is not playable in the tested settings.
Intel UHD Graphics 605
AMD Radeon R5 (Beema/Carrizo-L)
Intel UHD Graphics 600
Intel UHD Graphics 615
AMD Radeon R4 (Stoney Ridge)
AMD Radeon R5 (Bristol Ridge)
Intel HD Graphics 4400
NVIDIA GeForce GT 720M
...
» The benchmarks indicate that the game is not playable in the tested settings.
AMD Radeon R5 (Beema/Carrizo-L)
Intel HD Graphics 4400
NVIDIA GeForce GT 720M
AMD Radeon R4 (Stoney Ridge)
Intel UHD Graphics 615
AMD Radeon R5 (Bristol Ridge)
...
max:
» The benchmarks indicate that the game is not playable in the tested settings.
AMD Radeon R5 (Beema/Carrizo-L)
Intel HD Graphics 4400
Intel UHD Graphics 615
AMD Radeon R4 (Stoney Ridge)
AMD Radeon R5 (Bristol Ridge)
...
max:
NVIDIA GeForce GTX 1080 (Desktop)
» The benchmarks indicate that the game is not playable in the tested settings.
AMD Radeon R5 (Beema/Carrizo-L)
Intel UHD Graphics 615
Intel UHD Graphics 610
AMD Radeon R5 (Bristol Ridge)
Intel HD Graphics 4400
NVIDIA GeForce GT 720M
...
max:
» The benchmarks indicate that the game is not playable in the tested settings.
AMD Radeon R5 (Beema/Carrizo-L)
Intel HD Graphics 4400
AMD Radeon R5 (Bristol Ridge)
AMD Radeon R4 (Stoney Ridge)
Intel UHD Graphics 615
NVIDIA GeForce GT 720M
...
max:
» The benchmarks indicate that the game is not playable in the tested settings.
AMD Radeon R5 (Beema/Carrizo-L)
Intel HD Graphics 4400
AMD Radeon R5 (Bristol Ridge)
NVIDIA GeForce GT 720M
Intel HD Graphics 530
Intel HD Graphics 5600
Intel HD Graphics 630
...
max:
NVIDIA Titan RTX
» The benchmarks indicate that the game is not playable in the tested settings.
Intel HD Graphics (Haswell)
AMD Radeon R5 (Beema/Carrizo-L)
AMD Radeon R4 (Stoney Ridge)
Intel HD Graphics 4400
Intel UHD Graphics 615
NVIDIA GeForce GT 720M
AMD Radeon R5 (Bristol Ridge)
...
» The benchmarks indicate that the game is not playable in the tested settings.
AMD Radeon R5 (Beema/Carrizo-L)
AMD Radeon R4 (Stoney Ridge)
AMD Radeon R5 (Bristol Ridge)
Intel HD Graphics 4400
NVIDIA GeForce GT 720M
NVIDIA GeForce 920M
...
max:
» The benchmarks indicate that the game is not playable in the tested settings.
Intel UHD Graphics 600
Intel UHD Graphics 605
Intel HD Graphics 4400
AMD Radeon R5 (Beema/Carrizo-L)
NVIDIA GeForce GT 720M
AMD Radeon R4 (Stoney Ridge)
AMD Radeon R5 (Bristol Ridge)
Intel HD Graphics 630
...
max:
» The benchmarks indicate that the game is not playable in the tested settings.
Intel UHD Graphics 600
Intel HD Graphics 4400
AMD Radeon R5 (Beema/Carrizo-L)
Intel UHD Graphics 615
NVIDIA GeForce GT 720M
AMD Radeon R5 (Bristol Ridge)
Intel HD Graphics 530
Intel Iris Plus Graphics G7 (Ice Lake 64 EU)
...
max:
» The benchmarks indicate that the game is not playable in the tested settings.
AMD Radeon R5 (Beema/Carrizo-L)
Intel HD Graphics 4400
AMD Radeon RX Vega 6 (Ryzen 2000/3000)
Intel HD Graphics 630
NVIDIA GeForce GT 720M
...
max:
» The benchmarks indicate that the game is not playable in the tested settings.
Intel UHD Graphics 600
Intel UHD Graphics 605
AMD Radeon R5 (Beema/Carrizo-L)
Intel UHD Graphics 610
Intel UHD Graphics 615
AMD Radeon R4 (Stoney Ridge)
AMD Radeon R5 (Bristol Ridge)
NVIDIA GeForce GT 720M
...
max:
» The benchmarks indicate that the game is not playable in the tested settings.
...
AMD Radeon R5 (Beema/Carrizo-L)
AMD Radeon R5 (Bristol Ridge)
Intel UHD Graphics 615
NVIDIA GeForce GT 720M
AMD Radeon RX Vega 6 (Ryzen 2000/3000)
Intel HD Graphics 630
...
NVIDIA Quadro RTX 4000 (Laptop)
max:
» The benchmarks indicate that the game is not playable in the tested settings.
AMD Radeon R4 (Stoney Ridge)
Intel UHD Graphics 605
AMD Radeon R5 (Beema/Carrizo-L)
Intel HD Graphics 4400
AMD Radeon R5 (Bristol Ridge)
NVIDIA GeForce GT 720M
Intel UHD Graphics 615
Intel HD Graphics 630
NVIDIA GeForce 920M
...
NVIDIA Quadro P5200
max:
NVIDIA GeForce GTX 1650 Super (Desktop)
» The benchmarks indicate that the game is not playable in the tested settings.
Intel HD Graphics 4400
Intel UHD Graphics 605
AMD Radeon R5 (Beema/Carrizo-L)
AMD Radeon R5 (Bristol Ridge)
NVIDIA GeForce GT 720M
Intel HD Graphics 630
...
AMD Radeon Pro 555
» The benchmarks indicate that the game is not playable in the tested settings.
...
AMD Radeon R4 (Stoney Ridge)
Intel UHD Graphics 605
Intel HD Graphics 4400
AMD Radeon R5 (Bristol Ridge)
Intel UHD Graphics 615
AMD Radeon R5 (Beema/Carrizo-L)
Intel UHD Graphics 610
NVIDIA GeForce GT 720M
Intel HD Graphics 530
Intel HD Graphics 630
...
max:
» The benchmarks indicate that the game is not playable in the tested settings.
Intel UHD Graphics 600
Intel UHD Graphics 605
AMD Radeon R5 (Beema/Carrizo-L)
AMD Radeon R4 (Stoney Ridge)
Intel HD Graphics 4400
AMD Radeon R5 (Bristol Ridge)
AMD Radeon HD 8650G
Intel UHD Graphics 615
...
NVIDIA Quadro RTX 5000 Max-Q
» With all tested laptops playable in detail settings low.
Intel UHD Graphics 600
AMD Radeon R5 (Beema/Carrizo-L)
Intel UHD Graphics 605
Intel UHD Graphics (Elkhart Lake 16 EU)
AMD Radeon HD 8400
Intel UHD Graphics 610
Intel UHD Graphics 615
AMD Radeon HD 8350G
AMD Radeon R4 (Stoney Ridge)
AMD Radeon R5 (Bristol Ridge)
...
max:
» The benchmarks indicate that the game is not playable in the tested settings.
AMD Radeon R4 (Stoney Ridge)
AMD Radeon R5 (Beema/Carrizo-L)
AMD Radeon R5 (Bristol Ridge)
Intel HD Graphics 520
Intel HD Graphics 4400
NVIDIA GeForce GT 720M
Intel HD Graphics 530
...
max:
» The benchmarks indicate that the game is not playable in the tested settings.
Intel UHD Graphics (Elkhart Lake 16 EU)
Intel UHD Graphics 600
Intel UHD Graphics 605
AMD Radeon R5 (Beema/Carrizo-L)
Intel UHD Graphics 615
AMD Radeon R4 (Stoney Ridge)
Intel HD Graphics 520
Intel UHD Graphics 610
AMD Radeon R5 (Bristol Ridge)
Intel HD Graphics 5600
...
max:
» The benchmarks indicate that the game is not playable in the tested settings.
AMD Radeon R5 (Beema/Carrizo-L)
Intel UHD Graphics 610
Intel HD Graphics 520
AMD Radeon R5 (Bristol Ridge)
NVIDIA GeForce GT 720M
Intel Iris Plus Graphics G4 (Ice Lake 48 EU)
...
max:
NVIDIA GeForce GTX 1070 SLI (Desktop)
» The benchmarks indicate that the game is not playable in the tested settings.
AMD Radeon R5 (Beema/Carrizo-L)
AMD Radeon R5 (Bristol Ridge)
Intel HD Graphics 520
AMD Radeon R9 M280X
...
max:
» The benchmarks indicate that the game is not playable in the tested settings.
AMD Radeon R5 (Beema/Carrizo-L)
Intel HD Graphics 4400
Intel HD Graphics 520
AMD Radeon R5 (Bristol Ridge)
NVIDIA GeForce GT 720M
...
NVIDIA GeForce GTX 1080 Mobile
max:
NVIDIA GeForce GTX 1060 (Desktop)
» The benchmarks indicate that the game is not playable in the tested settings.
Intel UHD Graphics 605
Intel HD Graphics 4400
AMD Radeon R4 (Stoney Ridge)
Intel UHD Graphics 615
AMD Radeon R5 (Beema/Carrizo-L)
Intel HD Graphics 520
AMD Radeon R5 (Bristol Ridge)
NVIDIA GeForce GT 720M
Intel HD Graphics 630
...
max:
NVIDIA GeForce GTX 1060 (Desktop)
» The benchmarks indicate that the game is not playable in the tested settings.
Intel UHD Graphics 600
AMD Radeon R5 (Beema/Carrizo-L)
Intel HD Graphics 4400
Intel UHD Graphics 610
Intel HD Graphics 630
AMD Radeon R4 (Stoney Ridge)
Intel HD Graphics 520
AMD Radeon R5 (Bristol Ridge)
...
NVIDIA Quadro P5200
» The benchmarks indicate that the game is not playable in the tested settings.
Intel HD Graphics (Haswell)
Intel UHD Graphics 605
AMD Radeon R5 (Beema/Carrizo-L)
AMD Radeon R5 (Bristol Ridge)
Intel HD Graphics 4400
Intel HD Graphics 520
NVIDIA GeForce GT 720M
...
» The benchmarks indicate that the game is not playable in the tested settings.
AMD Radeon R5 (Beema/Carrizo-L)
NVIDIA GeForce 920M
Intel HD Graphics 520
Intel HD Graphics 530
NVIDIA GeForce GT 720M
...
max:
NVIDIA GeForce GTX 1660 Super (Desktop)
» The benchmarks indicate that the game is not playable in the tested settings.
AMD Radeon R2 (Stoney Ridge)
Intel HD Graphics (Cherry Trail)
AMD Radeon R5 (Beema/Carrizo-L)
Intel HD Graphics (Bay Trail)
AMD Radeon HD 8330
Intel UHD Graphics 600
AMD Radeon HD 8400
AMD Radeon R5 (Bristol Ridge)
Intel UHD Graphics 605
Intel HD Graphics 515
...
AMD Radeon Pro 560X
AMD Radeon R2 (Stoney Ridge)
AMD Radeon R5 (Beema/Carrizo-L)
AMD Radeon R4 (Stoney Ridge)
Intel HD Graphics (Bay Trail)
Intel HD Graphics (Haswell)
Intel UHD Graphics 600
Intel HD Graphics 515
Intel UHD Graphics 605
AMD Radeon R5 (Bristol Ridge)
...
AMD Radeon Pro 560X
» The benchmarks indicate that the game is not playable in the tested settings.
Intel HD Graphics (Bay Trail)
Intel HD Graphics (Haswell)
Intel UHD Graphics 605
Intel HD Graphics 4400
AMD Radeon HD 8650G
AMD Radeon R5 (Beema/Carrizo-L)
Intel HD Graphics 515
AMD Radeon R4 (Stoney Ridge)
AMD FirePro W4190M
Intel HD Graphics 520
...
Intel HD Graphics 4400
AMD FirePro W4190M
AMD Radeon R5 (Bristol Ridge)
Intel HD Graphics 630
AMD Radeon R5 (Beema/Carrizo-L)
NVIDIA GeForce GT 720M
NVIDIA GeForce 920M
...
max:
AMD Radeon VII
» The benchmarks indicate that the game is not playable in the tested settings.
Intel HD Graphics (Bay Trail)
...
Intel HD Graphics (Cherry Trail)
Intel UHD Graphics 600
Intel UHD Graphics 610
Intel UHD Graphics 605
AMD Radeon R5 (Beema/Carrizo-L)
Intel HD Graphics 515
AMD Radeon R2 (Stoney Ridge)
AMD Radeon R4 (Stoney Ridge)
Intel UHD Graphics 615
Intel HD Graphics (Haswell)
Intel HD Graphics 520
...
» The benchmarks indicate that the game is not playable in the tested settings.
Intel UHD Graphics 605
AMD Radeon R2 (Stoney Ridge)
Intel HD Graphics 4400
AMD Radeon R5 (Beema/Carrizo-L)
Intel UHD Graphics 615
Intel HD Graphics 520
AMD Radeon R5 (Bristol Ridge)
AMD Radeon HD 8650G
...
NVIDIA Quadro P5200
» The benchmarks indicate that the game is not playable in the tested settings.
AMD Radeon R5 (Beema/Carrizo-L)
AMD Radeon R5 (Bristol Ridge)
Intel HD Graphics 4400
AMD Radeon HD 8650G
Intel HD Graphics 520
NVIDIA GeForce GT 720M
...
max:
» The benchmarks indicate that the game is not playable in the tested settings.
Intel HD Graphics 520
Intel UHD Graphics 615
AMD Radeon R5 (Beema/Carrizo-L)
Intel HD Graphics 515
AMD Radeon R4 (Stoney Ridge)
Intel HD Graphics 4400
AMD Radeon HD 8650G
...
max:
...
AMD Radeon R5 (Beema/Carrizo-L)
Intel HD Graphics 520
Intel HD Graphics 515
NVIDIA GeForce GT 720M
AMD Radeon R5 (Bristol Ridge)
Intel HD Graphics 630
...
max:
» The benchmarks indicate that the game is not playable in the tested settings.
Intel UHD Graphics 605
Intel UHD Graphics 600
Intel HD Graphics 4400
AMD Radeon R5 (Beema/Carrizo-L)
AMD Radeon R4 (Stoney Ridge)
Intel UHD Graphics 615
Intel HD Graphics 515
Intel HD Graphics 520
AMD Radeon HD 8650G
AMD Radeon R5 (Bristol Ridge)
...
max:
AMD Radeon R5 (Beema/Carrizo-L)
Intel HD Graphics 515
AMD Radeon R5 (Bristol Ridge)
Intel HD Graphics 520
Intel HD Graphics 530
Intel HD Graphics 5600
...
max:
» The benchmarks indicate that the game is not playable in the tested settings.
Intel HD Graphics (Haswell)
Intel HD Graphics 510
AMD Radeon R5 (Beema/Carrizo-L)
Intel HD Graphics 4400
Intel HD Graphics 515
Intel HD Graphics 520
AMD FirePro W4190M
AMD Radeon R4 (Stoney Ridge)
NVIDIA GeForce GT 720M
...
NVIDIA GeForce GTX 1080 Mobile
max:
NVIDIA GeForce GTX 1080 (Desktop)
Intel HD Graphics 4400
Intel HD Graphics 515
AMD FirePro W4190M
AMD Radeon R5 (Beema/Carrizo-L)
Intel HD Graphics 530
NVIDIA GeForce GT 720M
Intel HD Graphics 630
...
max:
» The benchmarks indicate that the game is not playable in the tested settings.
AMD Radeon R5 (Beema/Carrizo-L)
AMD Radeon R7 M360
Intel HD Graphics 530
NVIDIA GeForce GT 720M
Intel Iris Plus Graphics 650
...
max:
NVIDIA GeForce GTX 1080 (Desktop)
AMD Radeon R5 (Beema/Carrizo-L)
AMD Radeon R7 M360
NVIDIA GeForce GT 720M
NVIDIA GeForce 940M
AMD Radeon R7 M445
...
max:
NVIDIA Titan RTX
» The benchmarks indicate that the game is not playable in the tested settings.
AMD Radeon R5 (Beema/Carrizo-L)
Intel HD Graphics 4400
Intel HD Graphics 510
NVIDIA GeForce GT 720M
AMD Radeon R5 (Bristol Ridge)
AMD Radeon HD 8650G
Intel HD Graphics 520
...
max:
NVIDIA Titan X Pascal
Intel HD Graphics 4400
AMD Radeon R5 (Beema/Carrizo-L)
Intel HD Graphics 510
NVIDIA GeForce GT 720M
AMD Radeon HD 8650G
AMD Radeon R5 (Bristol Ridge)
Intel HD Graphics 520
...
max:
NVIDIA Titan X Pascal
» The benchmarks indicate that the game is not playable in the tested settings.
Intel HD Graphics (Cherry Trail)
AMD Radeon R4 (Stoney Ridge)
Intel HD Graphics (Haswell)
AMD Radeon R5 (Beema/Carrizo-L)
AMD Radeon R2 (Stoney Ridge)
Intel HD Graphics 515
Intel HD Graphics 4400
AMD Radeon R5 (Bristol Ridge)
...
NVIDIA Quadro P2000
...
Intel HD Graphics (Haswell)
Intel HD Graphics 515
AMD Radeon R4 (Stoney Ridge)
AMD Radeon R2 (Stoney Ridge)
Intel HD Graphics 4400
AMD Radeon R5 (Beema/Carrizo-L)
AMD Radeon R5 (Bristol Ridge)
Intel HD Graphics 510
AMD Radeon R7 M445
...
NVIDIA Quadro P2000
» With all tested laptops playable in detail settings low.
AMD Radeon R4 (Stoney Ridge)
AMD Radeon R5 (Beema/Carrizo-L)
Intel HD Graphics 4400
Intel HD Graphics (Haswell)
AMD Radeon R5 (Bristol Ridge)
AMD Radeon HD 8650G
...
NVIDIA Quadro P3200
max:
NVIDIA GeForce GTX 1080 (Desktop)
Intel HD Graphics 4400
AMD Radeon R5 (Beema/Carrizo-L)
AMD Radeon R5 (Bristol Ridge)
AMD Radeon HD 8650G
Intel HD Graphics 520
NVIDIA GeForce GT 720M
...
max:
» The benchmarks indicate that the game is not playable in the tested settings.
...
Intel UHD Graphics 605
AMD Radeon R5 (Beema/Carrizo-L)
Intel HD Graphics 530
Intel UHD Graphics G1 (Ice Lake 32 EU)
Intel HD Graphics 4400
Intel HD Graphics 515
AMD Radeon R2 (Stoney Ridge)
Intel HD Graphics 510
AMD Radeon HD 8650G
...
Intel UHD Graphics 605
AMD Radeon R5 (Beema/Carrizo-L)
Intel HD Graphics 530
Intel HD Graphics 4400
AMD Radeon R2 (Stoney Ridge)
Intel HD Graphics 510
Intel HD Graphics 520
...
» The benchmarks indicate that the game is not playable in the tested settings.
AMD Radeon R5 (Beema/Carrizo-L)
Intel HD Graphics 4400
AMD Radeon R4 (Stoney Ridge)
NVIDIA GeForce GT 720M
Intel HD Graphics 515
Intel HD Graphics 520
NVIDIA GeForce 920M
...
NVIDIA Quadro P4000 Max-Q
max:
AMD Radeon R5 (Beema/Carrizo-L)
Intel HD Graphics 520
AMD Radeon R6 (Carrizo)
Intel HD Graphics 515
NVIDIA GeForce 920M
AMD Radeon R7 M360
...
NVIDIA Quadro P4000 Max-Q
max:
» The benchmarks indicate that the game is not playable in the tested settings.
AMD Radeon R5 (Beema/Carrizo-L)
Intel HD Graphics 515
Intel HD Graphics (Haswell)
AMD Radeon HD 8650G
Intel HD Graphics 4400
...
max:
» The benchmarks indicate that the game is not playable in the tested settings.
Intel UHD Graphics 605
AMD Radeon R2 (Stoney Ridge)
Intel HD Graphics 515
AMD Radeon R5 (Beema/Carrizo-L)
AMD Radeon R4 (Stoney Ridge)
Intel UHD Graphics 610
Intel HD Graphics (Haswell)
AMD Radeon R6 (Carrizo)
Intel UHD Graphics 615
...
Intel UHD Graphics 605
Intel HD Graphics 515
AMD Radeon R2 (Stoney Ridge)
Intel HD Graphics (Haswell)
AMD Radeon R4 (Stoney Ridge)
AMD Radeon R5 (Beema/Carrizo-L)
Intel UHD Graphics 610
Intel HD Graphics 4400
Intel UHD Graphics 615
Intel HD Graphics 520
...
» The benchmarks indicate that the game is not playable in the tested settings.
AMD Radeon R5 (Beema/Carrizo-L)
AMD Radeon RX Vega 6 (Ryzen 2000/3000)
AMD Radeon R6 (Carrizo)
AMD Radeon HD 8650G
NVIDIA GeForce 920M
AMD Radeon R7 M340
Intel HD Graphics 520
...
NVIDIA GeForce GTX 980 (Laptop)
» The benchmarks indicate that the game is not playable in the tested settings.
Intel HD Graphics (Haswell)
AMD Radeon R6 (Carrizo)
AMD Radeon R5 (Beema/Carrizo-L)
Intel HD Graphics 4400
AMD Radeon R5 (Bristol Ridge)
Intel HD Graphics 515
NVIDIA GeForce GT 720M
...
NVIDIA GeForce GTX 980 (Laptop)
AMD Radeon R6 (Carrizo)
AMD Radeon R5 (Beema/Carrizo-L)
Intel HD Graphics 4400
AMD Radeon R5 (Bristol Ridge)
Intel HD Graphics 515
AMD Radeon R5 M330
NVIDIA GeForce GT 720M
Intel HD Graphics 520
Intel Iris Graphics 540
AMD Radeon R7 M360
...
NVIDIA GeForce GTX 980 (Laptop)
» The benchmarks indicate that the game is not playable in the tested settings.
Intel HD Graphics (Haswell)
Intel HD Graphics 515
AMD Radeon R8 M365DX
AMD Radeon R5 (Beema/Carrizo-L)
NVIDIA GeForce GT 720M
Intel HD Graphics 510
AMD Radeon HD 8650G
AMD Radeon R6 (Carrizo)
Intel HD Graphics 4400
...
NVIDIA GeForce GTX 1080 Mobile
max:
AMD Radeon R5 (Beema/Carrizo-L)
Intel HD Graphics 510
Intel HD Graphics 4400
AMD Radeon R6 (Carrizo)
Intel HD Graphics 515
AMD Radeon R8 M365DX
...
NVIDIA GeForce GTX 1080 Mobile
max:
» The benchmarks indicate that the game is not playable in the tested settings.
Intel HD Graphics (Haswell)
AMD Radeon R5 (Beema/Carrizo-L)
Intel HD Graphics 515
Intel HD Graphics 4400
AMD Radeon R5 (Bristol Ridge)
AMD Radeon R6 (Carrizo)
Intel HD Graphics 520
...
NVIDIA GeForce GTX 1080 Mobile
AMD Radeon R5 (Beema/Carrizo-L)
NVIDIA GeForce GT 720M
AMD Radeon R8 M365DX
Intel HD Graphics 520
AMD Radeon R6 (Carrizo)
Intel HD Graphics 5600
NVIDIA GeForce 910M
AMD Radeon R5 (Bristol Ridge)
...
NVIDIA GeForce GTX 1080 Mobile
max:
NVIDIA GeForce GTX 1080 (Desktop)
» The benchmarks indicate that the game is not playable in the tested settings.
Intel HD Graphics 4200
AMD Radeon R5 (Beema/Carrizo-L)
Intel HD Graphics 515
AMD Radeon R6 (Carrizo)
Intel HD Graphics 4400
NVIDIA GeForce 910M
Intel HD Graphics 520
...
NVIDIA GeForce GTX 980 (Laptop)
AMD Radeon R5 (Beema/Carrizo-L)
AMD Radeon R6 (Carrizo)
Intel HD Graphics 515
AMD Radeon R6 M340DX
NVIDIA GeForce GT 720M
Intel HD Graphics 520
AMD Radeon R5 M330
AMD Radeon R5 (Bristol Ridge)
...
» The benchmarks indicate that the game is not playable in the tested settings.
Intel UHD Graphics 605
Intel HD Graphics 515
Intel HD Graphics (Haswell)
Intel Iris Plus Graphics G4 (Ice Lake 48 EU)
AMD Radeon R5 (Beema/Carrizo-L)
Intel HD Graphics 510
Intel HD Graphics 4200
Intel UHD Graphics 615
AMD Radeon HD 8650G
Intel HD Graphics 4400
...
NVIDIA Quadro P5200
max:
Intel HD Graphics 515
Intel HD Graphics (Haswell)
Intel HD Graphics 4200
AMD Radeon HD 8650G
AMD Radeon R5 (Beema/Carrizo-L)
Intel HD Graphics 510
Intel HD Graphics 4400
Intel UHD Graphics 615
AMD Radeon R6 (Carrizo)
NVIDIA GeForce 910M
...
NVIDIA Quadro P5200
max:
» The benchmarks indicate that the game is not playable in the tested settings.
...
Intel UHD Graphics 600
Intel HD Graphics 4200
Intel HD Graphics 4400
AMD Radeon R2 (Stoney Ridge)
Intel UHD Graphics 610
AMD Radeon R5 (Beema/Carrizo-L)
Intel HD Graphics 510
Intel HD Graphics 515
AMD Radeon HD 8650G
Intel UHD Graphics 615
...
max:
...
Intel HD Graphics (Haswell)
Intel HD Graphics 4200
Intel UHD Graphics 600
Intel HD Graphics 4400
AMD Radeon R2 (Stoney Ridge)
AMD Radeon R5 (Beema/Carrizo-L)
Intel UHD Graphics 610
Intel HD Graphics 515
Intel HD Graphics 510
AMD Radeon HD 8650G
...
max:
» The benchmarks indicate that the game is not playable in the tested settings.
AMD Radeon R5 (Beema/Carrizo-L)
Intel HD Graphics (Haswell)
Intel HD Graphics 4200
AMD Radeon HD 8650G
Intel HD Graphics 515
AMD Radeon R5 (Bristol Ridge)
AMD Radeon R7 (Carrizo)
AMD Radeon R6 (Carrizo)
...
NVIDIA GeForce GTX 980 (Laptop)
max:
NVIDIA Titan X Pascal
Intel HD Graphics 515
AMD Radeon R5 (Beema/Carrizo-L)
Intel HD Graphics 4200
AMD Radeon R5 (Bristol Ridge)
AMD Radeon R7 (Carrizo)
AMD Radeon R6 (Carrizo)
...
NVIDIA GeForce GTX 980 (Laptop)
max:
NVIDIA GeForce GTX 1080 (Desktop)
» The benchmarks indicate that the game is not playable in the tested settings.
Intel HD Graphics (Cherry Trail)
Intel HD Graphics (Broadwell)
AMD Radeon R5 (Beema/Carrizo-L)
Intel HD Graphics 515
Intel HD Graphics 4200
AMD Radeon R6 (Carrizo)
AMD Radeon R7 (Carrizo)
AMD Radeon HD 8650G
AMD Radeon R5 (Bristol Ridge)
NVIDIA GeForce 910M
...
NVIDIA GeForce GTX 980 (Laptop)
Intel HD Graphics (Cherry Trail)
Intel HD Graphics (Broadwell)
Intel HD Graphics 515
AMD Radeon R5 (Beema/Carrizo-L)
Intel HD Graphics 4200
AMD Radeon R5 (Bristol Ridge)
Intel HD Graphics 4400
AMD Radeon R6 (Carrizo)
NVIDIA GeForce GT 720M
Intel HD Graphics 520
AMD Radeon R7 M340
...
NVIDIA GeForce GTX 980 (Laptop)
max:
NVIDIA GeForce GTX 1080 (Desktop)
» The benchmarks indicate that the game is not playable in the tested settings.
AMD Radeon R5 (Beema/Carrizo-L)
Intel HD Graphics 520
AMD Radeon R7 (Carrizo)
Intel HD Graphics 5600
AMD Radeon R6 (Carrizo)
AMD Radeon R7 M360
...
NVIDIA Quadro P5200
AMD Radeon R5 (Beema/Carrizo-L)
Intel Iris Graphics 550
Intel HD Graphics 520
AMD Radeon R6 (Carrizo)
AMD Radeon R7 (Carrizo)
NVIDIA GeForce GT 720M
AMD Radeon R6 M340DX
...
NVIDIA Quadro P5200
» The benchmarks indicate that the game is not playable in the tested settings.
Intel HD Graphics 515
Intel HD Graphics 4200
AMD Radeon R5 (Beema/Carrizo-L)
AMD Radeon R6 (Carrizo)
Intel HD Graphics 520
Intel HD Graphics 4400
AMD Radeon R7 (Carrizo)
NVIDIA GeForce GT 720M
AMD Radeon R7 M360
...
max:
NVIDIA GeForce GTX 1060 (Desktop)
AMD Radeon R5 (Beema/Carrizo-L)
Intel HD Graphics 4200
Intel HD Graphics 520
Intel HD Graphics 4400
NVIDIA GeForce GT 720M
AMD Radeon R6 (Carrizo)
AMD Radeon R7 (Carrizo)
...
max:
NVIDIA GeForce GTX 1060 (Desktop)
» The benchmarks indicate that the game is not playable in the tested settings.
Intel HD Graphics (Cherry Trail)
Intel HD Graphics 530
Intel HD Graphics 515
AMD Radeon R5 (Beema/Carrizo-L)
AMD Radeon R5 (Bristol Ridge)
Intel HD Graphics 4200
Intel HD Graphics 510
Intel HD Graphics 520
Intel HD Graphics 4400
NVIDIA GeForce 910M
AMD Radeon R7 (Carrizo)
...
NVIDIA Quadro M5000M
Intel HD Graphics (Cherry Trail)
Intel HD Graphics 530
Intel HD Graphics 4200
AMD Radeon R5 (Beema/Carrizo-L)
Intel HD Graphics 4400
Intel HD Graphics 515
Intel HD Graphics 520
Intel Iris Pro Graphics 5200
AMD Radeon R5 (Bristol Ridge)
Intel HD Graphics 510
NVIDIA GeForce 910M
...
NVIDIA Quadro M5000M
» The benchmarks indicate that the game is not playable in the tested settings.
AMD Radeon R5 (Beema/Carrizo-L)
Intel HD Graphics (Broadwell)
Intel HD Graphics 515
AMD Radeon R7 (Carrizo)
Intel HD Graphics 520
AMD Radeon R8 M365DX
AMD Radeon R6 (Carrizo)
Intel HD Graphics 4400
...
max:
NVIDIA GeForce GTX 1060 (Desktop)
Intel HD Graphics (Broadwell)
AMD Radeon R5 (Beema/Carrizo-L)
Intel HD Graphics 4400
Intel HD Graphics 520
AMD Radeon R6 (Carrizo)
AMD Radeon R5 M330
...
max:
NVIDIA GeForce GTX 1060 (Desktop)
» The benchmarks indicate that the game is not playable in the tested settings.
Intel HD Graphics (Bay Trail)
...
Intel UHD Graphics 600
Intel UHD Graphics 605
AMD Radeon HD 8330
AMD Radeon R2 (Stoney Ridge)
AMD Radeon R5 (Beema/Carrizo-L)
AMD Radeon HD 8400
Intel HD Graphics (Broadwell)
AMD Radeon R4 (Stoney Ridge)
NVIDIA GeForce 910M
Intel HD Graphics 515
Intel HD Graphics 4200
NVIDIA GeForce GT 720M
...
max:
NVIDIA GeForce GTX 1080 (Desktop)
...
AMD Radeon HD 8330
AMD Radeon HD 8400
AMD Radeon R2 (Stoney Ridge)
AMD Radeon R5 (Beema/Carrizo-L)
Intel HD Graphics (Broadwell)
AMD Radeon R4 (Stoney Ridge)
Intel HD Graphics (Haswell)
Intel HD Graphics 4200
NVIDIA GeForce GT 720M
Intel HD Graphics 515
NVIDIA GeForce 910M
...
max:
NVIDIA GeForce GTX 1080 (Desktop)
» The benchmarks indicate that the game is not playable in the tested settings.
Intel HD Graphics (Bay Trail)
...
Intel UHD Graphics 605
AMD Radeon R2 (Stoney Ridge)
Intel HD Graphics 515
AMD Radeon R4 (Stoney Ridge)
AMD Radeon HD 8350G
AMD Radeon R5 (Beema/Carrizo-L)
Intel HD Graphics 4200
Intel HD Graphics 5600
Intel HD Graphics 4400
Intel Iris Graphics 5100
...
Intel HD Graphics (Braswell)
...
Intel HD Graphics (Cherry Trail)
Intel HD Graphics 515
Intel UHD Graphics 605
AMD Radeon R4 (Stoney Ridge)
AMD Radeon R5 (Beema/Carrizo-L)
Intel HD Graphics 4200
Intel HD Graphics 5600
AMD Radeon HD 8350G
Intel HD Graphics 4400
...
» The benchmarks indicate that the game is not playable in the tested settings.
Intel HD Graphics (Cherry Trail)
Intel UHD Graphics (Elkhart Lake 16 EU)
Intel HD Graphics (Bay Trail)
AMD Radeon R5 (Beema/Carrizo-L)
AMD Radeon HD 8330
AMD Radeon R6 (Carrizo)
AMD Radeon R2 (Stoney Ridge)
AMD Radeon HD 8350G
AMD Radeon R4 (Stoney Ridge)
Intel UHD Graphics 600
...
max:
...
Intel UHD Graphics 600
Intel HD Graphics (Cherry Trail)
AMD Radeon R2 (Stoney Ridge)
AMD Radeon R4 (Stoney Ridge)
AMD Radeon HD 8400
AMD Radeon R5 (Beema/Carrizo-L)
AMD Radeon HD 8350G
AMD Radeon R5 (Bristol Ridge)
Intel UHD Graphics 615
...
max:
NVIDIA GeForce RTX 3070 Ti
» The benchmarks indicate that the game is not playable in the tested settings.
AMD Radeon R5 (Beema/Carrizo-L)
AMD Radeon R6 (Carrizo)
NVIDIA GeForce GT 640M
Intel HD Graphics 5600
Intel HD Graphics 530
...
AMD Radeon R5 (Beema/Carrizo-L)
AMD Radeon R6 (Carrizo)
Intel HD Graphics 5600
AMD Radeon R5 M240
NVIDIA GeForce GT 640M
NVIDIA GeForce GT 720M
...
» The benchmarks indicate that the game is not playable in the tested settings.
Intel HD Graphics 515
Intel HD Graphics 4200
Intel HD Graphics (Haswell)
AMD Radeon R5 (Beema/Carrizo-L)
AMD Radeon R9 M375
Intel UHD Graphics 610
Intel UHD Graphics 615
Intel HD Graphics 4400
Intel HD Graphics 520
...
max:
Intel HD Graphics 4200
Intel HD Graphics (Haswell)
Intel UHD Graphics 615
AMD Radeon R5 (Beema/Carrizo-L)
Intel HD Graphics 4400
Intel HD Graphics 515
Intel HD Graphics 520
Intel UHD Graphics 610
Intel HD Graphics 530
NVIDIA GeForce GT 720M
...
max:
» The benchmarks indicate that the game is not playable in the tested settings.
Intel HD Graphics (Cherry Trail)
Intel HD Graphics (Bay Trail)
AMD Radeon R2 (Stoney Ridge)
Intel HD Graphics (Braswell)
AMD Radeon R5 (Beema/Carrizo-L)
Intel UHD Graphics 605
Intel UHD Graphics 600
NVIDIA GeForce 910M
AMD Radeon HD 8330
AMD Radeon R4 (Stoney Ridge)
...
Intel HD Graphics (Braswell)
...
AMD Radeon R2 (Stoney Ridge)
Intel HD Graphics (Broadwell)
AMD Radeon HD 8330
Intel HD Graphics 515
Intel HD Graphics 4200
AMD Radeon R5 (Beema/Carrizo-L)
AMD Radeon R4 (Stoney Ridge)
AMD Radeon HD 8350G
Intel HD Graphics 510
Intel HD Graphics 4400
AMD Radeon R5 (Bristol Ridge)
...
AMD FirePro W7170M
max:
NVIDIA GeForce GTX 1060 (Desktop)
» With most tested laptops playable in detail settings low.
...
Intel UHD Graphics 615
Intel HD Graphics 5000
Intel Iris Graphics 5100
AMD Radeon HD 8650G
Intel HD Graphics 4400
Intel UHD Graphics 610
AMD Radeon R5 (Beema/Carrizo-L)
Qualcomm Adreno 690
Intel HD Graphics 510
AMD Radeon R6 (Carrizo)
...
max:
...
Intel UHD Graphics 605
Intel UHD Graphics 600
Intel HD Graphics 5000
AMD Radeon HD 8650G
Intel UHD Graphics 615
Intel HD Graphics 4400
AMD Radeon R5 (Beema/Carrizo-L)
Intel UHD Graphics 610
Intel Iris Graphics 5100
Intel HD Graphics 510
Intel HD Graphics 520
...
max:
» The benchmarks indicate that the game is not playable in the tested settings.
AMD Radeon R2 (Stoney Ridge)
...
Intel HD Graphics 5000
AMD Radeon R5 (Bristol Ridge)
Intel HD Graphics (Broadwell)
Intel HD Graphics 515
AMD Radeon R5 (Beema/Carrizo-L)
AMD Radeon R8 M365DX
Intel HD Graphics 4400
AMD Radeon HD 8650G
NVIDIA GeForce GT 720M
Intel HD Graphics 510
Intel Iris Graphics 5100
...
AMD Radeon R2 (Stoney Ridge)
...
Intel HD Graphics (Haswell)
AMD Radeon HD 8350G
AMD Radeon R4 (Stoney Ridge)
AMD Radeon R5 (Bristol Ridge)
Intel HD Graphics 5000
Intel HD Graphics (Broadwell)
AMD Radeon R5 (Beema/Carrizo-L)
Intel HD Graphics 515
AMD Radeon R8 M365DX
Intel HD Graphics 4400
AMD Radeon HD 8650G
...
» The benchmarks indicate that the game is not playable in the tested settings.
Intel HD Graphics (Bay Trail)
Intel HD Graphics (Braswell)
Intel HD Graphics (Haswell)
AMD Radeon HD 8330
Intel HD Graphics 520
Intel HD Graphics 5000
AMD Radeon R5 (Beema/Carrizo-L)
Intel HD Graphics 4400
Intel HD Graphics 530
AMD Radeon HD 8650G
NVIDIA GeForce GT 720M
Intel HD Graphics 5600
...
Intel HD Graphics (Bay Trail)
Intel HD Graphics (Braswell)
Intel HD Graphics (Haswell)
AMD Radeon HD 8330
Intel HD Graphics 520
AMD Radeon R5 (Beema/Carrizo-L)
Intel HD Graphics 5000
Intel HD Graphics 4400
Intel HD Graphics 530
Intel HD Graphics 5600
NVIDIA GeForce GT 720M
...
» The benchmarks indicate that the game is not playable in the tested settings.
...
Intel HD Graphics 4200
Intel HD Graphics 515
Intel HD Graphics (Broadwell)
AMD Radeon R4 (Stoney Ridge)
Intel HD Graphics 4400
AMD Radeon R5 (Beema/Carrizo-L)
AMD Radeon R6 (Carrizo)
Intel HD Graphics 5000
AMD Radeon R7 (Carrizo)
AMD Radeon R7 M340
...
max:
NVIDIA GeForce GTX 1080 (Desktop)
...
Intel HD Graphics 4200
AMD Radeon R7 (Carrizo)
Intel HD Graphics 4400
Intel HD Graphics 515
Intel HD Graphics (Broadwell)
AMD Radeon R4 (Stoney Ridge)
AMD Radeon R5 (Beema/Carrizo-L)
AMD Radeon R6 M255DX
AMD Radeon R7 M340
Intel HD Graphics 520
AMD Radeon R6 (Carrizo)
...
max:
NVIDIA GeForce GTX 1060 (Desktop)
» The benchmarks indicate that the game is not playable in the tested settings.
Intel HD Graphics (Bay Trail)
Intel HD Graphics (Braswell)
Intel HD Graphics 4200
AMD Radeon HD 8330
Intel HD Graphics 4400
AMD Radeon R5 (Beema/Carrizo-L)
Intel HD Graphics 5000
Intel HD Graphics 530
Intel HD Graphics 5600
AMD Radeon HD 8650G
...
Intel HD Graphics (Bay Trail)
Intel HD Graphics (Braswell)
AMD Radeon HD 8330
Intel HD Graphics 4400
Intel HD Graphics 5000
AMD Radeon R5 (Beema/Carrizo-L)
Intel HD Graphics 530
Intel HD Graphics 5600
AMD Radeon R5 M330
AMD Radeon HD 8650G
NVIDIA GeForce GT 720M
...
» The benchmarks indicate that the game is not playable in the tested settings.
Intel HD Graphics (Braswell)
...
Intel HD Graphics 4400
AMD Radeon HD 8350G
AMD Radeon R7 M260
AMD Radeon R8 M365DX
AMD Radeon R5 (Beema/Carrizo-L)
Intel Iris Graphics 5100
AMD Radeon R6 (Carrizo)
AMD Radeon R5 M240
AMD Radeon R6 M255DX
AMD Radeon R7 M360
...
max:
Intel HD Graphics (Braswell)
Intel HD Graphics 4200
Intel HD Graphics (Bay Trail)
Intel HD Graphics (Cherry Trail)
AMD Radeon HD 8350G
Intel HD Graphics 4400
AMD Radeon R5 (Beema/Carrizo-L)
Intel HD Graphics 5000
AMD Radeon R6 M255DX
AMD Radeon R5 M230
Intel Iris Graphics 5100
AMD Radeon HD 8650G
...
» The benchmarks indicate that the game is not playable in the tested settings.
Intel HD Graphics (Braswell)
...
AMD Radeon HD 8330
AMD Radeon R4 (Stoney Ridge)
Intel UHD Graphics 605
AMD Radeon HD 8350G
Intel HD Graphics (Haswell)
AMD Radeon HD 8610G
AMD Radeon R5 (Beema/Carrizo-L)
AMD Radeon R6 M255DX
AMD Radeon R8 M365DX
NVIDIA GeForce 910M
Intel HD Graphics 515
...
max:
...
AMD Radeon R2 (Stoney Ridge)
AMD Radeon HD 8330
Intel UHD Graphics 605
Intel HD Graphics (Haswell)
AMD Radeon HD 8350G
AMD Radeon HD 8610G
Intel HD Graphics (Broadwell)
AMD Radeon R5 (Beema/Carrizo-L)
AMD Radeon R4 (Stoney Ridge)
Intel HD Graphics 515
Intel HD Graphics 4400
AMD Radeon R6 M255DX
Intel Iris Graphics 5100
...
...
Intel UHD Graphics 605
Intel HD Graphics 515
AMD Radeon HD 8610G
AMD Radeon HD 8350G
Intel HD Graphics 4400
Intel Iris Graphics 5100
AMD Radeon R5 (Beema/Carrizo-L)
AMD Radeon R5 M330
Intel HD Graphics 5000
AMD Radeon R6 M255DX
Intel HD Graphics 520
NVIDIA GeForce 910M
...
» The benchmarks indicate that the game is not playable in the tested settings.
Intel HD Graphics (Bay Trail)
Intel HD Graphics 4200
Intel Iris Graphics 5100
AMD Radeon HD 8350G
AMD Radeon R5 (Beema/Carrizo-L)
Intel HD Graphics 5000
AMD Radeon R5 M230
AMD Radeon HD 8650G
NVIDIA GeForce GT 720M
...
Intel HD Graphics (Bay Trail)
Intel Iris Graphics 5100
AMD Radeon R5 (Beema/Carrizo-L)
AMD Radeon R5 M230
Intel HD Graphics 4400
Intel HD Graphics 5000
NVIDIA GeForce GT 720M
...
» The benchmarks indicate that the game is not playable in the tested settings.
Intel HD Graphics (Bay Trail)
Intel HD Graphics 4200
AMD Radeon HD 8330
Intel HD Graphics (Haswell)
AMD Radeon R5 (Beema/Carrizo-L)
Intel HD Graphics 4400
AMD Radeon R6 M255DX
Intel HD Graphics 5000
NVIDIA GeForce GT 720M
Intel Iris Graphics 5100
...
NVIDIA Quadro M5000M
Intel HD Graphics (Bay Trail)
Intel HD Graphics 4200
Intel HD Graphics (Haswell)
AMD Radeon HD 8330
AMD Radeon R5 (Beema/Carrizo-L)
AMD Radeon R6 M255DX
Intel HD Graphics 4400
Intel HD Graphics 5000
NVIDIA GeForce GT 720M
...
NVIDIA Quadro M5000M
» The benchmarks indicate that the game is not playable in the tested settings.
Intel HD Graphics (Bay Trail)
...
Intel HD Graphics 4200
Intel HD Graphics (Braswell)
AMD Radeon HD 8330
Intel UHD Graphics 605
AMD Radeon R2 (Stoney Ridge)
AMD Radeon R5 (Beema/Carrizo-L)
Intel HD Graphics (Haswell)
AMD Radeon HD 8350G
AMD Radeon R7 M260
AMD Radeon R5 M330
AMD Radeon RX Vega 6 (Ryzen 2000/3000)
...
max:
NVIDIA GeForce GTX 1060 (Desktop)
Intel HD Graphics (Bay Trail)
Intel HD Graphics (Braswell)
Intel HD Graphics 4200
AMD Radeon HD 8330
AMD Radeon R2 (Stoney Ridge)
Intel HD Graphics (Haswell)
AMD Radeon R5 (Beema/Carrizo-L)
Intel UHD Graphics 605
AMD Radeon R5 M330
AMD Radeon HD 8350G
...
max:
NVIDIA GeForce GTX 1060 (Desktop)
» The benchmarks indicate that the game is not playable in the tested settings.
Intel HD Graphics (Bay Trail)
...
Intel HD Graphics 4200
AMD Radeon HD 8330
Intel HD Graphics (Haswell)
Intel UHD Graphics 605
AMD Radeon R5 (Beema/Carrizo-L)
AMD Radeon HD 8650G
Intel HD Graphics 4400
AMD Radeon HD 8350G
AMD Radeon R4 (Stoney Ridge)
AMD Radeon R5 M230
AMD FirePro W4190M
...
Intel HD Graphics (Bay Trail)
AMD Radeon HD 8330
Intel HD Graphics (Haswell)
Intel HD Graphics 4200
Intel UHD Graphics 605
AMD Radeon R5 (Beema/Carrizo-L)
Intel HD Graphics 4400
AMD Radeon R4 (Stoney Ridge)
Intel HD Graphics 5000
AMD Radeon R5 M230
...
AMD Radeon R5 (Beema/Carrizo-L)
Intel HD Graphics 4400
AMD Radeon R5 M230
Intel HD Graphics 5000
AMD Radeon R5 M335
NVIDIA GeForce GT 720M
...
» The benchmarks indicate that the game is not playable in the tested settings.
...
Intel HD Graphics (Bay Trail)
AMD Radeon R4 (Kaveri)
AMD Radeon R8 M365DX
Intel HD Graphics 4200
Intel HD Graphics (Cherry Trail)
Intel HD Graphics (Haswell)
AMD Radeon HD 8330
AMD Radeon R5 (Beema/Carrizo-L)
AMD Radeon HD 8400
AMD Radeon HD 8350G
Intel HD Graphics 4400
AMD Radeon R6 M255DX
Intel HD Graphics 5000
...
...
Intel HD Graphics 4200
Intel HD Graphics (Haswell)
AMD Radeon HD 8330
AMD Radeon HD 8400
AMD Radeon R8 M365DX
AMD Radeon R5 (Beema/Carrizo-L)
Intel HD Graphics 4400
AMD Radeon R5 M230
Intel HD Graphics 5000
AMD Radeon R6 M255DX
Intel HD Graphics 515
...
max:
NVIDIA GeForce GTX 970
» The benchmarks indicate that the game is not playable in the tested settings.
Intel HD Graphics (Bay Trail)
AMD Radeon HD 8330
AMD Radeon R9 M280X
AMD Radeon R5 (Beema/Carrizo-L)
AMD Radeon R4 (Kaveri)
Intel HD Graphics (Braswell)
AMD Radeon HD 8400
Intel HD Graphics (Cherry Trail)
...
max:
Intel HD Graphics (Bay Trail)
...
Intel HD Graphics (Braswell)
AMD Radeon R2 (Stoney Ridge)
AMD Radeon HD 8400
Intel UHD Graphics 605
Intel HD Graphics 4200
AMD Radeon R5 (Beema/Carrizo-L)
AMD Radeon R7 M260
Intel HD Graphics (Haswell)
Intel HD Graphics (Broadwell)
AMD Radeon HD 8350G
AMD Radeon R4 (Stoney Ridge)
Intel HD Graphics 4400
Intel HD Graphics 510
...
max:
NVIDIA GeForce GTX 1060 (Desktop)
» With all tested laptops playable in detail settings low.
...
AMD Radeon R5 M330
AMD Radeon R6 M255DX
NVIDIA GeForce GT 720M
AMD Radeon R5 M240
AMD Radeon R7 M260
Intel HD Graphics 5000
AMD Radeon R5 (Beema/Carrizo-L)
AMD Radeon R5 M230
NVIDIA GeForce GTX 960M
AMD Radeon R7 M360
AMD Radeon RX Vega 8 (Ryzen 2000/3000)
...
...
Intel HD Graphics (Haswell)
AMD Radeon HD 8610G
Intel HD Graphics 4200
AMD Radeon HD 8350G
AMD Radeon R5 (Beema/Carrizo-L)
AMD Radeon HD 8450G
Intel HD Graphics 4400
AMD Radeon R6 M255DX
AMD Radeon R5 M330
Intel HD Graphics 520
AMD Radeon R5 M230
...
NVIDIA GeForce GTX 780M
max:
AMD Radeon R5 (Beema/Carrizo-L)
Intel HD Graphics 520
AMD Radeon HD 8610G
Intel HD Graphics 5000
...
max:
AMD Radeon R5 (Beema/Carrizo-L)
Intel HD Graphics 5000
AMD Radeon R7 M360
Intel Iris Graphics 5100
...
NVIDIA GeForce GTX 1080 Mobile
» The benchmarks indicate that the game is not playable in the tested settings.
...
AMD Radeon R4 (Stoney Ridge)
AMD Radeon HD 8350G
Intel HD Graphics 4200
Intel HD Graphics (Broadwell)
AMD Radeon HD 8450G
AMD Radeon HD 8330
Intel HD Graphics (Haswell)
Intel UHD Graphics 605
AMD Radeon R5 (Beema/Carrizo-L)
AMD Radeon HD 8610G
AMD Radeon R6 M255DX
Intel UHD Graphics 600
AMD Radeon HD 8400
AMD Radeon R8 M365DX
...
Intel HD Graphics (Bay Trail)
...
Intel UHD Graphics 605
AMD Radeon R2 (Stoney Ridge)
Intel UHD Graphics 600
Intel HD Graphics 4200
Intel HD Graphics (Haswell)
AMD Radeon R5 (Beema/Carrizo-L)
AMD Radeon HD 8330
AMD Radeon HD 8610G
AMD Radeon HD 8400
Intel HD Graphics (Broadwell)
AMD Radeon HD 8350G
...
AMD Radeon R5 (Beema/Carrizo-L)
Intel UHD Graphics 605
AMD Radeon HD 8330
Intel UHD Graphics 600
AMD Radeon HD 8400
AMD Radeon HD 8610G
AMD Radeon HD 8350G
...
max:
NVIDIA GeForce GTX 970
AMD Radeon R5 (Beema/Carrizo-L)
AMD Radeon R5 M230
Intel HD Graphics 4400
NVIDIA GeForce GT 720M
Intel HD Graphics 5600
AMD Radeon R6 (Carrizo)
...
max:
NVIDIA GeForce GTX 1060 (Desktop)
» With all tested laptops playable in detail settings low.
Intel HD Graphics (Haswell)
Intel HD Graphics (Bay Trail)
AMD Radeon R5 (Beema/Carrizo-L)
Intel HD Graphics 4200
AMD Radeon HD 8350G
AMD Radeon HD 8450G
Intel HD Graphics 4400
...
NVIDIA GeForce GTX 980 (Laptop)
max:
NVIDIA GeForce GTX 1060 (Desktop)
Intel HD Graphics (Bay Trail)
Intel HD Graphics 4200
AMD Radeon R5 (Beema/Carrizo-L)
Intel HD Graphics 4400
AMD Radeon R5 M230
Intel HD Graphics 5000
Intel HD Graphics 530
AMD Radeon HD 8550G
...
NVIDIA GeForce GTX 980 (Laptop)
max:
NVIDIA GeForce GTX 1060 (Desktop)
AMD Radeon R5 (Beema/Carrizo-L)
Intel HD Graphics 4400
Intel Iris Pro Graphics 5200
NVIDIA GeForce GT 640M
Intel HD Graphics 5600
...
NVIDIA GeForce GTX 980 (Laptop)
max:
NVIDIA GeForce GTX 1060 (Desktop)
AMD Radeon R5 (Beema/Carrizo-L)
AMD Radeon R5 M230
AMD Radeon R7 M360
Intel HD Graphics 5600
NVIDIA GeForce 920M
Intel HD Graphics 530
NVIDIA GeForce 940M
...
NVIDIA GeForce GTX 1080 Mobile
» The benchmarks indicate that the game is not playable in the tested settings.
Intel HD Graphics (Bay Trail)
AMD Radeon HD 8330
AMD Radeon HD 8400
AMD Radeon R5 (Beema/Carrizo-L)
Intel HD Graphics (Haswell)
AMD Radeon R6 M255DX
AMD Radeon HD 8350G
Intel HD Graphics 4400
Intel Iris Graphics 5100
Intel HD Graphics 5000
Intel HD Graphics 4200
AMD Radeon HD 8450G
...
Intel HD Graphics (Bay Trail)
Intel HD Graphics (Haswell)
AMD Radeon R5 (Beema/Carrizo-L)
AMD Radeon R5 M230
Intel HD Graphics 4400
Intel HD Graphics 4200
Intel HD Graphics 5000
AMD Radeon R6 M255DX
AMD Radeon HD 8350G
Intel Iris Graphics 5100
...
AMD Radeon HD 8350G
AMD Radeon R5 (Beema/Carrizo-L)
AMD Radeon R5 M230
Intel HD Graphics 5000
AMD Radeon HD 8450G
Intel Iris Graphics 5100
AMD Radeon R6 M255DX
...
AMD Radeon R5 (Beema/Carrizo-L)
NVIDIA GeForce GT 750M
NVIDIA GeForce GTX 860M
NVIDIA GeForce GTX 770M
AMD Radeon HD 8970M
...
» The benchmarks indicate that the game is not playable in the tested settings.
AMD Radeon HD 8330
Intel HD Graphics (Bay Trail)
AMD Radeon HD 8400
AMD Radeon R5 (Beema/Carrizo-L)
Intel HD Graphics (Haswell)
AMD Radeon HD 8550G
AMD Radeon HD 8350G
Intel HD Graphics 4400
AMD Radeon HD 8450G
Intel HD Graphics 4200
...
max:
Intel HD Graphics (Bay Trail)
Intel HD Graphics (Haswell)
AMD Radeon HD 8330
AMD Radeon HD 8400
AMD Radeon R5 (Beema/Carrizo-L)
Intel HD Graphics 4400
AMD Radeon HD 8350G
Intel HD Graphics 4200
AMD Radeon HD 8450G
Intel Iris Graphics 5100
AMD Radeon HD 8550G
AMD Radeon R5 M230
...
max:
Intel HD Graphics (Haswell)
AMD Radeon HD 8400
AMD Radeon R5 (Beema/Carrizo-L)
AMD Radeon HD 8350G
Intel HD Graphics 4400
AMD Radeon R5 M230
Intel HD Graphics 4200
AMD Radeon HD 8450G
AMD Radeon HD 8550G
Intel Iris Graphics 5100
...
max:
AMD Radeon R5 (Beema/Carrizo-L)
AMD Radeon R5 M230
AMD Radeon HD 8550G
Intel Iris Graphics 5100
AMD Radeon HD 8650G
...
max:
» The benchmarks indicate that the game is not playable in the tested settings.
AMD Radeon HD 8280
Intel HD Graphics (Haswell)
AMD Radeon R5 (Beema/Carrizo-L)
Intel HD Graphics 4400
AMD Radeon HD 8350G
Intel HD Graphics 5000
AMD Radeon HD 8450G
AMD Radeon HD 8650G
AMD Radeon HD 8550G
...
NVIDIA GeForce GTX 860M
max:
AMD Radeon R5 (Beema/Carrizo-L)
Intel HD Graphics (Haswell)
Intel HD Graphics 4400
AMD Radeon HD 8450G
Intel HD Graphics 5000
NVIDIA GeForce GT 735M
AMD Radeon HD 8550G
...
AMD Radeon R5 (Beema/Carrizo-L)
Intel HD Graphics 4400
Intel HD Graphics 5000
AMD Radeon HD 8650G
AMD Radeon HD 8550G
NVIDIA GeForce GT 735M
Intel Iris Pro Graphics 5200
NVIDIA GeForce GT 640M
...
AMD Radeon R5 (Beema/Carrizo-L)
NVIDIA GeForce GT 640M
NVIDIA GeForce GT 740M
Intel Iris Pro Graphics 5200
...
» The benchmarks indicate that the game is not playable in the tested settings.
Intel HD Graphics (Bay Trail)
AMD Radeon R4 (Kaveri)
AMD Radeon HD 8280
AMD Radeon R5 (Beema/Carrizo-L)
AMD Radeon HD 8330
AMD Radeon HD 8610G
Intel HD Graphics (Haswell)
AMD Radeon HD 8350G
AMD Radeon HD 8400
AMD Radeon HD 8450G
...
Intel HD Graphics (Bay Trail)
AMD Radeon HD 8330
AMD Radeon R4 (Kaveri)
Intel HD Graphics (Haswell)
AMD Radeon R5 (Beema/Carrizo-L)
Intel HD Graphics 4200
AMD Radeon HD 8610G
AMD Radeon HD 8350G
Intel HD Graphics 4400
AMD Radeon HD 8450G
Intel HD Graphics 515
...
AMD Radeon R5 (Beema/Carrizo-L)
AMD Radeon R4 (Kaveri)
AMD Radeon HD 8330
Intel HD Graphics 4200
...
NVIDIA Quadro P5200
AMD Radeon R5 (Beema/Carrizo-L)
Intel HD Graphics 4400
AMD Radeon R5 M230
Intel HD Graphics 5000
...
» The benchmarks indicate that the game is not playable in the tested settings.
Intel HD Graphics (Bay Trail)
AMD Radeon HD 8330
Intel HD Graphics 4200
AMD Radeon R5 (Beema/Carrizo-L)
AMD Radeon HD 8400
AMD Radeon HD 8450G
AMD Radeon R7 M260
Intel HD Graphics 4400
Intel Iris Graphics 5100
...
Intel HD Graphics (Bay Trail)
Intel HD Graphics 4200
AMD Radeon HD 8400
AMD Radeon R5 (Beema/Carrizo-L)
Intel HD Graphics 4400
AMD Radeon HD 8450G
AMD Radeon R7 M260
Intel Iris Graphics 5100
...
NVIDIA GeForce GTX 780M
max:
Intel Iris Graphics 5100
AMD Radeon R5 (Beema/Carrizo-L)
AMD Radeon HD 8650G
AMD Radeon HD 8550G
AMD Radeon R7 M260
Intel HD Graphics 4400
Intel Iris Pro Graphics 5200
...
max:
AMD Radeon R5 (Beema/Carrizo-L)
Intel Iris Graphics 5100
AMD Radeon HD 8650G
NVIDIA GeForce GT 740M
Intel HD Graphics 4400
Intel Iris Pro Graphics 5200
...
» The benchmarks indicate that the game is not playable in the tested settings.
...
AMD Radeon R5 M240
AMD Radeon HD 8400
Intel HD Graphics (Haswell)
AMD Radeon R6 M255DX
Intel HD Graphics 4200
AMD Radeon R5 (Beema/Carrizo-L)
AMD Radeon HD 8610G
Intel HD Graphics 4400
Intel Iris Graphics 550
AMD Radeon HD 8350G
AMD Radeon R7 M275DX
AMD Radeon HD 8650G + HD 8570M Dual Graphics
...
...
Intel HD Graphics 4200
AMD Radeon HD 8610G
AMD Radeon R6 M255DX
AMD Radeon HD 8350G
AMD Radeon R5 (Beema/Carrizo-L)
AMD Radeon HD 8450G
Intel HD Graphics 4400
AMD Radeon HD 8650G
AMD Radeon HD 8650G + HD 8570M Dual Graphics
AMD Radeon R7 M275DX
Intel Iris Graphics 5100
...
...
AMD Radeon HD 8400
AMD Radeon HD 8610G
AMD Radeon R5 (Beema/Carrizo-L)
AMD Radeon R5 M240
AMD Radeon HD 8450G
AMD Radeon R6 M255DX
AMD Radeon HD 8650G + HD 8570M Dual Graphics
AMD Radeon HD 8650G
...
AMD Radeon R5 (Beema/Carrizo-L)
AMD Radeon HD 8400
AMD Radeon R7 M270
AMD Radeon HD 8450G
...
» The benchmarks indicate that the game is not playable in the tested settings.
Intel HD Graphics (Bay Trail)
...
AMD Radeon HD 8330
Intel HD Graphics (Haswell)
AMD Radeon HD 8400
AMD Radeon R5 (Beema/Carrizo-L)
Intel HD Graphics 4400
AMD Radeon R6 (Carrizo)
AMD Radeon HD 8350G
Intel HD Graphics 515
AMD Radeon R5 M240
AMD Radeon HD 8650G
AMD Radeon HD 8450G
Intel UHD Graphics 615
...
NVIDIA GeForce GTX 980 (Laptop)
max:
NVIDIA Titan RTX
...
AMD Radeon HD 8280
Intel HD Graphics (Haswell)
Intel HD Graphics 4400
AMD Radeon R5 (Beema/Carrizo-L)
AMD Radeon R6 (Carrizo)
Intel HD Graphics 515
AMD Radeon HD 8350G
AMD Radeon HD 8450G
Intel UHD Graphics 615
Intel HD Graphics 5000
...
NVIDIA GeForce GTX 980 (Laptop)
max:
NVIDIA Titan RTX
...
Intel HD Graphics 4400
AMD Radeon R5 (Beema/Carrizo-L)
AMD Radeon R6 (Carrizo)
Intel HD Graphics 515
Intel HD Graphics (Haswell)
AMD Radeon HD 8350G
Intel HD Graphics 5000
Intel UHD Graphics 615
AMD Radeon HD 8450G
...
NVIDIA GeForce GTX 980 (Laptop)
max:
NVIDIA Titan RTX
» The benchmarks indicate that the game is not playable in the tested settings.
...
Intel HD Graphics (Bay Trail)
AMD Radeon HD 8210
AMD Radeon HD 8280
Intel HD Graphics (Haswell)
AMD Radeon HD 8330
Intel HD Graphics 4200
AMD Radeon R5 (Beema/Carrizo-L)
AMD Radeon HD 8450G
Intel HD Graphics 4400
AMD Radeon HD 8650G
...
NVIDIA Quadro P4000 Max-Q
max:
Intel HD Graphics (Bay Trail)
Intel HD Graphics (Haswell)
AMD Radeon HD 8280
AMD Radeon HD 8400
Intel HD Graphics 4200
AMD Radeon R5 (Beema/Carrizo-L)
AMD Radeon HD 8450G
Intel HD Graphics 4400
AMD Radeon HD 8650G
...
NVIDIA Quadro P4000 Max-Q
AMD Radeon R5 M230
AMD Radeon R5 (Beema/Carrizo-L)
Intel Iris Graphics 5100
AMD Radeon HD 8650G + HD 8570M Dual Graphics
...
NVIDIA Quadro P4000 Max-Q
» The benchmarks indicate that the game is not playable in the tested settings.
...
Intel HD Graphics (Haswell)
AMD Radeon HD 8650G + HD 8570M Dual Graphics
AMD Radeon R6 M255DX
Intel HD Graphics 4200
AMD Radeon HD 8330
AMD Radeon HD 8350G
AMD Radeon R5 (Beema/Carrizo-L)
AMD Radeon HD 8450G
Intel HD Graphics 4400
AMD Radeon HD 8400
AMD Radeon HD 8650G
Intel HD Graphics 5000
AMD Radeon HD 8550G + HD 8750M Dual Graphics
AMD Radeon HD 8550G + HD 8670M Dual Graphics
...
NVIDIA GeForce GTX 765M
max:
...
AMD Radeon HD 8280
Intel HD Graphics 4200
AMD Radeon HD 8350G
Intel HD Graphics 4400
AMD Radeon R6 M255DX
AMD Radeon HD 8330
AMD Radeon R5 (Beema/Carrizo-L)
AMD Radeon HD 8650G
Intel HD Graphics 5000
Intel Iris Graphics 5100
AMD Radeon HD 8550G
AMD Radeon HD 8550G + HD 8750M Dual Graphics
...
NVIDIA GeForce GTX 770M
max:
...
Intel HD Graphics 4200
AMD Radeon HD 8400
AMD Radeon HD 8650G + HD 8570M Dual Graphics
Intel HD Graphics 4400
AMD Radeon HD 8280
AMD Radeon HD 8350G
AMD Radeon HD 8330
AMD Radeon R5 (Beema/Carrizo-L)
AMD Radeon HD 8450G
AMD Radeon HD 8650G
AMD Radeon R6 M255DX
Intel HD Graphics 5000
Intel Iris Graphics 5100
...
NVIDIA Quadro K5100M
max:
» The benchmarks indicate that the game is not playable in the tested settings.
...
Intel HD Graphics 4200
AMD Radeon HD 8330
AMD Radeon HD 8650G + HD 8570M Dual Graphics
AMD Radeon HD 8400
AMD Radeon R5 (Beema/Carrizo-L)
AMD Radeon HD 8550G + HD 8670M Dual Graphics
Intel HD Graphics 4400
AMD Radeon R5 M230
Intel HD Graphics 5000
...
NVIDIA GeForce GTX 760M
max:
Intel Graphics Media Accelerator (GMA) 4500MHD
Intel HD Graphics (Bay Trail)
AMD Radeon R4 (Kaveri)
AMD Radeon HD 8280
AMD Radeon R5 (Beema/Carrizo-L)
Intel HD Graphics (Haswell)
AMD Radeon HD 8330
Intel HD Graphics 4200
AMD Radeon HD 8650G + HD 8570M Dual Graphics
...
NVIDIA GeForce GTX 760M
max:
Intel Graphics Media Accelerator (GMA) 4500MHD
...
Intel HD Graphics (Bay Trail)
Intel Graphics Media Accelerator (GMA) 4500MHD
AMD Radeon R4 (Kaveri)
Intel HD Graphics 4200
Intel HD Graphics (Haswell)
AMD Radeon HD 8280
AMD Radeon R5 (Beema/Carrizo-L)
AMD Radeon HD 8330
AMD Radeon HD 8400
Intel HD Graphics 4400
AMD Radeon HD 8550G + HD 8670M Dual Graphics
...
max:
AMD Radeon R4 (Kaveri)
Intel HD Graphics 4200
AMD Radeon HD 8330
AMD Radeon HD 8400
AMD Radeon R5 (Beema/Carrizo-L)
Intel HD Graphics 4400
Intel HD Graphics 5000
AMD Radeon R5 M230
Intel Iris Graphics 5100
AMD Radeon HD 8450G
AMD Radeon HD 8650G + HD 8570M Dual Graphics
...
NVIDIA GeForce GTX 780M
max:
» With all tested laptops playable in detail settings high.
Intel HD Graphics (Bay Trail)
AMD Radeon HD 8210
AMD Radeon HD 8280
AMD Radeon HD 8330
AMD Radeon R5 (Beema/Carrizo-L)
Intel HD Graphics (Haswell)
AMD Radeon HD 8400
AMD Radeon HD 8650G + HD 8570M Dual Graphics
Intel HD Graphics 4200
...
NVIDIA Quadro M5000M
AMD Radeon HD 8280
AMD Radeon HD 8330
Intel HD Graphics (Haswell)
AMD Radeon HD 8400
AMD Radeon HD 8650G + HD 8570M Dual Graphics
AMD Radeon R5 (Beema/Carrizo-L)
Intel HD Graphics 4200
AMD Radeon HD 8450G
Intel HD Graphics 4400
AMD Radeon HD 8350G
...
NVIDIA Quadro M5000M
Intel HD Graphics 4200
AMD Radeon HD 8650G + HD 8570M Dual Graphics
AMD Radeon R5 (Beema/Carrizo-L)
AMD Radeon HD 8450G
Intel HD Graphics 4400
AMD Radeon HD 8350G
Intel HD Graphics 5000
...
» The benchmarks indicate that the game is not playable in the tested settings.
Intel HD Graphics (Braswell)
...
AMD Radeon HD 8330
AMD Radeon HD 8650G
AMD Radeon HD 8280
Intel HD Graphics (Haswell)
AMD Radeon HD 8450G
Intel HD Graphics 4400
AMD Radeon R5 (Beema/Carrizo-L)
AMD Radeon HD 8610G
AMD Radeon HD 8400
AMD Radeon R5 M240
AMD Radeon R6 M255DX
AMD Radeon R7 M260
...
AMD FirePro M6100
max:
Intel HD Graphics (Braswell)
...
AMD Radeon HD 8650G + HD 8570M Dual Graphics
AMD Radeon HD 8330
AMD Radeon HD 8650G
AMD Radeon HD 8280
Intel HD Graphics 4400
AMD Radeon HD 8610G
AMD Radeon HD 8450G
AMD Radeon R5 (Beema/Carrizo-L)
AMD Radeon HD 8400
AMD Radeon R5 M240
AMD Radeon R6 M255DX
AMD Radeon R7 M260
...
AMD FirePro M5100
...
Intel HD Graphics 4200
AMD Radeon HD 8610G
AMD Radeon HD 8330
Intel HD Graphics 4400
AMD Radeon HD 8650G + HD 8570M Dual Graphics
AMD Radeon HD 8450G
AMD Radeon R5 (Beema/Carrizo-L)
AMD Radeon HD 8650G
Intel Iris Graphics 5100
AMD Radeon HD 8550G + HD 8670M Dual Graphics
AMD Radeon R5 M240
AMD Radeon R6 M255DX
...
» The benchmarks indicate that the game is not playable in the tested settings.
...
AMD Radeon HD 8250
AMD Radeon HD 8280
Intel HD Graphics (Haswell)
Intel HD Graphics 4400
AMD Radeon HD 8330
AMD Radeon HD 8400
AMD Radeon R5 (Beema/Carrizo-L)
AMD Radeon HD 8450G
AMD Radeon HD 8550G + HD 8670M Dual Graphics
AMD Radeon R5 M230
AMD Radeon HD 8650G + HD 8670M Dual Graphics
AMD Radeon HD 8650G
...
NVIDIA GeForce GTX 960M
Intel HD Graphics (Bay Trail)
...
Intel HD Graphics (Haswell)
AMD Radeon HD 8280
AMD Radeon HD 8330
Intel HD Graphics 4400
AMD Radeon HD 8400
AMD Radeon HD 8450G
AMD Radeon R5 (Beema/Carrizo-L)
AMD Radeon HD 8550G + HD 8670M Dual Graphics
AMD Radeon R5 M230
...
NVIDIA GeForce GTX 780M SLI
Intel HD Graphics 4200
AMD Radeon HD 8550G + HD 8670M Dual Graphics
AMD Radeon HD 8450G
AMD Radeon R5 (Beema/Carrizo-L)
NVIDIA GeForce GT 720M
Intel Iris Graphics 5100
AMD Radeon HD 8650G
...
NVIDIA GeForce GTX 780M SLI
» The benchmarks indicate that the game is not playable in the tested settings.
...
Intel HD Graphics (Bay Trail)
Intel HD Graphics (Haswell)
Intel HD Graphics 4400
AMD Radeon HD 8280
Intel HD Graphics 4200
AMD Radeon HD 8330
AMD Radeon R5 (Beema/Carrizo-L)
AMD Radeon R7 M260
AMD Radeon HD 8450G
AMD Radeon HD 8400
AMD Radeon HD 8550G + HD 8670M Dual Graphics
AMD Radeon R5 M230
...
NVIDIA GeForce GTX 780M
max:
Intel HD Graphics (Bay Trail)
...
AMD Radeon HD 8400
AMD Radeon HD 8450G
AMD Radeon HD 8330
AMD Radeon R5 (Beema/Carrizo-L)
AMD Radeon HD 8550G + HD 8670M Dual Graphics
AMD Radeon HD 8550G + HD 8750M Dual Graphics
Intel Iris Graphics 5100
AMD Radeon R5 M230
AMD Radeon HD 8650G + HD 8570M Dual Graphics
AMD Radeon HD 8650G + HD 8670M Dual Graphics
AMD Radeon R7 M260
...
NVIDIA GeForce GTX 780M
max:
AMD Radeon R5 (Beema/Carrizo-L)
Intel HD Graphics 4200
AMD Radeon R5 M230
AMD Radeon HD 8650G + HD 8570M Dual Graphics
AMD Radeon HD 8650G + HD 8670M Dual Graphics
...
NVIDIA GeForce GTX 780M SLI
» The benchmarks indicate that the game is not playable in the tested settings.
...
Intel Graphics Media Accelerator (GMA) 4500MHD
AMD Radeon HD 8250
AMD Radeon R4 (Kaveri)
AMD Radeon HD 8280
AMD Radeon HD 8330
Intel HD Graphics (Bay Trail)
AMD Radeon R5 (Beema/Carrizo-L)
AMD Radeon HD 8650G + HD 8570M Dual Graphics
Intel HD Graphics (Cherry Trail)
AMD Radeon HD 8400
AMD Radeon R5 M320
AMD Radeon HD 8350G
Intel HD Graphics 4200
Intel HD Graphics (Haswell)
AMD Radeon R6 M255DX
...
max:
AMD Radeon R7 370
...
AMD Radeon HD 8240
AMD Radeon HD 8250
Intel HD Graphics (Bay Trail)
AMD Radeon HD 8280
AMD Radeon R4 (Kaveri)
Intel HD Graphics (Cherry Trail)
AMD Radeon HD 8330
AMD Radeon HD 8400
AMD Radeon R5 (Beema/Carrizo-L)
Intel HD Graphics 4200
AMD Radeon HD 8350G
AMD Radeon R5 M320
Intel HD Graphics (Haswell)
...
max:
AMD Radeon R7 370
» The benchmarks indicate that the game is not playable in the tested settings.
...
Intel HD Graphics 4200
AMD Radeon HD 8330
AMD Radeon HD 8350G
AMD Radeon HD 8450G
AMD Radeon R5 (Beema/Carrizo-L)
Intel HD Graphics 4400
AMD Radeon HD 8650G
Intel HD Graphics 5000
AMD Radeon R6 M255DX
...
NVIDIA GeForce GTX 1050 Max-Q
AMD Radeon HD 8330
Intel HD Graphics 4200
AMD Radeon HD 8650G + HD 8570M Dual Graphics
AMD Radeon R5 (Beema/Carrizo-L)
AMD Radeon HD 8350G
Intel HD Graphics 4400
Intel HD Graphics 5000
AMD Radeon HD 8650G
AMD Radeon HD 8450G
...
NVIDIA GeForce GTX 1050 Max-Q
AMD Radeon HD 8330
AMD Radeon R5 (Beema/Carrizo-L)
Intel HD Graphics 4200
Intel HD Graphics 4400
AMD Radeon HD 8650G + HD 8570M Dual Graphics
Intel HD Graphics 5000
...
AMD Radeon R5 (Beema/Carrizo-L)
Intel HD Graphics 4400
...
NVIDIA GeForce GTX 1080 Mobile
» The benchmarks indicate that the game is not playable in the tested settings.
...
Intel HD Graphics (Haswell)
AMD Radeon R2 (Stoney Ridge)
AMD Radeon HD 8400
Intel HD Graphics 4400
AMD Radeon HD 8610G
AMD Radeon HD 8330
AMD Radeon R5 (Beema/Carrizo-L)
AMD Radeon R4 (Stoney Ridge)
AMD Radeon HD 8550G
AMD Radeon R5 M240
Intel HD Graphics 4200
AMD Radeon R7 M260
...
...
AMD Radeon HD 8280
AMD Radeon R2 (Stoney Ridge)
AMD Radeon HD 8450G
AMD Radeon HD 8330
AMD Radeon HD 8400
AMD Radeon HD 8610G
Intel HD Graphics 4400
AMD Radeon R5 (Beema/Carrizo-L)
Intel HD Graphics 4200
AMD Radeon R4 (Stoney Ridge)
Intel HD Graphics 5000
...
NVIDIA Quadro M1000M
max:
...
Intel HD Graphics (Haswell)
AMD Radeon HD 8280
AMD Radeon HD 8330
AMD Radeon HD 8610G
Intel HD Graphics 4400
Intel HD Graphics 4200
AMD Radeon R5 (Beema/Carrizo-L)
AMD Radeon HD 8450G
AMD Radeon R4 (Stoney Ridge)
...
max:
» With all tested laptops playable in detail settings low.
...
Intel HD Graphics (Haswell)
AMD Radeon HD 8400
Intel HD Graphics 4200
AMD Radeon HD 8330
Intel HD Graphics (Broadwell)
AMD Radeon HD 8450G
AMD Radeon R5 (Beema/Carrizo-L)
AMD Radeon HD 8650G + HD 8570M Dual Graphics
AMD Radeon R5 M230
Intel HD Graphics 5000
Intel HD Graphics 515
...
AMD Radeon HD 8210
Intel HD Graphics 4200
AMD Radeon R5 (Beema/Carrizo-L)
Intel HD Graphics (Broadwell)
...
AMD Radeon HD 8210
AMD Radeon R5 (Beema/Carrizo-L)
Intel HD Graphics 4200
Intel HD Graphics (Broadwell)
...
AMD Radeon R5 (Beema/Carrizo-L)
Intel HD Graphics 4200
AMD Radeon HD 8450G
AMD Radeon R5 M230
NVIDIA Quadro K610M
...
max:
» The benchmarks indicate that the game is not playable in the tested settings.
...
AMD Radeon HD 8610G
Intel HD Graphics (Haswell)
AMD Radeon HD 8450G + Radeon HD 8570M Dual Graphics
Intel HD Graphics 4400
AMD Radeon R5 (Beema/Carrizo-L)
AMD Radeon R4 (Stoney Ridge)
AMD Radeon R2 (Stoney Ridge)
AMD Radeon R5 M230
Intel HD Graphics 5000
...
Intel HD Graphics (Bay Trail)
...
Intel HD Graphics (Broadwell)
AMD Radeon R4 (Stoney Ridge)
Intel HD Graphics 4400
AMD Radeon HD 8450G
AMD Radeon R5 (Beema/Carrizo-L)
AMD Radeon R2 (Stoney Ridge)
AMD Radeon HD 8450G + Radeon HD 8570M Dual Graphics
Intel HD Graphics 515
Intel HD Graphics 510
Intel HD Graphics 5000
...
Intel HD Graphics (Bay Trail)
...
AMD Radeon R4 (Stoney Ridge)
AMD Radeon HD 8450G
Intel HD Graphics 4400
AMD Radeon R2 (Stoney Ridge)
AMD Radeon R5 (Beema/Carrizo-L)
Intel HD Graphics 5000
Intel HD Graphics 515
Intel Iris Graphics 5100
Intel HD Graphics 510
Intel UHD Graphics 615
...
Intel HD Graphics (Bay Trail)
...
Intel HD Graphics 4400
AMD Radeon R4 (Stoney Ridge)
Intel HD Graphics 515
NVIDIA Quadro K610M
AMD Radeon R5 (Beema/Carrizo-L)
Intel UHD Graphics 615
Intel HD Graphics 520
AMD Radeon R5 M230
AMD Radeon HD 8650G + HD 8570M Dual Graphics
Intel HD Graphics 530
NVIDIA GeForce GT 720M
...
max:
» The benchmarks indicate that the game is not playable in the tested settings.
...
AMD Radeon HD 8400
NVIDIA GeForce G210M
Intel UHD Graphics 600
Intel HD Graphics 515
AMD Radeon R5 M240
AMD Radeon R5 (Beema/Carrizo-L)
AMD Radeon HD 6620G + HD 7670M Dual Graphics
Intel HD Graphics (Haswell)
AMD Radeon R6 M255DX
Intel HD Graphics 4200
AMD Radeon HD 8450G
...
NVIDIA Quadro P5200
Intel Graphics Media Accelerator (GMA) 4500MHD
...
AMD Radeon HD 8240
AMD Radeon HD 8280
AMD Radeon HD 8610G
Intel HD Graphics 515
NVIDIA GeForce G210M
AMD Radeon R5 (Beema/Carrizo-L)
AMD Radeon HD 8330
AMD Radeon HD 8400
Intel HD Graphics (Haswell)
Intel Iris Plus Graphics G4 (Ice Lake 48 EU)
...
NVIDIA Quadro P5200
AMD Radeon HD 8210
AMD Radeon R5 (Beema/Carrizo-L)
AMD Radeon HD 8280
NVIDIA GeForce G210M
AMD Radeon HD 8400
AMD Radeon HD 8330
Intel HD Graphics 515
...
NVIDIA Quadro P5200
AMD Radeon R5 (Beema/Carrizo-L)
AMD Radeon HD 8330
Intel HD Graphics 4200
AMD Radeon HD 8400
...
NVIDIA Quadro P5200
» With all tested laptops playable in detail settings low.
24.6 27.8 34 [X] HP 15-g005ng AMD A8-6410 2GHz
Radeon R5 (Beema/Carrizo-L)
34.7 [X] HP Pavilion 13-a093na x360 AMD A8-6410 2GHz
Radeon R5 (Beema/Carrizo-L)
35.6 [X] Acer Aspire ES1-521-87DN AMD A8-6410 2GHz
Radeon R5 (Beema/Carrizo-L)
~ 31 fps
+ Compare
- Hide Comparison
...
AMD Radeon HD 8330
Intel HD Graphics (Cherry Trail)
Intel HD Graphics (Haswell)
Intel HD Graphics 4200
AMD Radeon R5 (Beema/Carrizo-L)
Intel UHD Graphics 605
AMD Radeon HD 8610G
AMD Radeon HD 8450G + Radeon HD 8570M Dual Graphics
Intel UHD Graphics 600
Intel HD Graphics (Broadwell)
...
12.3 14.9 17.8 [X] HP 15-g005ng AMD A8-6410 2GHz
Radeon R5 (Beema/Carrizo-L)
18 [X] HP Pavilion 13-a093na x360 AMD A8-6410 2GHz
Radeon R5 (Beema/Carrizo-L)
18.1 [X] Acer Aspire ES1-521-87DN AMD A8-6410 2GHz
Radeon R5 (Beema/Carrizo-L)
~ 16 fps
+ Compare
- Hide Comparison
...
AMD Radeon HD 8330
Intel HD Graphics (Haswell)
AMD Radeon R2 (Stoney Ridge)
Intel HD Graphics 4200
AMD Radeon R5 (Beema/Carrizo-L)
AMD Radeon HD 8610G
Intel UHD Graphics 600
Intel HD Graphics (Broadwell)
Intel UHD Graphics 605
...
5.1 11.9 [X] HP 15-g005ng AMD A8-6410 2GHz
Radeon R5 (Beema/Carrizo-L)
12.1 [X] HP Pavilion 13-a093na x360 AMD A8-6410 2GHz
Radeon R5 (Beema/Carrizo-L)
13.8 [X] Acer Aspire ES1-521-87DN AMD A8-6410 2GHz
Radeon R5 (Beema/Carrizo-L)
~ 11 fps
+ Compare
- Hide Comparison
...
AMD Radeon HD 8330
AMD Radeon HD 8400
AMD Radeon HD 8610G
Intel HD Graphics 4200
Intel UHD Graphics 600
AMD Radeon R5 (Beema/Carrizo-L)
AMD Radeon R2 (Stoney Ridge)
Intel HD Graphics (Broadwell)
Intel HD Graphics 4400
Intel UHD Graphics 605
...
Intel HD Graphics (Bay Trail)
AMD Radeon R5 (Beema/Carrizo-L)
AMD Radeon R4 (Kaveri)
Intel HD Graphics (Cherry Trail)
Intel HD Graphics 4200
NVIDIA Quadro K610M
AMD Radeon HD 8350G
Intel UHD Graphics 600
...
» The benchmarks indicate that the game is not playable in the tested settings.
AMD Radeon HD 8250
Intel HD Graphics (Braswell)
Intel HD Graphics 4200
AMD Radeon R5 (Beema/Carrizo-L)
Intel HD Graphics (Haswell)
AMD Radeon HD 8280
Intel HD Graphics 4400
AMD Radeon HD 8330
...
max:
NVIDIA GeForce GTX 1080 (Desktop)
Intel HD Graphics (Braswell)
Intel HD Graphics 4200
AMD Radeon R5 (Beema/Carrizo-L)
Intel HD Graphics (Haswell)
AMD Radeon HD 8330
Intel HD Graphics 4400
AMD Radeon HD 8450G + Radeon HD 8570M Dual Graphics
...
max:
NVIDIA GeForce GTX 1080 (Desktop)
Intel HD Graphics (Braswell)
AMD Radeon R5 (Beema/Carrizo-L)
AMD Radeon HD 8250
Intel HD Graphics 4200
AMD Radeon HD 8330
...
max:
NVIDIA GeForce GTX 1080 (Desktop)
AMD Radeon R5 (Beema/Carrizo-L)
AMD Radeon HD 8650G + HD 8570M Dual Graphics
AMD Radeon R6 (Carrizo)
AMD Radeon R5 M230
...
max:
» The benchmarks indicate that the game is not playable in the tested settings.
Intel Graphics Media Accelerator (GMA) 4500MHD
...
AMD Radeon HD 8330
AMD Radeon HD 8450G
AMD Radeon R2 (Stoney Ridge)
AMD Radeon HD 8400
AMD Radeon R5 (Beema/Carrizo-L)
AMD Radeon R4 (Stoney Ridge)
NVIDIA GeForce G210M
Intel HD Graphics 4200
AMD Radeon HD 8280
...
NVIDIA GeForce GTX 765M SLI
...
NVIDIA GeForce G210M
AMD Radeon HD 8400
AMD Radeon R2 (Stoney Ridge)
Intel HD Graphics 4200
AMD Radeon R5 (Beema/Carrizo-L)
AMD Radeon HD 8450G
AMD Radeon R4 (Stoney Ridge)
Intel HD Graphics 4400
...
NVIDIA GeForce GTX 780M SLI
...
Intel UHD Graphics 605
AMD Radeon HD 8280
Intel HD Graphics 4200
AMD Radeon R2 (Stoney Ridge)
AMD Radeon R5 (Beema/Carrizo-L)
AMD Radeon HD 8450G
AMD Radeon R4 (Stoney Ridge)
Intel HD Graphics 4400
AMD Radeon HD 8450G + Radeon HD 8570M Dual Graphics
...
NVIDIA GeForce GTX 780M SLI
» With all tested laptops playable in detail settings low.
Intel HD Graphics (Bay Trail)
Intel HD Graphics (Haswell)
AMD Radeon HD 8330
AMD Radeon R5 (Beema/Carrizo-L)
Intel HD Graphics 4400
AMD Radeon HD 8650G + HD 8570M Dual Graphics
Intel HD Graphics 4200
Intel HD Graphics 5000
Intel Iris Graphics 5100
...
Intel HD Graphics (Bay Trail)
Intel HD Graphics (Haswell)
AMD Radeon HD 8330
AMD Radeon R5 (Beema/Carrizo-L)
Intel HD Graphics 4400
Intel HD Graphics 4200
AMD Radeon HD 8650G + HD 8570M Dual Graphics
Intel HD Graphics 5000
...
Intel HD Graphics 5000
AMD Radeon R5 (Beema/Carrizo-L)
Intel Iris Graphics 5100
AMD Radeon HD 8550G + HD 8670M Dual Graphics
AMD Radeon HD 8650G + HD 8570M Dual Graphics
...
AMD Radeon R5 (Beema/Carrizo-L)
AMD Radeon HD 8650G + HD 8570M Dual Graphics
Intel Iris Graphics 5100
AMD FirePro M4100
Intel Iris Pro Graphics 5200
...
» The benchmarks indicate that the game is not playable in the tested settings.
AMD Radeon HD 8450G + Radeon HD 8570M Dual Graphics
AMD Radeon HD 8450G
AMD Radeon HD 8330
AMD Radeon R5 (Beema/Carrizo-L)
Intel HD Graphics 4400
AMD Radeon HD 8550G + HD 8670M Dual Graphics
AMD Radeon HD 8650G + HD 8670M Dual Graphics
Intel HD Graphics 5000
...
NVIDIA GeForce GTX 765M SLI
AMD Radeon R5 (Beema/Carrizo-L)
Intel HD Graphics 5000
AMD Radeon HD 8550G + HD 8670M Dual Graphics
Intel Iris Graphics 5100
...
NVIDIA GeForce GTX 780M SLI
» The benchmarks indicate that the game is not playable in the tested settings.
...
AMD Radeon HD 8330
Intel HD Graphics (Broadwell)
AMD Radeon HD 8400
AMD Radeon HD 8610G
AMD Radeon R5 (Beema/Carrizo-L)
Intel HD Graphics 4200
Intel HD Graphics 4400
AMD Radeon R5 M240
AMD Radeon HD 6620G + HD 7670M Dual Graphics
AMD Radeon R6 M255DX
...
Intel HD Graphics (Bay Trail)
AMD Radeon HD 8250
AMD Radeon HD 8450G + Radeon HD 8570M Dual Graphics
Intel HD Graphics (Haswell)
AMD Radeon R5 (Beema/Carrizo-L)
AMD Radeon HD 8610G
Intel HD Graphics (Broadwell)
Intel HD Graphics 4200
AMD Radeon HD 8330
AMD Radeon HD 8650G + HD 8570M Dual Graphics
...
...
AMD Radeon HD 8250
Intel HD Graphics (Broadwell)
AMD Radeon HD 8610G
AMD Radeon HD 8330
AMD Radeon R5 (Beema/Carrizo-L)
Intel HD Graphics 5000
Intel Iris Graphics 5100
NVIDIA GeForce GT 720M
...
AMD Radeon R5 (Beema/Carrizo-L)
Intel Iris Graphics 5100
AMD Radeon R6 M340DX
AMD Radeon HD 8550G
...
» The benchmarks indicate that the game is not playable in the tested settings.
Intel HD Graphics (Bay Trail)
...
AMD Radeon HD 8450G + Radeon HD 8570M Dual Graphics
Intel HD Graphics (Haswell)
Intel HD Graphics 4200
AMD Radeon HD 8400
AMD Radeon HD 8330
Intel HD Graphics 4400
AMD Radeon HD 8450G
AMD Radeon R5 (Beema/Carrizo-L)
Intel HD Graphics 5000
AMD Radeon HD 8650G
AMD Radeon HD 8650G + HD 8570M Dual Graphics
AMD Radeon HD 8550G + HD 8670M Dual Graphics
...
NVIDIA GeForce GTX 765M SLI
Intel HD Graphics (Bay Trail)
...
AMD Radeon HD 8250
Intel HD Graphics (Haswell)
AMD Radeon HD 8400
Intel HD Graphics 4200
AMD Radeon HD 8330
Intel HD Graphics 4400
AMD Radeon R5 (Beema/Carrizo-L)
AMD Radeon HD 8450G + Radeon HD 8570M Dual Graphics
AMD Radeon HD 8450G
Intel HD Graphics 5000
AMD Radeon HD 8550G + HD 8670M Dual Graphics
...
NVIDIA GeForce GTX 780M SLI
...
AMD Radeon HD 8250
AMD Radeon HD 8330
Intel HD Graphics 4200
Intel HD Graphics 4400
AMD Radeon HD 8450G
AMD Radeon R5 (Beema/Carrizo-L)
Intel HD Graphics 5000
AMD Radeon HD 8450G + Radeon HD 8570M Dual Graphics
AMD Radeon HD 8550G + HD 8670M Dual Graphics
...
AMD Radeon HD 8970M Crossfire
» The benchmarks indicate that the game is not playable in the tested settings.
...
AMD Radeon HD 8450G
AMD Radeon HD 8450G + Radeon HD 8570M Dual Graphics
AMD Radeon HD 8330
AMD Radeon R5 (Beema/Carrizo-L)
Intel HD Graphics 4200
Intel HD Graphics 4400
...
NVIDIA GeForce GTX 780M
...
AMD Radeon HD 8450G
AMD Radeon HD 8450G + Radeon HD 8570M Dual Graphics
AMD Radeon R5 (Beema/Carrizo-L)
Intel HD Graphics 4200
Intel HD Graphics 4400
NVIDIA GeForce GT 720M
...
AMD Radeon R5 (Beema/Carrizo-L)
Intel HD Graphics 4400
NVIDIA GeForce GT 720M
...
» The benchmarks indicate that the game is not playable in the tested settings.
Intel Graphics Media Accelerator (GMA) 4500MHD
...
AMD Radeon HD 8400
Intel HD Graphics (Haswell)
AMD Radeon HD 8330
NVIDIA GeForce G210M
AMD Radeon R5 (Beema/Carrizo-L)
Intel HD Graphics 4400
AMD Radeon HD 8550G + HD 8670M Dual Graphics
Intel Iris Graphics 5100
...
Intel HD Graphics (Bay Trail)
...
Intel HD Graphics 4200
Intel HD Graphics (Haswell)
AMD Radeon HD 8330
AMD Radeon R5 (Beema/Carrizo-L)
NVIDIA GeForce G210M
NVIDIA GeForce GT 735M
Intel HD Graphics 4400
AMD Radeon HD 8550G + HD 8670M Dual Graphics
...
NVIDIA GeForce GTX 780M SLI
...
Intel HD Graphics (Braswell)
AMD Radeon HD 8250
Intel HD Graphics 4200
AMD Radeon HD 8330
AMD Radeon R5 (Beema/Carrizo-L)
NVIDIA GeForce G210M
NVIDIA GeForce GT 735M
Intel HD Graphics 4400
AMD Radeon HD 8550G + HD 8670M Dual Graphics
...
NVIDIA GeForce GTX 780M SLI
» The benchmarks indicate that the game is not playable in the tested settings.
AMD Radeon R5 (Beema/Carrizo-L)
Intel HD Graphics 4200
AMD Radeon HD 8650G + HD 8570M Dual Graphics
...
AMD Radeon R5 (Beema/Carrizo-L)
Intel HD Graphics 4200
AMD Radeon HD 8650G + HD 8570M Dual Graphics
Intel HD Graphics 4400
...
NVIDIA GeForce GTX 780M SLI
Intel HD Graphics 4200
AMD Radeon R5 (Beema/Carrizo-L)
Intel HD Graphics 4400
AMD Radeon R5 M230
...
NVIDIA GeForce GTX 780M SLI
AMD Radeon R5 (Beema/Carrizo-L)
AMD Radeon R5 M230
Intel Iris Graphics 5100
AMD Radeon HD 8550G
AMD Radeon HD 8650G
...
NVIDIA GeForce GTX 780M SLI
» The benchmarks indicate that the game is not playable in the tested settings.
AMD Radeon R5 (Beema/Carrizo-L)
Intel HD Graphics 4400
NVIDIA GeForce GT 640M
...
AMD Radeon R5 (Beema/Carrizo-L)
Intel HD Graphics 4400
Intel HD Graphics 4200
...
AMD Radeon R5 (Beema/Carrizo-L)
Intel HD Graphics 4200
Intel HD Graphics 520
...
NVIDIA Quadro P5200
» The benchmarks indicate that the game is not playable in the tested settings.
...
Intel Graphics Media Accelerator (GMA) 4500MHD
AMD Radeon HD 8250
AMD Radeon HD 8210
AMD Radeon HD 8240
Intel HD Graphics (Cherry Trail)
AMD Radeon R2 (Stoney Ridge)
AMD Radeon R4 (Kaveri)
Intel UHD Graphics 600
AMD Radeon R4 (Stoney Ridge)
AMD Radeon R5 (Beema/Carrizo-L)
Intel HD Graphics (Bay Trail)
NVIDIA GeForce 910M
AMD Radeon HD 8450G + Radeon HD 8570M Dual Graphics
AMD Radeon HD 8330
...
NVIDIA GeForce GTX 1050 Max-Q
Intel Graphics Media Accelerator (GMA) 4500MHD
...
Intel HD Graphics (Broadwell)
AMD Radeon HD 8450G + Radeon HD 8570M Dual Graphics
AMD Radeon HD 8450G
Intel HD Graphics (Haswell)
AMD Radeon HD 8330
AMD Radeon R5 (Beema/Carrizo-L)
Intel HD Graphics 4200
NVIDIA GeForce 910M
Intel UHD Graphics 610
...
NVIDIA GeForce GTX 1050 Max-Q
Intel Graphics Media Accelerator (GMA) 4500MHD
...
Intel HD Graphics (Haswell)
Intel HD Graphics (Broadwell)
AMD Radeon HD 8450G
AMD Radeon HD 8450G + Radeon HD 8570M Dual Graphics
AMD Radeon HD 8330
AMD Radeon R5 (Beema/Carrizo-L)
NVIDIA GeForce G210M
Intel HD Graphics 4400
AMD Radeon HD 8400
...
NVIDIA GeForce GTX 780M SLI
» With all tested laptops playable in detail settings med..
...
Intel HD Graphics 4200
AMD Radeon HD 8650G + HD 8570M Dual Graphics
AMD Radeon HD 8450G + Radeon HD 8570M Dual Graphics
AMD Radeon HD 8400
AMD Radeon HD 8330
Intel HD Graphics 4400
AMD Radeon R5 (Beema/Carrizo-L)
Intel Iris Graphics 5100
AMD Radeon HD 8550G + HD 8750M Dual Graphics
...
NVIDIA Quadro P5200
...
AMD Radeon HD 8240
Intel HD Graphics 4200
AMD Radeon HD 8650G + HD 8570M Dual Graphics
AMD Radeon HD 8400
Intel Iris Graphics 5100
AMD Radeon HD 8330
AMD Radeon R5 (Beema/Carrizo-L)
Intel HD Graphics 4400
AMD Radeon HD 8550G + HD 8750M Dual Graphics
AMD Radeon HD 8550G + HD 8670M Dual Graphics
...
NVIDIA Quadro P5200
AMD Radeon HD 8250
AMD Radeon HD 8330
Intel HD Graphics 4200
Intel HD Graphics 4400
AMD Radeon R5 (Beema/Carrizo-L)
Intel Iris Graphics 5100
AMD Radeon HD 8650G + HD 8570M Dual Graphics
...
NVIDIA Quadro P5200
» The benchmarks indicate that the game is not playable in the tested settings.
...
AMD Radeon HD 8450G
AMD Radeon HD 8610G
AMD Radeon R5 (Beema/Carrizo-L)
AMD Radeon R4 (Stoney Ridge)
AMD Radeon HD 8450G + Radeon HD 8570M Dual Graphics
AMD Radeon R6 (Carrizo)
Intel HD Graphics 4400
AMD Radeon R5 (Bristol Ridge)
AMD Radeon R7 (Carrizo)
AMD Radeon R5 M240
...
...
AMD Radeon HD 8610G
Intel UHD Graphics 610
AMD Radeon R5 (Beema/Carrizo-L)
AMD Radeon HD 8450G
AMD Radeon R4 (Stoney Ridge)
Intel HD Graphics 4400
AMD Radeon R6 (Carrizo)
...
Intel HD Graphics (Bay Trail)
...
AMD Radeon HD 8400
NVIDIA GeForce G210M
AMD Radeon R5 (Beema/Carrizo-L)
AMD Radeon HD 8450G
AMD Radeon R4 (Stoney Ridge)
Intel HD Graphics 4400
AMD Radeon R5 M230
AMD Radeon HD 8450G + Radeon HD 8570M Dual Graphics
...
Intel HD Graphics (Bay Trail)
...
AMD Radeon R4 (Kaveri)
AMD Radeon HD 8330
AMD Radeon HD 8610G
Intel UHD Graphics 605
NVIDIA GeForce G210M
AMD Radeon HD 8400
AMD Radeon R5 (Beema/Carrizo-L)
Intel HD Graphics 4400
AMD Radeon R5 M230
Intel HD Graphics 5000
...
NVIDIA GeForce GTX 1080 Mobile
max:
» With all tested laptops playable in detail settings low.
Intel Graphics Media Accelerator (GMA) 4500MHD
...
AMD Radeon HD 8330
AMD Radeon HD 8450G
AMD Radeon R5 (Beema/Carrizo-L)
NVIDIA GeForce G210M
Intel HD Graphics 4200
...
Intel HD Graphics (Bay Trail)
AMD Radeon HD 8330
AMD Radeon HD 8450G
NVIDIA GeForce G210M
AMD Radeon R5 (Beema/Carrizo-L)
Intel HD Graphics 4200
AMD Radeon HD 8450G + Radeon HD 8570M Dual Graphics
...
» The benchmarks indicate that the game is not playable in the tested settings.
...
AMD Radeon HD 8250
NVIDIA GeForce G210M
Intel HD Graphics (Braswell)
AMD Radeon HD 8240
AMD Radeon R5 (Beema/Carrizo-L)
Intel HD Graphics 4200
AMD FirePro M4100
Intel UHD Graphics 605
AMD Radeon HD 8330
Intel HD Graphics (Haswell)
...
max:
AMD Radeon HD 7870
...
AMD Radeon HD 8240
Intel HD Graphics (Cherry Trail)
AMD Radeon HD 8330
AMD Radeon R5 (Beema/Carrizo-L)
Intel HD Graphics 4200
AMD Radeon HD 8400
AMD Radeon HD 8610G
Intel UHD Graphics 605
...
NVIDIA GeForce GTX 780M SLI
...
Intel HD Graphics (Cherry Trail)
Intel HD Graphics (Braswell)
Intel HD Graphics (Haswell)
AMD Radeon HD 8330
AMD Radeon R5 (Beema/Carrizo-L)
Intel HD Graphics 4200
Intel UHD Graphics 605
...
NVIDIA GeForce GTX 780M SLI
Intel HD Graphics (Bay Trail)
AMD Radeon R5 (Beema/Carrizo-L)
Intel HD Graphics 4200
AMD Radeon HD 8350G
NVIDIA Quadro K610M
AMD FirePro M4100
AMD Radeon R5 M230
...
» The benchmarks indicate that the game is not playable in the tested settings.
...
AMD Radeon HD 8650G + HD 8570M Dual Graphics
AMD Radeon R5 (Beema/Carrizo-L)
Intel HD Graphics 5000
Intel HD Graphics 4400
Intel HD Graphics 515
AMD Radeon R7 (Carrizo)
...
...
Intel UHD Graphics 605
AMD Radeon HD 8330
Intel UHD Graphics 600
AMD Radeon HD 8280
AMD Radeon R5 (Beema/Carrizo-L)
AMD Radeon HD 8450G + Radeon HD 8570M Dual Graphics
AMD Radeon HD 8450G
Intel HD Graphics 4400
AMD Radeon R2 (Stoney Ridge)
AMD Radeon R4 (Stoney Ridge)
...
...
AMD Radeon HD 8330
Intel UHD Graphics 600
Intel HD Graphics 4400
AMD Radeon R5 (Beema/Carrizo-L)
AMD Radeon HD 8610G
AMD Radeon R2 (Stoney Ridge)
AMD Radeon R4 (Stoney Ridge)
...
Intel HD Graphics 4200
AMD Radeon R5 (Beema/Carrizo-L)
Intel HD Graphics 520
Intel Iris Graphics 5100
Intel HD Graphics 515
AMD Radeon HD 8350G
...
NVIDIA GeForce GTX 780M SLI
» The benchmarks indicate that the game is not playable in the tested settings.
...
Intel HD Graphics 4400
AMD Radeon R5 (Beema/Carrizo-L)
AMD Radeon HD 8650G
AMD Radeon HD 8550G + HD 8750M Dual Graphics
...
NVIDIA GeForce GTX 765M SLI
Intel HD Graphics (Bay Trail)
...
AMD Radeon HD 8650G + HD 8570M Dual Graphics
AMD Radeon R5 (Beema/Carrizo-L)
AMD Radeon HD 8650G
...
...
AMD Radeon HD 8250
AMD Radeon HD 8330
Intel HD Graphics 4400
AMD Radeon R5 (Beema/Carrizo-L)
AMD Radeon HD 8650G + HD 8570M Dual Graphics
...
» The benchmarks indicate that the game is not playable in the tested settings.
Intel Graphics Media Accelerator (GMA) 4500MHD
...
NVIDIA GeForce G210M
AMD Radeon HD 8330
Intel HD Graphics (Haswell)
AMD Radeon HD 8450G
AMD Radeon HD 8450G + Radeon HD 8570M Dual Graphics
AMD Radeon HD 8610G
AMD Radeon R5 (Beema/Carrizo-L)
AMD Radeon R2 (Stoney Ridge)
...
NVIDIA Quadro K3100M
...
Intel HD Graphics (Haswell)
AMD Radeon HD 8330
Intel HD Graphics 4200
AMD Radeon HD 8610G
AMD Radeon R5 (Beema/Carrizo-L)
AMD Radeon HD 8450G
AMD Radeon R2 (Stoney Ridge)
Intel UHD Graphics 605
...
» With all tested laptops playable in detail settings low.
...
Intel HD Graphics (Haswell)
NVIDIA GeForce G210M
AMD Radeon HD 8330
Intel UHD Graphics 605
AMD Radeon R2 (Stoney Ridge)
AMD Radeon R5 (Beema/Carrizo-L)
AMD Radeon HD 8400
...
...
AMD Radeon HD 8330
AMD Radeon R2 (Stoney Ridge)
AMD Radeon HD 8400
AMD Radeon R5 (Beema/Carrizo-L)
...
NVIDIA Quadro M5000M
...
AMD Radeon R2 (Stoney Ridge)
Intel Iris Graphics 5100
AMD Radeon R5 (Beema/Carrizo-L)
Intel HD Graphics 4400
...
NVIDIA Quadro M5000M
» With all tested laptops playable in detail settings low.
...
AMD Radeon HD 8330
AMD Radeon R2 (Stoney Ridge)
Intel UHD Graphics 600
Intel HD Graphics (Cherry Trail)
AMD Radeon R5 (Beema/Carrizo-L)
NVIDIA GeForce G210M
Intel UHD Graphics 605
...
Intel Graphics Media Accelerator (GMA) 4500MHD
...
NVIDIA GeForce G210M
Intel UHD Graphics 605
AMD Radeon R2 (Stoney Ridge)
Intel HD Graphics (Cherry Trail)
AMD Radeon R5 (Beema/Carrizo-L)
...
» With all tested laptops playable in detail settings low.
Intel HD Graphics (Braswell)
...
AMD Radeon HD 8400
Intel HD Graphics 4200
AMD Radeon R5 (Beema/Carrizo-L)
...
Intel HD Graphics (Braswell)
...
AMD Radeon HD 8400
Intel HD Graphics 4200
AMD Radeon HD 8450G + Radeon HD 8570M Dual Graphics
AMD Radeon R5 (Beema/Carrizo-L)
...
Intel HD Graphics (Braswell)
...
Intel HD Graphics 4200
AMD Radeon R5 (Beema/Carrizo-L)
AMD Radeon HD 8450G + Radeon HD 8570M Dual Graphics
...
» With all tested laptops playable in detail settings low.
...
AMD Radeon HD 8450G + Radeon HD 8570M Dual Graphics
AMD Radeon HD 8450G
NVIDIA GeForce G210M
Intel HD Graphics (Haswell)
AMD Radeon HD 8330
AMD Radeon R5 (Beema/Carrizo-L)
Intel HD Graphics 4400
Intel HD Graphics 4200
AMD Radeon HD 8550G + HD 8670M Dual Graphics
...
Intel Graphics Media Accelerator (GMA) 4500MHD
...
Intel HD Graphics (Haswell)
NVIDIA GeForce G210M
AMD Radeon HD 8450G + Radeon HD 8570M Dual Graphics
AMD Radeon HD 8330
Intel HD Graphics 4200
AMD Radeon R5 (Beema/Carrizo-L)
...
» With all tested laptops playable in detail settings low.
...
AMD Radeon HD 8330
Intel HD Graphics (Bay Trail)
AMD Radeon R4 (Kaveri)
AMD Radeon R5 (Beema/Carrizo-L)
Intel HD Graphics (Braswell)
Intel HD Graphics (Cherry Trail)
AMD Radeon HD 8450G + Radeon HD 8570M Dual Graphics
Intel HD Graphics (Haswell)
AMD Radeon HD 8550G + HD 8670M Dual Graphics
...
Intel Graphics Media Accelerator (GMA) X3100
...
AMD Radeon HD 8240
Intel HD Graphics (Bay Trail)
AMD Radeon R4 (Kaveri)
AMD Radeon HD 8330
Intel HD Graphics (Braswell)
AMD Radeon R5 (Beema/Carrizo-L)
Intel HD Graphics (Cherry Trail)
Intel UHD Graphics 600
AMD Radeon HD 8450G
AMD Radeon HD 8450G + Radeon HD 8570M Dual Graphics
AMD Radeon HD 8550G + HD 8670M Dual Graphics
...
» With all tested laptops playable in detail settings low.
...
NVIDIA GeForce GT 720M
Intel HD Graphics 4200
AMD Radeon R2 (Stoney Ridge)
AMD Radeon HD 8280
AMD Radeon HD 8450G
AMD Radeon HD 8330
AMD Radeon R5 (Beema/Carrizo-L)
AMD Radeon HD 8450G + Radeon HD 8570M Dual Graphics
AMD Radeon HD 8400
Intel HD Graphics (Haswell)
...
AMD FirePro M5100
...
AMD Radeon HD 8400
AMD Radeon HD 8450G
AMD Radeon HD 8450G + Radeon HD 8570M Dual Graphics
ATI Mobility Radeon HD 4530
AMD Radeon R5 (Beema/Carrizo-L)
ATI Mobility Radeon HD 4570
Intel HD Graphics 4200
NVIDIA GeForce GT 740M
...
AMD FirePro M6100
» With all tested laptops playable in detail settings med..
For more games that might be playable and a list of all games and graphics cards visit our Gaming List
v1.26
log 27. 07:44:26
#0 no ids found in url (should be separated by "_") +0s ... 0s
#1 not redirecting to Ajax server +0s ... 0s
#2 did not recreate cache, as it is less than 5 days old! Created at Thu, 25 Apr 2024 05:40:10 +0200 +0.001s ... 0.001s
#3 no comparison url found in template nbc.compare_page_1 needed +0.049s ... 0.05s
#4 no comparison url found in template nbc.compare_page_1 needed +0s ... 0.05s
#5 no comparison url found in template nbc.compare_page_1 needed +0s ... 0.05s
#6 no comparison url found in template nbc.compare_page_1 needed +0s ... 0.051s
#7 composed specs +0s ... 0.051s
#8 did output specs +0s ... 0.051s
#9 start showIntegratedCPUs +0s ... 0.051s
#10 getting avg benchmarks for device 5750 +0.031s ... 0.082s
#11 got single benchmarks 5750 +0.03s ... 0.111s
#12 got avg benchmarks for devices +0s ... 0.111s
#13 min, max, avg, median took s +0.599s ... 0.711s
#14 before gaming benchmark output +0s ... 0.711s
#15 Got 323 rows for game benchmarks. +0.037s ... 0.748s
#16 composed SQL query for gamebenchmarks +0s ... 0.748s
#17 got data and put it in $dataArray +0.098s ... 0.846s
#18 benchmarks composed for output. +3.345s ... 4.191s
#19 no comparison url found in template nbc.compare_page_1 needed +0.006s ... 4.196s
#20 return log +0s ... 4.196s
Notebook reviews with AMD Radeon R5 (Beema/Carrizo-L) graphics card
联想 IdeaPad 110-15ACL (A8-7410, 高清) 笔记本电脑简短评测 体力不足。 联想的这台15.6寸笔记本电脑售价约350欧元(约2558人民币)。它的亮点在1TB硬盘和8GB内存。不过,选购的用户需要接受一颗较慢的处理器和较短的电池续航。...
AMD A8-7410 | AMD Radeon R5 (Beema/Carrizo-L) | 15.60" | 2.2 kg
东芝 Satellite C55D-C-10P Carrizo-L 笔记本电脑简短评测 漫天要价? 东芝为他们的简洁15寸笔记本电脑定价高昂,而它甚至没有搭配一块独立显卡。C55D的优势在哪里?Carrizo-L采用的AMD整合处理器可以带来改变吗?...
AMD A8-7410 | AMD Radeon R5 (Beema/Carrizo-L) | 15.60" | 2.2 kg
惠普 Pavilion 17z 笔记本电脑简短评测 Beema笔记本。 惠普Pavilion 17-f050ng配备了最新一代的AMD Beema系列处理器。请阅读我们的评测以了解为何这款测试机会让我们大吃一惊。...
AMD A8-6410 | AMD Radeon R5 (Beema/Carrizo-L) | 17.30" | 2.6 kg
Lenovo Ideapad 110-15ACL 80TJ00H0GE : AMD A8-7410, 15.60", 2.2 kgExternal Review » Lenovo Ideapad 110-15ACL 80TJ00H0GE
Lenovo Ideapad 110-15ACL : AMD A8-7410, 15.60"External Review » Lenovo Ideapad 110-15ACL
HP 17-y013na : AMD A8-7410, 17.30", 2.7 kgExternal Review » HP 17-y013na
Acer Aspire ES1-522-84WU : AMD A8-7410, 15.60", 2.4 kgExternal Review » Acer Aspire ES1-522-84WU
HP 15-ba023ng : AMD A8-7410, 15.60", 2 kgExternal Review » HP 15-ba023ng
HP 15-ba056ng : AMD A8-7410, 15.60", 2 kgExternal Review » HP 15-ba056ng
HP 15-af119ng : AMD A8-7410, 15.60", 2.2 kgExternal Review » HP 15-af119ng
HP 255 G4 : AMD A8-7410, 15.60", 2.1 kgExternal Review » HP 255 G4
Toshiba Satellite C55DT-C5245 : AMD A8-7410, 15.60", 2.2 kgExternal Review » Toshiba Satellite C55DT-C5245
HP Pavilion 15-P054ND : AMD A8-6410, 15.60", 2.3 kgExternal Review » HP Pavilion 15-P054ND
HP Pavilion 13-a020nr x360 (K1Q28EA) : AMD A8-6410, 13.30", 2 kgExternal Review » HP Pavilion 13-a020nr x360 (K1Q28EA)
HP 15-g005ng : AMD A8-6410, 15.60", 2.2 kgExternal Review » HP 15-g003sm G1M03EA
Please share our article, every link counts!
» Comparison of GPUs
» Benchmark List
» Notebook Gaming List
Class 1 GeForce RTX 2080 Super Mobile
Class 2 M1 Max 32-Core GPU *
GeForce RTX 2070 Super Mobile
M1 Max 24-Core GPU *
Quadro RTX 5000 Max-Q
Radeon RX 5700M *
GeForce GTX 1080 Mobile
Quadro RTX 4000 (Laptop)
M1 Pro 16-Core GPU *
Radeon PRO W6600M *
GeForce RTX 2070 Super Max-Q
Quadro RTX 4000 Max-Q *
M1 Pro 14-Core GPU *
Quadro P5200
Quadro RTX 3000 Max-Q *
Quadro P4200
Quadro P5000 Max-Q *
GeForce GTX 980 (Laptop)
Quadro P4000
Quadro P4000 Max-Q
Quadro P3200
Radeon RX 580X (Laptop) *
Radeon RX 580 (Laptop)
Radeon Pro 5300M
Radeon RX 5300M
Quadro P3000 Max-Q *
Quadro T2000 Max-Q *
Radeon Pro WX 7100 *
Radeon RX 570X (Laptop) *
Radeon RX 570 (Laptop) *
Radeon RX 470 (Laptop) *
Quadro T1000 Max-Q *
Class 3 Vega M GH
Quadro M5000M
GeForce GTX 1050 Ti Mobile
Radeon 680M
Quadro P2000
Quadro P2000 Max-Q
Quadro M4000M
T500 Laptop GPU *
Radeon R9 M395X
GeForce GTX 1050 Ti Max-Q *
Radeon Pro Vega 16
WX Vega M GL
Radeon R9 M485X
Quadro M3000M
FirePro W7170M
Radeon R9 M395
GeForce GTX 1050 Max-Q *
Radeon 660M
Radeon Pro WX 4150 *
Radeon RX 560X (Laptop)
Radeon RX 560 (Laptop)
Radeon RX 460 (Laptop)
Quadro P1000
Radeon R9 M390
Xe MAX
Radeon Pro 560X
Radeon Pro 560
Radeon Pro 460
Radeon Pro WX 4130 *
GeForce GTX 960M
Quadro P620 *
Radeon RX 550X (Laptop)
Radeon Pro WX 3200 *
Radeon Pro 555X
Radeon Pro 555
Radeon Pro 455
Quadro P600
Quadro M2000M
Radeon RX 540X *
Radeon Pro WX 2100 *
Radeon Pro WX 3100 *
GeForce GTX 950M
Radeon Pro 450
Radeon 630
Radeon 540X *
Radeon R9 M385X
Quadro P520
Quadro M1000M
GeForce 945M
Quadro P500 *
Iris Plus Graphics G7 (Ice Lake 64 EU) *
Vega 10 *
Iris Pro Graphics 580
FirePro W5170M *
Radeon R9 M370X
Vega 9
FirePro W5130M
UHD Graphics Xe G4 48EUs *
UHD Graphics 32EUs
UHD Graphics Xe 32EUs (Tiger Lake-H) *
UHD Graphics 750
Vega 7
Radeon R7 M465
Iris Pro Graphics 6200
Vega 8
GeForce 940M
Iris Plus Graphics G4 (Ice Lake 48 EU)
Quadro M600M
FirePro W4190M
Radeon R9 M375
Radeon R7 M445
Iris Plus Graphics 650
Iris Graphics 550
Radeon 625
Vega 6 *
Iris Plus Graphics 640
Iris Graphics 540
UHD Graphics 24EUs (Alder Lake-N) *
Radeon R7 M360
GeForce 920M
Radeon 620
Radeon R7 M340
Radeon 610
Radeon 610M *
Vega 6 *
UHD Graphics G1 (Ice Lake 32 EU)
UHD Graphics Xe 16EUs (Tiger Lake-H) *
HD Graphics 530
Radeon R5 (Bristol Ridge)
Adreno 690 *
Adreno 685 *
Adreno 680 *
Radeon R5 M330
GeForce 910M
HD Graphics 520
Class 4 UHD Graphics 730
Radeon R5 M320 *
Radeon R5 M315 *
Radeon R5 M420 *
Vega 2 *
UHD Graphics 617
UHD Graphics 615
HD Graphics 515
UHD Graphics 610
HD Graphics 510
UHD Graphics 605
Radeon R4 (Stoney Ridge)
Radeon R2 (Stoney Ridge)
HD Graphics (Broadwell)
UHD Graphics 600
HD Graphics (Braswell)
Class 5 * Approximate position of the graphics adapter
Klaus Hinum (Update: 2016-01-26)
 Deutsch
 English
 Español
 Français
 Italiano
 Nederlands
 Polski
 Português
 Русский
 Türkçe
 Svenska
 Chinese
 Magyar