Notebookcheck Logo

NVIDIA RTX Spark N1X 6144-Core Blackwell GPU

NVIDIA RTX Spark N1X 6144-Core Blackwell GPU

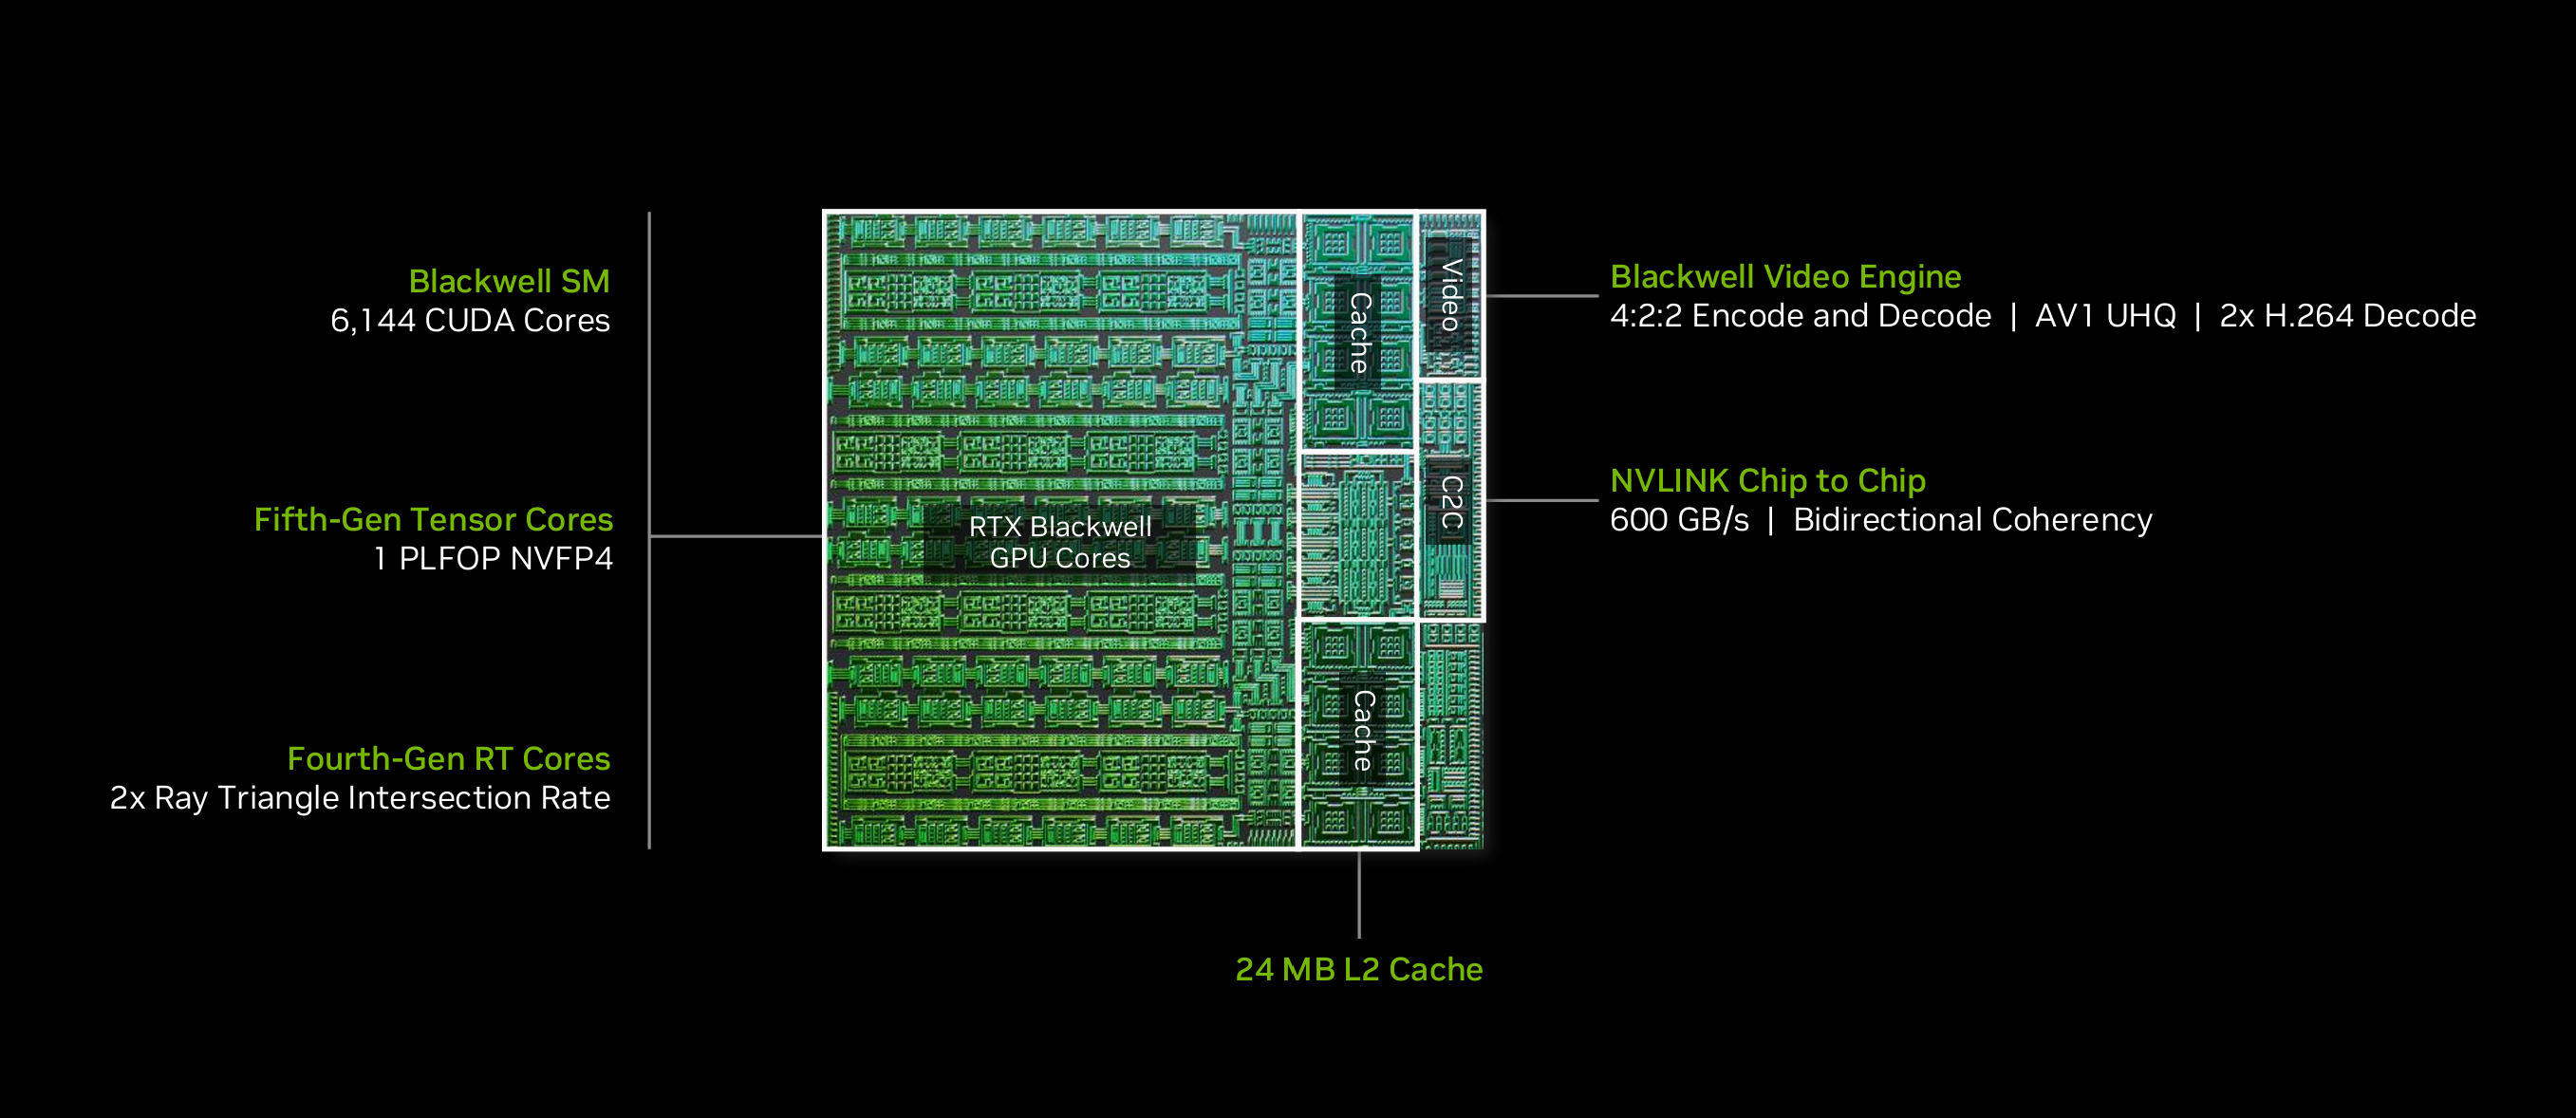
NVIDIA RTX Spark N1X 6144 核 Blackwell GPU 是 N1X RTX Spark 芯片中的集成移动显卡,该芯片配备 20 个 CPU 核心和共享 SoC 内存。因此,就核心数量而言,它高于移动版 GeForce RTX 5070 Ti(5888 核),但后者配备了速度明显更快的 GDDR7 显存(677 GB/s),时钟频率更高,TDP 也更高。相比之下,Spark GPU 使用共享的 256 位 LPDDR5X-9400 统一内存,带宽最高可达 300 GB/s。

性能

因此,其游戏性能仅处于 RTX 5060 移动版 至 RTX 5070 移动版 的水平。与 Apple 的 M5 系列相比,该 GPU 的性能介于 M5 Pro 和 M5 Max 之间。

在本地 AI 性能方面,Spark 凭借大容量共享内存尤其能展现优势。大型模型可以利用强大的 GPU 和大容量系统内存(最高 128 GB)。对于 Llama 3.1 8B 等较小的模型,其优势会减弱,性能仅相当于 RTX 4080。 

功耗

移动版 N1X 的功耗最高可达 85 瓦,因此仍远低于独立 GPU。在我们的测试中,其能效与 RTX 5070 Laptop 相当。

ArchitectureBlackwell
iGPUIntegrated Graphics
Pipelines6144 - unified
TMUs192
ROPs48
Raytracing Cores48
Tensor / AI Cores192
Core Speed2531 (Boost) MHz
CacheL1: 6 MB, L2: 24 MB
Memory TypeDDR5X
Shared Memoryyes
APIDirectX 12_2, OpenGL 4.6, OpenCL 3.0, Vulkan 1.4
Man. Technology3 nm
PCIe5
Notebook Sizemedium sized
Date of Announcement15.10.2026
CPU in RTX Spark N1X 6144-Core Blackwell GPUGPU Base SpeedGPU Boost / Turbo
Nvidia RTX Spark N1X 20-Core20 x 1500 MHz? MHz2535 MHz

Benchmarks

3DMark - 3DMark Speed Way Score
min: 2987     avg: 2989     median: 2988.5 (20%)     max: 2990 Points
3DMark - 3DMark Steel Nomad
3134 Points (22%)
3DMark - 3DMark Steel Nomad Light
min: 12900     avg: 13083     median: 13083 (30%)     max: 13266 Points
3DMark - 3DMark Fire Strike Standard Score
min: 22706     avg: 23122     median: 23122 (35%)     max: 23538 Points
3DMark - 3DMark Fire Strike Standard Graphics
min: 28207     avg: 28626     median: 28626 (26%)     max: 29045 Points
3DMark - 3DMark Time Spy Score
min: 12832     avg: 12931     median: 12931 (34%)     max: 13030 Points
3DMark - 3DMark Time Spy Graphics
min: 12456     avg: 12545     median: 12545 (26%)     max: 12634 Points
Intel UHD Graphics 600
107.5 -99%
...
10478 -16%
10681 -15%
10783 -14%
10860 -13%
11067 -12%
11609 -7%
11637 -7%
11837 -6%
11850 -6%
NVIDIA RTX Spark N1X 6144-Core Blackwell GPU
12545
12640 1%
12806 2%
13255 6%
NVIDIA RTX PRO 3000 Blackwell Generation Laptop
14875 19%
15184 21%
16308 30%
16621 32%
17764 42%
19434 55%
...
NVIDIA RTX PRO 5000 Blackwell Generation Laptop
23277 86%
max:
NVIDIA GeForce RTX 5090
44063 251%
0%
100%
Restrict / Search: Model: Max. age: years
3DMark 11 - 3DM11 Performance Score
min: 25983     avg: 26497     median: 26497 (32%)     max: 27011 Points
3DMark 11 - 3DM11 Performance GPU
min: 39804     avg: 40835     median: 40835 (31%)     max: 41866 Points
171.8 -100%
...
AMD Radeon 8050S
36323 -11%
37375 -8%
37918 -7%
38052 -7%
38259 -6%
38895 -5%
39402 -4%
40391 -1%
40462 -1%
NVIDIA RTX Spark N1X 6144-Core Blackwell GPU
40835
41630 2%
42016 3%
43219 6%
43753 7%
44377 9%
46877 15%
NVIDIA RTX PRO 3000 Blackwell Generation Laptop
49410 21%
51979 27%
54921 34%
...
NVIDIA RTX PRO 5000 Blackwell Generation Laptop
68271 67%
max:
NVIDIA GeForce RTX 5090
129772 218%
0%
100%
Restrict / Search: Model: Max. age: years
Blender - Blender 3.3 Classroom CUDA *
32 Seconds (5%)
Blender - Blender 3.3 Classroom OPTIX *
20 Seconds (7%)
Cinebench R15
Cinebench R15 OpenGL 64 Bit +
Cinebench R15 - Cinebench R15 OpenGL 64 Bit
min: 178.9     avg: 183.8     median: 183.8 (11%)     max: 188.7 fps
Cinebench R15 OpenGL Ref. Match 64 Bit +
Cinebench R15 - Cinebench R15 OpenGL Ref. Match 64 Bit
97.6 % (98%)
Geekbench 7.0 - Geekbench 7.0 GPU OpenCL
118849 Points (63%)
Geekbench 6.7 - Geekbench 6.7.1 GPU OpenCL
min: 130738     avg: 137844     median: 137844 (35%)     max: 144949 points
Power Consumption - Furmark Stress Test Power Consumption - external Monitor *
min: 104.2     avg: 113.7     median: 113.7 (15%)     max: 123.2 Watt
05101520253035404550556065707580859095100105110115120125130135140Tooltip
Power Consumption - Cyberpunk 2077 Power Consumption 150cd *
min: 115.4     avg: 125     median: 125 (35%)     max: 134.5 Watt
05101520253035404550556065707580859095100105110115120125130135Tooltip
Power Consumption - Cyberpunk 2077 Power Consumption - external Monitor *
min: 115.7     avg: 123.5     median: 123.5 (16%)     max: 131.3 Watt
05101520253035404550556065707580859095100105110115120125130135Tooltip
Power Consumption - Power Efficiency - Cyberpunk 2077 ultra
min: 0.585     avg: 0.6     median: 0.6 (1%)     max: 0.654 fps per Watt
- Range of benchmark values
red legend - Average benchmark values
* Smaller numbers mean a higher performance

Game Benchmarks

The following benchmarks stem from our benchmarks of review laptops. The performance depends on the used graphics memory, clock rate, processor, system settings, drivers, and operating systems. So the results don't have to be representative for all laptops with this GPU. For detailed information on the benchmark results, click on the fps number.

low 1920x1080
68.3  fps    + Compare
med. 1920x1080
64.2  fps    + Compare
high 1920x1080
60.7  fps    + Compare
ultra 1920x1080
58.8  fps    + Compare
QHD 2560x1440
43.9  fps    + Compare
» With all tested laptops playable in detail settings ultra.
low 1920x1080
91  fps    + Compare
med. 1920x1080
76  fps    + Compare
high 1920x1080
64  fps    + Compare
ultra 1920x1080
38  fps    + Compare
QHD 2560x1440
27  fps    + Compare
» With all tested laptops playable in detail settings ultra.
ultra 1920x1080
26  fps    + Compare
QHD 2560x1440
23  fps    + Compare
» The benchmarks indicate that the game is not playable in the tested settings.
low 1920x1080
106.4  fps    + Compare
med. 1920x1080
84.9  fps    + Compare
high 1920x1080
76.9  fps    + Compare
ultra 1920x1080
68.7  fps    + Compare
QHD 2560x1440
52.9  fps    + Compare
» With all tested laptops playable in detail settings ultra.
Additional Benchmarks
Very Ultra Preset + Full Path Tracing + Quality DLSS + Frame Generation 2560x1440
72.8
Marvel Rivals

Marvel Rivals

2024
ultra 1920x1080
55  fps    + Compare
QHD 2560x1440
41  fps    + Compare
» With all tested laptops playable in detail settings ultra.
low 1920x1080
95.3 99.3 ~ 97 fps    + Compare
med. 1920x1080
91.5 96.1 ~ 94 fps    + Compare
high 1920x1080
83 85.6 ~ 84 fps    + Compare
ultra 1920x1080
76.6 76.6 ~ 77 fps    + Compare
QHD 2560x1440
54.6 56.8 ~ 56 fps    + Compare
QHD DLSS 2560x1440
63.6  fps    + Compare
» With all tested laptops playable in detail settings ultra.
Additional Benchmarks
30min Start Ultra Preset (FSR off) 1920x1080
76.8
75.7
low 1920x1080
114  fps    + Compare + 📈 Graph
med. 1920x1080
100.9  fps    + Compare + 📈 Graph
high 1920x1080
94.3  fps    + Compare + 📈 Graph
ultra 1920x1080
93.4 97.4 ~ 95 fps    + Compare + 📈 Graph
QHD 2560x1440
75.8 79.1 ~ 77 fps    + Compare + 📈 Graph
» With all tested laptops playable in detail settings ultra.
Strange Brigade

Strange Brigade

2018
low 1280x720
295 350 ~ 323 fps    + Compare
med. 1920x1080
201 230 ~ 216 fps    + Compare
high 1920x1080
192 213 ~ 203 fps    + Compare
ultra 1920x1080
180 192 ~ 186 fps    + Compare
QHD 2560x1440
133 140 ~ 137 fps    + Compare
» With all tested laptops playable in detail settings ultra.
low 1280x720
68.6 73.1 ~ 71 fps    + Compare
med. 1920x1080
60.2 70.5 ~ 65 fps    + Compare
high 1920x1080
52.8 55 ~ 54 fps    + Compare
» With all tested laptops playable in detail settings high.
low 1280x720
122.1 140.4 ~ 131 fps    + Compare
med. 1920x1080
113.4 117.9 ~ 116 fps    + Compare
high 1920x1080
95.7 99.9 ~ 98 fps    + Compare
QHD 2560x1440
83 83.5 ~ 83 fps    + Compare
» With all tested laptops playable in detail settings high.
low 1280x720
103.4 111.1 ~ 107 fps    + Compare
med. 1366x768
101.3 106.1 ~ 104 fps    + Compare
high 1920x1080
95.8 99.7 ~ 98 fps    + Compare
ultra 1920x1080
91.8 97.4 ~ 95 fps    + Compare
» With all tested laptops playable in detail settings ultra.
GTA V

GTA V

2015
ultra 1920x1080
62.9  fps    + Compare
QHD 2560x1440
54.7  fps    + Compare
» With all tested laptops playable in detail settings ultra.
lowmed.highultraQHD4K
007 First Light68.364.260.758.843.9
Forza Horizon 69176643827
Assassin's Creed Shadows2623
Indiana Jones and the Great Circle106.484.976.968.752.9
Marvel Rivals5541
Cyberpunk 20779794847756
Baldur's Gate 3114100.994.39577
Strange Brigade323216203186137
X-Plane 11.11716554
Final Fantasy XV Benchmark1311169883
Dota 2 Reborn1071049895
GTA V62.954.7
lowmed.highultraQHD4K
< 30 fps
< 60 fps
< 120 fps
≥ 120 fps


7
2


8
1

1
7
1
1
3
5
1
2
5
2
1


For more games that might be playable and a list of all games and graphics cards visit our Gaming List

Amazon Logo
  • $3,299.99
    msi Prestige N16 Flip AI+ 16” 2.8k OLED 2-in-1 Touchscreen Laptop, NVIDIA RTX Spark N1X with 6144-core GPU and 20-core CPU, 120Hz, 32GB LPDDR5X, 1TB SSD, Pen, Win 11 Pro: Platinum Gray C1XMT-067USY
  • $9,489.00
    HIDevolution [2026] ASUS ProArt P14 H7407BA 14" 3K 120Hz 700 Nits OLED Touch, White, NVIDIA RTX Spark N1X 6144-Core GPU 20-Core CPU, 128 GB Unified Memory, 8 TB PCIe SSD, Windows 11 Pro
  • $8,139.00
    HIDevolution [2026] ASUS ProArt P14 H7407BA 14" 3K 120Hz 700 Nits OLED Touch, White, NVIDIA RTX Spark N1X 6144-Core GPU 20-Core CPU, 128 GB Unified Memory, 4 TB PCIe SSD, Windows 11 Pro
  • $6,739.00
    HIDevolution [2026] MSI Prestige N16 Flip AI+ C1XMT 16" 2.8K 120Hz OLED Touch, NVIDIA RTX Spark N1X 6144-Core GPU 20-Core CPU, 64 GB Unified Memory, 8 TB PCIe SSD, Windows 11 Pro
  • $5,389.00
    HIDevolution [2026] MSI Prestige N16 Flip AI+ C1XMT 16" 2.8K 120Hz OLED Touch, NVIDIA RTX Spark N1X 6144-Core GPU 20-Core CPU, 64 GB Unified Memory, 4 TB PCIe SSD, Windows 11 Pro

v1.35
log 19. 16:22:15

#0 ran 0s before starting gpusingle class +0s ... 0s

#1 no ids found in url (should be separated by "_") +0s ... 0s

#2 not redirecting to Ajax server +0s ... 0s

#3 did not recreate cache, as it is less than 5 days old! Created at Mon, 19 Oct 2026 12:54:45 +0200 +0.002s ... 0.002s

#4 composed specs +0.02s ... 0.022s

#5 did output specs +0s ... 0.022s

#6 start showIntegratedCPUs +0s ... 0.022s

#7 getting avg benchmarks for device 13706 +0.018s ... 0.04s

#8 got single benchmarks 13706 +0.009s ... 0.049s

#9 got avg benchmarks for devices +0s ... 0.049s

#10 min, max, avg, median took s +1.054s ... 1.103s

#11 before gaming benchmark output +0s ... 1.103s

#12 Got 119 rows for game benchmarks. +0.007s ... 1.11s

#13 composed SQL query for gamebenchmarks +0s ... 1.11s

#14 got data and put it in $dataArray +0.008s ... 1.118s

#15 benchmarks composed for output. +0.143s ... 1.261s

#16 no comparison url found in template nbc.compare_page_1 needed +0.61s ... 1.871s

#17 return log +0s ... 1.871s

Google LogoAdd as a preferred source on Google
Mail Logo

» Comparison of GPUs
Detailed list of all laptop GPUs sorted by class and performance.

» Benchmark List
Sort and restrict laptop GPUs based on performance in synthetic benchmarks.

» Notebook Gaming List
Playable games for each graphics card and their average FPS results.

Class 1

Class 2

GeForce RTX 2080 Super Mobile
RTX PRO 2000 Blackwell Generation Laptop
M5 Max 32-Core GPU *
M1 Max 32-Core GPU *
M1 Max 24-Core GPU *
GeForce RTX 2070 Super Mobile
Radeon 8050S
Quadro RTX 5000 Max-Q
Radeon RX 5700M *
Quadro RTX 4000 (Laptop)
GeForce GTX 1080 Mobile
M1 Pro 16-Core GPU *
Radeon PRO W6600M *
GeForce RTX 2070 Super Max-Q
RTX PRO 1000 Blackwell Generation Laptop *
M1 Pro 14-Core GPU *
Quadro RTX 4000 Max-Q
Quadro RTX 3000 Max-Q
Radeon 8040S *
Pro A60M *

Class 3

Pro A30M
Radeon Pro 5300M
Radeon RX 5300M
Adreno 850 *
Adreno 840 V Series *
GeForce GTX 1050 Ti Mobile
GeForce GTX 1050 Ti Max-Q
Radeon 680M
T500 Laptop GPU
Arc 130T
Radeon Pro Vega 16
GeForce GTX 1050 Max-Q
Radeon 660M
Xe MAX
Radeon Pro 560X
Radeon Pro 560
Quadro P620
Radeon RX 550X (Laptop)
Radeon Pro WX 3200 *
Radeon Pro 555X
Radeon Pro 555
Graphics 3-Core iGPU (Arrow Lake) *
Graphics 2-Core iGPU (Arrow Lake) *
Radeon 630
Quadro P520
Radeon 540X *
Vega 10
Vega 9
UHD Graphics 32EUs
UHD Graphics 750
Vega 7
UHD Graphics Xe 32EUs (Tiger Lake-H)
UHD Graphics Xe G4 48EUs
CXTP-48-1536 *
Vega 8
UHD Graphics 730
Vega 6 *
UHD Graphics 24EUs (Alder Lake-N) *
Radeon 610M *
Vega 6 *
UHD Graphics Xe 16EUs *
Adreno 690 *
Adreno 685 *
Adreno 680 *

Class 4

* Approximate position of the graphics adapter

Klaus Hinum (Update: 2026-10-19)