

Notebookcheck Logo
Teaser

Nvidia RTX Spark 解析 - 终于有了应对 Apple M5 Pro & M5 Max 的答案?

本地 AI 性能猛兽。

RTX Spark 是 Nvidia 的首款 SoC,集成了定制 ARM CPU、Blackwell GPU 和最高 128 GB 内存。这款新芯片专为 AI 工作负载和内容创作者设计,也可以用来玩游戏。我们测试了这款全新的 RTX Spark SoC,并将其与 Apple、AMD、Intel 和 Qualcomm 的产品进行了比较。
Andreas Osthoff, 👁 Andreas Osthoff (translated by DeepL / Ninh Duy) Published 🇺🇸 🇩🇪 ...
Nvidia ARM Benchmark AI Blackwell RTX 5000 Laptop / Notebook RTX Spark Wi-Fi 7 Windows

Nvidia 全新的 RTX Spark 芯片终于来了。我们有机会测试这一新平台,并将结果与 AMD(尤其是 Strix Halo)、Intel、Qualcomm 以及当然少不了的 Apple M5 系列等其他笔记本电脑芯片进行比较。我们测试了 CPU 性能、GPU 性能、游戏性能、AI 性能和能效。

Nvidia RTX Spark N1X 概述
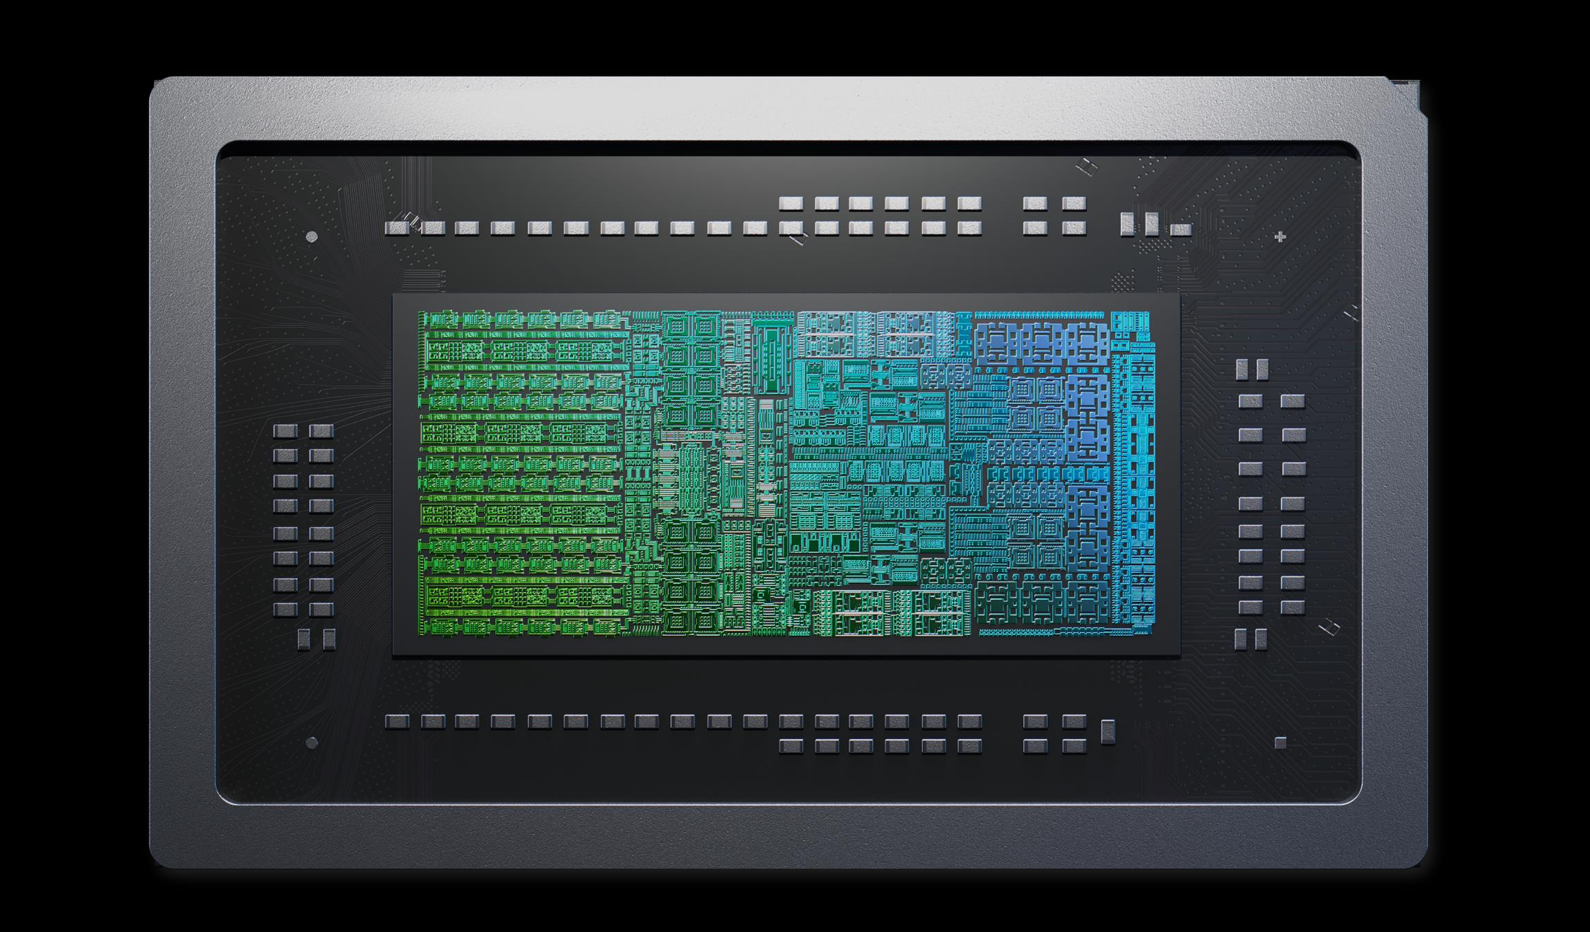
Nvidia RTX Spark N1X
ⓘ Nvidia
Nvidia RTX Spark N1X

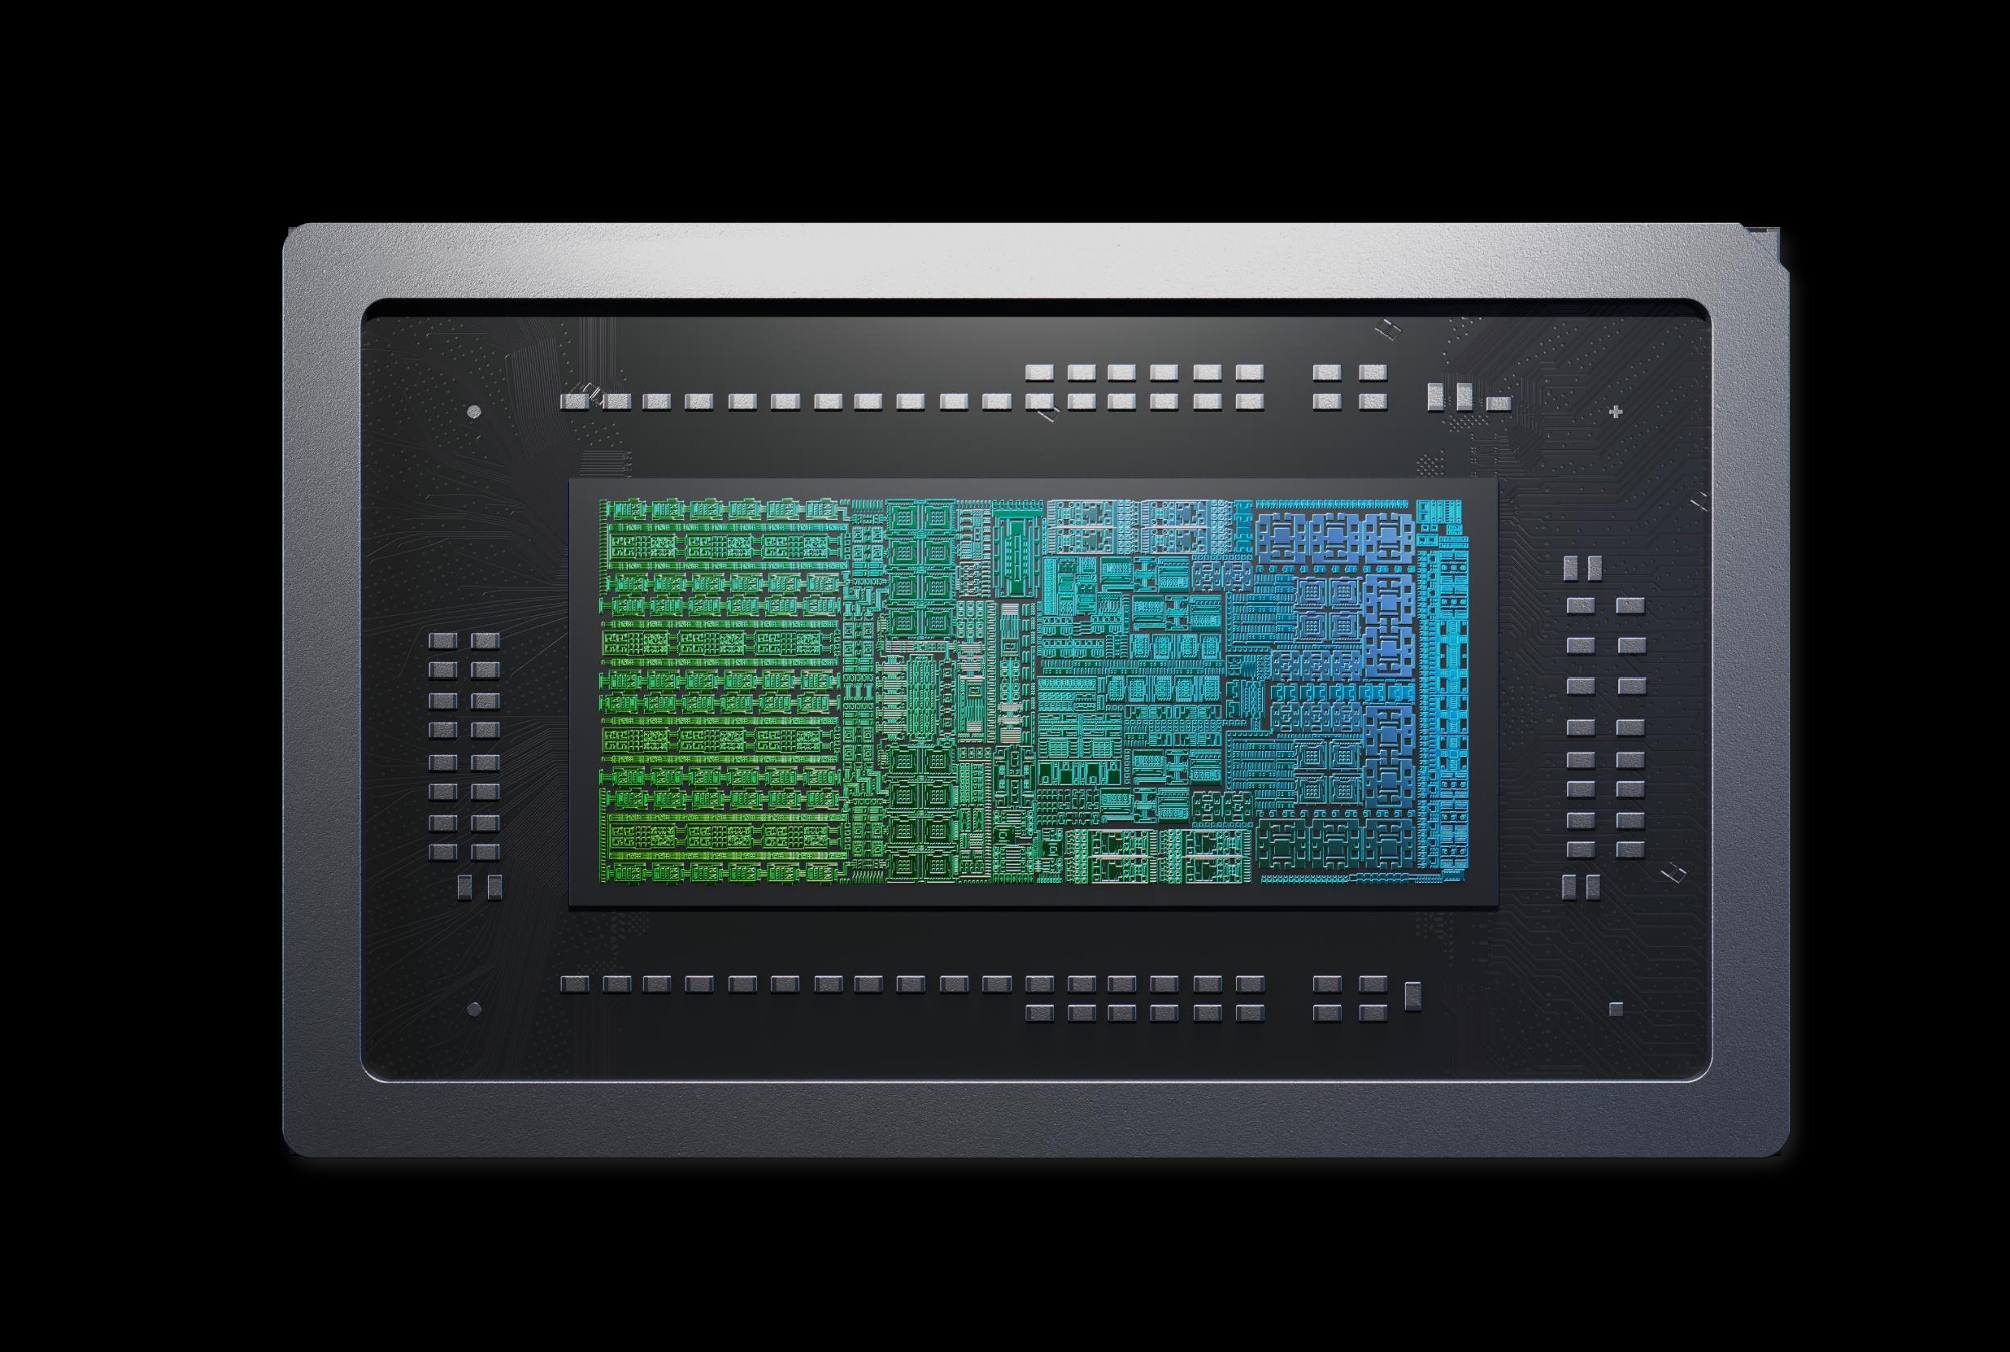
RTX Spark N1X 是 Nvidia 首款将定制 ARM CPU、Nvidia Blackwell GPU 以及最高 128 GB 内存整合在一起的 SoC。我们对这种设计已经很熟悉,Apple 的 M 系列芯片以及 AMD 的 Strix Halo SoC 都采用了类似方案。由于 RTX Spark N1X 使用 ARM CPU,因此也需要 ARM 版 Windows,兼容性也将是需要考虑的一个方面。RTX Spark N1X 用于移动设备时的最大 TDP 为 80 瓦,而桌面系统的功耗最高可达 120 瓦。

Nvidia 采用定制的 MediaTek CPU,最多配备 20 个核心,分为四个集群。其中包括最多十个性能核心(ARM Cortex X925,最高 4.1 GHz)和十个能效核心(ARM Cortex A725,最高 2.8 GHz)。该 CPU 由 TMSC 采用 3 nm 工艺制造。CPU 芯粒还集成了支持最高 128 GB LPDDR5x-9400 RAM 的内存接口、显示接口(HDMI 2.1a & DisplayPort 2.0)以及高速 I/O 连接(4x USB 4.0、PCIe 5.0、Wi-Fi 7)。
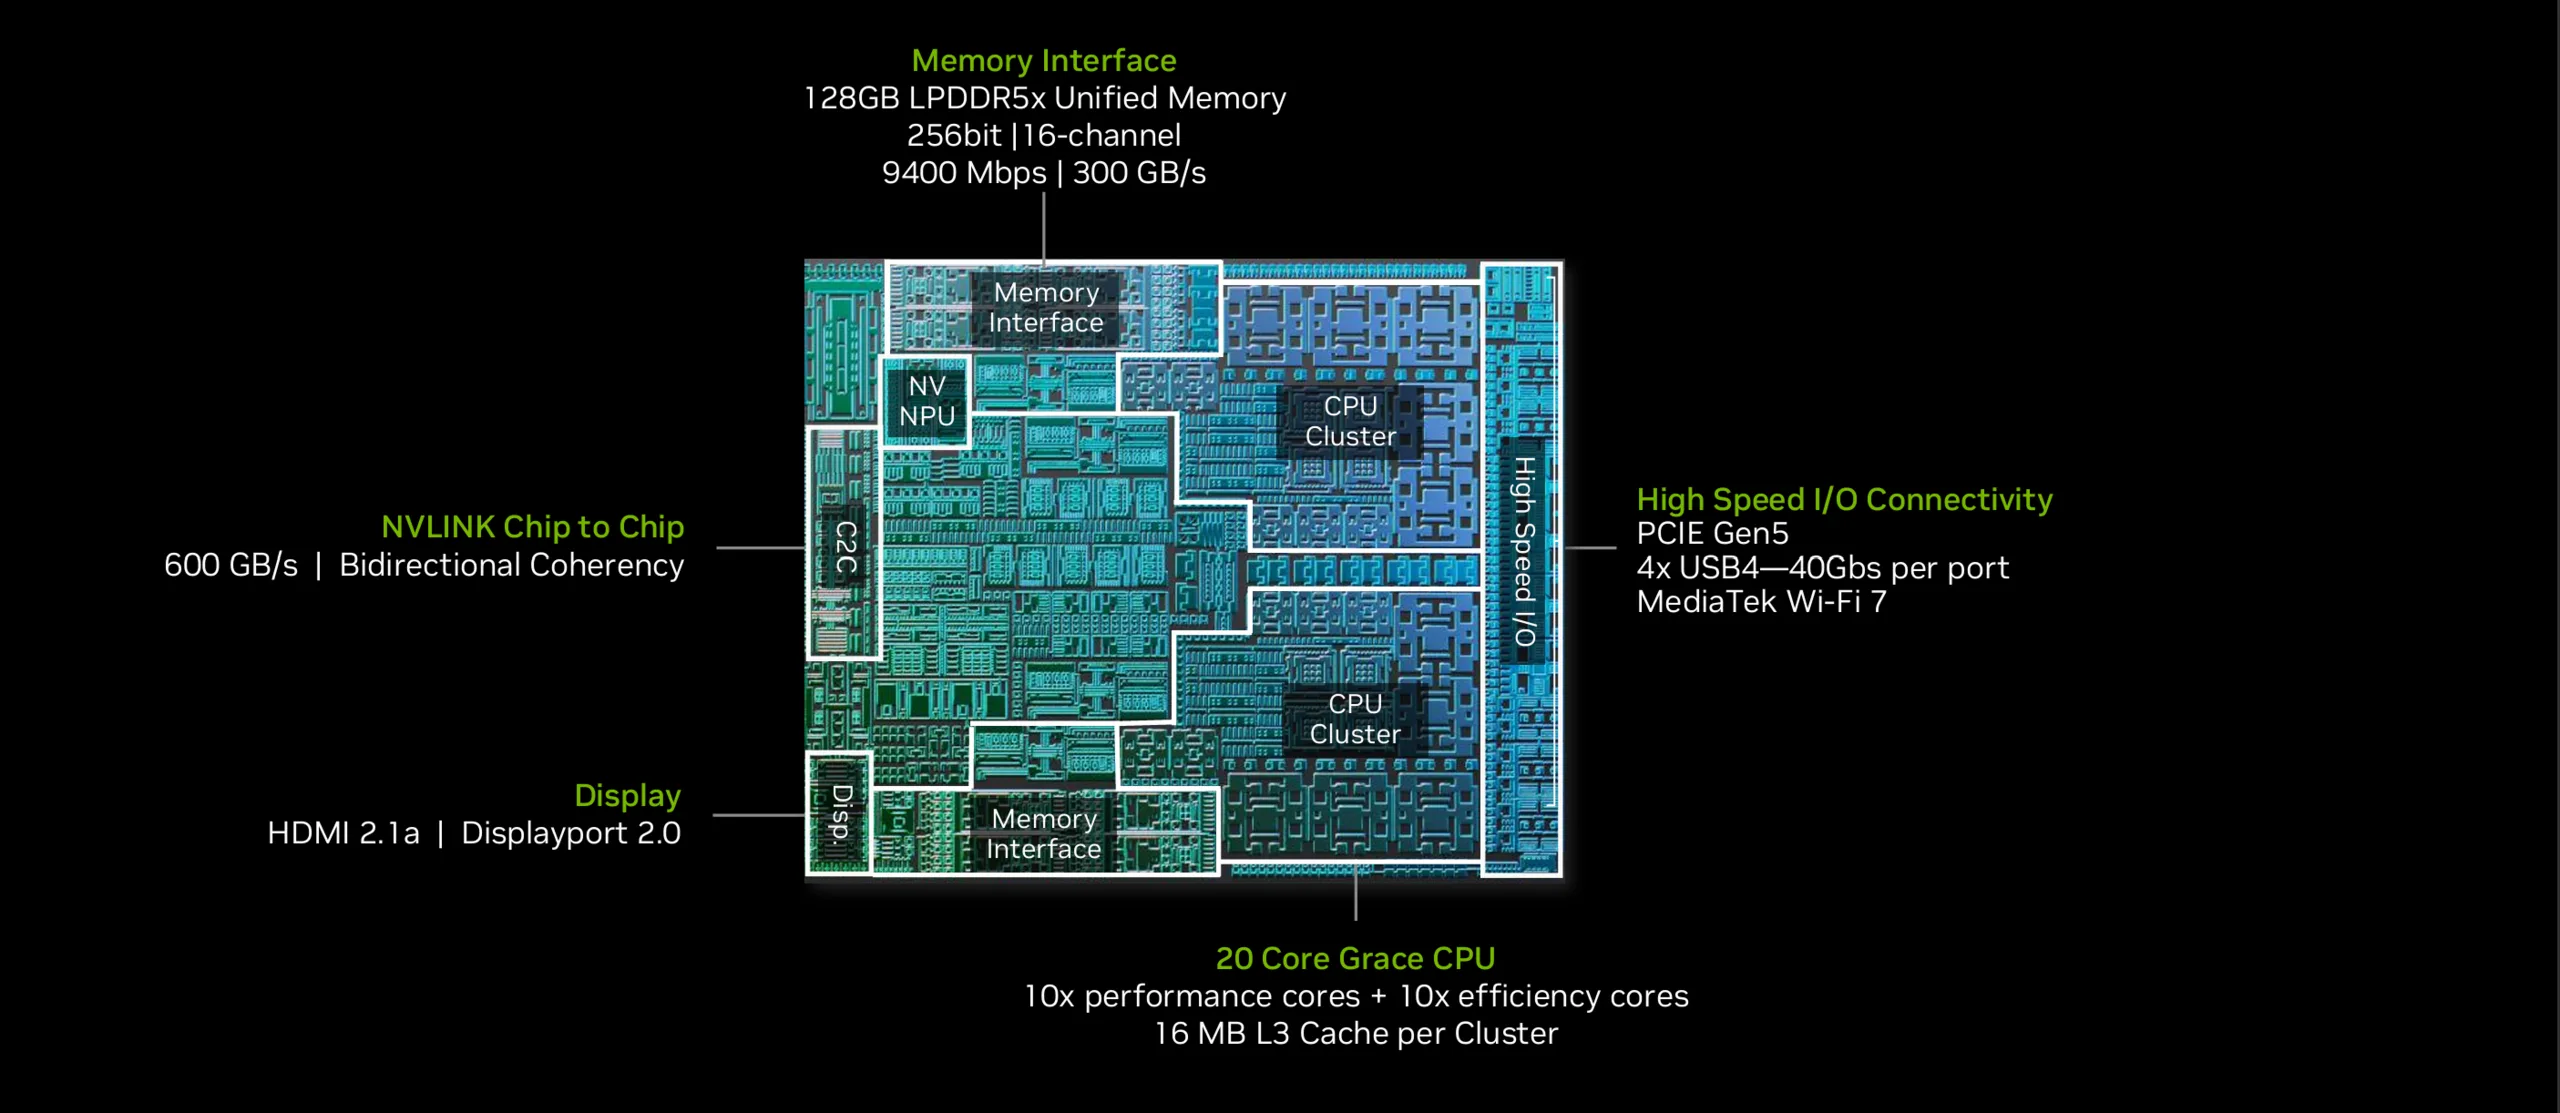
RTX Spark N1X 20核 ARM CPU
ⓘ Nvidia
RTX Spark N1X 20核 ARM CPU

GPU 部分采用了我们熟悉的 Blackwell GPU (GB20B),配备 5120 或 6144 个 CUDA 核心,运行频率最高可达 2535 MHz。由于芯片架构与 GeForce RTX 5070 等当前消费级 GPU 相同,N1X GPU 也能利用 DLSS5 或帧生成等所有现有的软件优化技术。 
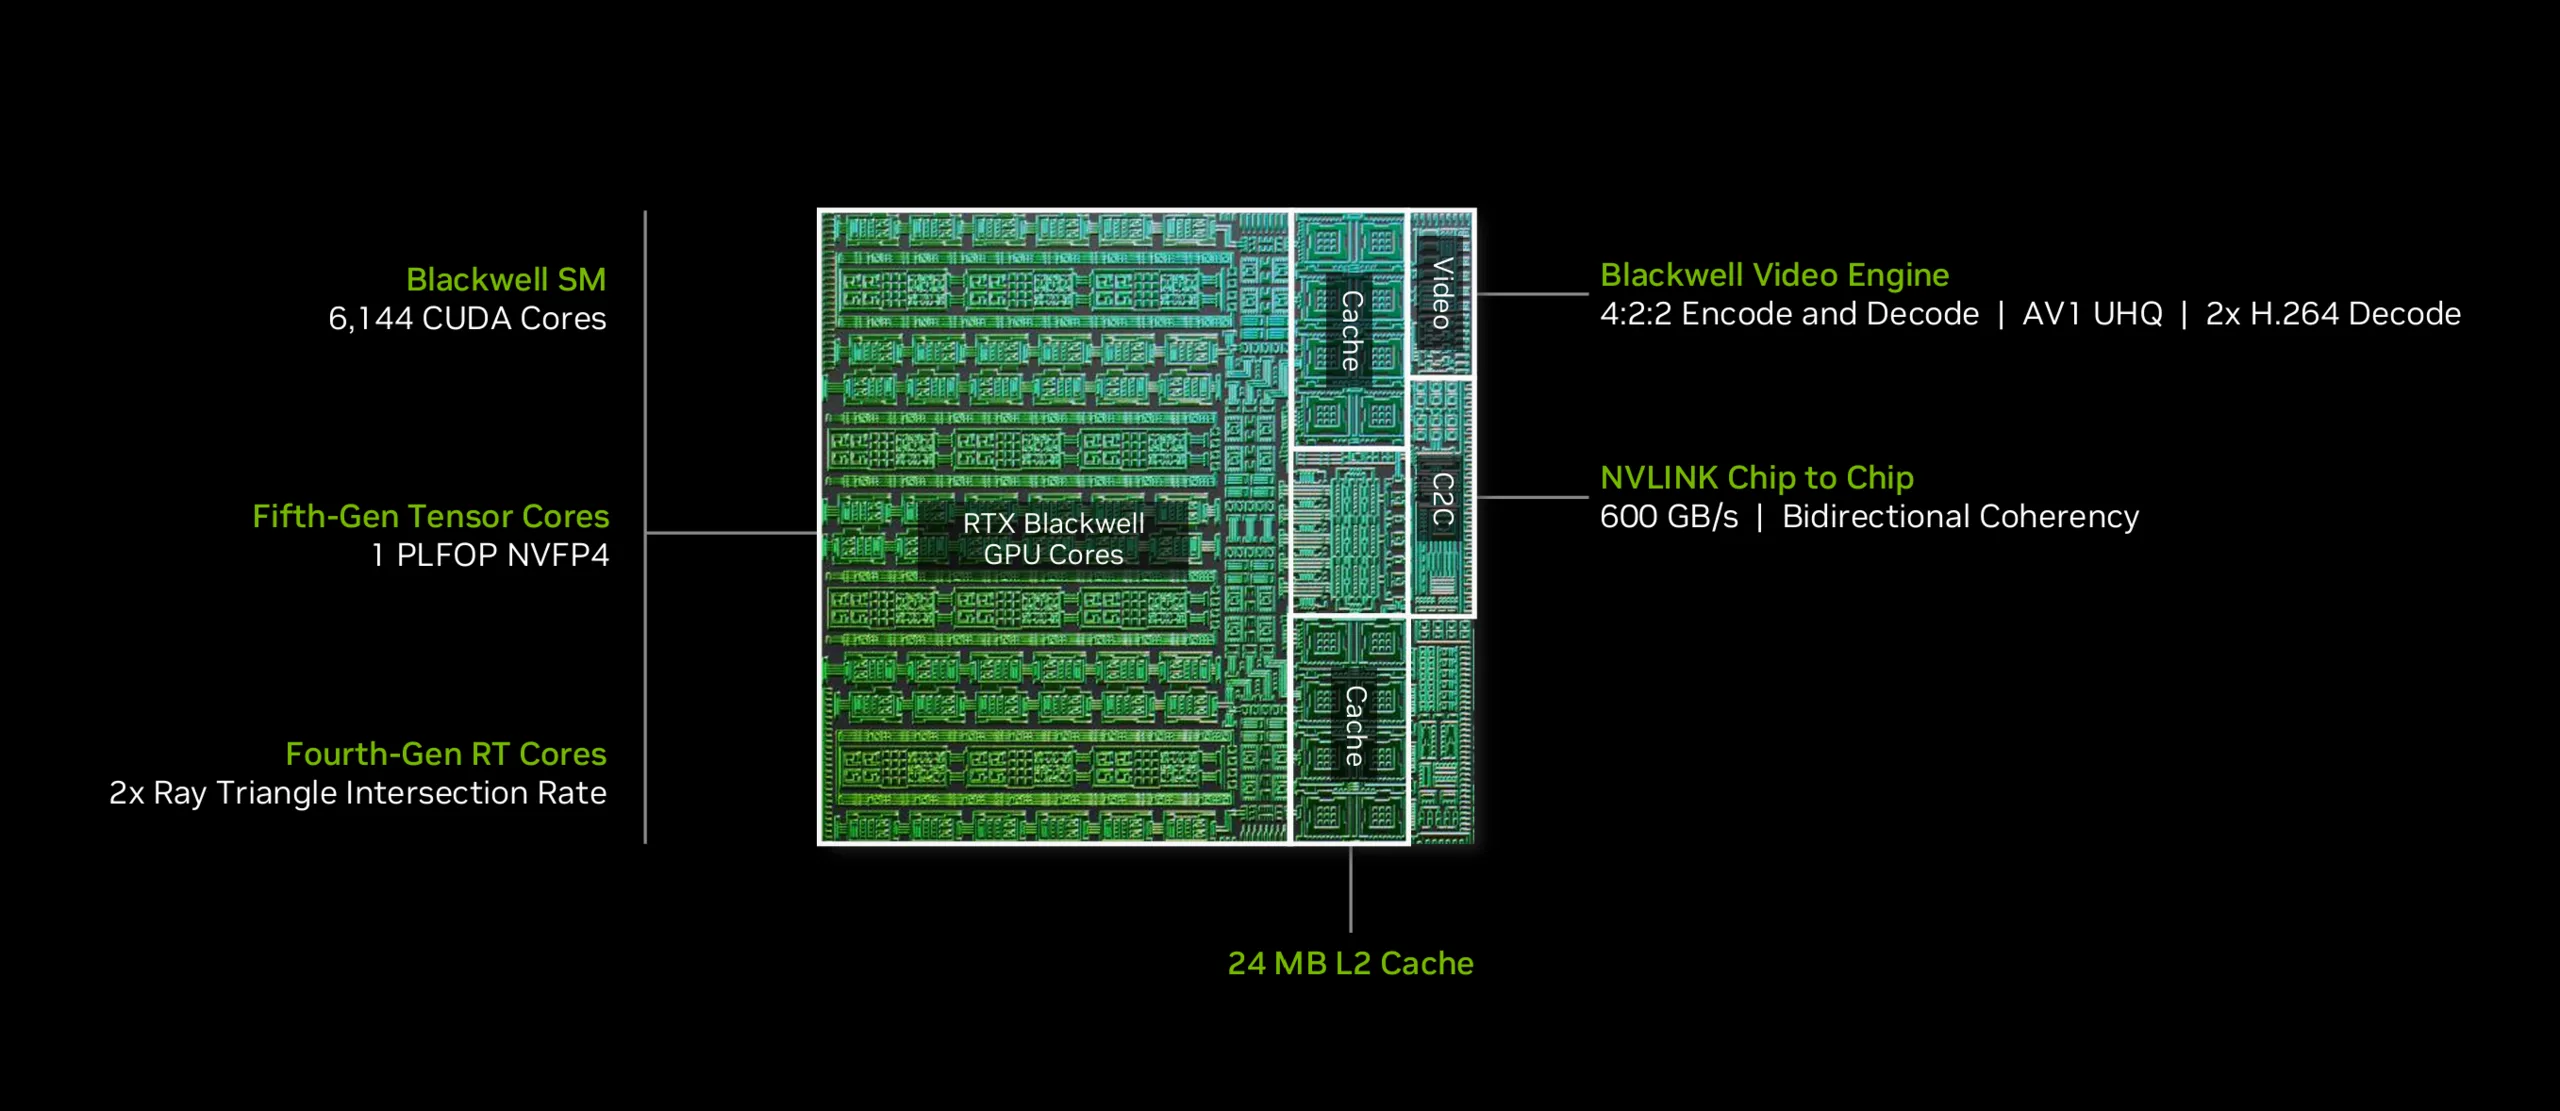
RTX Spark N1X 6144核 Blackwell GPU
ⓘ Nvidia
RTX Spark N1X 6144核 Blackwell GPU

最大内存带宽为 300 GB/s,与 Apple 的 M5 Pro SoC 相当。CPU 和 GPU 芯粒通过 NVLink 连接,带宽为 600 GB/s。除了配备 20 个 CPU 核心和 6144 个 GPU 核心的 N1X 外,还有一款规模较小的 N1X,配备 18 个 CPU 核心(9 个性能核心 + 9 个能效核心)以及 5120 个 GPU 核心。由于名称相同,购买搭载 RTX Spark 的笔记本电脑时,务必留意具体规格。两款 N1X 的完整技术规格请参见下表。
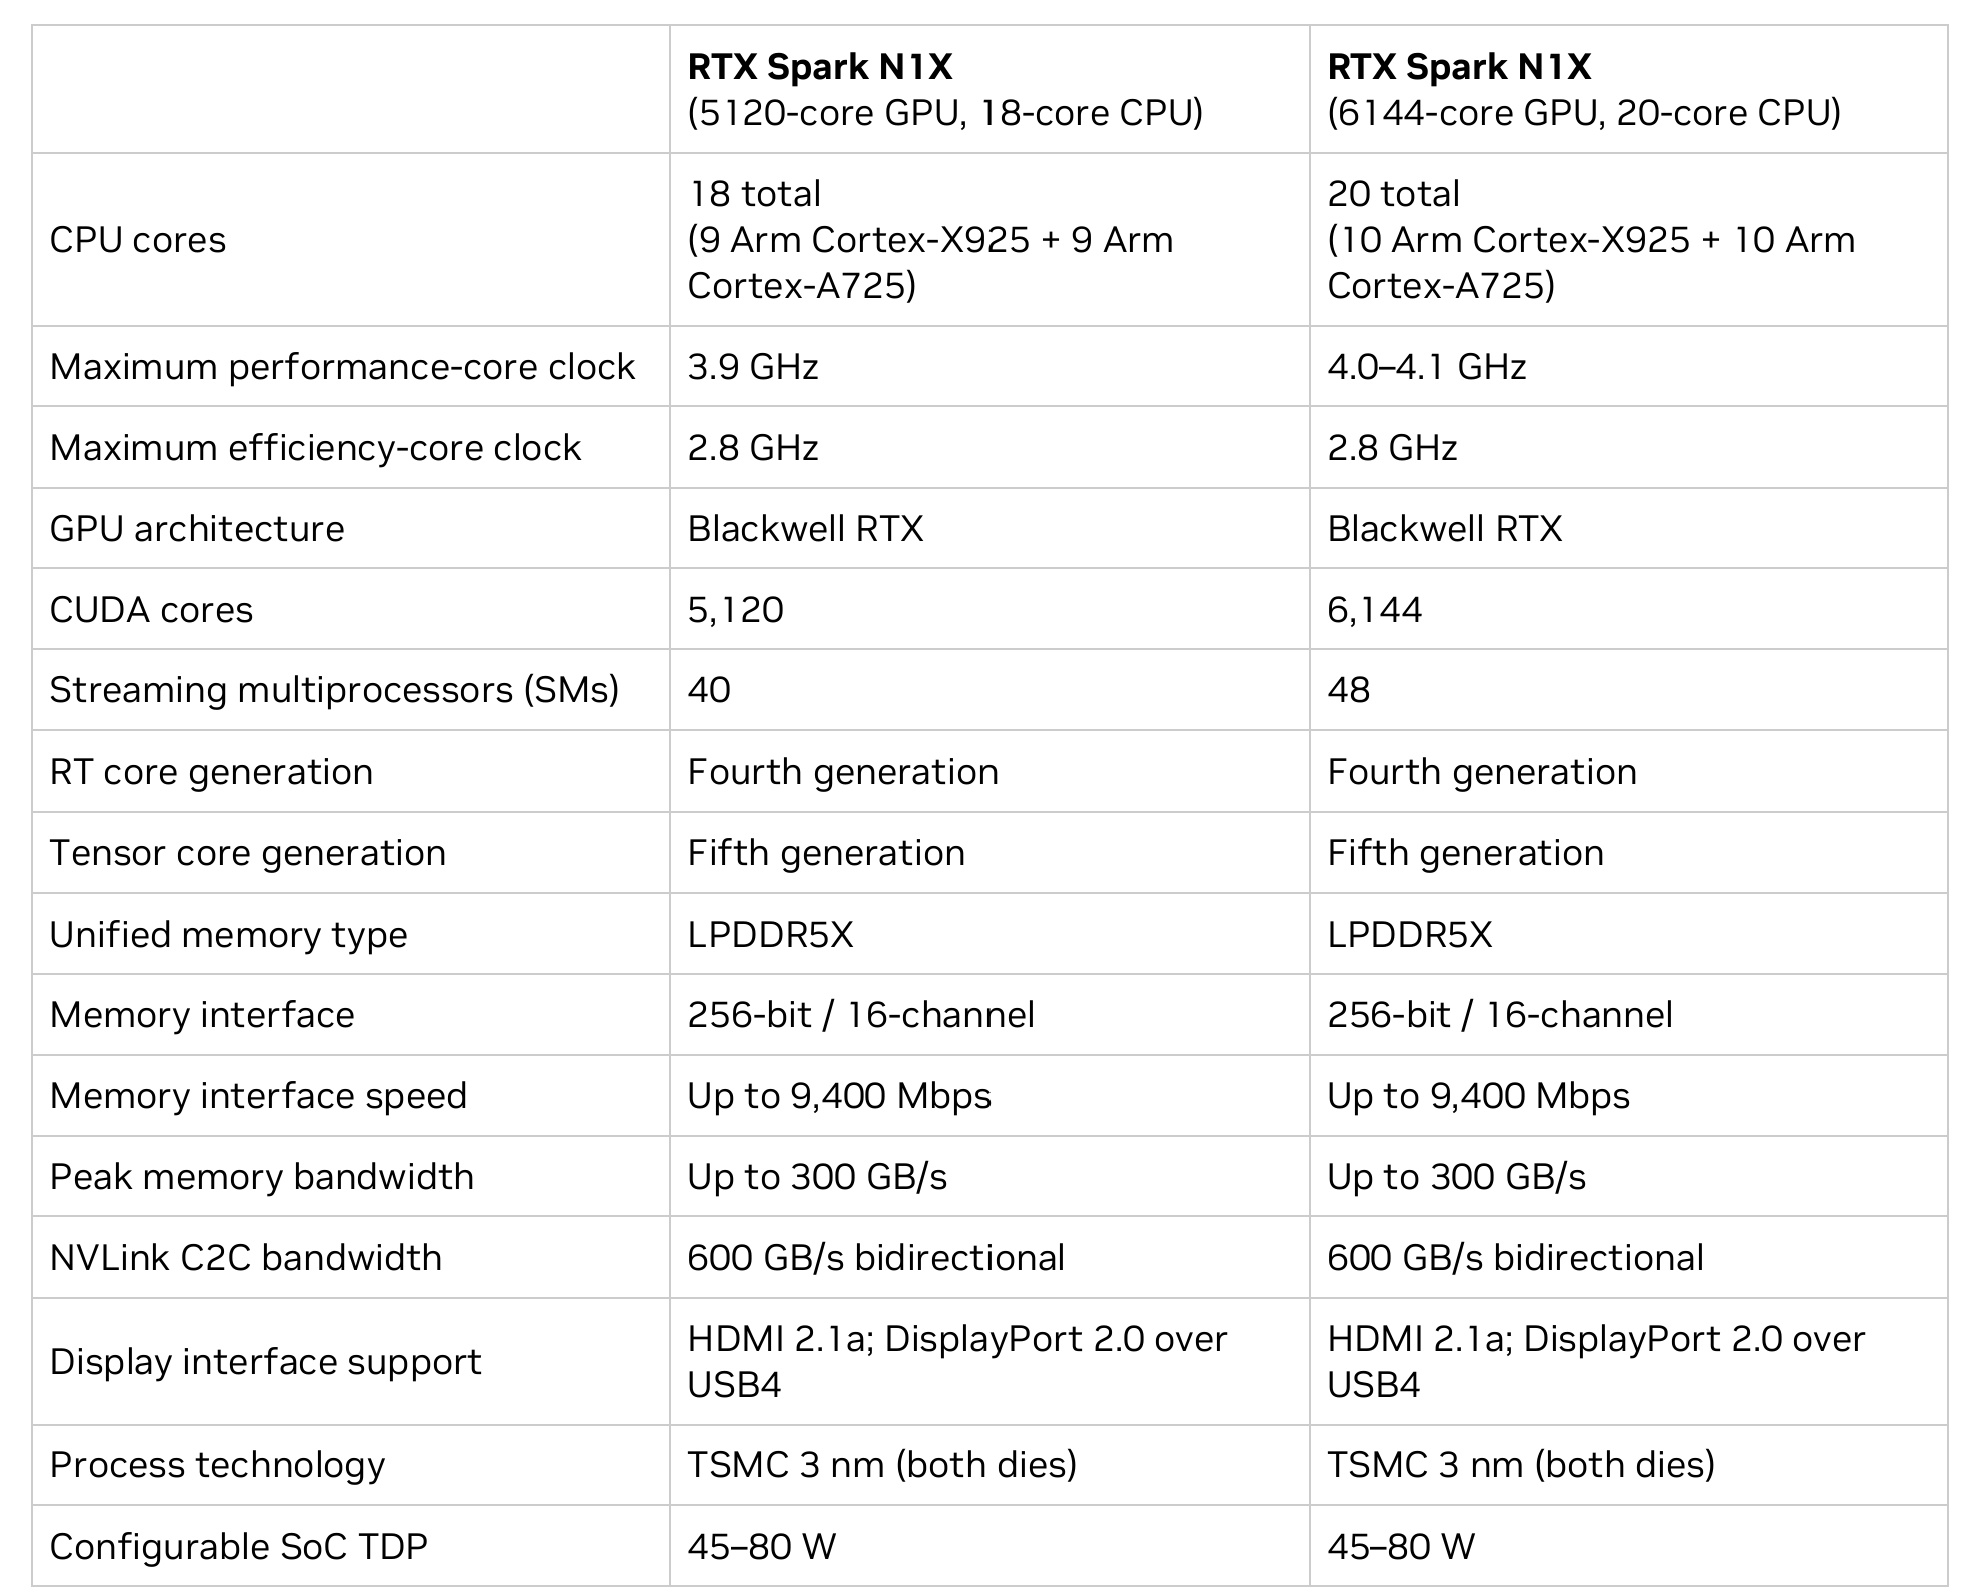
RTX Spark N1X 概述
ⓘ Nvidia
RTX Spark N1X 概述

测试系统

Asus ProArt P16 RTX Spark

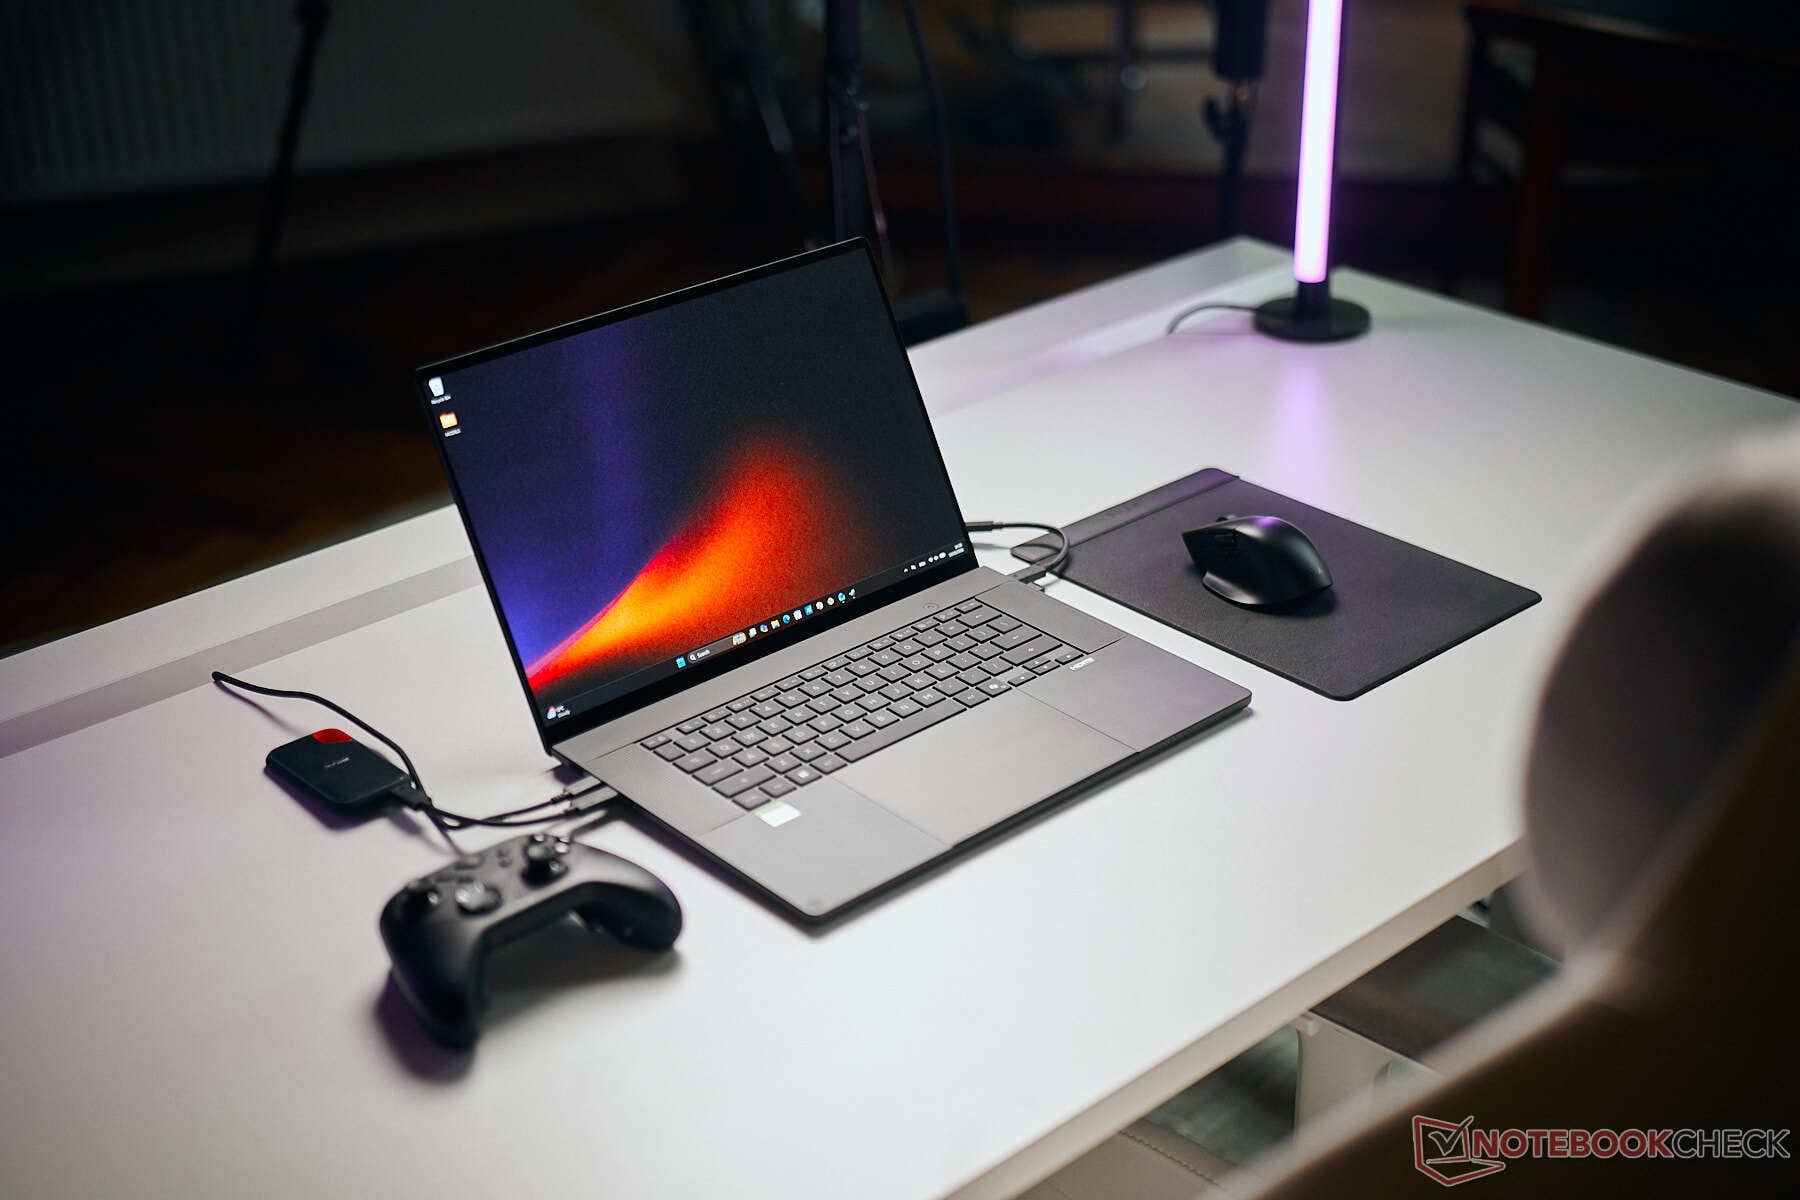
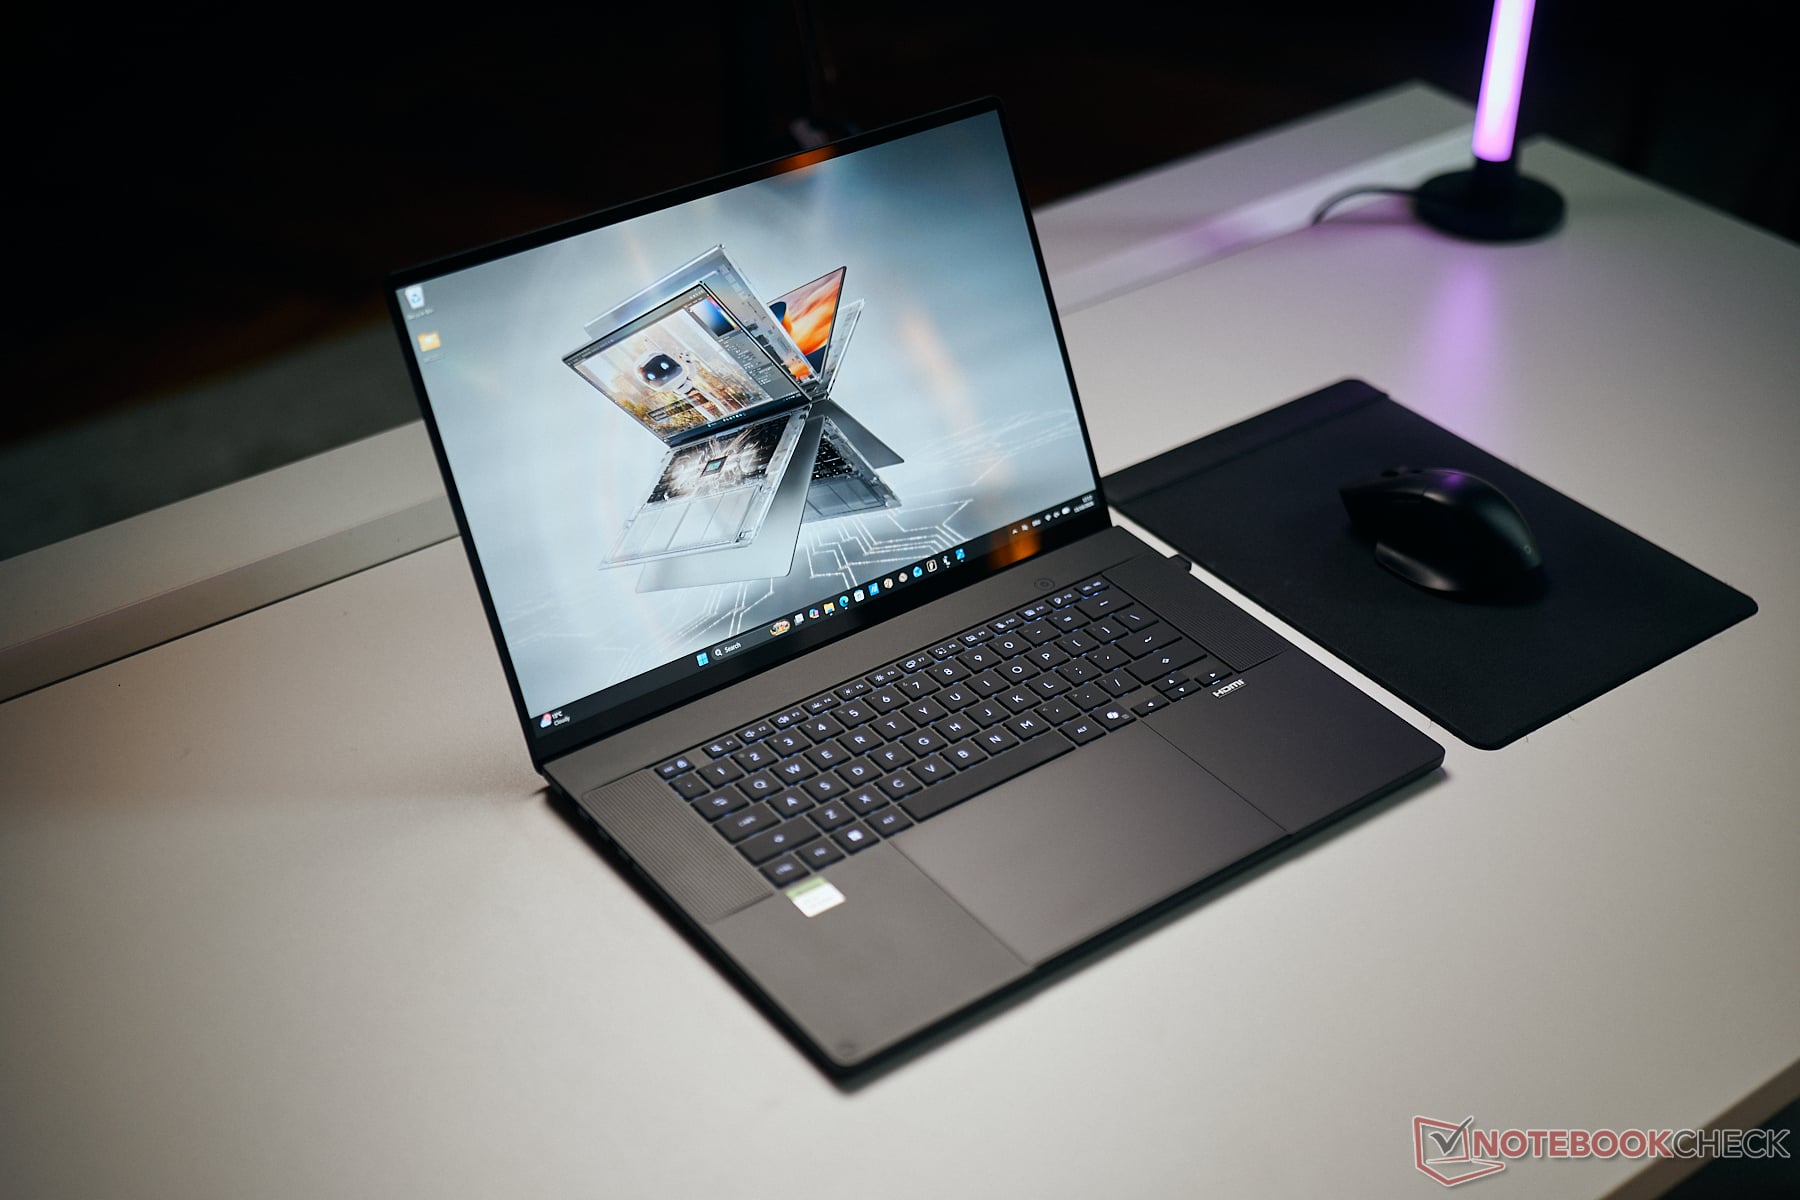
我们的测试系统是更新后的 2026 款 Asus ProArt P16,该机型针对全新的 RTX Spark 芯片进行了全面重新设计。我们的评测机搭载高端 RTX Spark N1X 芯片,拥有 20 个 CPU 核心、6144 个 GPU 核心和 64 GB 内存(LPDDR5x-9400),并配备一块 3K OLED 显示屏。我们对新款 ProArt P16 的完整评测即将上线,但目前我们只能透露,该芯片在性能 模式下的功耗最高可达 85/70 瓦。目前,监测 CPU & GPU 功耗数据的唯一方法是使用 Nvidia 的性能叠加层(Alt+R),因为 HWiNFO 不显示任何功耗数值,而 GPU-Z 则会导致崩溃。

测试条件

为了对不同的处理器和显卡进行有意义的比较,除了合成基准测试中的纯性能表现外,我们还会考察功耗,并据此确定能效。

功耗测量始终在连接外接显示器的情况下进行,以排除不同内置显示屏的影响。不过,我们在此测量的是系统的整体功耗,而不只是比较单纯的 TDP 数值。

单核性能与能效

我们先来看单核性能,N1X 的表现相当不错。它比 AMD 的 Zen 5 芯片更快,与 Intel 最新的 Panther Lake 芯片不相上下。Qualcomm 的新款 X2 芯片稍快一些,而 Apple 的单核性能显然完全处于另一个层次。

Performance rating: Percent | Cinebench 2024: CPU Single Core | Geekbench 6.7: Single-Core
Performance rating
Apple M5 Max
MacBook Pro 16 2026 M5 Max
99.5 pt
Apple M5 Pro 18-Core
MacBook Pro 16 2026 M5 Pro
99.5 pt
Apple M4 Max 16-Core
MacBook Pro 16 M4 Max
89 pt
Qualcomm Snapdragon X2 Elite Extreme X2E-94-100
Zenbook A16 UX3607
81.7 pt
Qualcomm Snapdragon X2 Elite X2E-88-100
Zenbook A14 UX3704NA
81 pt
Nvidia RTX Spark N1x 675
ProArt P16 H7607
68 pt
Intel Core Ultra X9 388H
ZenBook Duo UX8407AA
67.1 pt
Intel Core Ultra 9 386H
ROG Zephyrus G16 GU606AW
63.9 pt
AMD Ryzen AI Max+ 395
ROG Flow Z13 GZ302EA-RU073W
63.4 pt
AMD Ryzen AI Max+ 395
ProArt PX13 HN7306EA
63.3 pt
AMD Ryzen AI Max PRO 390
ZBook Ultra G1a A3ZQ0ET
58.8 pt
Cinebench 2024 / CPU Single Core
Apple M5 Pro 18-Core
MacBook Pro 16 2026 M5 Pro
201 Points +55%
Apple M5 Max
MacBook Pro 16 2026 M5 Max
199 Points +53%
Apple M4 Max 16-Core
MacBook Pro 16 M4 Max
178 Points +37%
Qualcomm Snapdragon X2 Elite Extreme X2E-94-100
Zenbook A16 UX3607
151 Points +16%
Qualcomm Snapdragon X2 Elite X2E-88-100
Zenbook A14 UX3704NA
149 Points +15%
Nvidia RTX Spark N1x 675
ProArt P16 H7607
130 Points
Intel Core Ultra X9 388H
ZenBook Duo UX8407AA
129.8 Points 0%
Intel Core Ultra 9 386H
ROG Zephyrus G16 GU606AW
120.4 Points -7%
AMD Ryzen AI Max+ 395
ROG Flow Z13 GZ302EA-RU073W
116.8 Points -10%
AMD Ryzen AI Max+ 395
ProArt PX13 HN7306EA
116.4 Points -10%
AMD Ryzen AI Max PRO 390
ZBook Ultra G1a A3ZQ0ET
107.8 Points -17%
Geekbench 6.7 / Single-Core
Apple M5 Max
MacBook Pro 16 2026 M5 Max
4336 Points +40%
Apple M5 Pro 18-Core
MacBook Pro 16 2026 M5 Pro
4295 Points +39%
Apple M4 Max 16-Core
MacBook Pro 16 M4 Max
3880 Points +25%
Qualcomm Snapdragon X2 Elite Extreme X2E-94-100
Zenbook A16 UX3607
3826 Points +24%
Qualcomm Snapdragon X2 Elite X2E-88-100
Zenbook A14 UX3704NA
3814 Points +23%
Nvidia RTX Spark N1x 675
ProArt P16 H7607
3092 Points
Intel Core Ultra X9 388H
ZenBook Duo UX8407AA
3020 Points -2%
AMD Ryzen AI Max+ 395
ROG Flow Z13 GZ302EA-RU073W
2978 Points -4%
AMD Ryzen AI Max+ 395
ProArt PX13 HN7306EA
2975 Points -4%
Intel Core Ultra 9 386H
ROG Zephyrus G16 GU606AW
2947 Points -5%
AMD Ryzen AI Max PRO 390
ZBook Ultra G1a A3ZQ0ET
2774 Points -10%

在单核工作负载下,N1X CPU 核心的功耗约为 9 瓦,系统总功耗约为 30 瓦。其能效表现出色,仅略逊于 Asus Zenbook Duo 中的 Panther Lake Core Ultra X 芯片,但优于所有 AMD 竞品。不过,Snapdragon X2 芯片和 Apple M5 芯片在这方面表现更佳。

Power Consumption / Cinebench 2024 Single Power Efficiency - external Monitor
Apple M5 Pro 18-Core
MacBook Pro 16 2026 M5 Pro
9.57 Points per Watt +125%
Apple M5 Max
MacBook Pro 16 2026 M5 Max
9.26 Points per Watt +117%
Apple M4 Max 16-Core
MacBook Pro 16 M4 Max
8.24 Points per Watt +93%
Qualcomm Snapdragon X2 Elite Extreme X2E-94-100
Zenbook A16 UX3607
5.83 Points per Watt +37%
Qualcomm Snapdragon X2 Elite X2E-88-100
Zenbook A14 UX3704NA
5.64 Points per Watt +32%
Intel Core Ultra X9 388H
ZenBook Duo UX8407AA
5.17 Points per Watt +21%
Nvidia RTX Spark N1x 675
ProArt P16 H7607
4.26 Points per Watt
AMD Ryzen AI Max+ 395
ProArt PX13 HN7306EA
2.94 Points per Watt -31%
AMD Ryzen AI Max PRO 390
ZBook Ultra G1a A3ZQ0ET
2.72 Points per Watt -36%
AMD Ryzen AI Max+ 395
ROG Flow Z13 GZ302EA-RU073W
2.62 Points per Watt -38%
Intel Core Ultra 9 386H
ROG Zephyrus G16 GU606AW
2.14 Points per Watt -50%
Power Consumption / Cinebench 2024 Single Power (external Monitor)
Intel Core Ultra 9 386H
ROG Zephyrus G16 GU606AW
56.2 (49.1min, 51.1P1 - 67.7max) Watt * -84%
AMD Ryzen AI Max+ 395
ROG Flow Z13 GZ302EA-RU073W
44.6 (42min, 42.4P1 - 70.6max) Watt * -46%
AMD Ryzen AI Max PRO 390
ZBook Ultra G1a A3ZQ0ET
39.6 (31.2min, 36.1P1 - 65.3max) Watt * -30%
AMD Ryzen AI Max+ 395
ProArt PX13 HN7306EA
39.6 (36.9min, 37.7P1 - 64.5max) Watt * -30%
Nvidia RTX Spark N1x 675
ProArt P16 H7607
30.5 (20.9min, 23.7P1 - 70max) Watt *
Qualcomm Snapdragon X2 Elite X2E-88-100
Zenbook A14 UX3704NA
26.4 (23.2min, 24.7P1 - 37.3max) Watt * +13%
Qualcomm Snapdragon X2 Elite Extreme X2E-94-100
Zenbook A16 UX3607
25.9 (22.5min, 22.7P1 - 35.3max) Watt * +15%
Intel Core Ultra X9 388H
ZenBook Duo UX8407AA
25.1 (21.9min, 22.6P1 - 37.3max) Watt * +18%
Apple M4 Max 16-Core
MacBook Pro 16 M4 Max
21.6 (19.9min, 20.1P1 - 23.2max) Watt * +29%
Apple M5 Max
MacBook Pro 16 2026 M5 Max
21.5 (18.5min, 18.9P1 - 25.1max) Watt * +30%
Apple M5 Pro 18-Core
MacBook Pro 16 2026 M5 Pro
21 (18.8min, 20P1 - 23.3max) Watt * +31%

* ... smaller is better

多核性能与能效

多核性能非常出色,RTX Spark N1X 能够媲美速度最快的 AMD Strix Halo 系统。它轻松击败了 Intel 的 Panther Lake 以及大多数 Snapdragon X2 Elite 芯片,只有少见的 Snapdragon X2 Elite Extreme 略快一些。与 Apple 的处理器相比,N1X 能够以微弱优势击败最新的 M6 芯片,但落后于 M4/M5 Pro & Max 型号。

Performance rating: Percent | Cinebench 2024: CPU Multi Core | Geekbench 6.7: Multi-Core
Performance rating
Apple M5 Max
MacBook Pro 16 2026 M5 Max
100 pt
Apple M5 Pro 18-Core
MacBook Pro 16 2026 M5 Pro
94.4 pt
Apple M4 Max 16-Core
MacBook Pro 16 M4 Max
83.9 pt
Qualcomm Snapdragon X2 Elite Extreme X2E-94-100
Zenbook A16 UX3607
74 pt
Apple M4 Pro 14-Core
MacBook Pro 16 2024 M4 Pro
72.2 pt
AMD Ryzen AI Max+ 395
ROG Flow Z13 GZ302EA-RU073W
68.5 pt
Nvidia RTX Spark N1x 675
ProArt P16 H7607
68.4 pt
AMD Ryzen AI Max+ 395
ProArt PX13 HN7306EA
65.8 pt
Apple M6
Mac Mini M6
64.9 pt
Qualcomm Snapdragon X2 Elite X2E-88-100
Zenbook A14 UX3704NA
63.3 pt
Intel Core Ultra 9 386H
ROG Zephyrus G16 GU606AW
54.3 pt
Intel Core Ultra X9 388H
ZenBook Duo UX8407AA
53 pt
AMD Ryzen AI Max PRO 390
ZBook Ultra G1a A3ZQ0ET
52.5 pt
Cinebench 2024 / CPU Multi Core
Apple M5 Max
MacBook Pro 16 2026 M5 Max
2490 Points +44%
Apple M5 Pro 18-Core
MacBook Pro 16 2026 M5 Pro
2347 Points +36%
Apple M4 Max 16-Core
MacBook Pro 16 M4 Max
2069 Points +20%
Apple M4 Max 16-Core
MacBook Pro 16 M4 Max
2015 Points +17%
Qualcomm Snapdragon X2 Elite Extreme X2E-94-100
Zenbook A16 UX3607
1761 Points +2%
Apple M4 Pro 14-Core
MacBook Pro 16 2024 M4 Pro
1729 Points 0%
Nvidia RTX Spark N1x 675
ProArt P16 H7607
1726 Points
AMD Ryzen AI Max+ 395
ProArt PX13 HN7306EA
1673 Points -3%
AMD Ryzen AI Max+ 395
ROG Flow Z13 GZ302EA-RU073W
1648 Points -5%
Qualcomm Snapdragon X2 Elite X2E-88-100
Zenbook A14 UX3704NA
1471 Points -15%
Apple M6
Mac Mini M6
1468 Points -15%
AMD Ryzen AI Max PRO 390
ZBook Ultra G1a A3ZQ0ET
1316 Points -24%
Intel Core Ultra 9 386H
ROG Zephyrus G16 GU606AW
1271 Points -26%
Intel Core Ultra X9 388H
ZenBook Duo UX8407AA
1172 Points -32%
Geekbench 6.7 / Multi-Core
Apple M5 Max
MacBook Pro 16 2026 M5 Max
30057 Points +48%
Apple M5 Pro 18-Core
MacBook Pro 16 2026 M5 Pro
28436 Points +40%
Apple M4 Max 16-Core
MacBook Pro 16 M4 Max
25760 Points +27%
Qualcomm Snapdragon X2 Elite Extreme X2E-94-100
Zenbook A16 UX3607
23204 Points +14%
Apple M4 Pro 14-Core
MacBook Pro 16 2024 M4 Pro
22509 Points +11%
Apple M6
Mac Mini M6
21302 Points +5%
AMD Ryzen AI Max+ 395
ROG Flow Z13 GZ302EA-RU073W
21269 Points +5%
Qualcomm Snapdragon X2 Elite X2E-88-100
Zenbook A14 UX3704NA
20325 Points 0%
Nvidia RTX Spark N1x 675
ProArt P16 H7607
20296 Points
AMD Ryzen AI Max+ 395
ProArt PX13 HN7306EA
19364 Points -5%
Intel Core Ultra X9 388H
ZenBook Duo UX8407AA
17694 Points -13%
Intel Core Ultra 9 386H
ROG Zephyrus G16 GU606AW
17319 Points -15%
AMD Ryzen AI Max PRO 390
ZBook Ultra G1a A3ZQ0ET
15649 Points -23%
Performance rating: Percent | Cinebench 2024: CPU Multi Core | Geekbench 6.7: Multi-Core

在 Asus ProArt P16 的性能模式下,N1X 的功耗最高可达 85 瓦,随后稳定在 70 瓦。其多核能效与 Strix Halo 系统大致相当。Intel 的 Panther Lake 系统能效更高(但速度也慢得多),第二代 Snapdragon 处理器也更胜一筹,Apple 的 M4/M5 芯片同样如此。我们将很快补充 ProArt P16 在速度较慢的电源模式下的能效数据。

Power Consumption / Cinebench 2024 Multi Power Efficiency - external Monitor
Apple M6
Mac Mini M6
32.5 Points per Watt +139%
Qualcomm Snapdragon X2 Elite X2E-88-100
Zenbook A14 UX3704NA
23.2 Points per Watt +71%
Apple M5 Pro 18-Core
MacBook Pro 16 2026 M5 Pro
23 Points per Watt +69%
Apple M4 Max 16-Core
MacBook Pro 16 M4 Max
22.4 Points per Watt +65%
Qualcomm Snapdragon X2 Elite Extreme X2E-94-100
Zenbook A16 UX3607
22.2 Points per Watt +63%
Apple M5 Max
MacBook Pro 16 2026 M5 Max
21.2 Points per Watt +56%
Apple M4 Pro 14-Core
MacBook Pro 16 2024 M4 Pro
20.2 Points per Watt +49%
Intel Core Ultra X9 388H
ZenBook Duo UX8407AA
16.2 Points per Watt +19%
AMD Ryzen AI Max+ 395
ProArt PX13 HN7306EA
15.1 Points per Watt +11%
AMD Ryzen AI Max+ 395
ROG Flow Z13 GZ302EA-RU073W
14.7 Points per Watt +8%
Nvidia RTX Spark N1x 675
ProArt P16 H7607
13.6 Points per Watt
AMD Ryzen AI Max PRO 390
ZBook Ultra G1a A3ZQ0ET
12.3 Points per Watt -10%
Intel Core Ultra 9 386H
ROG Zephyrus G16 GU606AW
12.1 Points per Watt -11%
Power Consumption / Cinebench 2024 Multi Power (external Monitor)
Nvidia RTX Spark N1x 675
ProArt P16 H7607
127.1 (121.4min, 122.4P1 - 138.7max) Watt *
Apple M5 Max
MacBook Pro 16 2026 M5 Max
117.5 (107.9min, 108.8P1 - 129.6max) Watt * +8%
AMD Ryzen AI Max+ 395
ROG Flow Z13 GZ302EA-RU073W
112.4 (109.8min, 109.9P1 - 134.7max) Watt * +12%
AMD Ryzen AI Max+ 395
ProArt PX13 HN7306EA
111.1 (105.2min, 106.5P1 - 127.7max) Watt * +13%
AMD Ryzen AI Max PRO 390
ZBook Ultra G1a A3ZQ0ET
107.3 (103.7min, 103.8P1 - 119.6max) Watt * +16%
Intel Core Ultra 9 386H
ROG Zephyrus G16 GU606AW
104.9 (95.9min, 96.2P1 - 111.1max) Watt * +17%
Apple M5 Pro 18-Core
MacBook Pro 16 2026 M5 Pro
102 (82.3min, 87P1 - 123.5max) Watt * +20%
Apple M4 Max 16-Core
MacBook Pro 16 M4 Max
92.2 (85.6min, 87.1P1 - 105.4max) Watt * +27%
Apple M4 Pro 14-Core
MacBook Pro 16 2024 M4 Pro
85.8 (77.5min, 77.7P1 - 89.6max) Watt * +32%
Qualcomm Snapdragon X2 Elite Extreme X2E-94-100
Zenbook A16 UX3607
79.2 (57min, 62.7P1 - 99.1max) Watt * +38%
Intel Core Ultra X9 388H
ZenBook Duo UX8407AA
72.2 (66min, 66.8P1 - 89.8max) Watt * +43%
Qualcomm Snapdragon X2 Elite X2E-88-100
Zenbook A14 UX3704NA
63.3 (56.6min, 57.5P1 - 81.9max) Watt * +50%
Apple M6
Mac Mini M6
45.2 (41.5min, 42.2P1 - 47.2max) Watt * +64%

* ... smaller is better

GPU 性能

正如我们之前提到的,Blackwell GPU 基本上就是消费级 GeForce 显卡所采用的 GPU。请注意,Time Spy 等一些基准测试必须通过模拟运行,这会影响性能。因此,我们仅选择了 3DMark Steel Nomad 等原生 ARM 基准测试。在这项测试中,其 GPU 性能可媲美高功耗版本的 Nvidia GeForce RTX 5070,比 Radeon 8060S 快约 50 %。Intel 和 Qualcomm 在这方面无法与之竞争。Apple 的 M5 Pro GPU 也更慢(-28 %),而 M5 Max GPU 则更快(+27 %)。

Performance rating: Percent | 3DMark: Steel Nomad Score | Steel Nomad Light Score | Geekbench 6.7: GPU OpenCL
Performance rating
NVIDIA GeForce RTX 5090 Laptop
ProArt P16 RTX 5090
100 pt
NVIDIA GeForce RTX 5080 Laptop
ThinkPad T16g Gen 3 RTX 5080
87.1 pt
NVIDIA GeForce RTX 5070 Ti Laptop
XMG APEX 16 MAX
86.1 pt
Apple M5 Max 40-Core GPU
MacBook Pro 16 2026 M5 Max
83.8 pt
NVIDIA GeForce RTX 5070 Ti Laptop
ROG Zephyrus G14 GU405AR
78.9 pt
NVIDIA GeForce RTX 5070 Laptop
XMG FUSION 16 (M25)
67.2 pt
NVIDIA RTX Spark N1X 6144-Core Blackwell GPU
ProArt P16 H7607
66 pt
NVIDIA GeForce RTX 5070 Laptop
Galaxy Book6 Ultra
61.8 pt
NVIDIA GeForce RTX 5070 Laptop
ThinkPad T1g Gen 8 21TD003GE
59 pt
NVIDIA GeForce RTX 5060 Laptop
Legion 7 16 AGP11
57.2 pt
NVIDIA GeForce RTX 5060 Laptop
ThinkBook 16p G6 21R00013GE
55.7 pt
NVIDIA GeForce RTX 5070 Laptop
Yoga Pro 9i 16 RTX 5070
53.1 pt
Apple M5 Pro 20-Core GPU
MacBook Pro 16 2026 M5 Pro
47.2 pt
AMD Radeon 8060S
ProArt PX13 HN7306EA
44.1 pt
AMD Radeon 8060S
ROG Flow Z13 GZ302EA-RU073W
43.9 pt
Intel Arc B390 12 Xe3 Panther Lake iGPU
ZenBook Duo UX8407AA
31.4 pt
Qualcomm Adreno X2-90
Zenbook A16 UX3607
24.9 pt
Qualcomm Adreno X2-90
Zenbook A14 UX3704NA
22.2 pt
3DMark / Steel Nomad Score
NVIDIA GeForce RTX 5090 Laptop
ProArt P16 RTX 5090
4959 Points +70%
Apple M5 Max 40-Core GPU
MacBook Pro 16 2026 M5 Max
4386 Points +50%
NVIDIA GeForce RTX 5080 Laptop
ThinkPad T16g Gen 3 RTX 5080
4022 Points +38%
NVIDIA GeForce RTX 5070 Ti Laptop
XMG APEX 16 MAX
3953 Points +35%
NVIDIA GeForce RTX 5070 Ti Laptop
ROG Zephyrus G14 GU405AR
3694 Points +26%
NVIDIA GeForce RTX 5070 Laptop
XMG FUSION 16 (M25)
3075 Points +5%
NVIDIA RTX Spark N1X 6144-Core Blackwell GPU
ProArt P16 H7607
2924 Points
NVIDIA GeForce RTX 5070 Laptop
Yoga Pro 9i 16 RTX 5070
2906 Points -1%
NVIDIA GeForce RTX 5070 Laptop
Galaxy Book6 Ultra
2784 Points -5%
NVIDIA GeForce RTX 5070 Laptop
ThinkPad T1g Gen 8 21TD003GE
2636 Points -10%
NVIDIA GeForce RTX 5060 Laptop
Legion 7 16 AGP11
2605 Points -11%
NVIDIA GeForce RTX 5060 Laptop
ThinkBook 16p G6 21R00013GE
2603 Points -11%
Apple M5 Pro 20-Core GPU
MacBook Pro 16 2026 M5 Pro
2323 Points -21%
AMD Radeon 8060S
ProArt PX13 HN7306EA
2019 Points -31%
AMD Radeon 8060S
ROG Flow Z13 GZ302EA-RU073W
1874 Points -36%
Intel Arc B390 12 Xe3 Panther Lake iGPU
ZenBook Duo UX8407AA
1667 Points -43%
Qualcomm Adreno X2-90
Zenbook A16 UX3607
1264 Points -57%
Qualcomm Adreno X2-90
Zenbook A14 UX3704NA
1095 Points -63%
3DMark / Steel Nomad Light Score
NVIDIA GeForce RTX 5090 Laptop
ProArt P16 RTX 5090
21012 Points +62%
NVIDIA GeForce RTX 5070 Ti Laptop
XMG APEX 16 MAX
18188 Points +40%
Apple M5 Max 40-Core GPU
MacBook Pro 16 2026 M5 Max
17649 Points +36%
NVIDIA GeForce RTX 5080 Laptop
ThinkPad T16g Gen 3 RTX 5080
17002 Points +31%
NVIDIA GeForce RTX 5070 Ti Laptop
ROG Zephyrus G14 GU405AR
16907 Points +30%
NVIDIA GeForce RTX 5070 Laptop
Yoga Pro 9i 16 RTX 5070
13721 Points +6%
NVIDIA GeForce RTX 5070 Laptop
XMG FUSION 16 (M25)
13426 Points +3%
NVIDIA RTX Spark N1X 6144-Core Blackwell GPU
ProArt P16 H7607
12992 Points
NVIDIA GeForce RTX 5070 Laptop
Galaxy Book6 Ultra
12271 Points -6%
NVIDIA GeForce RTX 5060 Laptop
Legion 7 16 AGP11
12141 Points -7%
NVIDIA GeForce RTX 5070 Laptop
ThinkPad T1g Gen 8 21TD003GE
11903 Points -8%
NVIDIA GeForce RTX 5060 Laptop
ThinkBook 16p G6 21R00013GE
11804 Points -9%
Apple M5 Pro 20-Core GPU
MacBook Pro 16 2026 M5 Pro
10018 Points -23%
AMD Radeon 8060S
ProArt PX13 HN7306EA
9866 Points -24%
AMD Radeon 8060S
ROG Flow Z13 GZ302EA-RU073W
9653 Points -26%
Intel Arc B390 12 Xe3 Panther Lake iGPU
ZenBook Duo UX8407AA
6338 Points -51%
Qualcomm Adreno X2-90
Zenbook A16 UX3607
5492 Points -58%
Qualcomm Adreno X2-90
Zenbook A14 UX3704NA
4877 Points -62%
Geekbench 6.7 / GPU OpenCL
NVIDIA GeForce RTX 5090 Laptop
ProArt P16 RTX 5090
187922 Points +30%
NVIDIA GeForce RTX 5080 Laptop
ThinkPad T16g Gen 3 RTX 5080
186625 Points +29%
NVIDIA GeForce RTX 5070 Ti Laptop
XMG APEX 16 MAX
172925 Points +19%
NVIDIA GeForce RTX 5070 Ti Laptop
ROG Zephyrus G14 GU405AR
153565 Points +6%
Apple M5 Max 40-Core GPU
MacBook Pro 16 2026 M5 Max
148149 Points +2%
NVIDIA RTX Spark N1X 6144-Core Blackwell GPU
ProArt P16 H7607
144949 Points
NVIDIA GeForce RTX 5070 Laptop
XMG FUSION 16 (M25)
142486 Points -2%
NVIDIA GeForce RTX 5070 Laptop
Galaxy Book6 Ultra
132895 Points -8%
NVIDIA GeForce RTX 5070 Laptop
ThinkPad T1g Gen 8 21TD003GE
126177 Points -13%
NVIDIA GeForce RTX 5060 Laptop
Legion 7 16 AGP11
115157 Points -21%
NVIDIA GeForce RTX 5060 Laptop
ThinkBook 16p G6 21R00013GE
109612 Points -24%
AMD Radeon 8060S
ROG Flow Z13 GZ302EA-RU073W
90181 Points -38%
Apple M5 Pro 20-Core GPU
MacBook Pro 16 2026 M5 Pro
88251 Points -39%
AMD Radeon 8060S
ProArt PX13 HN7306EA
83773 Points -42%
NVIDIA GeForce RTX 5070 Laptop
Yoga Pro 9i 16 RTX 5070
66275 Points -54%
Intel Arc B390 12 Xe3 Panther Lake iGPU
ZenBook Duo UX8407AA
57288 Points -60%
Qualcomm Adreno X2-90
Zenbook A16 UX3607
43591 Points -70%
Qualcomm Adreno X2-90
Zenbook A14 UX3704NA
39874 Points -72%
Performance rating: Percent | 3DMark: Steel Nomad Score | Steel Nomad Light Score | Geekbench 6.7: GPU OpenCL

游戏性能与能效

配备 Blackwell GPU,游戏显然也是另一个重要方面,而考虑到 ARM 版 Windows,这一点也非常值得关注。根据过去两年使用 Snapdragon 笔记本电脑的经验,我们知道有些游戏并不兼容。例如,其中就包括 F1 25 或 Battlefield 6,不过我们已经在 Gamescom 上见过可以运行的 F1 25 版本,因此这种情况可能很快就会改变。此外还有性能方面的问题,因为目前绝大多数游戏都必须通过模拟运行。我们有机会测试了 Marvel Rivals 的原生版本,在 1080p 下,其性能优势约为 20 %,而且 1% low 帧率也高得多(9 对 29 fps),因此差异相当显著。我们在 Assassin's Creed BlackF Flag 或 Shadows 等游戏中也遇到了卡顿问题。目前我们仍在继续测试,并将很快更新本文。

本次对比中,我们仅纳入了 Cyberpunk 2077 和 Baldur's Gate 3,而模拟运行确实会造成性能损失。与合成基准测试中的表现相比,N1X 相对 RTX 5070 的差距有所扩大,例如在 Cyberpunk 中更接近 RTX 5060,但在 Baldur's Gate 3 中仍具备竞争力。更大的内存容量在要求较高的游戏中显然是一项优势,我们预计未来发布的大多数游戏都会提供原生 ARM 版本。就目前而言,玩游戏完全可行,尤其是在 DLSS 和 Frame Generation 等功能的加持下,但配备高性能 GeForce GPU 的笔记本电脑在游戏方面(仍然)更胜一筹。

Cyberpunk 2077 / Ultra Preset (FSR off)
NVIDIA GeForce RTX 5090 Laptop
ProArt P16 RTX 5090
90.8 (72.6min - 114.9max) fps +60%
NVIDIA GeForce RTX 5070 Ti Laptop
XMG APEX 16 MAX
82.9 (69.5min - 107max) fps +46%
NVIDIA GeForce RTX 5070 Ti Laptop
ROG Zephyrus G14 GU405AR
77.4 (64.3min - 98max) fps +36%
NVIDIA GeForce RTX 5080 Laptop
ThinkPad T16g Gen 3 RTX 5080
74.4 (62min - 94.6max) fps +31%
NVIDIA GeForce RTX 5070 Ti Laptop
ROG Zephyrus G16 2025 5070 Ti
68.4 (57.1min - 89.2max) fps +20%
NVIDIA GeForce RTX 5070 Laptop
XMG FUSION 16 (M25)
65.2 (55.7min - 81.9max) fps +15%
Apple M5 Max 40-Core GPU
MacBook Pro 16 2026 M5 Max
63.1 fps +11%
NVIDIA GeForce RTX 5070 Laptop
Yoga Pro 9i 16 RTX 5070
62.8 (53.8min - 79.1max) fps +11%
NVIDIA GeForce RTX 5070 Laptop
Galaxy Book6 Ultra
57.4 (49.2min - 71.9max) fps +1%
NVIDIA GeForce RTX 5060 Laptop
ThinkBook 16p G6 21R00013GE
57 (48.9min - 72.8max) fps 0%
NVIDIA RTX Spark N1X 6144-Core Blackwell GPU
ProArt P16 H7607
56.8 (42.2min - 69max) fps
NVIDIA GeForce RTX 5060 Laptop
Legion 7 16 AGP11
56.2 (47.6min - 72max) fps -1%
NVIDIA GeForce RTX 5070 Laptop
ThinkPad T1g Gen 8 21TD003GE
56.1 (47.7min - 71.2max) fps -1%
AMD Radeon 8060S
ProArt PX13 HN7306EA
49.4 (40.2min - 64.4max) fps -13%
AMD Radeon 8060S
ROG Flow Z13 GZ302EA-RU073W
46.4 (39.2min - 60.2max) fps -18%
Apple M5 Pro 20-Core GPU
MacBook Pro 16 2026 M5 Pro
33.4 fps -41%
Intel Arc B390 12 Xe3 Panther Lake iGPU
ZenBook Duo UX8407AA
28.9 (24.1min - 38.6max) fps -49%
Qualcomm Adreno X2-90
Zenbook A16 UX3607
22.7 (19.4min - 30max) fps -60%
Cyberpunk 2077 / Ultra Preset (FSR off)
NVIDIA GeForce RTX 5070 Ti Laptop
XMG APEX 16 MAX
128 (103min - 160.2max) fps +67%
NVIDIA GeForce RTX 5090 Laptop
ProArt P16 RTX 5090
112.3 (80.7min - 139.2max) fps +47%
NVIDIA GeForce RTX 5070 Ti Laptop
ROG Zephyrus G14 GU405AR
111.9 (88.8min - 143.4max) fps +46%
NVIDIA GeForce RTX 5080 Laptop
ThinkPad T16g Gen 3 RTX 5080
107.6 (84.2min - 137.7max) fps +40%
NVIDIA GeForce RTX 5070 Ti Laptop
ROG Zephyrus G16 2025 5070 Ti
105.4 (82.3min - 135.9max) fps +38%
NVIDIA GeForce RTX 5070 Laptop
XMG FUSION 16 (M25)
103.8 (85.4min - 128.8max) fps +36%
Apple M5 Max 40-Core GPU
MacBook Pro 16 2026 M5 Max
102.8 fps +34%
NVIDIA GeForce RTX 5070 Laptop
Yoga Pro 9i 16 RTX 5070
98.3 (80min - 123.8max) fps +28%
NVIDIA GeForce RTX 5060 Laptop
Legion 7 16 AGP11
90.5 (72.4min - 113.7max) fps +18%
NVIDIA GeForce RTX 5060 Laptop
ThinkBook 16p G6 21R00013GE
90 (74.4min - 113.3max) fps +17%
NVIDIA GeForce RTX 5070 Laptop
ThinkPad T1g Gen 8 21TD003GE
87.3 (69.7min - 110.7max) fps +14%
NVIDIA GeForce RTX 5070 Laptop
Galaxy Book6 Ultra
84.6 (62.2min - 105.6max) fps +10%
AMD Radeon 8060S
ProArt PX13 HN7306EA
79.5 (63.2min - 105max) fps +4%
NVIDIA RTX Spark N1X 6144-Core Blackwell GPU
ProArt P16 H7607
76.6 (57.1min - 94.9max) fps
AMD Radeon 8060S
ROG Flow Z13 GZ302EA-RU073W
75.6 (62min - 97.7max) fps -1%
AMD Radeon 8050S
ZBook Ultra G1a A3ZQ0ET
63.1 (51.7min, 45.1P1 - 80.2max) fps -18%
Apple M5 Pro 20-Core GPU
MacBook Pro 16 2026 M5 Pro
57.8 fps -25%
Intel Arc B390 12 Xe3 Panther Lake iGPU
ZenBook Duo UX8407AA
47.7 (37.8min - 61.7max) fps -38%
Qualcomm Adreno X2-90
Zenbook A16 UX3607
38.2 (30.9min - 49.7max) fps -50%
Qualcomm Adreno X2-90
Zenbook A14 UX3704NA
30.8 (25.3min - 39.9max) fps -60%
Baldur's Gate 3 / Ultra Preset
NVIDIA GeForce RTX 5090 Laptop
ProArt P16 RTX 5090
121 fps +53%
NVIDIA GeForce RTX 5070 Ti Laptop
ROG Zephyrus G14 GU405AR
120 (117.6min, 117.9P0.1, 118.7P1 - 123.3max) fps +52%
NVIDIA GeForce RTX 5070 Ti Laptop
XMG APEX 16 MAX
110.5 (92.1min, 95.8P0.1, 99P1 - 123.3max) fps +40%
NVIDIA GeForce RTX 5080 Laptop
ThinkPad T16g Gen 3 RTX 5080
107 (68.2min, 83.6P0.1, 96.6P1 - 126.4max) fps +35%
Apple M5 Max 40-Core GPU
MacBook Pro 16 2026 M5 Max
96.4 fps +22%
NVIDIA GeForce RTX 5070 Ti Laptop
ROG Zephyrus G16 2025 5070 Ti
93.9 fps +19%
NVIDIA GeForce RTX 5070 Laptop
XMG FUSION 16 (M25)
84.1 (71.6min, 75.9P0.1, 76.9P1 - 94.3max) fps +6%
NVIDIA RTX Spark N1X 6144-Core Blackwell GPU
ProArt P16 H7607
79.1 (54.2min, 59.8P0.1, 65.6P1 - 99.3max) fps
NVIDIA GeForce RTX 5060 Laptop
ThinkBook 16p G6 21R00013GE
78 (10.9min, 69.1P0.1, 71.4P1 - 139.7max) fps -1%
NVIDIA GeForce RTX 5060 Laptop
Legion 7 16 AGP11
76.4 (65.3min, 66.4P0.1, 68.8P1 - 90.6max) fps -3%
NVIDIA GeForce RTX 5070 Laptop
Galaxy Book6 Ultra
76.2 (56.4min, 57.1P0.1, 68.6P1 - 86.7max) fps -4%
NVIDIA GeForce RTX 5070 Laptop
ThinkPad T1g Gen 8 21TD003GE
72.8 (34.9min, 54P0.1, 64.7P1 - 82.6max) fps -8%
NVIDIA GeForce RTX 5070 Laptop
Yoga Pro 9i 16 RTX 5070
63.1 fps -20%
AMD Radeon 8060S
ProArt PX13 HN7306EA
60.8 (55min, 55.2P0.1, 56.3P1 - 67.3max) fps -23%
Apple M5 Pro 20-Core GPU
MacBook Pro 16 2026 M5 Pro
56.7 fps -28%
AMD Radeon 8060S
ROG Flow Z13 GZ302EA-RU073W
55.2 fps -30%
Intel Arc B390 12 Xe3 Panther Lake iGPU
ZenBook Duo UX8407AA
31.4 (25.9min, 26.2P0.1, 27.6P1 - 34.8max) fps -60%
Qualcomm Adreno X2-90
Zenbook A16 UX3607
28.7 (21.2min, 21.6P0.1, 23.2P1 - 32.2max) fps -64%
Baldur's Gate 3 / Ultra Preset
NVIDIA GeForce RTX 5090 Laptop
ProArt P16 RTX 5090
158.7 fps +70%
NVIDIA GeForce RTX 5070 Ti Laptop
XMG APEX 16 MAX
155.6 (107.2min, 130P0.1, 140P1 - 192.8max) fps +67%
NVIDIA GeForce RTX 5080 Laptop
ThinkPad T16g Gen 3 RTX 5080
145.9 (27min, 79.7P0.1, 113.3P1 - 217max) fps +56%
NVIDIA GeForce RTX 5070 Ti Laptop
ROG Zephyrus G14 GU405AR
141.9 (90.2min, 102.1P0.1, 119.1P1 - 183max) fps +52%
Apple M5 Max 40-Core GPU
MacBook Pro 16 2026 M5 Max
134.6 fps +44%
NVIDIA GeForce RTX 5070 Ti Laptop
ROG Zephyrus G16 2025 5070 Ti
131.2 fps +40%
NVIDIA GeForce RTX 5070 Laptop
XMG FUSION 16 (M25)
121 (101min, 103.8P0.1, 109.6P1 - 139.5max) fps +30%
NVIDIA GeForce RTX 5060 Laptop
ThinkBook 16p G6 21R00013GE
115.6 (97.5min, 98.1P0.1, 105.3P1 - 135.6max) fps +24%
NVIDIA GeForce RTX 5060 Laptop
Legion 7 16 AGP11
112.2 (90.4min, 93.5P0.1, 101.2P1 - 155.7max) fps +20%
NVIDIA GeForce RTX 5070 Laptop
Galaxy Book6 Ultra
109.2 (88.4min, 93.8P0.1, 97.6P1 - 128.1max) fps +17%
NVIDIA GeForce RTX 5070 Laptop
ThinkPad T1g Gen 8 21TD003GE
106 (79.2min, 92.7P0.1, 95.4P1 - 120.9max) fps +13%
NVIDIA RTX Spark N1X 6144-Core Blackwell GPU
ProArt P16 H7607
93.4 (55min, 57.7P0.1, 67.4P1 - 135.8max) fps
AMD Radeon 8060S
ProArt PX13 HN7306EA
90.5 (62.4min, 66.1P0.1, 83.3P1 - 101.6max) fps -3%
NVIDIA GeForce RTX 5070 Laptop
Yoga Pro 9i 16 RTX 5070
87.3 fps -7%
AMD Radeon 8060S
ROG Flow Z13 GZ302EA-RU073W
85.3 fps -9%
Apple M5 Pro 20-Core GPU
MacBook Pro 16 2026 M5 Pro
83.8 fps -10%
AMD Radeon 8050S
ZBook Ultra G1a A3ZQ0ET
68.7 (35.6min, 50.1P0.1, 62.2P1 - 80max) fps -26%
Intel Arc B390 12 Xe3 Panther Lake iGPU
ZenBook Duo UX8407AA
44.6 (38min, 38.3P0.1, 40.6P1 - 49.8max) fps -52%
Qualcomm Adreno X2-90
Zenbook A16 UX3607
42.5 (28.7min, 29.8P0.1, 39.3P1 - 48max) fps -54%
Qualcomm Adreno X2-90
Zenbook A14 UX3704NA
34.8 (23.1min, 23.9P0.1, 29.6P1 - 40.8max) fps -63%

我们还测试了游戏时的能效,但请再次注意,Cyberpunk 使用的是 x64 版本(目前尚无 Windows 原生 ARM 版本,只有 macOS 版本),这会影响性能,进而影响能效。测试结果依然不错,N1X 仅略逊于搭载 GeForce RTX 5060/5070 的系统。它的能效优于 AMD Strix Halo 系统,也超过了搭载 M5 Pro 的 MacBook Pro 16。 

Power Consumption / Cyberpunk 2077 ultra Efficiency
Qualcomm Adreno X2-90
Zenbook A14 UX3704NA
0.841 fps per Watt +44%
NVIDIA GeForce RTX 5070 Laptop
ThinkPad T1g Gen 8 21TD003GE
0.688 fps per Watt +18%
Apple M5 Pro 20-Core GPU
MacBook Pro 16 2026 M5 Pro
0.672 fps per Watt +15%
AMD Radeon 8060S
ProArt PX13 HN7306EA
0.66 fps per Watt +13%
NVIDIA GeForce RTX 5070 Ti Laptop
ROG Zephyrus G14 GU405AR
0.655 fps per Watt +12%
NVIDIA GeForce RTX 5070 Laptop
Galaxy Book6 Ultra
0.622 fps per Watt +6%
NVIDIA GeForce RTX 5090 Laptop
ProArt P16 RTX 5090
0.616 fps per Watt +5%
NVIDIA GeForce RTX 5080 Laptop
ThinkPad T16g Gen 3 RTX 5080
0.606 fps per Watt +4%
NVIDIA RTX Spark N1X 6144-Core Blackwell GPU
ProArt P16 H7607
0.585 fps per Watt
NVIDIA GeForce RTX 5070 Laptop
Yoga Pro 9i 16 RTX 5070
0.583 fps per Watt 0%
AMD Radeon 8060S
ROG Flow Z13 GZ302EA-RU073W
0.562 fps per Watt -4%
Qualcomm Adreno X2-90
Zenbook A16 UX3607
0.562 fps per Watt -4%
AMD Radeon 8050S
ZBook Ultra G1a A3ZQ0ET
0.543 fps per Watt -7%
Intel Arc B390 12 Xe3 Panther Lake iGPU
ZenBook Duo UX8407AA
0.533 fps per Watt -9%
NVIDIA GeForce RTX 5070 Laptop
XMG FUSION 16 (M25)
0.525 fps per Watt -10%
NVIDIA GeForce RTX 5060 Laptop
Legion 7 16 AGP11
0.523 fps per Watt -11%
NVIDIA GeForce RTX 5070 Ti Laptop
XMG APEX 16 MAX
0.514 fps per Watt -12%
NVIDIA GeForce RTX 5060 Laptop
ThinkBook 16p G6 21R00013GE
0.3825 fps per Watt -35%

AI 性能

本地 AI 是所有芯片制造商热议的焦点。但本地 AI 究竟是什么意思,又该如何使用呢?简单来说,只要内存足够大,你就可以下载模型并在自己的机器上本地运行,无需使用云服务,自然也就无需为这些服务付费。当然,模型种类繁多,每位用户的具体用途也各不相同。模型运行起来后,你基本上可以像使用 ChatGPT 或 Gemini 一样,将其作为聊天机器人使用,而智能体则让 AI 工作负载更进一步。例如,我们使用 Hermes 为 YouTube 上的 RTX Spark 视频评测制作了幻灯片,相关内容也可以在下一节(创作者基准测试)中看到。智能体不只是回答问题,还能从不同来源获取信息并创建文档。智能体能做的事情远不止这些,这只是一个简单的例子,但即便如此,也已经改善了我们的工作流程。 

评估性能的一大难题在于,AI 模型的演进速度很快,因此建立数据库并不容易。我们也仍在尝试寻找最合适的基准测试,目前主要使用 Mlperf 2.0 进行比较。另一方面,Geekbench AI 目前并不太适用,因为在 RTX Spark N1X 上只能运行其 CPU 测试。我们的 Mlperf 测试结果呈现出好坏参半的情况,N1X 与 M5 Pro 在不同的单项测试中互有胜负。我们将继续测试 AI 性能,并在获得更多结果后更新本文。 

MLPerf Client 2.0 / GPU Llama 3.1 8B SWE Agent Avg Expected Duration
Apple MacBook Pro 14 2024 M4 Pro Entry
M4 Pro 16-Core GPU, M4 Pro 12-Core, Apple SSD AP1024Z
152.9 s * -231%
Apple MacBook Pro 14 2024 M4 Pro Entry
M4 Pro 16-Core GPU, M4 Pro 12-Core, Apple SSD AP1024Z
129.9 s * -181%
Apple MacBook Pro 16 2026 M5 Pro
M5 Pro 20-Core GPU, M5 Pro 18-Core, Apple SSD AP4096Z
74.5 s * -61%
Apple MacBook Pro 16 2026 M5 Pro
M5 Pro 20-Core GPU, M5 Pro 18-Core, Apple SSD AP4096Z
55.4 s * -20%
Lenovo Legion 5 Pro 16IAH7H
GeForce RTX 3060 Laptop GPU, i7-12700H, 2x Samsung PM9A1 MZVL21T0HCLR (RAID 0)
51.6 s * -12%
Asus ProArt P16 H7607
RTX Spark N1X 6144-Core Blackwell GPU, Spark RTX N1x 675, SanDisk PC SN5100S 2TB
46.234 s *
Razer Blade 16 Early 2023
GeForce RTX 4080 Laptop GPU, i9-13950HX, SSSTC CA6-8D1024
37.7 s * +18%
Asus ROG Strix Scar 17 G733PY-XS96
GeForce RTX 4090 Laptop GPU, R9 7945HX, SK hynix PC801 HFS001TEJ9X101N
30.4 s * +34%
Lenovo Legion 9 18IAX10 RTX 5090
GeForce RTX 5090 Laptop, Ultra 9 275HX, Samsung PM9E1 MZVLC2T0HBLD
24.7 s * +47%
MLPerf Client 2.0 / GPU Llama 3.1 8B SWE Agent Avg Tools Duration
Lenovo Legion 5 Pro 16IAH7H
GeForce RTX 3060 Laptop GPU, i7-12700H, 2x Samsung PM9A1 MZVL21T0HCLR (RAID 0)
8.32 s * -30%
Asus ROG Strix Scar 17 G733PY-XS96
GeForce RTX 4090 Laptop GPU, R9 7945HX, SK hynix PC801 HFS001TEJ9X101N
7.7 s * -20%
Razer Blade 16 Early 2023
GeForce RTX 4080 Laptop GPU, i9-13950HX, SSSTC CA6-8D1024
7.69 s * -20%
Asus ProArt P16 H7607
RTX Spark N1X 6144-Core Blackwell GPU, Spark RTX N1x 675, SanDisk PC SN5100S 2TB
6.414 s *
Lenovo Legion 9 18IAX10 RTX 5090
GeForce RTX 5090 Laptop, Ultra 9 275HX, Samsung PM9E1 MZVLC2T0HBLD
5.56 s * +13%
Apple MacBook Pro 14 2024 M4 Pro Entry
M4 Pro 16-Core GPU, M4 Pro 12-Core, Apple SSD AP1024Z
4.97 s * +23%
Apple MacBook Pro 14 2024 M4 Pro Entry
M4 Pro 16-Core GPU, M4 Pro 12-Core, Apple SSD AP1024Z
4.91 s * +23%
Apple MacBook Pro 16 2026 M5 Pro
M5 Pro 20-Core GPU, M5 Pro 18-Core, Apple SSD AP4096Z
3.97 s * +38%
Apple MacBook Pro 16 2026 M5 Pro
M5 Pro 20-Core GPU, M5 Pro 18-Core, Apple SSD AP4096Z
3.95 s * +38%
MLPerf Client 2.0 / GPU Llama 3.1 8B LLM TTFT
Apple MacBook Pro 14 2024 M4 Pro Entry
M4 Pro 16-Core GPU, M4 Pro 12-Core, Apple SSD AP1024Z
2.37 s * -690%
Apple MacBook Pro 14 2024 M4 Pro Entry
M4 Pro 16-Core GPU, M4 Pro 12-Core, Apple SSD AP1024Z
2.25 s * -650%
Lenovo Legion 5 Pro 16IAH7H
GeForce RTX 3060 Laptop GPU, i7-12700H, 2x Samsung PM9A1 MZVL21T0HCLR (RAID 0)
0.44 s * -47%
Asus ProArt P16 H7607
RTX Spark N1X 6144-Core Blackwell GPU, Spark RTX N1x 675, SanDisk PC SN5100S 2TB
0.3 s *
Razer Blade 16 Early 2023
GeForce RTX 4080 Laptop GPU, i9-13950HX, SSSTC CA6-8D1024
0.24 s * +20%
Asus ROG Strix Scar 17 G733PY-XS96
GeForce RTX 4090 Laptop GPU, R9 7945HX, SK hynix PC801 HFS001TEJ9X101N
0.15 s * +50%
Lenovo Legion 9 18IAX10 RTX 5090
GeForce RTX 5090 Laptop, Ultra 9 275HX, Samsung PM9E1 MZVLC2T0HBLD
0.15 s * +50%
MLPerf Client 2.0 / GPU Llama 3.1 8B LLM Tokens/s
Lenovo Legion 9 18IAX10 RTX 5090
GeForce RTX 5090 Laptop, Ultra 9 275HX, Samsung PM9E1 MZVLC2T0HBLD
123.7 TPS +122%
Asus ROG Strix Scar 17 G733PY-XS96
GeForce RTX 4090 Laptop GPU, R9 7945HX, SK hynix PC801 HFS001TEJ9X101N
100.8 TPS +81%
Razer Blade 16 Early 2023
GeForce RTX 4080 Laptop GPU, i9-13950HX, SSSTC CA6-8D1024
73.4 TPS +32%
Lenovo Legion 5 Pro 16IAH7H
GeForce RTX 3060 Laptop GPU, i7-12700H, 2x Samsung PM9A1 MZVL21T0HCLR (RAID 0)
61.6 TPS +10%
Asus ProArt P16 H7607
RTX Spark N1X 6144-Core Blackwell GPU, Spark RTX N1x 675, SanDisk PC SN5100S 2TB
55.8 TPS
Apple MacBook Pro 14 2024 M4 Pro Entry
M4 Pro 16-Core GPU, M4 Pro 12-Core, Apple SSD AP1024Z
43.2 TPS -23%
Apple MacBook Pro 14 2024 M4 Pro Entry
M4 Pro 16-Core GPU, M4 Pro 12-Core, Apple SSD AP1024Z
37.4 TPS -33%
MLPerf Client 2.0 / GPU Qwen 3 8B SWE Agent Avg Expected Duration
Apple MacBook Pro 14 2024 M4 Pro Entry
M4 Pro 16-Core GPU, M4 Pro 12-Core, Apple SSD AP1024Z
132.7 s * -188%
Apple MacBook Pro 16 2026 M5 Pro
M5 Pro 20-Core GPU, M5 Pro 18-Core, Apple SSD AP4096Z
55.7 s * -21%
Asus ProArt P16 H7607
RTX Spark N1X 6144-Core Blackwell GPU, Spark RTX N1x 675, SanDisk PC SN5100S 2TB
46.115 s *
Lenovo Legion 9 18IAX10 RTX 5090
GeForce RTX 5090 Laptop, Ultra 9 275HX, Samsung PM9E1 MZVLC2T0HBLD
25.7 s * +44%
MLPerf Client 2.0 / GPU Qwen 3 8B SWE Agent Avg Tools Duration
Asus ProArt P16 H7607
RTX Spark N1X 6144-Core Blackwell GPU, Spark RTX N1x 675, SanDisk PC SN5100S 2TB
6.556 s *
Lenovo Legion 9 18IAX10 RTX 5090
GeForce RTX 5090 Laptop, Ultra 9 275HX, Samsung PM9E1 MZVLC2T0HBLD
5.56 s * +15%
Apple MacBook Pro 14 2024 M4 Pro Entry
M4 Pro 16-Core GPU, M4 Pro 12-Core, Apple SSD AP1024Z
4.91 s * +25%
Apple MacBook Pro 16 2026 M5 Pro
M5 Pro 20-Core GPU, M5 Pro 18-Core, Apple SSD AP4096Z
4 s * +39%
MLPerf Client 2.0 / GPU Qwen 3 8B LLM TTFT
Apple MacBook Pro 14 2024 M4 Pro Entry
M4 Pro 16-Core GPU, M4 Pro 12-Core, Apple SSD AP1024Z
2.32 s * -759%
Apple MacBook Pro 16 2026 M5 Pro
M5 Pro 20-Core GPU, M5 Pro 18-Core, Apple SSD AP4096Z
0.54 s * -100%
Asus ProArt P16 H7607
RTX Spark N1X 6144-Core Blackwell GPU, Spark RTX N1x 675, SanDisk PC SN5100S 2TB
0.27 s *
Lenovo Legion 9 18IAX10 RTX 5090
GeForce RTX 5090 Laptop, Ultra 9 275HX, Samsung PM9E1 MZVLC2T0HBLD
0.15 s * +44%
MLPerf Client 2.0 / GPU Qwen 3 8B LLM Tokens/s
Lenovo Legion 9 18IAX10 RTX 5090
GeForce RTX 5090 Laptop, Ultra 9 275HX, Samsung PM9E1 MZVLC2T0HBLD
119 TPS +121%
Asus ProArt P16 H7607
RTX Spark N1X 6144-Core Blackwell GPU, Spark RTX N1x 675, SanDisk PC SN5100S 2TB
53.8 TPS
Apple MacBook Pro 16 2026 M5 Pro
M5 Pro 20-Core GPU, M5 Pro 18-Core, Apple SSD AP4096Z
52.3 TPS -3%
Apple MacBook Pro 14 2024 M4 Pro Entry
M4 Pro 16-Core GPU, M4 Pro 12-Core, Apple SSD AP1024Z
47.5 TPS -12%
Geekbench AI / Single Precision CPU 1.7
Apple MacBook Pro 16 2026 M5 Pro
M5 Pro 20-Core GPU, M5 Pro 18-Core, Apple SSD AP4096Z
5018 Points +212%
Asus ProArt P16 H7607
RTX Spark N1X 6144-Core Blackwell GPU, Spark RTX N1x 675, SanDisk PC SN5100S 2TB
1606 Points
Geekbench AI / Half Precision CPU 1.7
Apple MacBook Pro 16 2026 M5 Pro
M5 Pro 20-Core GPU, M5 Pro 18-Core, Apple SSD AP4096Z
8738 Points +170%
Asus ProArt P16 H7607
RTX Spark N1X 6144-Core Blackwell GPU, Spark RTX N1x 675, SanDisk PC SN5100S 2TB
3237 Points
Geekbench AI / Quantized CPU 1.7
Apple MacBook Pro 16 2026 M5 Pro
M5 Pro 20-Core GPU, M5 Pro 18-Core, Apple SSD AP4096Z
7007 Points +8%
Asus ProArt P16 H7607
RTX Spark N1X 6144-Core Blackwell GPU, Spark RTX N1x 675, SanDisk PC SN5100S 2TB
6468 Points

* ... smaller is better

PugetBench 创作者基准测试

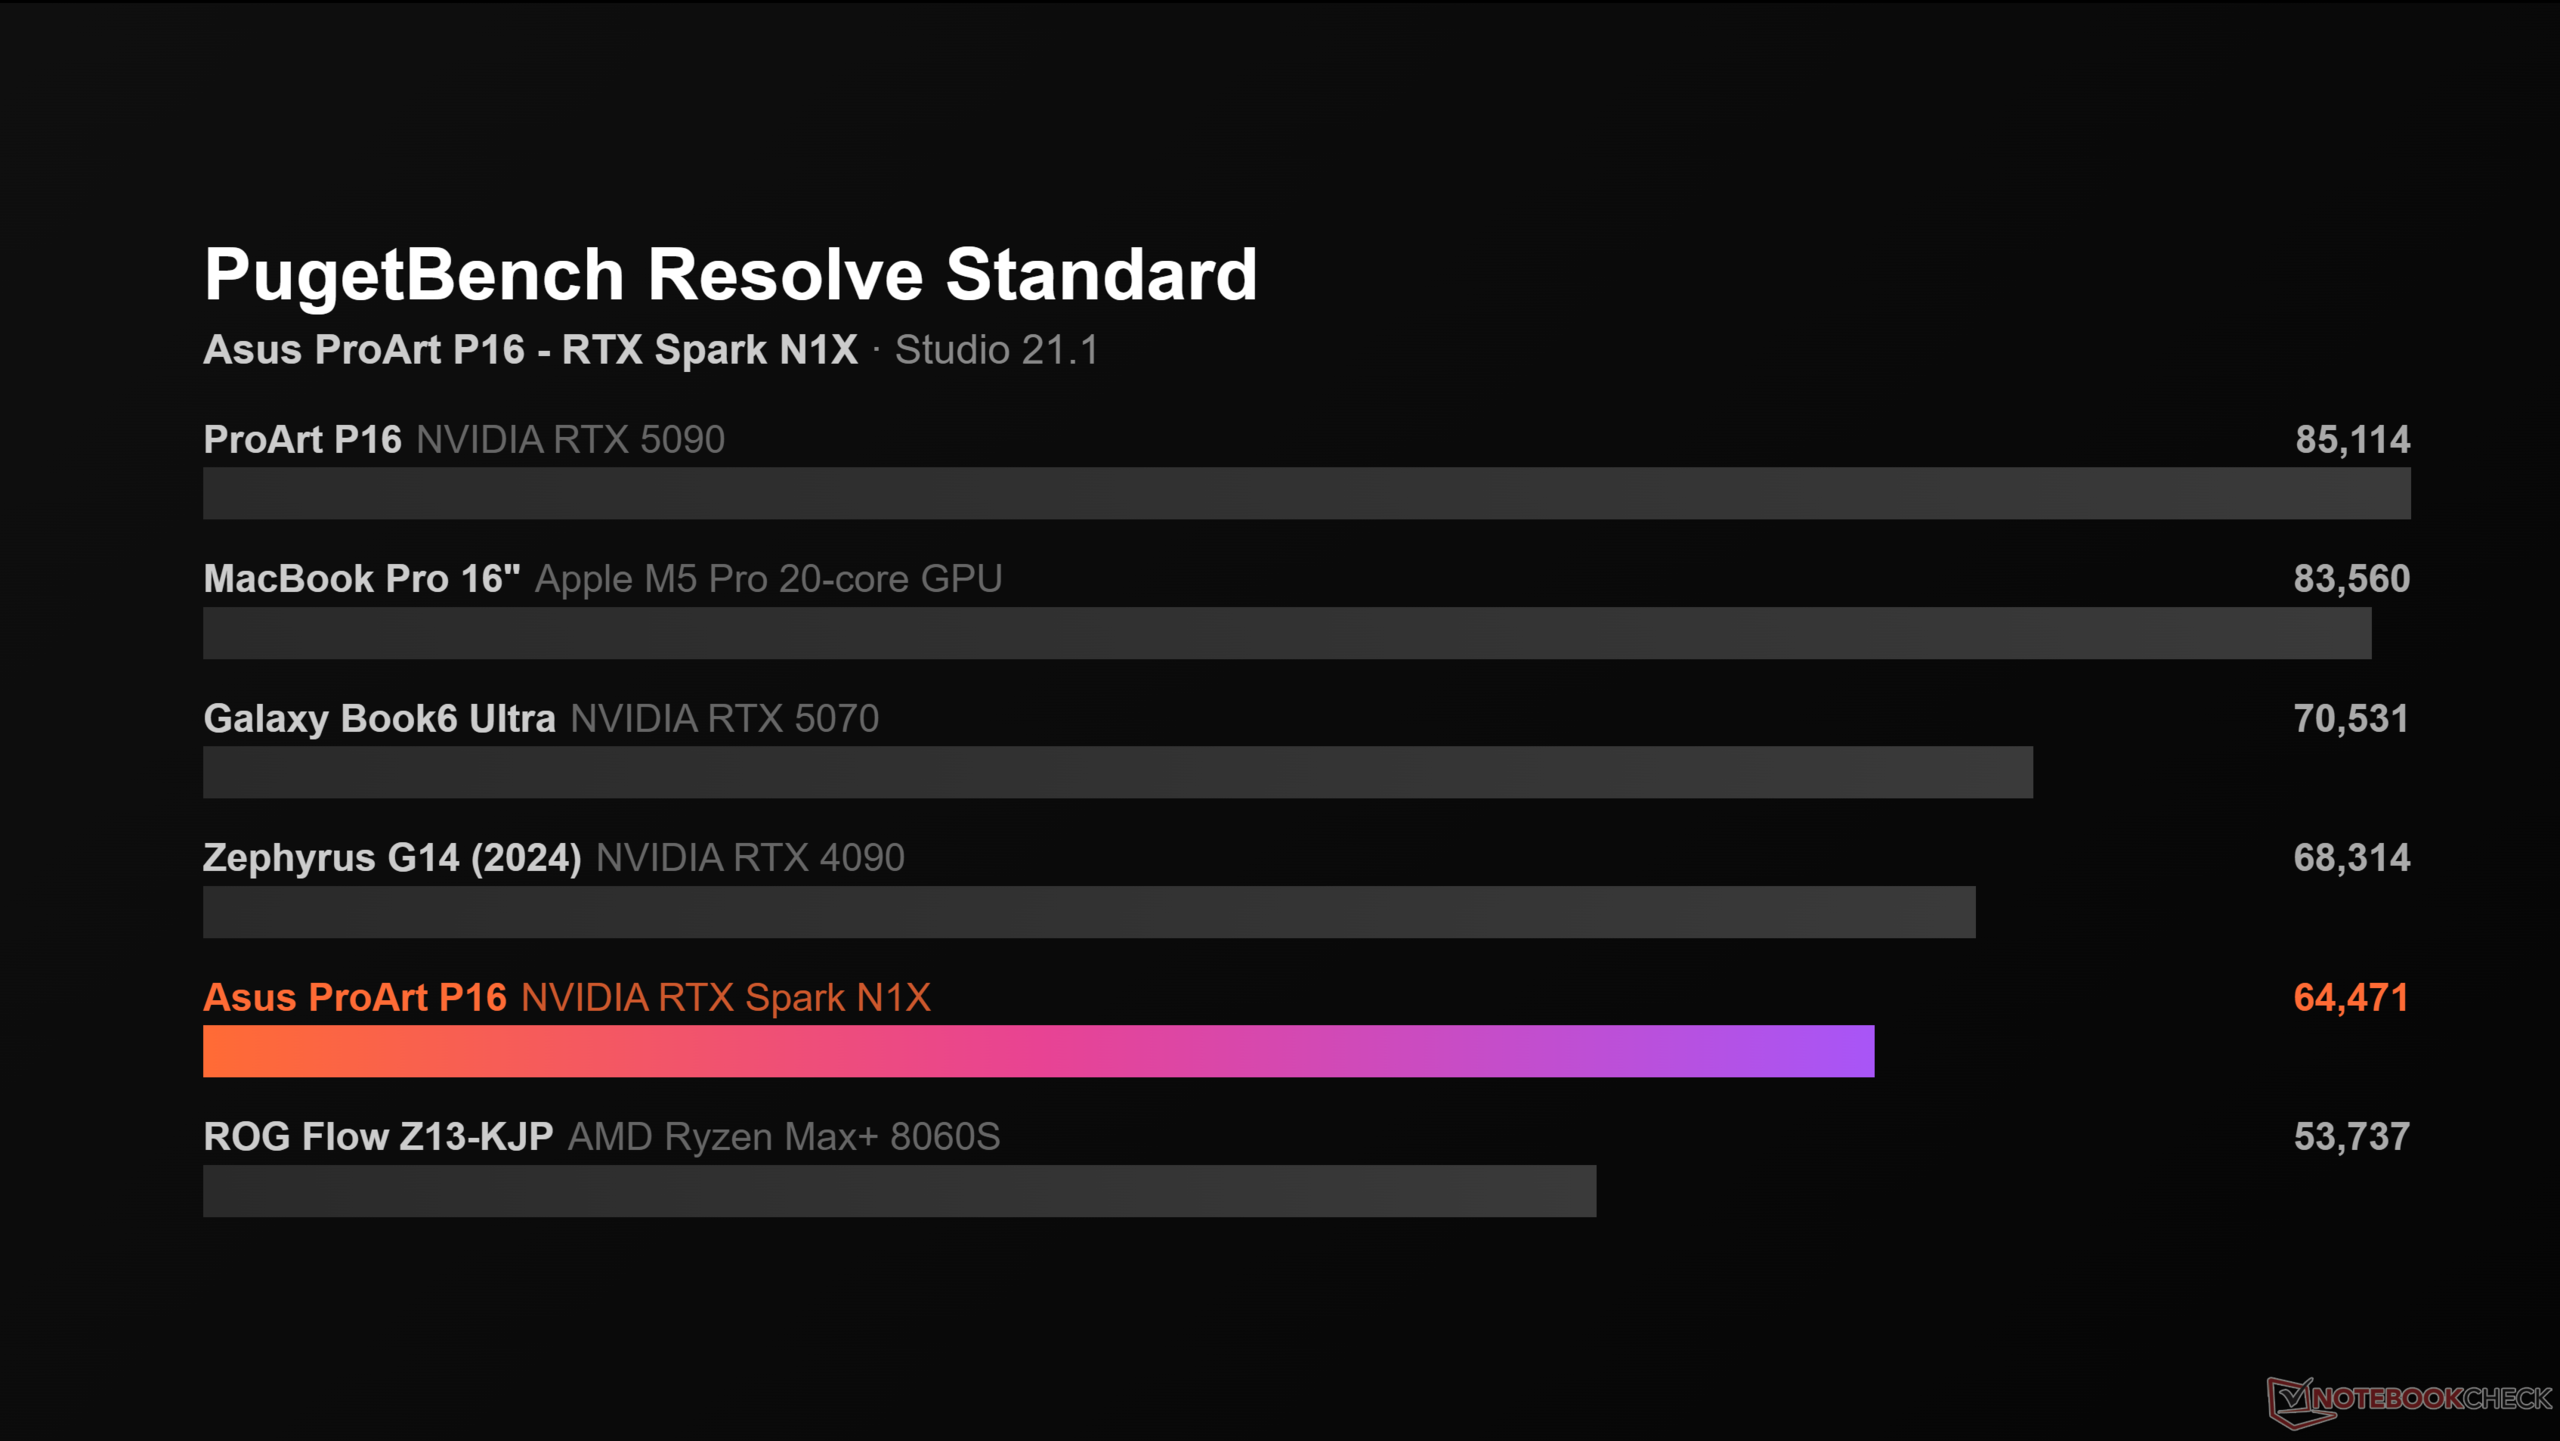
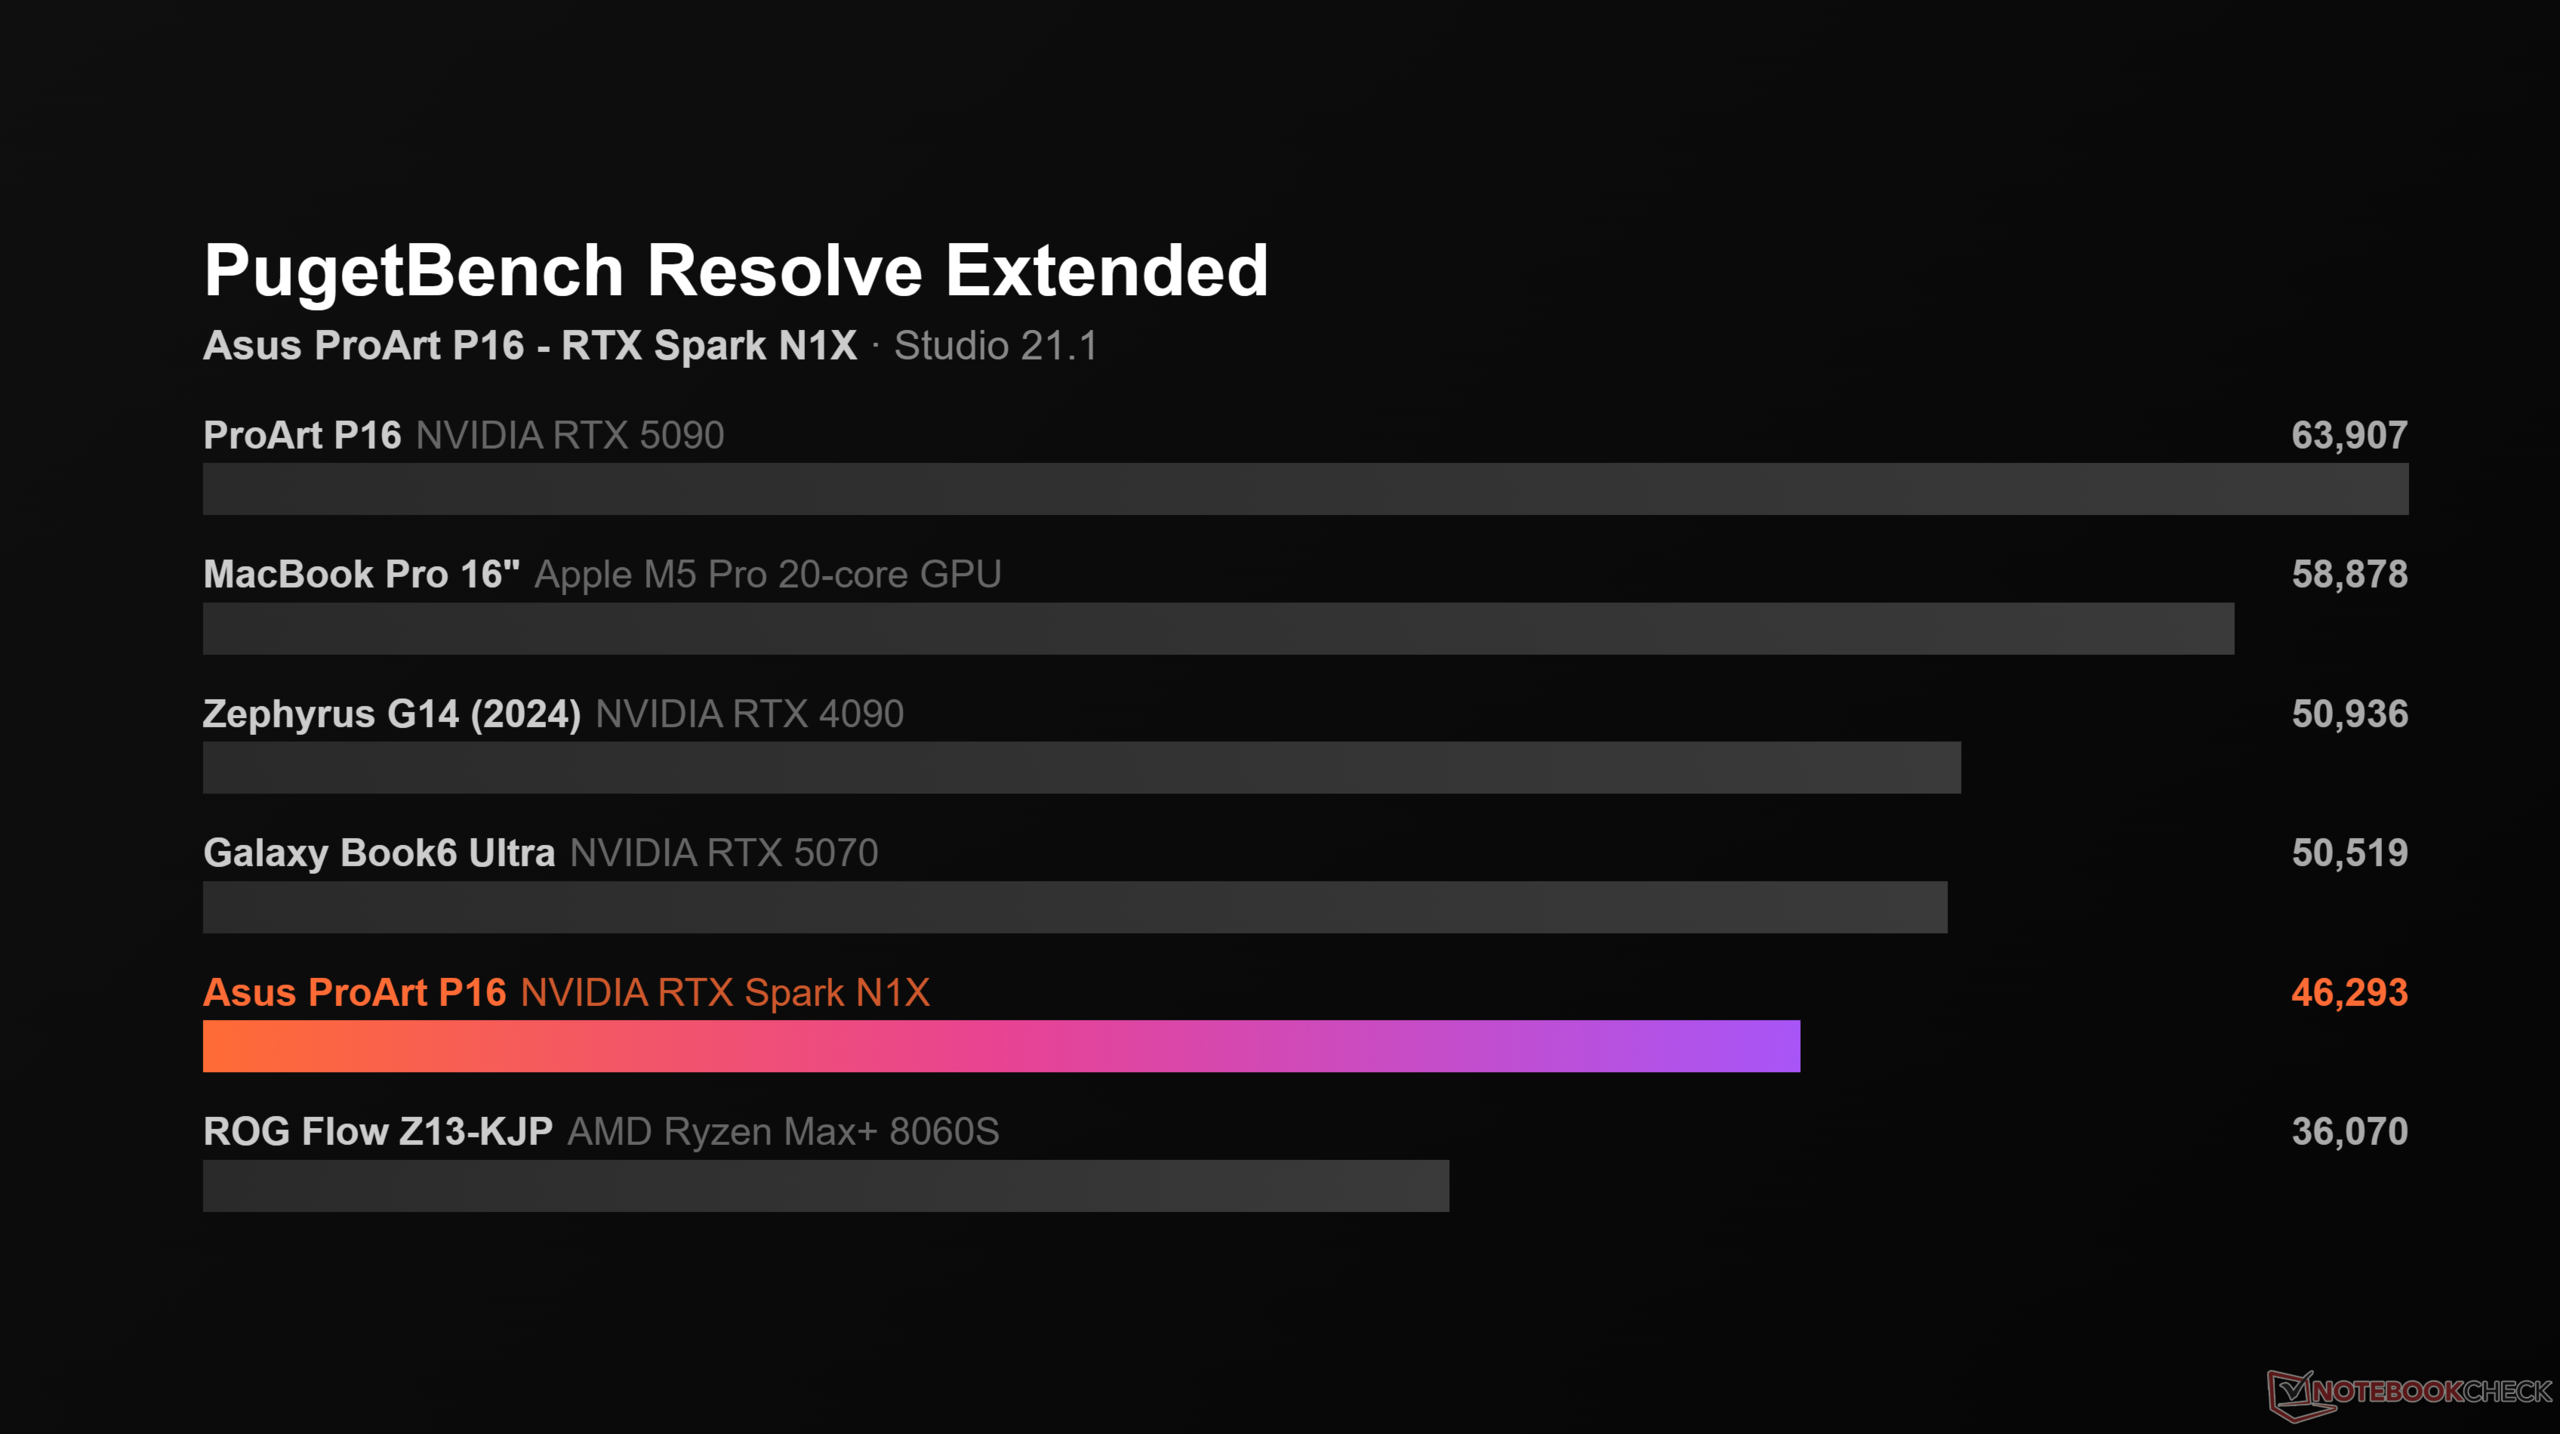
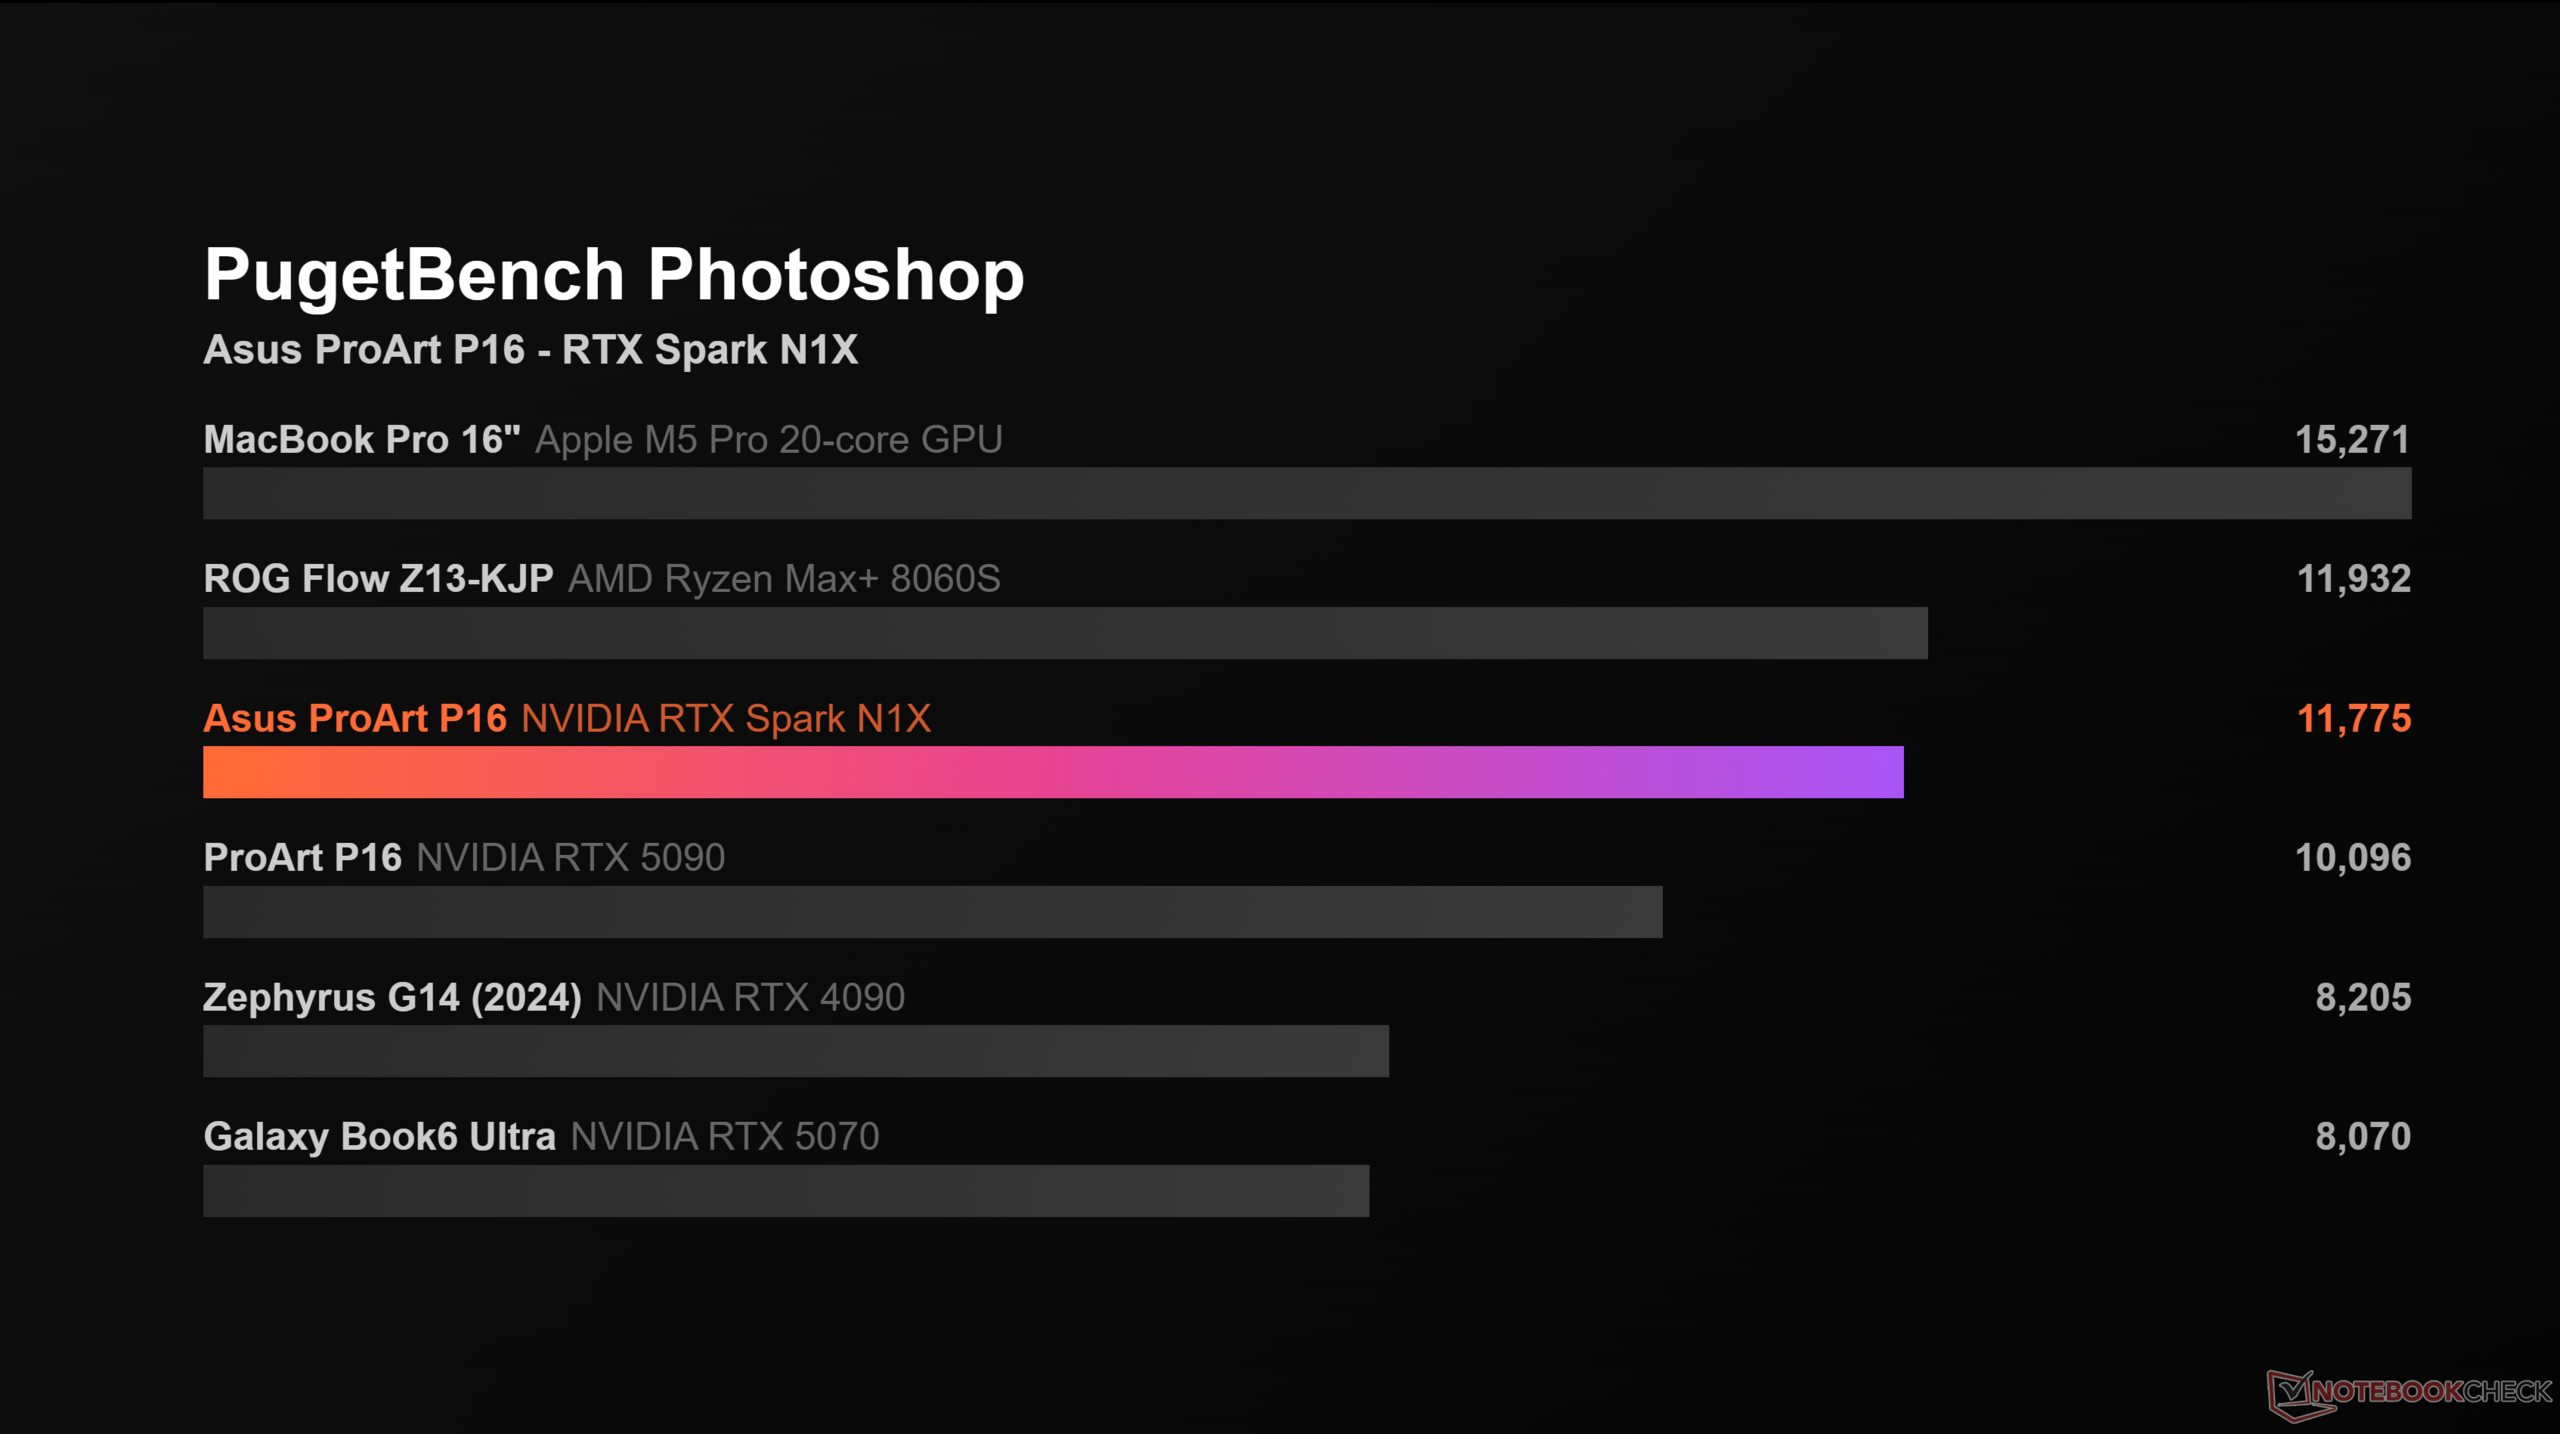
我们还进行了一些内容创作基准测试。在 Adobe Photoshop 中,全新的 N1X 表现出色,与 AMD 的 Strix Halo SoC 不相上下,但 M5 Pro 凭借强大的 CPU 明显领先。有传言称,Photoshop 将推出更新,以更充分地利用 GPU 加速,因此我们很期待看到更新发布后的性能表现。Resolve 基准测试的结果有些令人失望,但考虑到该基准测试不需要太多显存,而且这款软件更青睐高速 GPU,并针对 macOS 进行了深度优化,这些结果也就更容易理解了。不过,当你处理大量 RAW 素材、显存很快就被占满时,N1X 相比 RTX 5070 这类 GPU 无疑更具优势。 
结论 - 首次尝试表现扎实,配备高端硬件
Asus ProArt P16
Asus ProArt P16

全新的 Nvidia RTX Spark N1X 总体表现相当出色,为既要从事 AI 工作和内容创作,又想在同一台设计精致的机器上玩游戏的用户提供了很好的解决方案。虽然它在任何单一领域都不算突出,但整体配置非常有吸引力。作为第一代产品,其 CPU 性能相当强劲,不过能效显然还有提升空间。GPU 性能同样十分可观,原始性能与 GeForce RTX 5070 相当,同时还拥有更大内存的优势,能够应对要求苛刻的游戏或更大型的项目(例如建模、图片和视频编辑)。由于采用 ARM 版 Windows,它仍存在一些兼容性问题(尤其是在游戏方面),但整体情况已比第一代 Snapdragon Windows 笔记本电脑刚推出时好得多。

而且,无论你是否喜欢这种路线,RTX Spark 目前都是获得顶级 Windows 硬件的唯一途径。所有厂商(Microsoft、Asus、Lenovo、Dell、HP 和 MSI)都提供了顶级高端硬件,并配备市面上最好的显示屏。不过,这些笔记本电脑价格昂贵,如果你只想玩游戏,搭载 GeForce RTX GPU 的专用游戏笔记本电脑仍然更胜一筹。然而,RTX Spark 也可能开启游戏设备的新篇章。反正 Nvidia 已经主导了笔记本电脑市场,所以谁知道呢,也许它会直接将下一代 GPU(RTX 6000)与第二代 ARM CPU 结合起来,不再提供独立笔记本电脑 GPU。 

Transparency

The selection of devices to be reviewed is made by our editorial team. The test sample was provided to the author as a loan by the manufacturer or retailer for the purpose of this review. The lender had no influence on this review, nor did the manufacturer receive a copy of this review before publication. There was no obligation to publish this review. As an independent media company, Notebookcheck is not subjected to the authority of manufacturers, retailers or publishers.

This is how Notebookcheck is testing

Every year, Notebookcheck independently reviews hundreds of laptops and smartphones using standardized procedures to ensure that all results are comparable. We have continuously developed our test methods for around 20 years and set industry standards in the process. In our test labs, high-quality measuring equipment is utilized by experienced technicians and editors. These tests involve a multi-stage validation process. Our complex rating system is based on hundreds of well-founded measurements and benchmarks, which maintains objectivity. Further information on our test methods can be found here.

Google LogoAdd as a preferred source on Google
Mail Logo
> Notebookcheck中文版(NBC中国) > 评测 > Nvidia RTX Spark 解析 - 终于有了应对 Apple M5 Pro & M5 Max 的答案?
Andreas Osthoff, 2026-10-16 (Update: 2026-10-16)