Radeon RX 7700S 性能首秀:框架笔记本 16 评测

在 GDC 2023 上亮相框架笔记本 16 在框架 13.5 的可修复性和可持续发展方面进行了扩展,但采用了更大的 16 英寸外形。然而,它不仅仅是一个更大的版本,因为更大的屏幕尺寸允许比原来的 13.5 英寸设计更多的定制和可选部件,包括可拆卸的独立显卡、触摸板垫片、LED 和数字键盘。
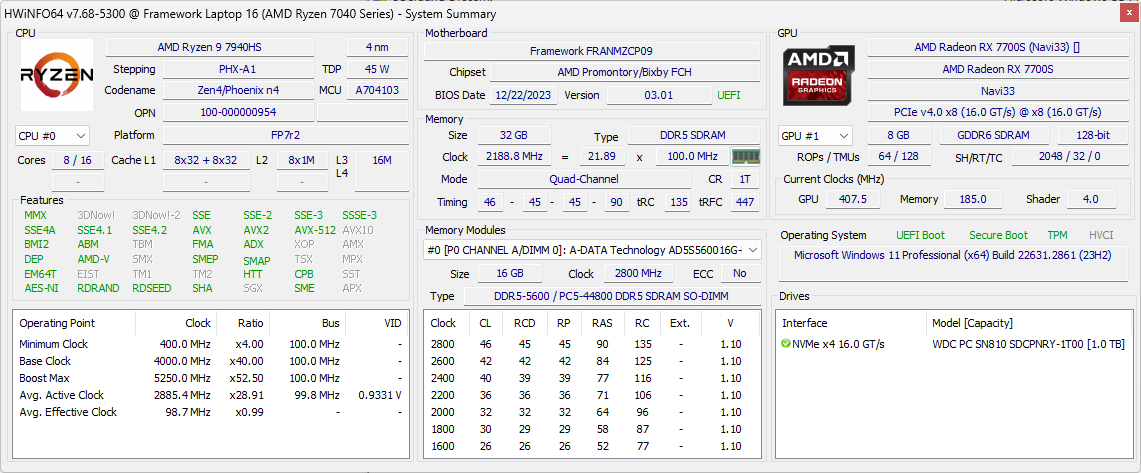
我们的评测机是最高端的配置,配备 Ryzen 9 7940HS 和 100 W Radeon RX 7700S,零售价约为 2400 美元。较低端的 SKU 配备了 Ryzen 7 7840HS,没有独立 GPU,但所有选项都配备了相同的 1600p 165 Hz VRR IPS 显示屏。与 Laptop 13.5 一样,也提供裸机和 DIY 工具包。Framework 表示,该公司在 Laptop 16 的设计上与 AMD 密切合作,这意味着我们不应该在短期内对任何英特尔-英伟达(Intel-Nvidia)选项屏息以待。
尽管从规格上看,Laptop 16 完全能够胜任游戏,但 Framework 还是小心翼翼地避免将其称为游戏笔记本电脑,因为担心会对该机型产生偏见。相反,Laptop 16 的目标受众更广泛,包括多媒体用户、内容创作者和游戏玩家。Laptop 16 的竞争对手包括来自更传统制造商的 16 英寸笔记本电脑,如 惠普 Spectre x360 16即将推出的戴尔 XPS 16、 联想 ThinkPad Z16或 Apple MacBook Pro 16.
更多框架评论:
潜在的竞争对手比较
Rating | Date | Model | Weight | Height | Size | Resolution | Price |
|---|---|---|---|---|---|---|---|
| 89.6 % v7 (old) | 01 / 2024 | Framework Laptop 16 R9 7940HS, Radeon RX 7700S | 2.4 kg | 20.95 mm | 16.00" | 2560x1600 | |
| 88.1 % v7 (old) | 12 / 2023 | MSI Prestige 16 B1MG-001US Ultra 7 155H, Arc 8-Core | 1.6 kg | 19.1 mm | 16.00" | 2560x1600 | |
| 88.6 % v7 (old) | 12 / 2023 | Lenovo ThinkPad Z16 Gen 2 R9 PRO 7940HS, Radeon RX 6550M | 1.8 kg | 15.8 mm | 16.00" | 3840x2400 | |
| 93.2 % v7 (old) | 11 / 2023 | Apple MacBook Pro 16 2023 M3 Max Apple M3 Max 16-Core, M3 Max 40-Core GPU | 2.1 kg | 16.9 mm | 16.00" | 3456x2234 | |
| 87.1 % v7 (old) | 08 / 2023 | Dell Inspiron 16 Plus 7630 i7-13700H, GeForce RTX 4060 Laptop GPU | 2.2 kg | 19.95 mm | 16.00" | 2560x1600 | |
| 87.3 % v7 (old) | 01 / 2023 | HP Spectre x360 2-in-1 16-f1075ng i7-12700H, Iris Xe G7 96EUs | 2 kg | 19.9 mm | 16.00" | 3072x1920 |
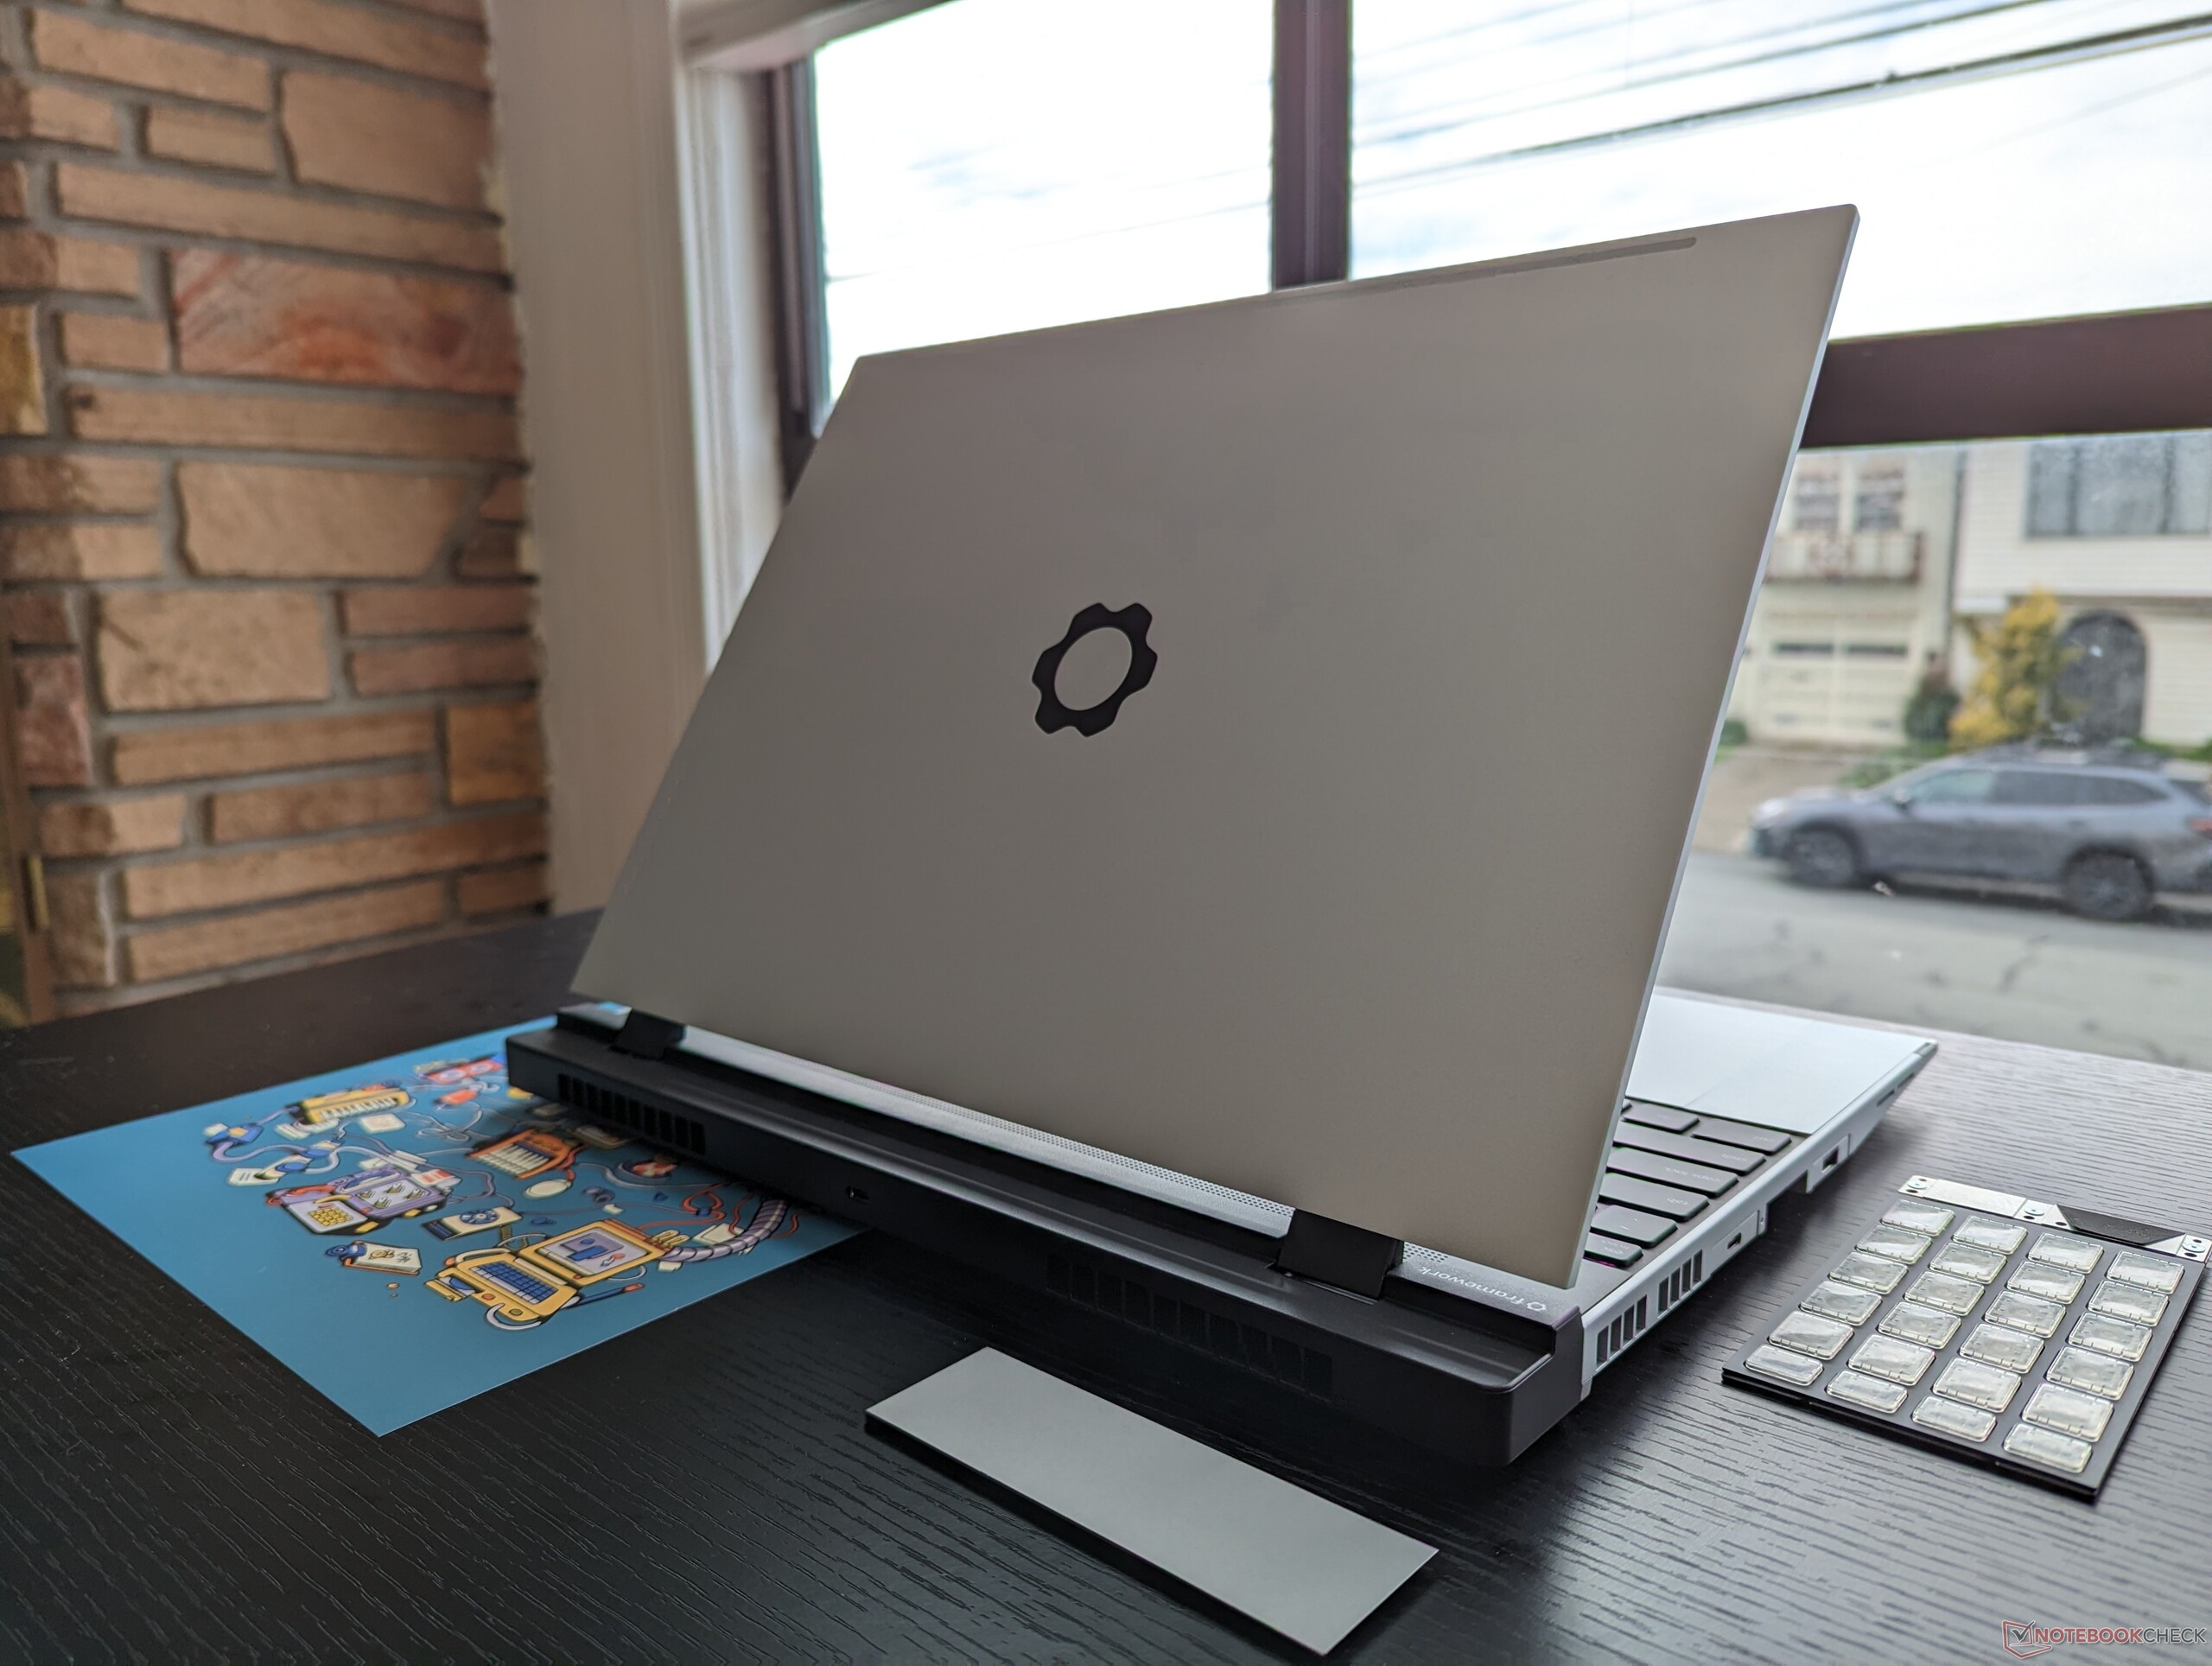
案例 - 形式与功能的完美结合
该机箱由较小的 13.5 英寸笔记本电脑.虽然两者的材料基本相同,但 Laptop 16 的底座给人的感觉更厚实、更坚固,即使考虑到所有新的可拆卸部件,也能给人更好的第一印象。如果试图扭转底座或翘起键盘,几乎不会出现吱吱嘎嘎的声音,变形也很小,这已经是比更脆弱的 13.5 笔记本电脑的巨大进步。
遗憾的是,有一项性能没有得到改善,那就是盖子。与笔记本 13.5 一样,笔记本 16 的盖子与其他 16 英寸的替代产品(如惠普 Spectre x360 16 或刀锋 16)相比,更容易扭曲和变形。 刀锋 16.铰链可能还不错,但盖子感觉又是机身最薄弱的地方。
尺寸和重量因安装 dGPU 模块或安装较小的标准盖板模块而不同。事实上,与其他 16 英寸多媒体笔记本电脑相比,装上 dGPU 模块后,Laptop 16 的重量和长度都明显增加。如果仅使用标准上盖模块,其长度已达到 270 毫米。如果你担心便携性问题,那么Apple 或 LG Gram 系列等传统笔记本电脑肯定能帮你解决这个问题。 LG Gram 系列.
| 带标准扩展舱盖模块 | 356.58 x 270.0 x 17.95 毫米 | 2.1 千克 |
| 带独立显卡托架模块 | 356.58 x 290.2 x 20.95 毫米 | 2.4 千克 |
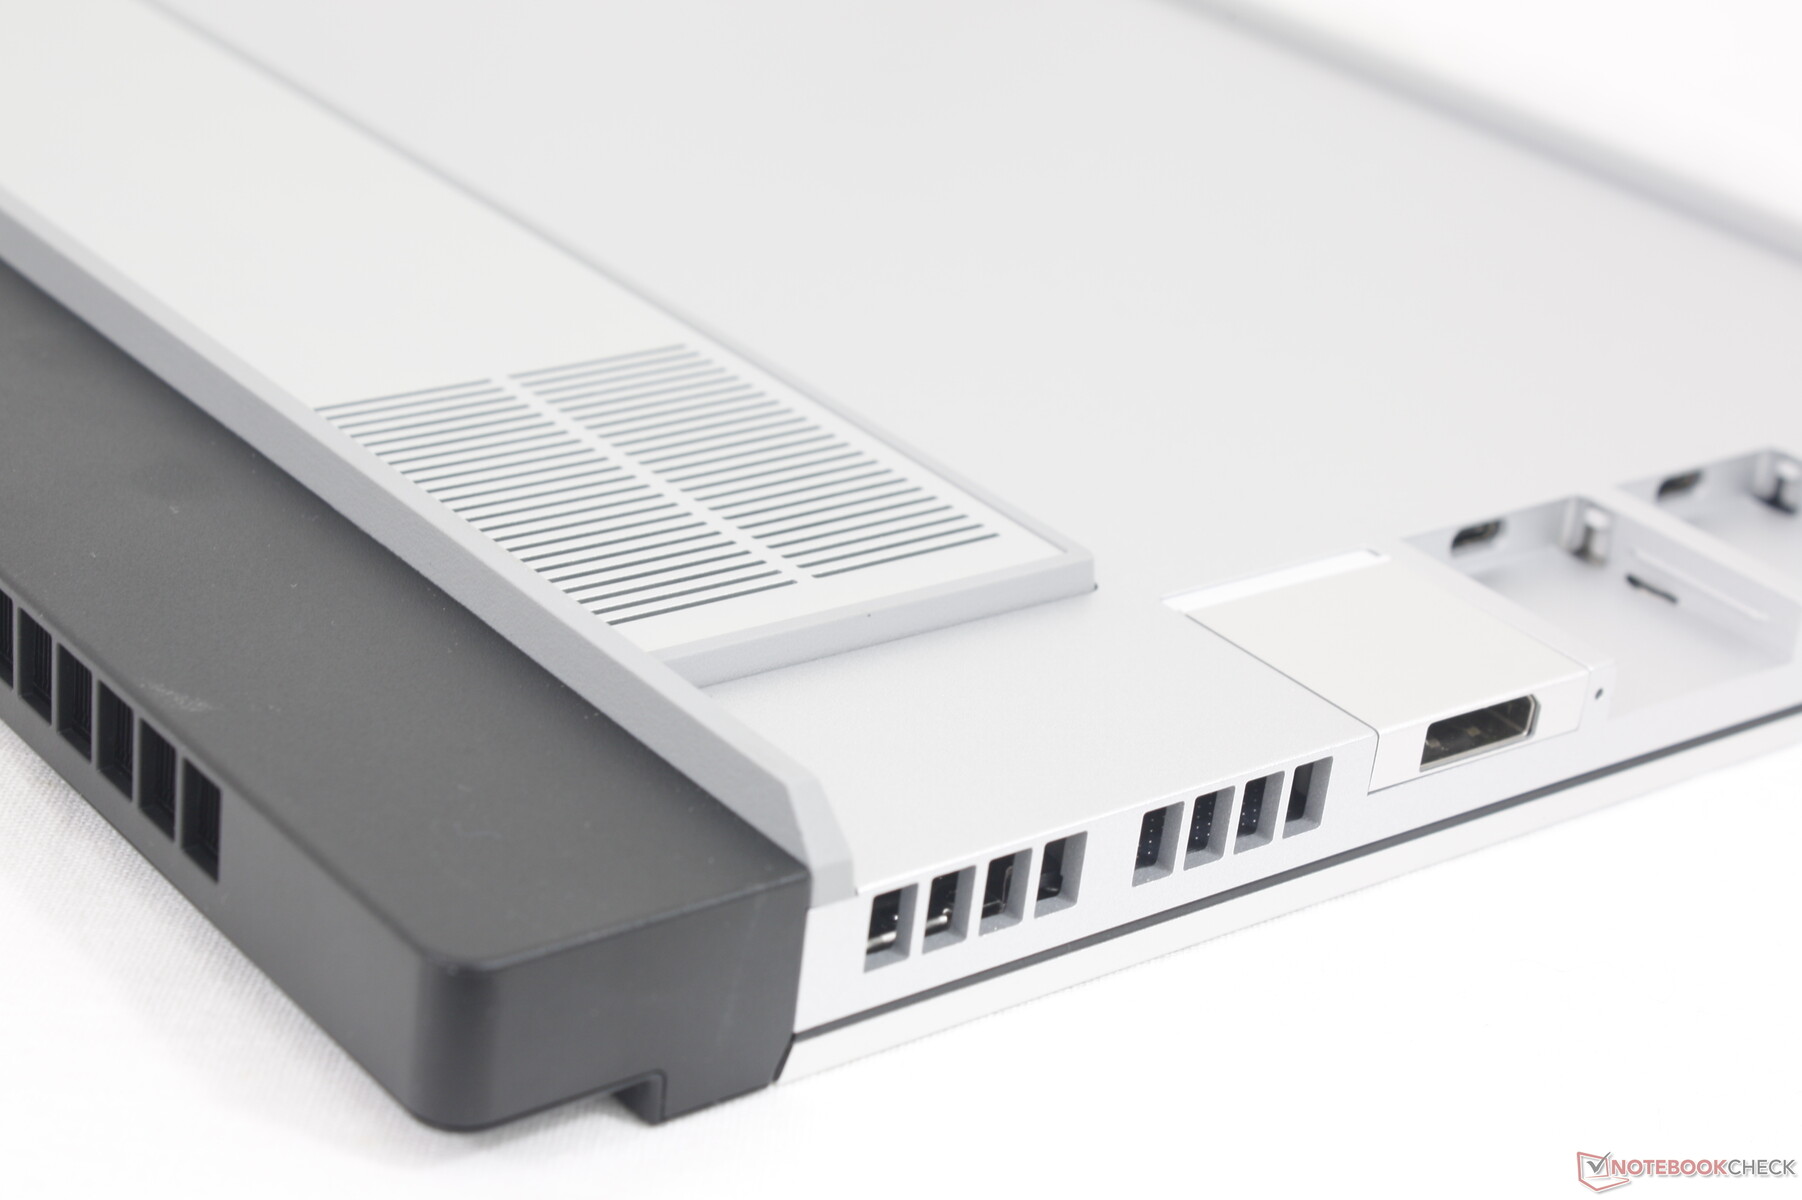
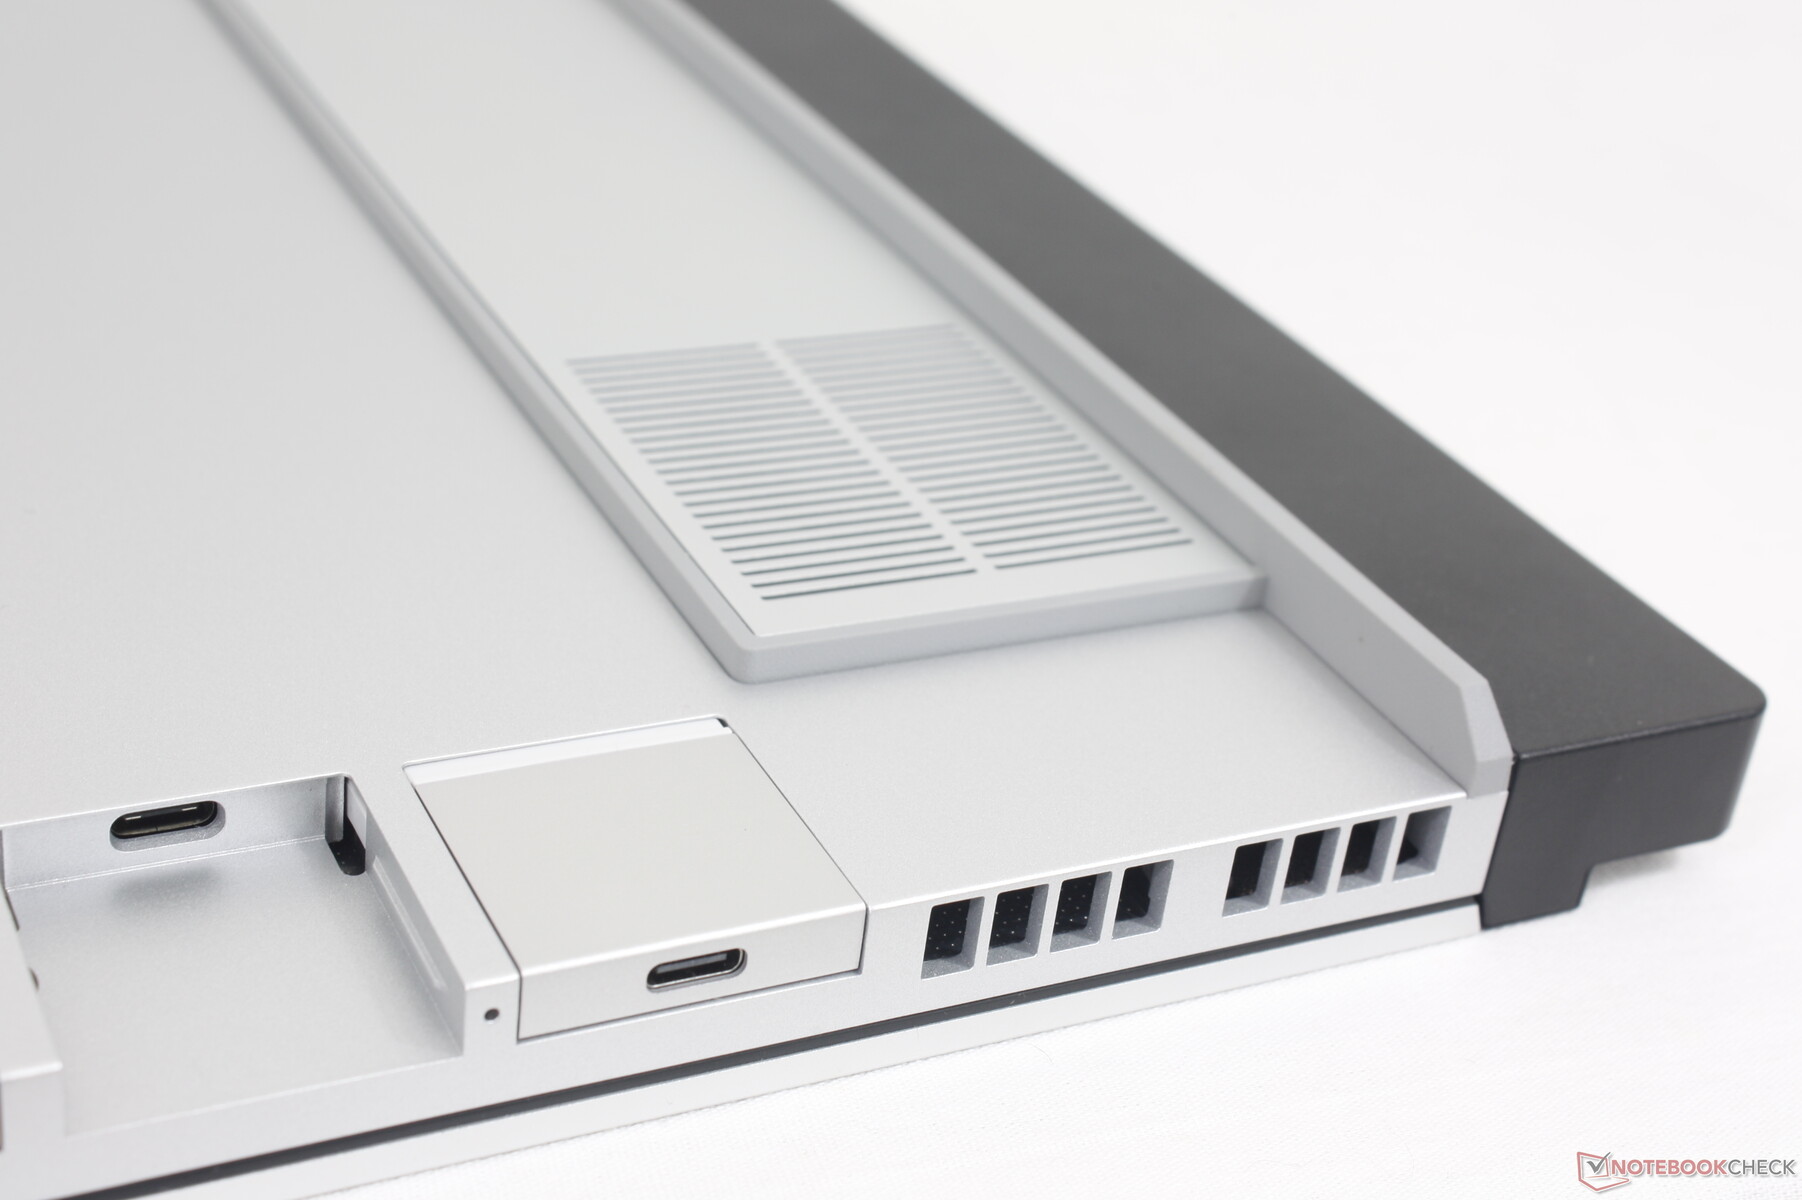
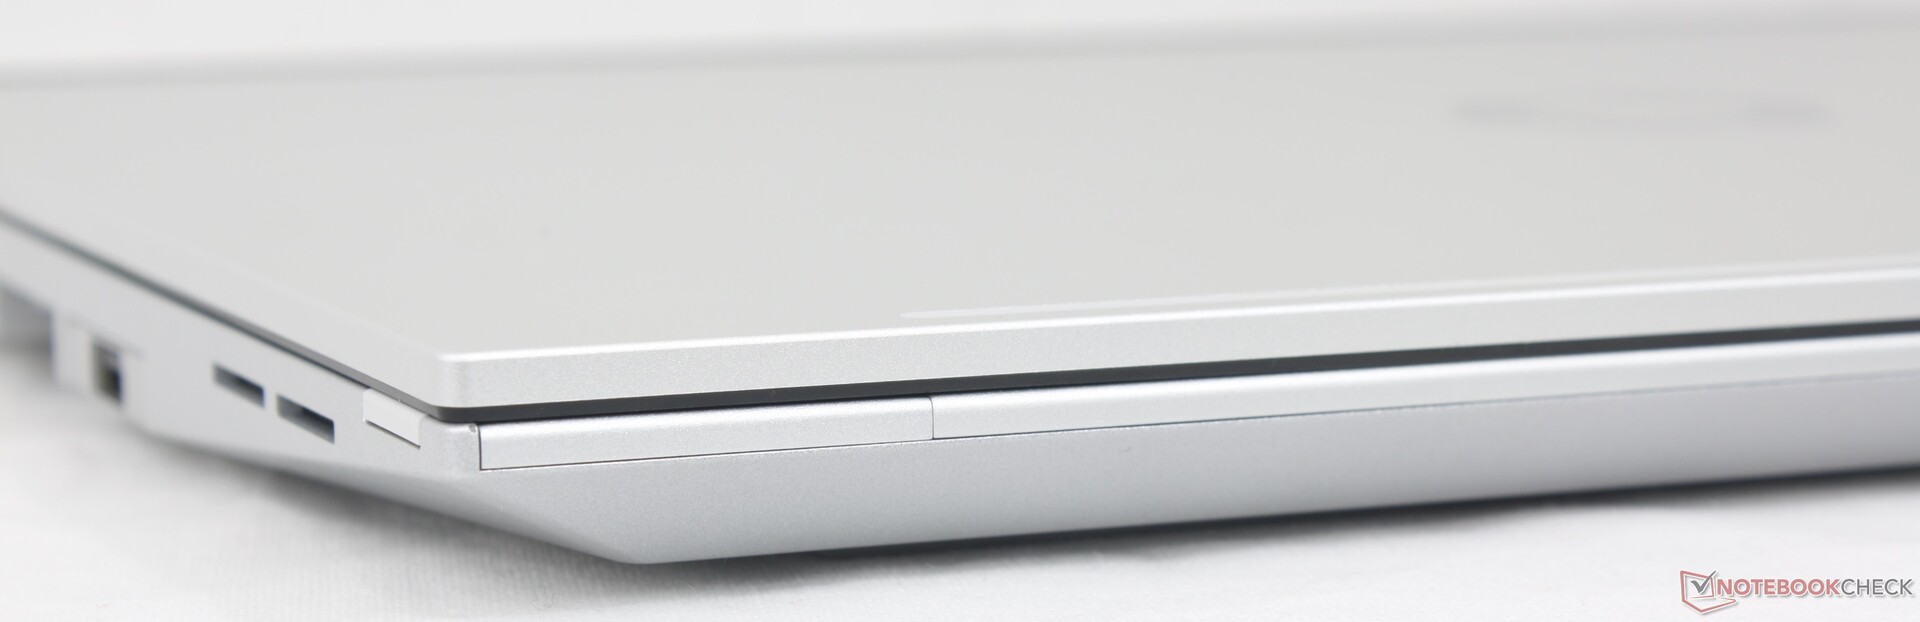
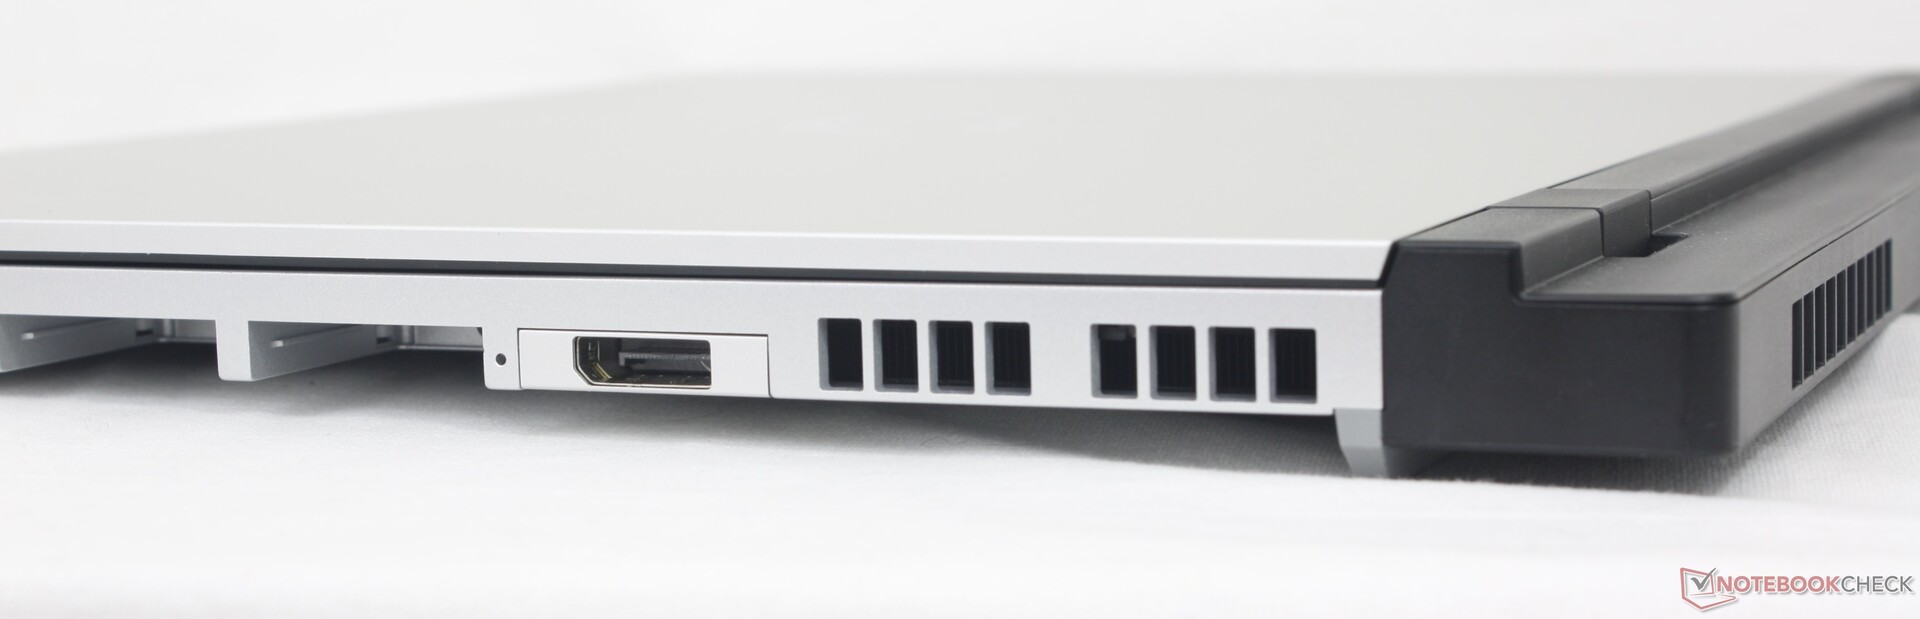
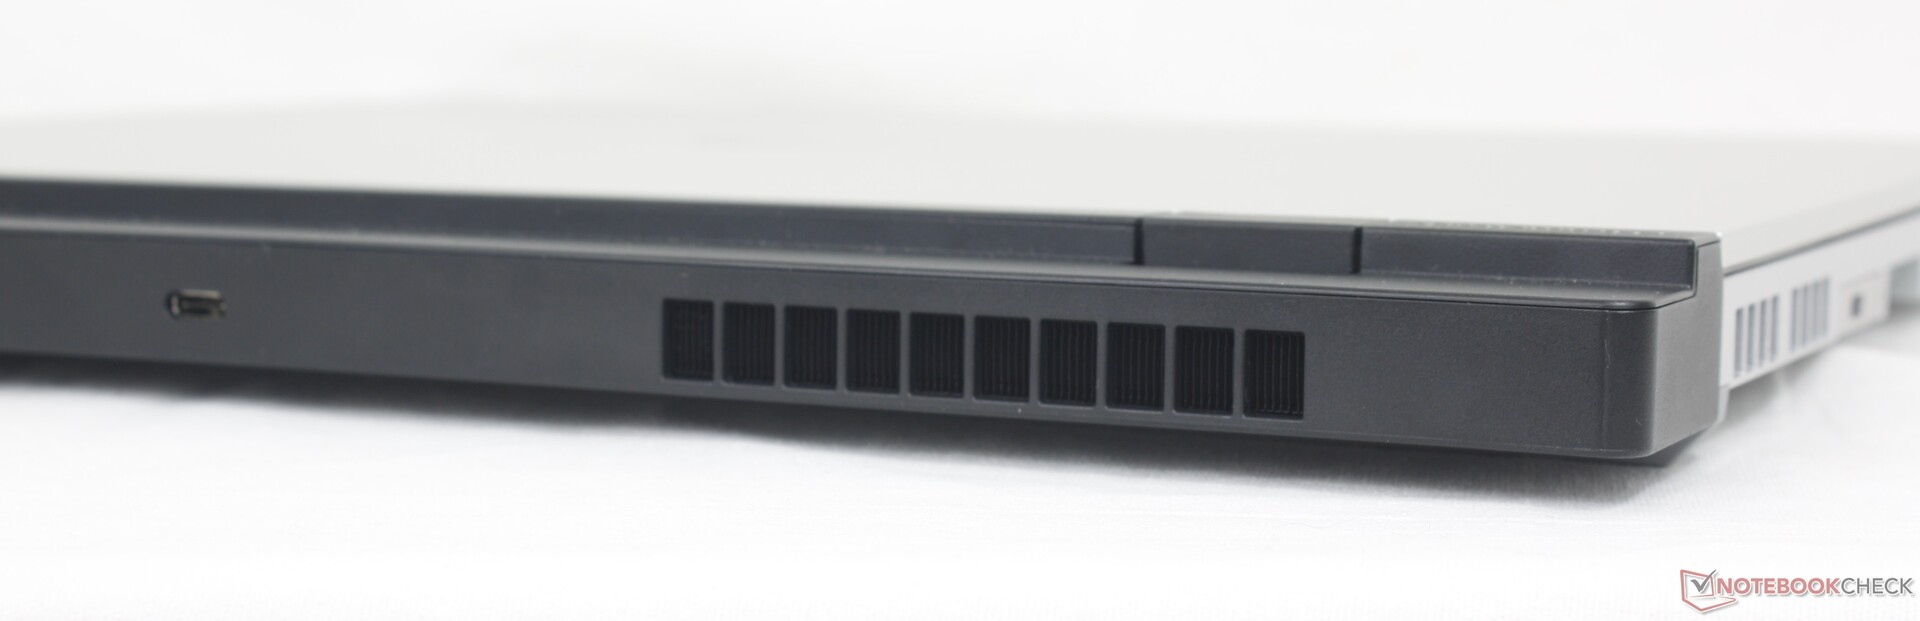
连接性 - 六个可定制的端口
这是近来唯一一款集成了六个 USB-C 端口的笔记本电脑,甚至没有音频插孔或 Kensington 锁。所有六个端口都与 Framework 现有的扩展卡阵容兼容,因此它们的功能与 13.5 笔记本电脑相同。
值得注意的是,如下表所示,这六个 USB-C 端口并不相同。只有两个是 USB4,三个兼容 DP,四个兼容 USB-C 交流适配器。端口之间没有直观的指示灯区分。
| 扩展卡插槽 # | 接口 | 兼容 DisplayPort? | 240 瓦 USB-C 充电兼容? | USB-A 高功耗? |
| 1 | USB4 | Y | Y | Y |
| 2 | USB 3.2 | N | Y | N |
| 3 | USB 3.2 | N | N | N |
| 4 | USB4 | Y | Y | Y |
| 5 | USB 3.2 | Y | Y | N |
| 6 | USB 3.2 | N | N | N |
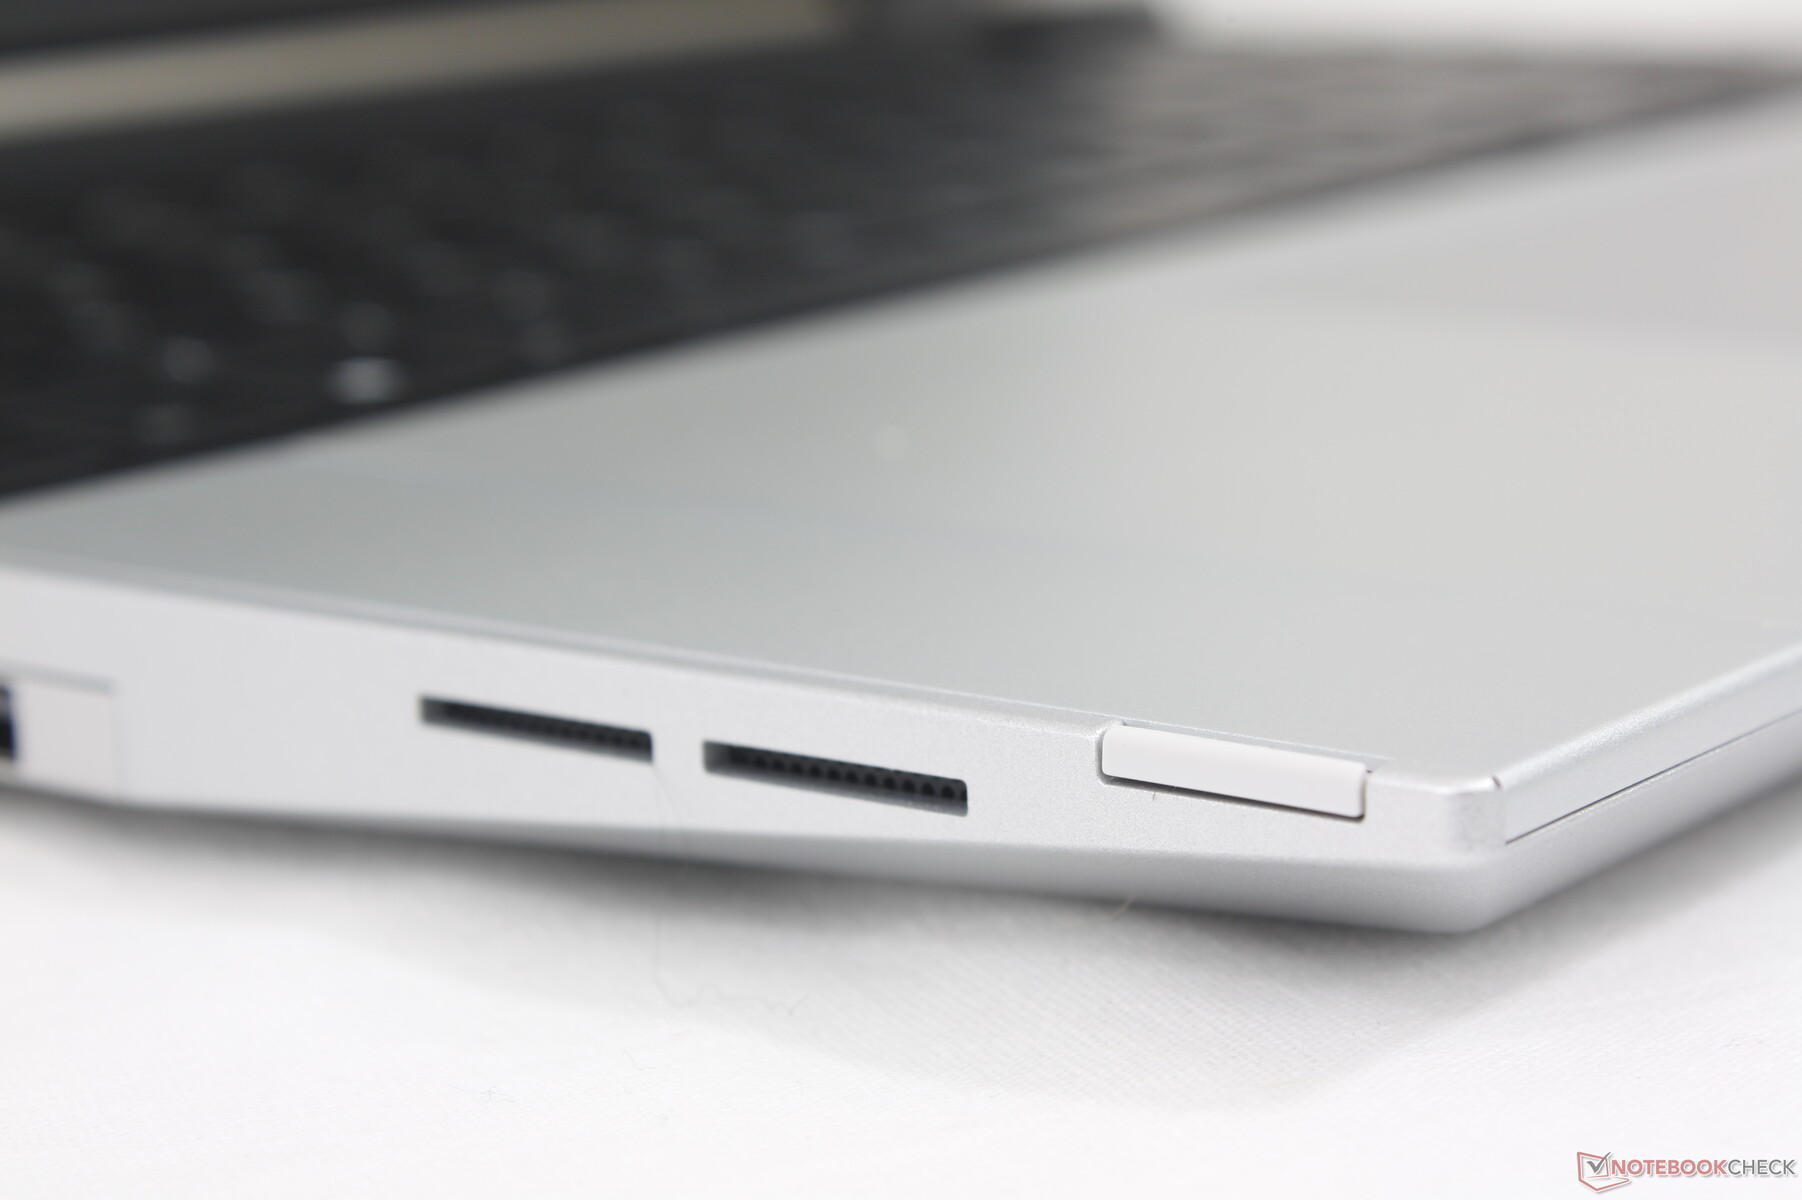
此外,全尺寸 SD 阅读器、WAN 或 RJ-45 扩展卡仍未配备。如果这些端口对你来说很重要,那么你就得考虑 USB 适配器或扩展坞了。
如果安装了独立 GPU 模块,后部边缘的第七个 USB-C 端口将可用。该端口与 DP 兼容,但与 AC 适配器不兼容。
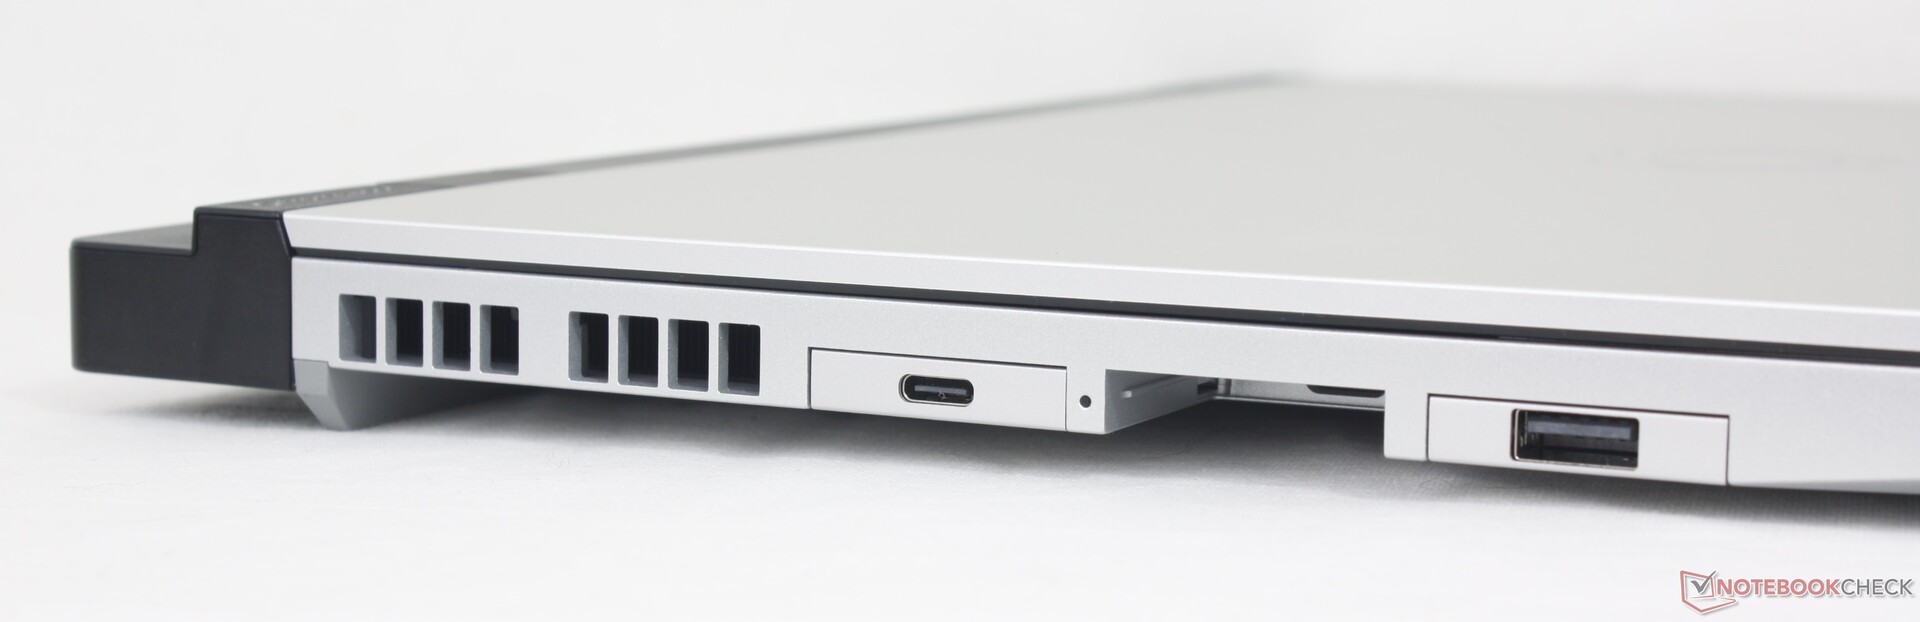
SD 读卡器
Laptop 16 采用了与 Laptop 13.5 相同的 MicroSD 扩展读卡器,读写速度相似。读卡速度仅为 80 MB/s,比同类机型的读卡器慢得多,如 ThinkPad Z16 Gen 2或 MacBook Pro 16 等竞争机型的读卡器要慢得多。
我们无法获得 Laptop 16 的 SD 读卡器扩展卡,因此下面提供的是 Laptop 13.5 的数据。
| SD Card Reader | |
| average JPG Copy Test (av. of 3 runs) | |
| MSI Prestige 16 B1MG-001US (Toshiba Exceria Pro SDXC 64 GB UHS-II) | |
| Apple MacBook Pro 16 2023 M3 Max (Angelbird AV Pro V60) | |
| Lenovo ThinkPad Z16 Gen 2 (Toshiba Exceria Pro SDXC 64 GB UHS-II) | |
| HP Spectre x360 2-in-1 16-f1075ng | |
| Framework Laptop 13.5 (AV Pro UHS-II V60) | |
| Dell Inspiron 16 Plus 7630 (AV Pro SD microSD 128 GB V60) | |
| maximum AS SSD Seq Read Test (1GB) | |
| Lenovo ThinkPad Z16 Gen 2 (Toshiba Exceria Pro SDXC 64 GB UHS-II) | |
| Apple MacBook Pro 16 2023 M3 Max (Angelbird AV Pro V60) | |
| MSI Prestige 16 B1MG-001US (Toshiba Exceria Pro SDXC 64 GB UHS-II) | |
| HP Spectre x360 2-in-1 16-f1075ng | |
| Framework Laptop 13.5 (AV Pro UHS-II V60) | |
| Dell Inspiron 16 Plus 7630 (AV Pro SD microSD 128 GB V60) | |
交流
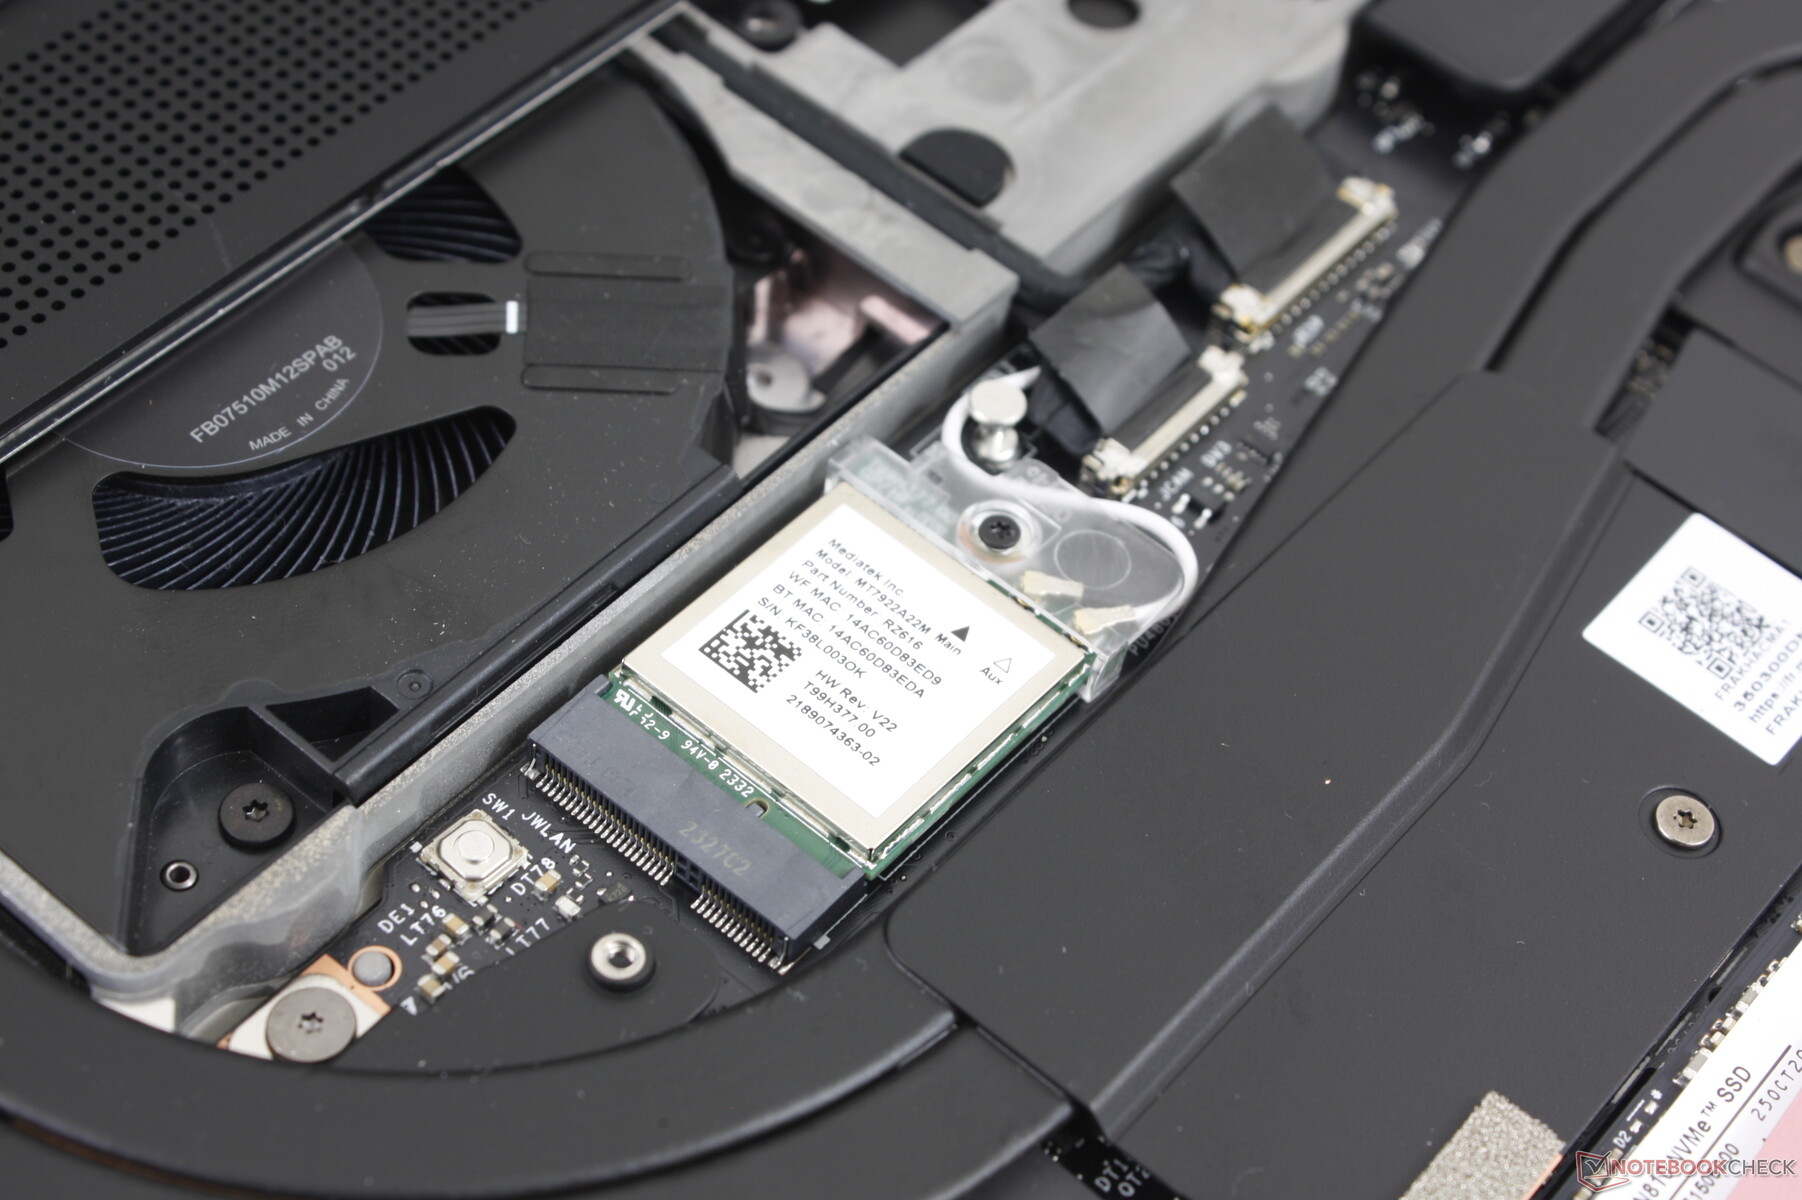
Wi-Fi 6 和 6E 由联发科 MT7922 提供,而不是通常的 AX211,这与该机型的无英特尔设计保持了一致。与华硕 AXE11000 测试路由器配对时,我们体验到了稳定可靠的连接。
遗憾的是,它不支持广域网。
网络摄像头
该机标配 200 万像素网络摄像头,带有红外和手动快门功能,而惠普 Spectre 或 Elite 系列等竞争对手早在一年多以前就已经配备了 500 万像素或更高像素的网络摄像头。希望 Framework 能在未来提供更好的网络摄像头选项。


配件 - 比蝙蝠侠的多功能腰带更多的选择
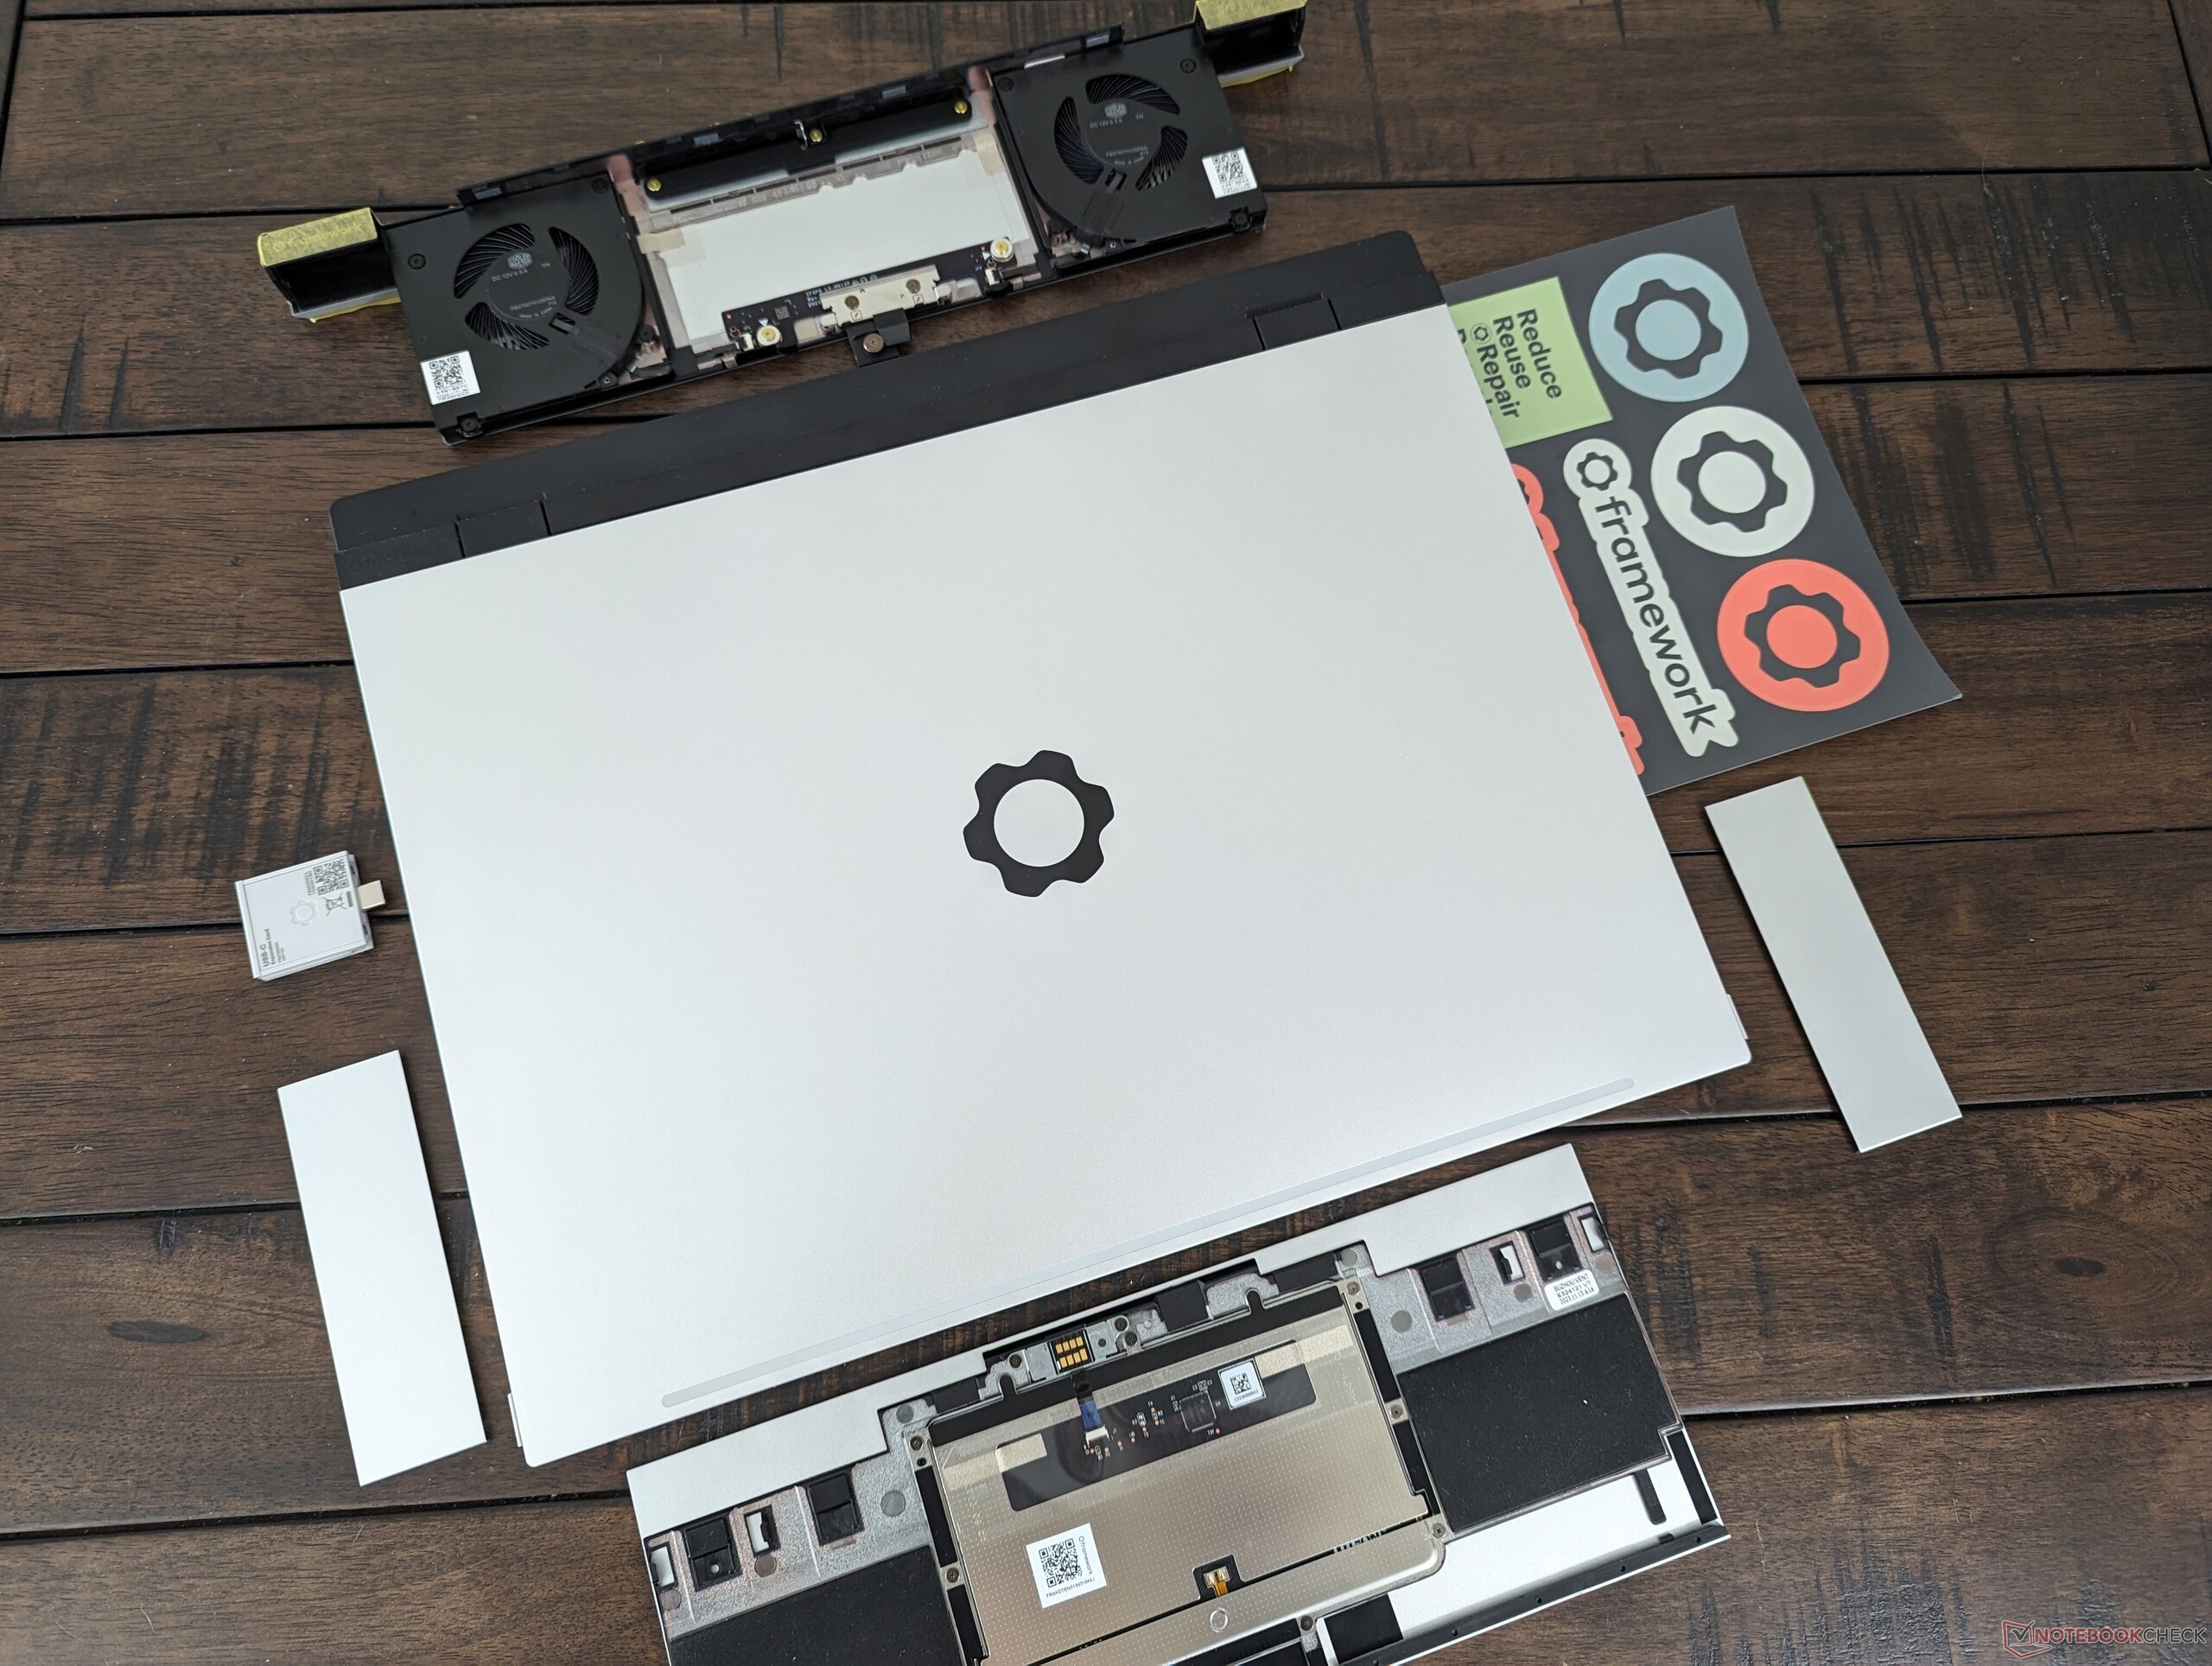
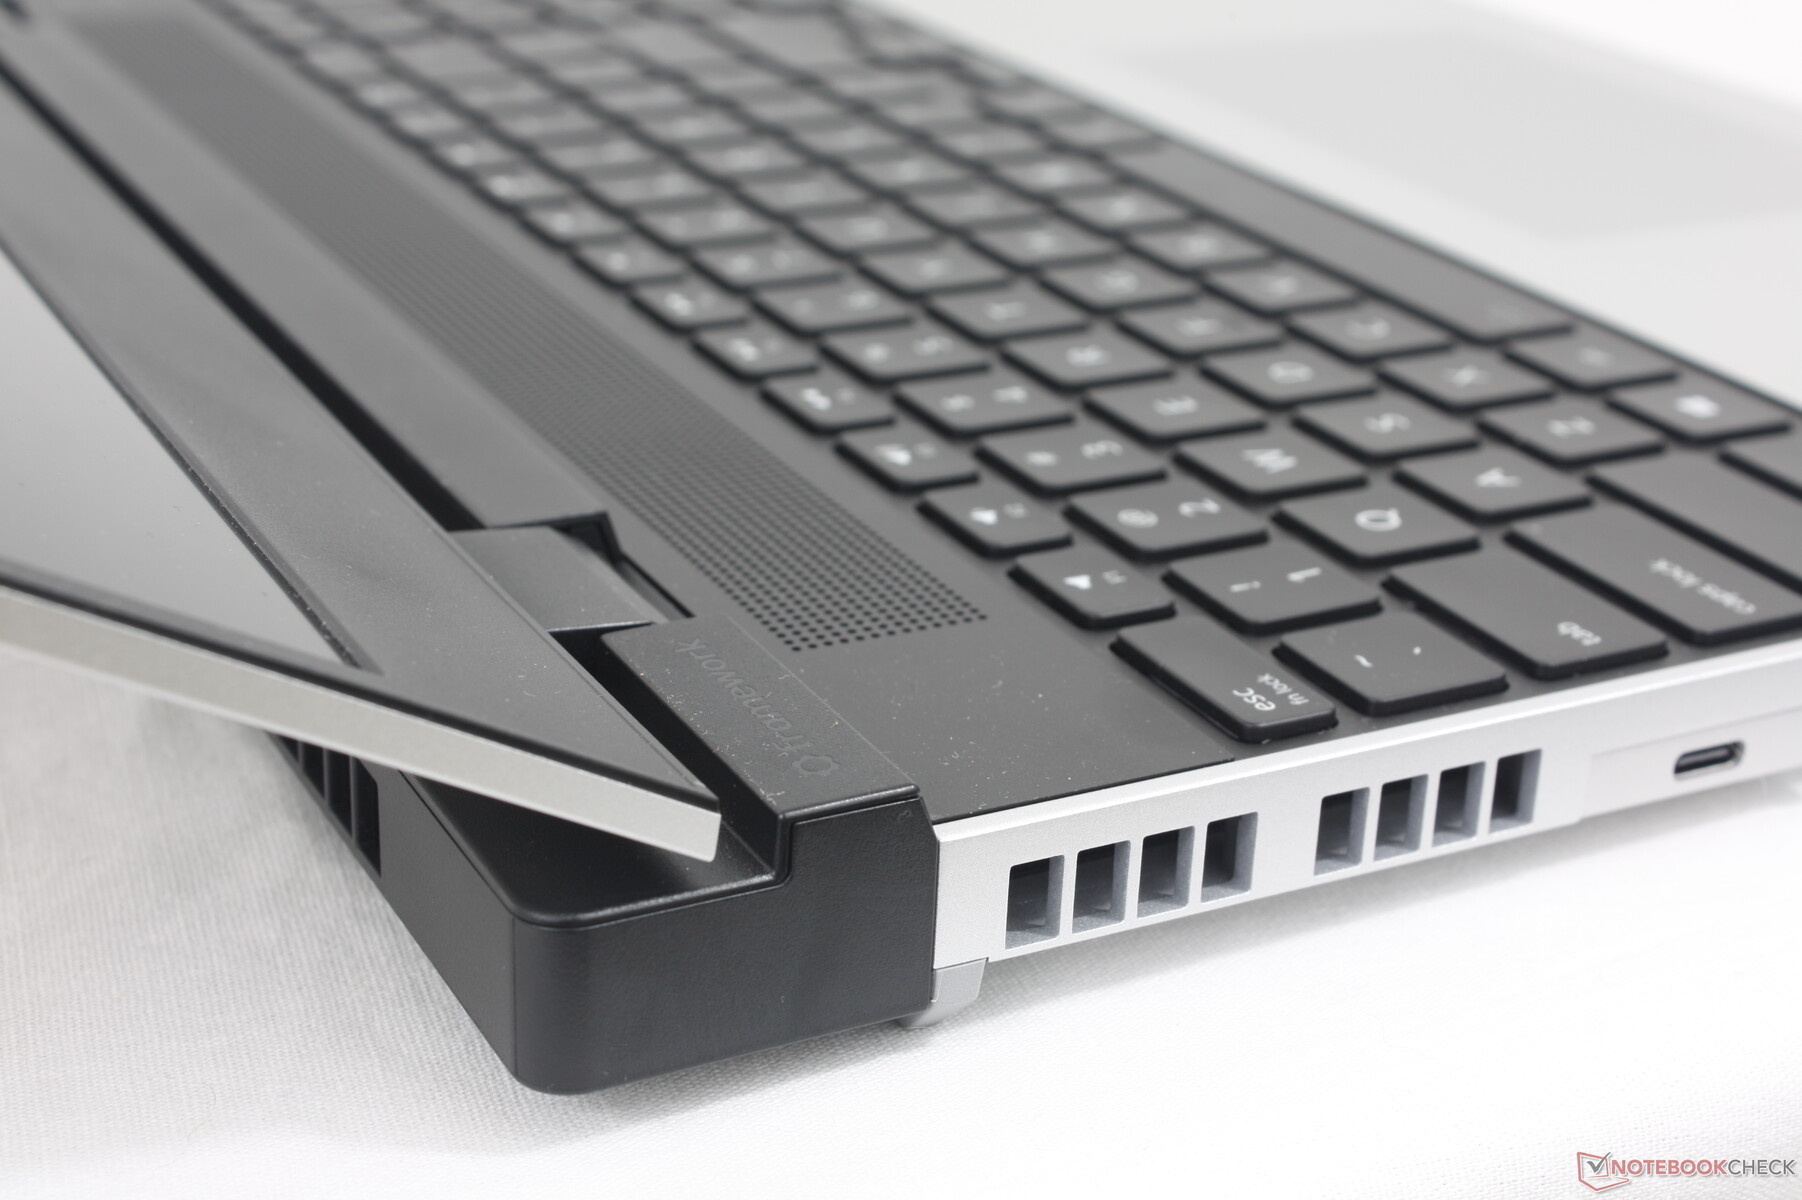
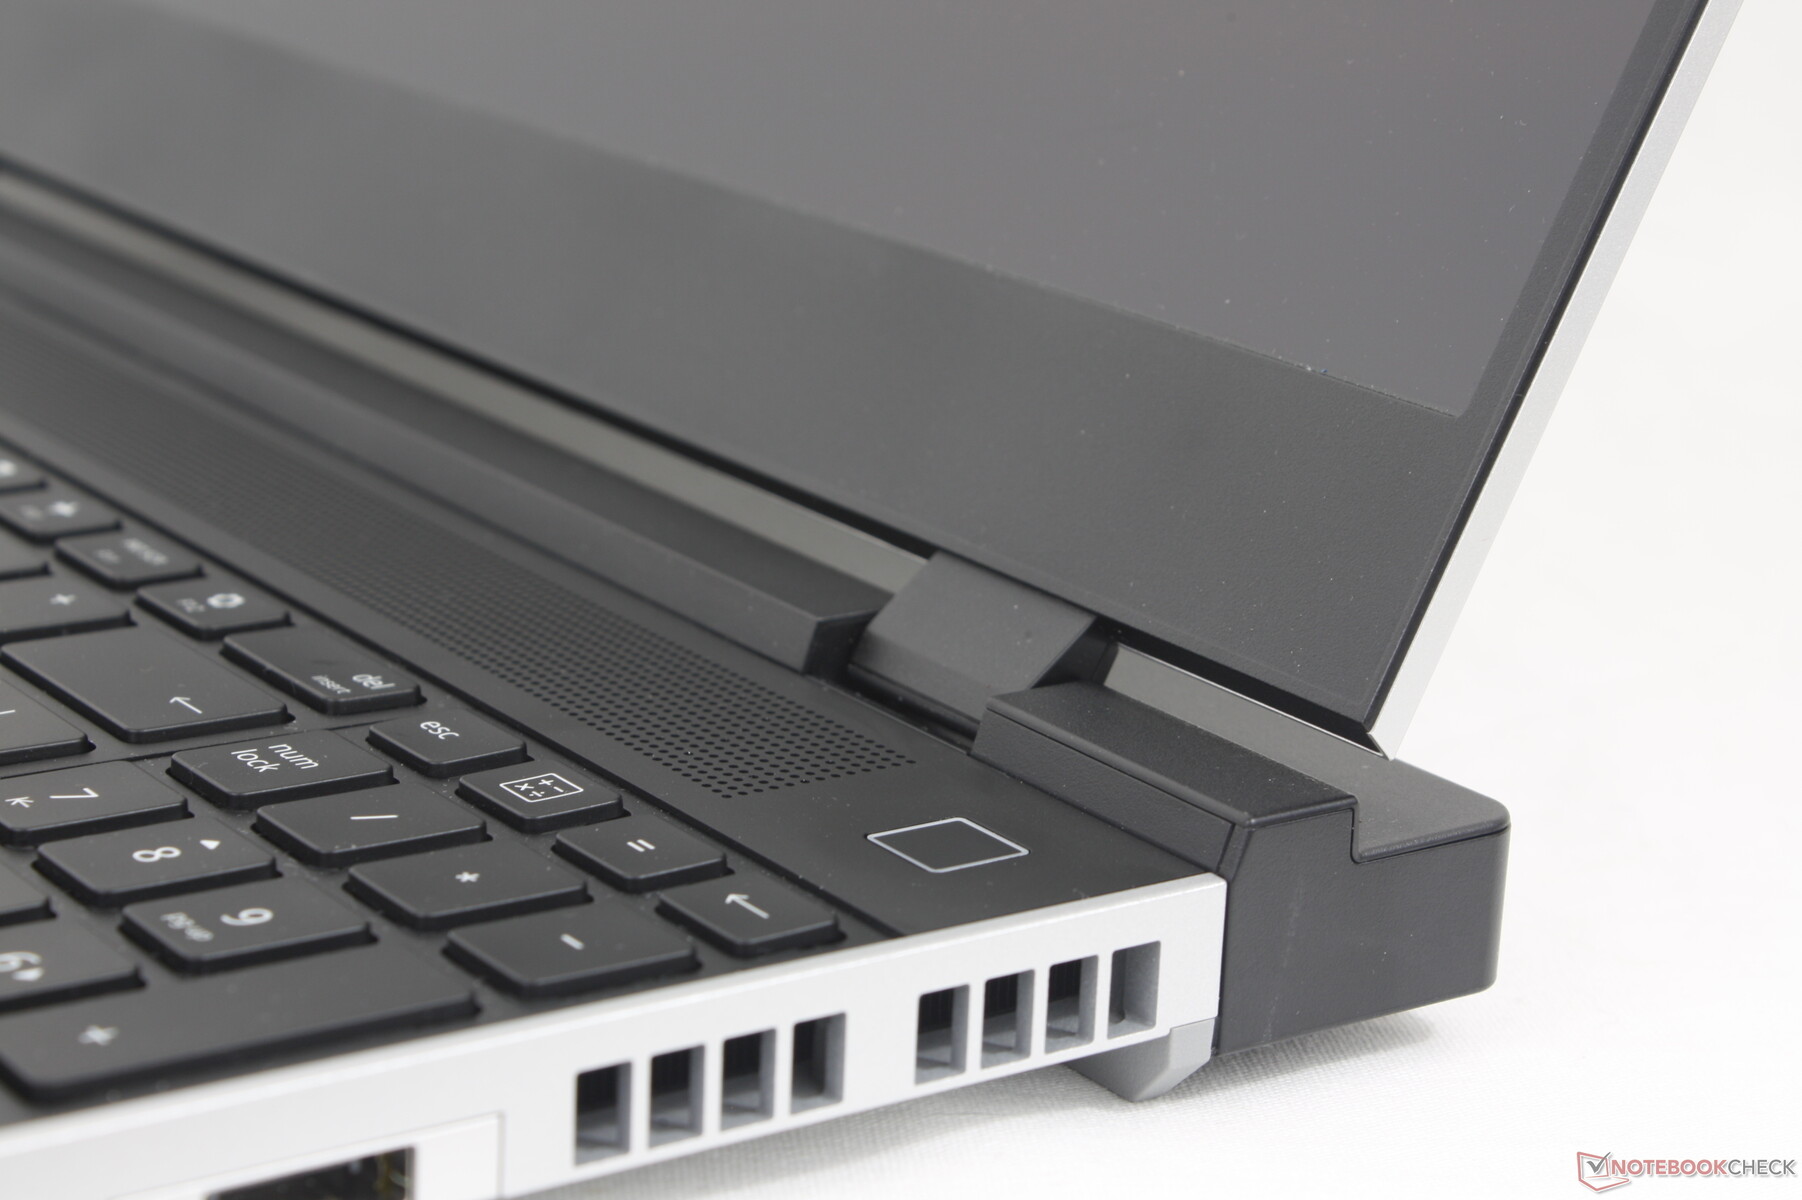
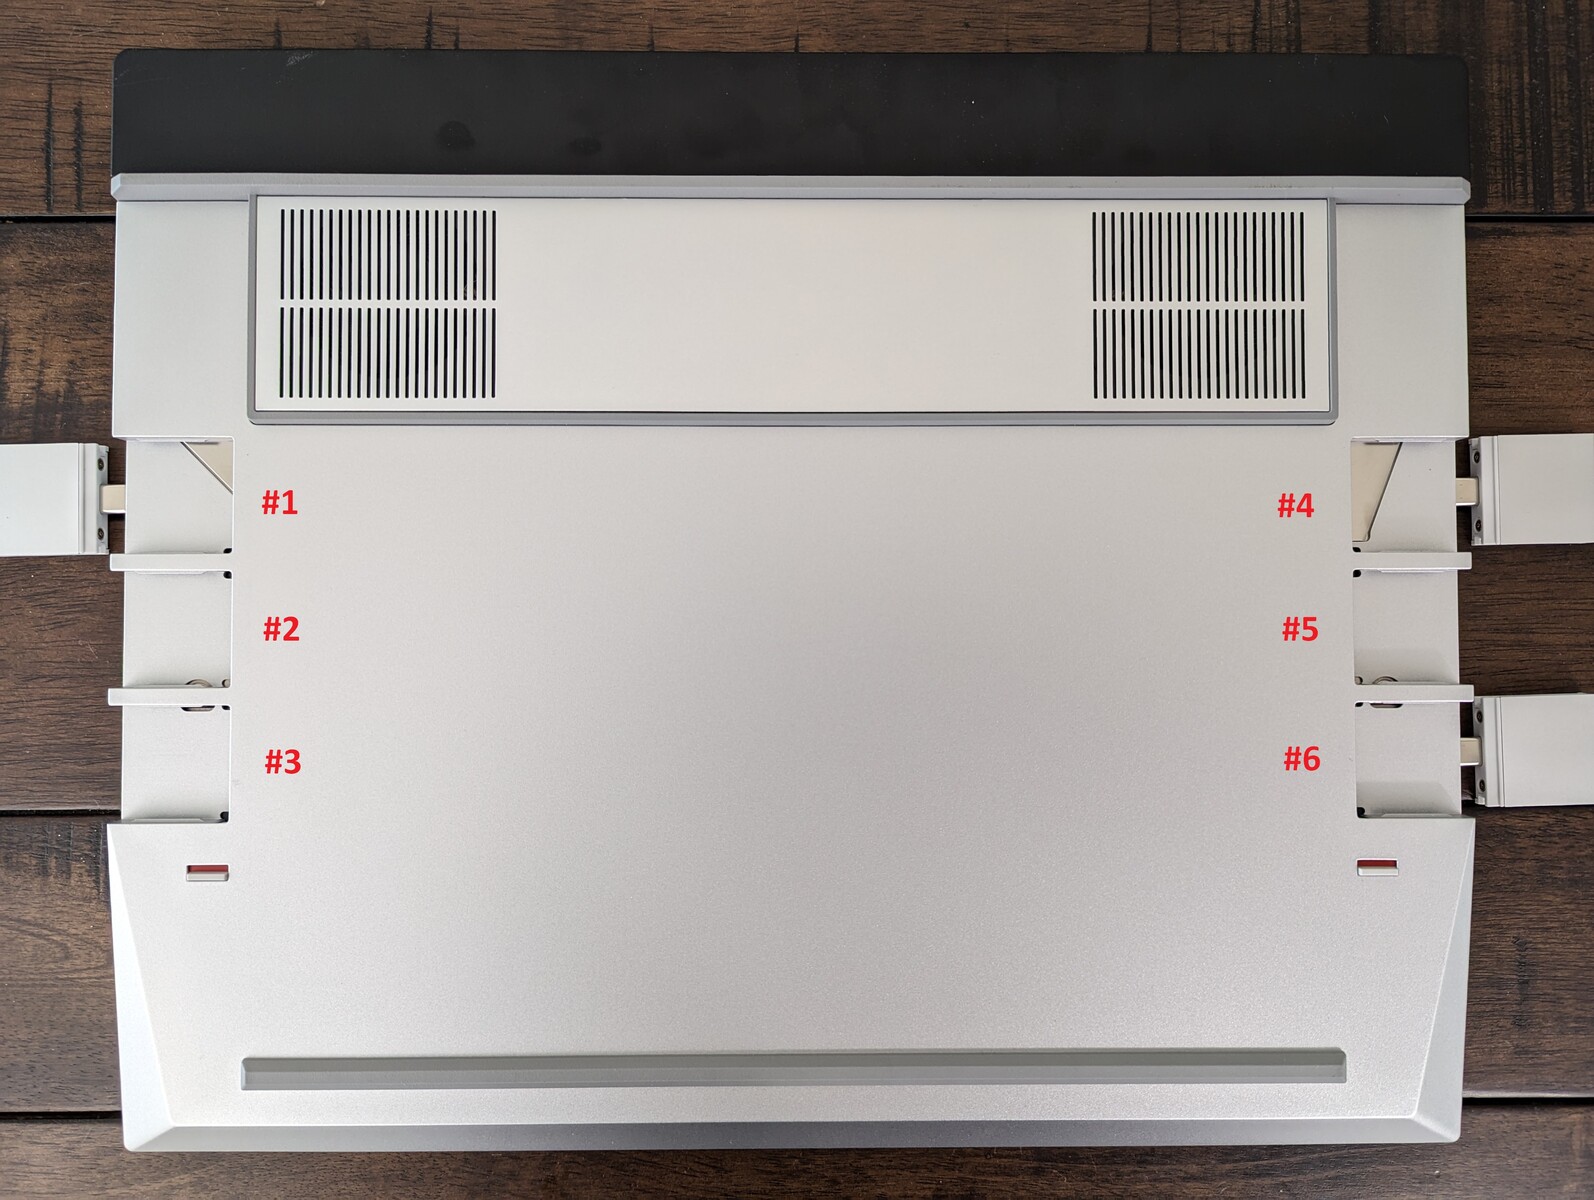
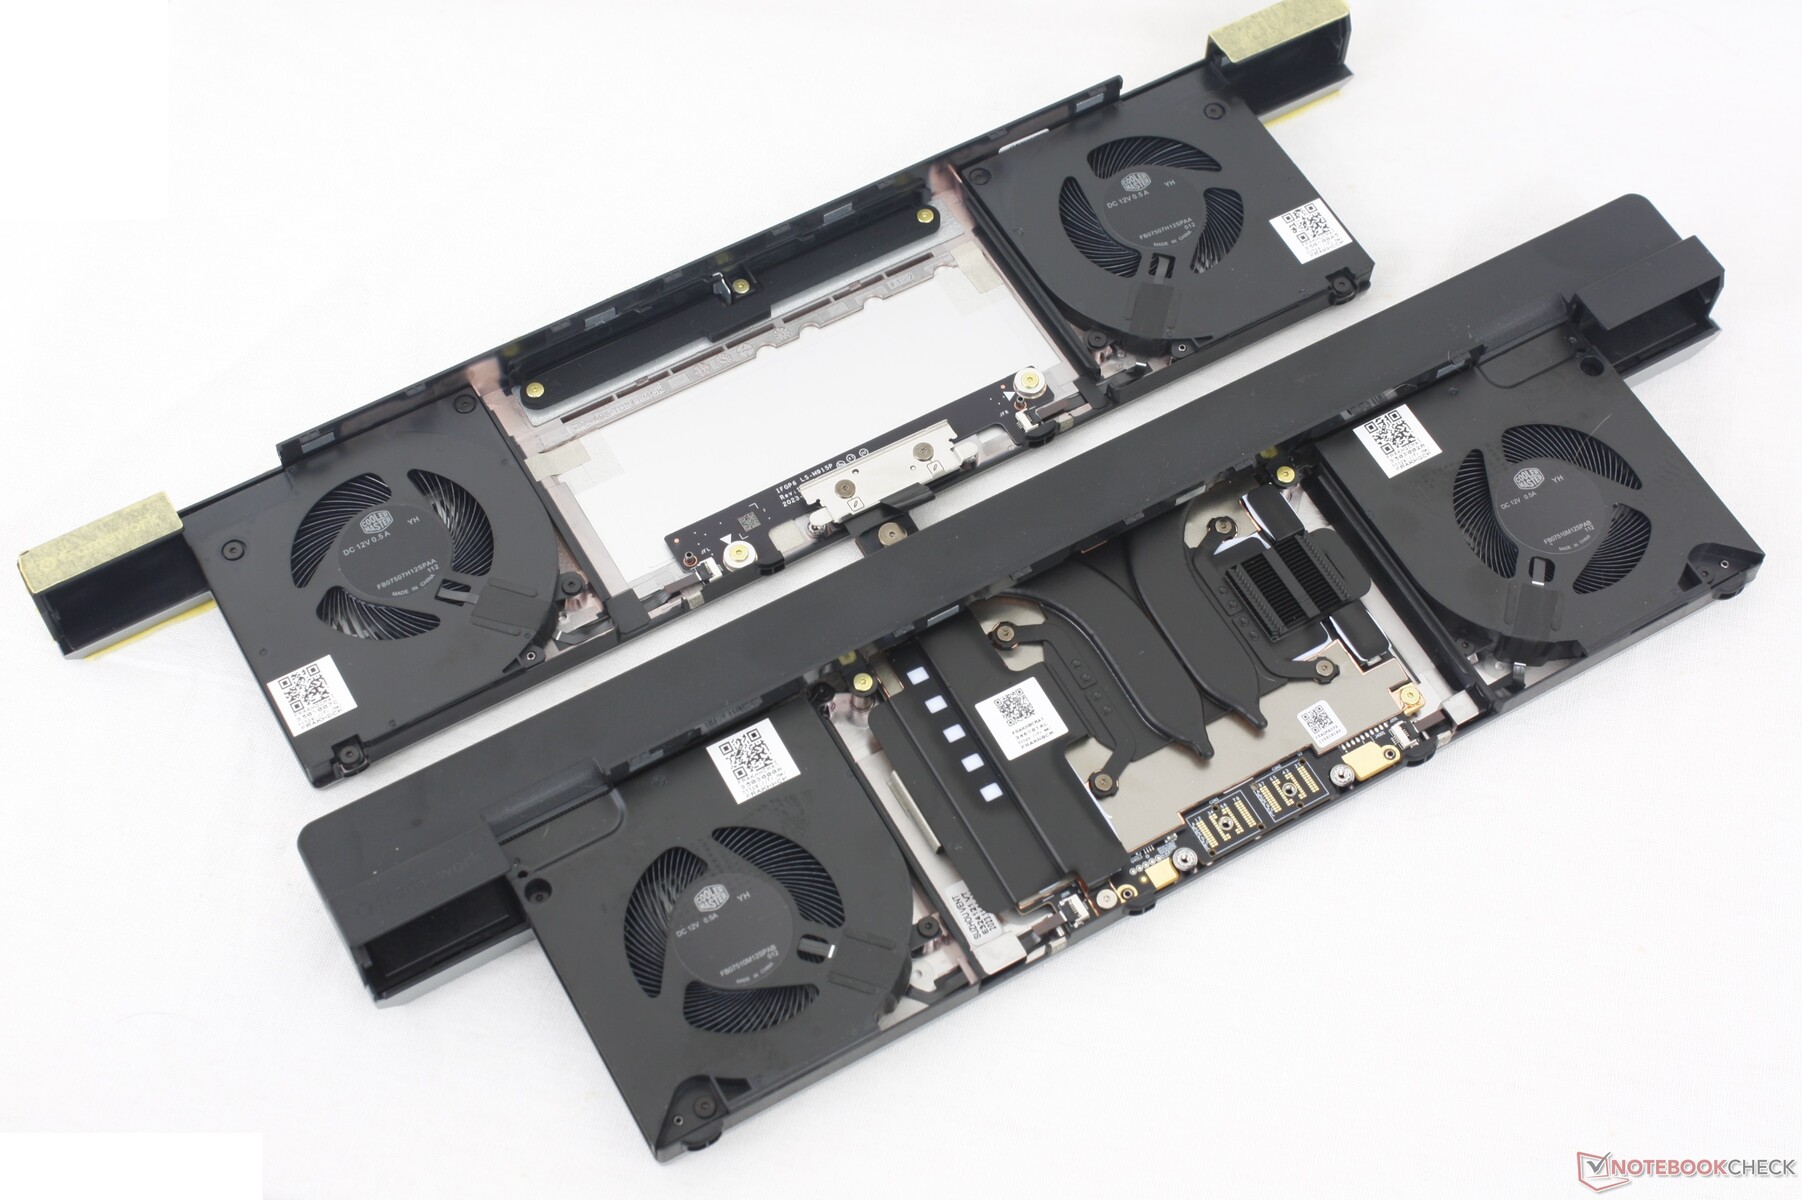
与一般的笔记本电脑不同,Laptop 16 可以说是由其配件定义的。.最显著的配件包括可拆卸的后置独立显卡模块、LED 矩阵模块和 RGB Macropad 模块。目前只有一个 dGPU 可供选择,但未来可能会有更多选择。
RGB Macropad 是标准数字键盘的辅助选项。它的输入与普通数字键盘完全相同,但按键在视觉上有所不同,因为它们是透明的,带有 RGB 背光,而标准数字键盘是印刷的,只有白色背光。Macropad 的按键清晰、色彩丰富,对喜欢自定义按键输入的铁杆用户或游戏玩家很有吸引力。
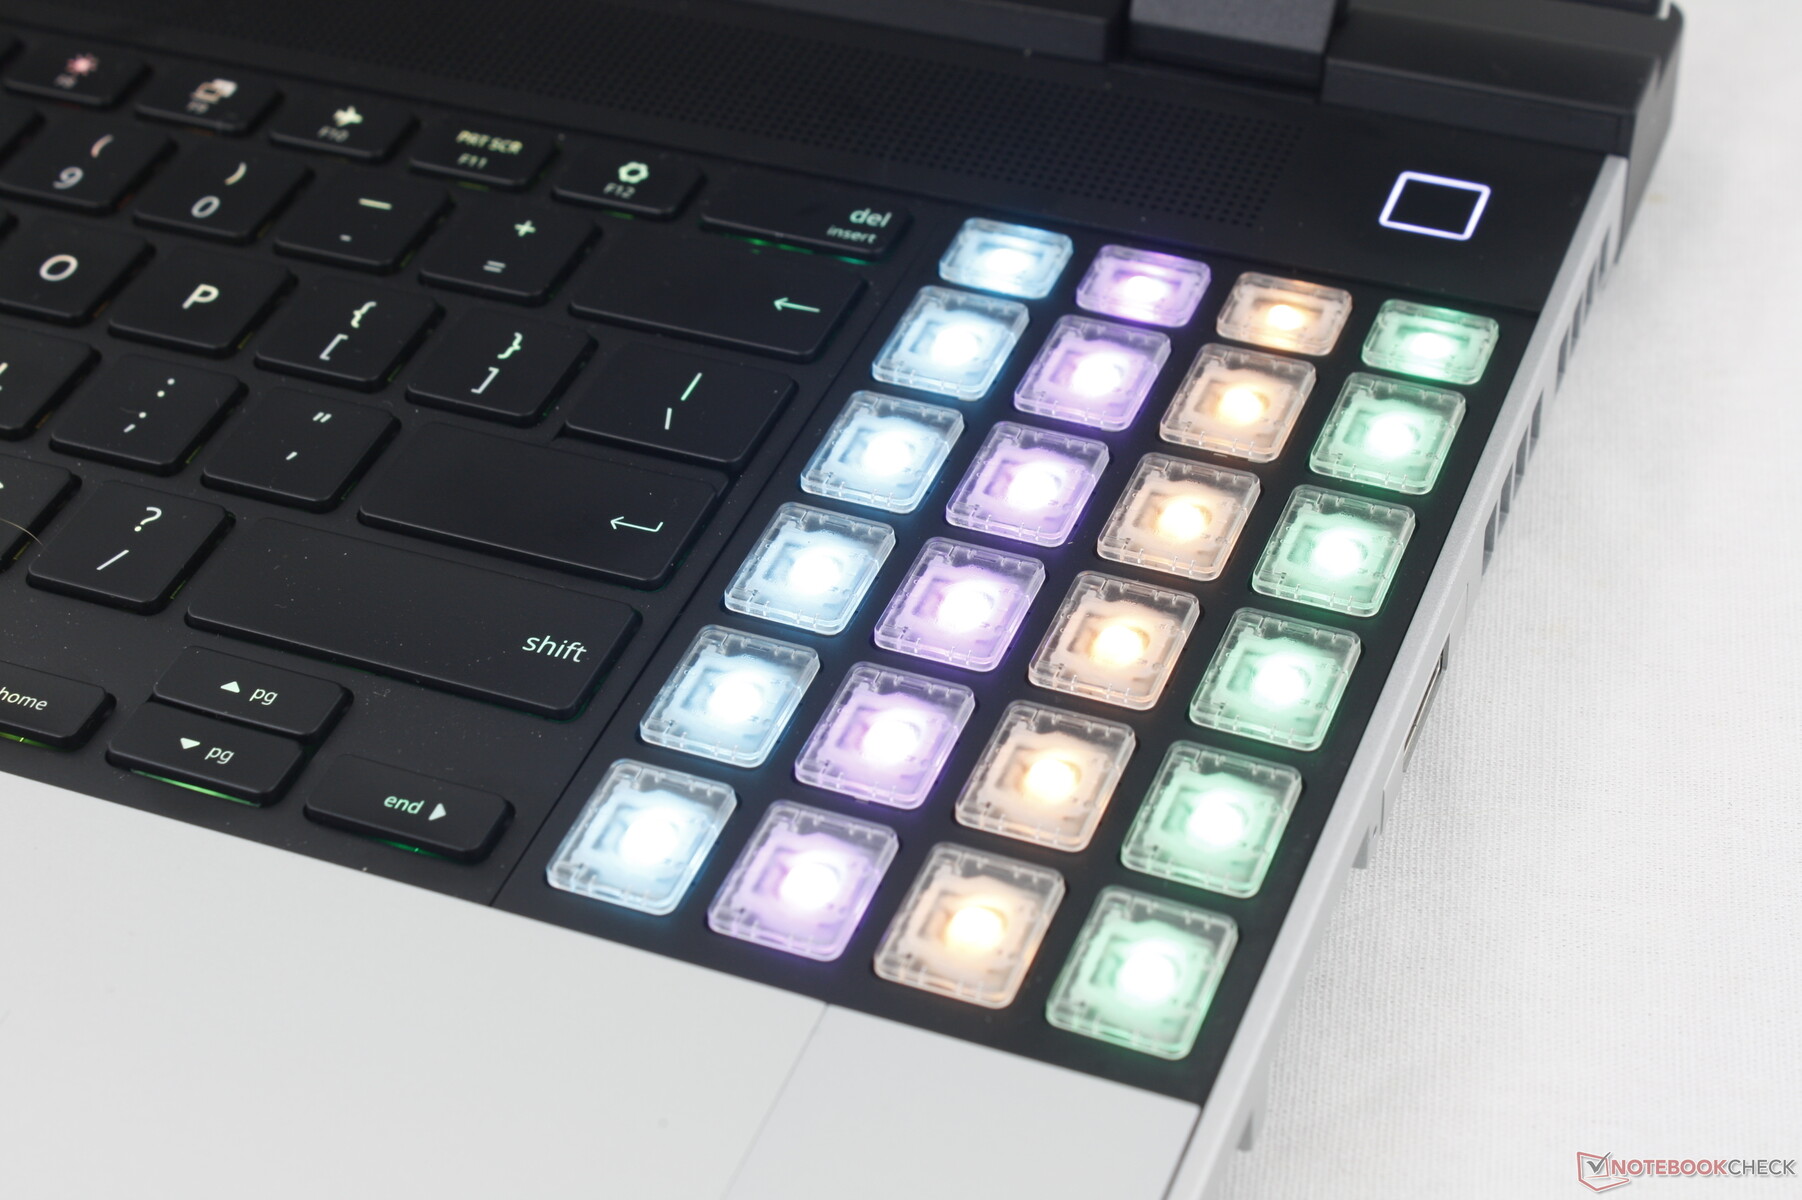
至于 LED 矩阵模块,这些模块取代了常规的垫片,由许多像素网格状的 LED 组成,可通过编程显示电池电量、滚动文本、通知或时钟。
不需要 dGPU 或 LED 矩阵模块的用户可以在相应位置安装标准板盖。这些盖板随 Laptop 16 的所有配置一起发货。
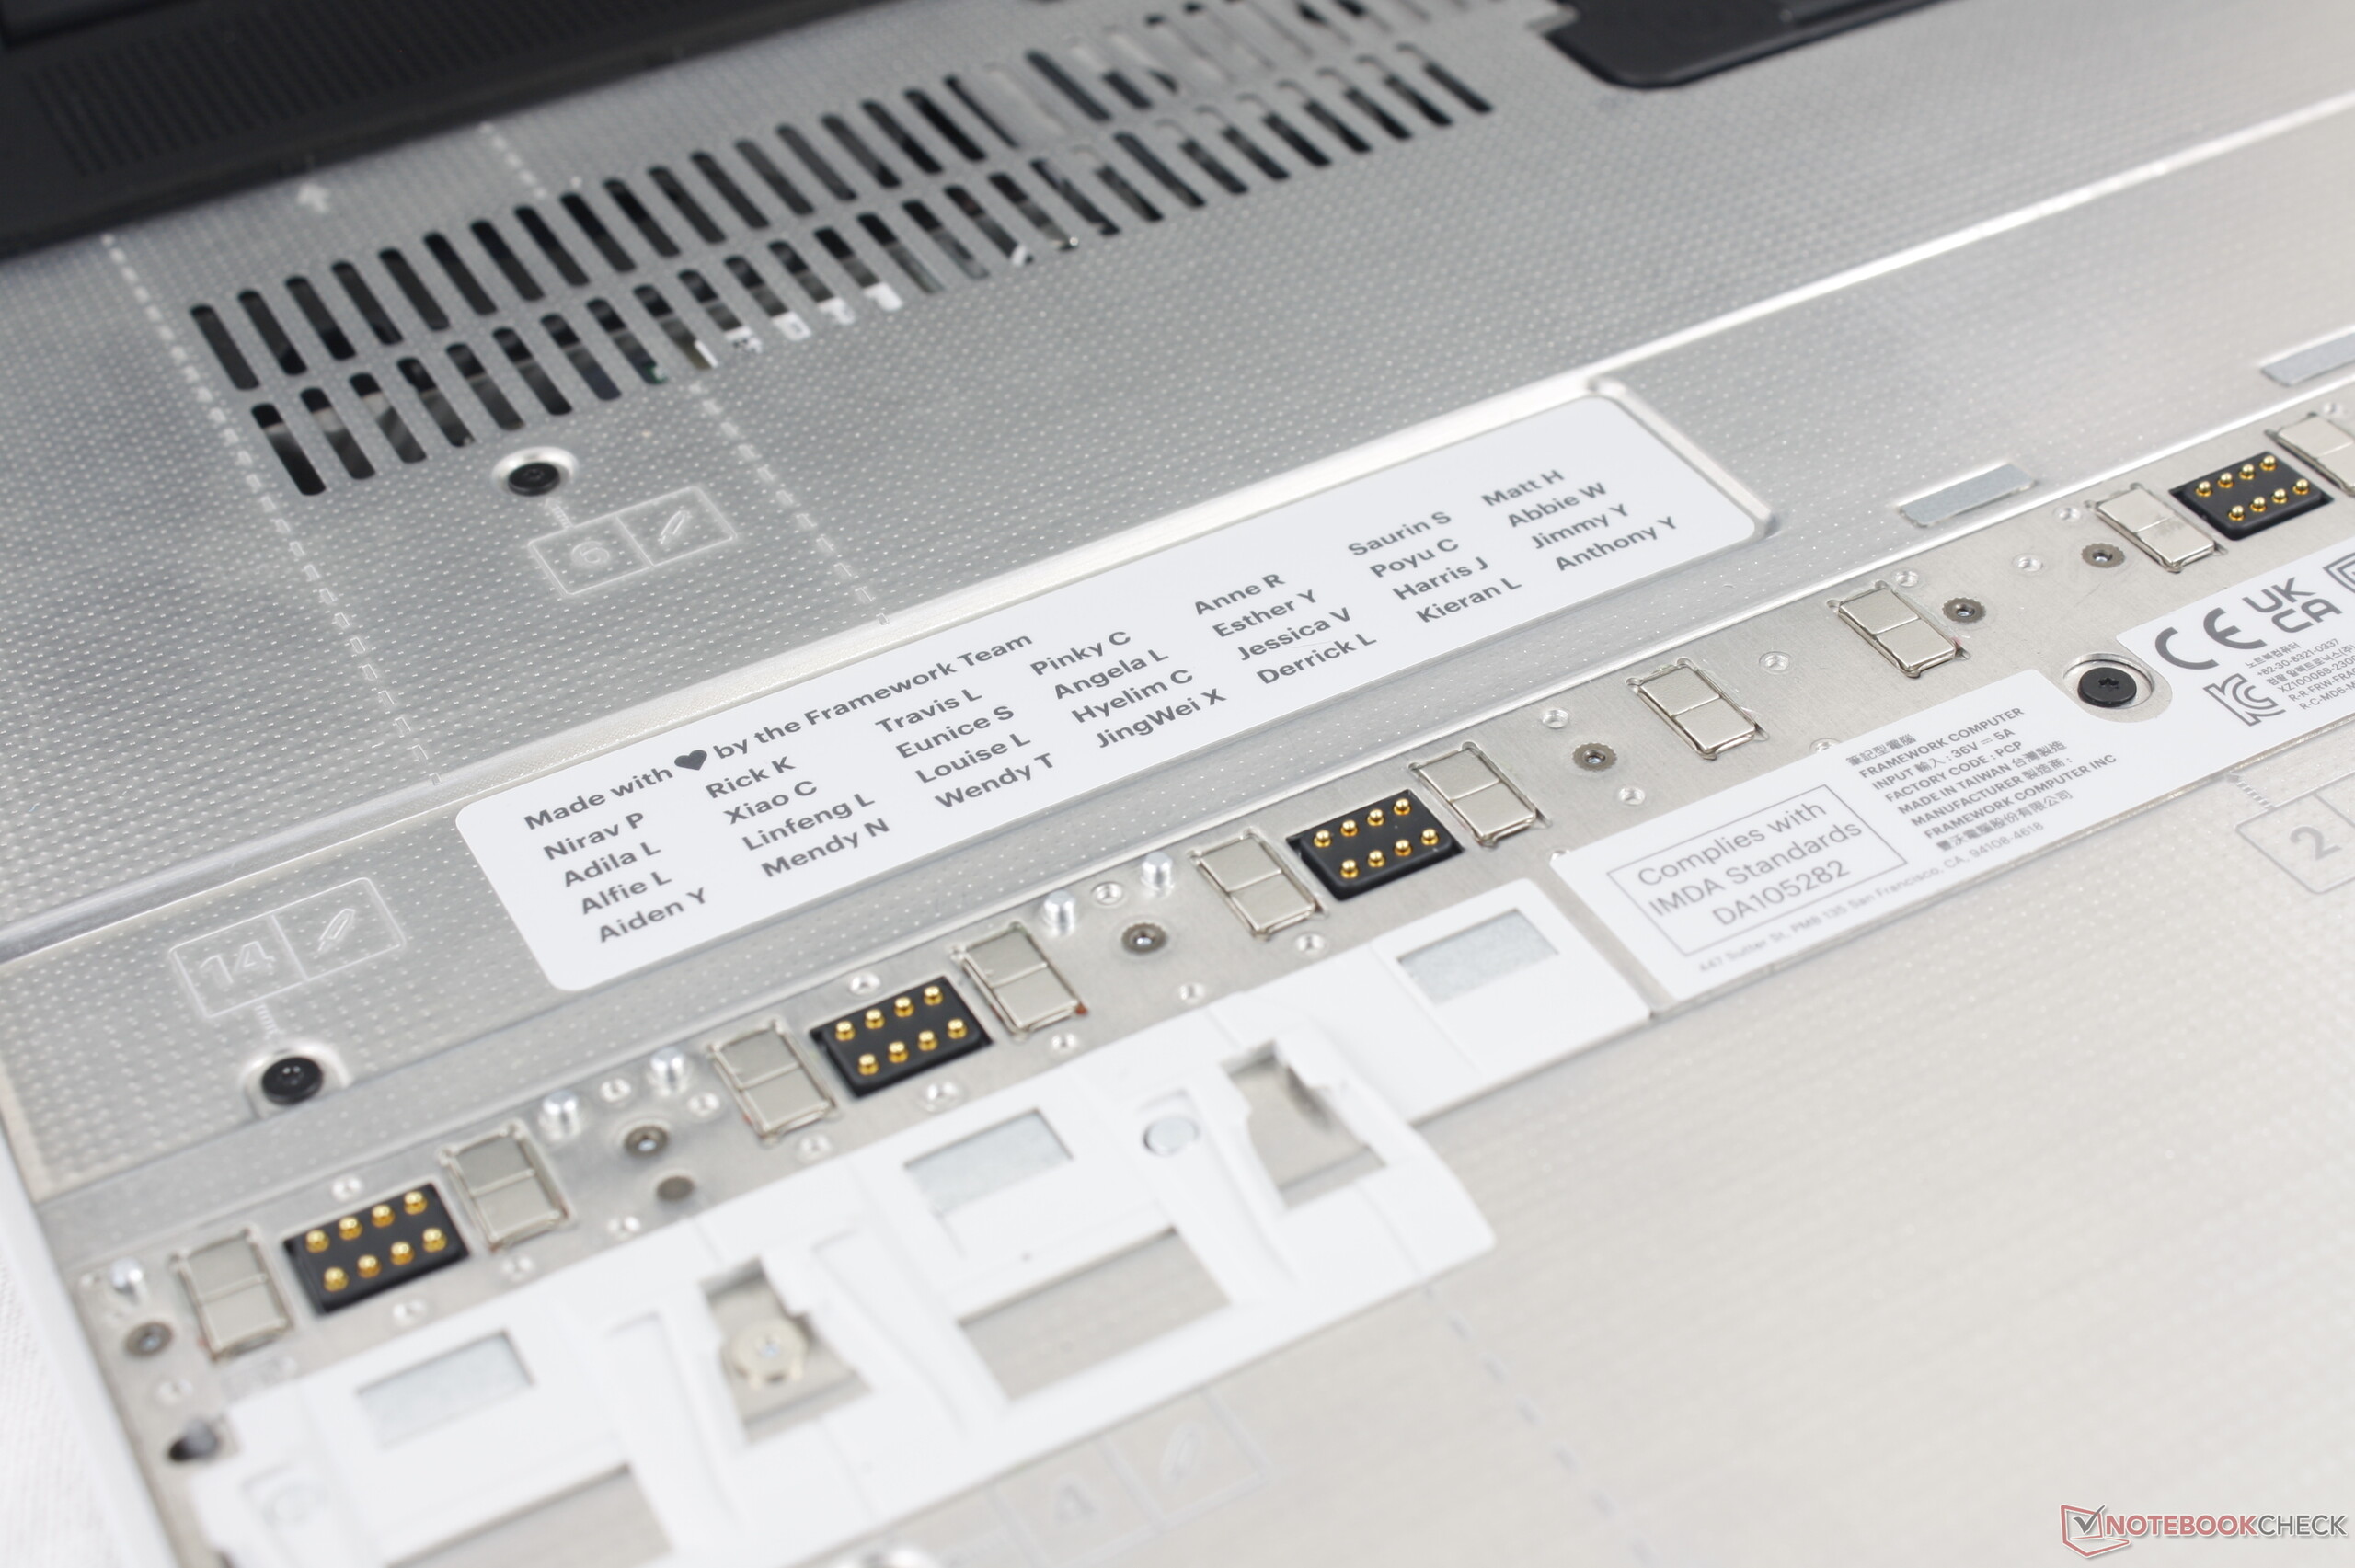
除配件外,大多数内部零件都是可更换的,包括主板在内,都可以像 Framework 13.5 一样从制造商处单独购买。
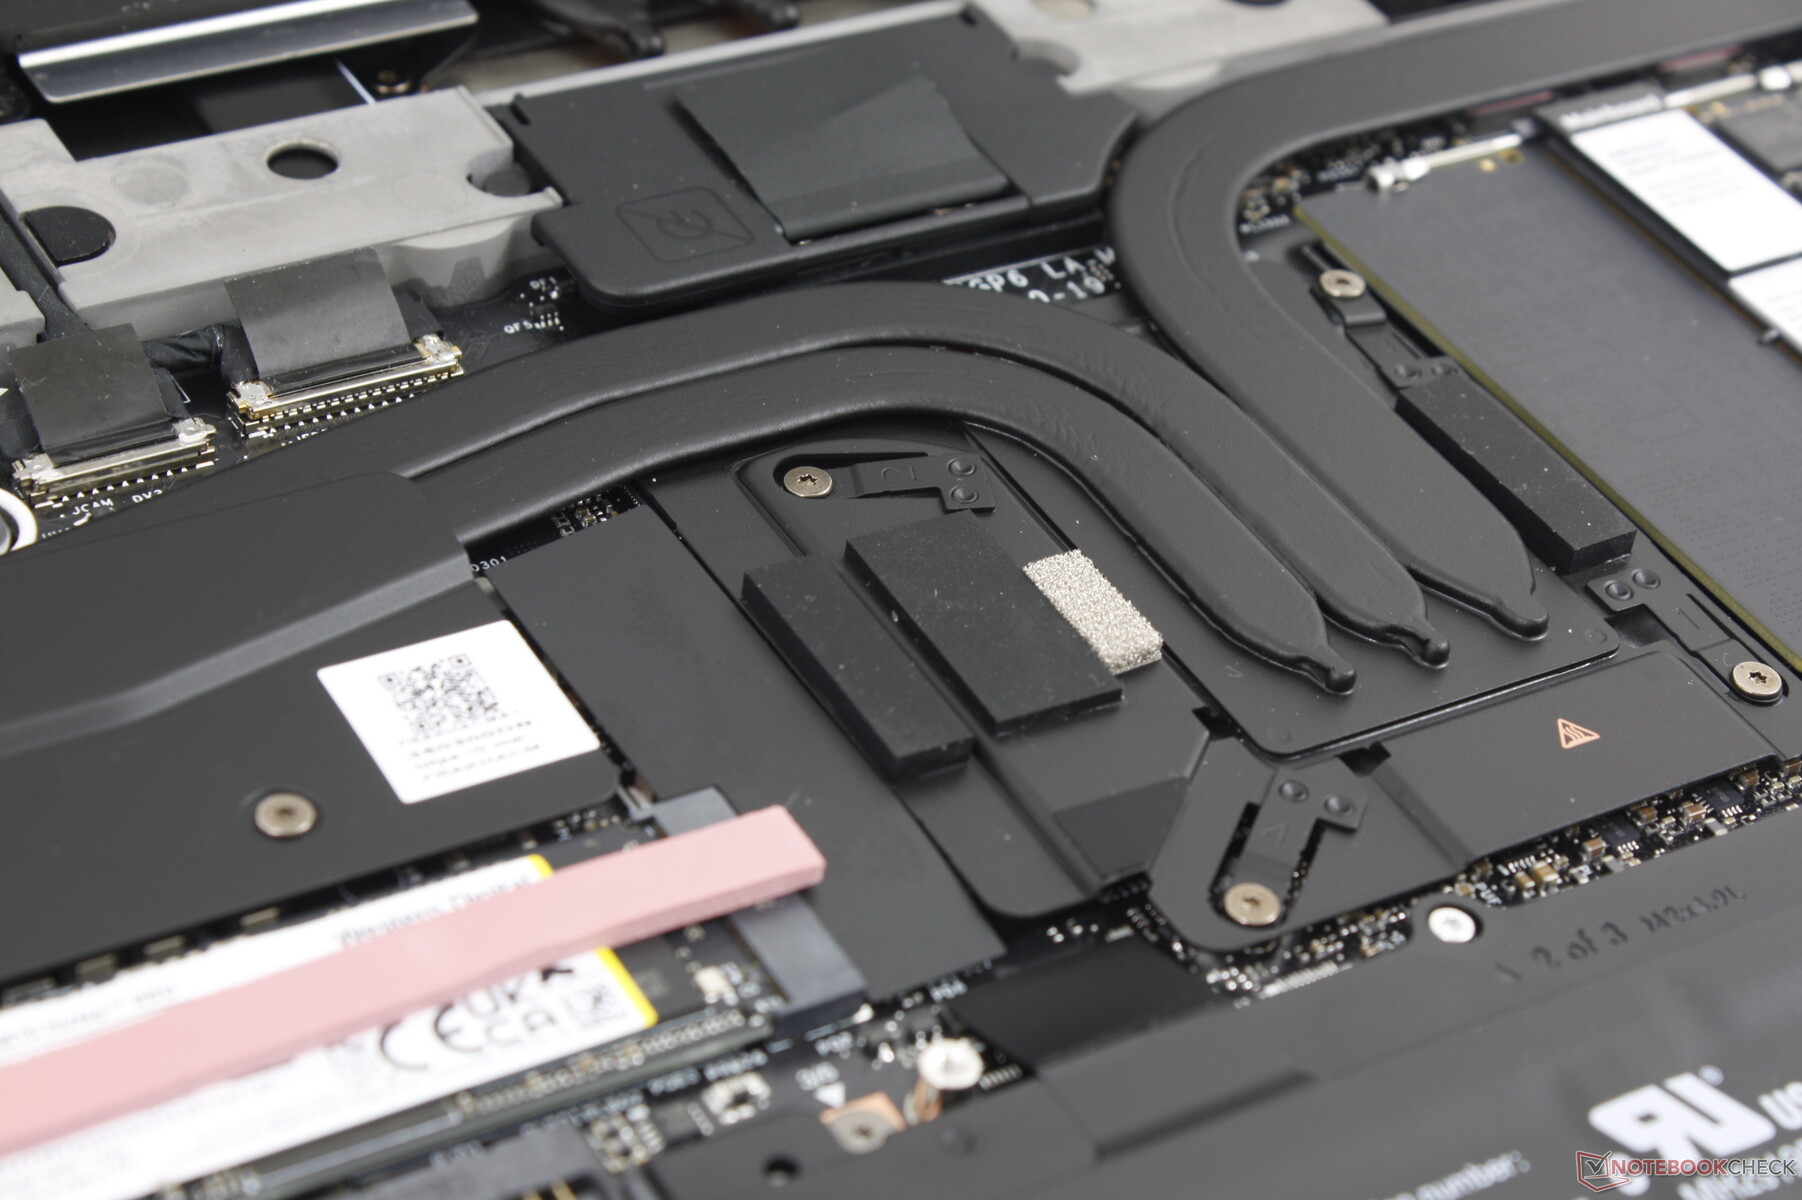
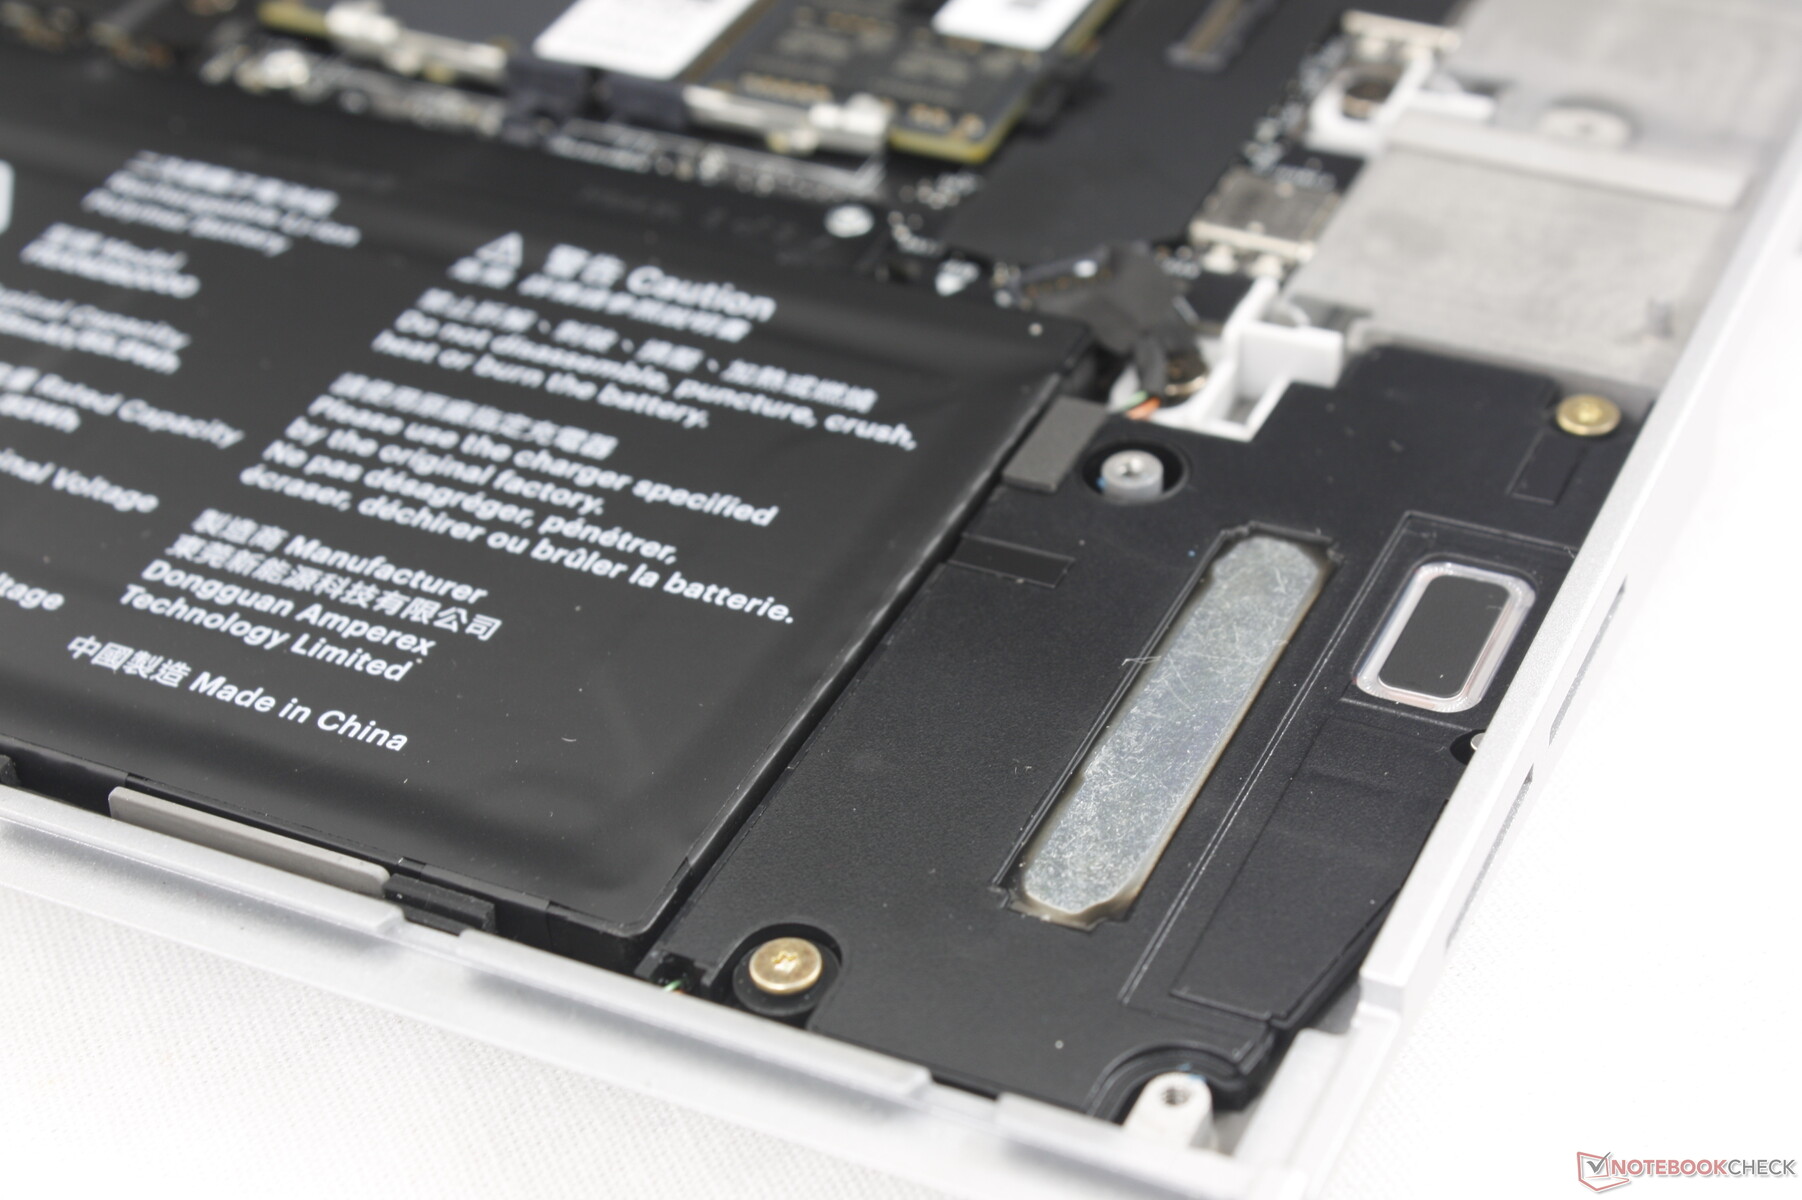
维护
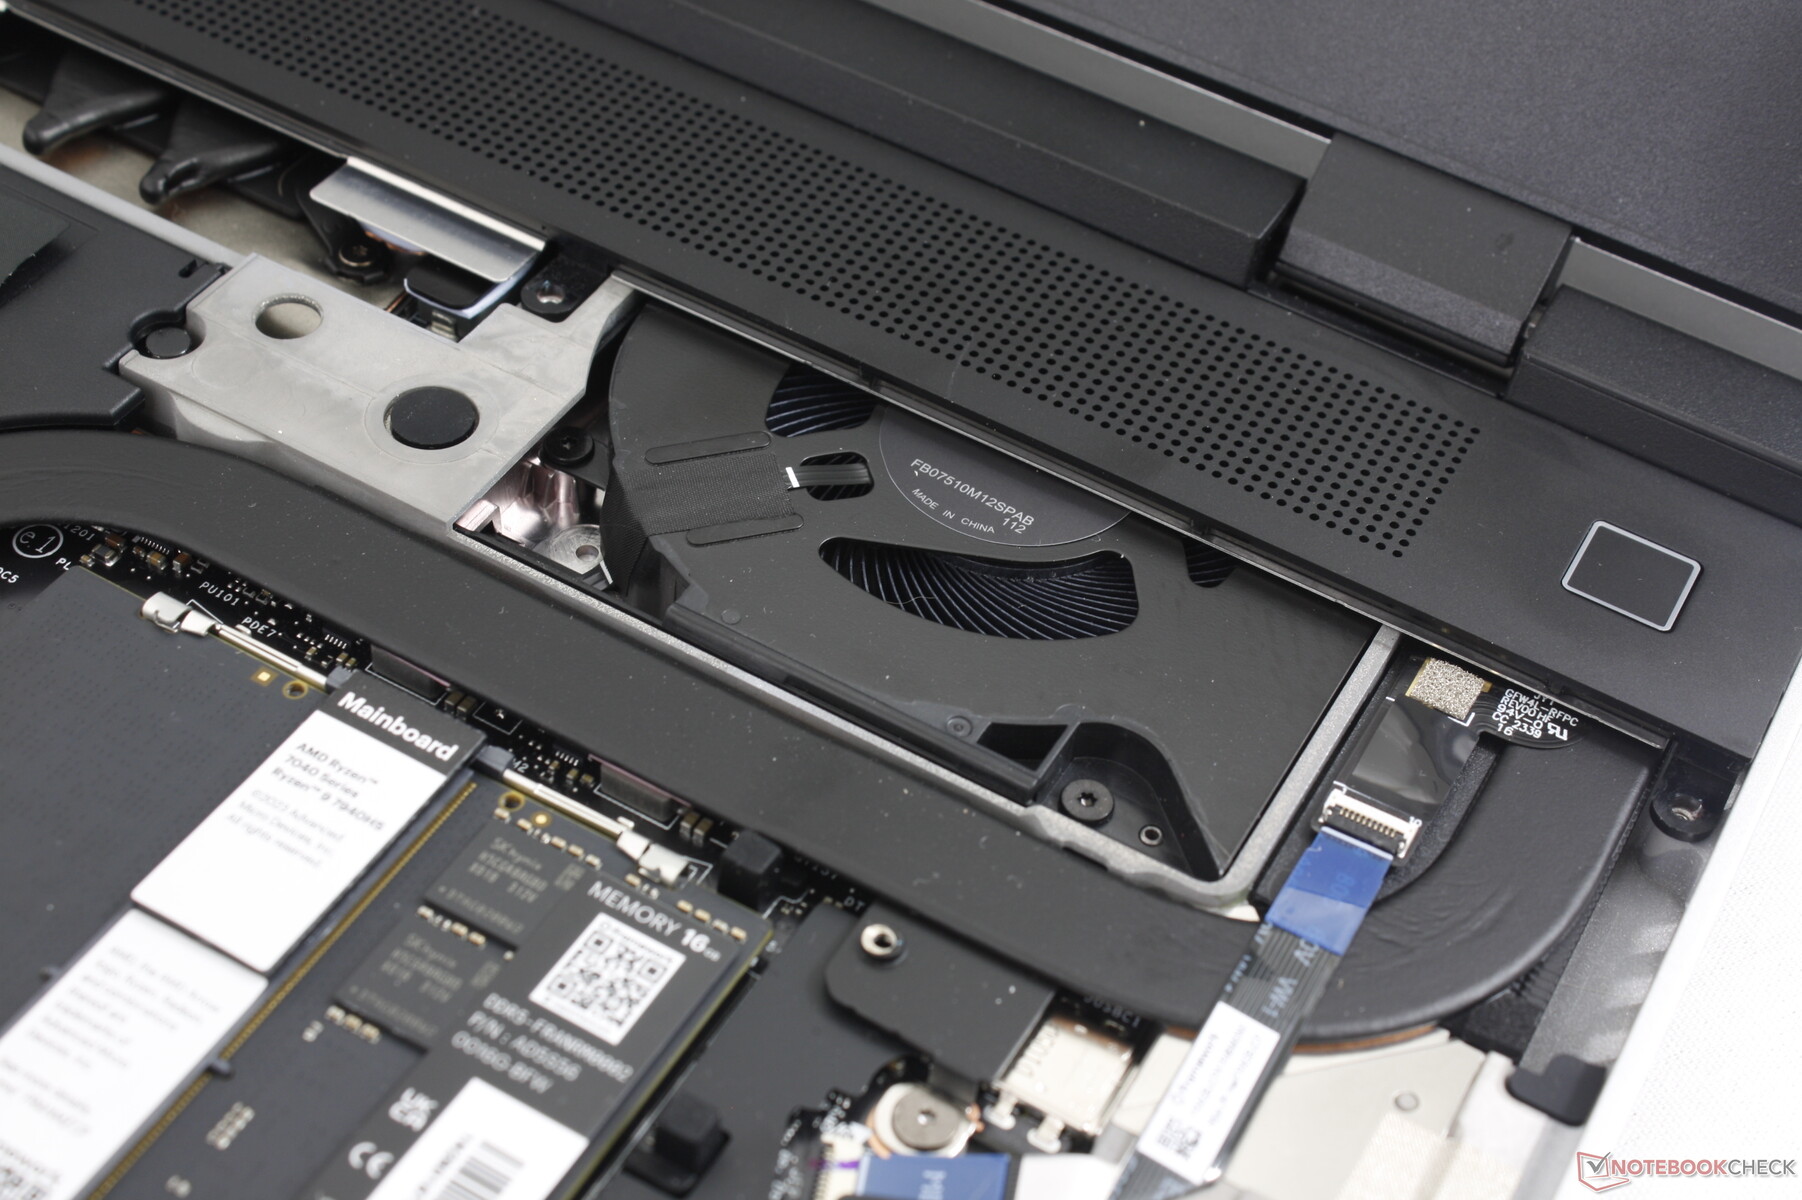
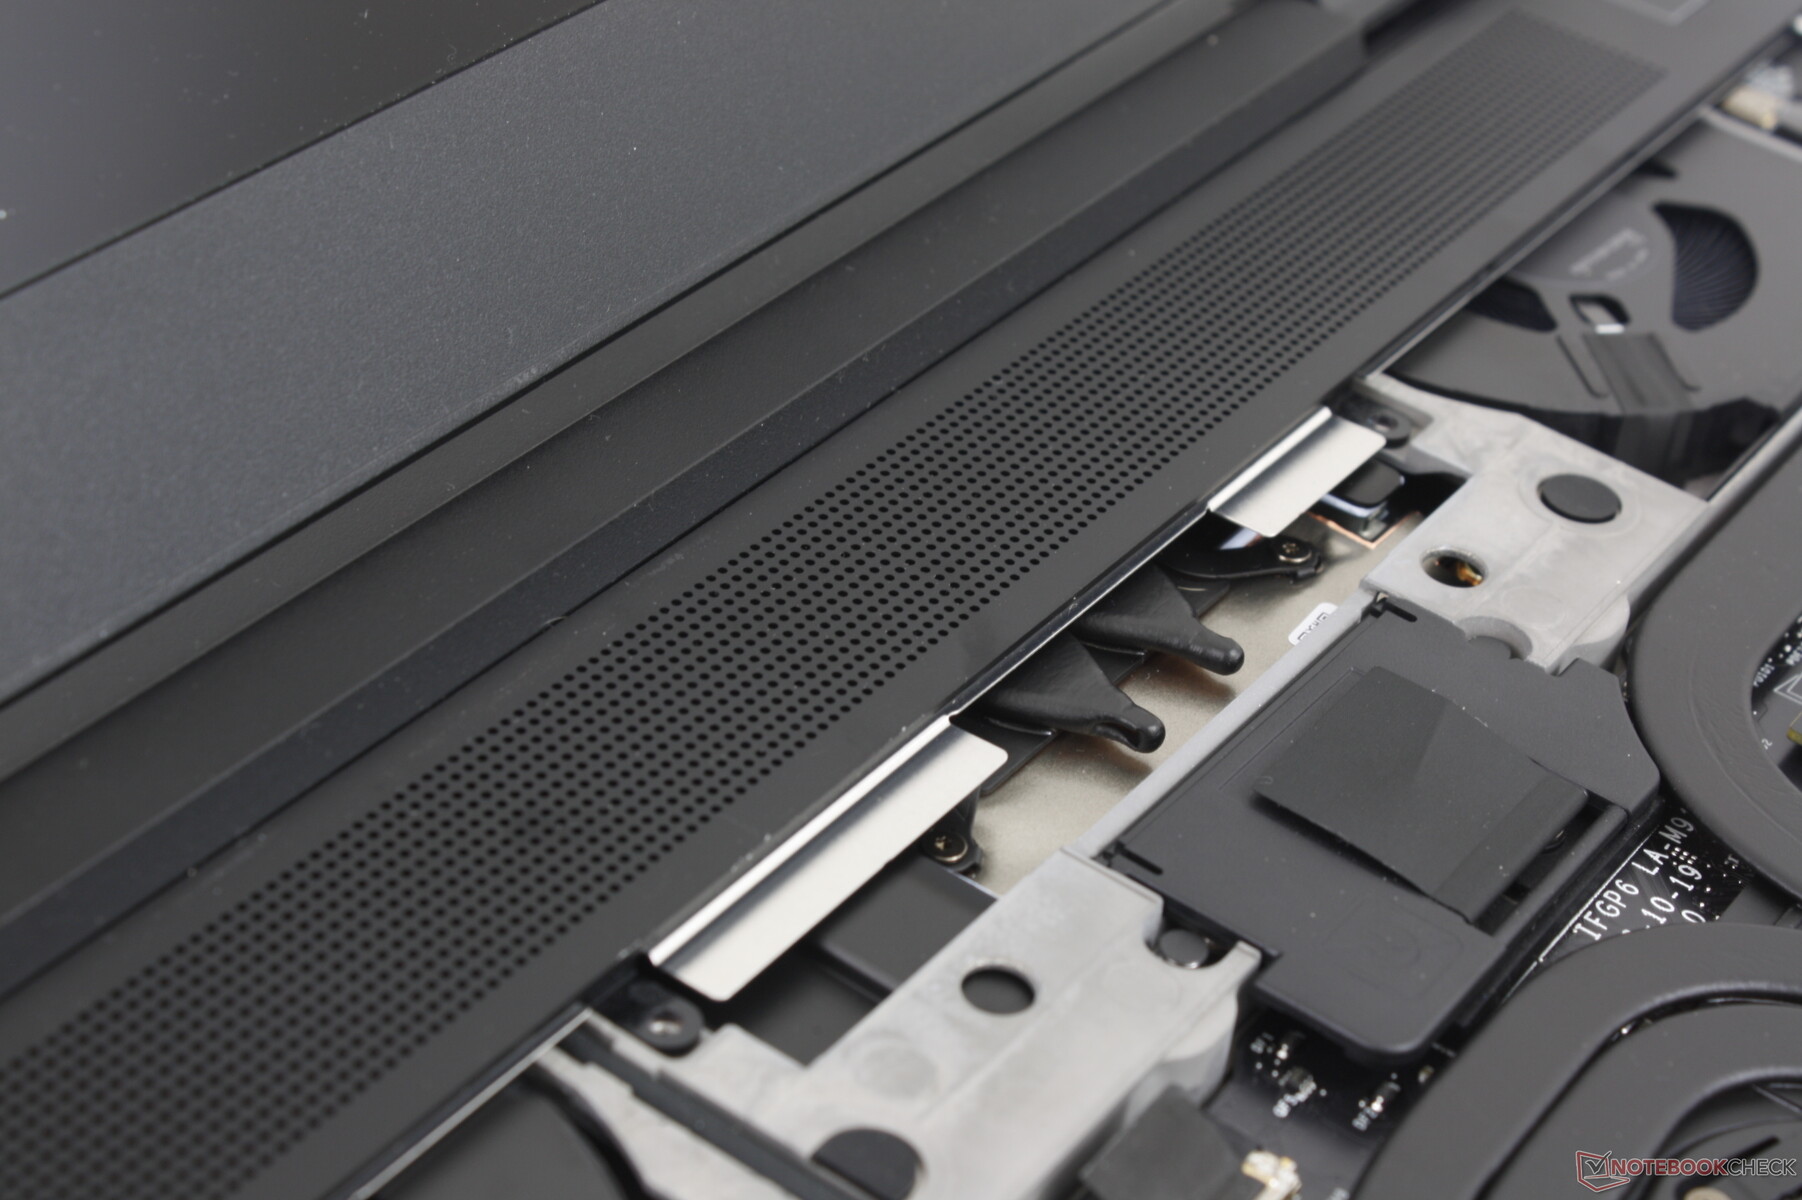
进入主板的过程比通常要复杂得多。大多数其他笔记本电脑只需要拆下底板,而 Laptop 16 则需要拆下键盘、点击板、一条带状电缆、15 个 Torx 螺钉和一个金属中板,才能露出内脏。这并不难,但与传统的 ThinkPad 或 EliteBook 相比,拆卸过程略长。
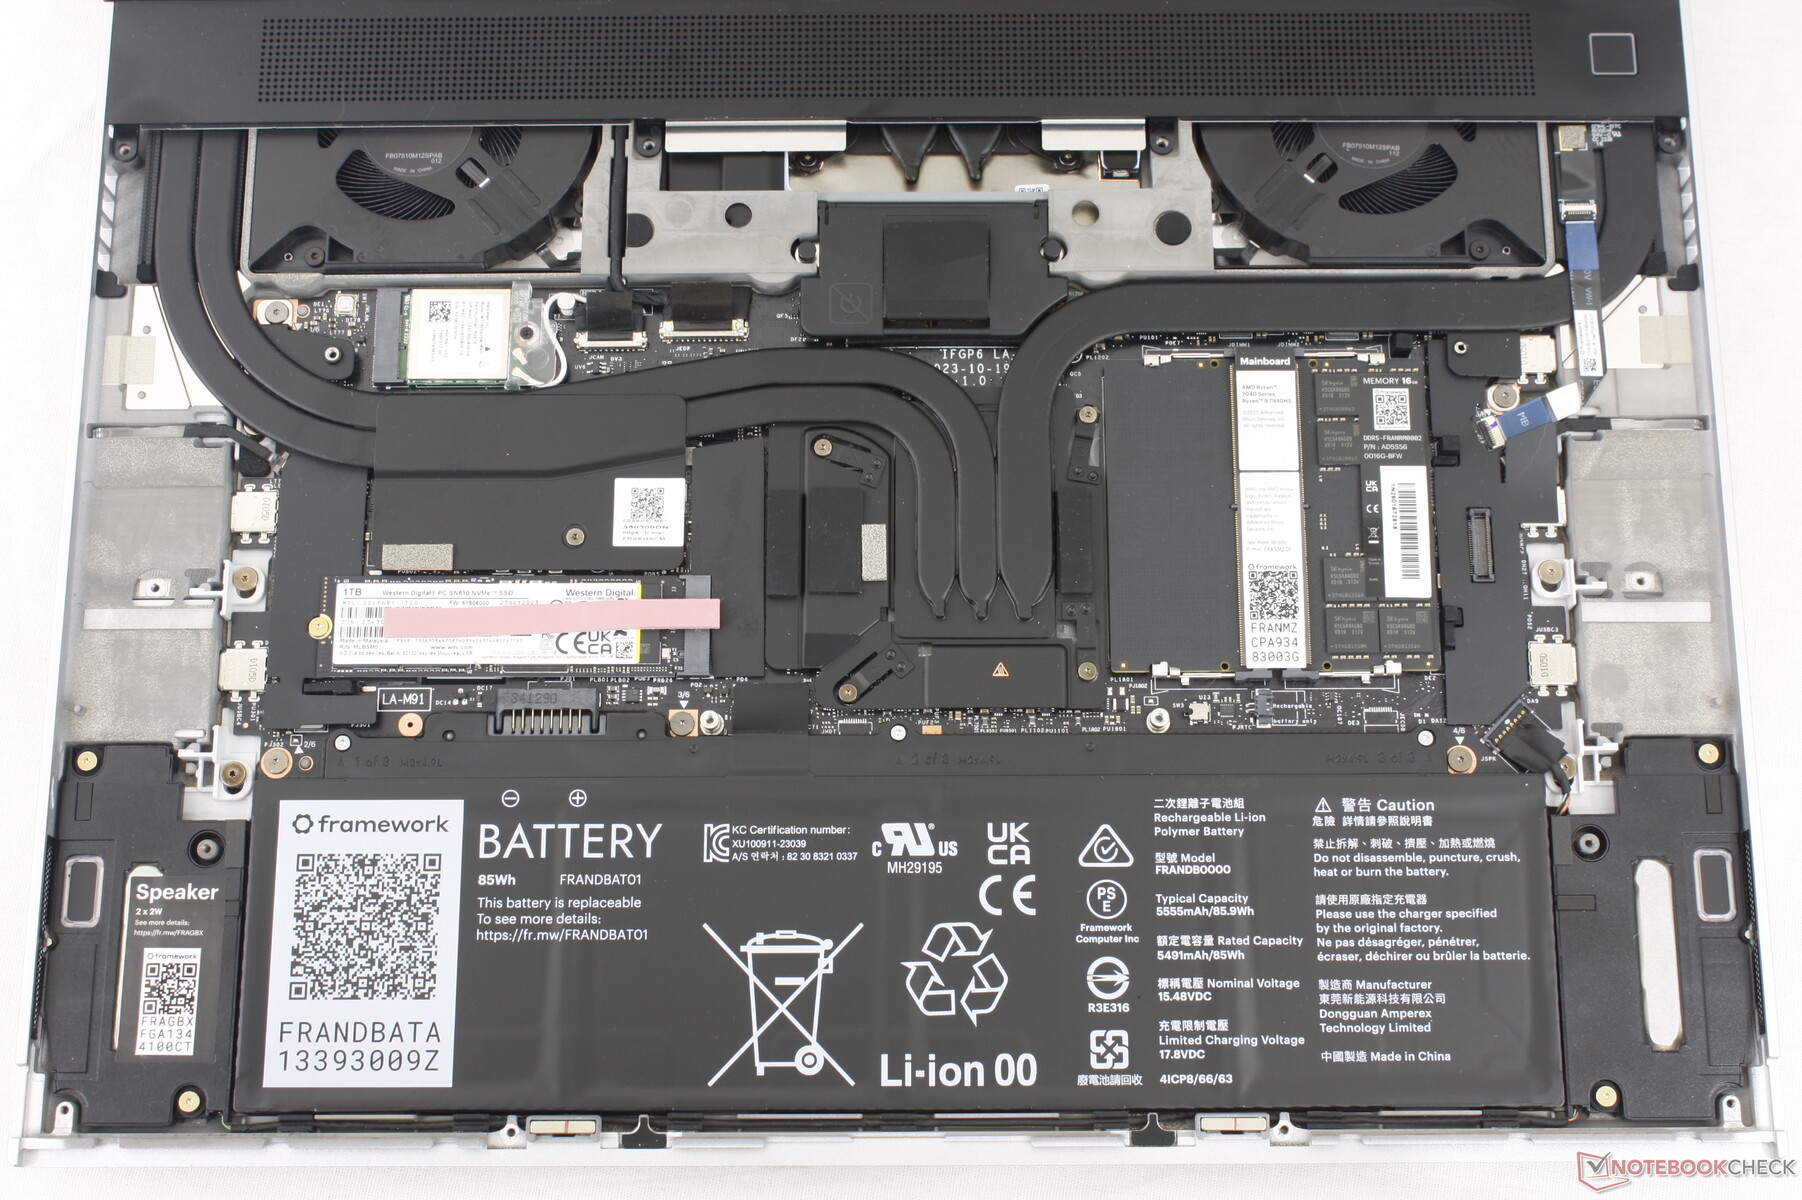
值得庆幸的是,Framework 提供了我们所见过的所有笔记本电脑制造商中最详细、最易懂的维修指南,让维护工作变得轻而易举。我们强烈建议您访问官方支持页面 涵盖了从简单的内存和固态硬盘升级到主板更换和 dGPU 模块安装。我们不需要重印整个维护过程,但由于新的可拆卸 dGPU 和更大的输入模块的复杂性,这些程序的学习曲线比 Laptop 13.5 稍高。
虽然许多模块都是磁性的,但安装后置 dGPU 时仍需要使用螺丝刀,而且某些模块必须按一定顺序安装。尤其是后部模块,由于必须关闭系统电源,而且必须先卸下键盘和点击板,因此不能即插即用。好在你只需拆卸和重新组装一次系统,维护程序就会成为你的第二天性。为了鼓励用户这样做,Framework 甚至在发货时将键盘和触控板拆开,这就迫使用户在第一次打开笔记本电脑之前,先了解一些模块的工作原理。
触摸板模块使用磁铁和锁扣是一种直观的维修方法。我们希望看到这种做法能得到进一步推广,使所有模块和升级都能实现免工具操作。
保修
如果在美国购买,则适用标准的一年有限制造商保修。保修范围包括笔记本电脑及其部件和模块。
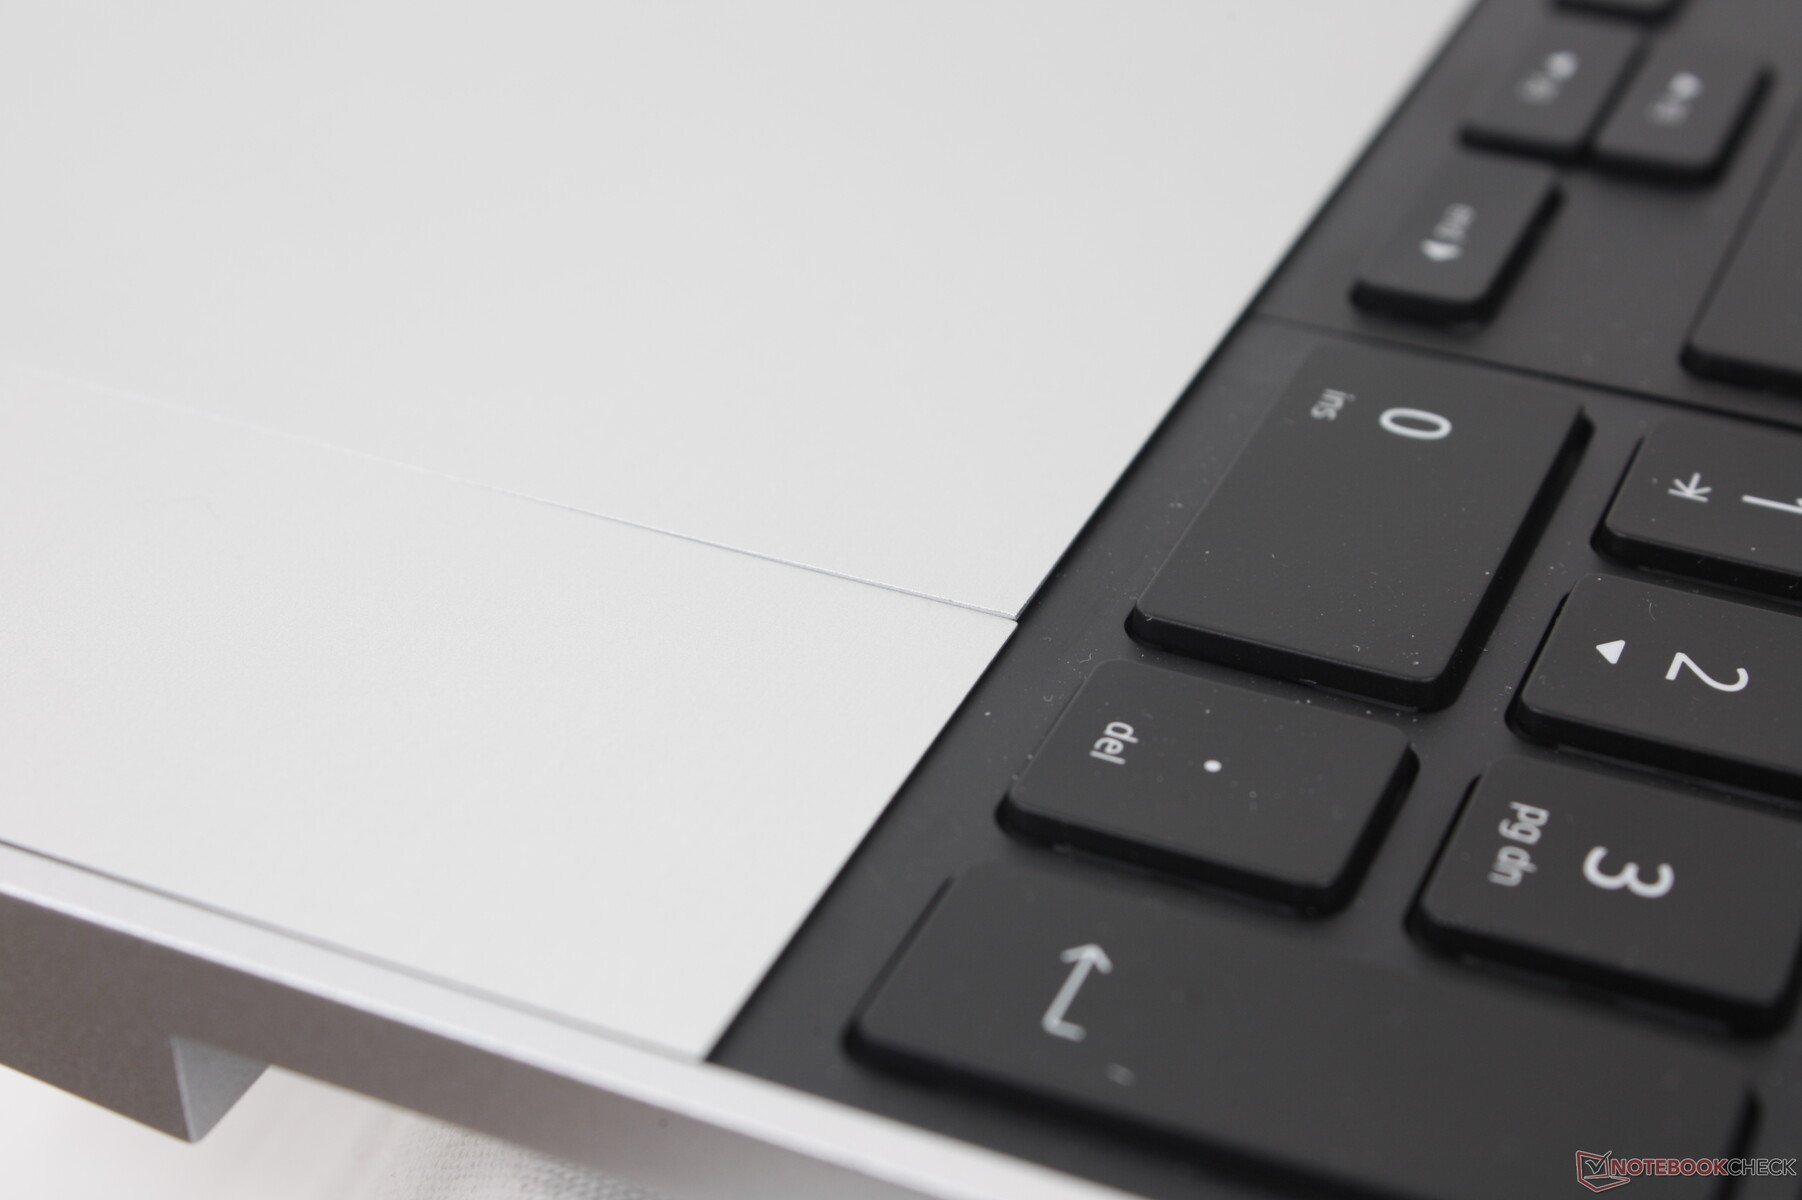
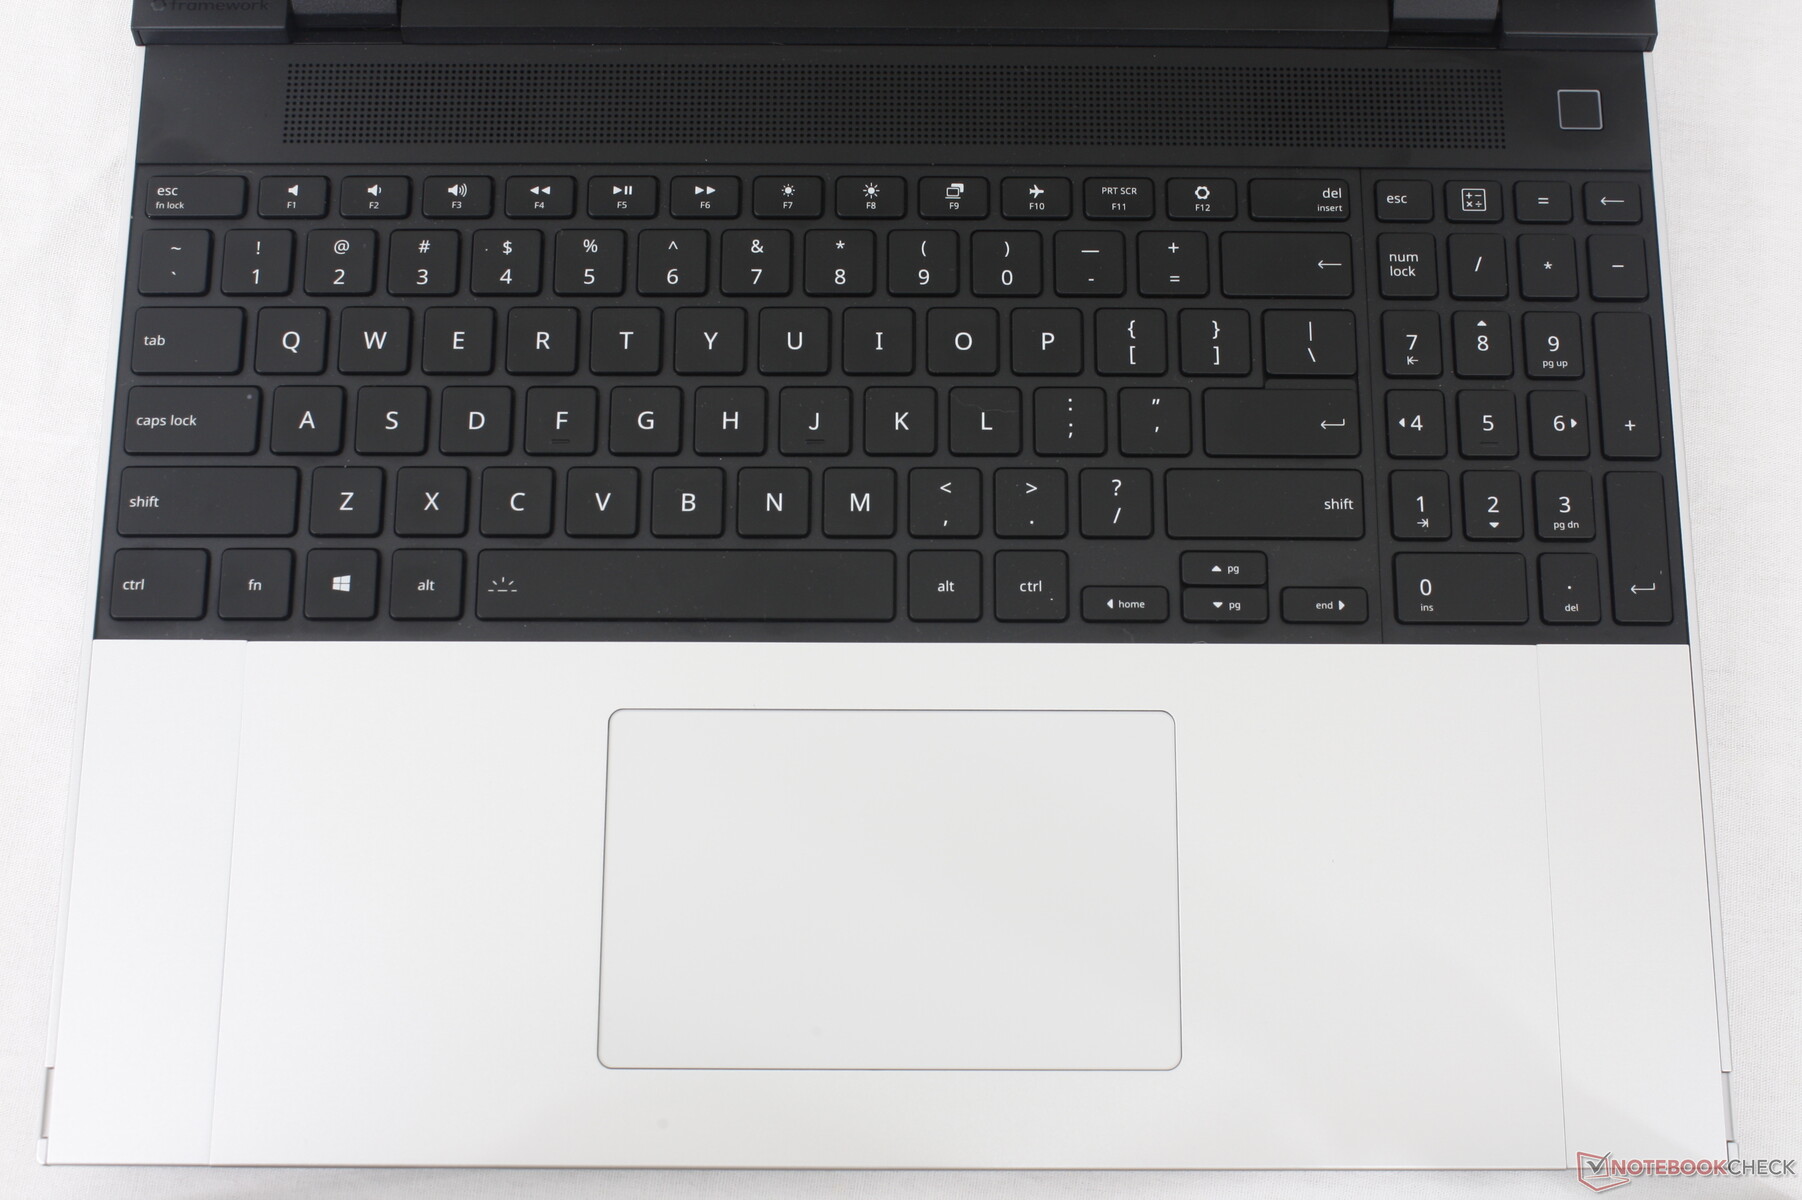
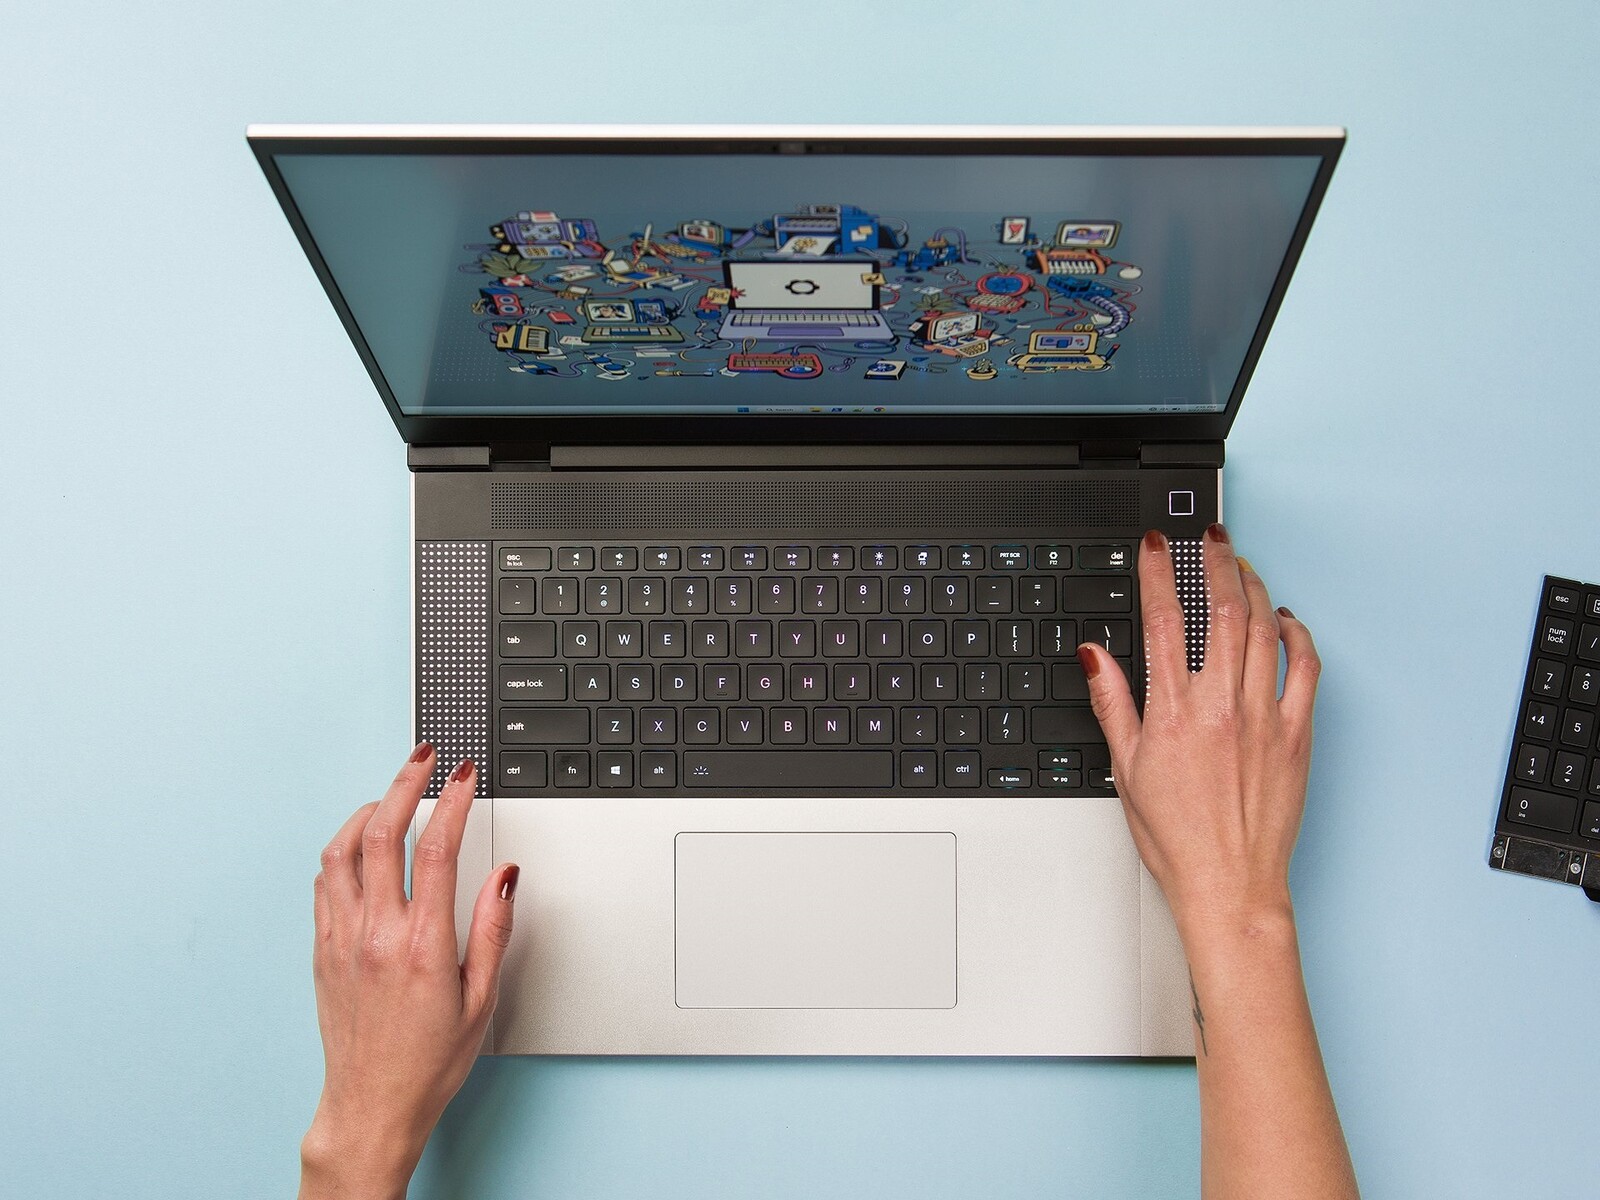
输入设备 - 可拆卸、可更换、可重新排列
键盘
每个 RGB 键的键程为 1.5 毫米,这在大多数超极本中很常见。键盘的可拆卸设计不会影响打字体验,这正是我们所希望看到的。喜欢键程更深、更坚固的笔记本电脑的用户应该试试惠普 Spectre。
奇怪的是,数字键只有白色背光,而主要的 QWERTY 键却有 RGB 灯光。喜欢没有数字键盘的用户可以安装垫片使 QWERTY 键盘居中,或者安装带有自定义按键的 RGB 宏键盘。根据自己的喜好调整键盘位置或居中的功能是我们在其他笔记本电脑上从未见过的。 例如,数字键盘可以安装在 QWERTY 键盘的左侧或右侧,以实现一些真正有趣的配置。
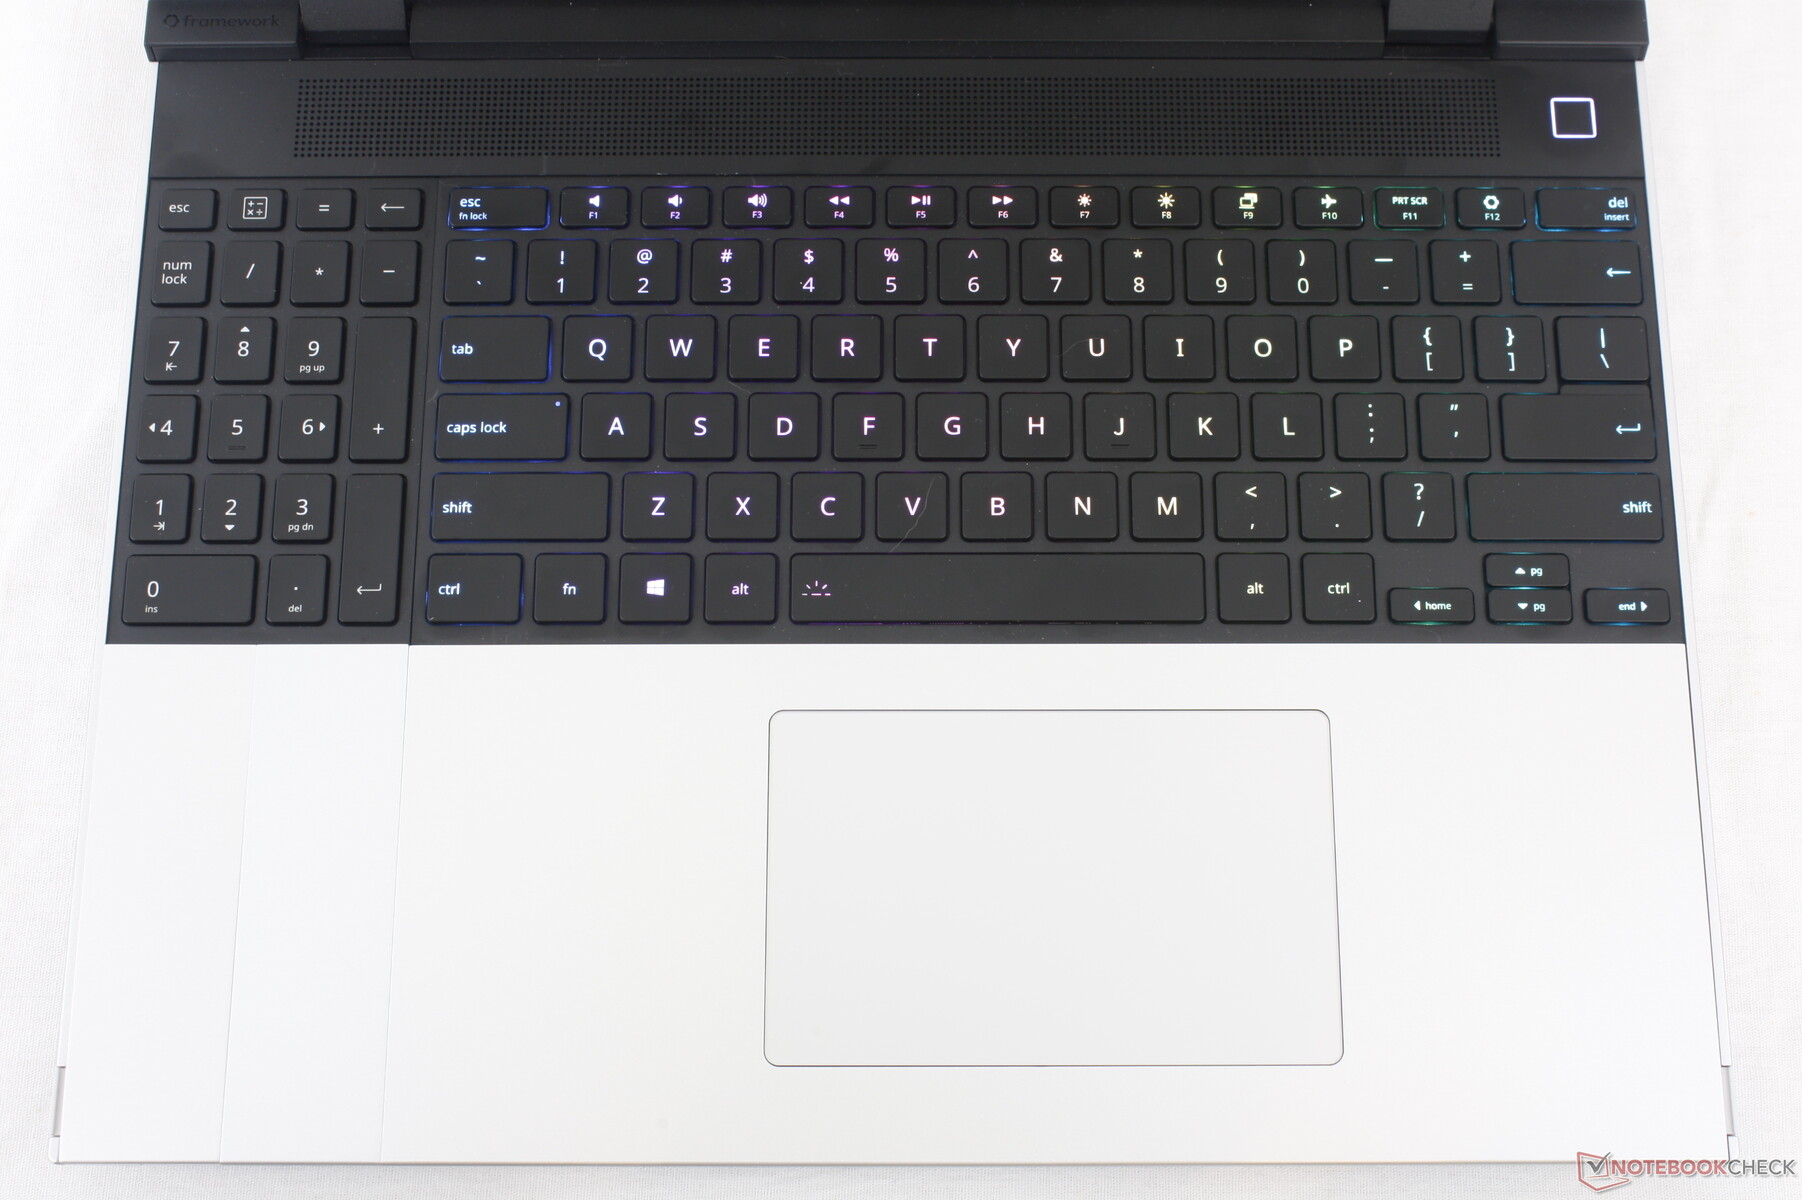
触摸板
Precision 的点击板尺寸为 12.3 x 7.7 厘米,比 微星威望 16(15 x 9 厘米) 小,与 Inspiron 16 Plus(11.5 x 8 厘米)差不多。磨砂玻璃表面的触感非常平滑,只是在以较慢的速度滑行时有一点粘滞感,从而提高了准确性。点击的感觉也很好,反馈不像 Prestige 16 那样松软,但咔嗒声稍大。
如下图所示,点击板的一个独特之处在于它可以根据安装方式在掌托上左右移动。对于喜欢将点击板偏离中心的用户来说,这是一项非常实用的功能。

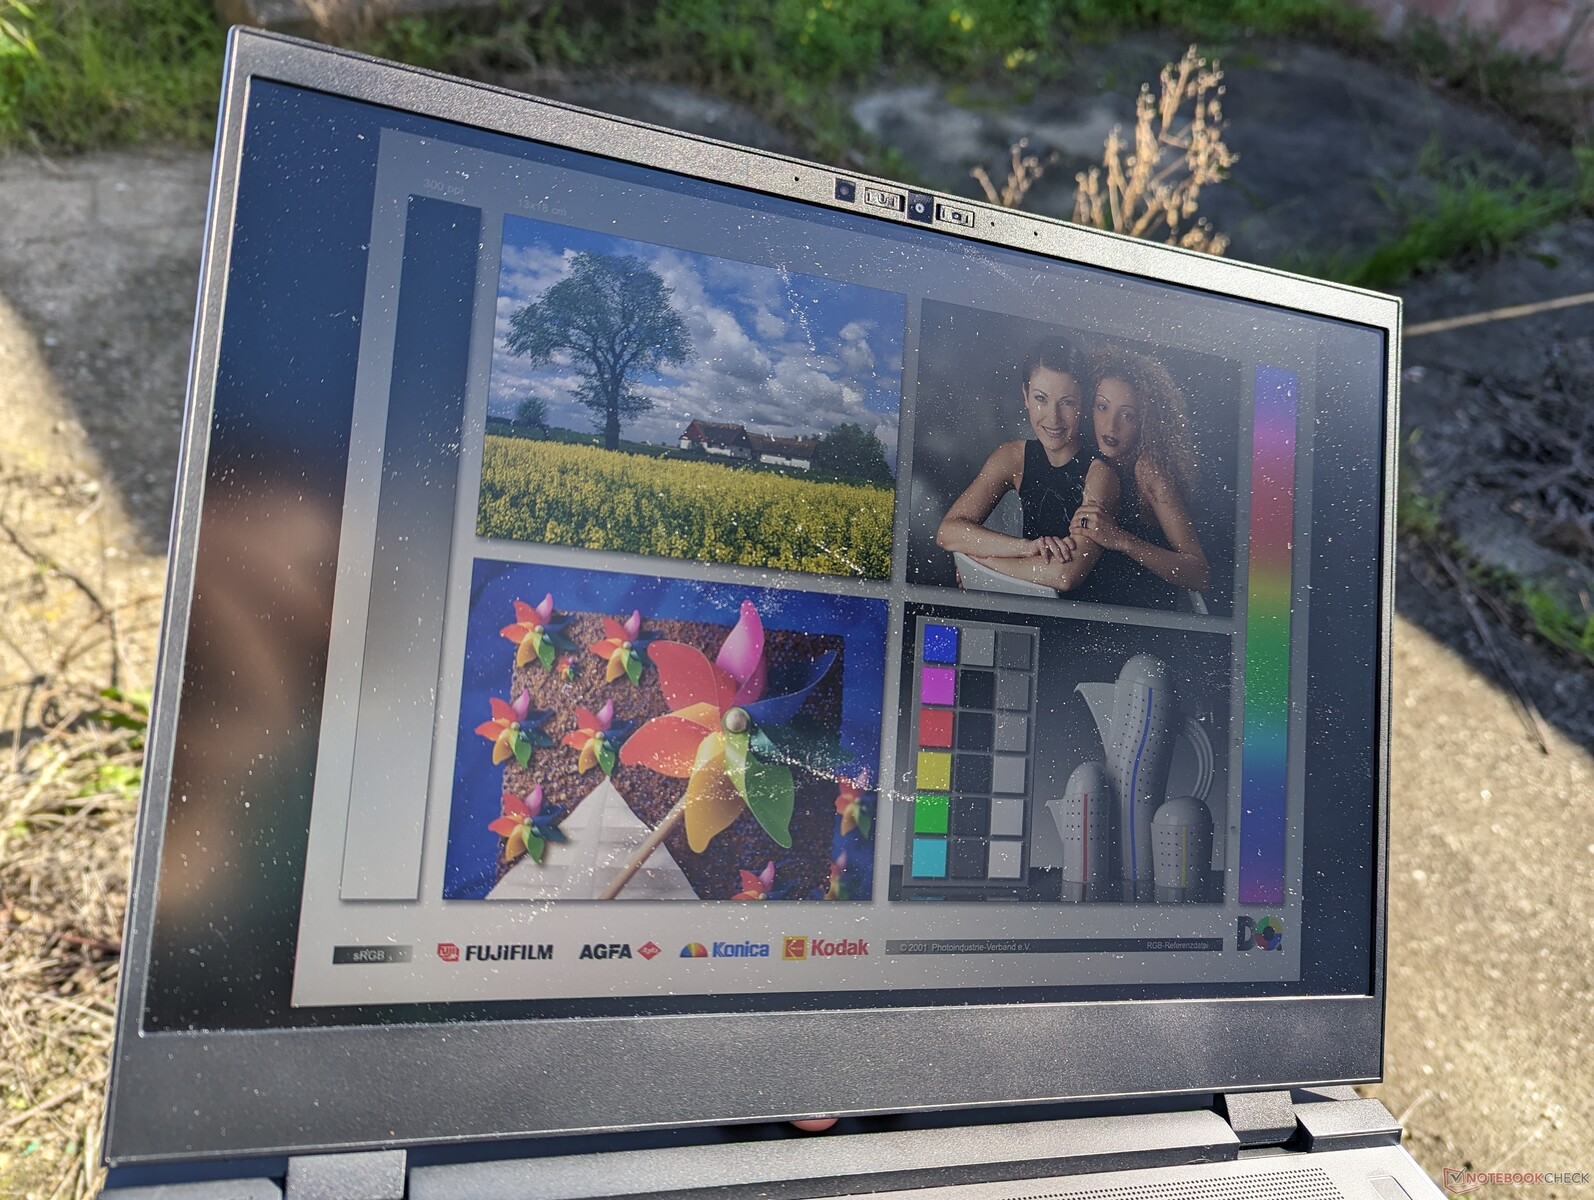
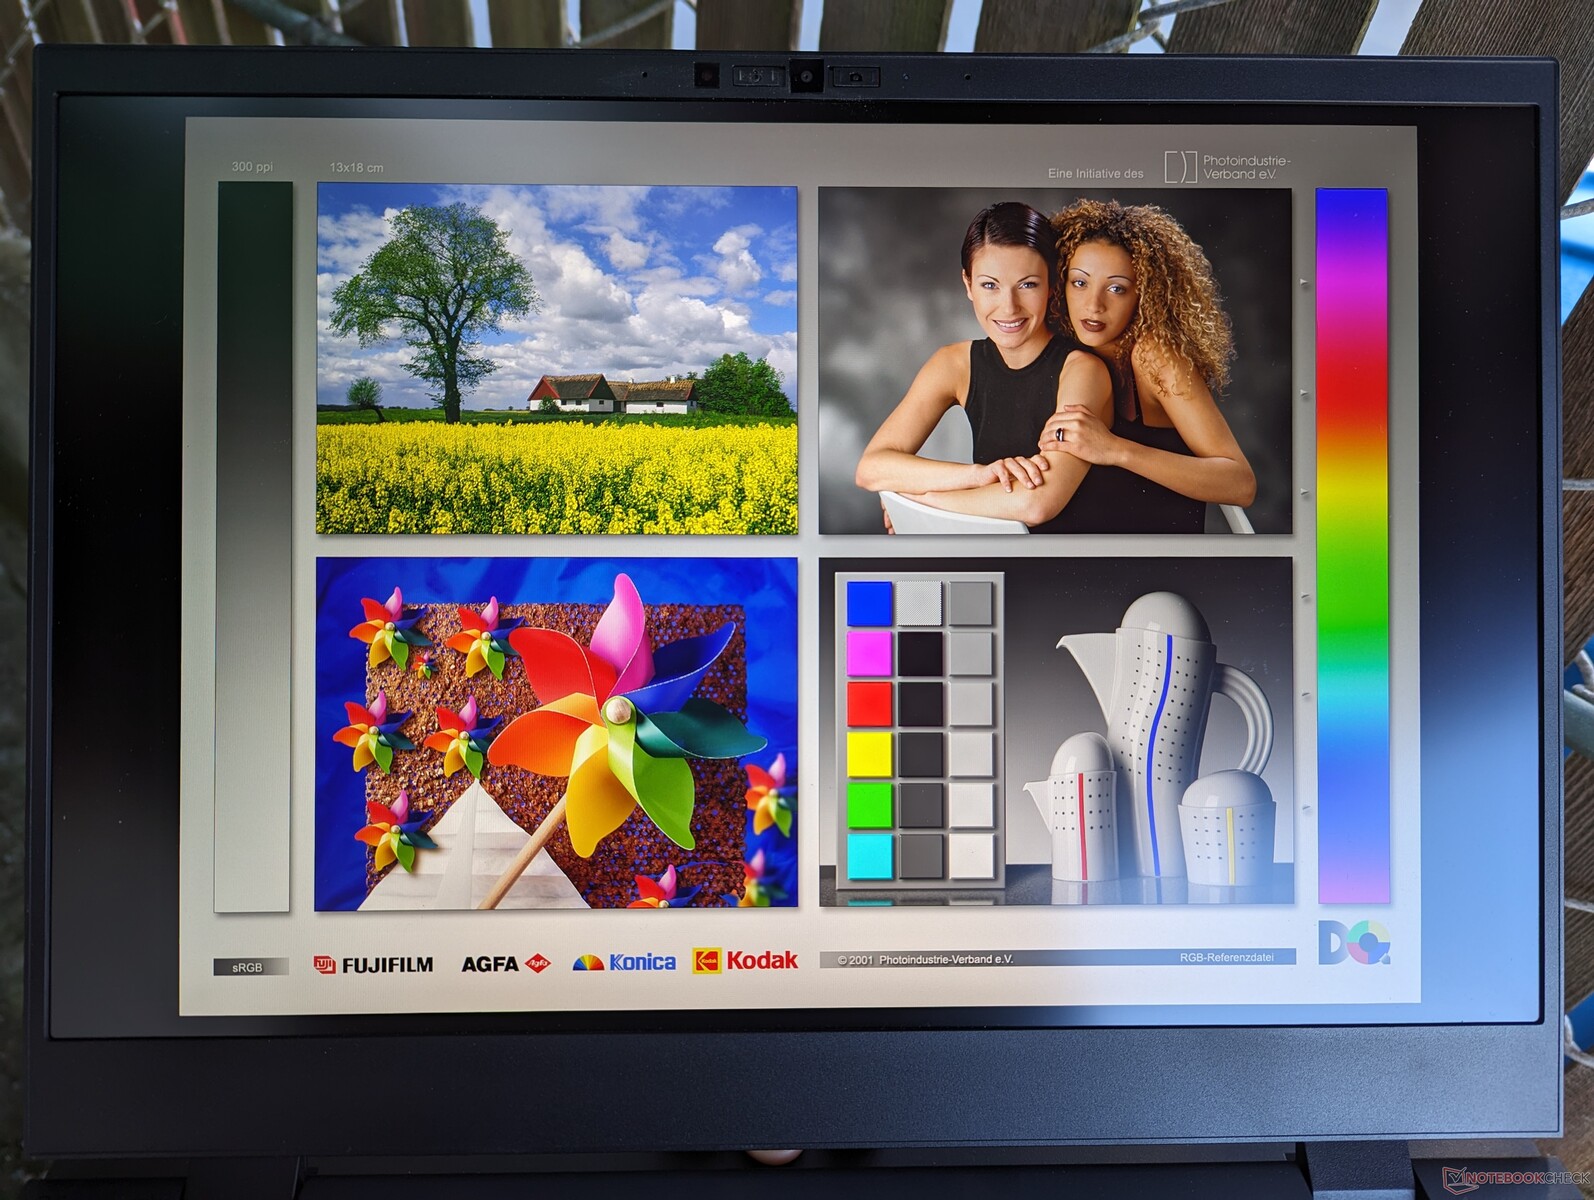
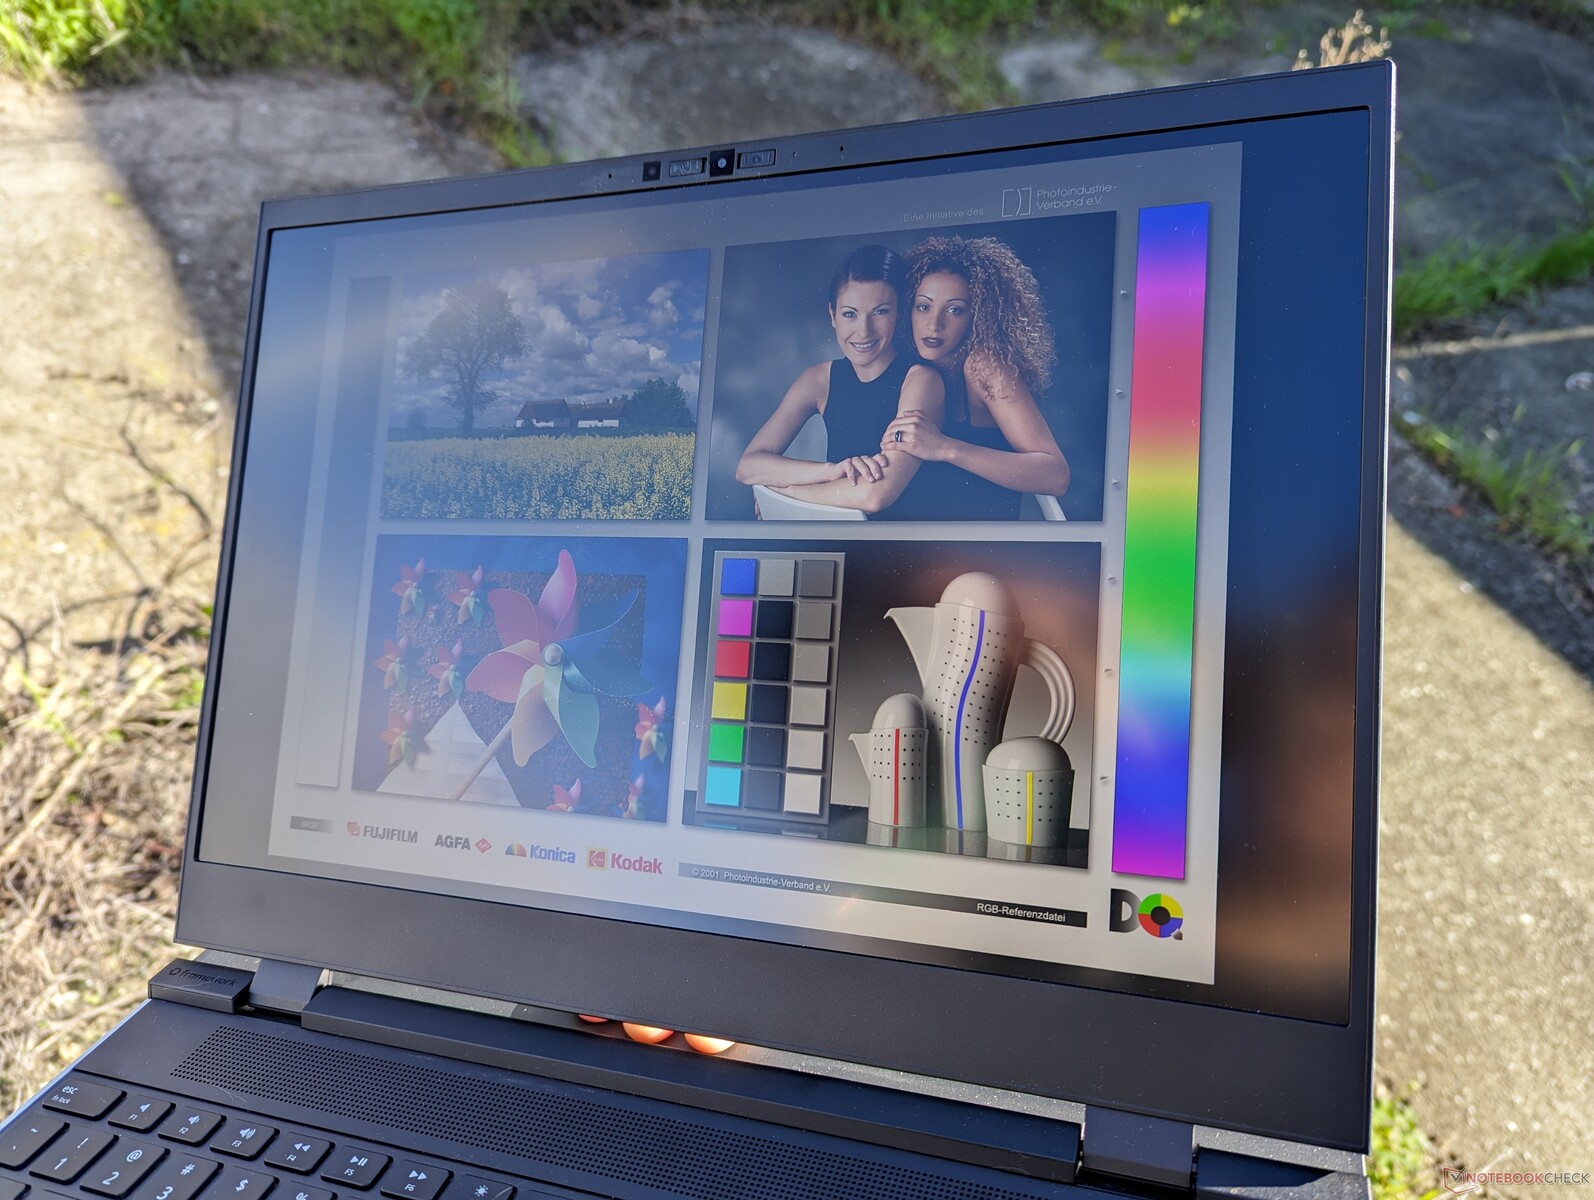
显示屏 - 对不起,没有 OLED 显示屏
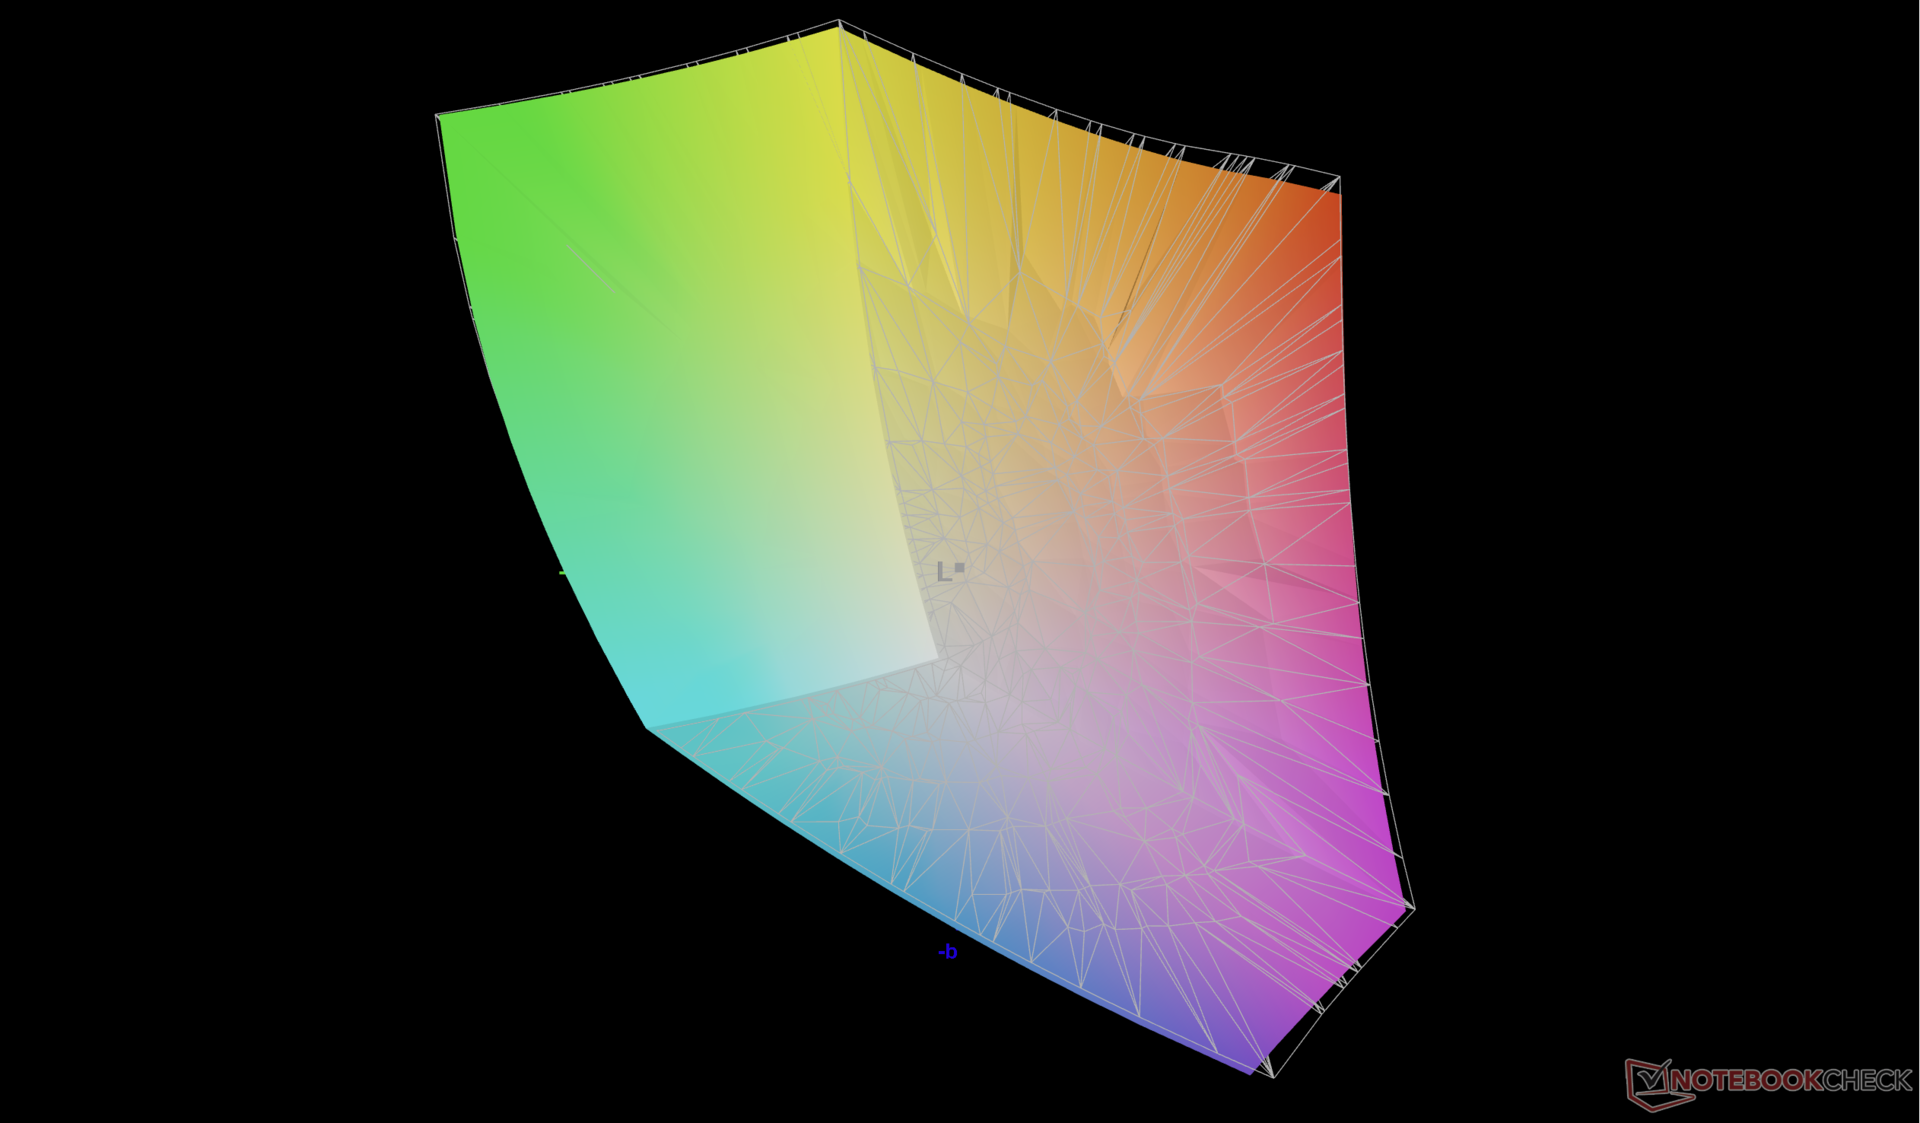
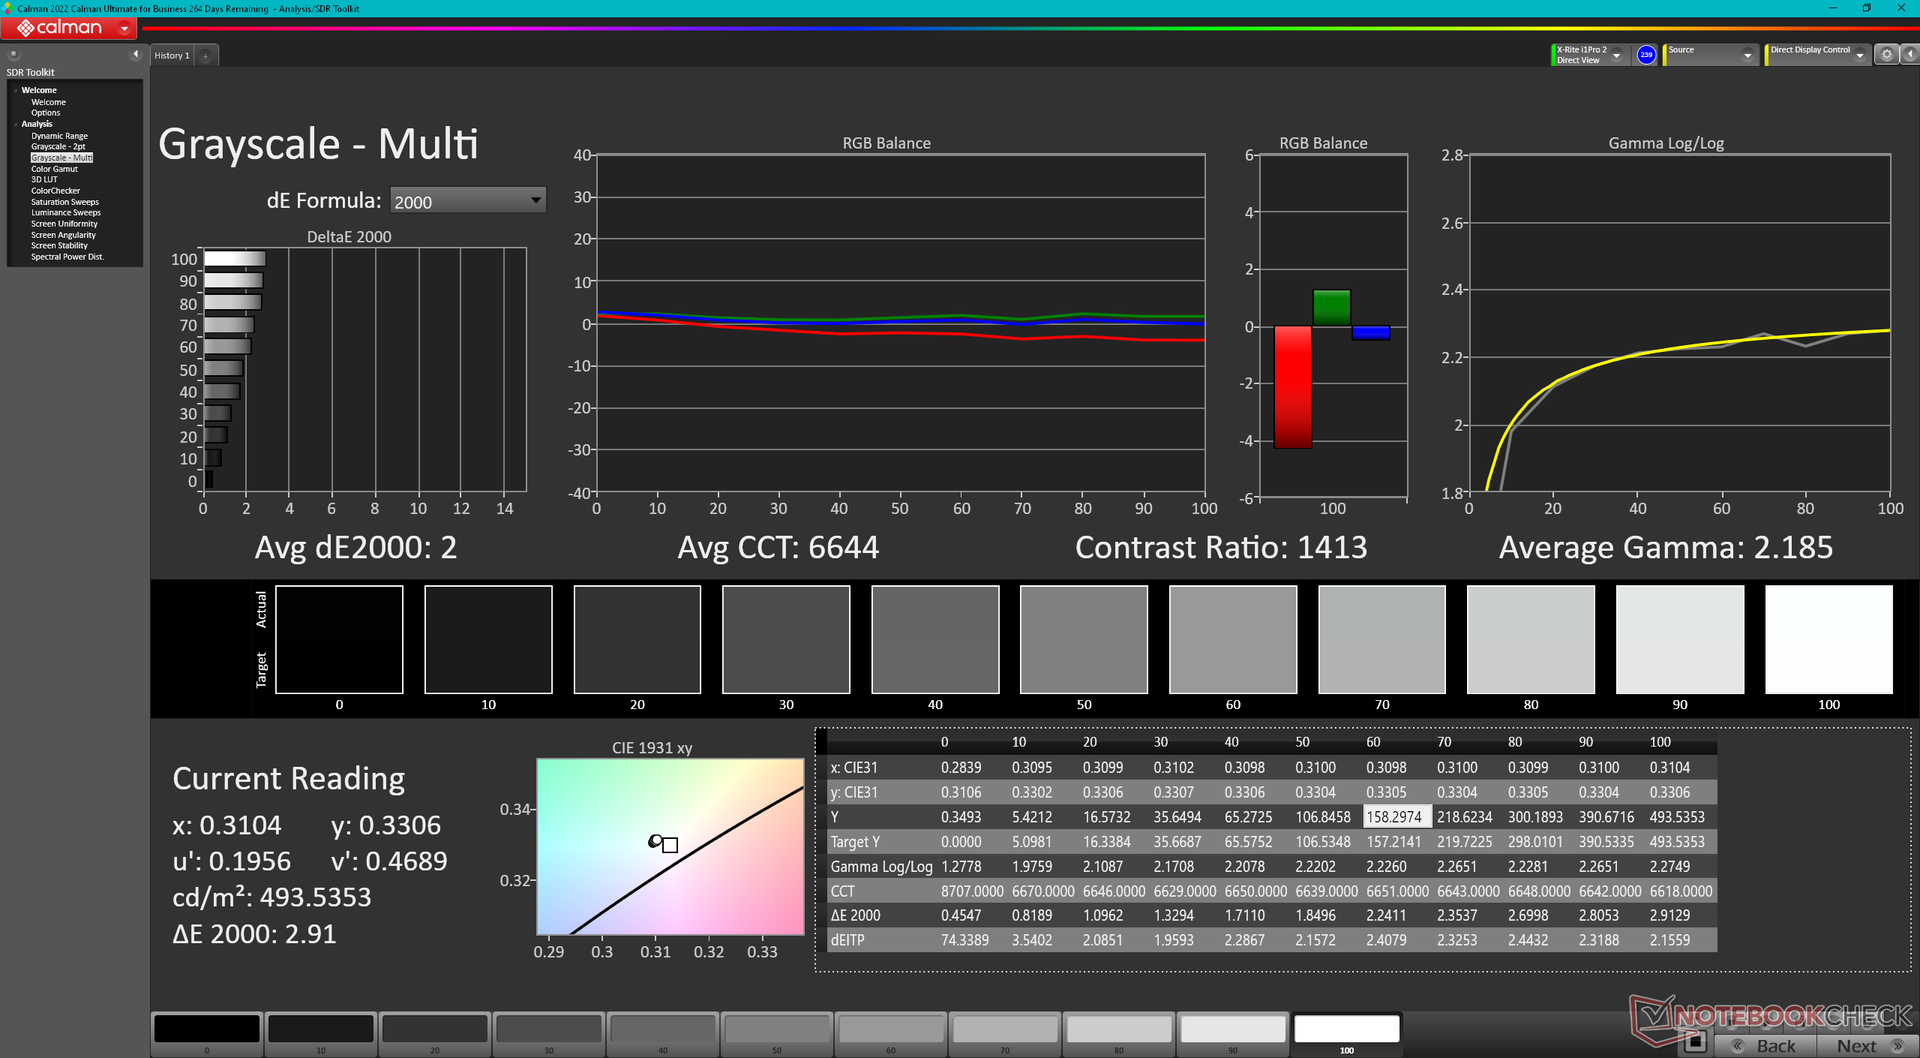
在撰写本文时,由于完全没有其他显示屏可供选择,我们对每台 Laptop 16 配置的唯一 IPS 面板寄予了很高的期望。幸运的是,我们可以负责任地说,Framework 在显示屏上一点也不吝啬。2560 x 1600 的面板响应速度快、DCI-P3 色彩、背光明亮、对比度相对较高,甚至支持 FreeSync 的 165 Hz 可变刷新率。因此,Laptop 16 是首批配备京东方 NE160QDM-NZ6 VRR 面板的笔记本电脑之一。
不过,作为一款 IPS 面板,它在黑白对比度或响应时间方面与典型的 OLED 面板(如 华硕 VivoBook 16系列一样。此外,它还缺乏适当的 HDR 支持,而 HDR 已成为多媒体笔记本电脑上越来越常见的功能。对于一款标榜可为最终用户升级的笔记本电脑来说,没有第二个显示屏选项实在是太奇怪了。即便如此,这仍然是我们见过的最适合编辑和游戏的 16 英寸 IPS 显示屏之一。


| |||||||||||||||||||||||||
Brightness Distribution: 84 %
Center on Battery: 504.8 cd/m²
Contrast: 1231:1 (Black: 0.41 cd/m²)
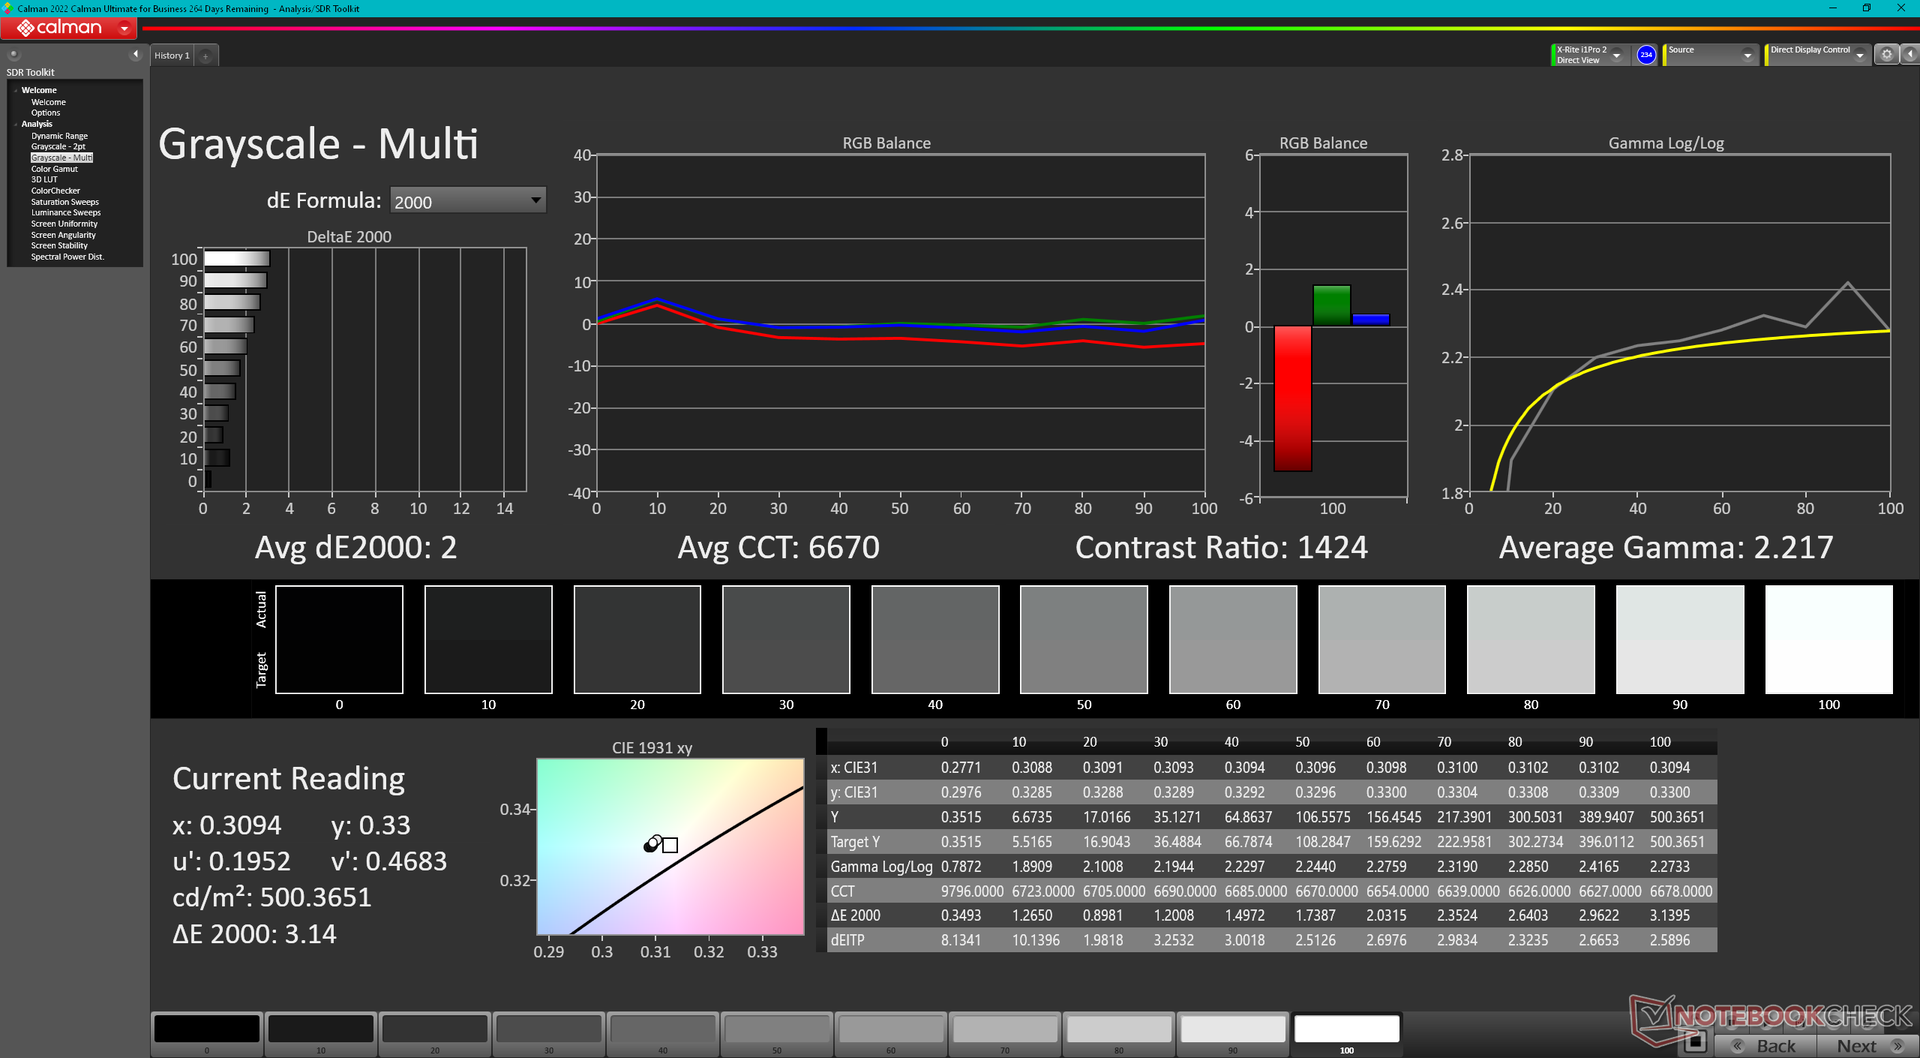
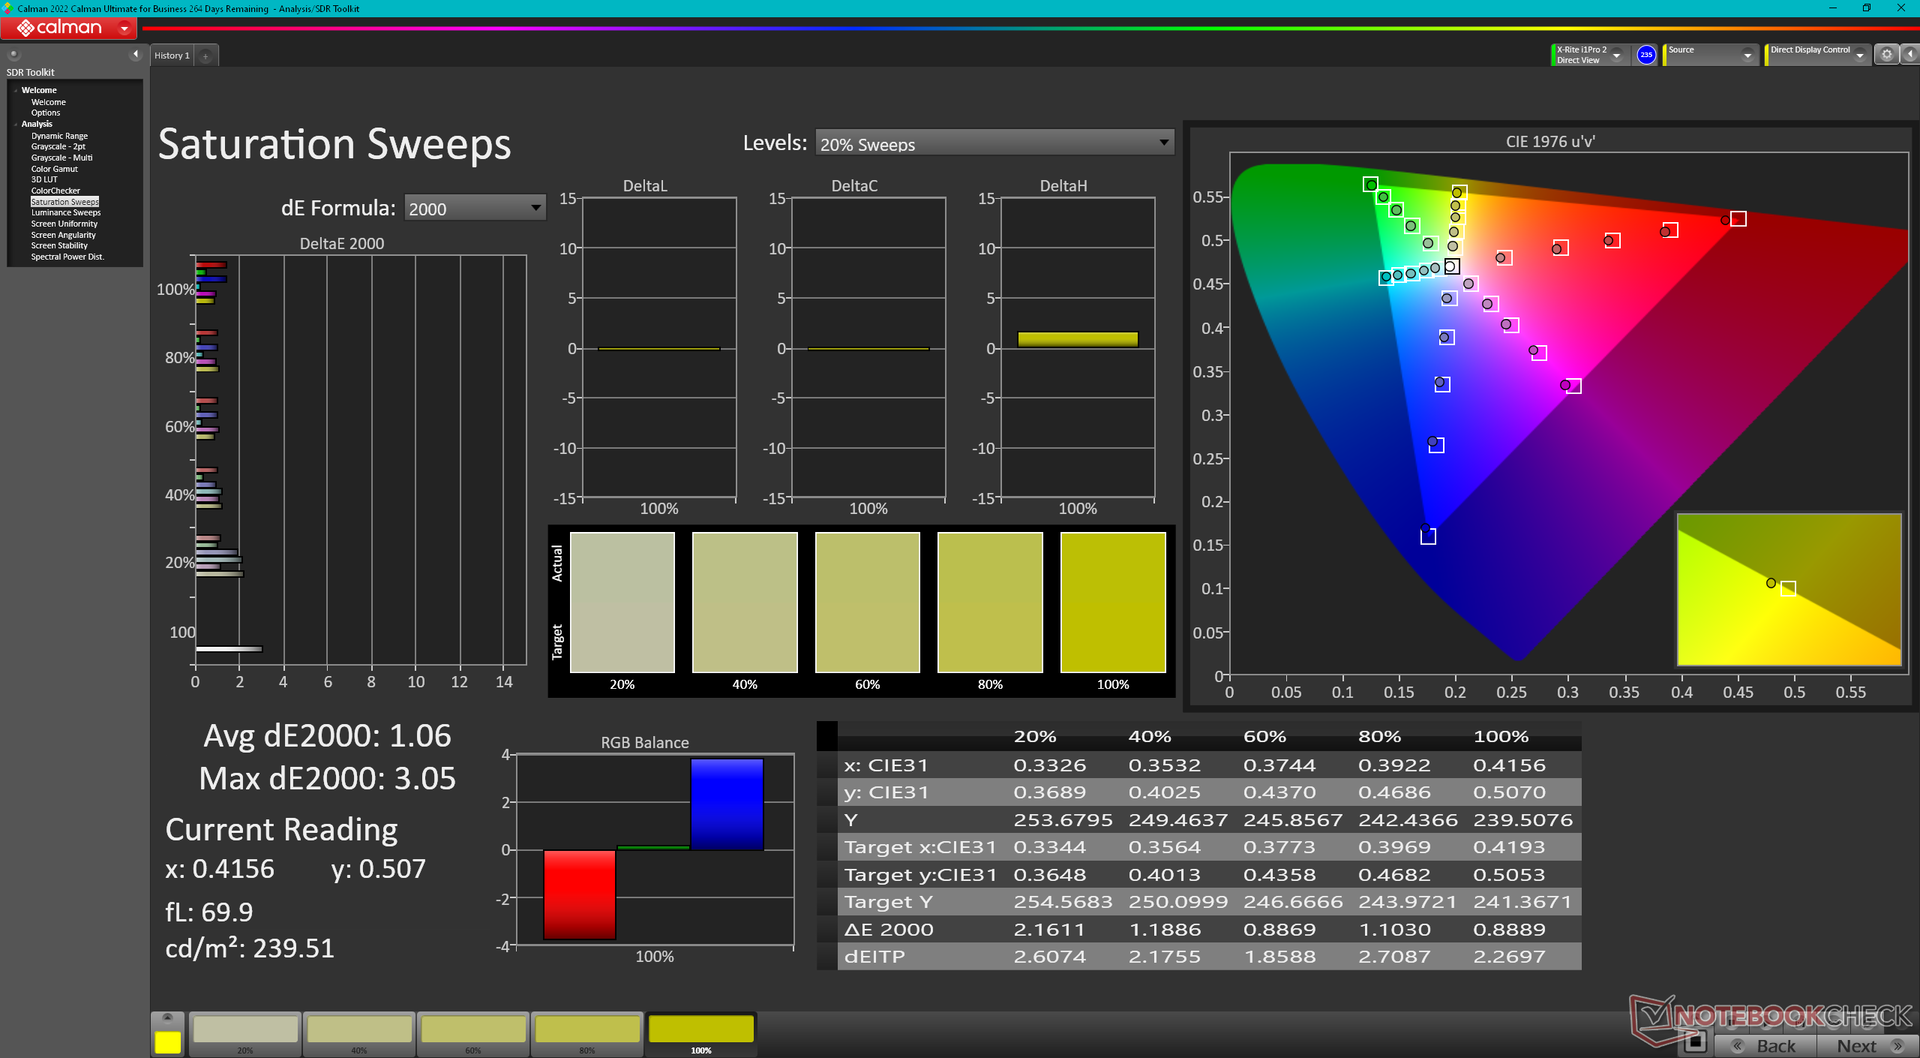
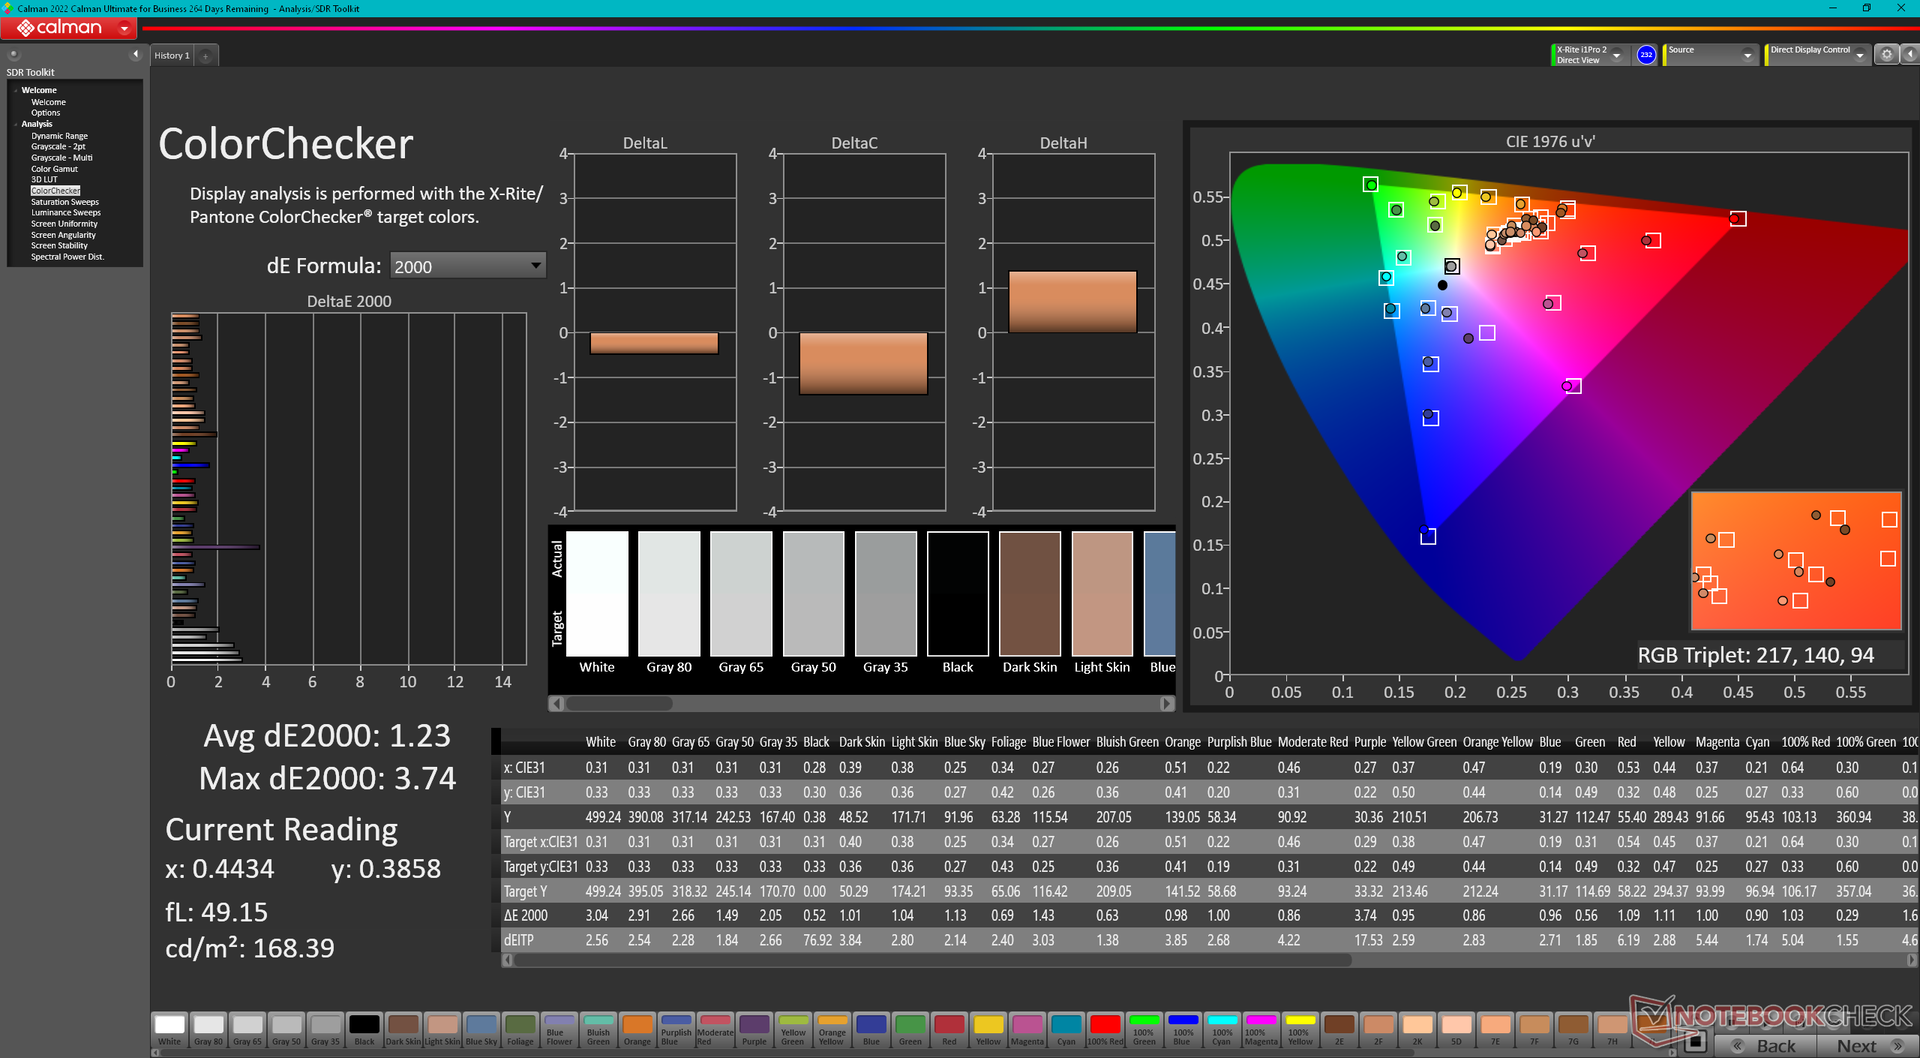
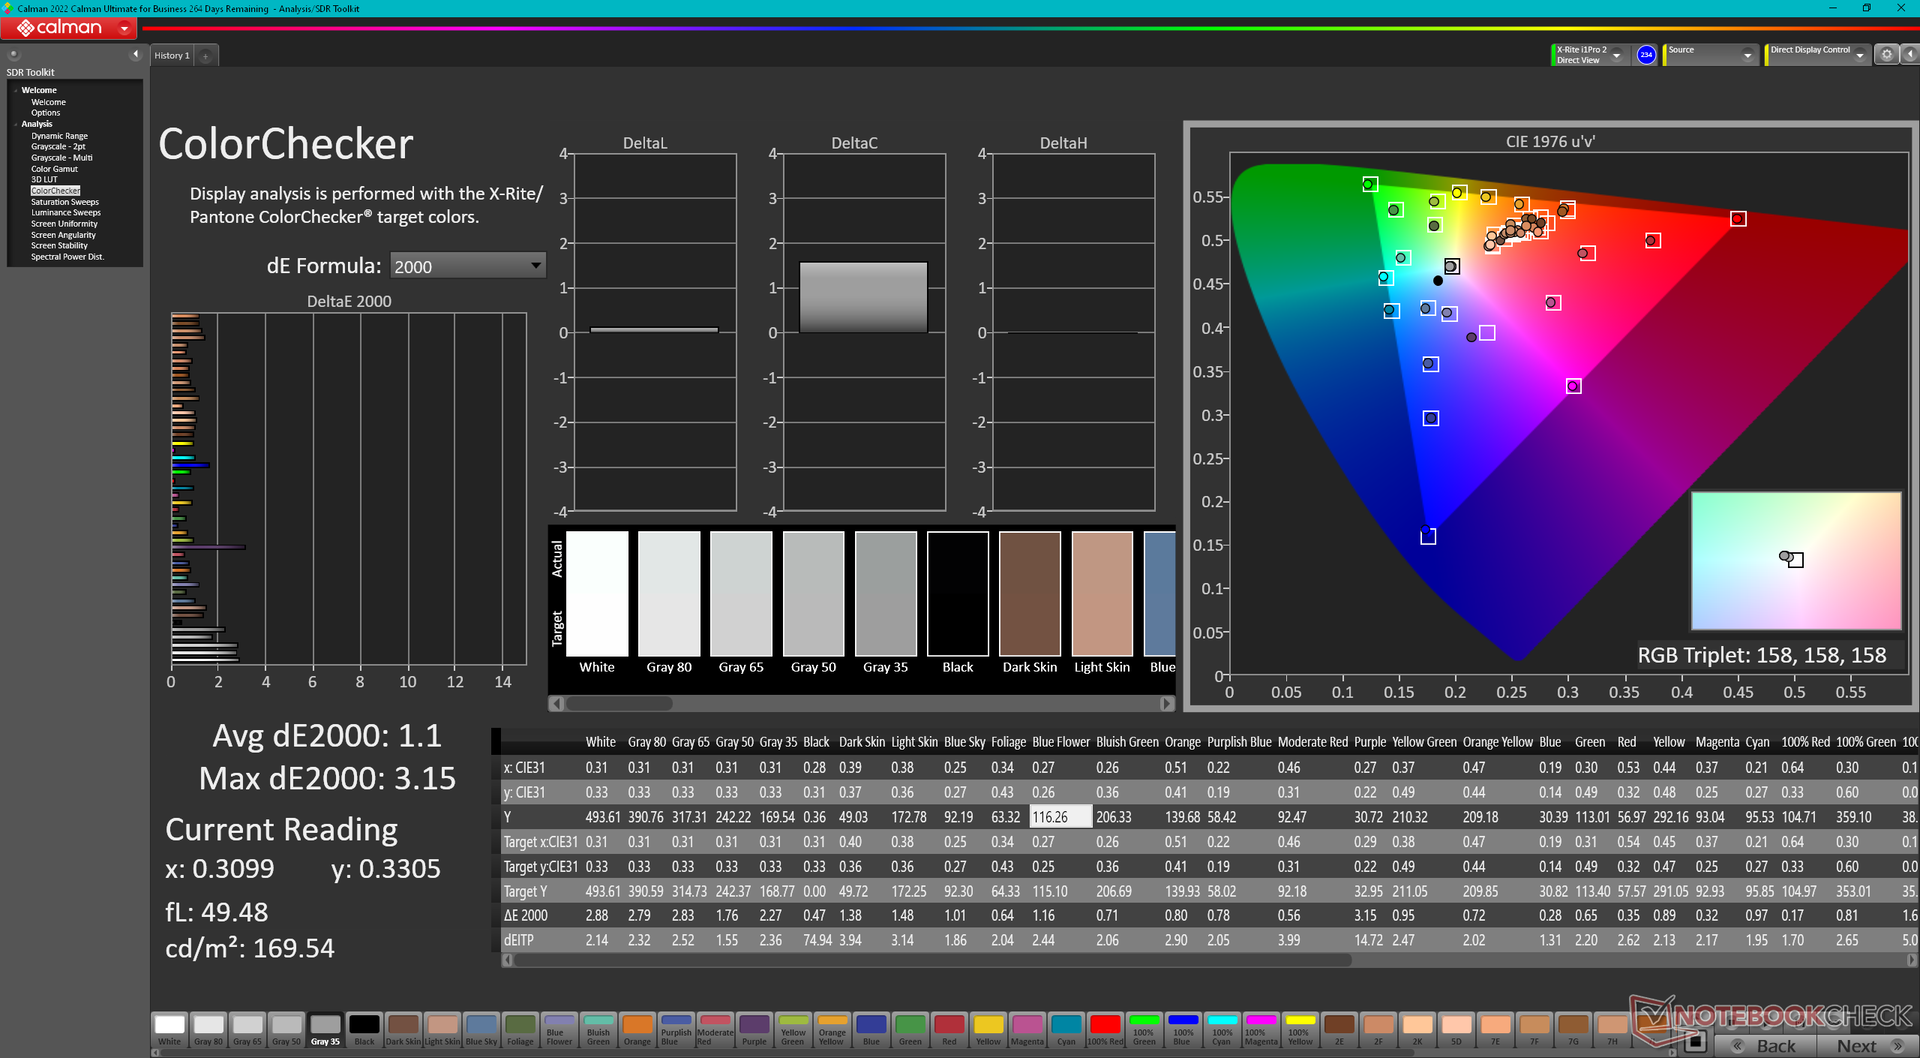
ΔE ColorChecker Calman: 1.23 | ∀{0.5-29.43 Ø4.71}
calibrated: 1.1
ΔE Greyscale Calman: 2 | ∀{0.09-98 Ø4.96}
87% AdobeRGB 1998 (Argyll 3D)
99.7% sRGB (Argyll 3D)
97.7% Display P3 (Argyll 3D)
Gamma: 2.22
CCT: 6670 K
| Framework Laptop 16 2560x1600, 16" | MSI Prestige 16 B1MG-001US AU Optronics B160QAN03.R, IPS, 2560x1600, 16" | Lenovo ThinkPad Z16 Gen 2 Samsung ATNA60YV04-0, OLED, 3840x2400, 16" | Apple MacBook Pro 16 2023 M3 Max Mini-LED, 3456x2234, 16" | Dell Inspiron 16 Plus 7630 LG Philips 160WQ2, IPS, 2560x1600, 16" | HP Spectre x360 2-in-1 16-f1075ng AU Optronics AUO50A3, IPS, 3072x1920, 16" | |
|---|---|---|---|---|---|---|
| Display | -1% | 4% | 2% | -15% | -11% | |
| Display P3 Coverage (%) | 97.7 | 96.7 -1% | 99.7 2% | 99.2 2% | 70.1 -28% | 75.6 -23% |
| sRGB Coverage (%) | 99.7 | 99.8 0% | 100 0% | 99.6 0% | 100.2 1% | |
| AdobeRGB 1998 Coverage (%) | 87 | 84.6 -3% | 96.7 11% | 72.3 -17% | 77.2 -11% | |
| Response Times | -219% | 85% | -322% | -127% | -202% | |
| Response Time Grey 50% / Grey 80% * (ms) | 14.6 ? | 49.4 ? -238% | 1.86 ? 87% | 66.9 ? -358% | 35 ? -140% | 52 ? -256% |
| Response Time Black / White * (ms) | 11.3 ? | 33.9 ? -200% | 1.89 ? 83% | 43.6 ? -286% | 24.2 ? -114% | 28 ? -148% |
| PWM Frequency (Hz) | 60 ? | 14877 | ||||
| Screen | -70% | -6% | 15% | -50% | -120% | |
| Brightness middle (cd/m²) | 504.8 | 473.6 -6% | 390.1 -23% | 630 25% | 299.4 -41% | 425 -16% |
| Brightness (cd/m²) | 490 | 456 -7% | 393 -20% | 604 23% | 290 -41% | 406 -17% |
| Brightness Distribution (%) | 84 | 87 4% | 97 15% | 94 12% | 92 10% | 78 -7% |
| Black Level * (cd/m²) | 0.41 | 0.19 54% | 0.21 49% | 0.24 41% | ||
| Contrast (:1) | 1231 | 2493 103% | 1426 16% | 1771 44% | ||
| Colorchecker dE 2000 * | 1.23 | 5.9 -380% | 1.41 -15% | 1.2 2% | 4.25 -246% | 5.8 -372% |
| Colorchecker dE 2000 max. * | 3.74 | 9.37 -151% | 3.43 8% | 2.8 25% | 6.71 -79% | 11.03 -195% |
| Colorchecker dE 2000 calibrated * | 1.1 | 0.89 19% | 0.52 53% | 4.16 -278% | ||
| Greyscale dE 2000 * | 2 | 7.3 -265% | 2 -0% | 1.9 5% | 5.5 -175% | 7.57 -279% |
| Gamma | 2.22 99% | 1.9 116% | 2.22 99% | 2.29 96% | 2.35 94% | 6600 0% |
| CCT | 6670 97% | 7260 90% | 6324 103% | 6812 95% | 6368 102% | |
| Total Average (Program / Settings) | -97% /
-77% | 28% /
13% | -102% /
-61% | -64% /
-54% | -111% /
-108% |
* ... smaller is better
尽管面板覆盖了 100% 的 DCI-P3,但显示器还是根据 sRGB 标准进行了良好的校准。自行校准显示屏并不会明显改善其平均 deltaE 值,因此大多数情况下都不需要进行最终用户校准。

Display Response Times
| ↔ Response Time Black to White | ||
|---|---|---|
| 11.3 ms ... rise ↗ and fall ↘ combined | ↗ 6.1 ms rise | 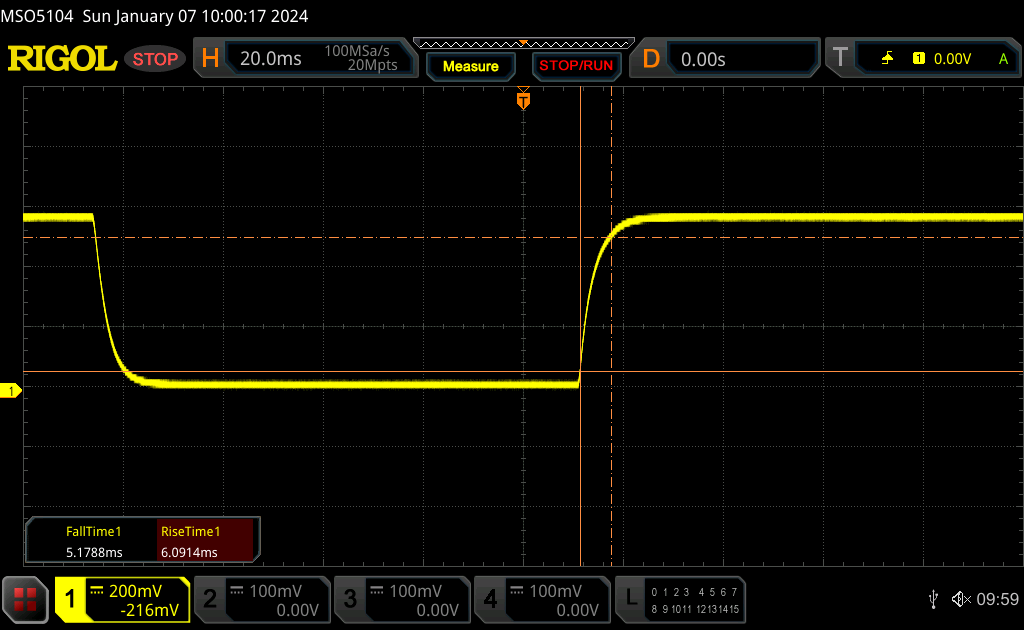 |
| ↘ 5.2 ms fall | ||
| The screen shows good response rates in our tests, but may be too slow for competitive gamers. In comparison, all tested devices range from 0.1 (minimum) to 240 (maximum) ms. » 31 % of all devices are better. This means that the measured response time is better than the average of all tested devices (19.8 ms). | ||
| ↔ Response Time 50% Grey to 80% Grey | ||
| 14.6 ms ... rise ↗ and fall ↘ combined | ↗ 7.1 ms rise | 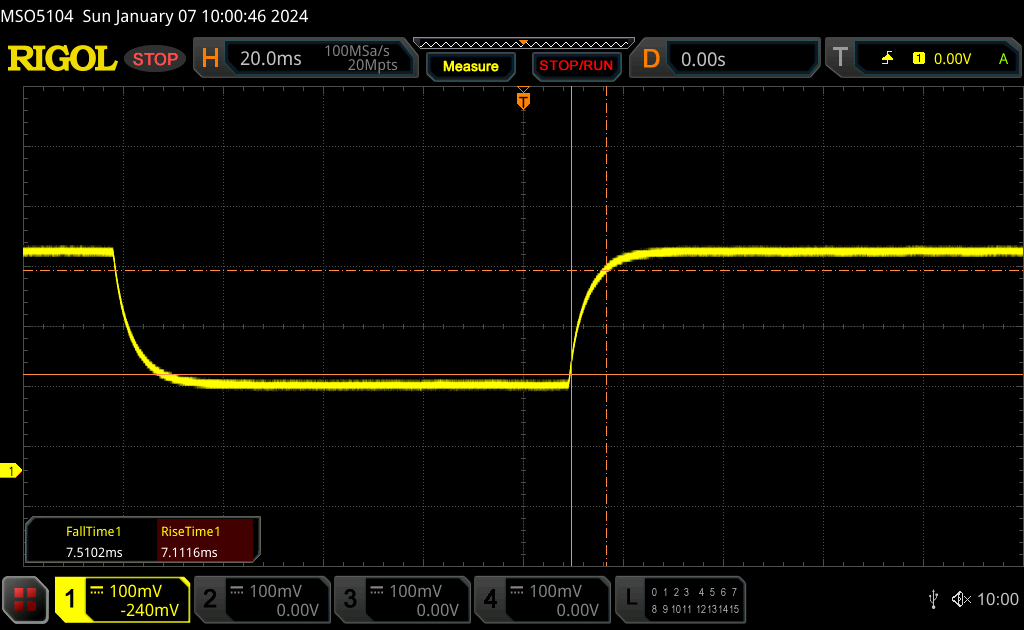 |
| ↘ 7.5 ms fall | ||
| The screen shows good response rates in our tests, but may be too slow for competitive gamers. In comparison, all tested devices range from 0.165 (minimum) to 636 (maximum) ms. » 29 % of all devices are better. This means that the measured response time is better than the average of all tested devices (31 ms). | ||
Screen Flickering / PWM (Pulse-Width Modulation)
| Screen flickering / PWM not detected | 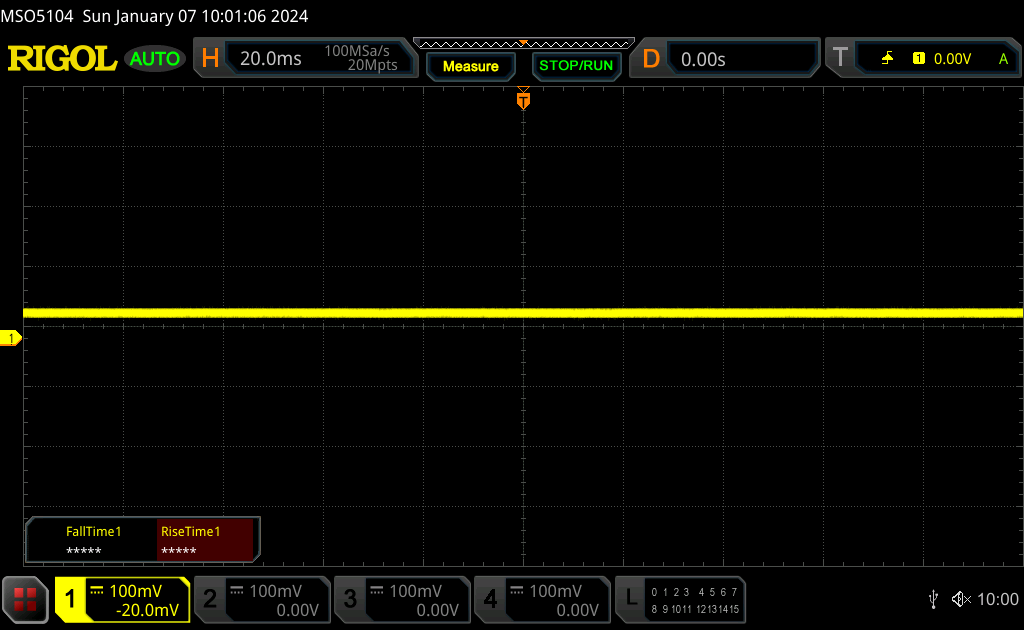 | ||
In comparison: 52 % of all tested devices do not use PWM to dim the display. If PWM was detected, an average of 7754 (minimum: 5 - maximum: 343500) Hz was measured. | |||
500 尼特的显示屏亮度超过了许多其他多媒体笔记本电脑,甚至包括其 OLED 面板。 ThinkPad Z16 Gen 2或微星 Stealth 16 的 OLED 面板。高亮度和亚光面板使屏幕在户外环境下更容易看清。
性能--无需英特尔或 Nvidia
测试条件
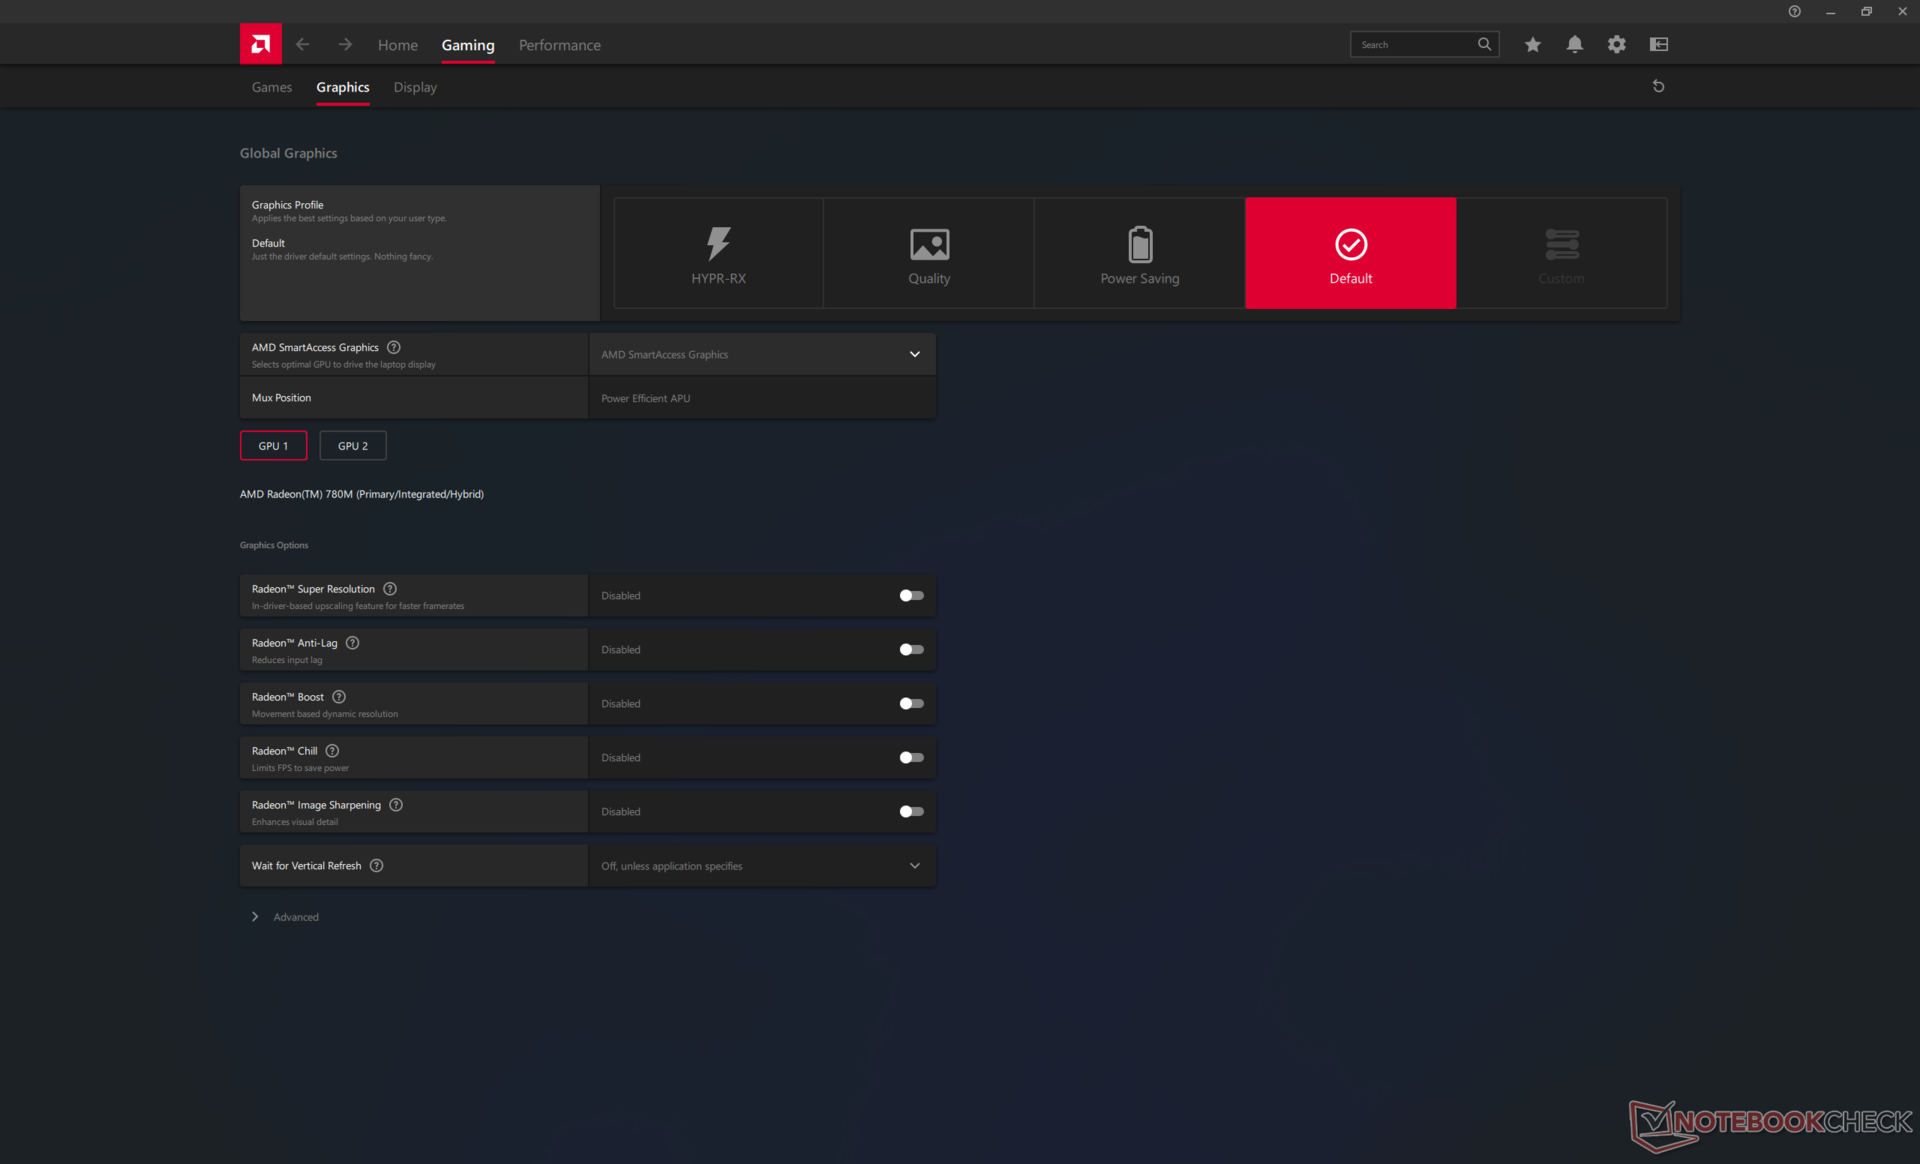
在运行以下基准测试之前,我们将 Windows 设置为性能模式,将 AMD Adrenalin 设置为默认模式。SmartAccess Graphics 是 AMD 的 MUX 解决方案,可根据应用程序在 iGPU 和 dGPU 之间自动切换。问题是,与GeForce 笔记本电脑不同,SmartAccess Graphics 不提供 "纯 dGPU "或 "纯 iGPU "模式,因此你的图形体验完全依赖于自动切换。每当系统检测到 GPU 功能较强的应用程序时,就必须冻结几秒钟,这在不同窗口之间进行多任务处理时可能会很烦人。实施 "仅 dGPU "模式可以解决这个问题。
处理器
... Ryzen 9 7940HS通常用于快速多媒体或游戏笔记本电脑,如 华硕 ROG Zephyrus G14或 TUF Gaming A17.它直接与第 13 代 酷睿 i7-13700H直接竞争,因此这两款处理器的性能大致相当。
框架提供 Ryzen 7 7840HS配置的 Laptop 16。根据我们使用 联想Legion Slim 7 16APH8不过,尽管价格和命名规则不同,Ryzen 7 7840HS 与 Ryzen 9 7940HS 的性能基本不相上下。如果你不需要 Ryzen 9 多出的 5% 性能,那么选择 Ryzen 7 可以为你节省数百美元。
可惜的是,Framework 并没有提供 Ryzen 9 Pro 7940HS,而这将使 Laptop 16 对专业人士更具吸引力。
Cinebench R15 Multi Loop
Cinebench R23: Multi Core | Single Core
Cinebench R20: CPU (Multi Core) | CPU (Single Core)
Cinebench R15: CPU Multi 64Bit | CPU Single 64Bit
Blender: v2.79 BMW27 CPU
7-Zip 18.03: 7z b 4 | 7z b 4 -mmt1
Geekbench 5.5: Multi-Core | Single-Core
HWBOT x265 Benchmark v2.2: 4k Preset
LibreOffice : 20 Documents To PDF
R Benchmark 2.5: Overall mean
* ... smaller is better
AIDA64: FP32 Ray-Trace | FPU Julia | CPU SHA3 | CPU Queen | FPU SinJulia | FPU Mandel | CPU AES | CPU ZLib | FP64 Ray-Trace | CPU PhotoWorxx
| Performance rating | |
| Framework Laptop 16 | |
| Average AMD Ryzen 9 7940HS | |
| Lenovo ThinkPad Z16 Gen 2 | |
| MSI Prestige 16 B1MG-001US | |
| Dell Inspiron 16 Plus 7630 | |
| HP Spectre x360 2-in-1 16-f1075ng | |
| AIDA64 / FP32 Ray-Trace | |
| Lenovo ThinkPad Z16 Gen 2 | |
| Framework Laptop 16 | |
| Average AMD Ryzen 9 7940HS (25226 - 29109, n=10) | |
| MSI Prestige 16 B1MG-001US | |
| Dell Inspiron 16 Plus 7630 | |
| HP Spectre x360 2-in-1 16-f1075ng | |
| AIDA64 / FPU Julia | |
| Lenovo ThinkPad Z16 Gen 2 | |
| Average AMD Ryzen 9 7940HS (106512 - 123214, n=10) | |
| Framework Laptop 16 | |
| MSI Prestige 16 B1MG-001US | |
| Dell Inspiron 16 Plus 7630 | |
| HP Spectre x360 2-in-1 16-f1075ng | |
| AIDA64 / CPU SHA3 | |
| Lenovo ThinkPad Z16 Gen 2 | |
| Framework Laptop 16 | |
| Average AMD Ryzen 9 7940HS (4566 - 5119, n=10) | |
| MSI Prestige 16 B1MG-001US | |
| Dell Inspiron 16 Plus 7630 | |
| HP Spectre x360 2-in-1 16-f1075ng | |
| AIDA64 / CPU Queen | |
| Lenovo ThinkPad Z16 Gen 2 | |
| Framework Laptop 16 | |
| Average AMD Ryzen 9 7940HS (118174 - 124783, n=10) | |
| Dell Inspiron 16 Plus 7630 | |
| MSI Prestige 16 B1MG-001US | |
| HP Spectre x360 2-in-1 16-f1075ng | |
| AIDA64 / FPU SinJulia | |
| Lenovo ThinkPad Z16 Gen 2 | |
| Average AMD Ryzen 9 7940HS (14663 - 15551, n=10) | |
| Framework Laptop 16 | |
| MSI Prestige 16 B1MG-001US | |
| Dell Inspiron 16 Plus 7630 | |
| HP Spectre x360 2-in-1 16-f1075ng | |
| AIDA64 / FPU Mandel | |
| Lenovo ThinkPad Z16 Gen 2 | |
| Average AMD Ryzen 9 7940HS (56839 - 66238, n=10) | |
| Framework Laptop 16 | |
| MSI Prestige 16 B1MG-001US | |
| Dell Inspiron 16 Plus 7630 | |
| HP Spectre x360 2-in-1 16-f1075ng | |
| AIDA64 / CPU AES | |
| Framework Laptop 16 | |
| Average AMD Ryzen 9 7940HS (86309 - 171350, n=10) | |
| HP Spectre x360 2-in-1 16-f1075ng | |
| Lenovo ThinkPad Z16 Gen 2 | |
| MSI Prestige 16 B1MG-001US | |
| Dell Inspiron 16 Plus 7630 | |
| AIDA64 / CPU ZLib | |
| Lenovo ThinkPad Z16 Gen 2 | |
| Average AMD Ryzen 9 7940HS (866 - 1152, n=10) | |
| MSI Prestige 16 B1MG-001US | |
| Framework Laptop 16 | |
| Dell Inspiron 16 Plus 7630 | |
| HP Spectre x360 2-in-1 16-f1075ng | |
| AIDA64 / FP64 Ray-Trace | |
| Lenovo ThinkPad Z16 Gen 2 | |
| Average AMD Ryzen 9 7940HS (13175 - 15675, n=10) | |
| Framework Laptop 16 | |
| MSI Prestige 16 B1MG-001US | |
| Dell Inspiron 16 Plus 7630 | |
| HP Spectre x360 2-in-1 16-f1075ng | |
| AIDA64 / CPU PhotoWorxx | |
| MSI Prestige 16 B1MG-001US | |
| Framework Laptop 16 | |
| Dell Inspiron 16 Plus 7630 | |
| Lenovo ThinkPad Z16 Gen 2 | |
| Average AMD Ryzen 9 7940HS (22477 - 41567, n=10) | |
| HP Spectre x360 2-in-1 16-f1075ng | |
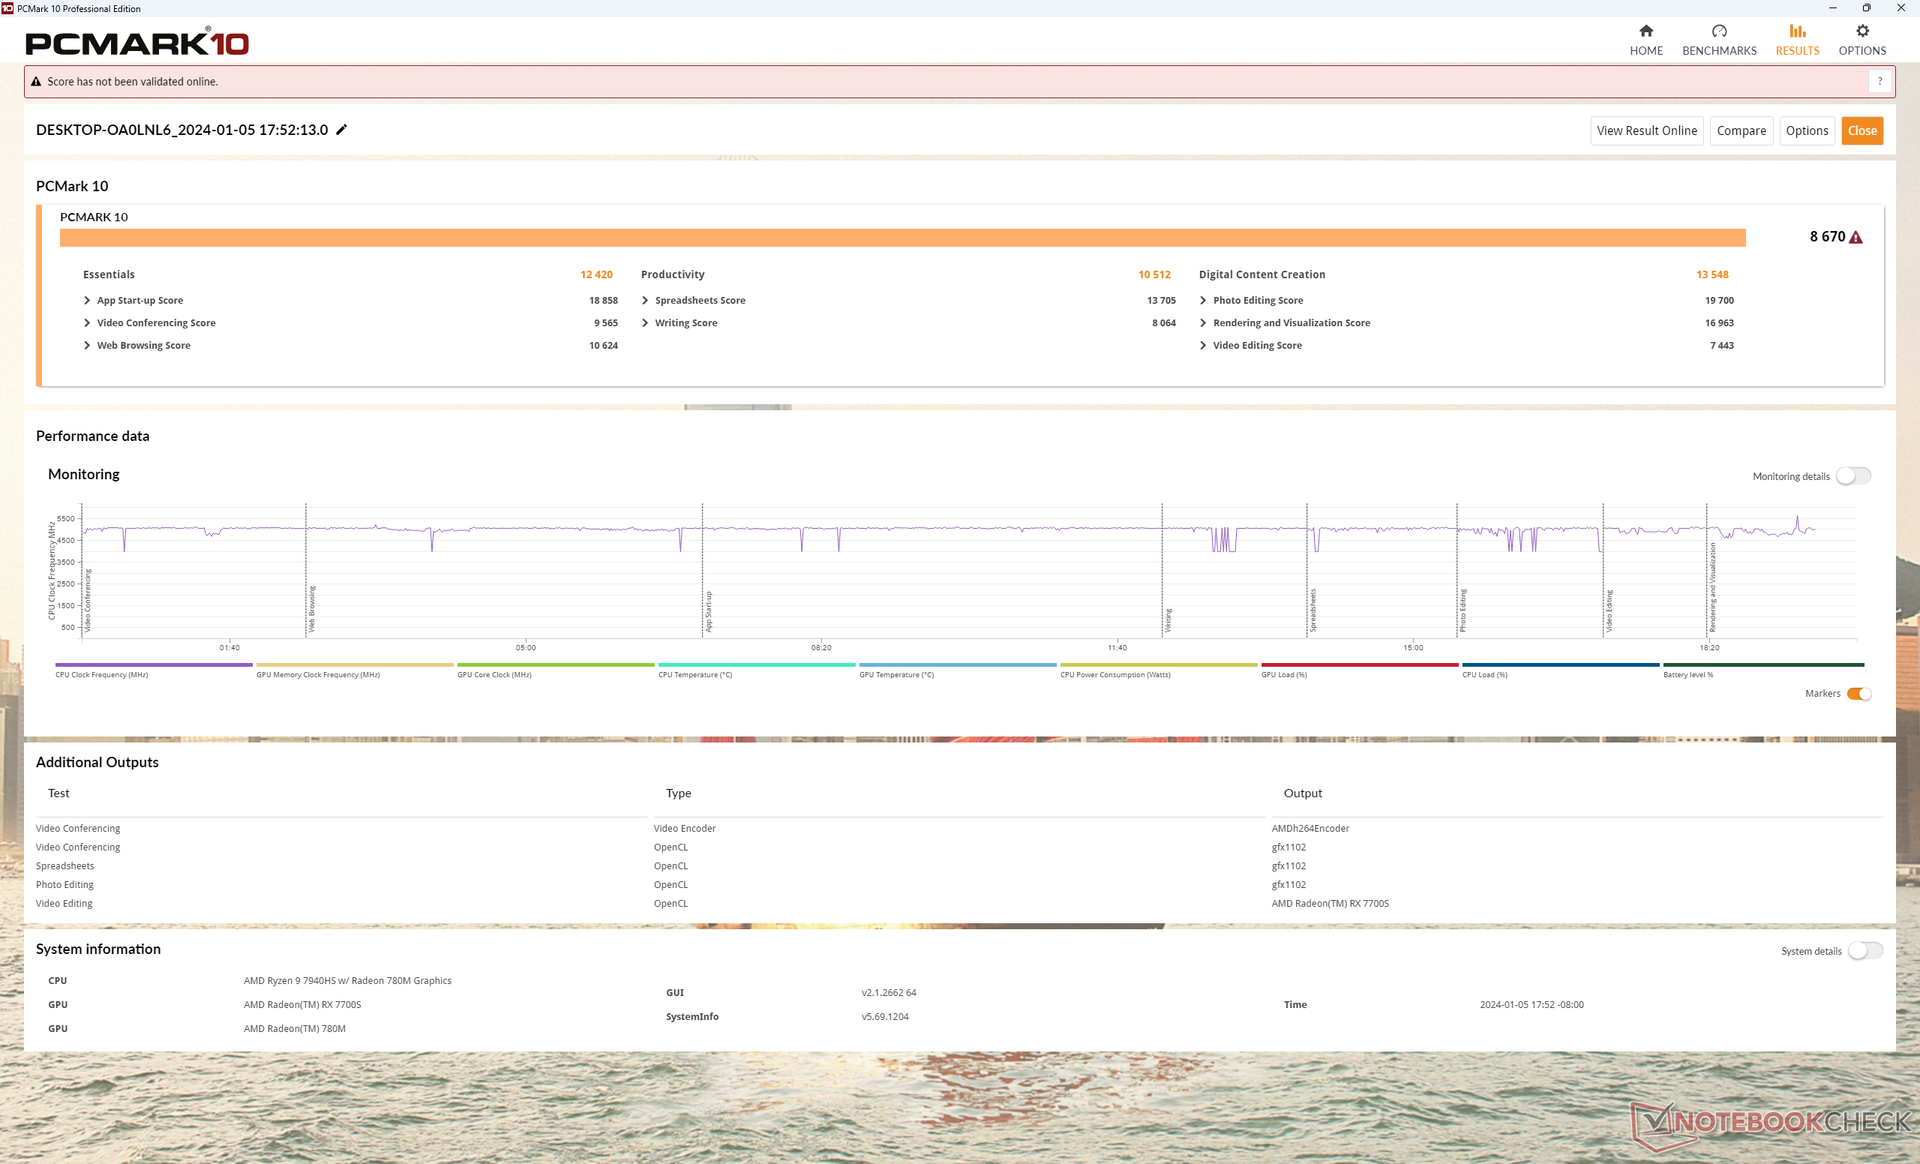
系统性能
由于采用了快速的 Ryzen 9 Zen 4 CPU 和相关的 Radeon 显卡,PCMark 10 分数在所有 16 英寸多媒体笔记本电脑中名列前茅。高 PCMark 分数表明,在运行从浏览器到图形编辑器等日常任务时,Framework 16 的速度与其他高性能笔记本电脑不相上下。
CrossMark: Overall | Productivity | Creativity | Responsiveness
WebXPRT 3: Overall
WebXPRT 4: Overall
Mozilla Kraken 1.1: Total
| PCMark 10 / Score | |
| Framework Laptop 16 | |
| Average AMD Ryzen 9 7940HS, AMD Radeon RX 7700S (n=1) | |
| Lenovo ThinkPad Z16 Gen 2 | |
| Dell Inspiron 16 Plus 7630 | |
| MSI Prestige 16 B1MG-001US | |
| HP Spectre x360 2-in-1 16-f1075ng | |
| PCMark 10 / Essentials | |
| Framework Laptop 16 | |
| Average AMD Ryzen 9 7940HS, AMD Radeon RX 7700S (n=1) | |
| Lenovo ThinkPad Z16 Gen 2 | |
| Dell Inspiron 16 Plus 7630 | |
| MSI Prestige 16 B1MG-001US | |
| HP Spectre x360 2-in-1 16-f1075ng | |
| PCMark 10 / Productivity | |
| Framework Laptop 16 | |
| Average AMD Ryzen 9 7940HS, AMD Radeon RX 7700S (n=1) | |
| Lenovo ThinkPad Z16 Gen 2 | |
| Dell Inspiron 16 Plus 7630 | |
| MSI Prestige 16 B1MG-001US | |
| HP Spectre x360 2-in-1 16-f1075ng | |
| PCMark 10 / Digital Content Creation | |
| Framework Laptop 16 | |
| Average AMD Ryzen 9 7940HS, AMD Radeon RX 7700S (n=1) | |
| Dell Inspiron 16 Plus 7630 | |
| Lenovo ThinkPad Z16 Gen 2 | |
| MSI Prestige 16 B1MG-001US | |
| HP Spectre x360 2-in-1 16-f1075ng | |
| CrossMark / Overall | |
| Apple MacBook Pro 16 2023 M3 Max | |
| Dell Inspiron 16 Plus 7630 | |
| MSI Prestige 16 B1MG-001US | |
| HP Spectre x360 2-in-1 16-f1075ng | |
| Framework Laptop 16 | |
| Average AMD Ryzen 9 7940HS, AMD Radeon RX 7700S (n=1) | |
| Lenovo ThinkPad Z16 Gen 2 | |
| CrossMark / Productivity | |
| Apple MacBook Pro 16 2023 M3 Max | |
| Dell Inspiron 16 Plus 7630 | |
| HP Spectre x360 2-in-1 16-f1075ng | |
| MSI Prestige 16 B1MG-001US | |
| Framework Laptop 16 | |
| Average AMD Ryzen 9 7940HS, AMD Radeon RX 7700S (n=1) | |
| Lenovo ThinkPad Z16 Gen 2 | |
| CrossMark / Creativity | |
| Apple MacBook Pro 16 2023 M3 Max | |
| Dell Inspiron 16 Plus 7630 | |
| MSI Prestige 16 B1MG-001US | |
| Framework Laptop 16 | |
| Average AMD Ryzen 9 7940HS, AMD Radeon RX 7700S (n=1) | |
| Lenovo ThinkPad Z16 Gen 2 | |
| HP Spectre x360 2-in-1 16-f1075ng | |
| CrossMark / Responsiveness | |
| HP Spectre x360 2-in-1 16-f1075ng | |
| Dell Inspiron 16 Plus 7630 | |
| MSI Prestige 16 B1MG-001US | |
| Apple MacBook Pro 16 2023 M3 Max | |
| Framework Laptop 16 | |
| Average AMD Ryzen 9 7940HS, AMD Radeon RX 7700S (n=1) | |
| Lenovo ThinkPad Z16 Gen 2 | |
| WebXPRT 3 / Overall | |
| Apple MacBook Pro 16 2023 M3 Max | |
| Framework Laptop 16 | |
| Average AMD Ryzen 9 7940HS, AMD Radeon RX 7700S (n=1) | |
| Lenovo ThinkPad Z16 Gen 2 | |
| Dell Inspiron 16 Plus 7630 | |
| MSI Prestige 16 B1MG-001US | |
| HP Spectre x360 2-in-1 16-f1075ng | |
| WebXPRT 4 / Overall | |
| Dell Inspiron 16 Plus 7630 | |
| Framework Laptop 16 | |
| Average AMD Ryzen 9 7940HS, AMD Radeon RX 7700S (n=1) | |
| MSI Prestige 16 B1MG-001US | |
| Lenovo ThinkPad Z16 Gen 2 | |
| HP Spectre x360 2-in-1 16-f1075ng | |
| Mozilla Kraken 1.1 / Total | |
| Lenovo ThinkPad Z16 Gen 2 | |
| MSI Prestige 16 B1MG-001US | |
| HP Spectre x360 2-in-1 16-f1075ng | |
| Dell Inspiron 16 Plus 7630 | |
| Framework Laptop 16 | |
| Average AMD Ryzen 9 7940HS, AMD Radeon RX 7700S (n=1) | |
| Apple MacBook Pro 16 2023 M3 Max | |
* ... smaller is better
| PCMark 10 Score | 8670 points | |
Help | ||
| AIDA64 / Memory Copy | |
| MSI Prestige 16 B1MG-001US | |
| Framework Laptop 16 | |
| Lenovo ThinkPad Z16 Gen 2 | |
| Average AMD Ryzen 9 7940HS (35327 - 78739, n=10) | |
| Dell Inspiron 16 Plus 7630 | |
| HP Spectre x360 2-in-1 16-f1075ng | |
| AIDA64 / Memory Read | |
| MSI Prestige 16 B1MG-001US | |
| Dell Inspiron 16 Plus 7630 | |
| Framework Laptop 16 | |
| Average AMD Ryzen 9 7940HS (30769 - 61836, n=10) | |
| Lenovo ThinkPad Z16 Gen 2 | |
| HP Spectre x360 2-in-1 16-f1075ng | |
| AIDA64 / Memory Write | |
| Lenovo ThinkPad Z16 Gen 2 | |
| Framework Laptop 16 | |
| Average AMD Ryzen 9 7940HS (42217 - 91567, n=10) | |
| MSI Prestige 16 B1MG-001US | |
| Dell Inspiron 16 Plus 7630 | |
| HP Spectre x360 2-in-1 16-f1075ng | |
| AIDA64 / Memory Latency | |
| MSI Prestige 16 B1MG-001US | |
| Lenovo ThinkPad Z16 Gen 2 | |
| Dell Inspiron 16 Plus 7630 | |
| Average AMD Ryzen 9 7940HS (87.6 - 111.1, n=10) | |
| Framework Laptop 16 | |
| HP Spectre x360 2-in-1 16-f1075ng | |
* ... smaller is better
DPC 延迟
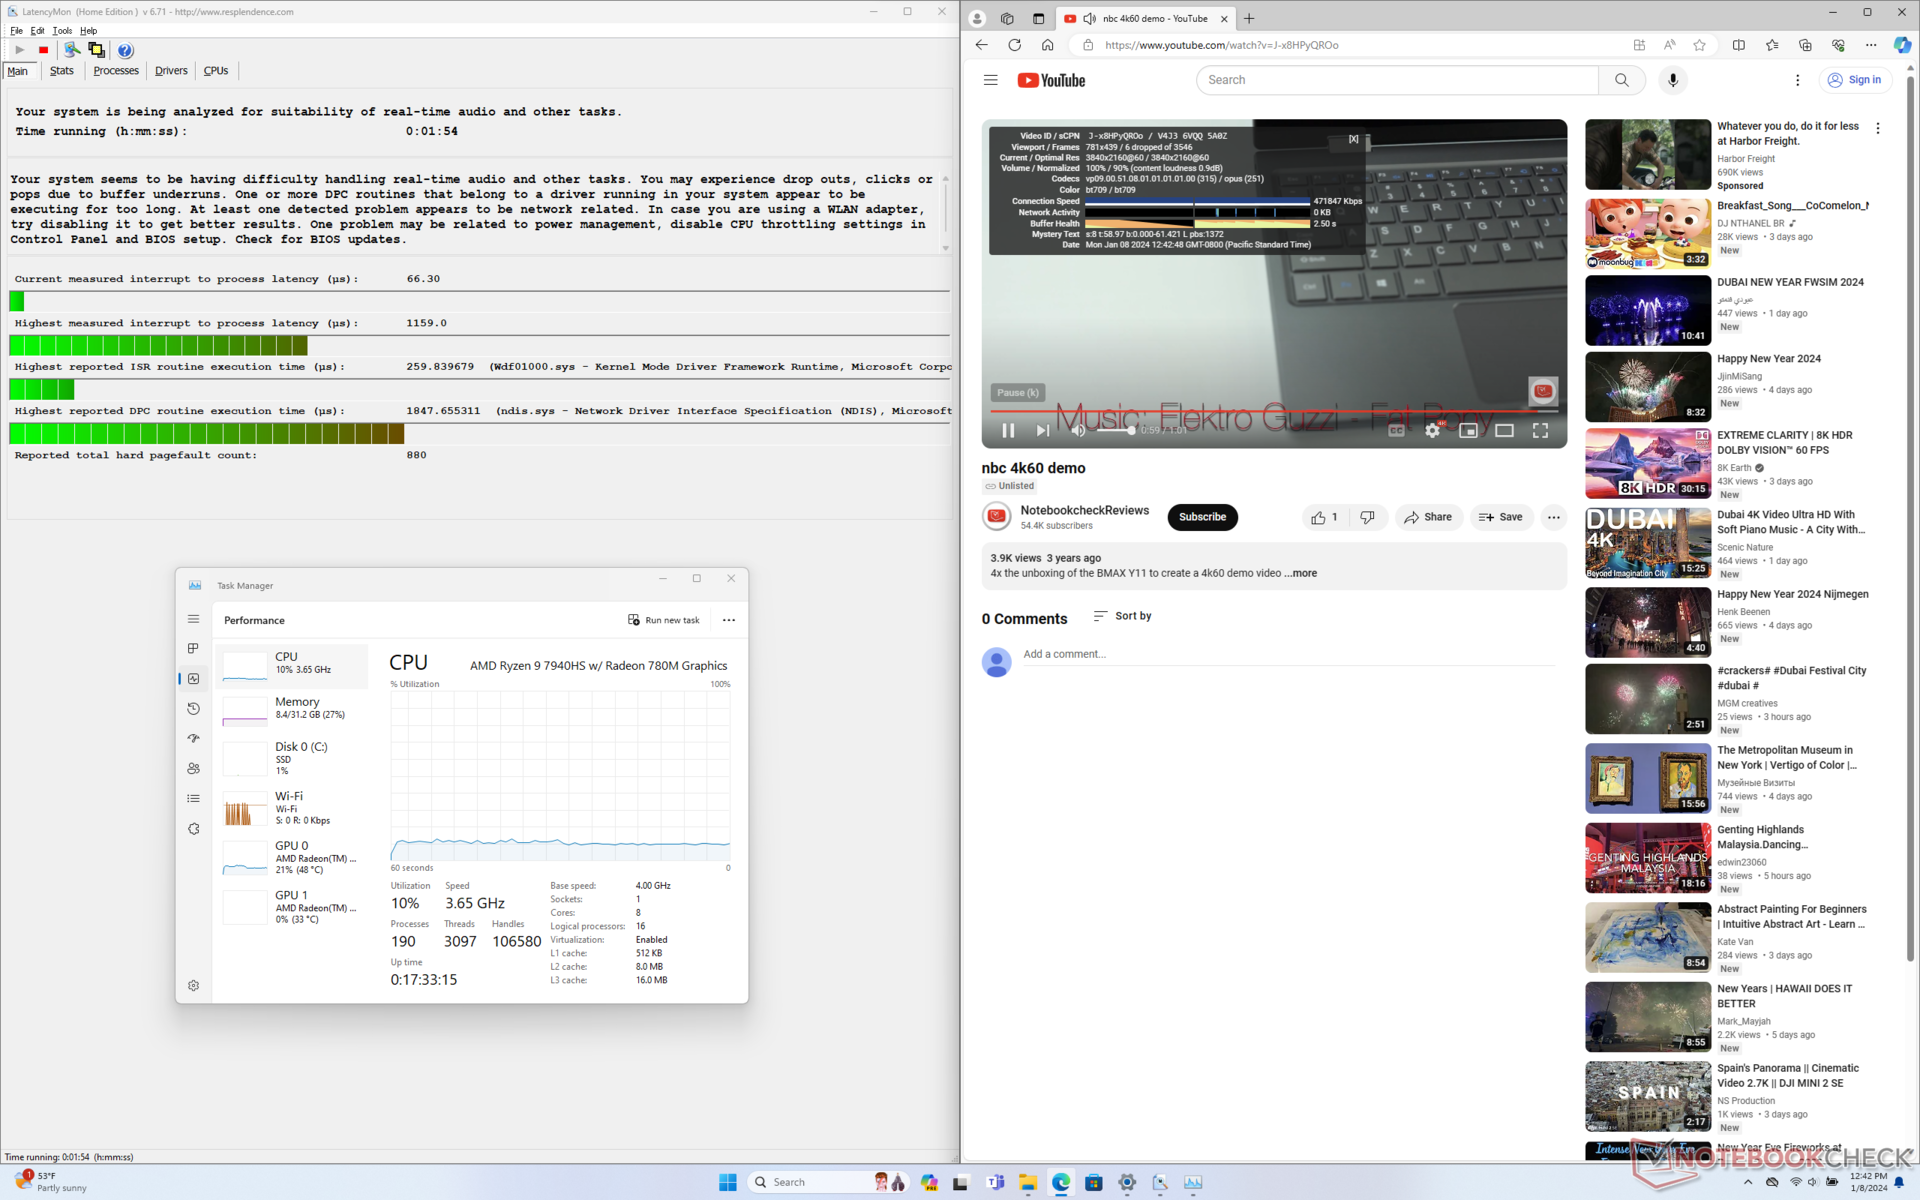
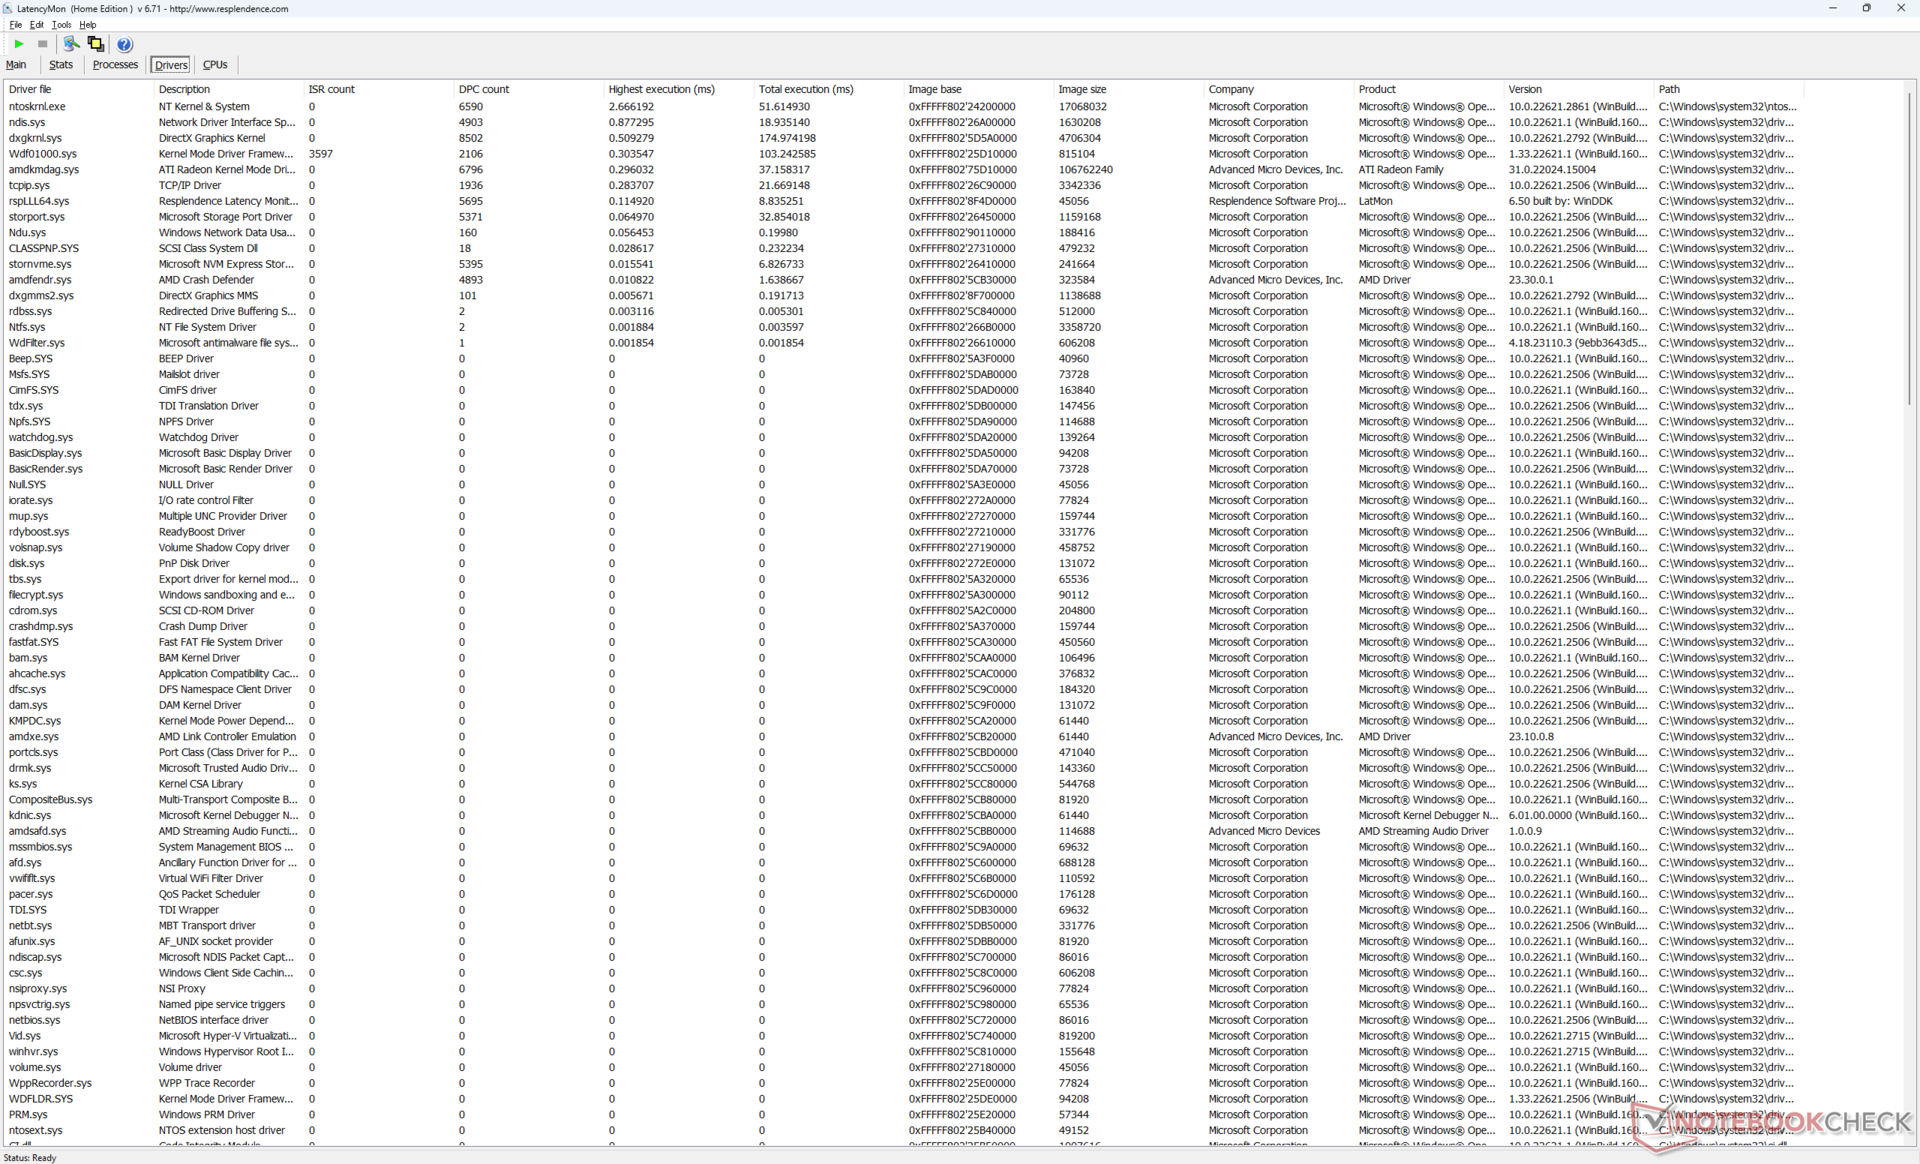
在打开主页的多个浏览器标签页时,LatencyMon 发现了 DPC 问题。此外,在播放 4K60 视频时,我们能在一分钟的时间跨度内记录到 6 次丢帧。每帧掉帧的发生时间几乎都是固定的,这表明潜在的驱动程序问题可能与 AMD GPU 有关。根据我们的经验,大多数基于英特尔的笔记本电脑都不会出现类似问题,在运行相同测试时更有可能完全不丢帧。
| DPC Latencies / LatencyMon - interrupt to process latency (max), Web, Youtube, Prime95 | |
| Lenovo ThinkPad Z16 Gen 2 | |
| Framework Laptop 16 | |
| HP Spectre x360 2-in-1 16-f1075ng | |
| Dell Inspiron 16 Plus 7630 | |
| MSI Prestige 16 B1MG-001US | |
* ... smaller is better
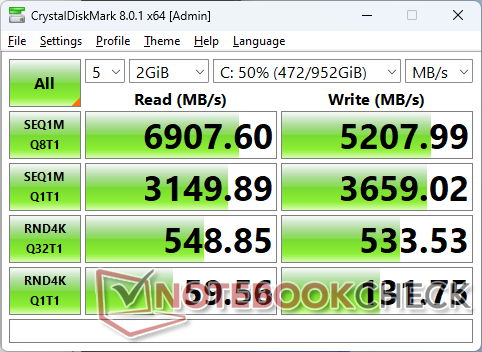
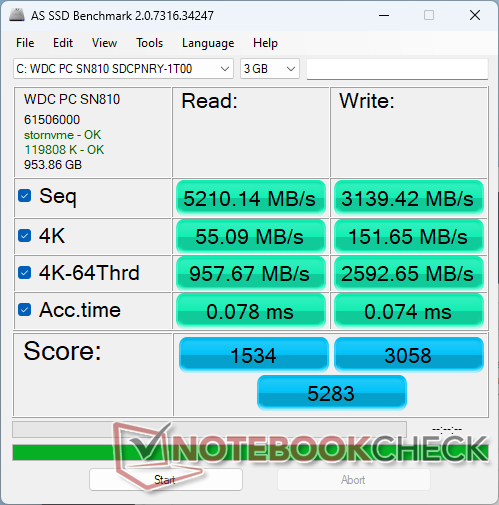
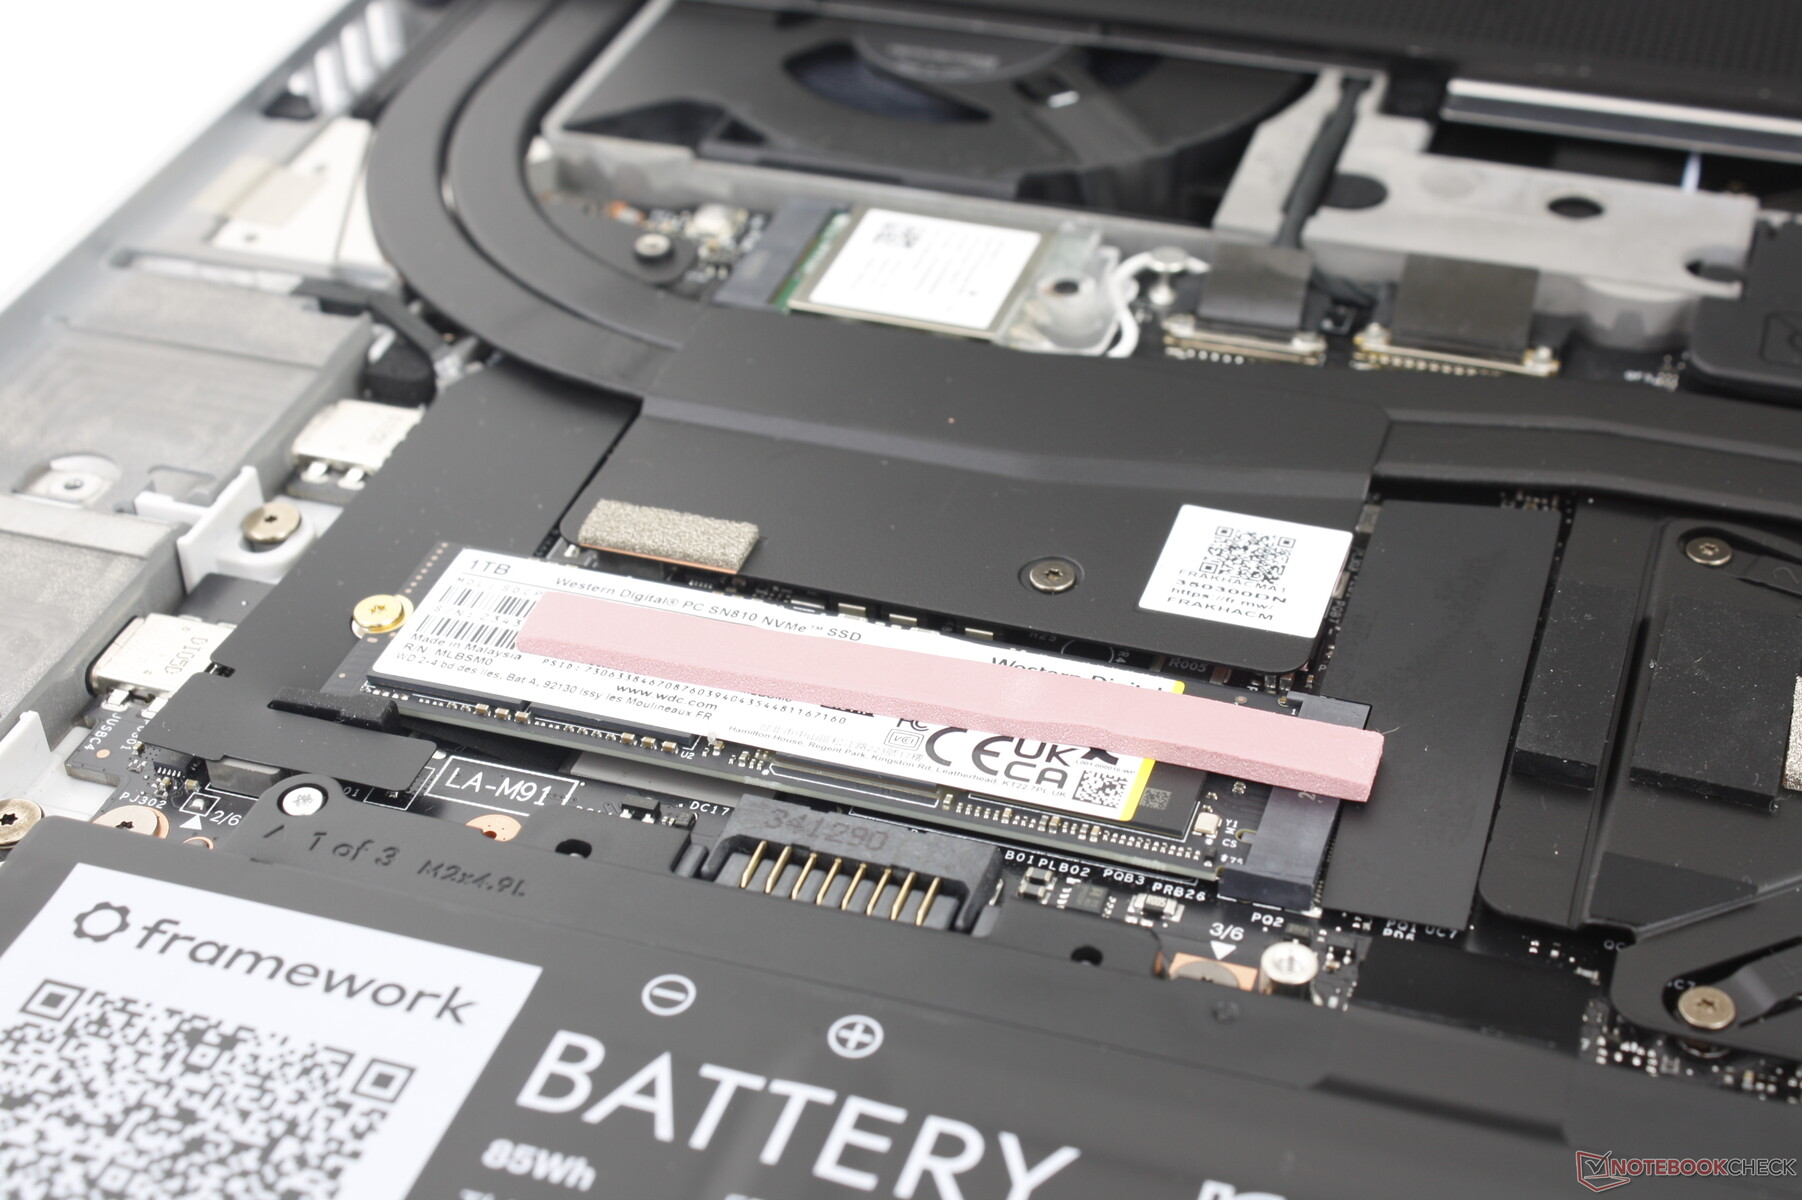
存储设备
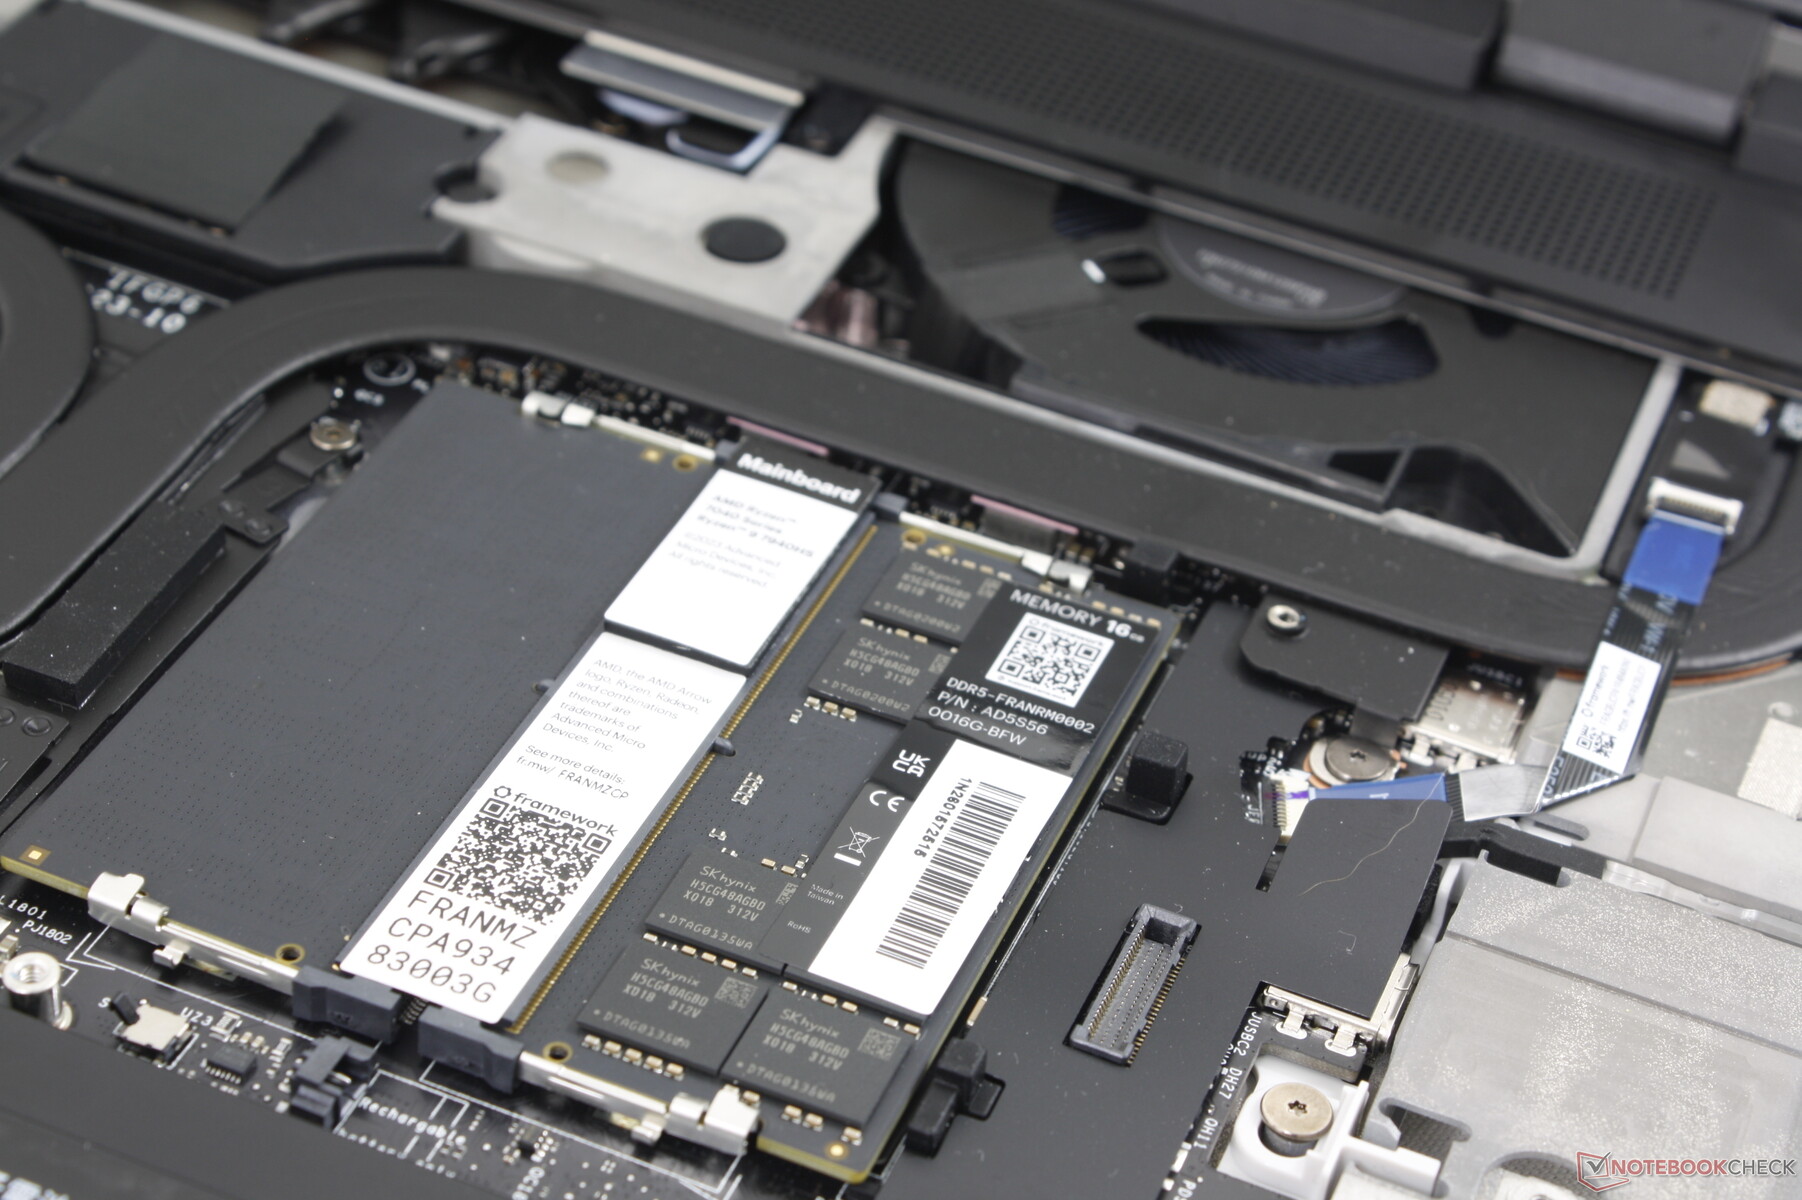
我们的测试设备配备了 西部数据 SN810PCIe4 x4 NVMe 固态硬盘,它是目前 Framework 13.5 上的 SN740 的升级版。与我们在惠普 Plus 14.5 上观察到的情况不同,该硬盘在长时间保持 ~7000 MB/s 的传输速率方面没有任何问题。 惠普Pavilion Plus 14与我们在配备相同西部数据固态硬盘的惠普 Plus 14 上观察到的情况不同。这表明,Framework 16 在设计时考虑到了更好的固态硬盘散热,以防止性能节流。

| Drive Performance rating - Percent | |
| MSI Prestige 16 B1MG-001US | |
| Average WDC PC SN810 1TB | |
| Framework Laptop 16 | |
| HP Spectre x360 2-in-1 16-f1075ng | |
| Lenovo ThinkPad Z16 Gen 2 | |
| Dell Inspiron 16 Plus 7630 | |
* ... smaller is better
Disk Throttling: DiskSpd Read Loop, Queue Depth 8
GPU 性能--RDNA 3 的救星
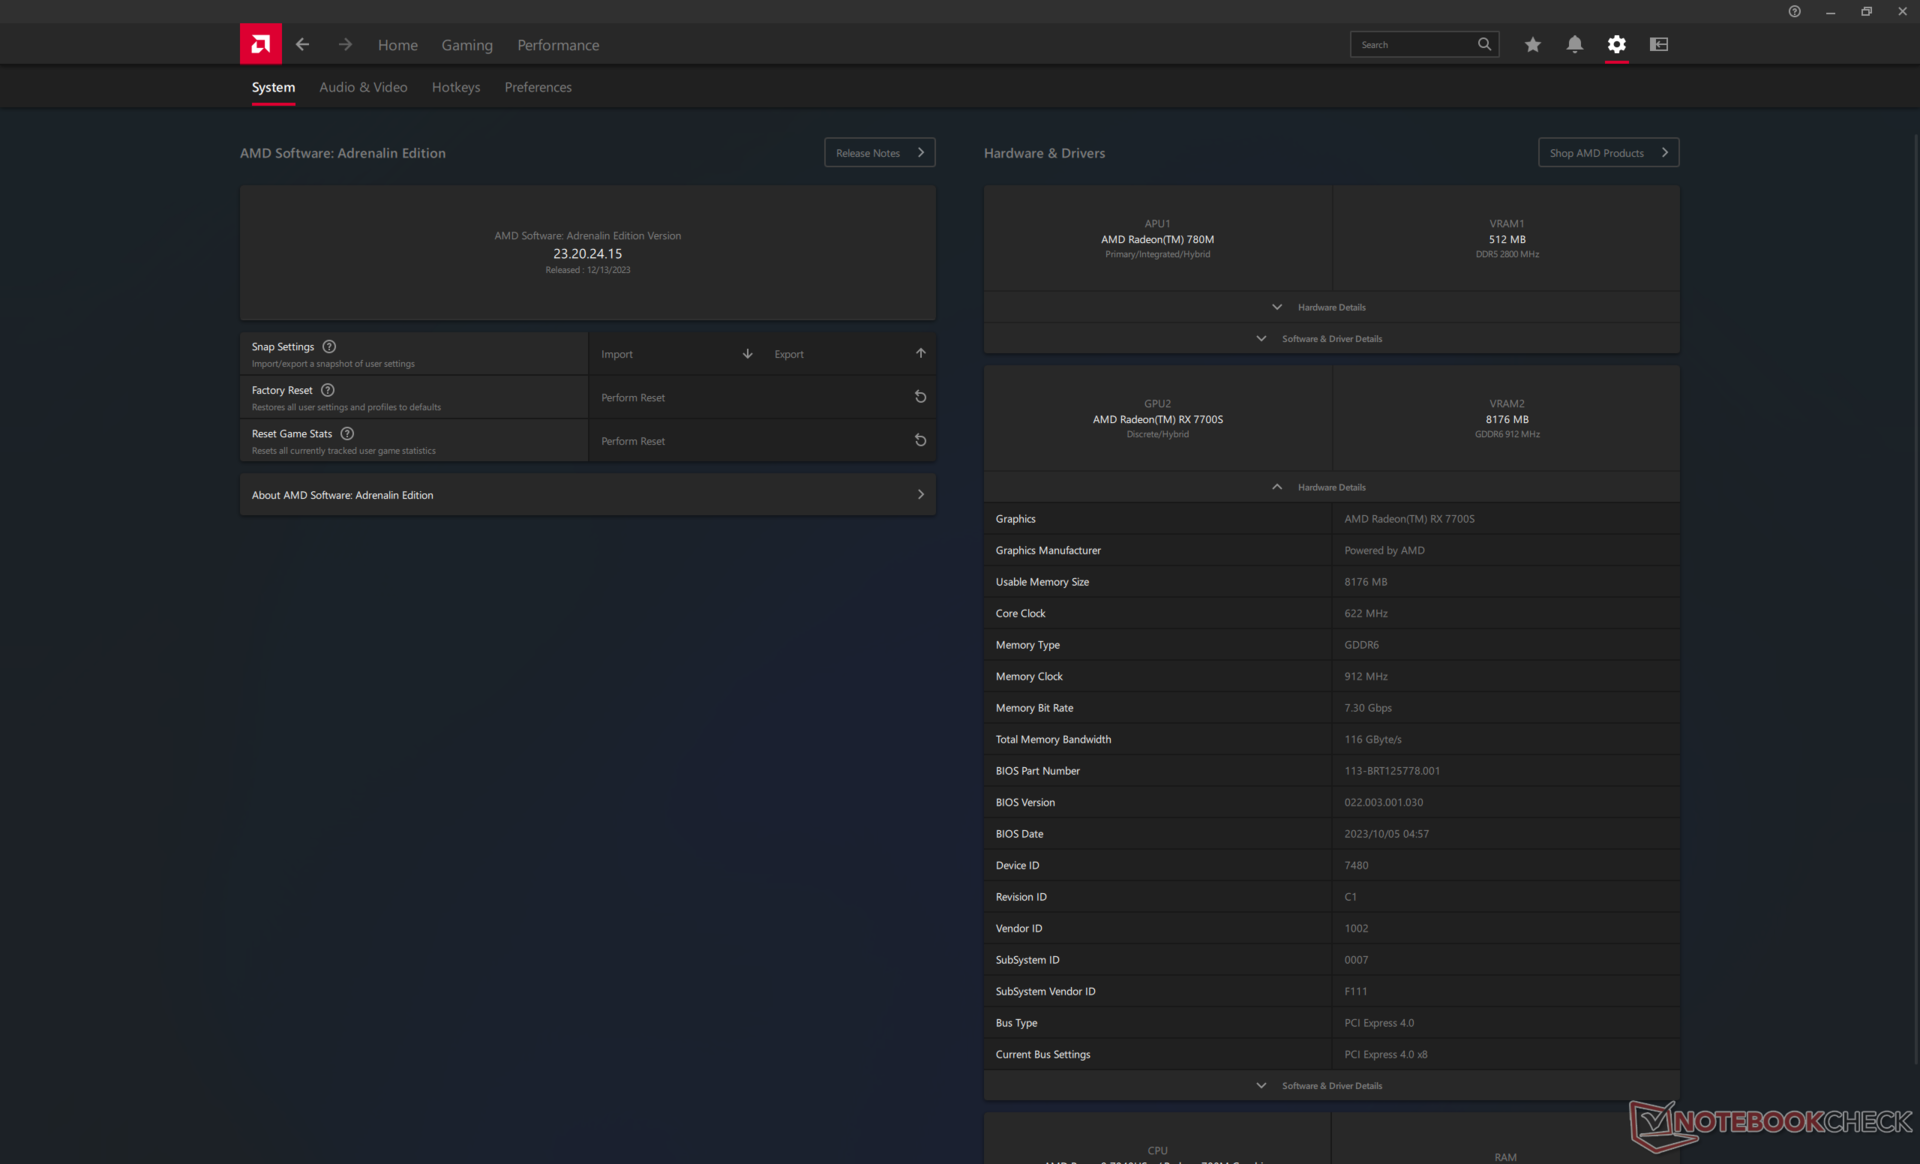
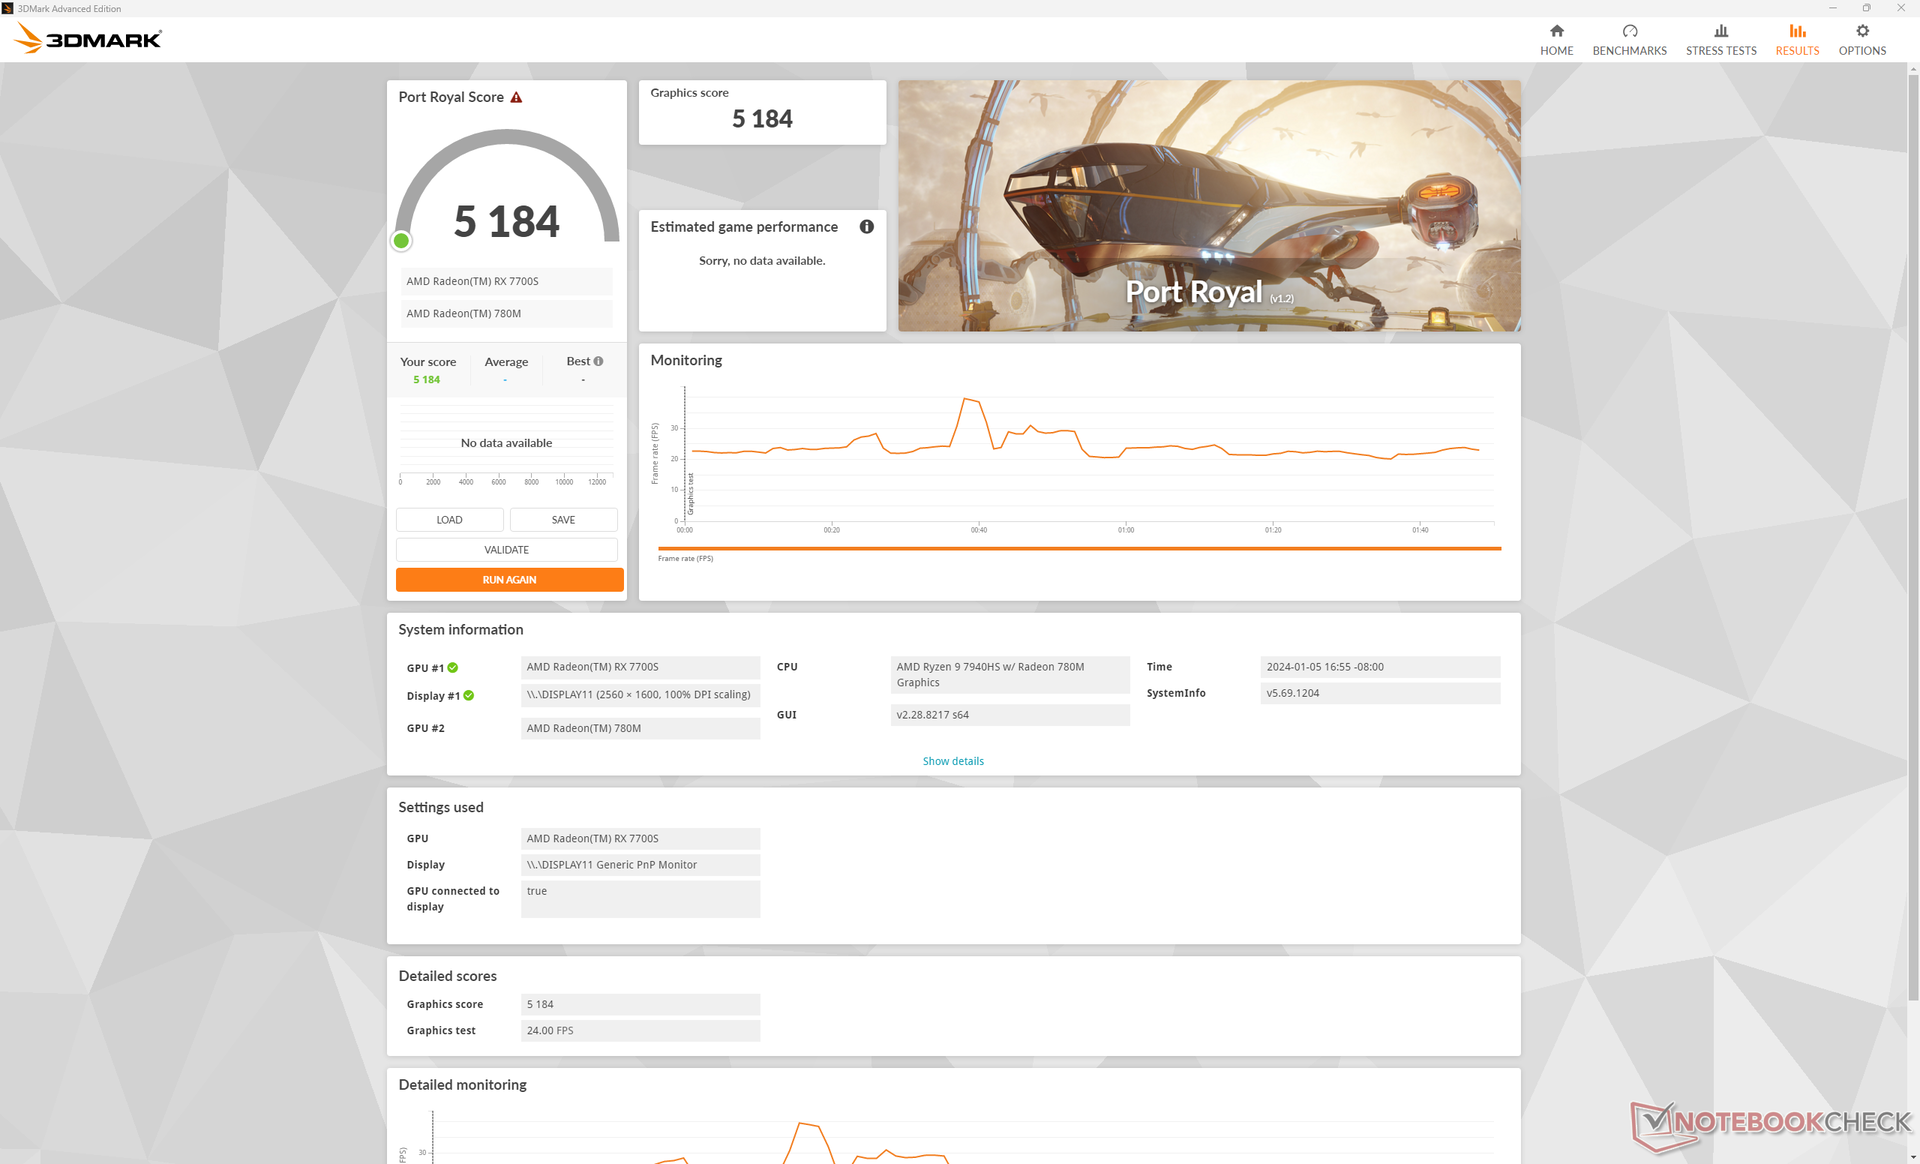
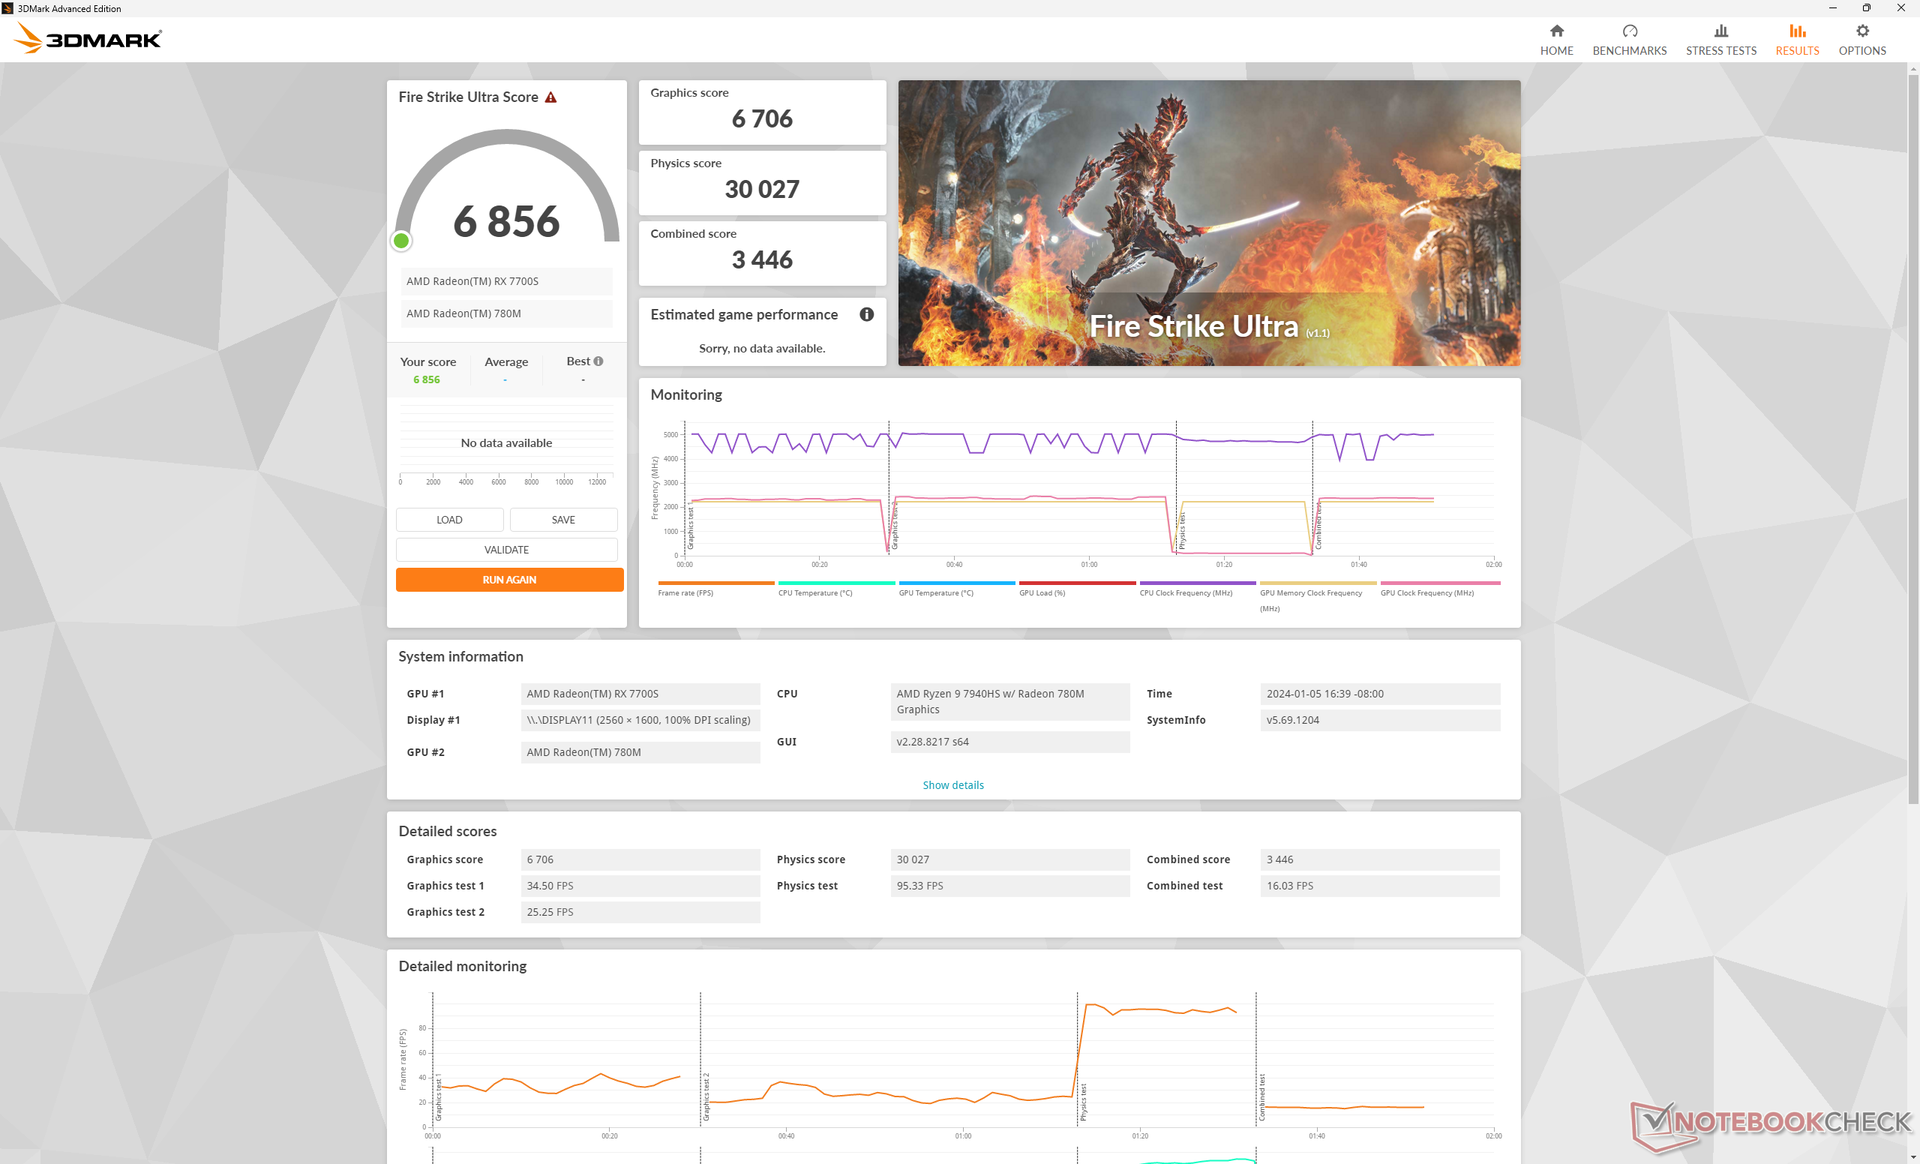
RDNA 3 Radeon RX 7700S直接接替了去年的 RDNA 2 Radeon RX 6700S.不过,除非游戏支持 DX12,否则更新的架构对性能的提升并不大;3DMarkFire Strike 的结果与两款 GPU 几乎相同,而Time Spy 的结果则比以前快 20% 至 25%。由于 RT 性能是旧版 RDNA 2 架构的薄弱环节,因此在 RT 性能方面可以看到更大的提升。整体性能与配备 GeForce RTX 4060图形处理器的 联想Legion Slim 7 16.
即使移除 dGPU,Radeon RX 780M Radeon RX 780MiGPU 仍然能够胜任多媒体任务。AMD GPU 仍是目前速度最快的 iGPU 解决方案之一,尽管最近被 英特尔 Arc 系列.
如下表Fire Strike 所示,在 Windows 平衡模式而非性能模式下运行似乎不会影响性能。使用电池供电将降低约 15% 的性能。
| 电源配置文件 | 图形得分 | 物理得分 | 综合得分 |
| 性能 | 24246 | 29487 | 10294 |
| 均衡 | 24125 (-0%) | 29101 (-0%) | 10389 (-0%) |
| 电池模式 | 20380 (-16%) | 25009 (-15%) | 6769 (-34%) |
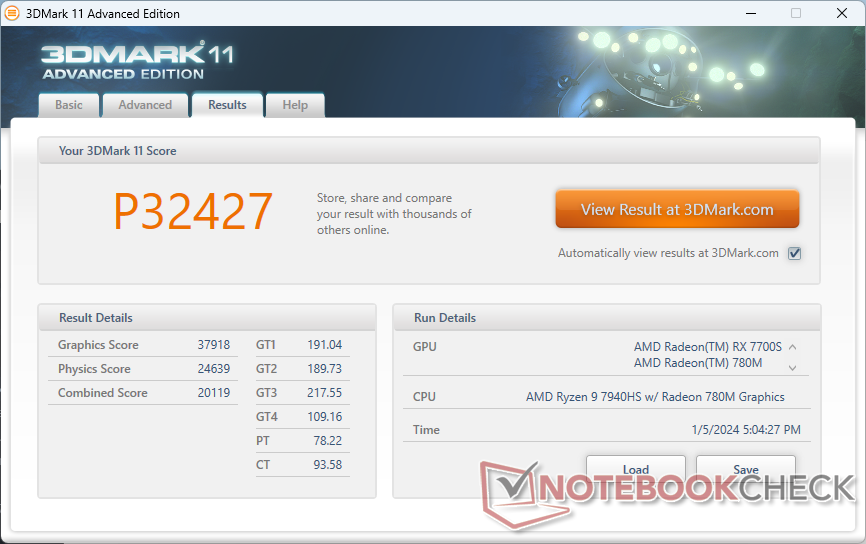
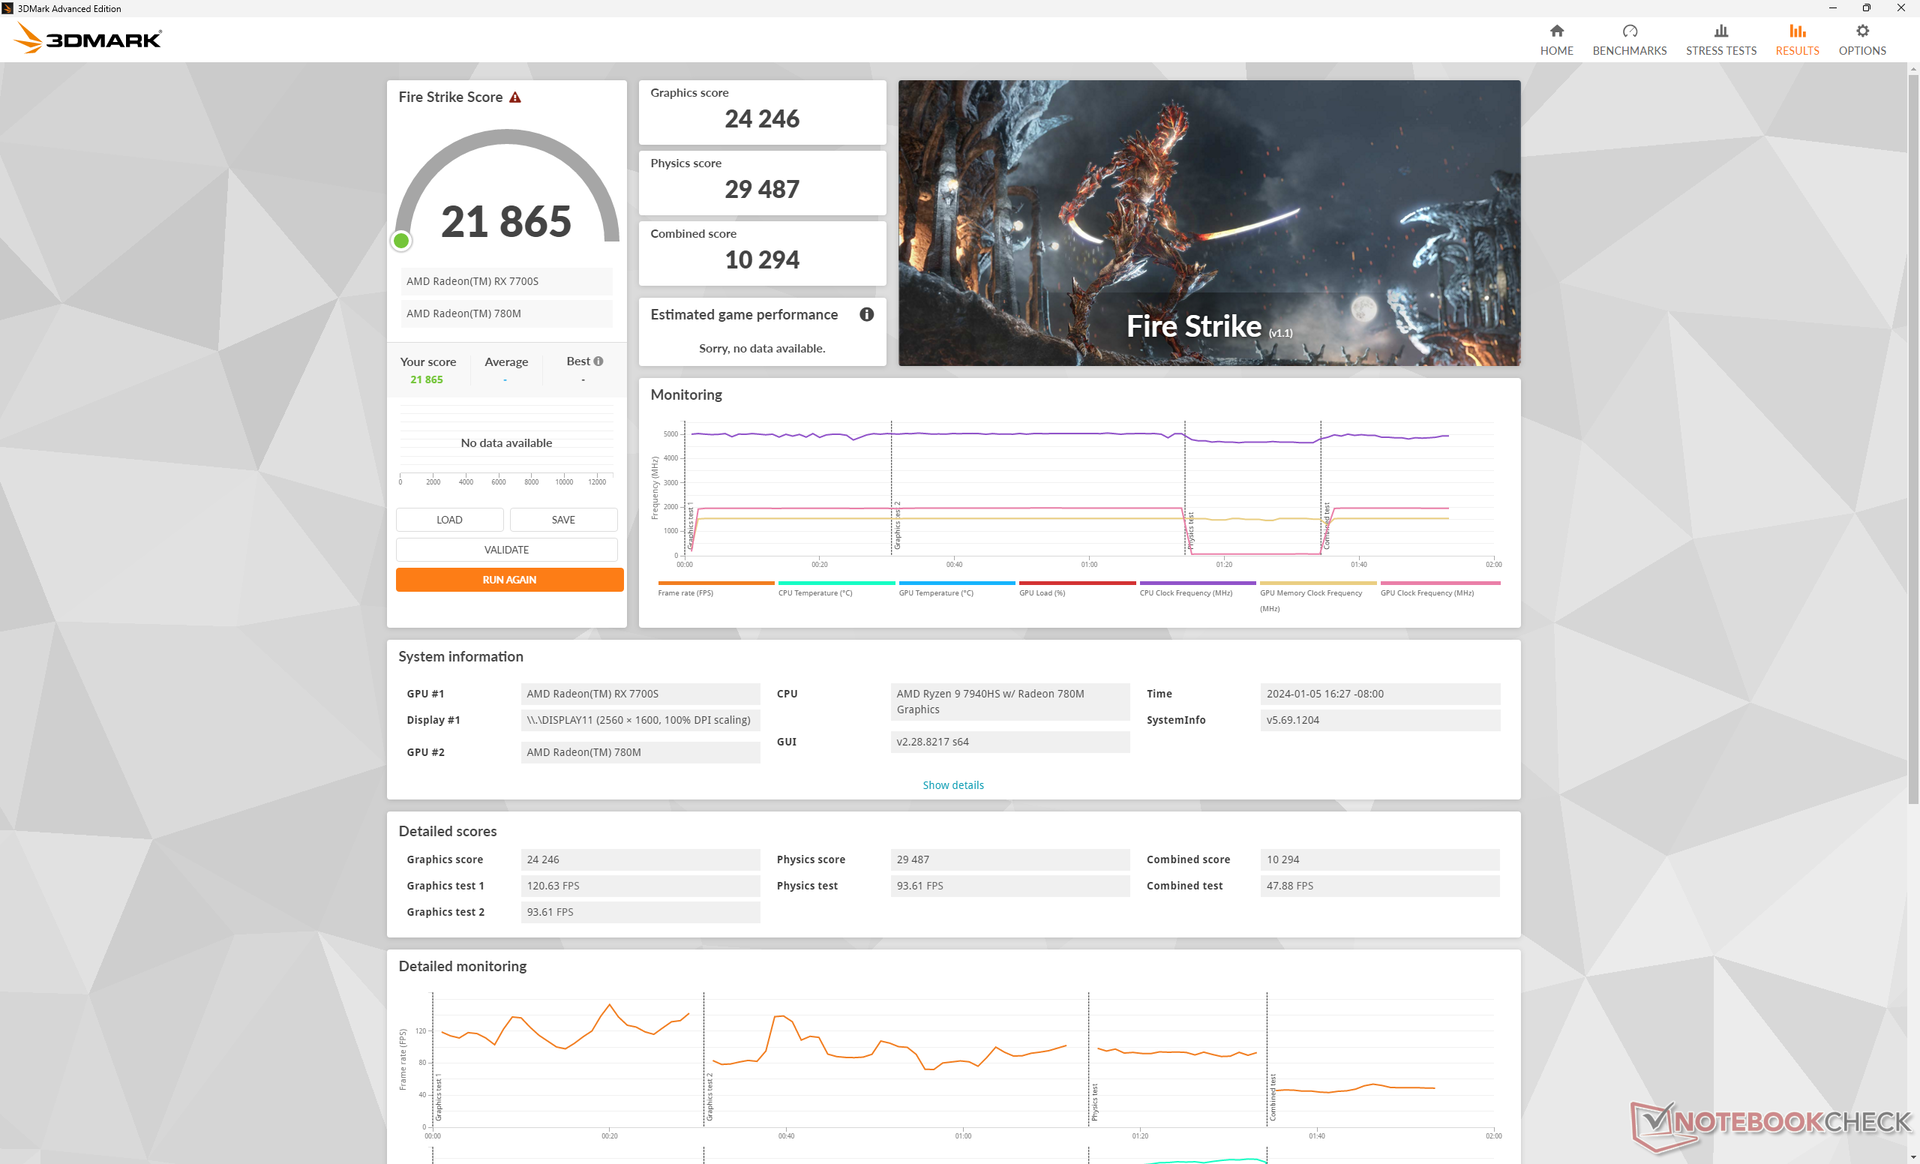
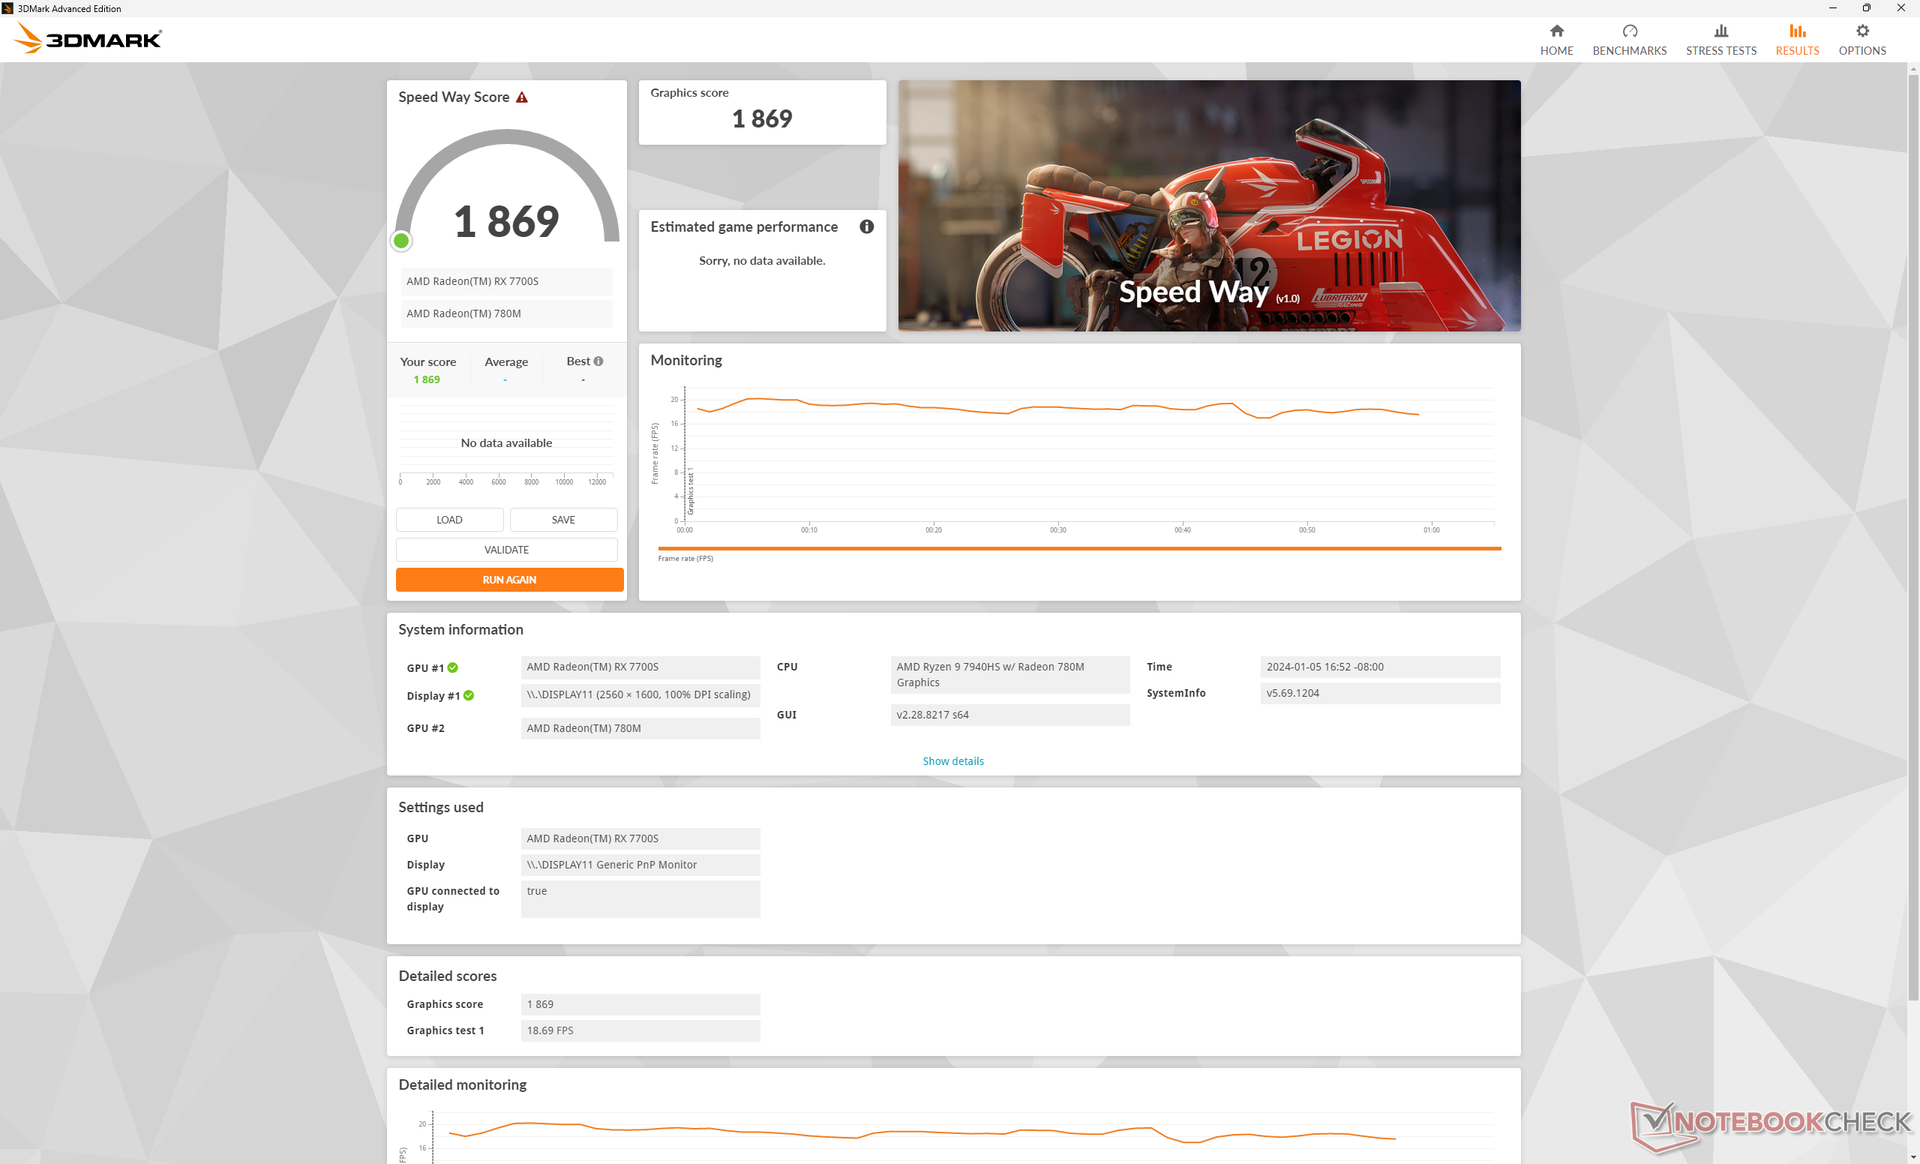
| 3DMark 11 Performance | 32427 points | |
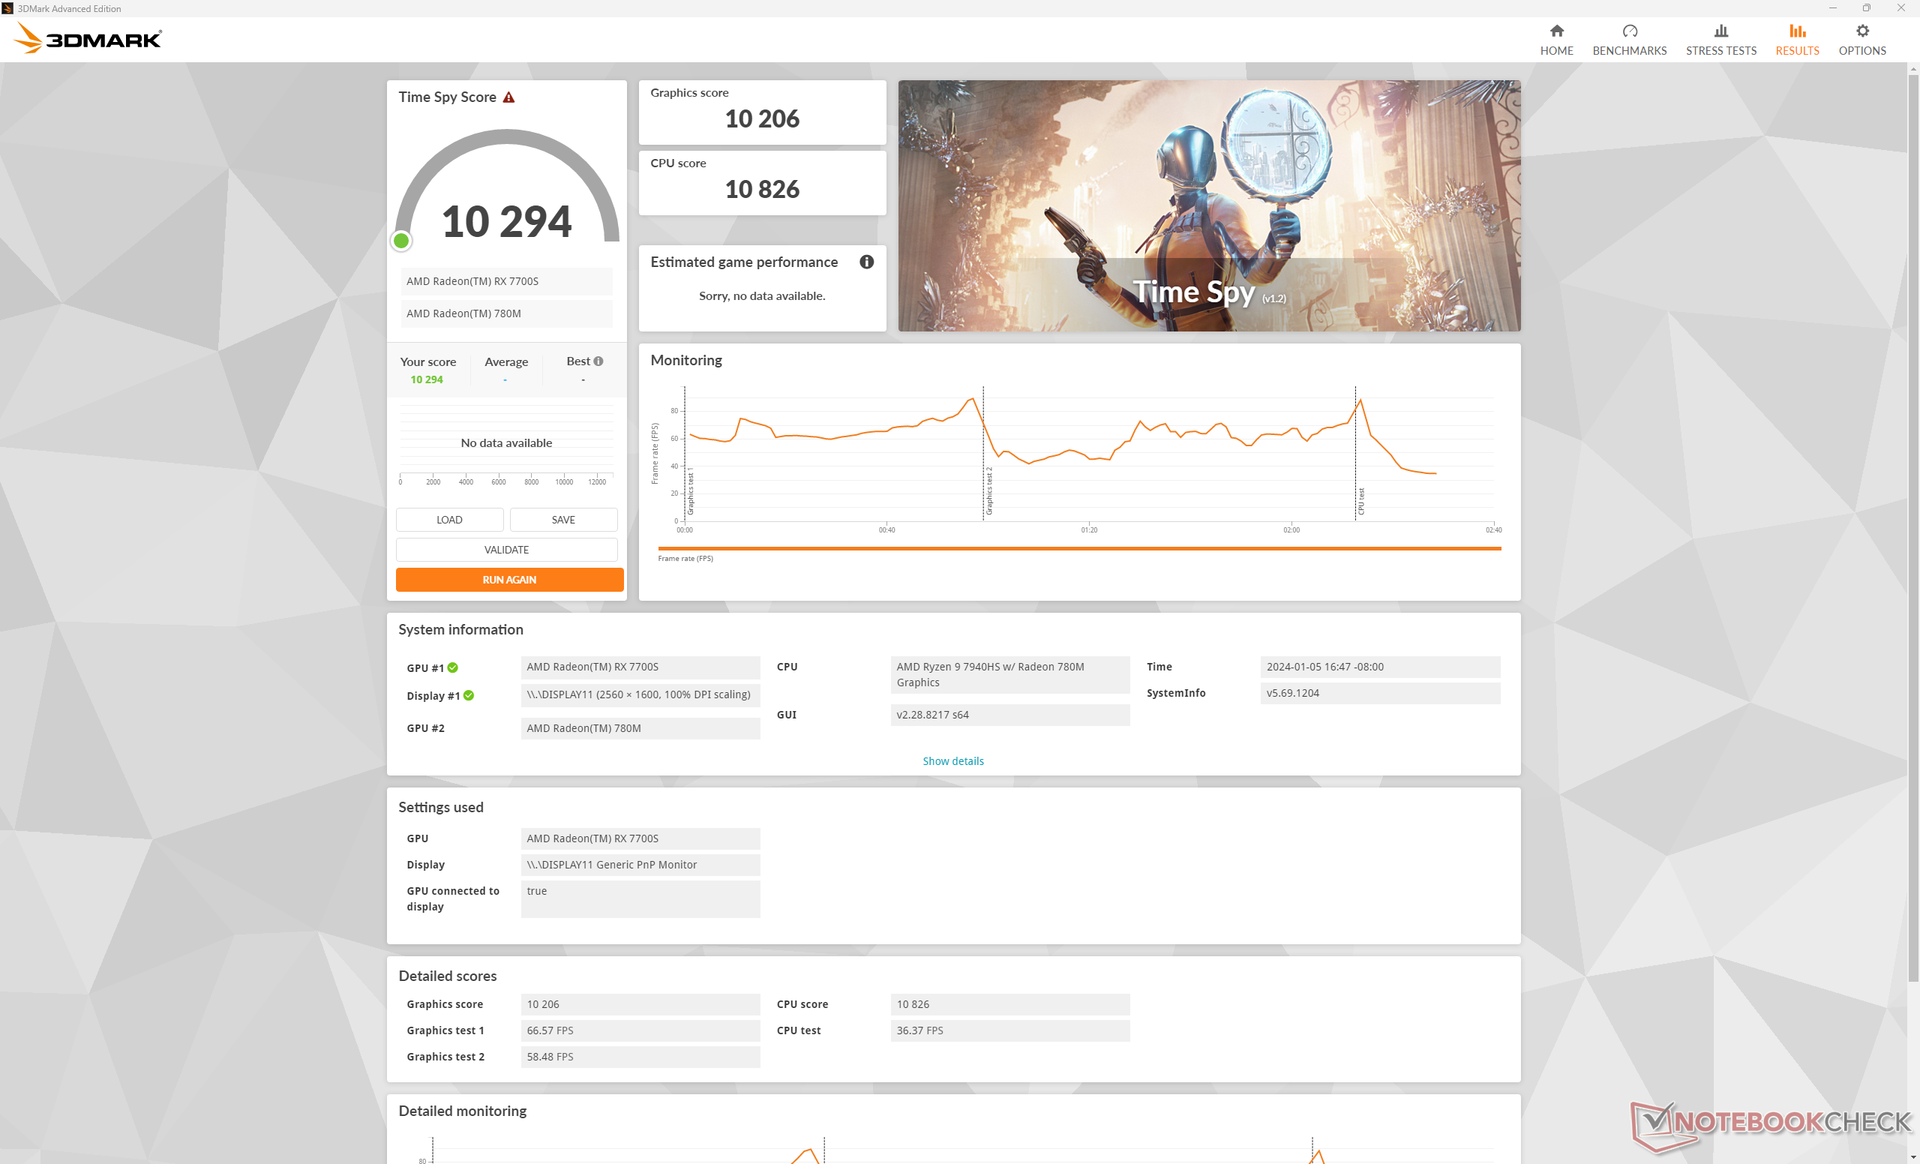
| 3DMark Fire Strike Score | 21865 points | |
| 3DMark Time Spy Score | 10294 points | |
Help | ||
* ... smaller is better
游戏性能
根据 TDP 的不同,100 W Radeon RX 7700S 的游戏性能要比移动GeForce RTX 4060 差 10%到 30%。例如,戴尔 Inspiron 16 Plus 7630 的性能更接近于 60 W RTX 4060。 戴尔 Inspiron 16 Plus 7630而 140 W RTX 4060 的性能则会远远超过我们的 Radeon。因此,预计游戏性能将介于 移动 RTX 4050和移动 RTX 4060 之间。
在大多数测试游戏中,其性能也将略快于去年的 Radeon RX 6700S。正如 3DMark 所预测的那样,启用 RT 时的性能提升最大。例如,当《 F1 22》的 RT 设置激活时,其运行速度将比之前快 30% 至 40%,而关闭 RT 设置时,其运行速度仅提高 5% 至 15%。
| Baldur's Gate 3 | |
| 1920x1080 High Preset AA:T | |
| Alienware m18 R1 AMD | |
| Lenovo Legion Slim 7 16APH8 | |
| Framework Laptop 16 | |
| Average AMD Radeon RX 7700S (n=1) | |
| Lenovo ThinkPad Z16 Gen 2 | |
| MSI Prestige 16 B1MG-001US | |
| 1920x1080 Ultra Preset AA:T | |
| Alienware m18 R1 AMD | |
| Lenovo Legion Slim 7 16APH8 | |
| Framework Laptop 16 | |
| Average AMD Radeon RX 7700S (n=1) | |
| Lenovo ThinkPad Z16 Gen 2 | |
| MSI Prestige 16 B1MG-001US | |
| 2560x1440 Ultra Preset AA:T | |
| Alienware m18 R1 AMD | |
| Lenovo Legion Slim 7 16APH8 | |
| Framework Laptop 16 | |
| Average AMD Radeon RX 7700S (n=1) | |
| Lenovo ThinkPad Z16 Gen 2 | |
| 3840x2160 Ultra Preset AA:T | |
| Alienware m18 R1 AMD | |
| Framework Laptop 16 | |
| Average AMD Radeon RX 7700S (n=1) | |
Witcher 3 FPS Chart
| low | med. | high | ultra | QHD | 4K | |
|---|---|---|---|---|---|---|
| GTA V (2015) | 184 | 178.6 | 170.6 | 95.8 | 67.1 | 68.4 |
| The Witcher 3 (2015) | 392.2 | 277.5 | 147.1 | 84 | 43 | |
| Dota 2 Reborn (2015) | 174 | 159.8 | 156.5 | 136.8 | 85.3 | |
| Final Fantasy XV Benchmark (2018) | 206 | 106 | 74.8 | 54.5 | 29 | |
| X-Plane 11.11 (2018) | 97.6 | 79.3 | 65 | 46.8 | ||
| Far Cry 5 (2018) | 148 | 130 | 123 | 117 | 81 | 39 |
| Strange Brigade (2018) | 449 | 202 | 167.4 | 143.9 | 91.9 | 47.9 |
| Tiny Tina's Wonderlands (2022) | 183.5 | 140.4 | 92 | 71.2 | 47.3 | 23.1 |
| F1 22 (2022) | 251 | 221 | 168 | 47.7 | 29.9 | 11.3 |
| Baldur's Gate 3 (2023) | 106.8 | 88 | 76.4 | 73.6 | 51.1 | 24.7 |
| Cyberpunk 2077 (2023) | 100.7 | 80.5 | 68.1 | 60.7 | 37.3 | 15.8 |
在 Ultra Witcher 3超级设置下的每瓦性能与台式机GeForce RTX 4070 Ti 或 RTX 4080 相当。因此,尽管 RDNA 3 GPU 的性能远不及 Nvidia 最快的 GPU,但它至少是高效的。与此同时,更具竞争力的移动 RTX 4060 的效率仍然高出约 30%,而且在运行支持 RT 的游戏时,Nvidia 的优势只会更大。
排放量
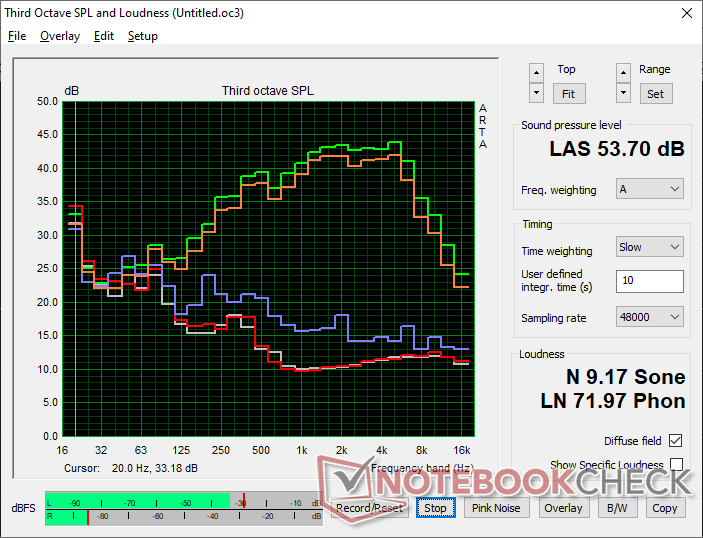
系统噪音 - 负载时很响
风扇噪音很好地涵盖了两个极端,即在运行要求不高的负载时非常安静,而在运行要求较高的负载(如游戏)时则非常响亮。例如,在简单浏览或视频流媒体时,风扇噪音往往徘徊在 28.5 dB(A)左右,而安静的背景噪音为 23.8 dB(A),基本听不到。然而,当运行Witcher 3 时,风扇噪音可达到近 52 dB(A),与竞争对手 Inspiron 16 Plus 或一些游戏笔记本电脑(如 Razer Blade 16.
Noise level
| Idle |
| 23.9 / 23.9 / 23.9 dB(A) |
| Load |
| 28.5 / 53.7 dB(A) |
 | ||
30 dB silent 40 dB(A) audible 50 dB(A) loud |
||
min: | ||
| Framework Laptop 16 Radeon RX 7700S, R9 7940HS, WDC PC SN810 1TB | MSI Prestige 16 B1MG-001US Arc 8-Core, Ultra 7 155H, Samsung PM9A1 MZVL22T0HBLB | Lenovo ThinkPad Z16 Gen 2 Radeon RX 6550M, R9 PRO 7940HS, Kioxia XG8 KXG8AZNV1T02 | Apple MacBook Pro 16 2023 M3 Max M3 Max 40-Core GPU, Apple M3 Max 16-Core, Apple SSD AP8192Z | Dell Inspiron 16 Plus 7630 GeForce RTX 4060 Laptop GPU, i7-13700H, WD PC SN740 SDDPTQD-1T00 | HP Spectre x360 2-in-1 16-f1075ng Iris Xe G7 96EUs, i7-12700H, SK Hynix PC711 1TB HFS001TDE9X073N | |
|---|---|---|---|---|---|---|
| Noise | -6% | -5% | -0% | -1% | -6% | |
| off / environment * (dB) | 23.8 | 24.5 -3% | 22.6 5% | 23.7 -0% | 23.2 3% | 26 -9% |
| Idle Minimum * (dB) | 23.9 | 24.5 -3% | 22.9 4% | 23.7 1% | 23.2 3% | 26 -9% |
| Idle Average * (dB) | 23.9 | 26.3 -10% | 29.4 -23% | 23.7 1% | 23.2 3% | 26 -9% |
| Idle Maximum * (dB) | 23.9 | 26.3 -10% | 29.4 -23% | 23.7 1% | 23.2 3% | 26 -9% |
| Load Average * (dB) | 28.5 | 36.5 -28% | 29.5 -4% | 40.8 -43% | 35.1 -23% | 42.9 -51% |
| Witcher 3 ultra * (dB) | 51.9 | 46.3 11% | 52 -0% | 42.8 18% | 52.5 -1% | 42.9 17% |
| Load Maximum * (dB) | 53.7 | 52.9 1% | 52 3% | 42.8 20% | 52.5 2% | 39.1 27% |
* ... smaller is better
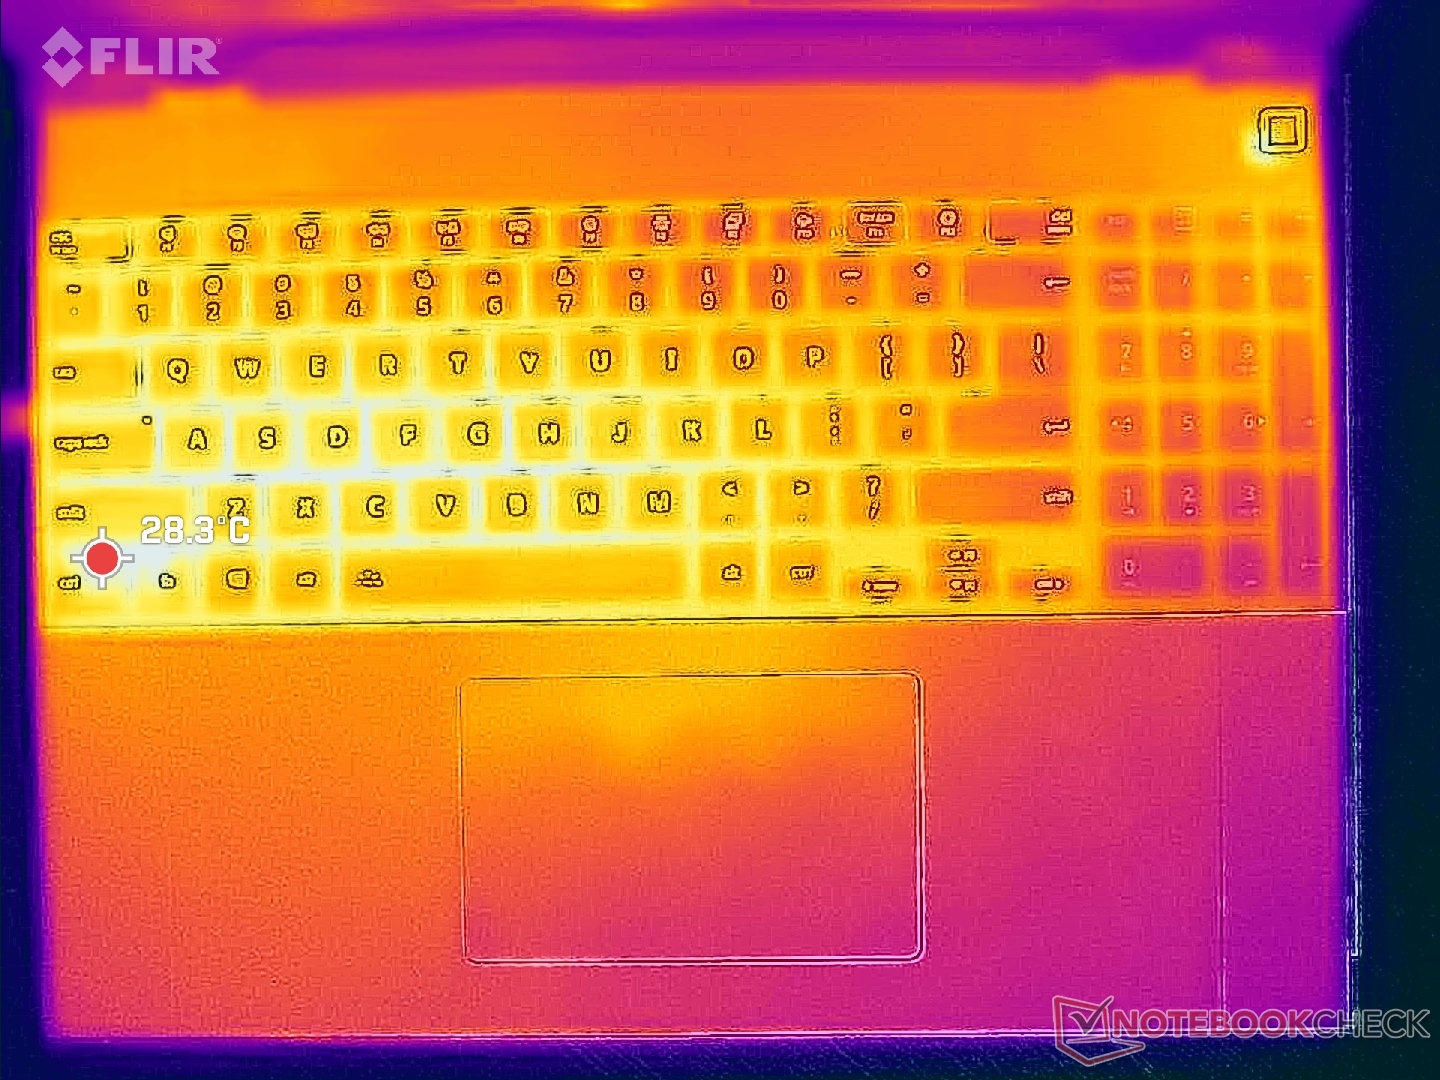
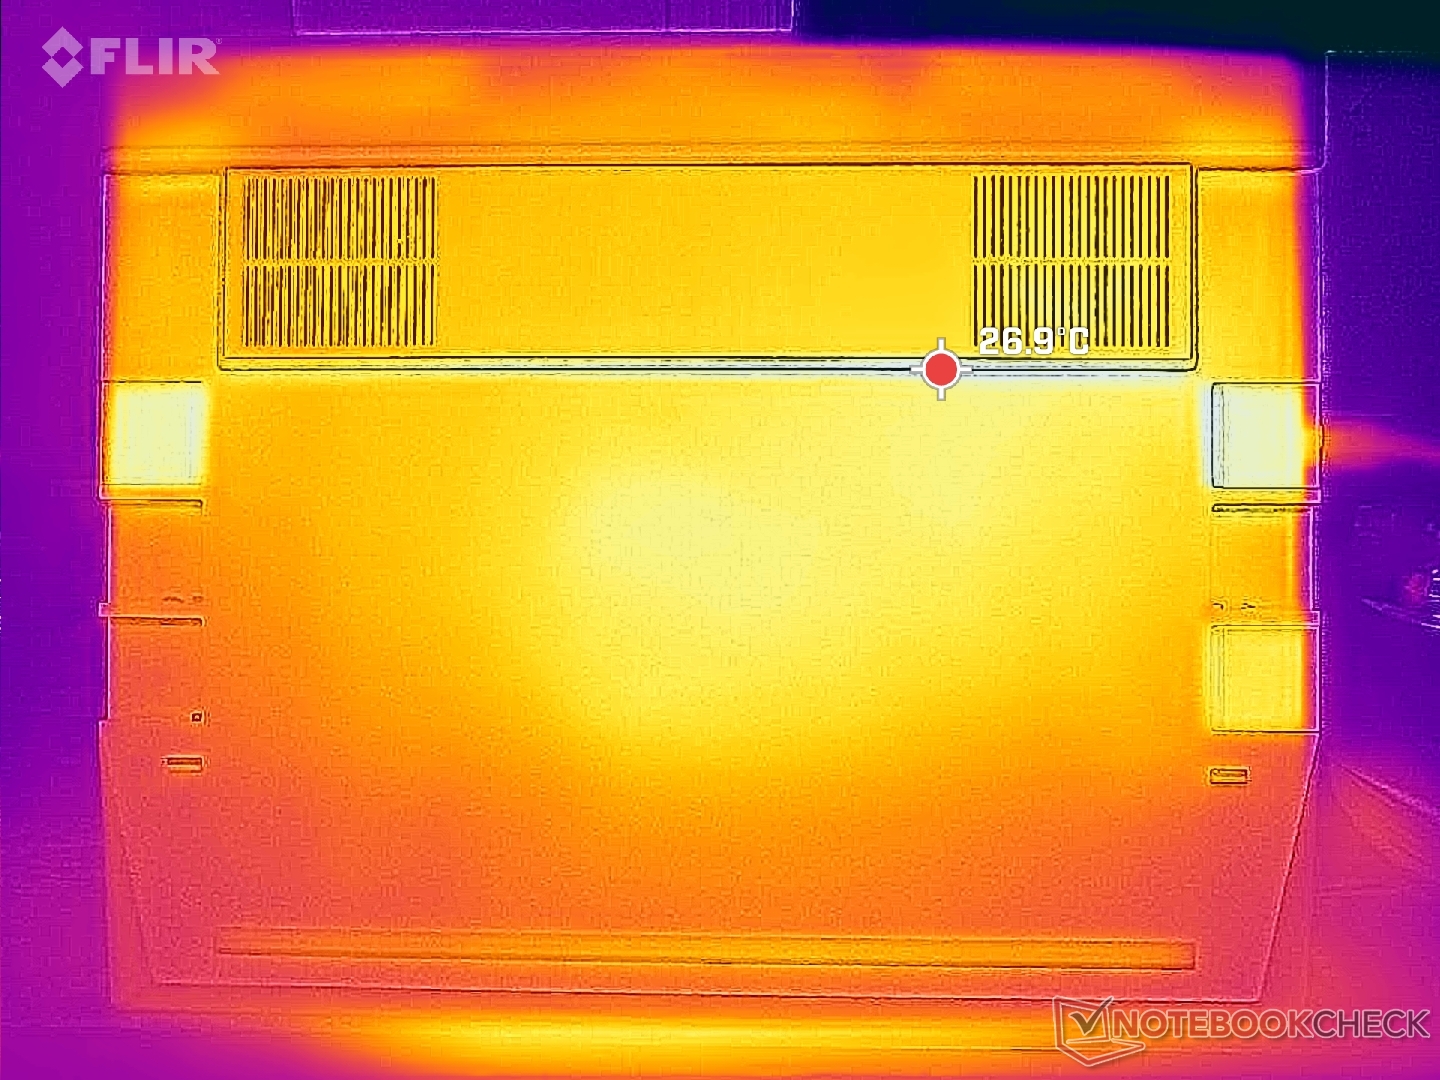
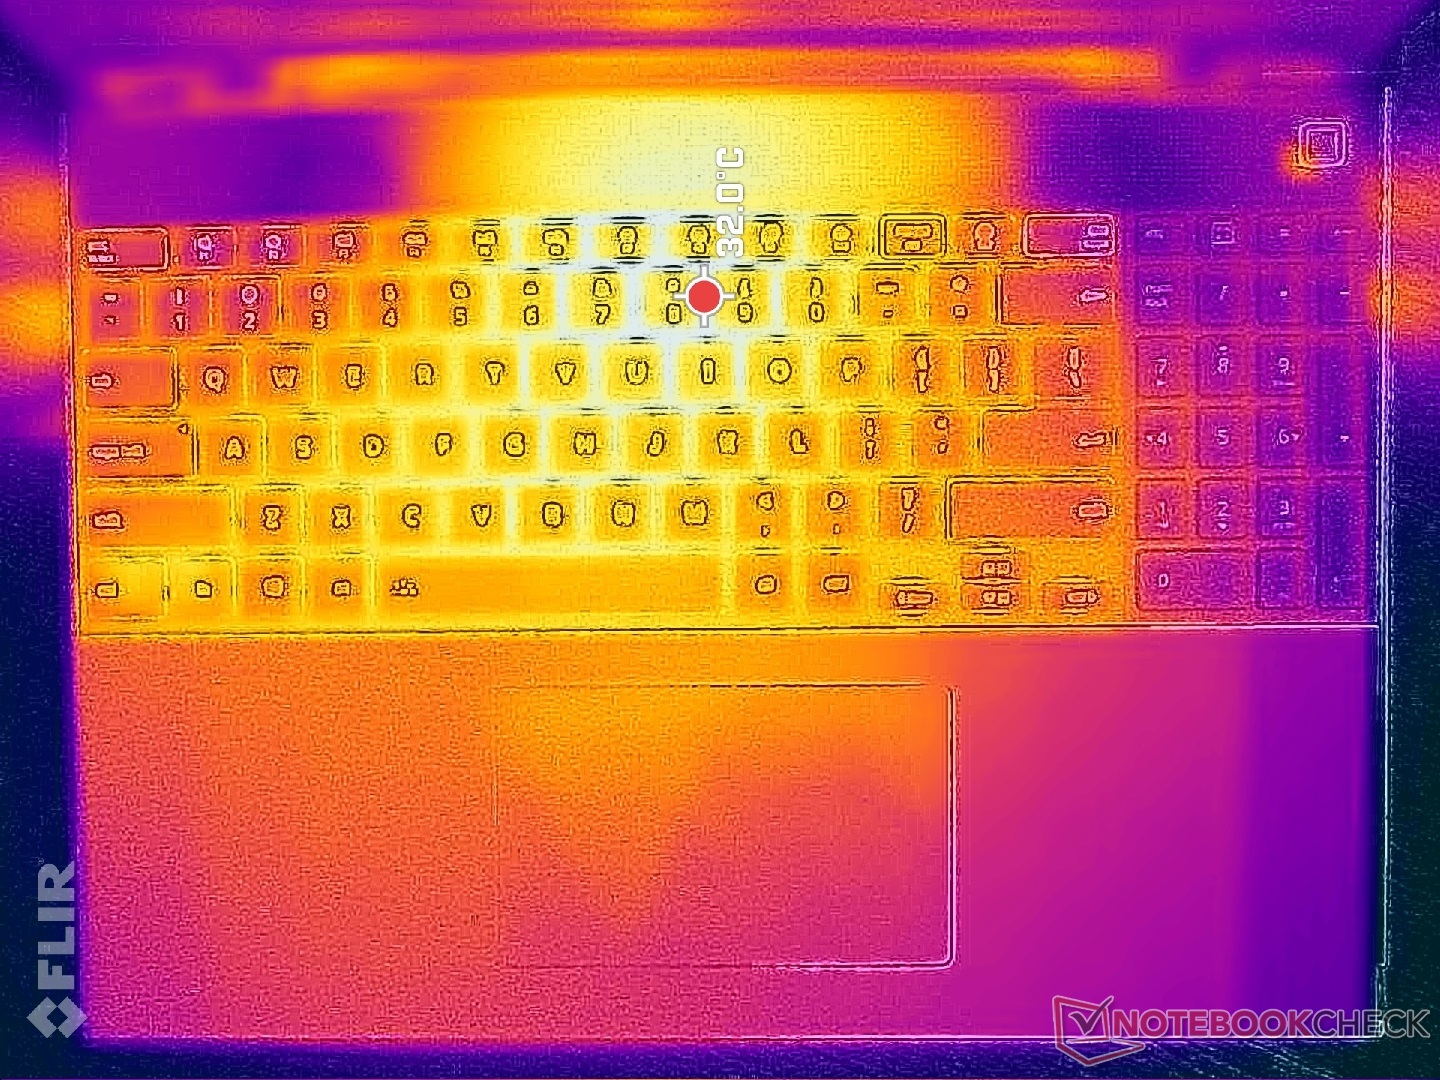
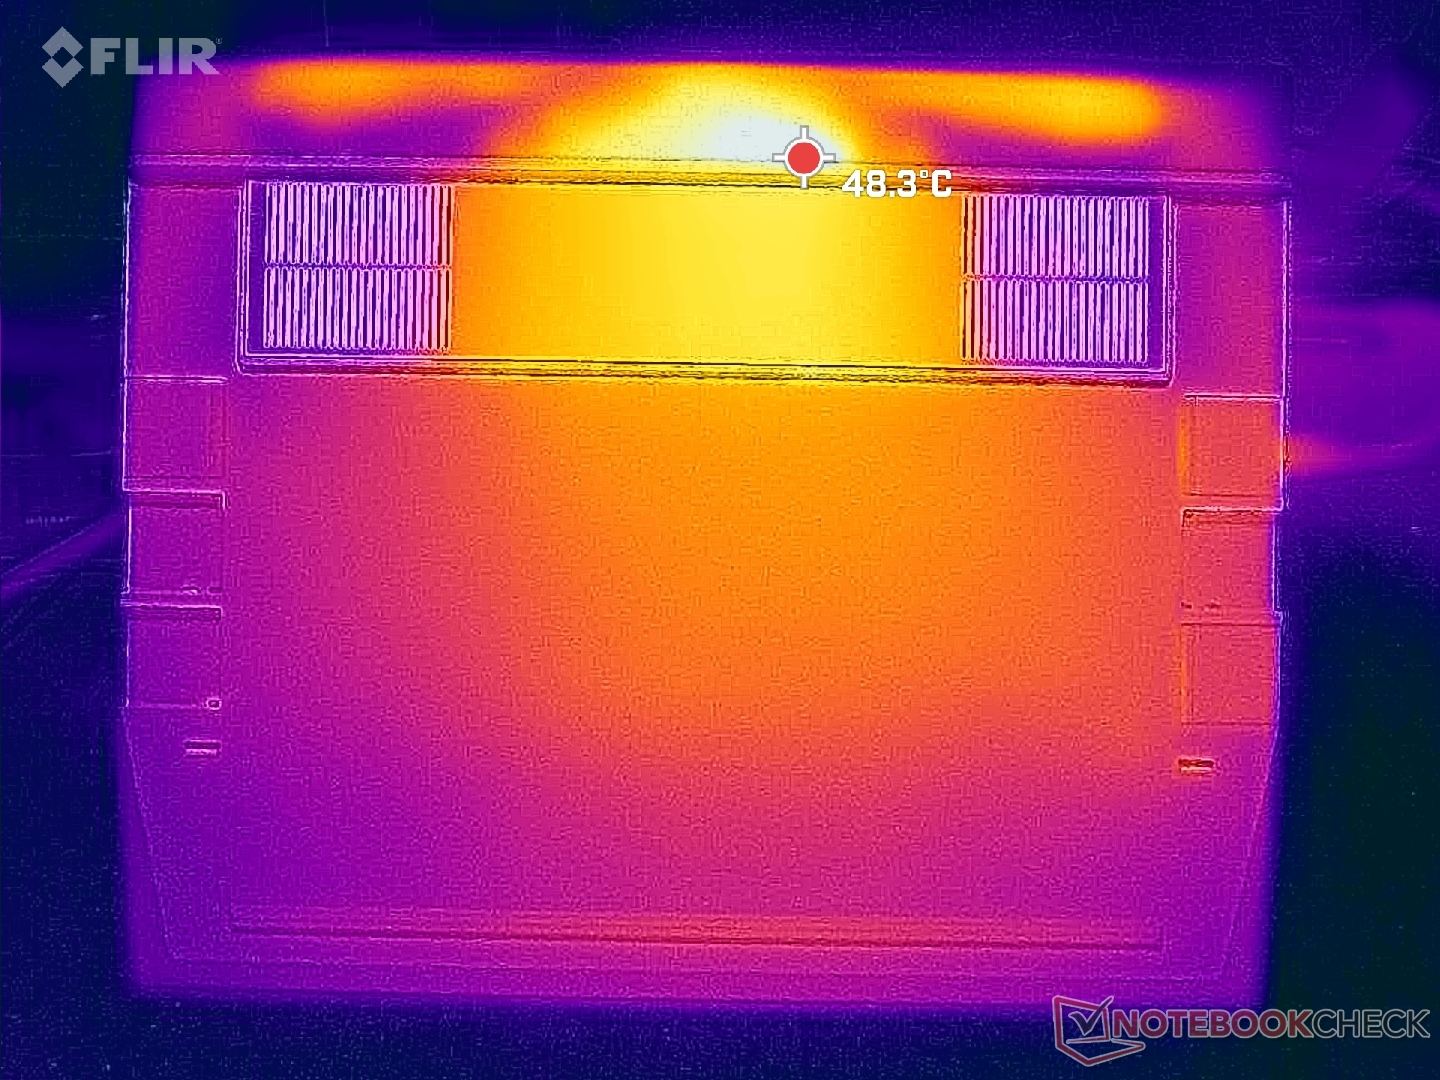
温度
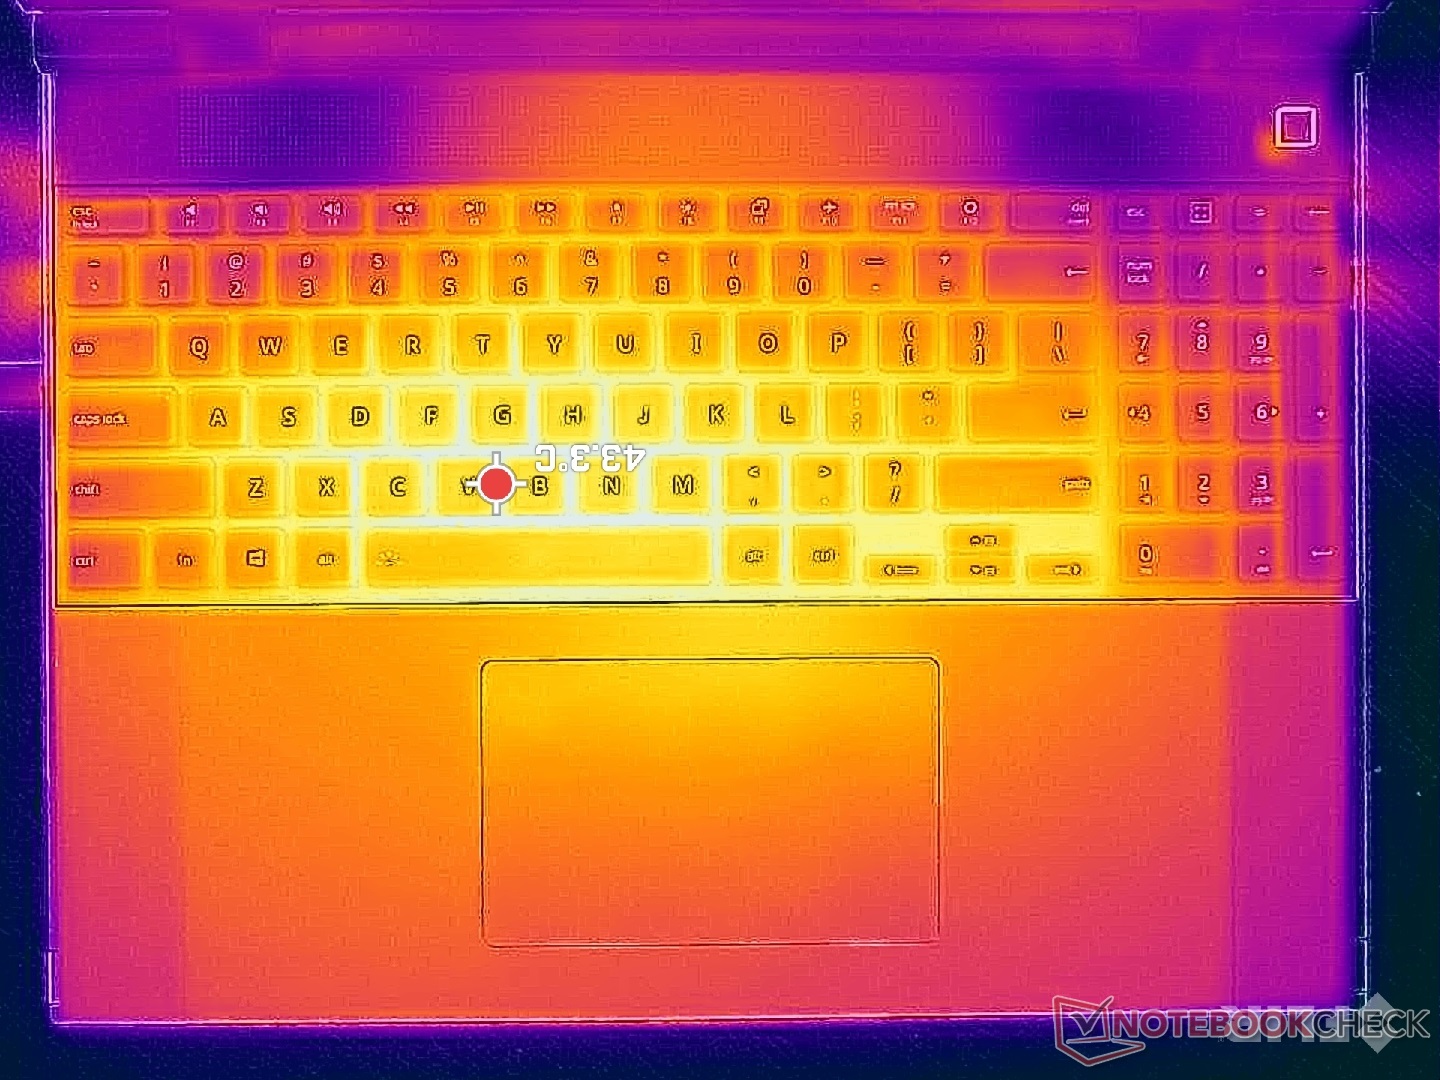
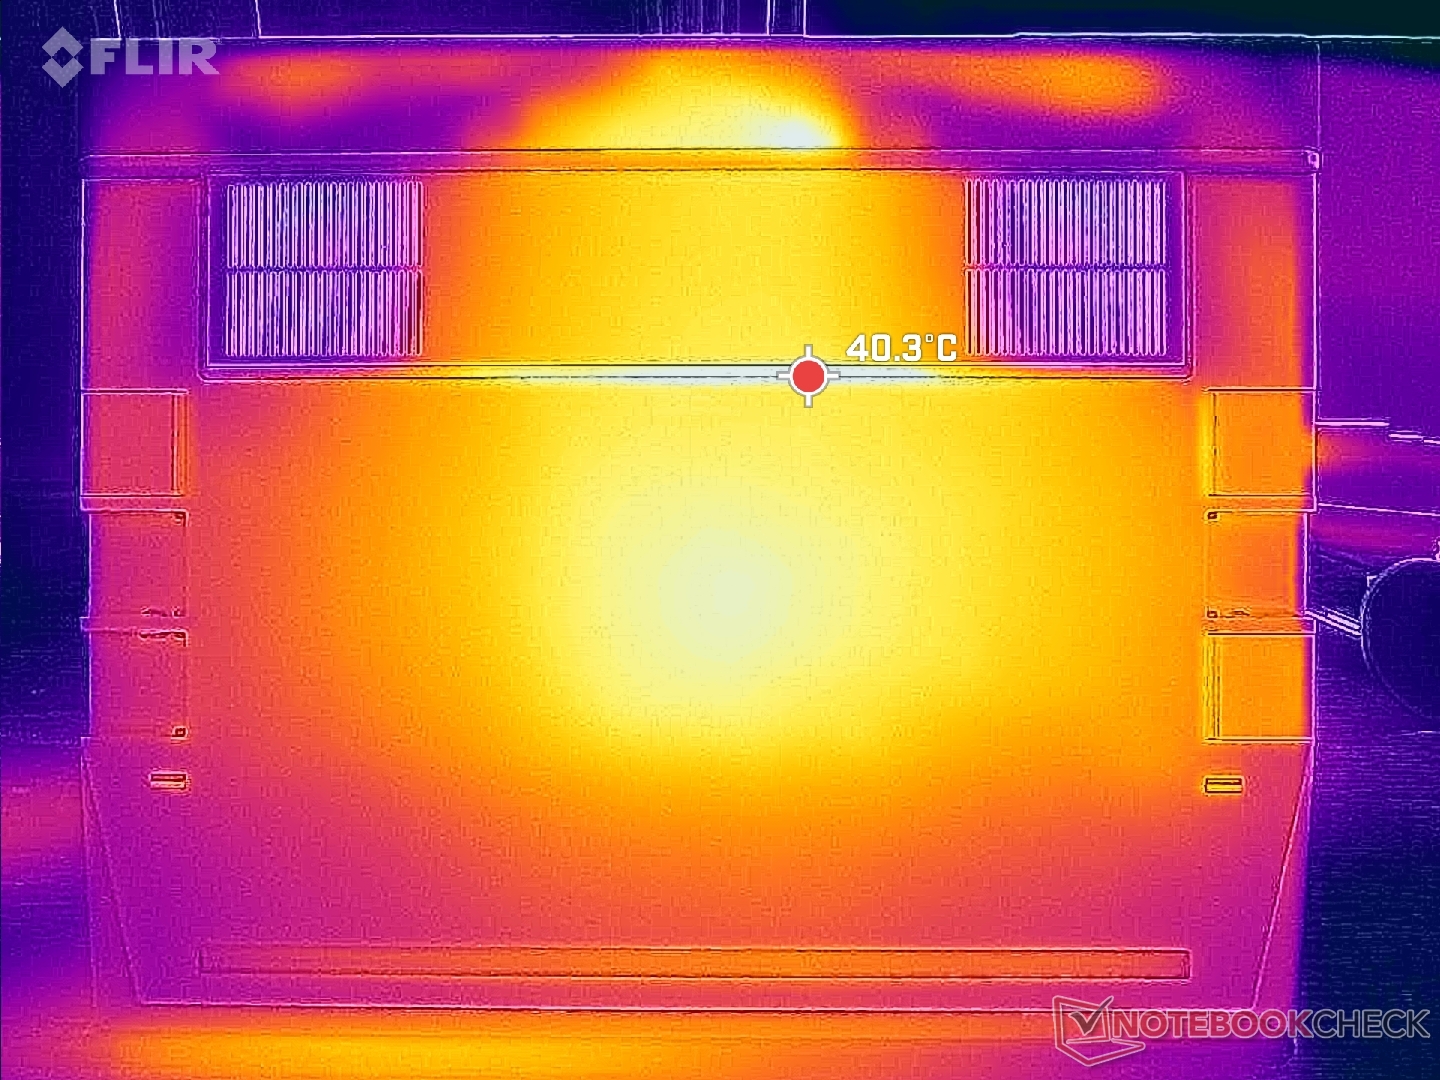
由于采用金属机身和慵懒的风扇,表面温度总是很高。当运行要求较高的负载(如游戏)时,笔记本底座上下两侧的热点温度可达 40 摄氏度以上。发热点更靠近 Laptop 16 的中心,而其他大多数笔记本电脑的发热点一般都在后部。这意味着在使用过程中,你更容易注意到框架系统升温的现象,而与其他笔记本电脑相比,如 惠普 Spectre x360 16相比,惠普 Spectre x360 16 的掌托和正面区域往往更凉爽。即便如此,我们也从未发现 Laptop 16 的温度会让皮肤感到不舒服。
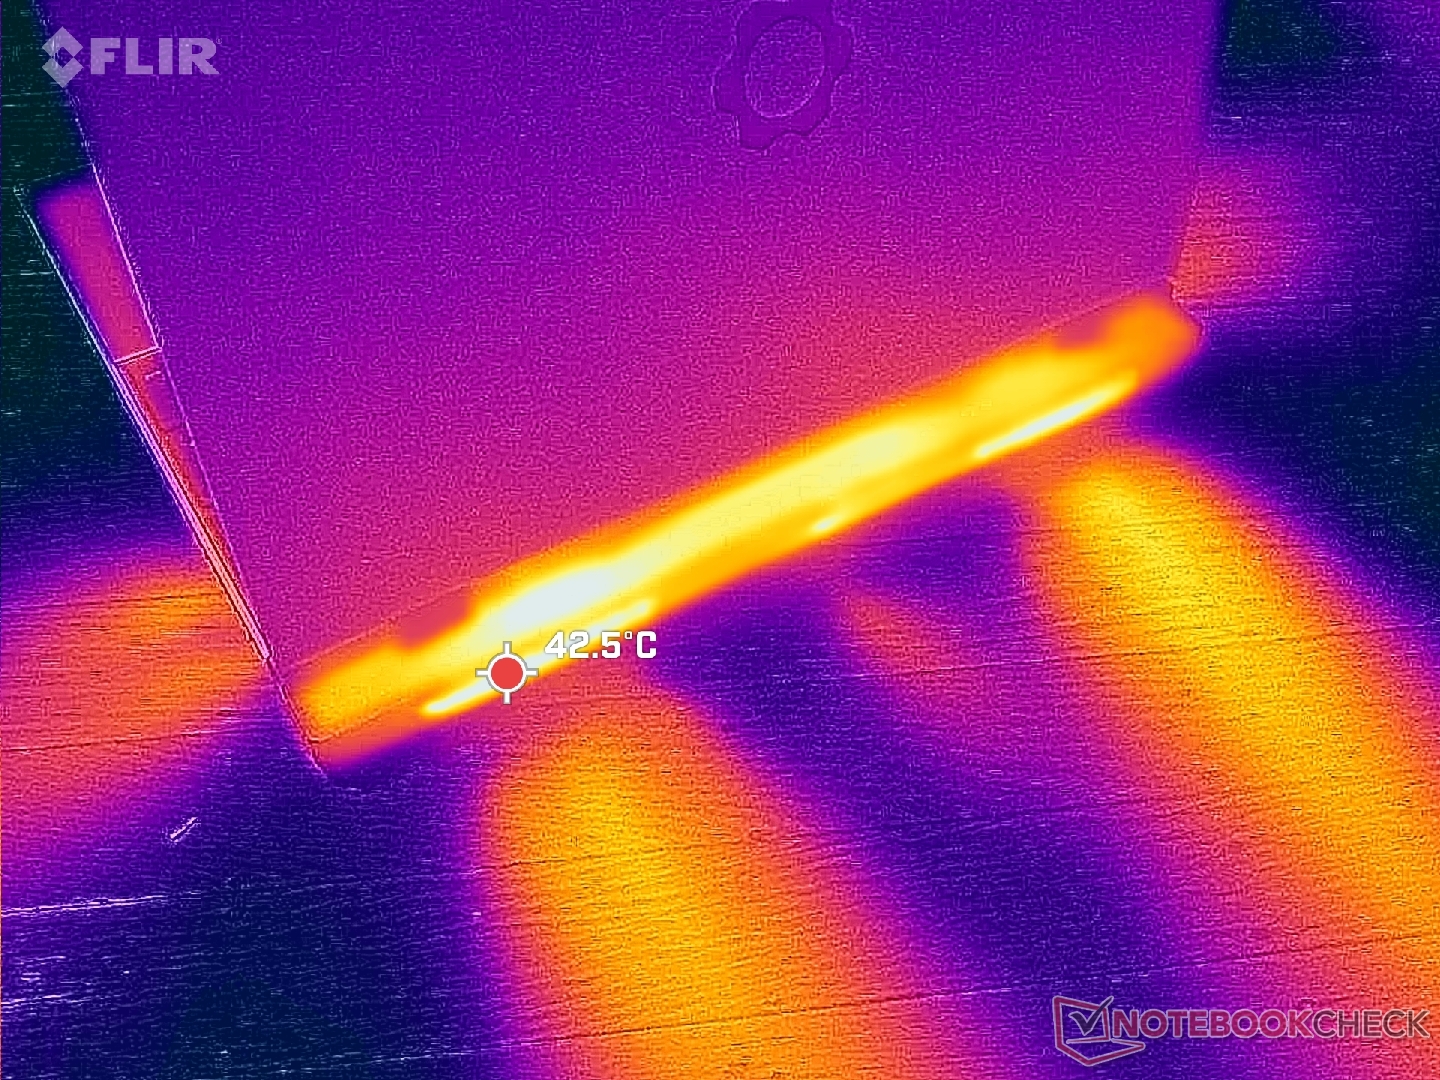
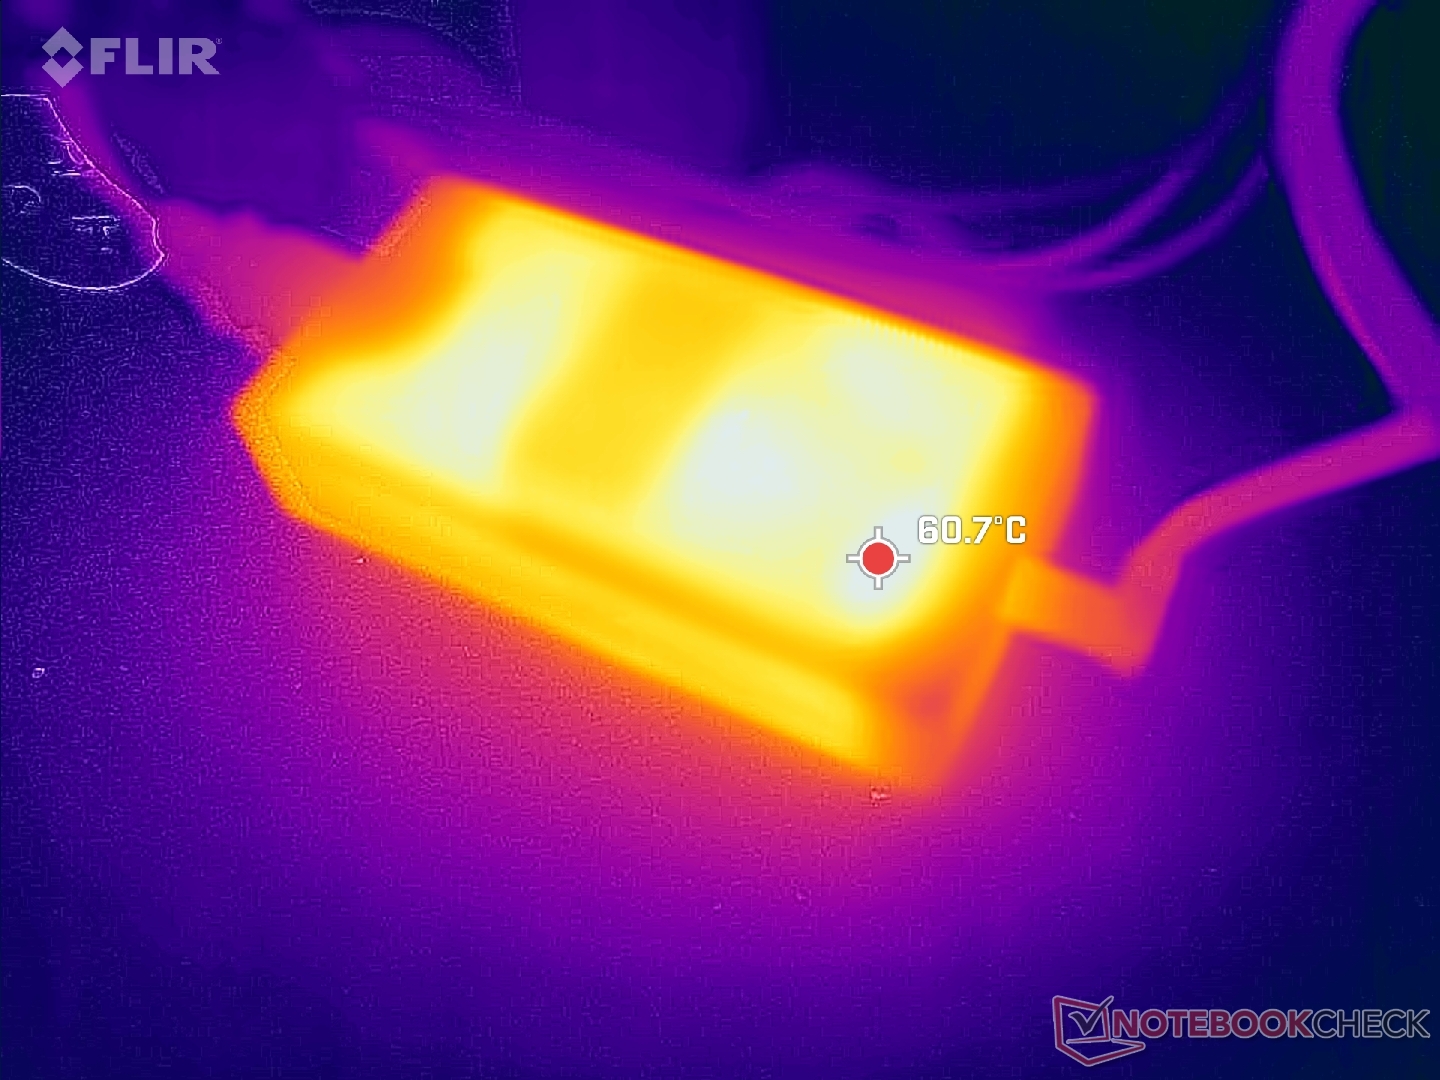
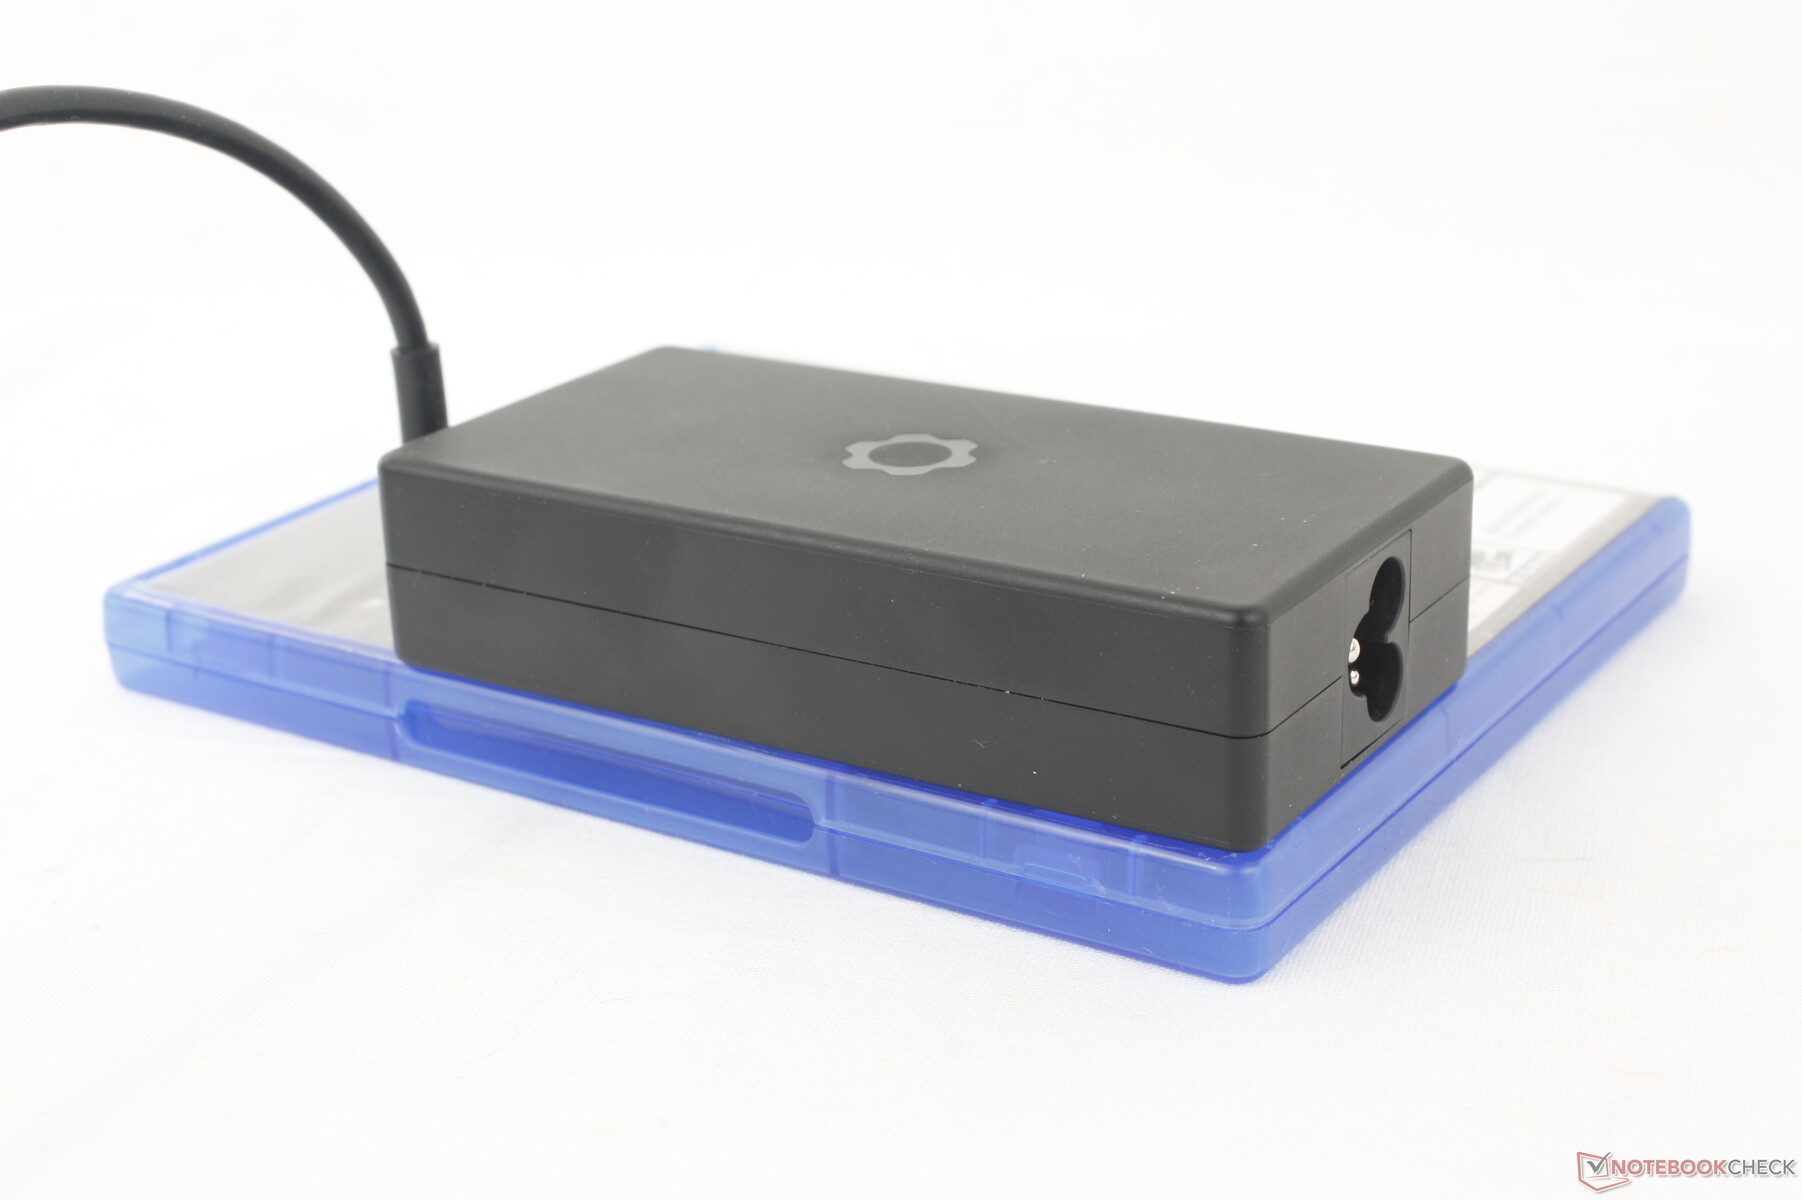
请记住,就输出功率而言,180 W USB-C 交流适配器是我们见过的最小的适配器之一(约 11.6 z 5.7 x 2.6 厘米)。之所以能做到如此小巧,是因为采用了氮化镓晶体管技术。 雷蛇 自己的交流适配器也采用了这种技术。氮化镓的缺点是,根据我们的经验,适配器本身在温度超过 60 摄氏度时会变得非常热。相比之下,较大的非 GaN 充电器在负载情况下的温度通常在 40 摄氏度到 50 摄氏度之间。
(±) The maximum temperature on the upper side is 42.4 °C / 108 F, compared to the average of 36.8 °C / 98 F, ranging from 21 to 71 °C for the class Multimedia.
(±) The bottom heats up to a maximum of 40.8 °C / 105 F, compared to the average of 39.1 °C / 102 F
(+) In idle usage, the average temperature for the upper side is 28.7 °C / 84 F, compared to the device average of 31.3 °C / 88 F.
(+) Playing The Witcher 3, the average temperature for the upper side is 30.2 °C / 86 F, compared to the device average of 31.3 °C / 88 F.
(+) The palmrests and touchpad are reaching skin temperature as a maximum (33.2 °C / 91.8 F) and are therefore not hot.
(-) The average temperature of the palmrest area of similar devices was 28.7 °C / 83.7 F (-4.5 °C / -8.1 F).
| Framework Laptop 16 AMD Ryzen 9 7940HS, AMD Radeon RX 7700S | MSI Prestige 16 B1MG-001US Intel Core Ultra 7 155H, Intel Arc 8-Core iGPU | Lenovo ThinkPad Z16 Gen 2 AMD Ryzen 9 PRO 7940HS, AMD Radeon RX 6550M | Apple MacBook Pro 16 2023 M3 Max Apple M3 Max 16-Core, Apple M3 Max 40-Core GPU | Dell Inspiron 16 Plus 7630 Intel Core i7-13700H, NVIDIA GeForce RTX 4060 Laptop GPU | HP Spectre x360 2-in-1 16-f1075ng Intel Core i7-12700H, Intel Iris Xe Graphics G7 96EUs | |
|---|---|---|---|---|---|---|
| Heat | 2% | 13% | 11% | -14% | 9% | |
| Maximum Upper Side * (°C) | 42.4 | 48.8 -15% | 43 -1% | 42.3 -0% | 47.8 -13% | 37.4 12% |
| Maximum Bottom * (°C) | 40.8 | 47.6 -17% | 41.6 -2% | 42 -3% | 42.2 -3% | 39.1 4% |
| Idle Upper Side * (°C) | 31.4 | 24.2 23% | 21.2 32% | 22.5 28% | 35.2 -12% | 27.1 14% |
| Idle Bottom * (°C) | 27.8 | 23.6 15% | 21.4 23% | 22.9 18% | 35 -26% | 26.3 5% |
* ... smaller is better
压力测试
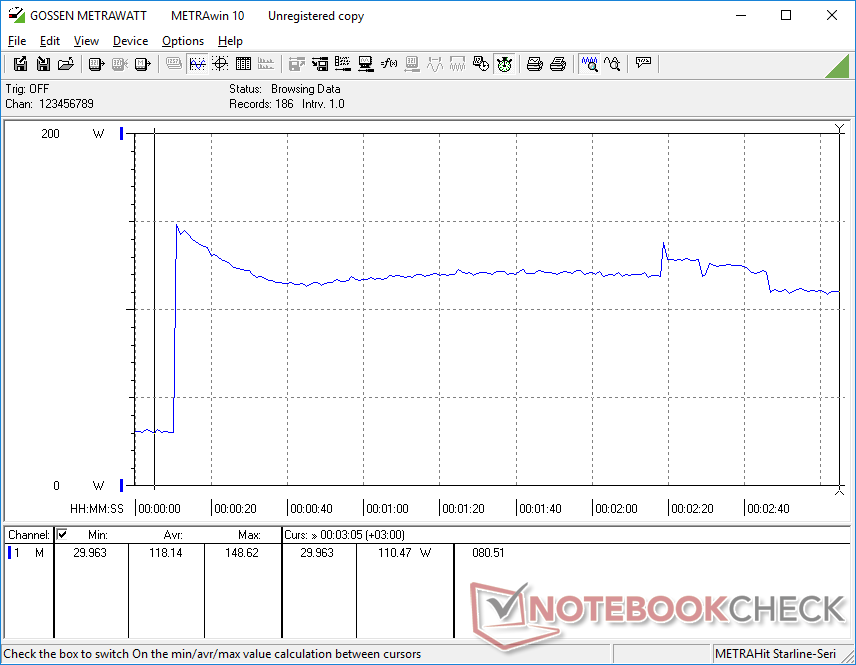
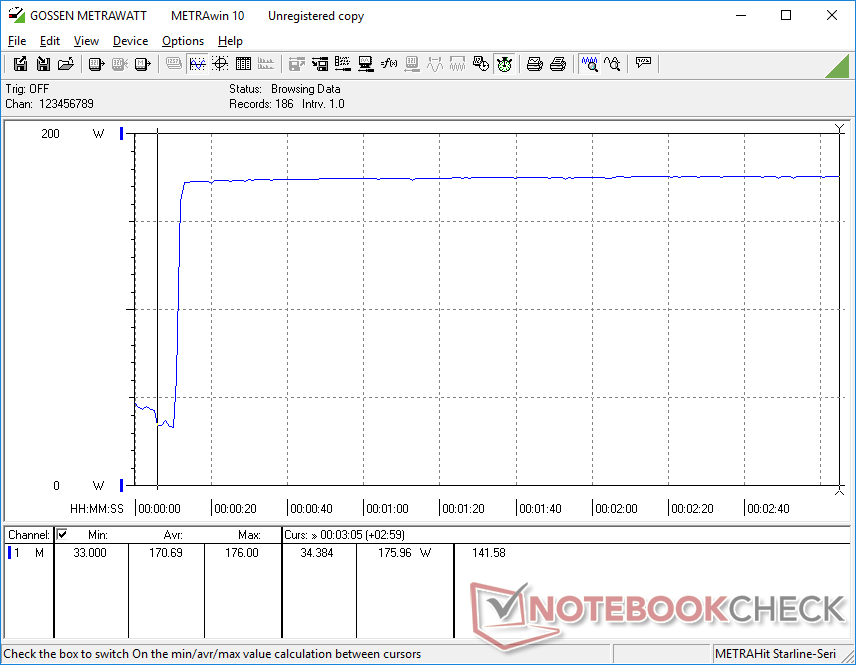
在启动 Prime95 压力测试时,CPU 会在最初几秒钟内提升到 4.6 GHz 和 80 W,然后迅速下降并稳定在 4.0 GHz、54 W 和比预期更高的 96 C。 联想 Slim Pro 9i 16这表明 Framework 更愿意提升处理器性能,限制节流,即使这意味着更高的平均核心温度,发烧友可能会对此表示赞赏。
运行时,图形处理器的频率将稳定在 2363 MHz,功耗为 99 W。 Witcher 3这意味着它可以在游戏时利用全部 100 W 的预算。核心温度将保持在 66 摄氏度的适当低水平,而上述GeForce 上的联想处理器则为 62 摄氏度。
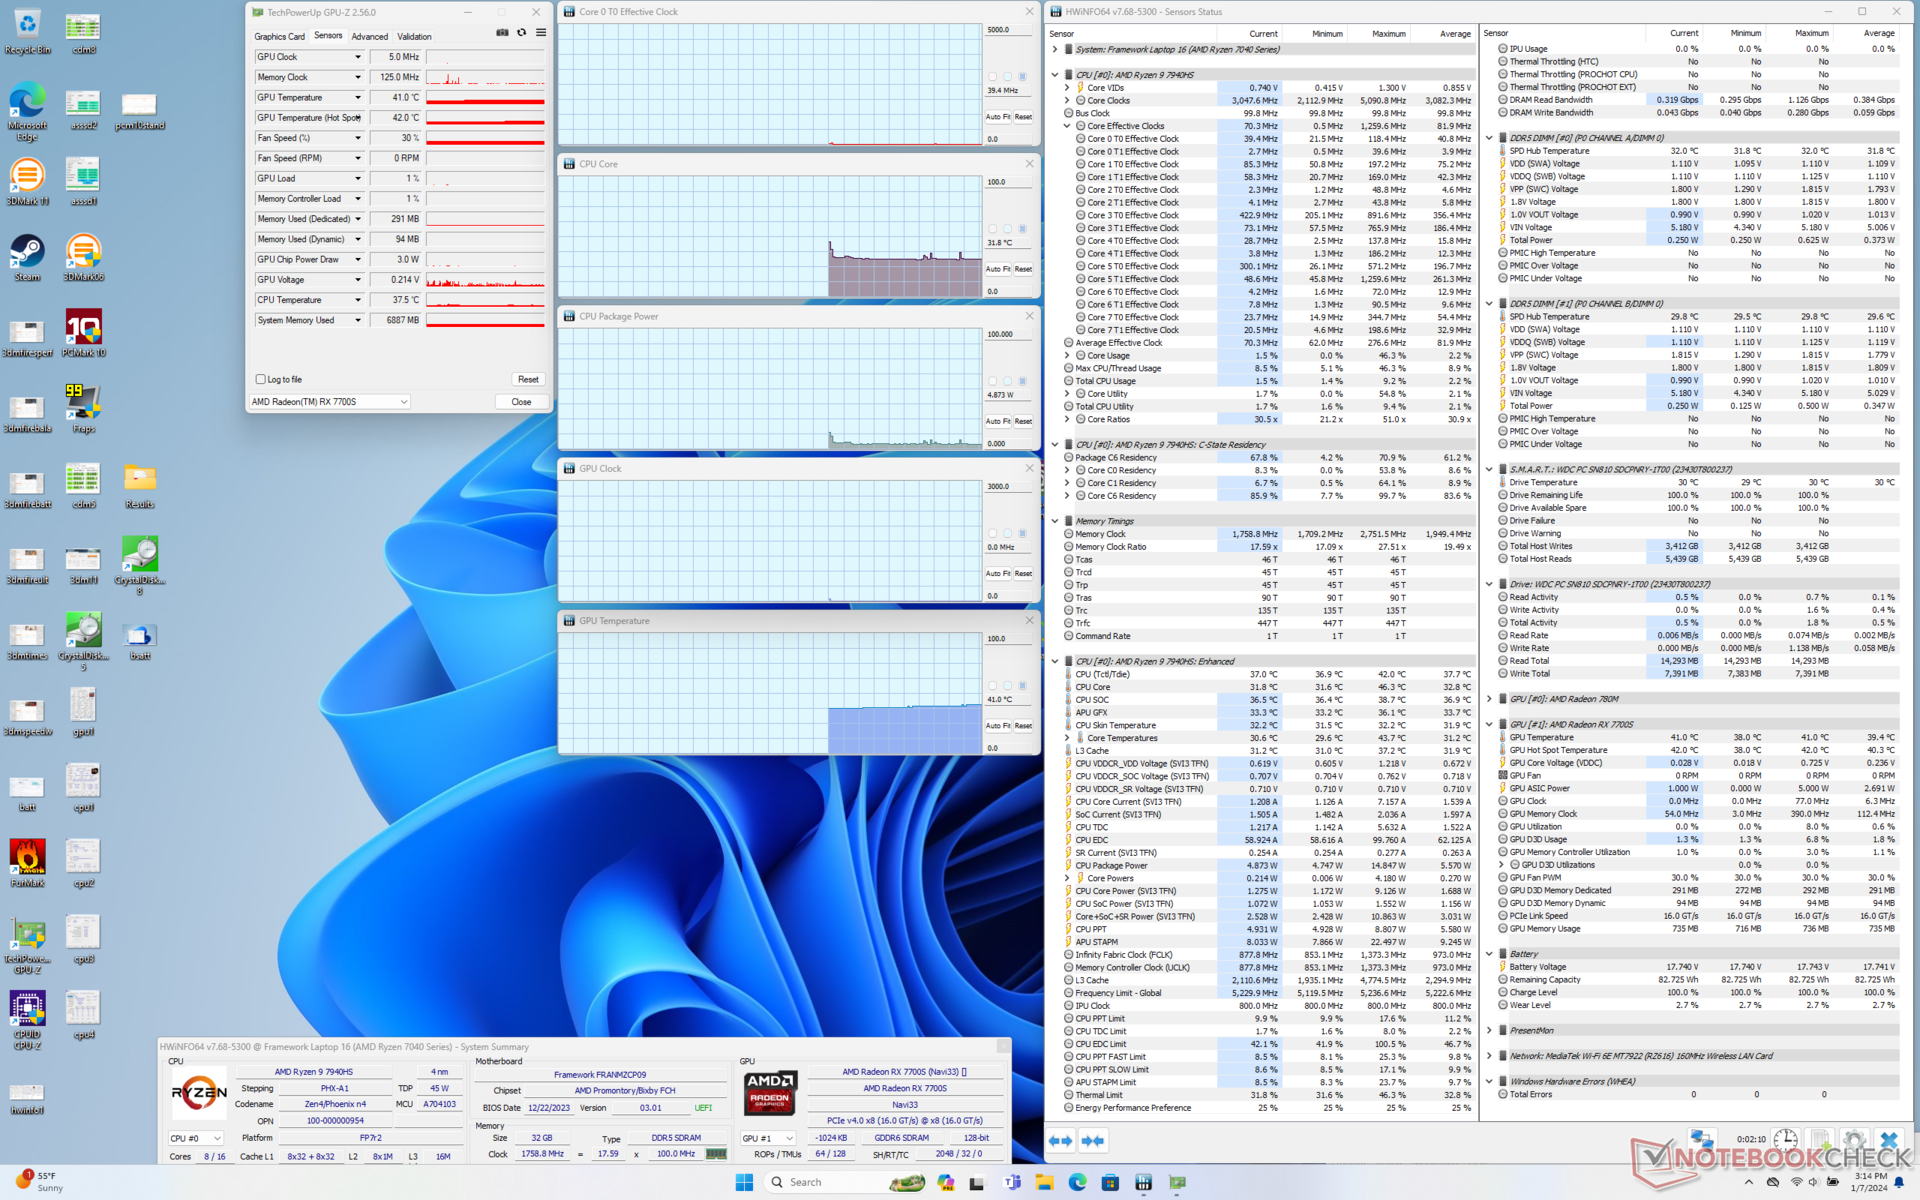
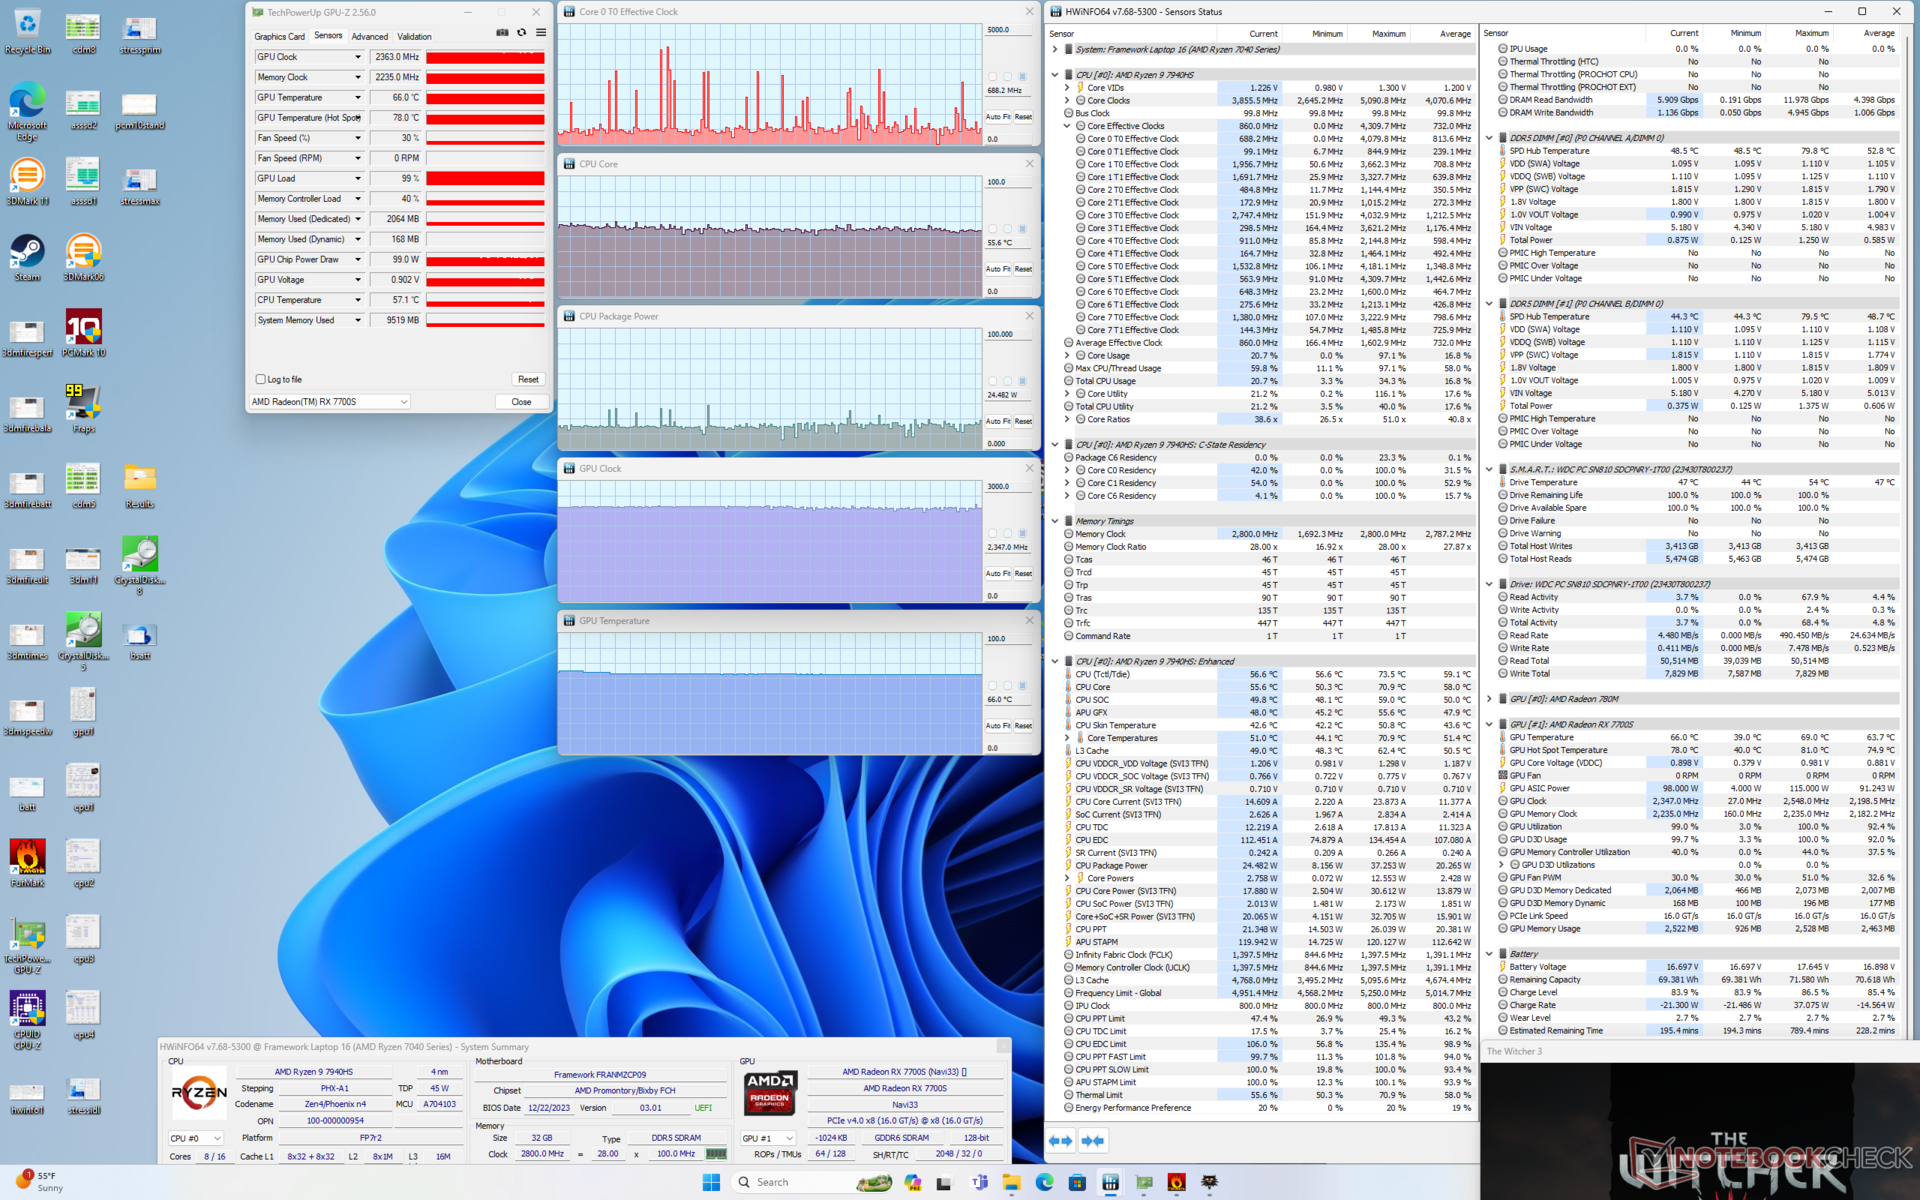
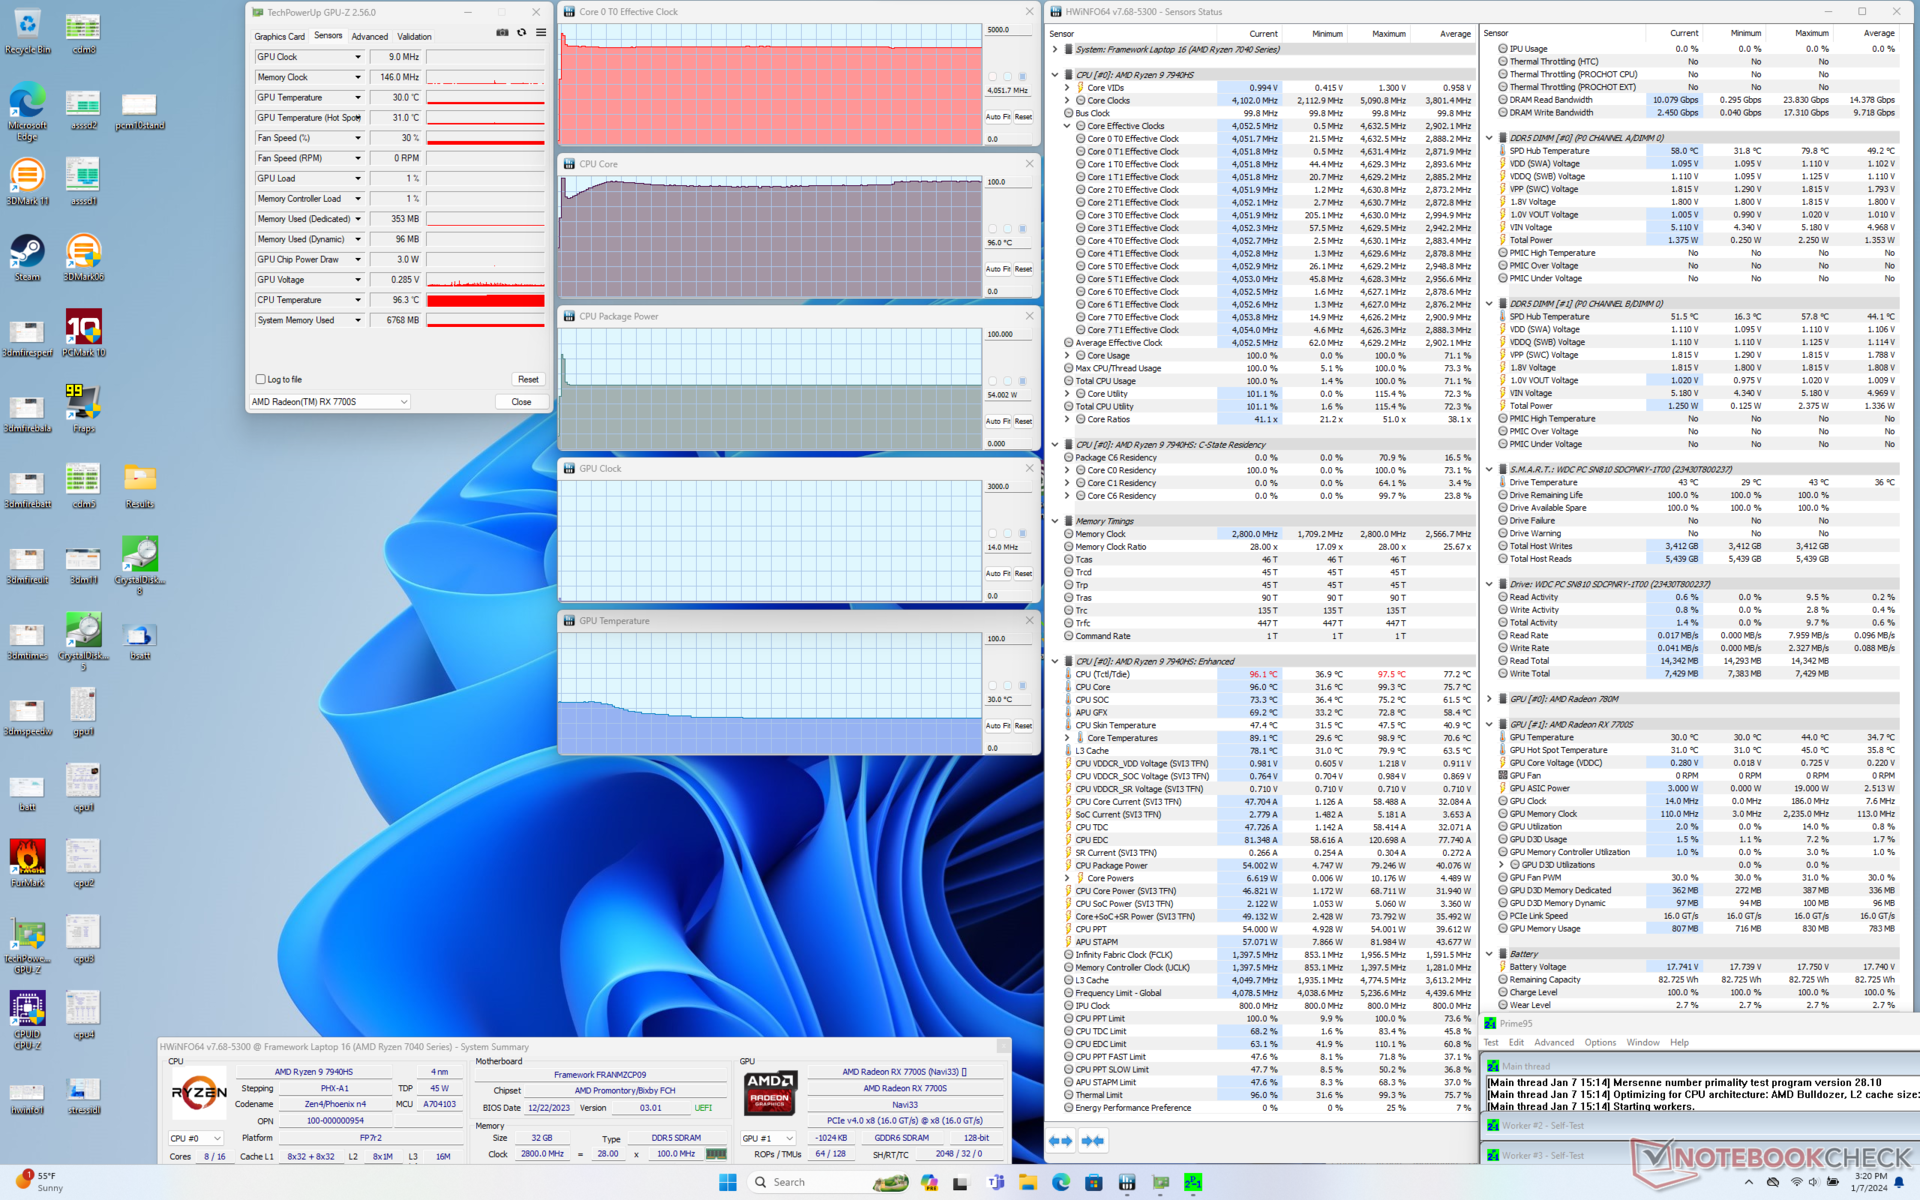
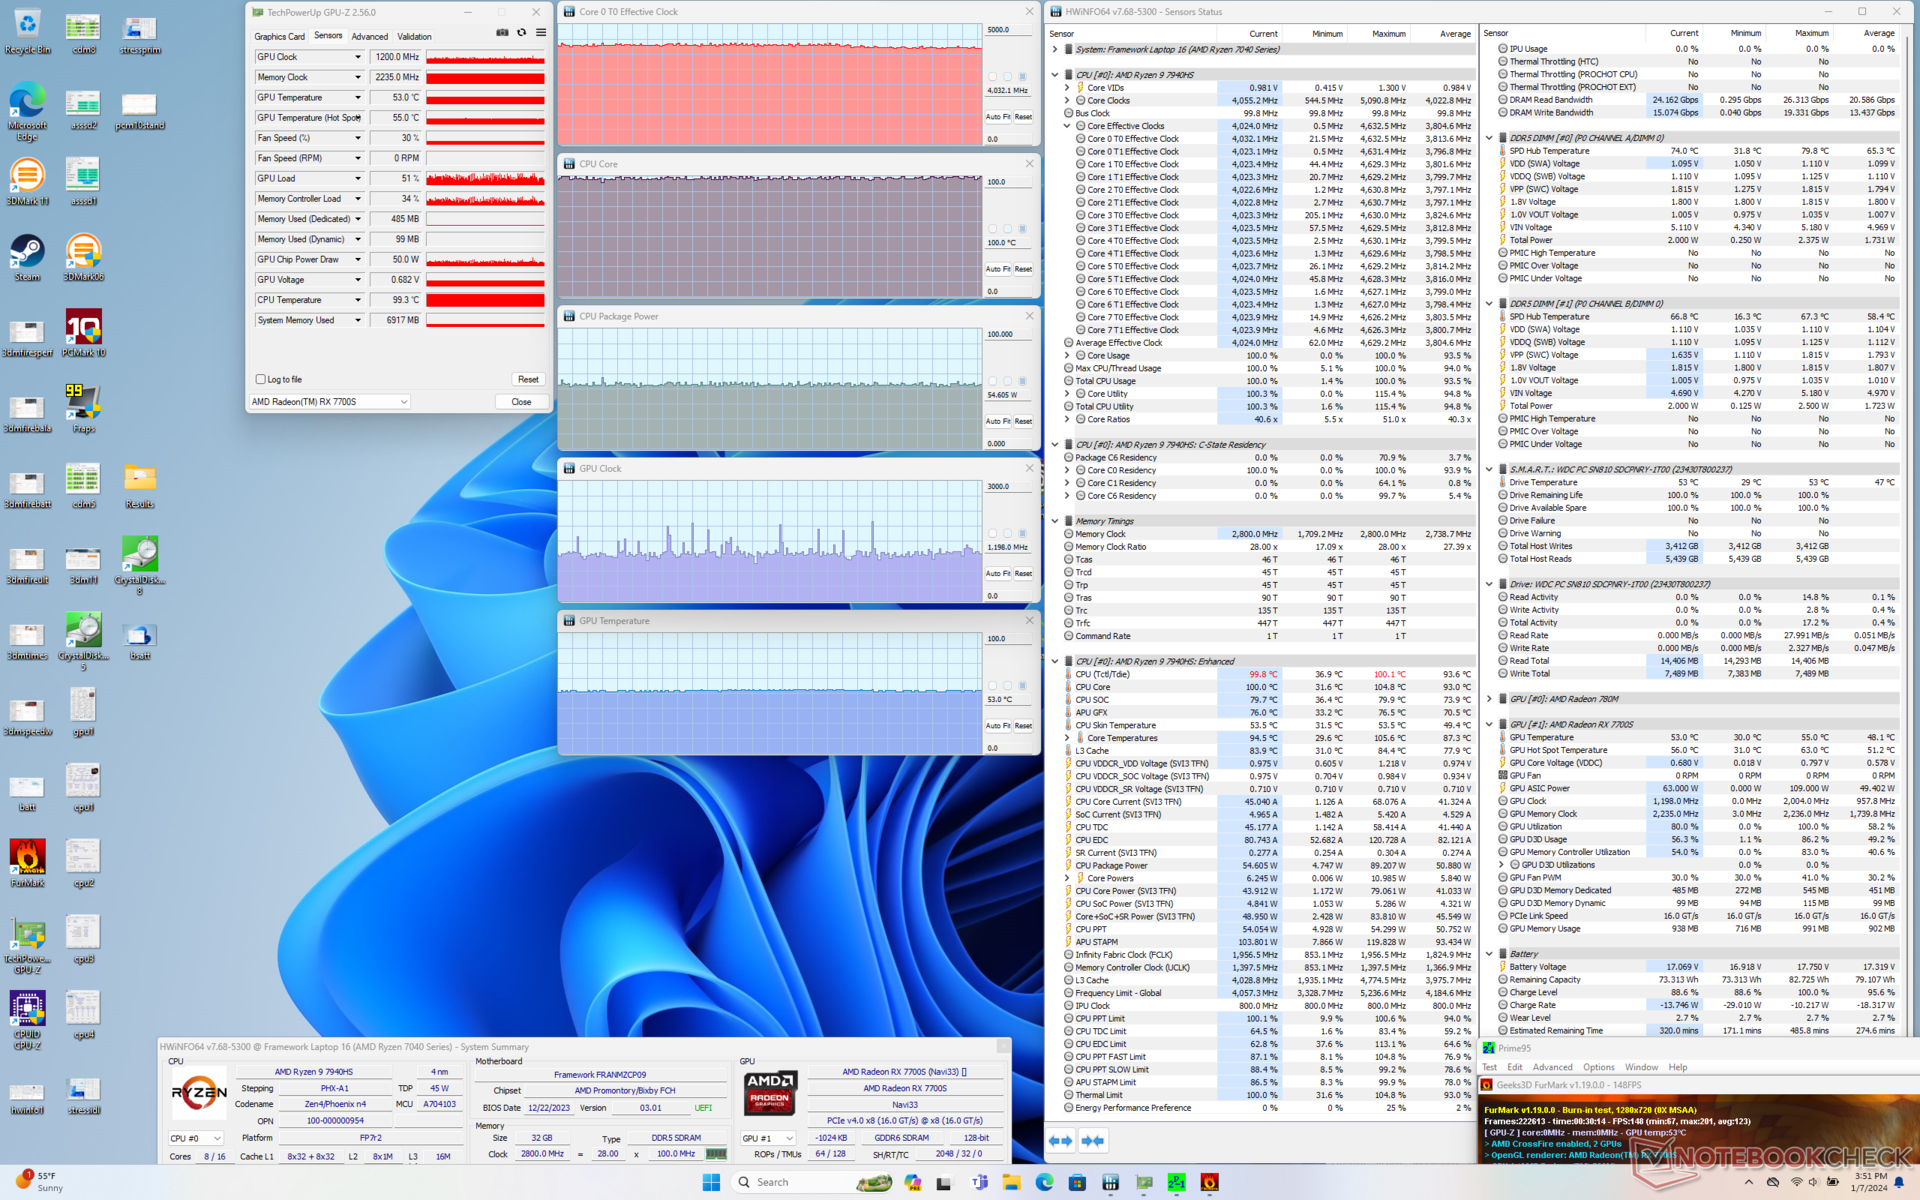
| CPU 时钟 (GHz) | GPU 时钟 (MHz) | CPU 平均温度 (°C) | GPU 平均温度(°C) | |
| 系统闲置 | -- | -- | 32 | 41 |
| Prime95 压力 | 4.0 | -- | 96 | 30 |
| Prime95 + FurMark 压力 | 4.0 | 1200 | 100 | 53 |
| Witcher 3 压力 | ~0.7 | 2363 | 56 | 66 |
发言人
Framework Laptop 16 audio analysis
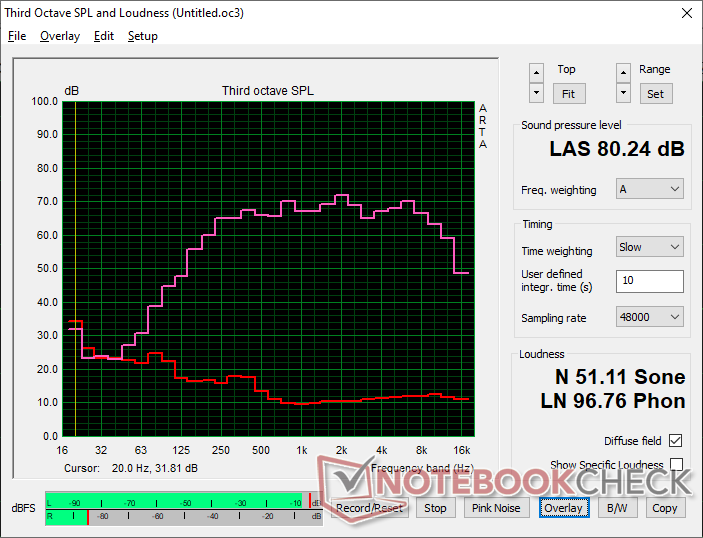
(±) | speaker loudness is average but good (80.2 dB)
Bass 100 - 315 Hz
(±) | reduced bass - on average 9.6% lower than median
(±) | linearity of bass is average (8.1% delta to prev. frequency)
Mids 400 - 2000 Hz
(+) | balanced mids - only 2.2% away from median
(+) | mids are linear (3.8% delta to prev. frequency)
Highs 2 - 16 kHz
(+) | balanced highs - only 2% away from median
(+) | highs are linear (4.9% delta to prev. frequency)
Overall 100 - 16.000 Hz
(+) | overall sound is linear (10.5% difference to median)
Compared to same class
» 16% of all tested devices in this class were better, 1% similar, 83% worse
» The best had a delta of 5%, average was 17%, worst was 45%
Compared to all devices tested
» 5% of all tested devices were better, 1% similar, 93% worse
» The best had a delta of 4%, average was 23%, worst was 134%
Apple MacBook Pro 16 2021 M1 Pro audio analysis
(+) | speakers can play relatively loud (84.7 dB)
Bass 100 - 315 Hz
(+) | good bass - only 3.8% away from median
(+) | bass is linear (5.2% delta to prev. frequency)
Mids 400 - 2000 Hz
(+) | balanced mids - only 1.3% away from median
(+) | mids are linear (2.1% delta to prev. frequency)
Highs 2 - 16 kHz
(+) | balanced highs - only 1.9% away from median
(+) | highs are linear (2.7% delta to prev. frequency)
Overall 100 - 16.000 Hz
(+) | overall sound is linear (4.6% difference to median)
Compared to same class
» 0% of all tested devices in this class were better, 0% similar, 100% worse
» The best had a delta of 5%, average was 17%, worst was 45%
Compared to all devices tested
» 0% of all tested devices were better, 0% similar, 100% worse
» The best had a delta of 4%, average was 23%, worst was 134%
能源管理
耗电量
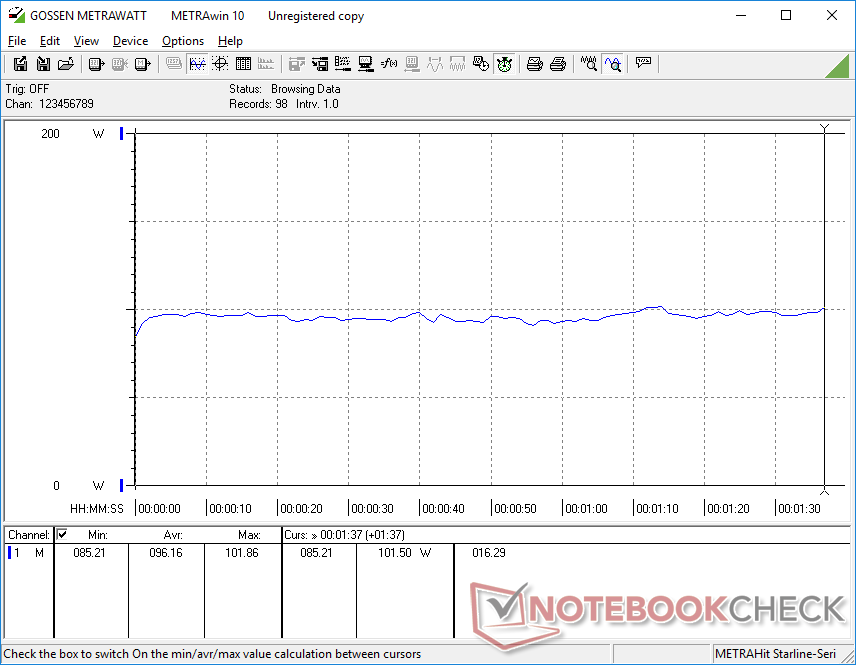
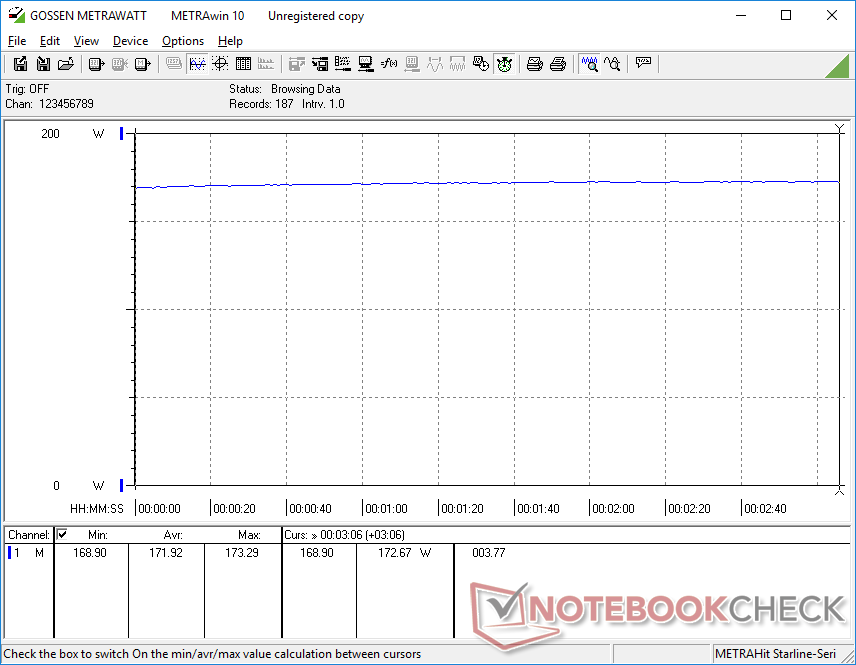
耗电量与 Dell Inspiron 16 Plus 或 MacBook Pro 16 2023 空闲或运行低负载时的耗电量与戴尔 Inspiron 16 Plus 或 MacBook Pro 16 2023 相当。但在运行游戏等较高负载时,耗电量会高于预期。运行 Witcher 3需要 172 W,而搭载 RTX 4060 的 Inspiron 16 Plus 仅需 122 W。考虑到 RTX 4060 在许多游戏中都能经常超越 Radeon RX 7700S,Laptop 16 的每瓦 GPU 性能还不如 Nvidia 的替代产品,这也印证了我们上面的说法。
运行 Prime95 时,CPU 的全系统功耗为 110 瓦,而微星 Stealth 16 的功耗仅为 75 瓦。 微星隐形 16而搭载酷睿 i9-13900H 的微星 Stealth 16 只有 75 W。
在运行游戏或其他极端负载(如 Prime95 和 FurMark)时,我们可以记录到小型 180 W USB-C AC 适配器的最大功耗为 176 W。这一点很重要,因为有限的交流适配器开销可能会对笔记本电脑的性能或充电能力造成瓶颈。在这种情况下,当运行苛刻负载时,充电速度会受到影响。例如,当连接到插座并运行时,我们可以观察到电池电量从 100% 消耗到 85%。 Witcher 3这意味着,在同时运行高负载的情况下,电池不可能以合适的速度充电。这种情况在大多数其他笔记本电脑上是不会出现的。
| Off / Standby | |
| Idle | |
| Load |
|
Key:
min: | |
| Framework Laptop 16 R9 7940HS, Radeon RX 7700S, WDC PC SN810 1TB, , 2560x1600, 16" | MSI Prestige 16 B1MG-001US Ultra 7 155H, Arc 8-Core, Samsung PM9A1 MZVL22T0HBLB, IPS, 2560x1600, 16" | Lenovo ThinkPad Z16 Gen 2 R9 PRO 7940HS, Radeon RX 6550M, Kioxia XG8 KXG8AZNV1T02, OLED, 3840x2400, 16" | Apple MacBook Pro 16 2023 M3 Max Apple M3 Max 16-Core, M3 Max 40-Core GPU, Apple SSD AP8192Z, Mini-LED, 3456x2234, 16" | Dell Inspiron 16 Plus 7630 i7-13700H, GeForce RTX 4060 Laptop GPU, WD PC SN740 SDDPTQD-1T00, IPS, 2560x1600, 16" | HP Spectre x360 2-in-1 16-f1075ng i7-12700H, Iris Xe G7 96EUs, SK Hynix PC711 1TB HFS001TDE9X073N, IPS, 3072x1920, 16" | |
|---|---|---|---|---|---|---|
| Power Consumption | 46% | 26% | 18% | -5% | 40% | |
| Idle Minimum * (Watt) | 9.5 | 3 68% | 7.5 21% | 5.2 45% | 15.6 -64% | 9 5% |
| Idle Average * (Watt) | 17 | 9.5 44% | 9.6 44% | 16.9 1% | 17.7 -4% | 11.1 35% |
| Idle Maximum * (Watt) | 17.2 | 12 30% | 18.5 -8% | 17.2 -0% | 20.6 -20% | 16.4 5% |
| Load Average * (Watt) | 96.2 | 68.3 29% | 57.1 41% | 90.5 6% | 87.4 9% | 38.3 60% |
| Witcher 3 ultra * (Watt) | 171.9 | 59.8 65% | 115.8 33% | 109 37% | 121.7 29% | 34.4 80% |
| Load Maximum * (Watt) | 175.7 | 104.8 40% | 131.7 25% | 145.2 17% | 138 21% | 82.5 53% |
* ... smaller is better
Power Consumption Witcher 3 / Stresstest
Power Consumption external Monitor
电池寿命
85 Wh 电池的实际 WLAN 浏览时间略高于 9 小时,与戴尔 Inspiron 16 Plus 7630 相似。 戴尔 Inspiron 16 Plus 7630或惠普 Spectre x360 2 合 1 相似。我们建议将显示屏设置为可变刷新率,而不是固定的默认 165 Hz,这样可以从电池中榨取更多的电量。例如,在 83 Hz 至 165 Hz 的动态刷新率设置下,我们可以在相同的 WLAN 测试中多坚持 20 分钟。大多数智能手机都采用了同样的技术来节省电池使用时间。
如果在桌面上闲置或运行要求不高的负载,使用附带的交流适配器从空闲状态充至满电大约需要 2 小时。但是,如果运行更极端的负载,电池充电速度会更慢,如上所述。更大的 240 W USB-C 交流适配器有可能解决这个问题。
| Framework Laptop 16 R9 7940HS, Radeon RX 7700S, 85 Wh | MSI Prestige 16 B1MG-001US Ultra 7 155H, Arc 8-Core, 99.9 Wh | Lenovo ThinkPad Z16 Gen 2 R9 PRO 7940HS, Radeon RX 6550M, 72 Wh | Apple MacBook Pro 16 2023 M3 Max Apple M3 Max 16-Core, M3 Max 40-Core GPU, 99.6 Wh | Dell Inspiron 16 Plus 7630 i7-13700H, GeForce RTX 4060 Laptop GPU, 86 Wh | HP Spectre x360 2-in-1 16-f1075ng i7-12700H, Iris Xe G7 96EUs, 83 Wh | |
|---|---|---|---|---|---|---|
| Battery runtime | 86% | -17% | 32% | 5% | 20% | |
| Reader / Idle (h) | 14.8 | 25.1 70% | 10.2 -31% | 17.6 19% | 20.6 39% | |
| WiFi v1.3 (h) | 9.1 | 18.3 101% | 6 -34% | 16.7 84% | 9.4 3% | 10.5 15% |
| Load (h) | 1.5 | 2.8 87% | 1.7 13% | 1.2 -20% | 1.4 -7% | 1.6 7% |
| H.264 (h) | 20.4 | 11.2 |
Pros
Cons
结论 - 提高可维修性意味着增加尺寸和重量
通过将越来越多的元件集成到主板上,笔记本电脑的轻薄化趋势得以实现。这种方法的主要缺点是限制了可维修性,因为即使是很小的故障也可能需要更换整个电路板。Framework 是唯一一家反其道而行之的制造商,试图改善最终用户的定制和维修服务。毫无疑问,Laptop 16 比任何其他产品都更便于用户维修,但这一有利可图的特点是以体积和重量为代价的,因为单个组件必须易于更换。如果你只打算在笔记本电脑的整个生命周期中升级内存或固态硬盘一两次,那么更小巧、更便于旅行的 16 英寸替代产品,如 Inspiron 16 Plus或 华硕 VivoBook Pro 16在这方面可能更适合你。
可拆卸的 dGPU 也是一种冒险的尝试,因为戴尔和联想等大型 OEM 厂商历来都不成功。事实上,通用的 USB4 或基于 Thunderbolt 的 eGPU 选项已经存在,这使得专门的 Laptop 16 dGPU 的吸引力大打折扣。如果你真的想在路上使用独立显卡,那么GeForce RTX 4060 可以提供比 Radeon 7700S 更好的性能和每瓦性能。因此,Framework 必须在未来数年内支持 Laptop 16 dGPU 设计,并提供未来的 RDNA 选项,这样才能使投资物有所值。现在购买就意味着相信该公司会做到这一点。
为了便于维修和可持续发展,Framework Laptop 16 比其他 16 英寸笔记本电脑更大更重。如果您经常升级或需要维修,那么 Laptop 16 就值得购买。如果不是这样,那么来自大型原始设备制造商的替代产品往往速度更快、重量更轻。
由于上述原因,有兴趣的买家应该重视 girthy Laptop 16 的扩展卡、可持续性角度和高可维修性,因为替代品往往更薄、更轻,有时速度更快,尤其是在 2000 美元的范围内。如果框架能在某种程度上与 雷蛇刀锋 16或 MacBook Pro的尺寸,同时保持可修复性,那么未来的改版产品就有可能变得非常特别。目前,为了享受 Framework 的所有独特功能,你不得不牺牲一些便携性。
价格和供应情况
框架现在开始接受预订Laptop 16 基础版 Ryzen 7 DIY 起价 1400 美元,配置 Ryzen 9、独立 Radeon 7700S 显卡和多个扩展卡及模块时售价超过 2400 美元。
Framework Laptop 16
- 01/23/2024 v7 (old)
Allen Ngo
Transparency
The selection of devices to be reviewed is made by our editorial team. The test sample was provided to the author as a loan by the manufacturer or retailer for the purpose of this review. The lender had no influence on this review, nor did the manufacturer receive a copy of this review before publication. There was no obligation to publish this review. As an independent media company, Notebookcheck is not subjected to the authority of manufacturers, retailers or publishers.
This is how Notebookcheck is testing
Every year, Notebookcheck independently reviews hundreds of laptops and smartphones using standardized procedures to ensure that all results are comparable. We have continuously developed our test methods for around 20 years and set industry standards in the process. In our test labs, high-quality measuring equipment is utilized by experienced technicians and editors. These tests involve a multi-stage validation process. Our complex rating system is based on hundreds of well-founded measurements and benchmarks, which maintains objectivity. Further information on our test methods can be found here.
Price comparison

