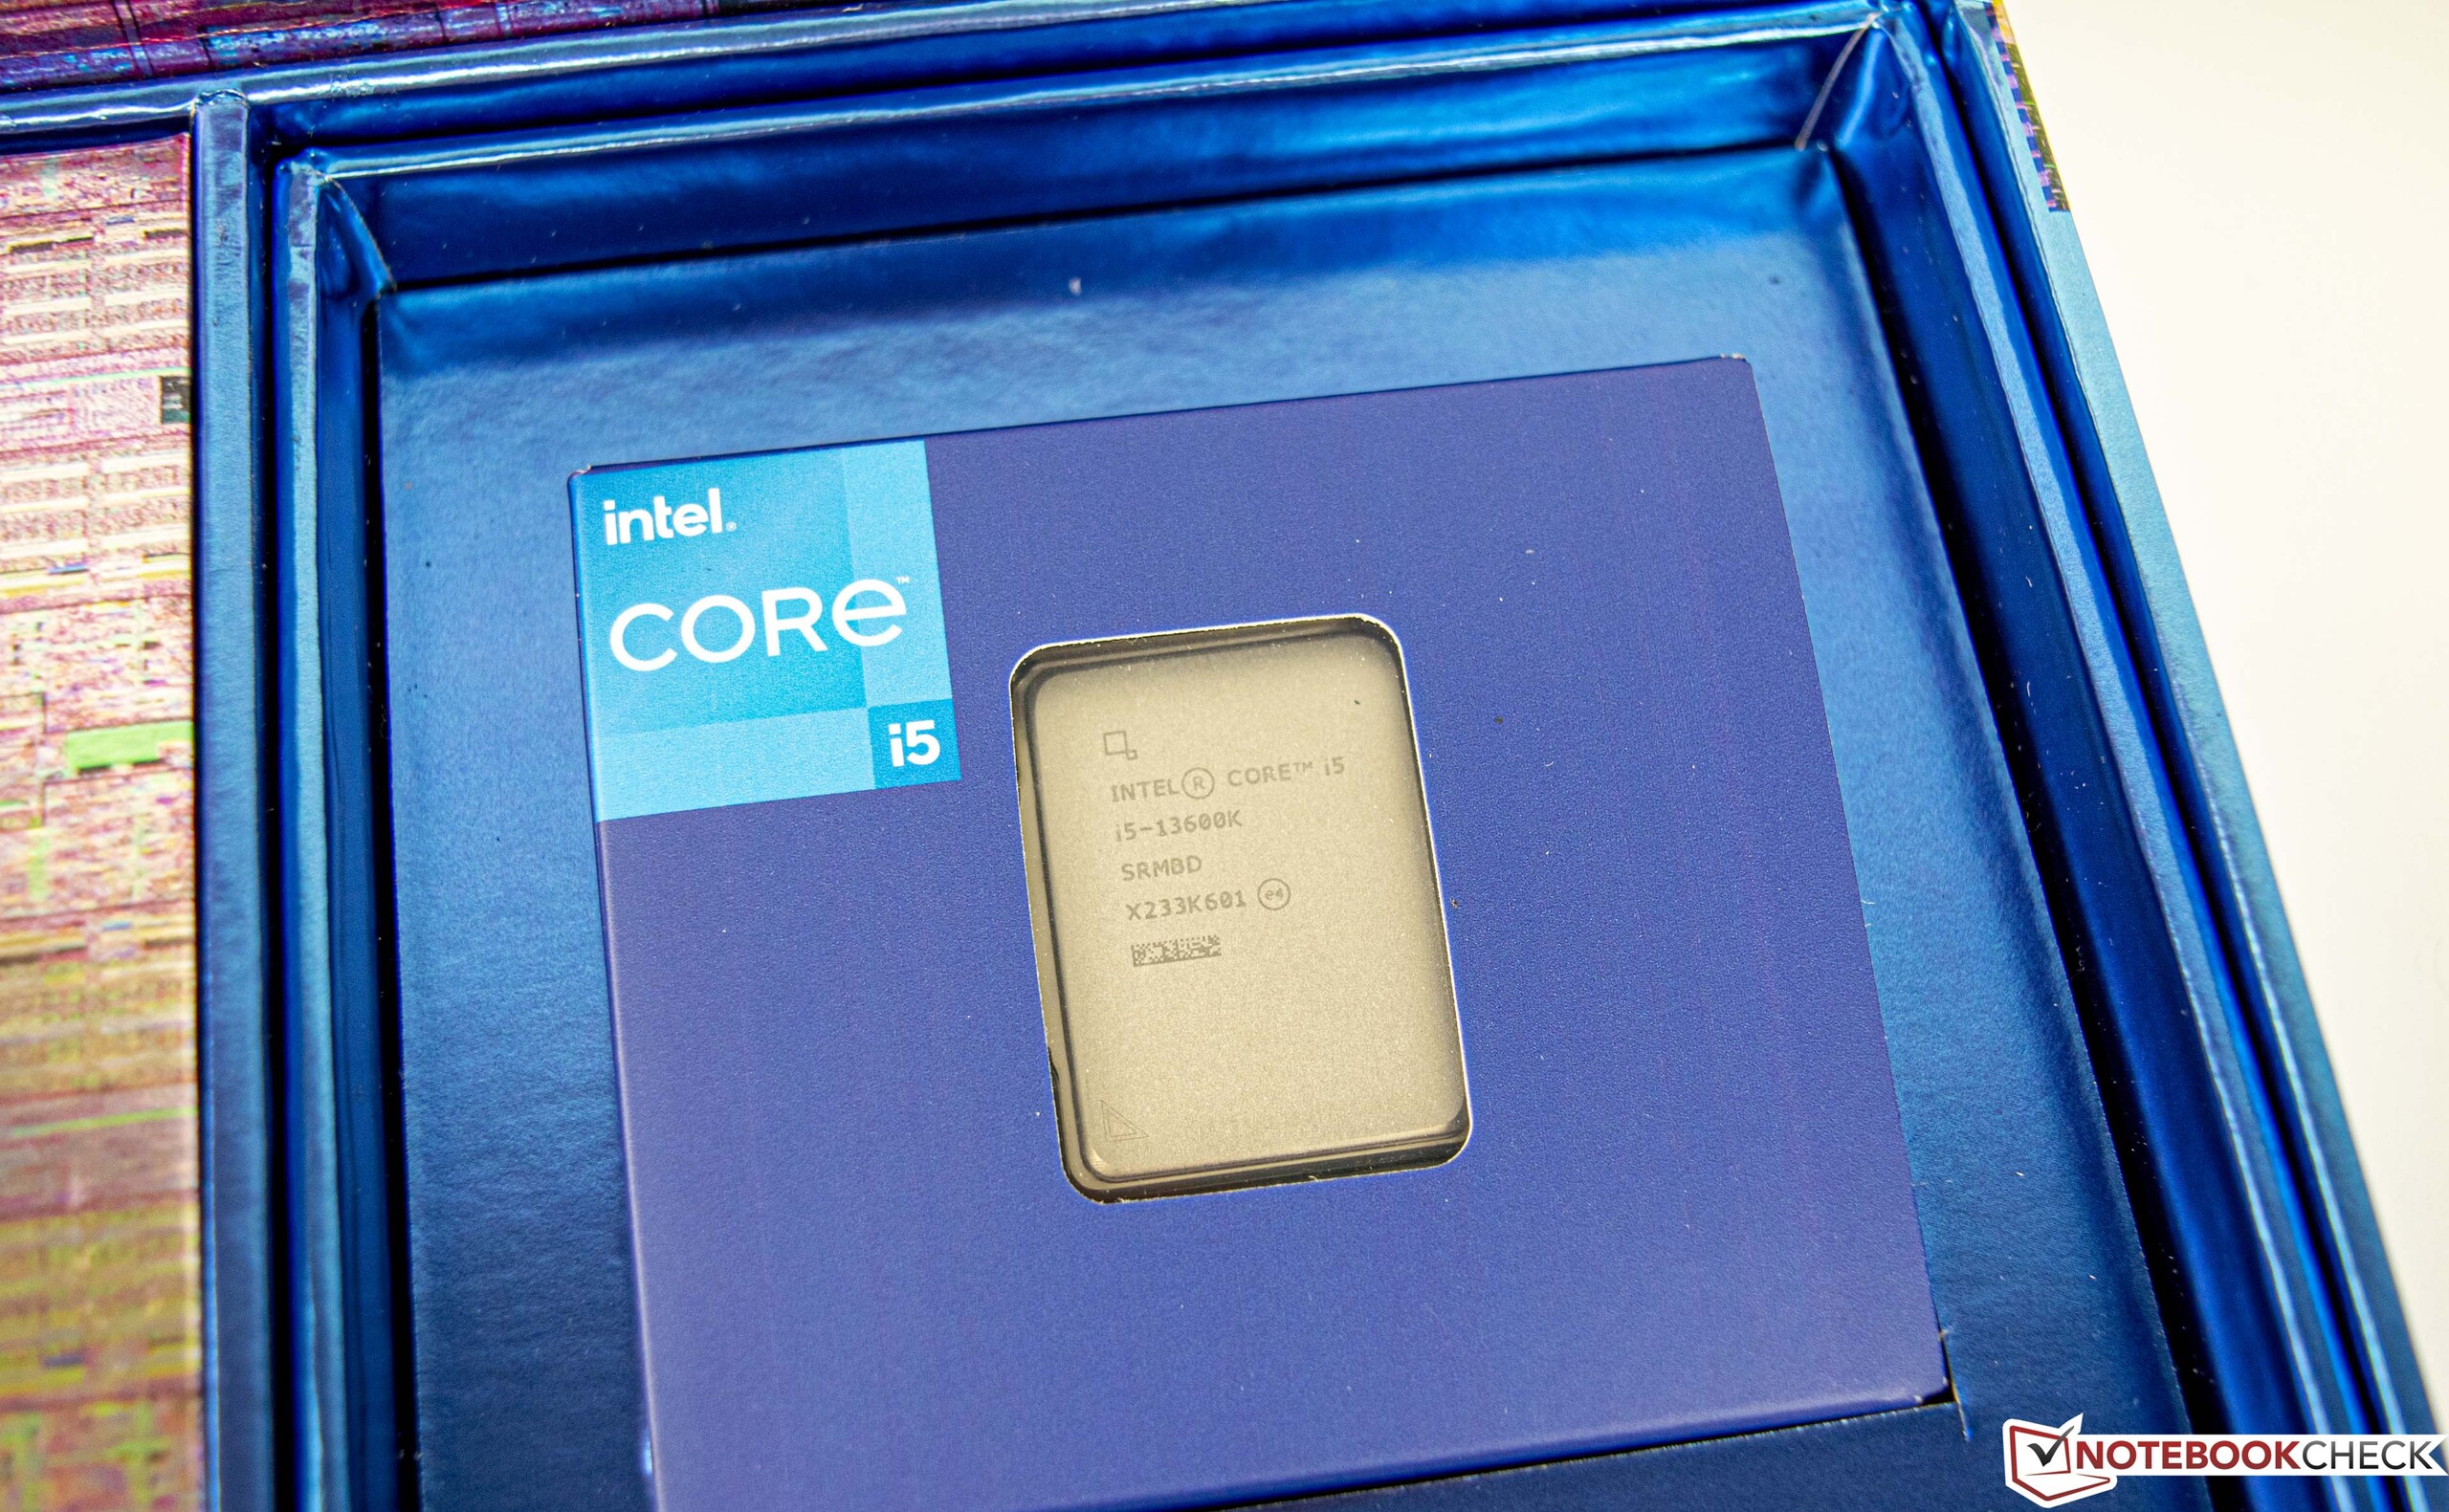
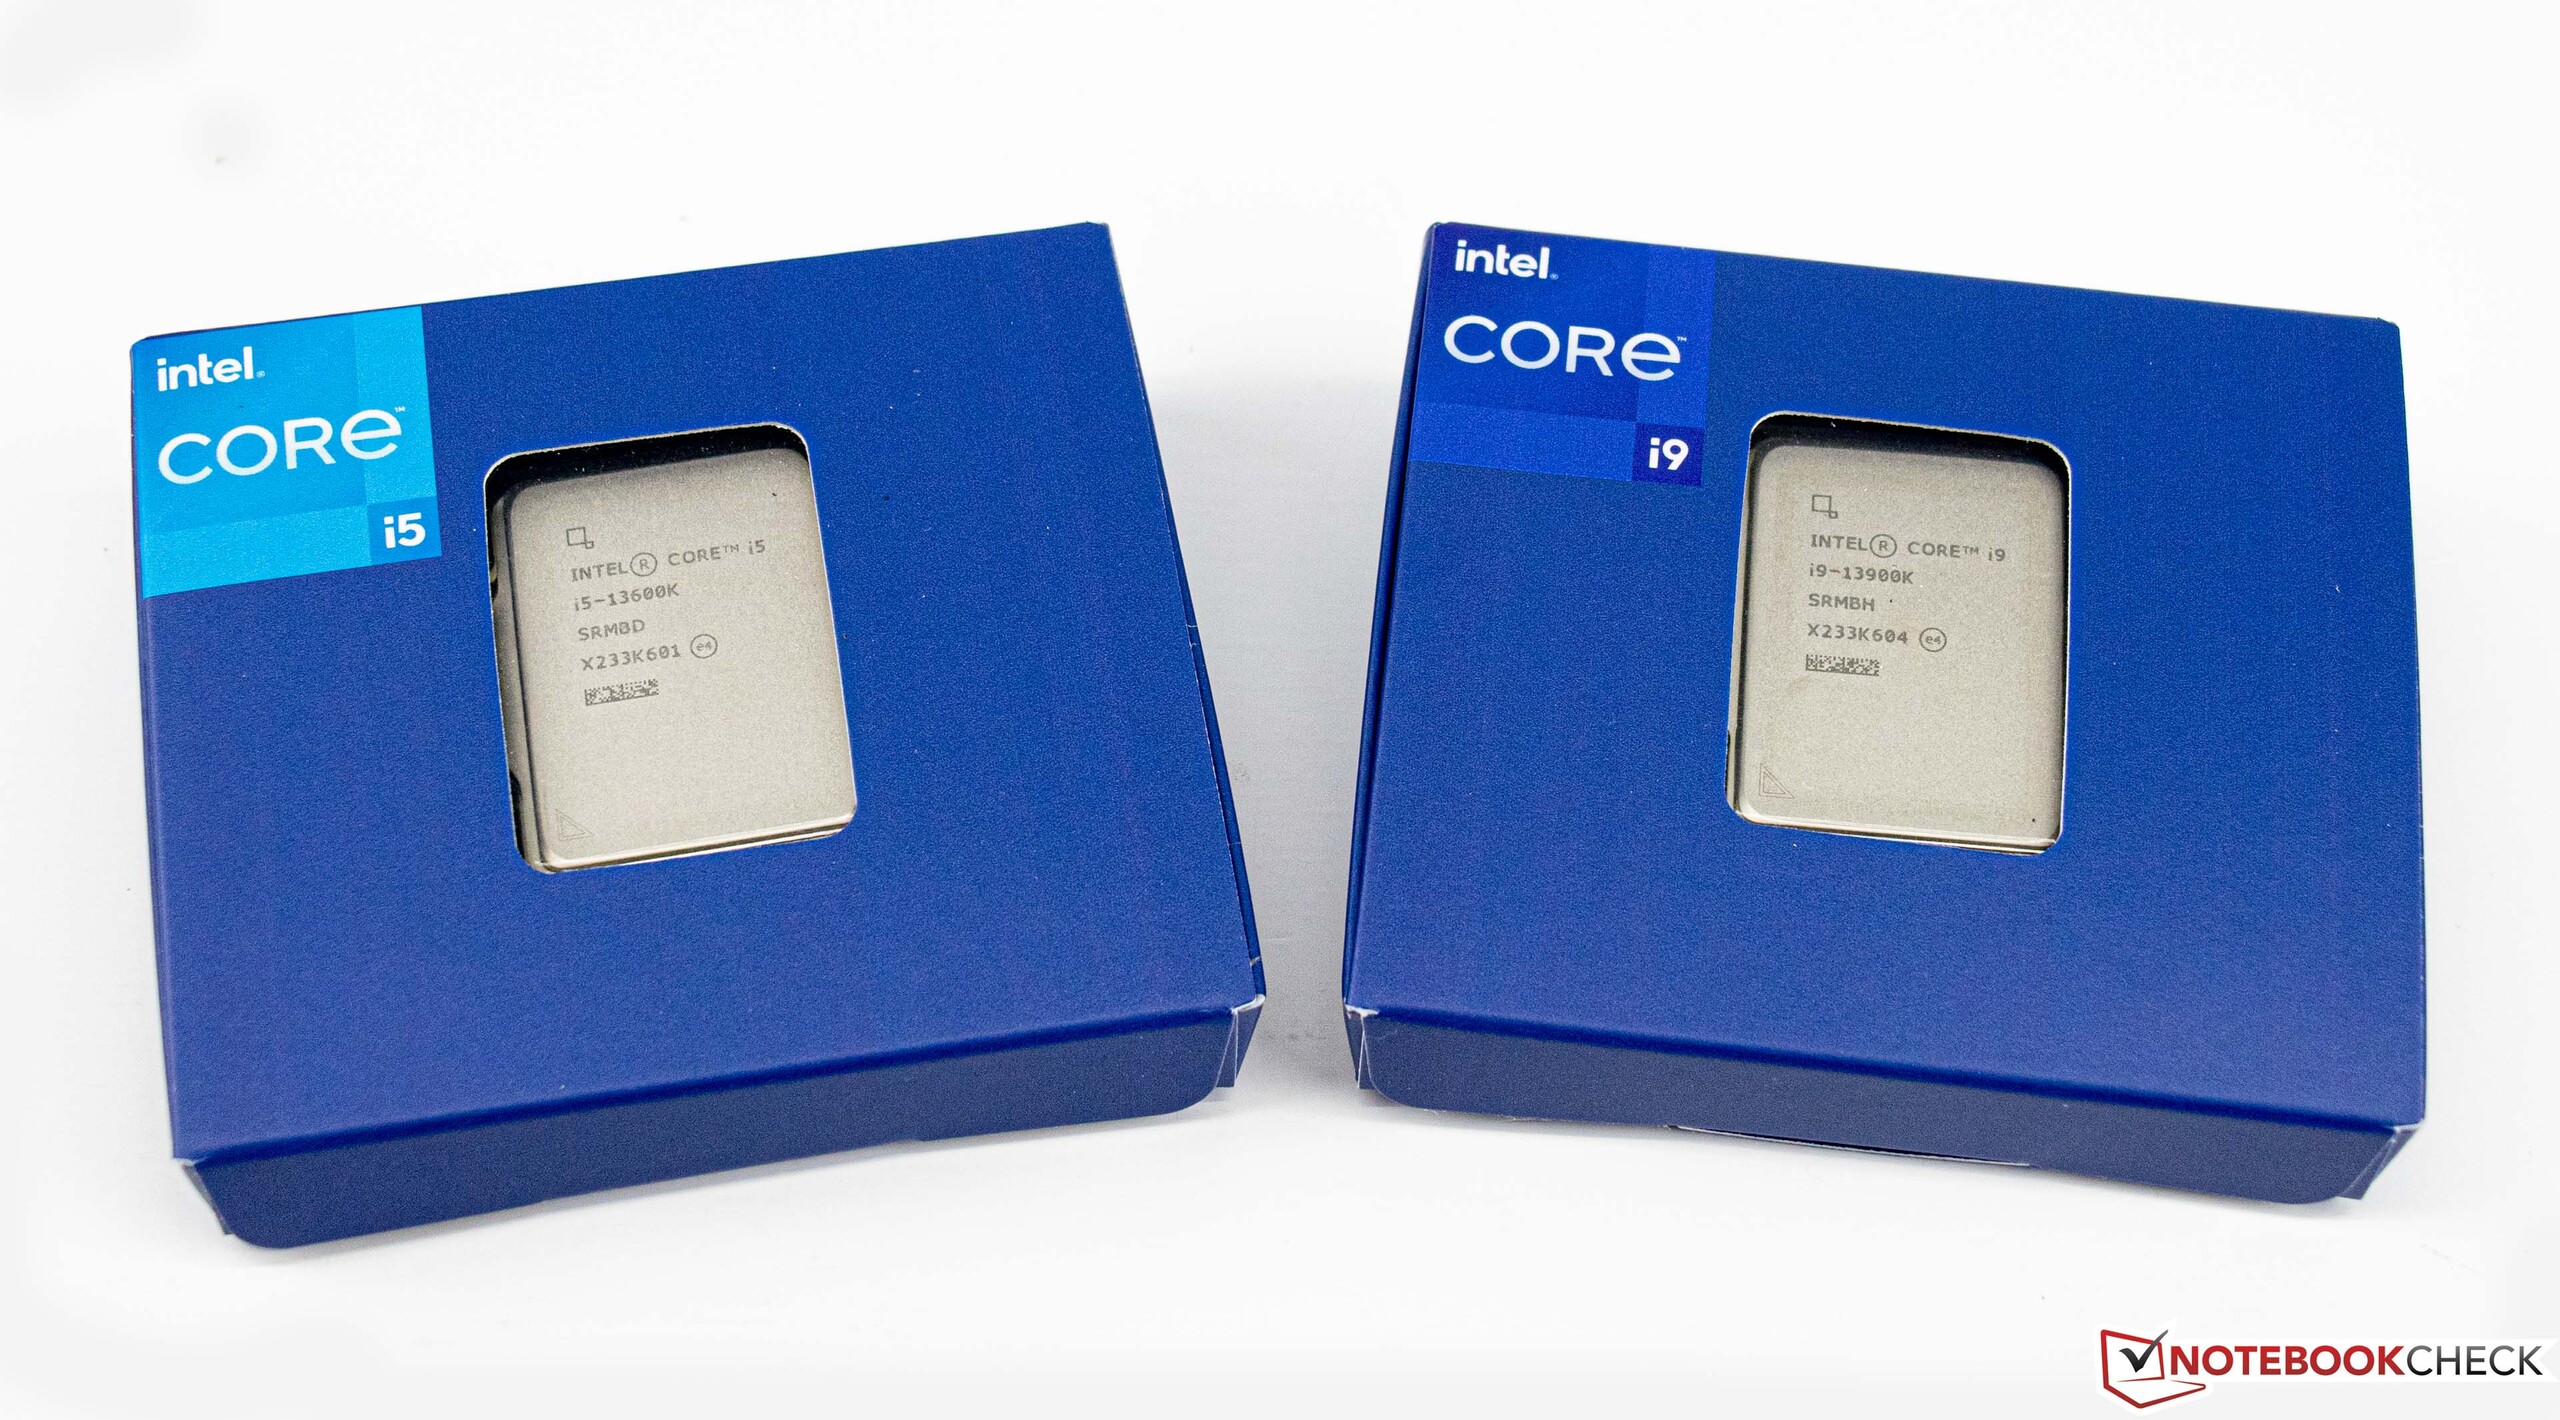
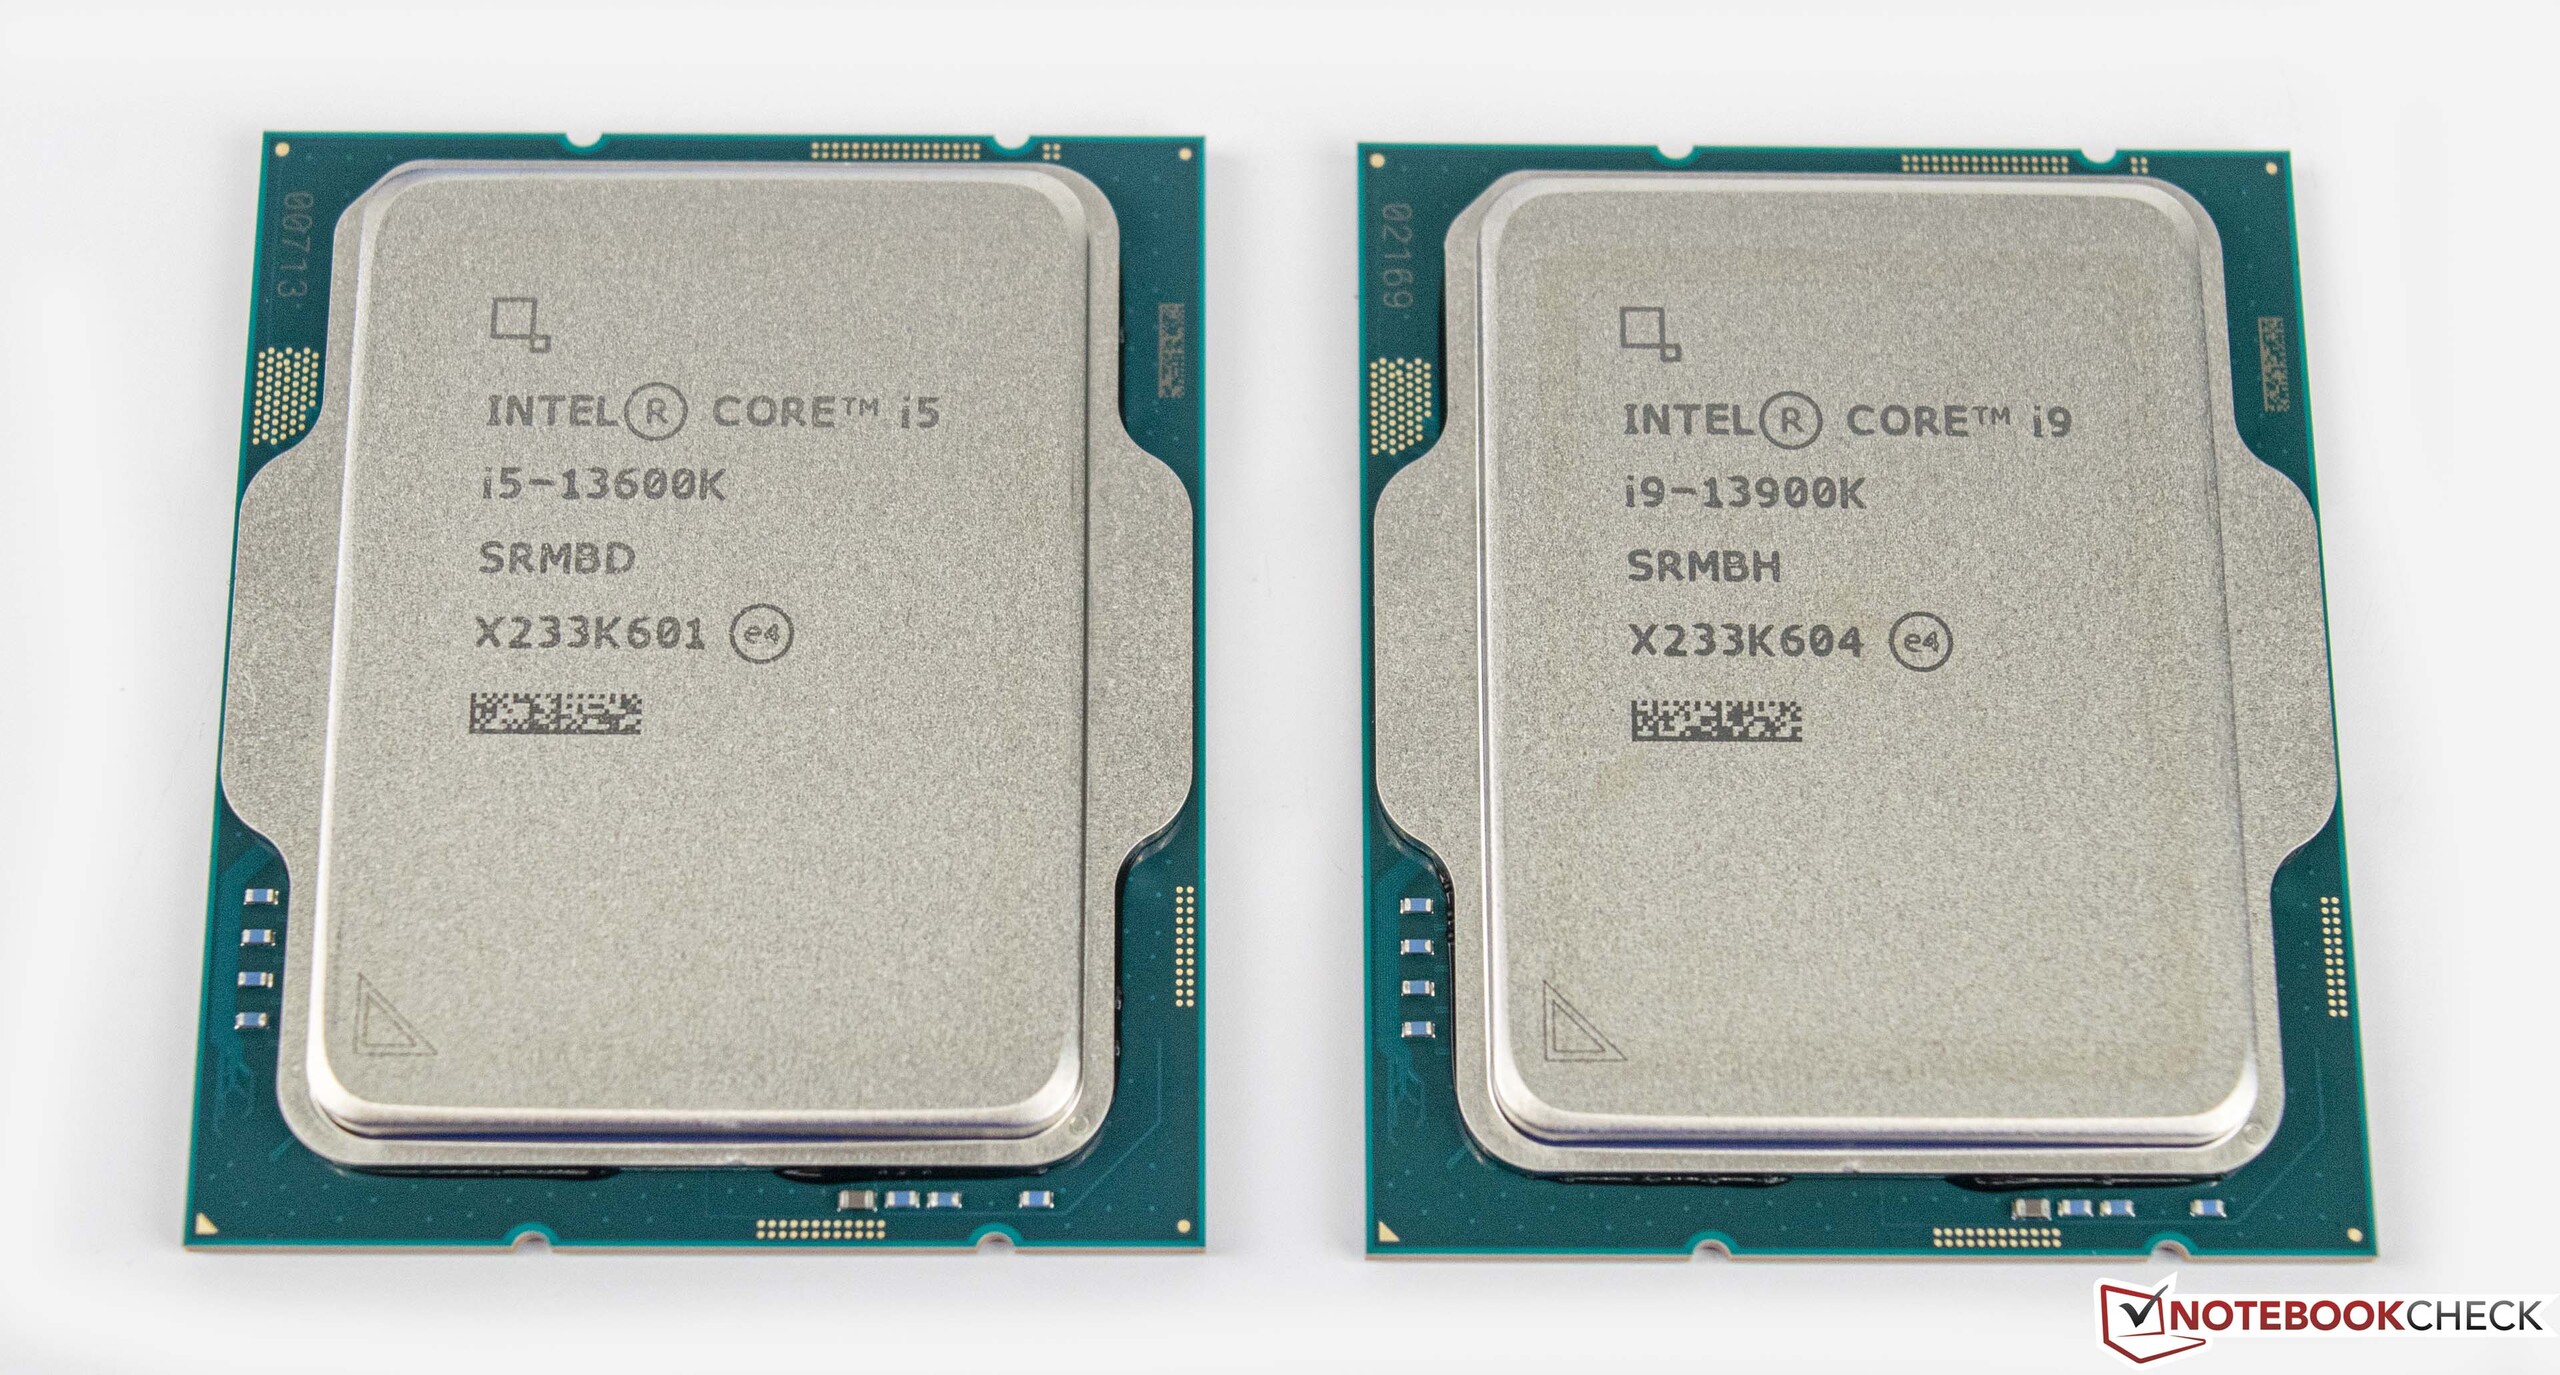
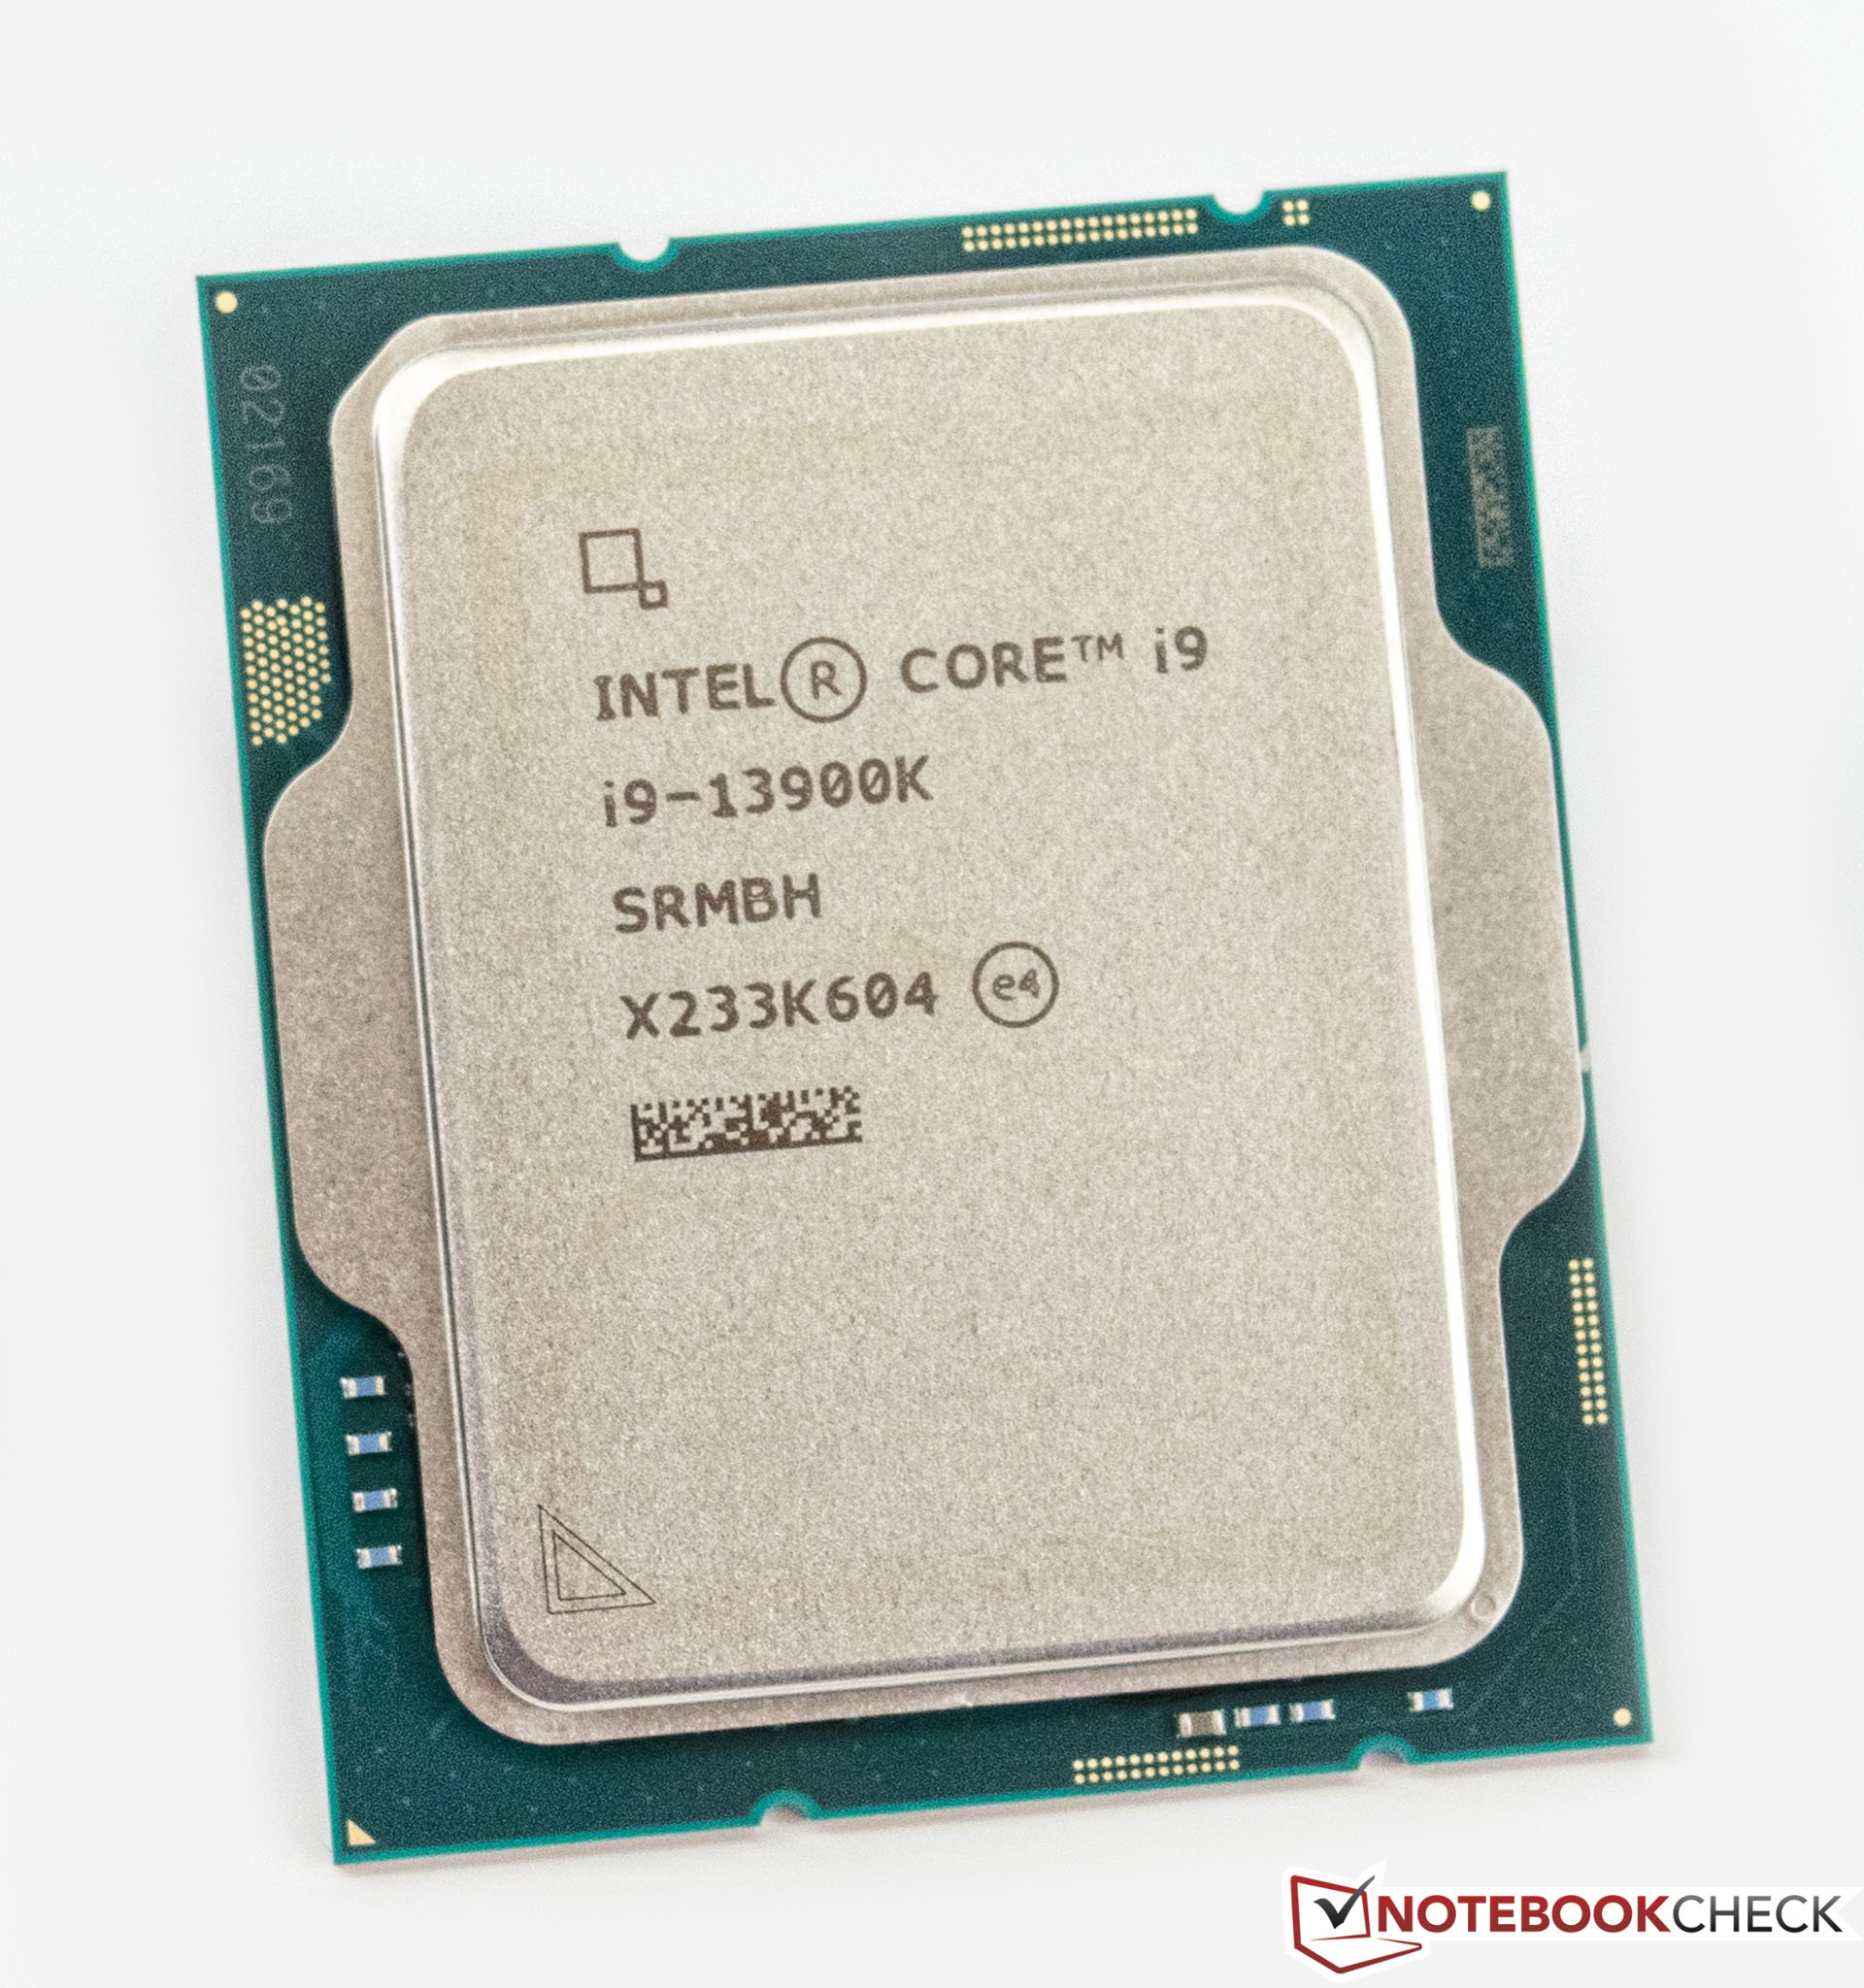
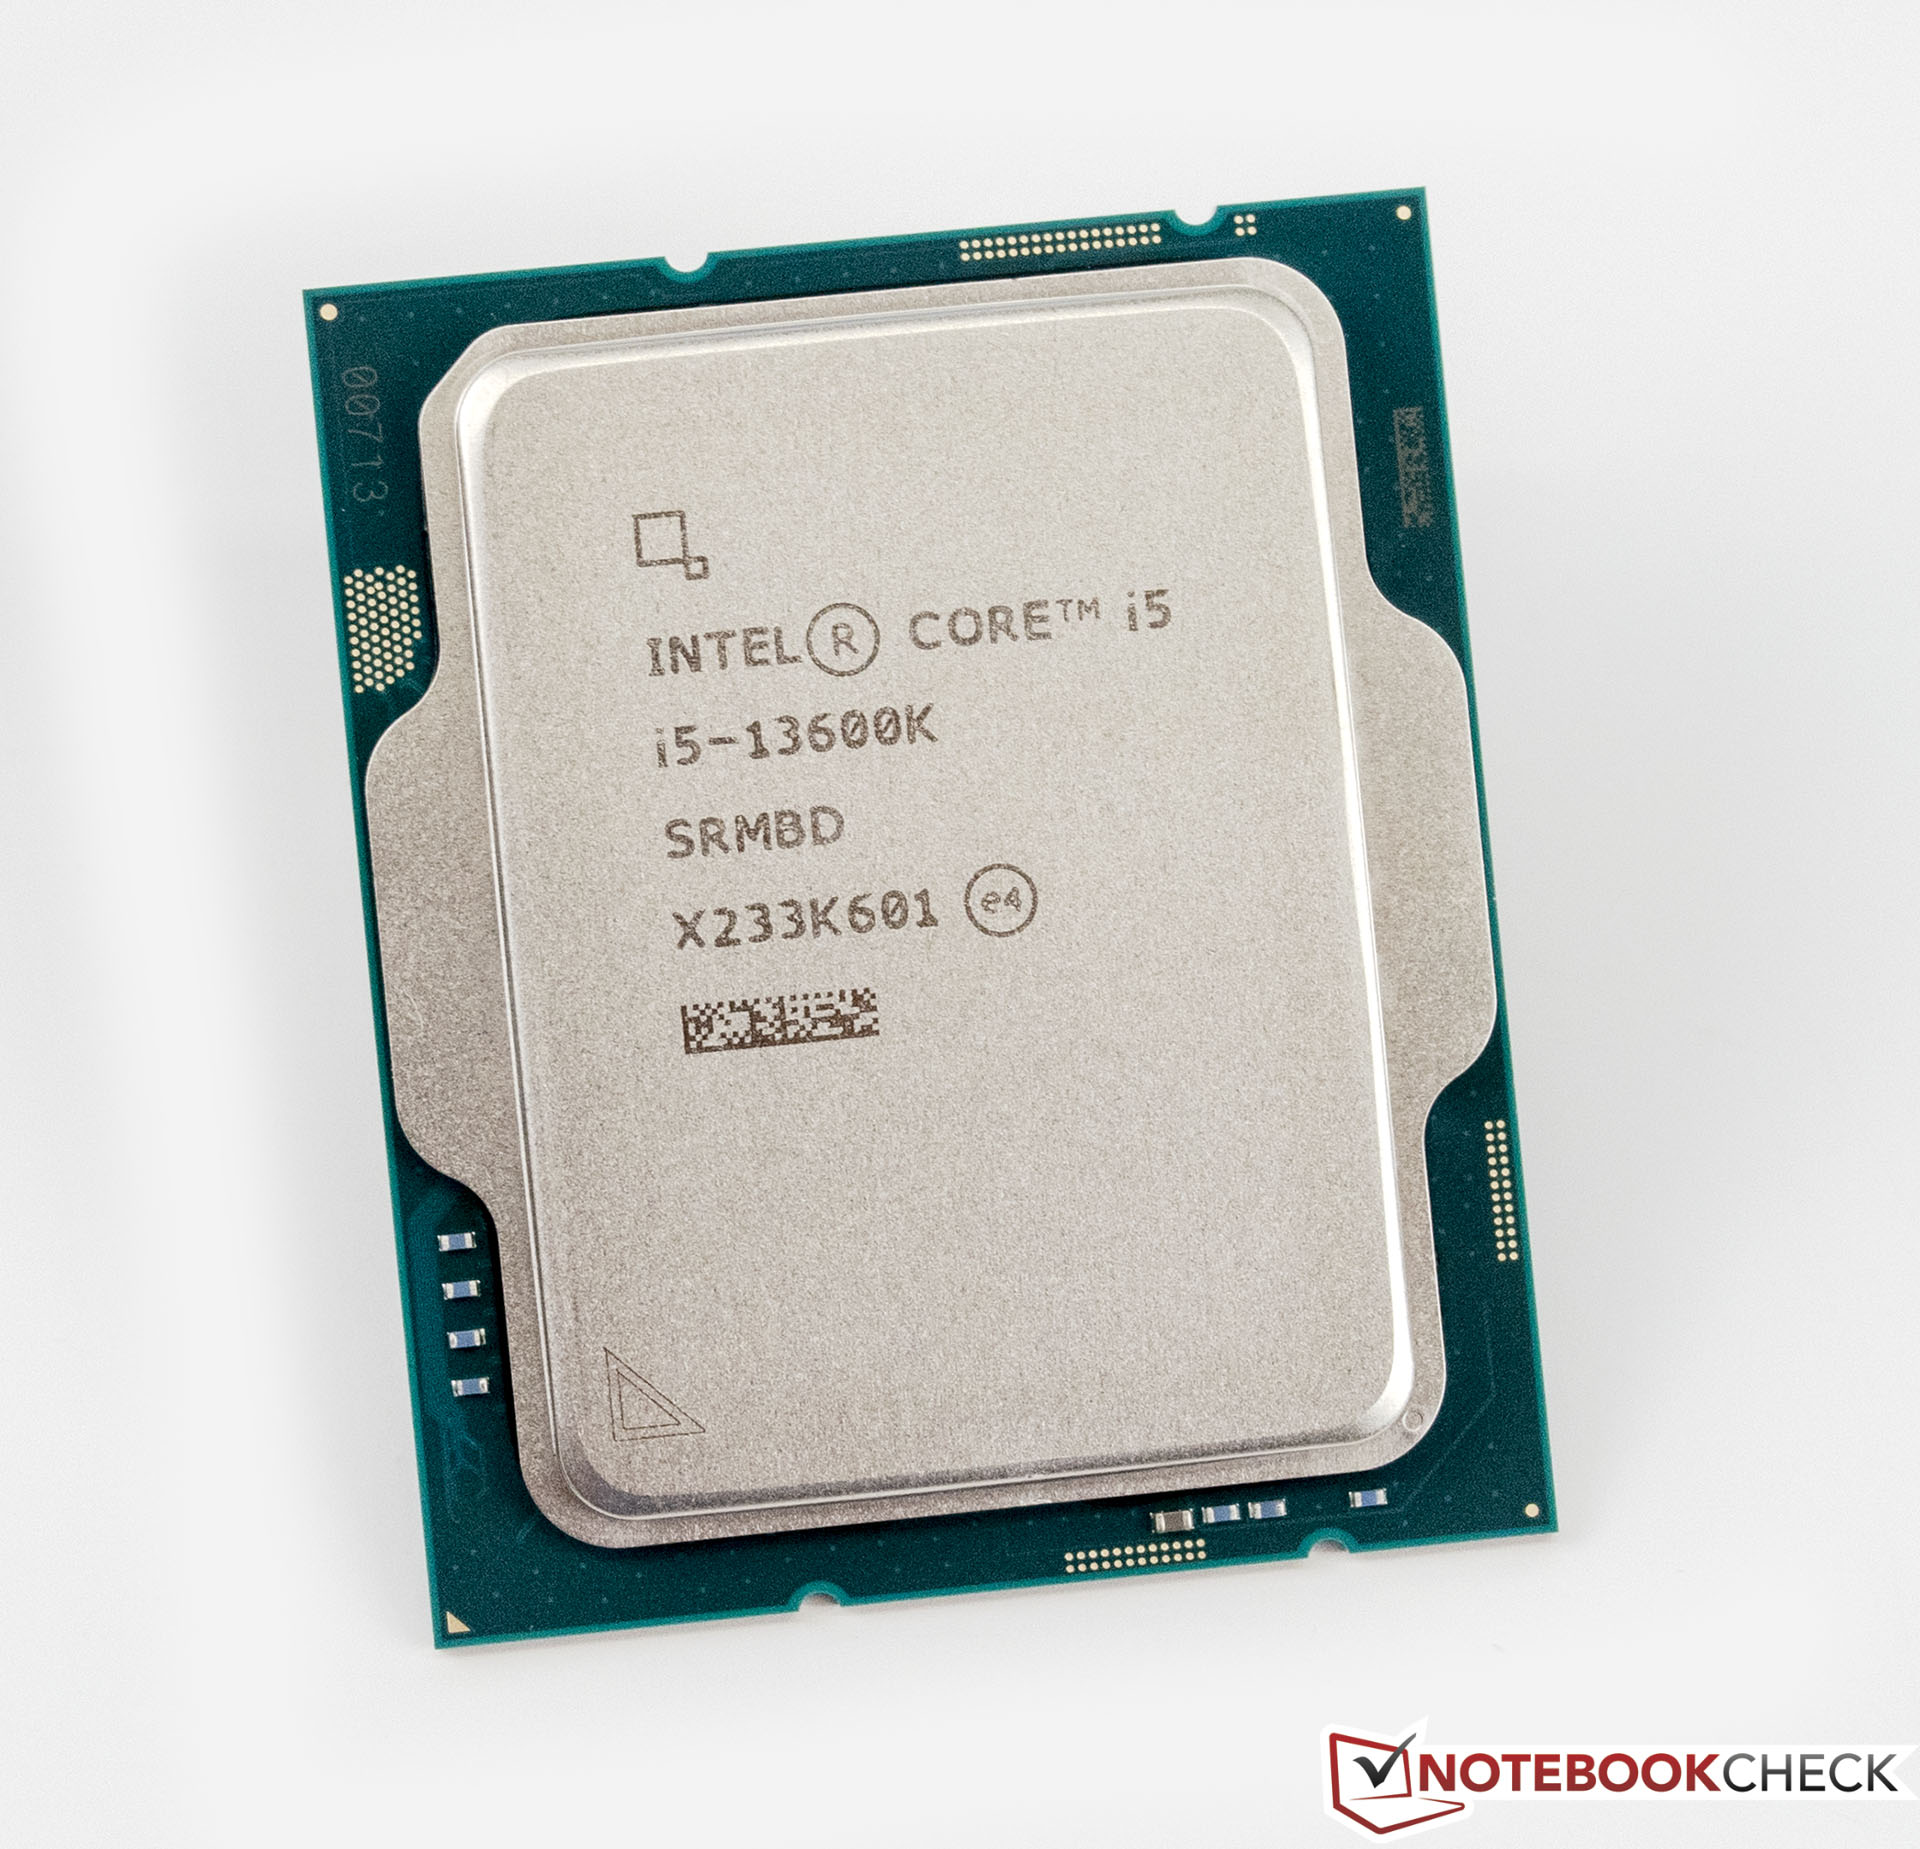
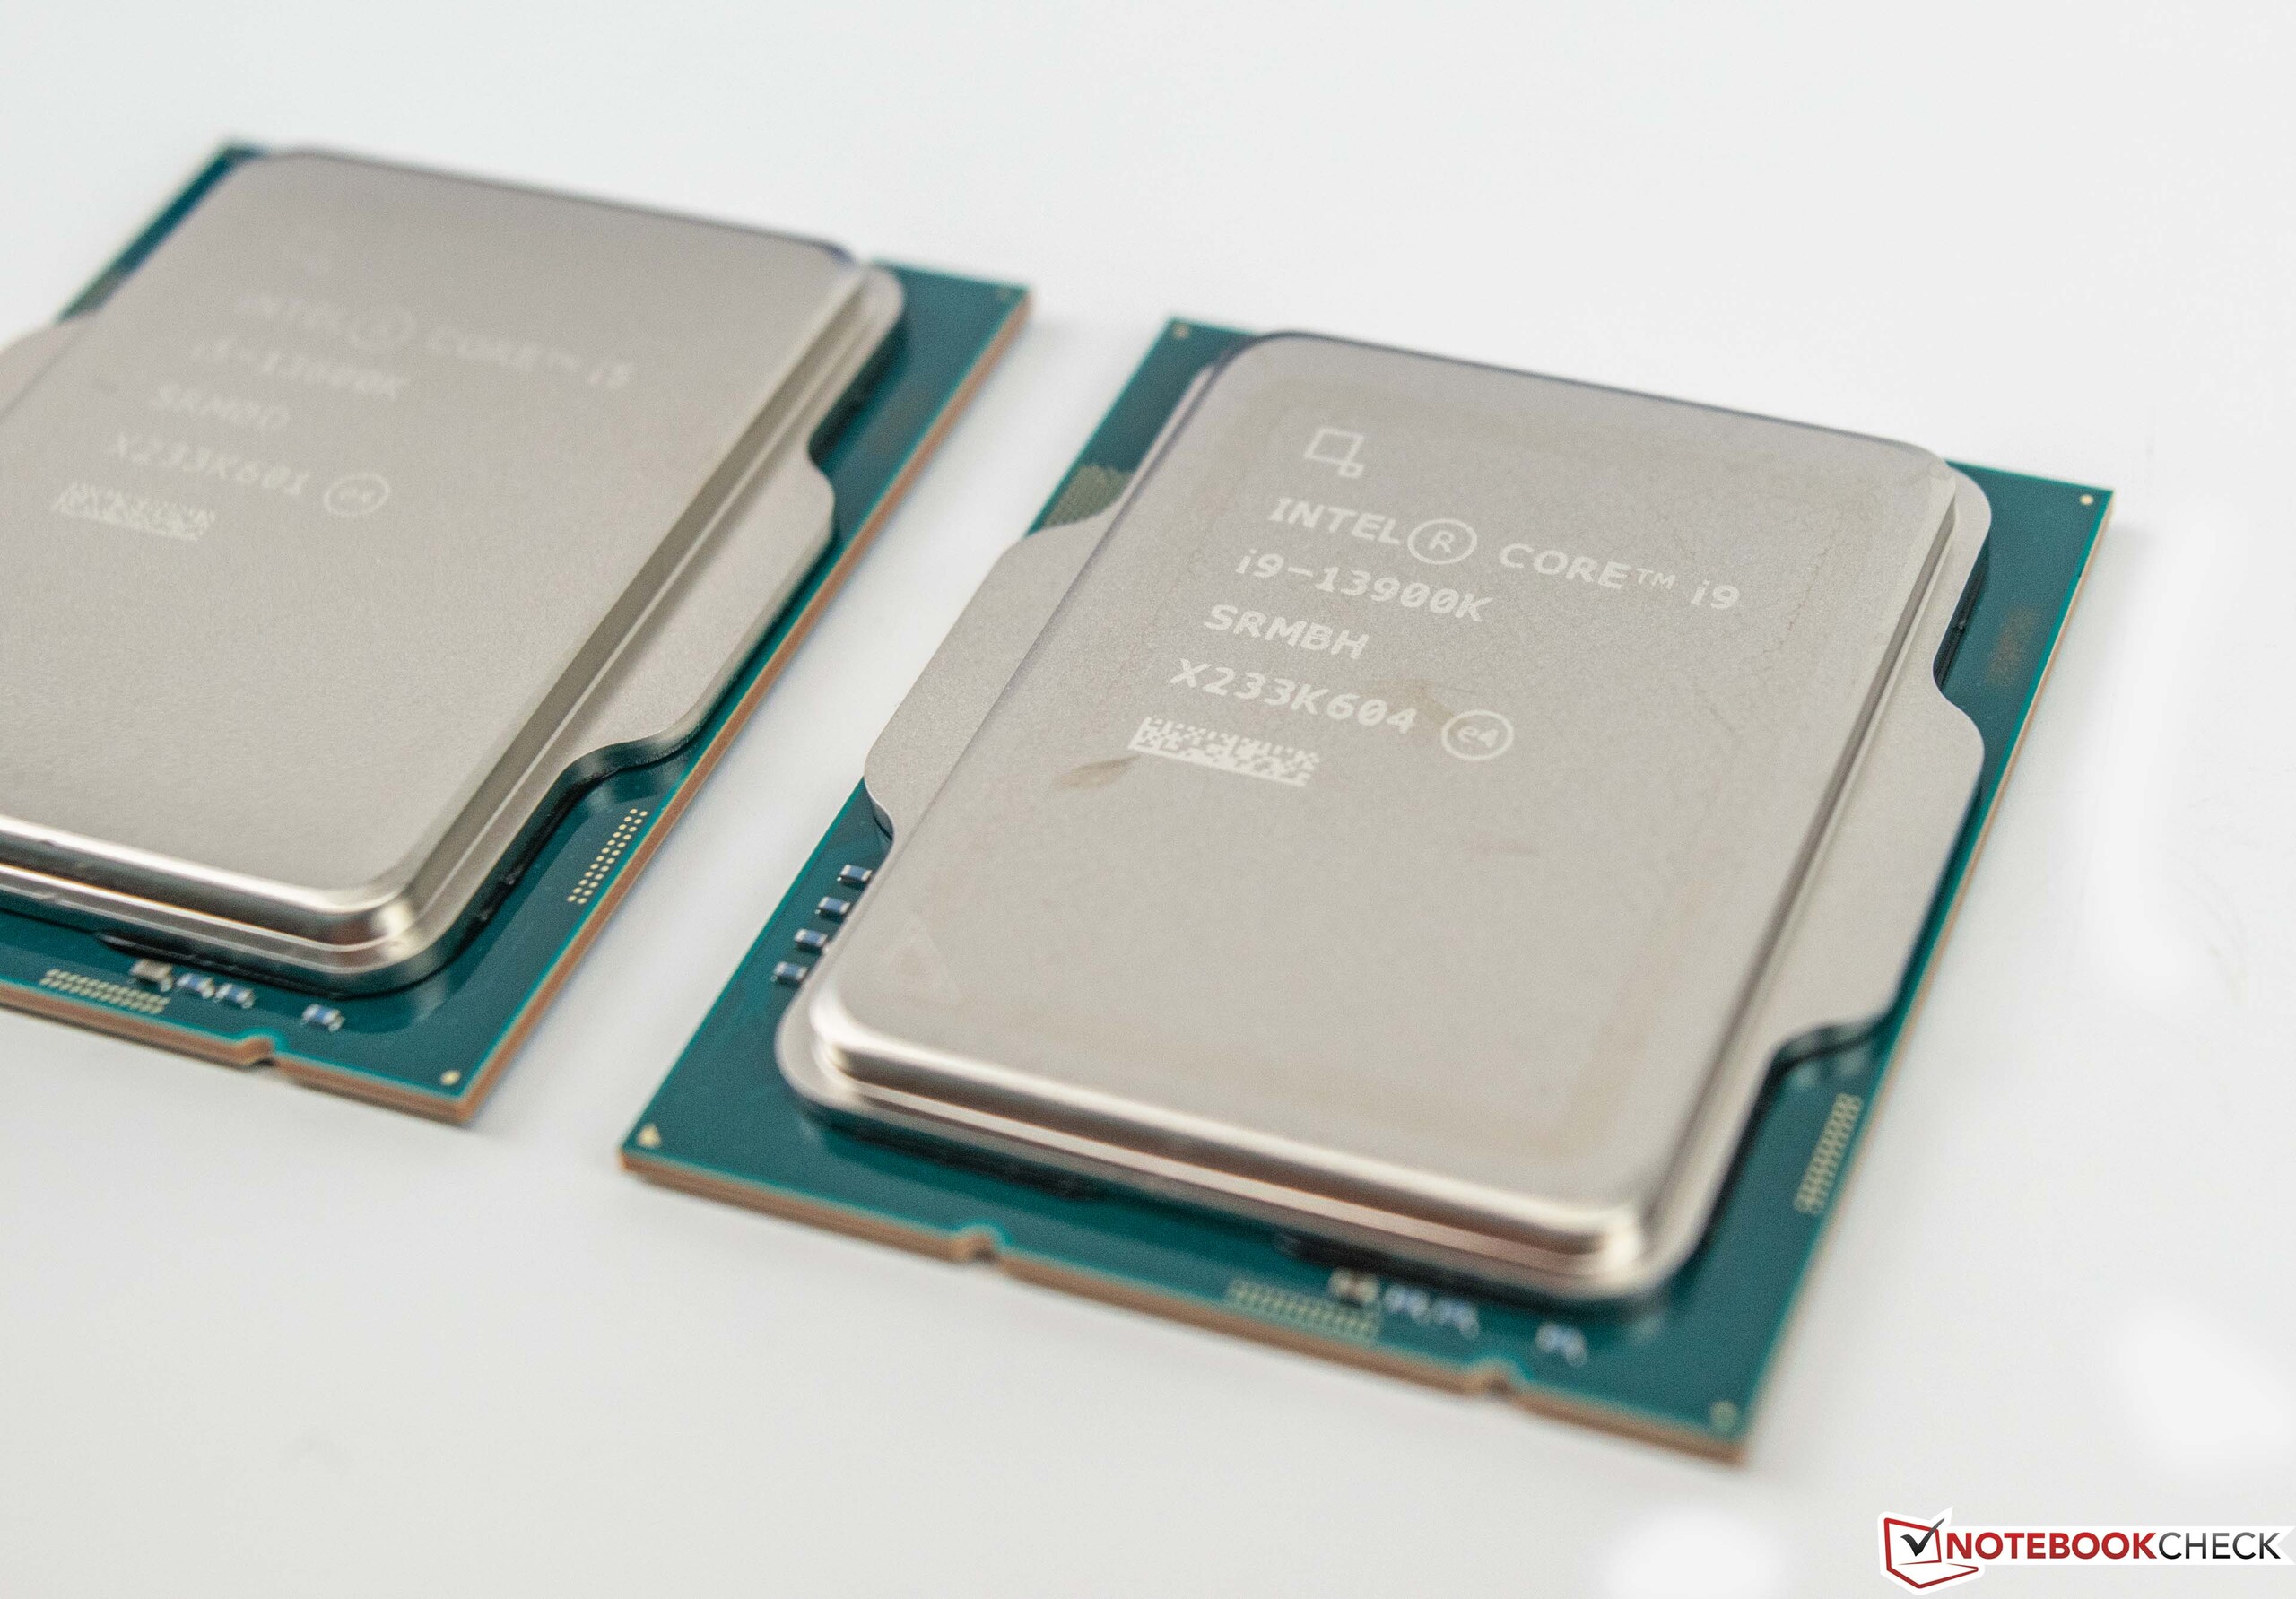
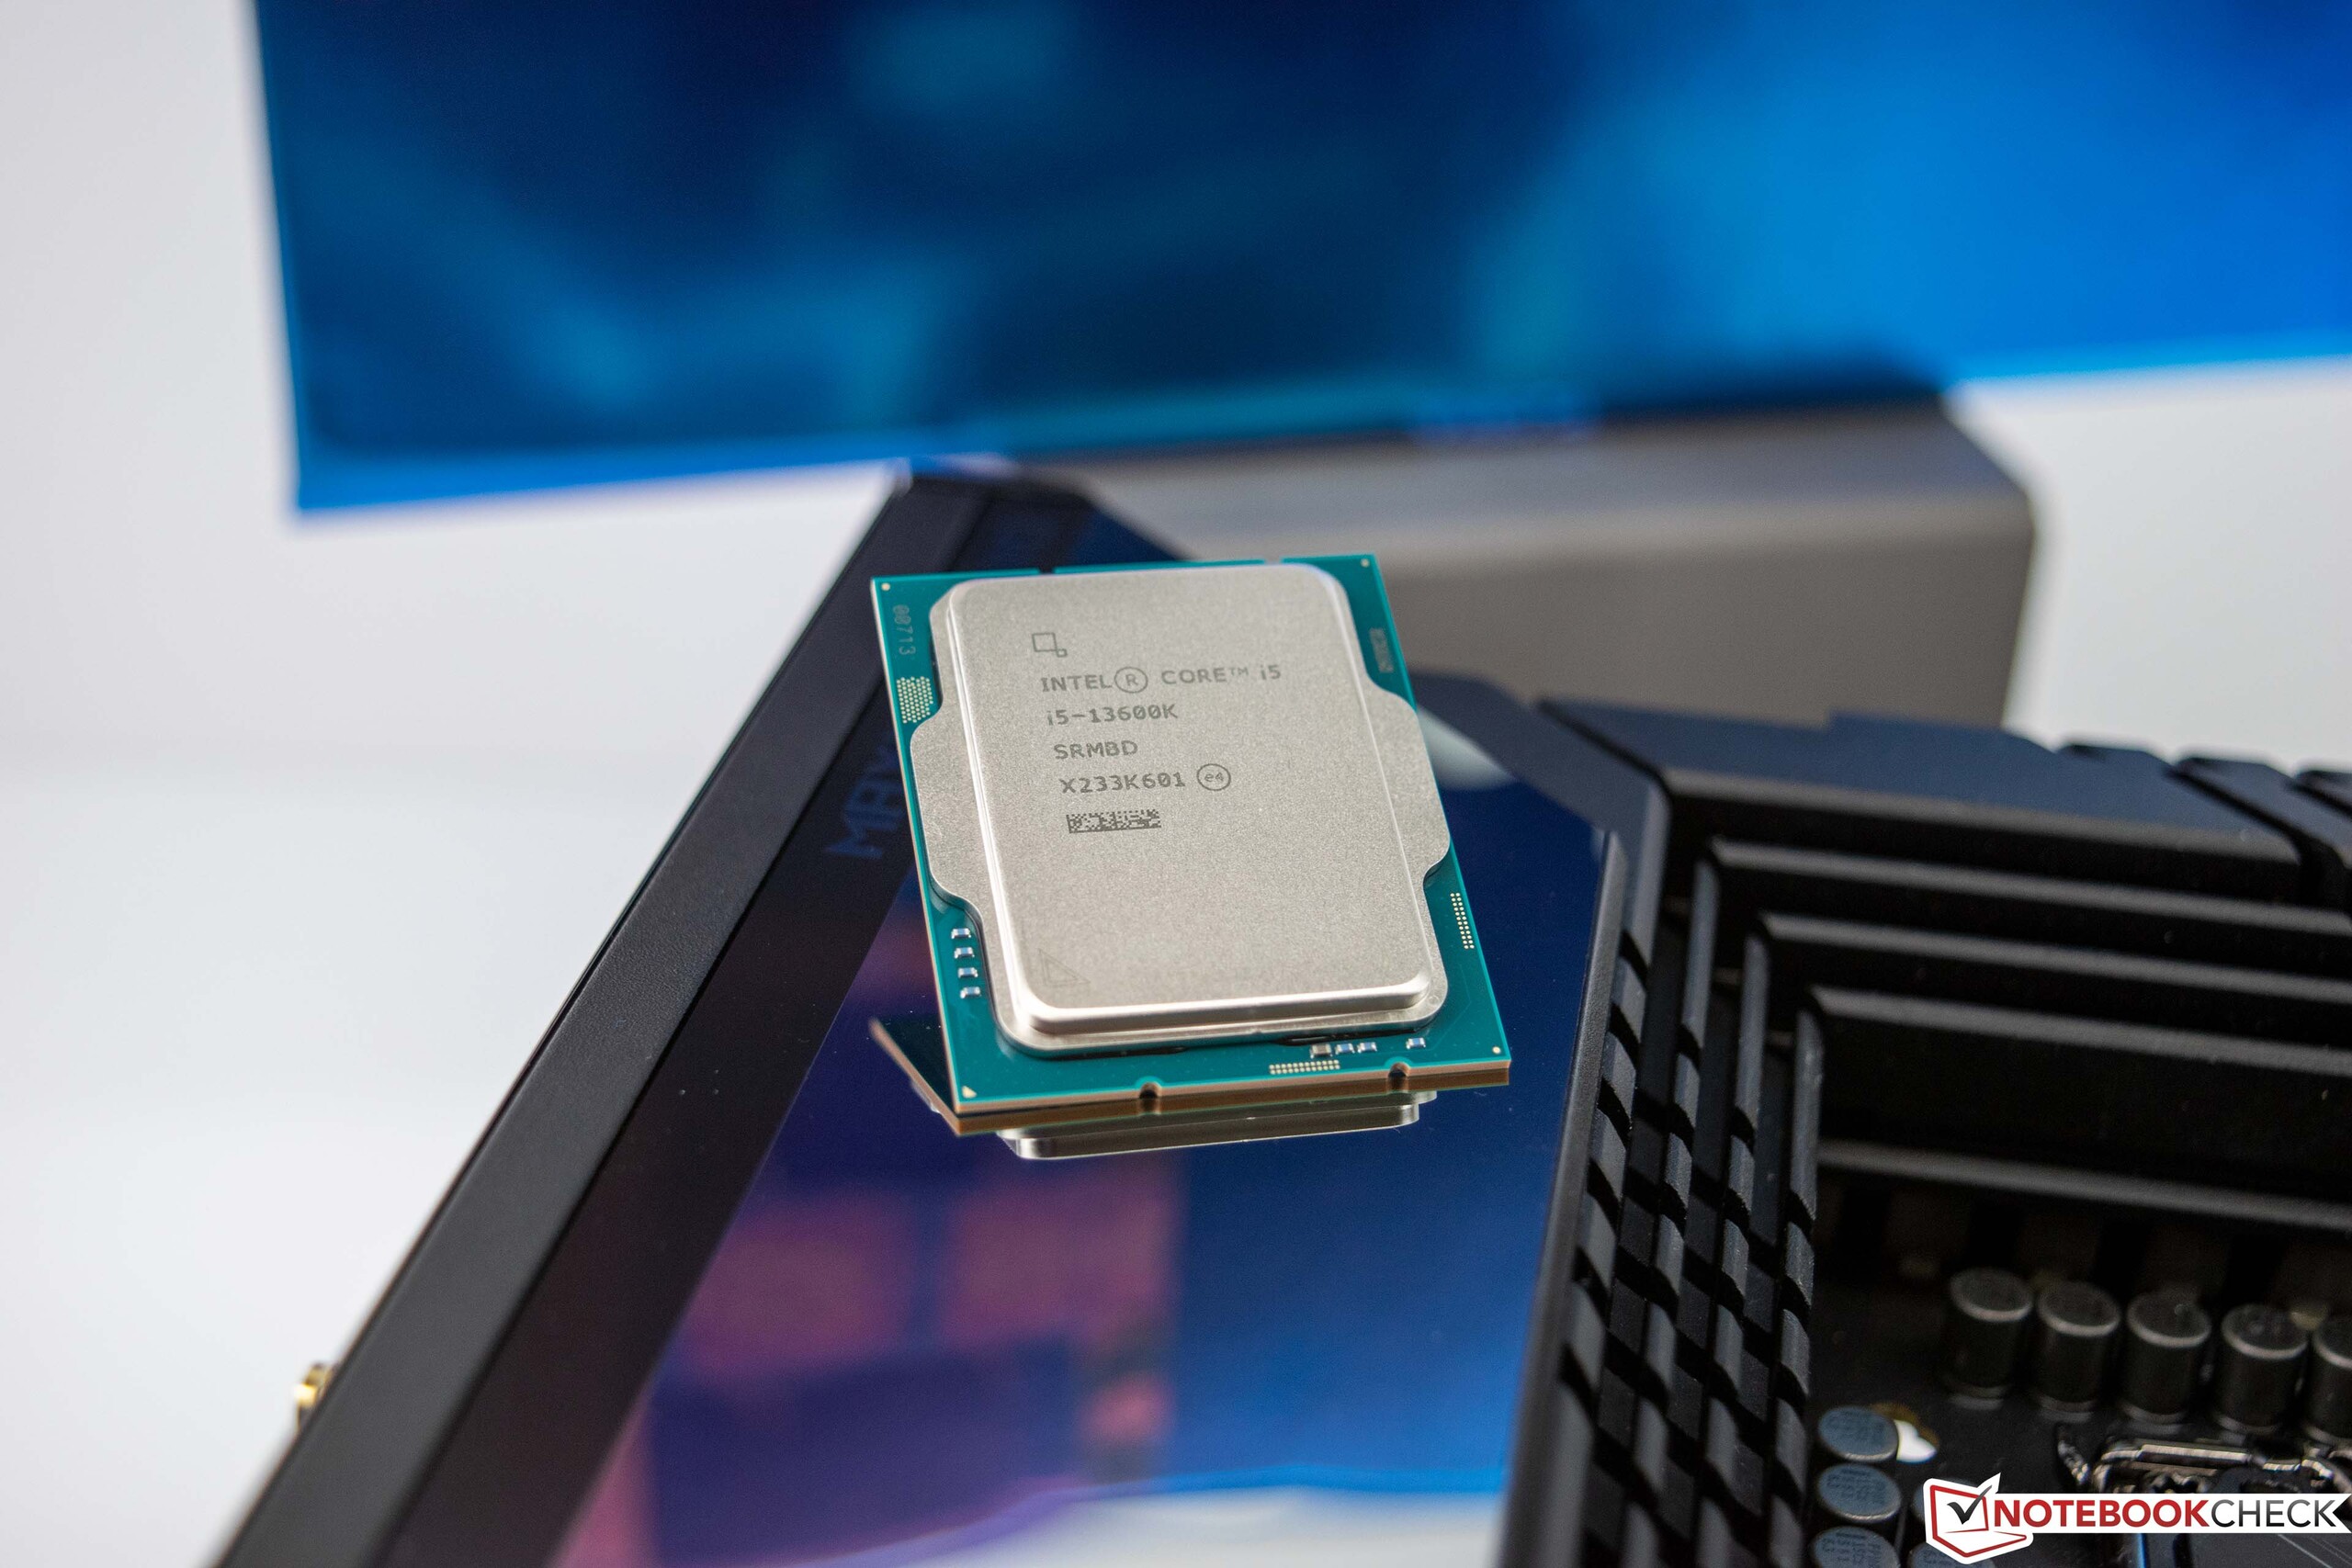
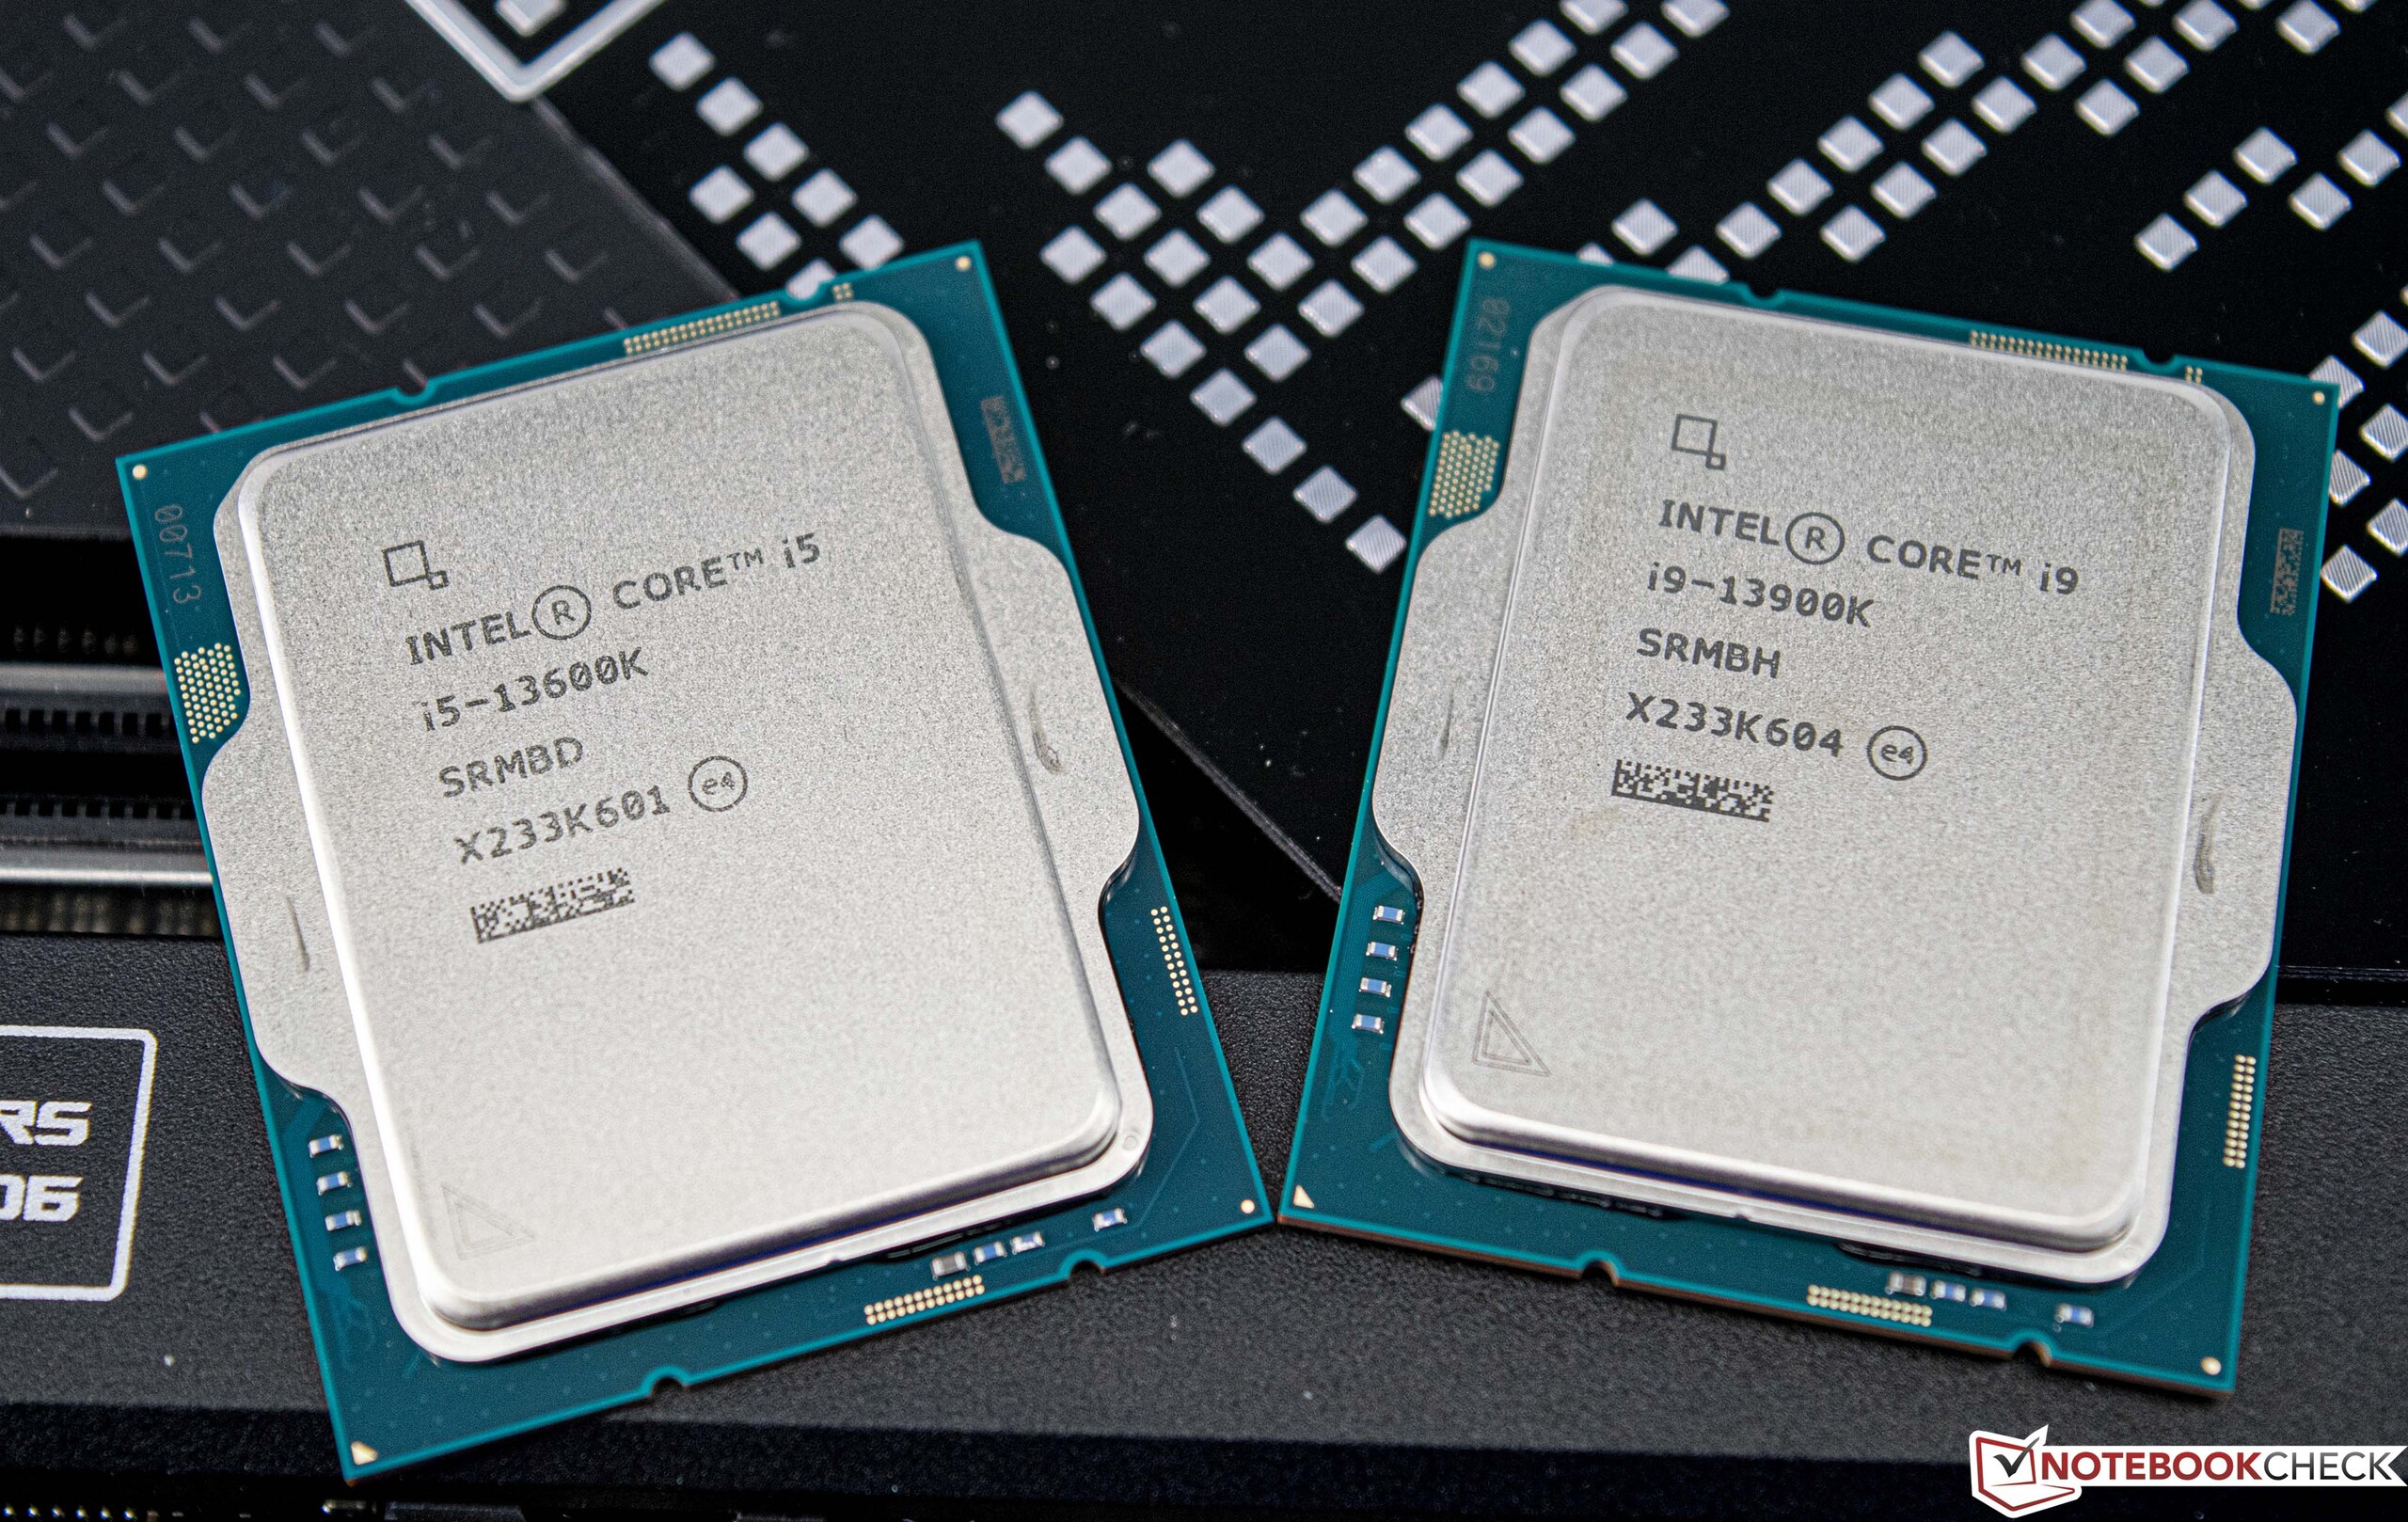
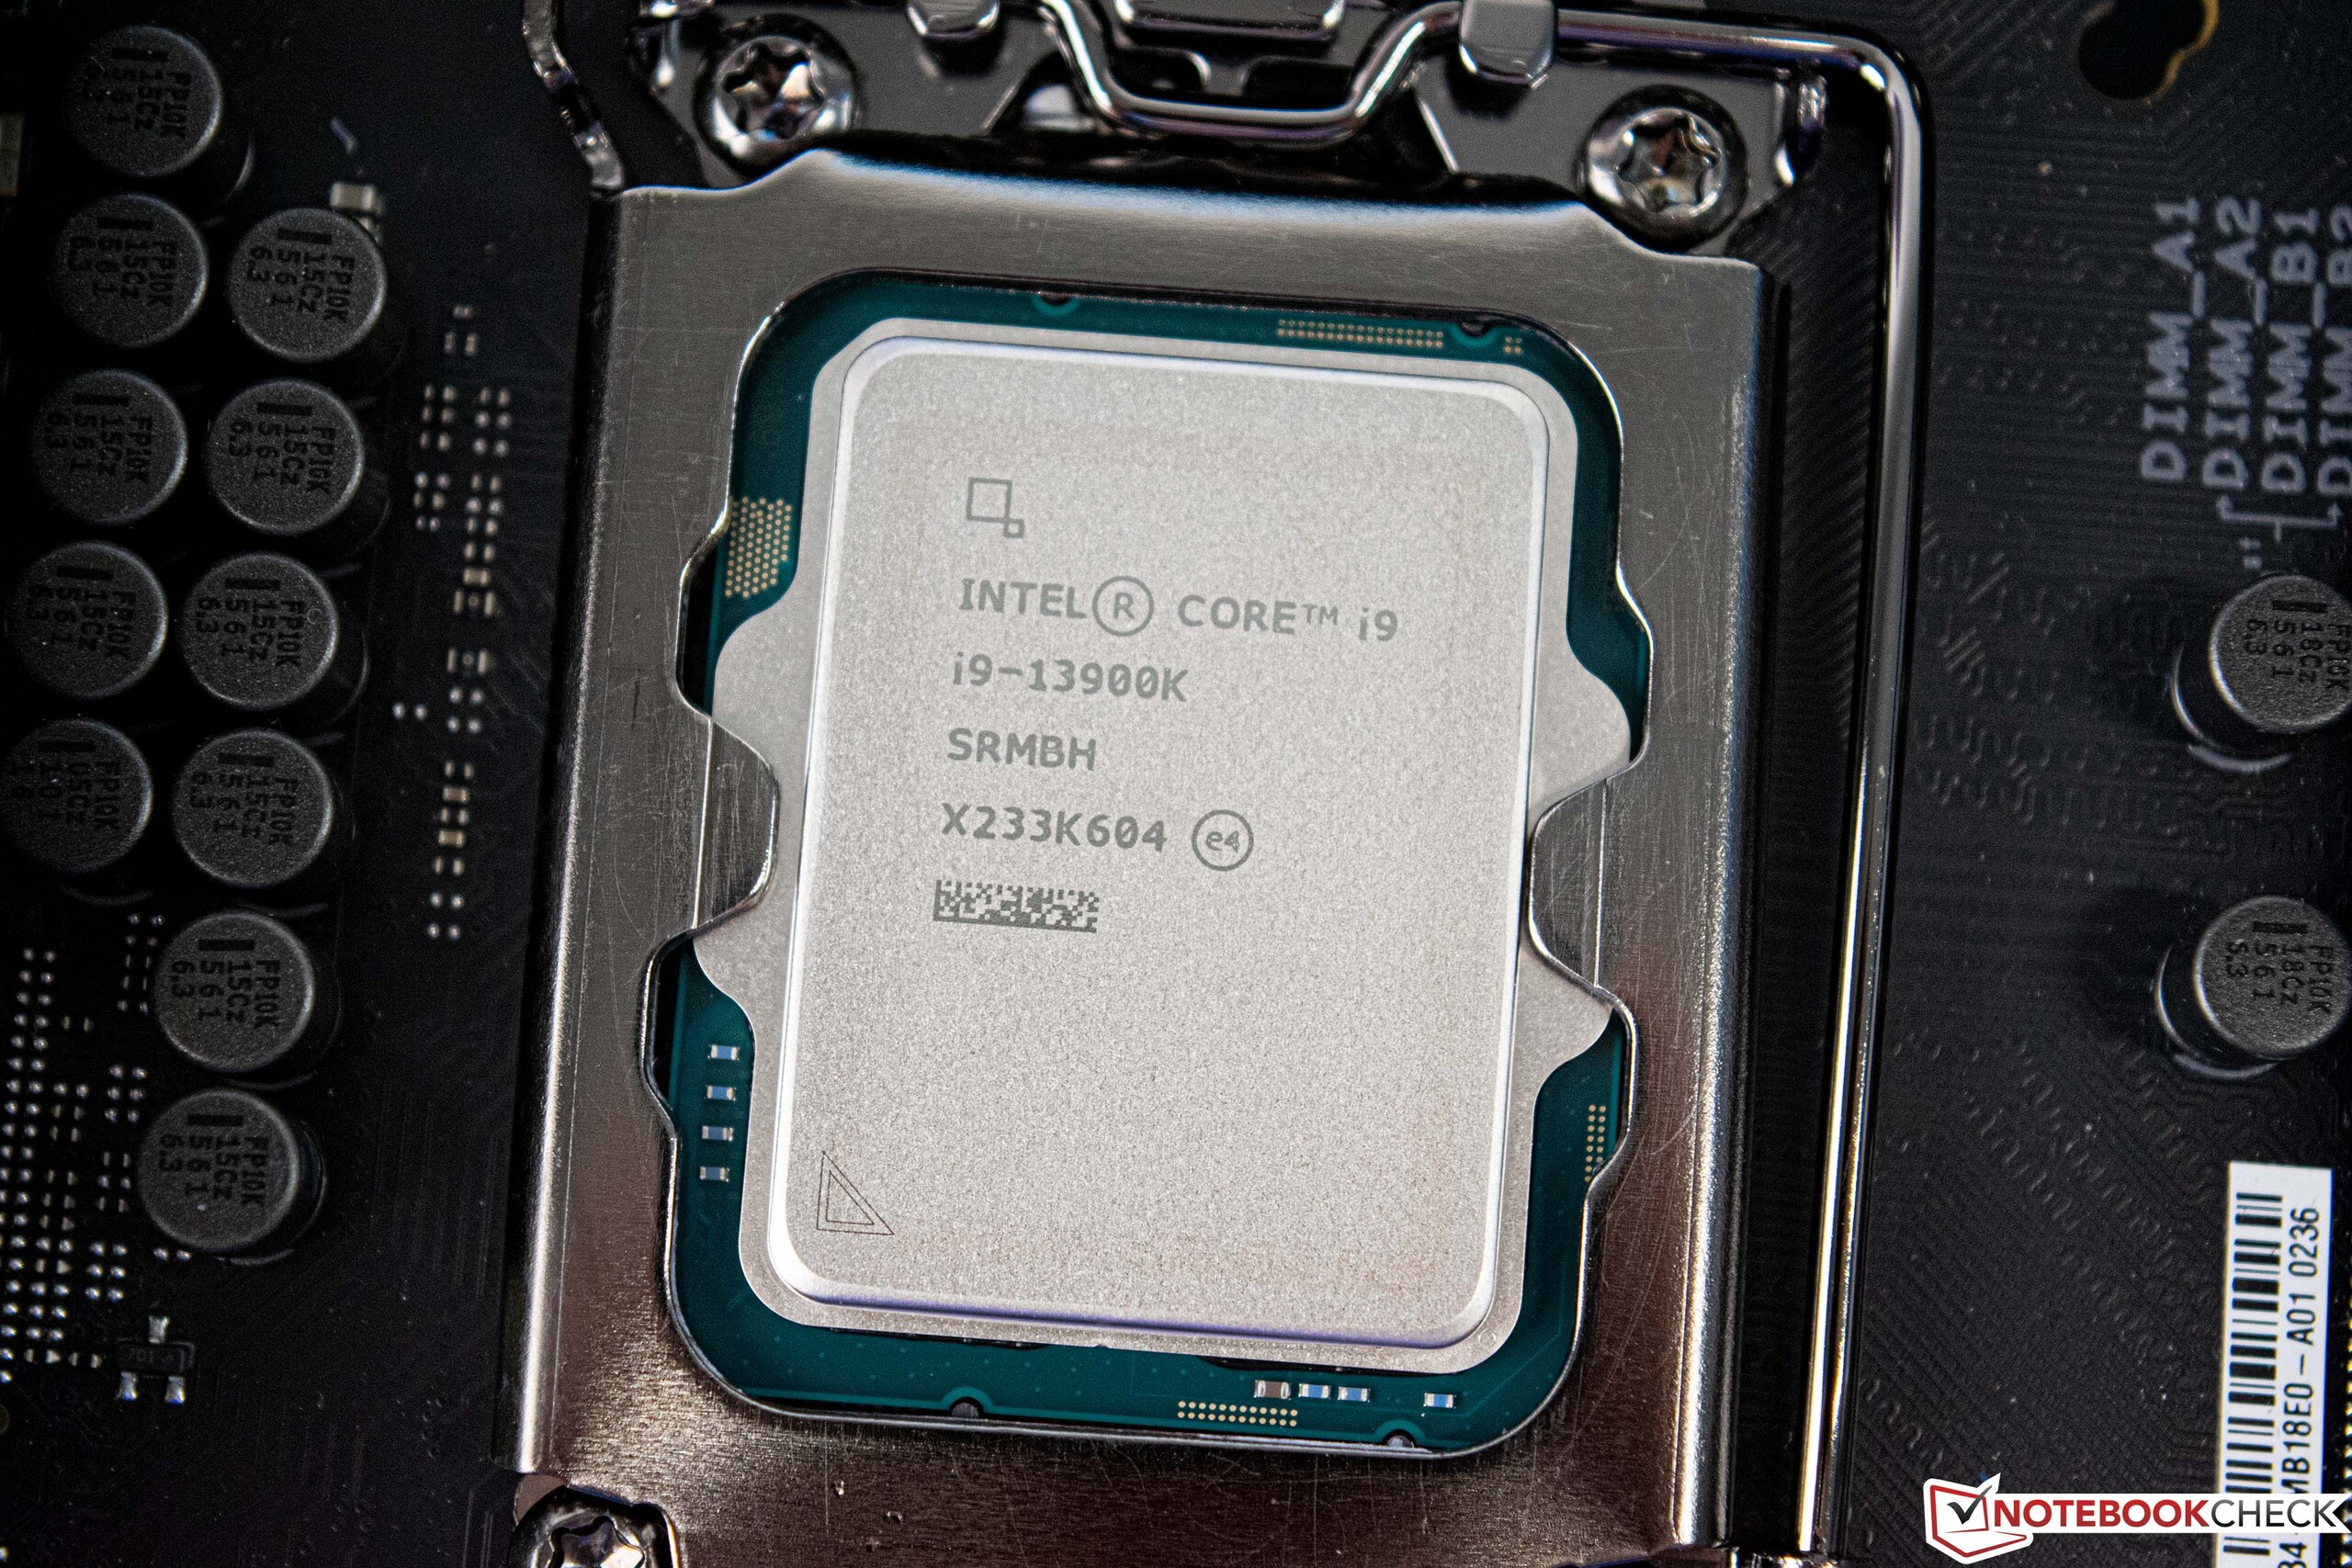
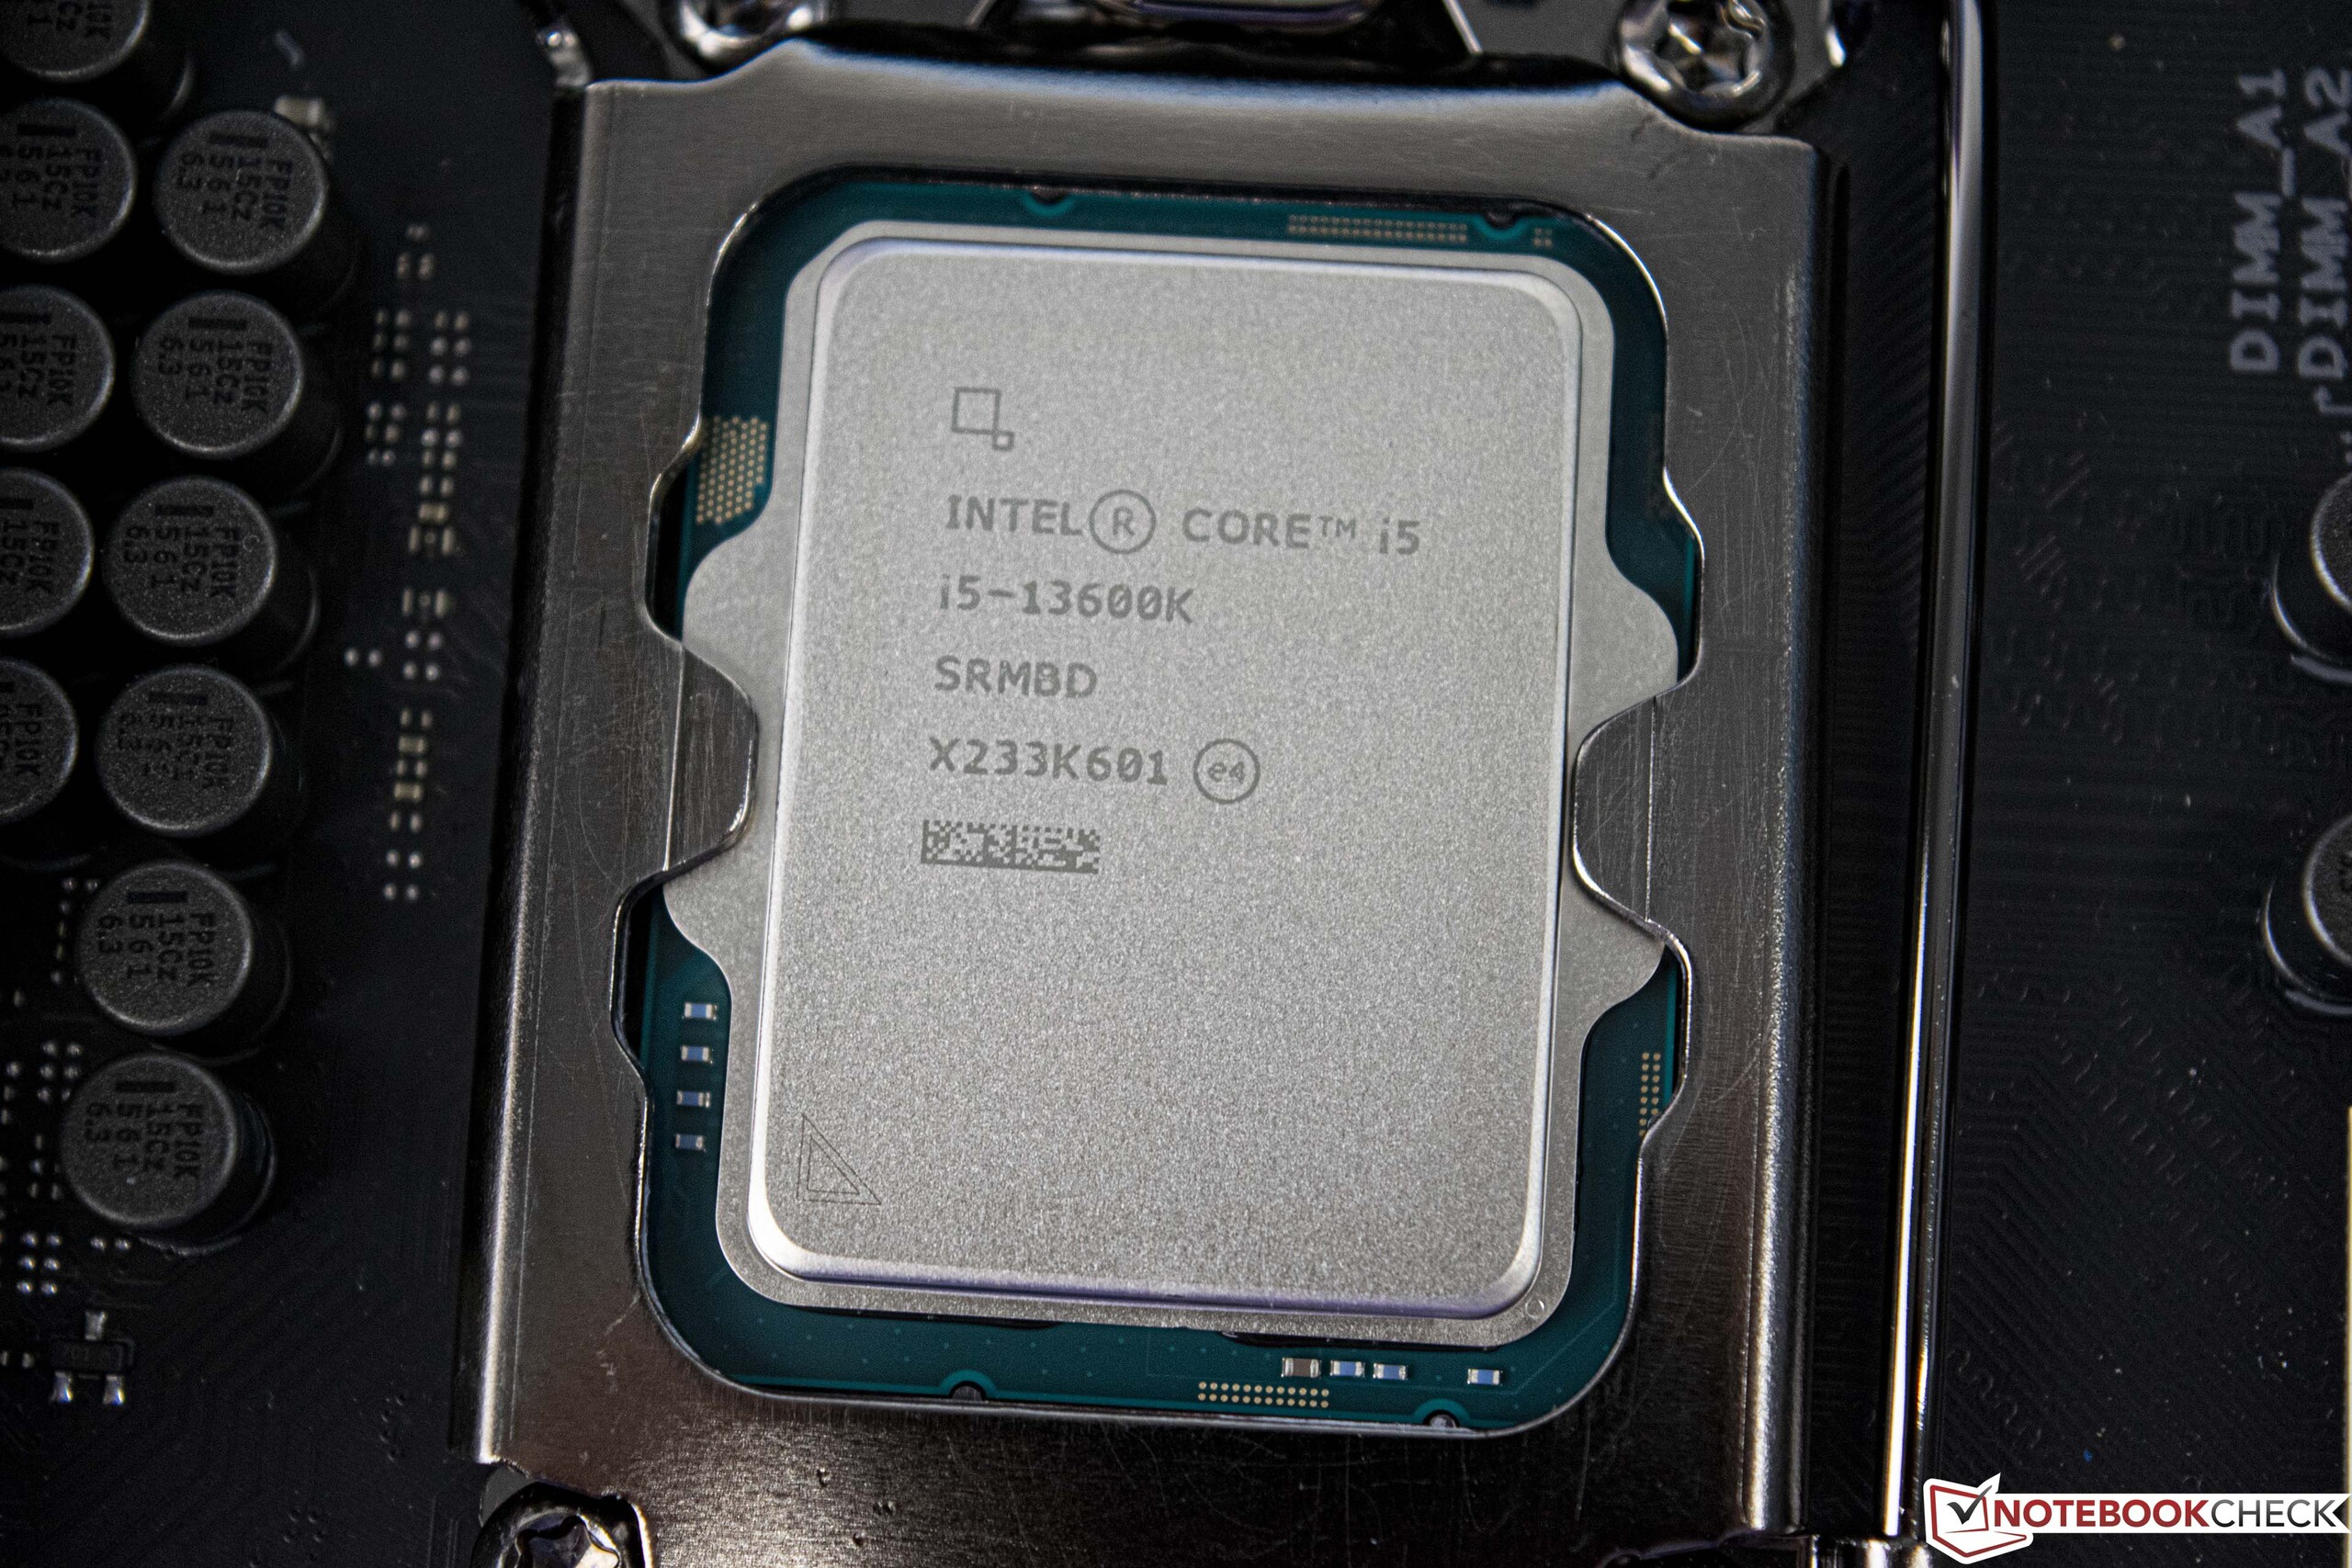
英特尔酷睿i9-13900K和英特尔酷睿i5-13600K回顾。猛禽湖的更多核心和更高的时钟速度
随着混合型CPU被引入台式机领域,英特尔去年得以在性能上取得重大飞跃。第一次,Alder Lake平台使用P和E核心来改善性能分布。AMD以其芯片架构追求不同的方法,在这一点上也能够实现非常好的性能。通过最近推出的Zen 4处理器,AMD再次实现了性能的大幅提升。猛禽湖现在应该是弥补了这一点,让英特尔重新夺回性能冠军。
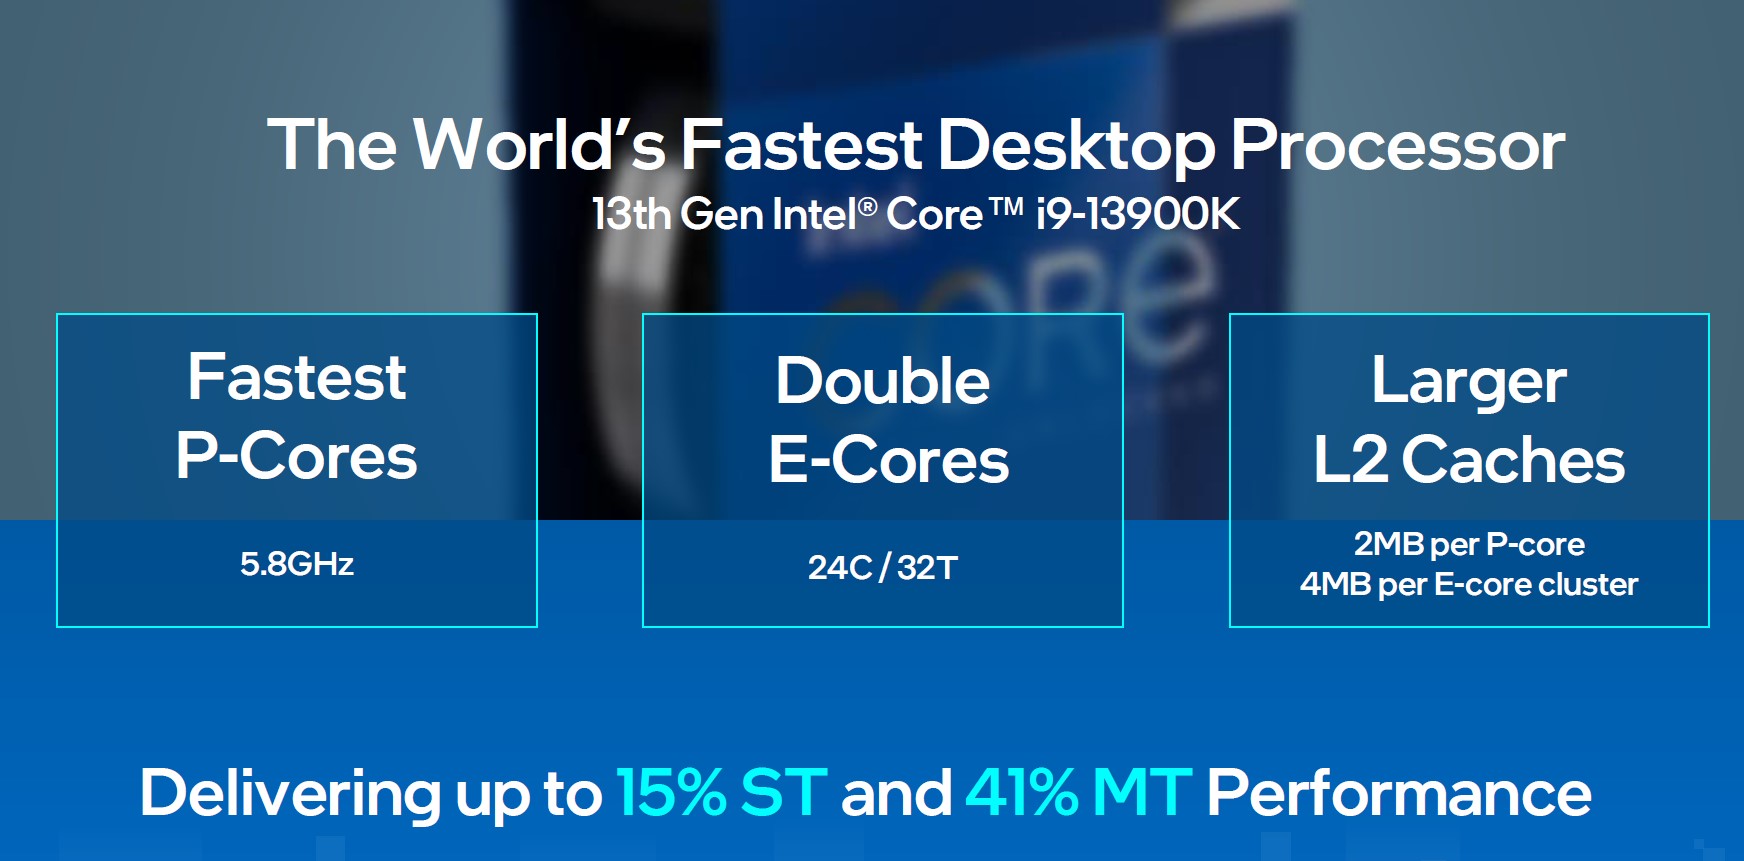
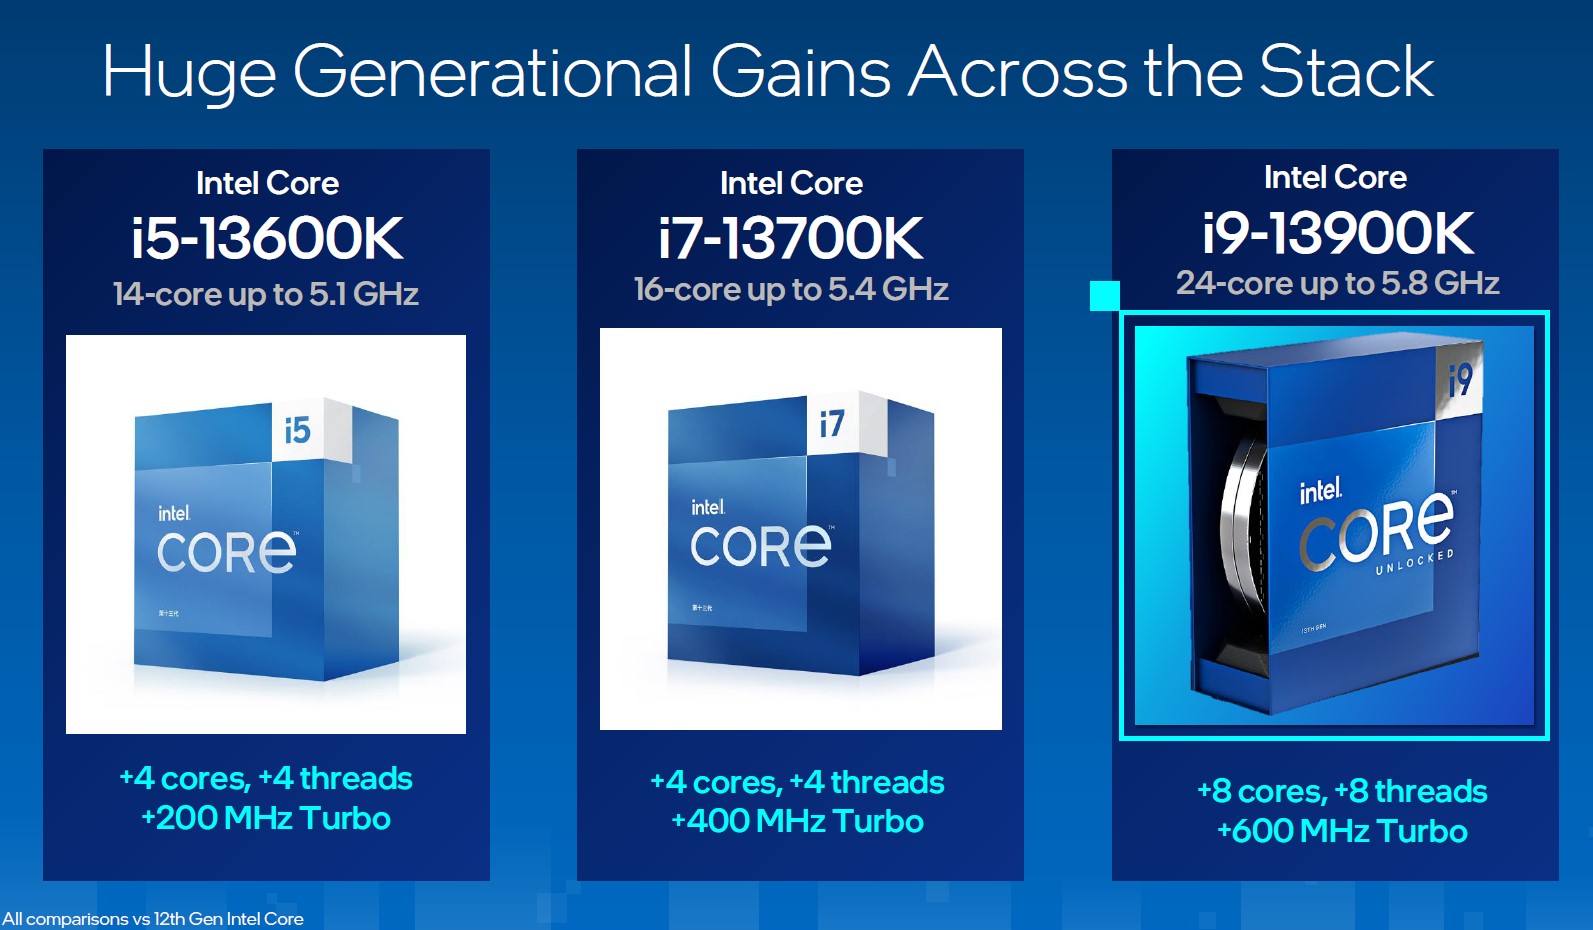
英特尔在这一代基本上仍然忠实于1700插座。然而,仍有许多变化,总的来说导致与AMD的Ryzen 9 7950X的正面竞争。例如,有一个明显更大的缓存,总共有更多的线程和重新设计的P核,具有更高的IPC。此外,英特尔将涡轮增压提高了600兆赫,最高达到5.8GHz。这些变化适用于新猛禽湖系列的整个阵容。
我们在下面的图表中为你列出了新猛禽湖S系列的最重要代表。
尽管英特尔在价格方面沿用了Alder Lake系列,但目前疲软的欧元兑美元汇率将使新处理器的价格在主观上看起来更贵。
第13代英特尔酷睿处理器一览
| 型号 | 核心/ 线程 |
时钟速度P核心/涡轮 | 时钟速度E核心/涡轮 | 缓存 L2 + L3 | 图形 | PBP | MTB | 价格(MSRP) |
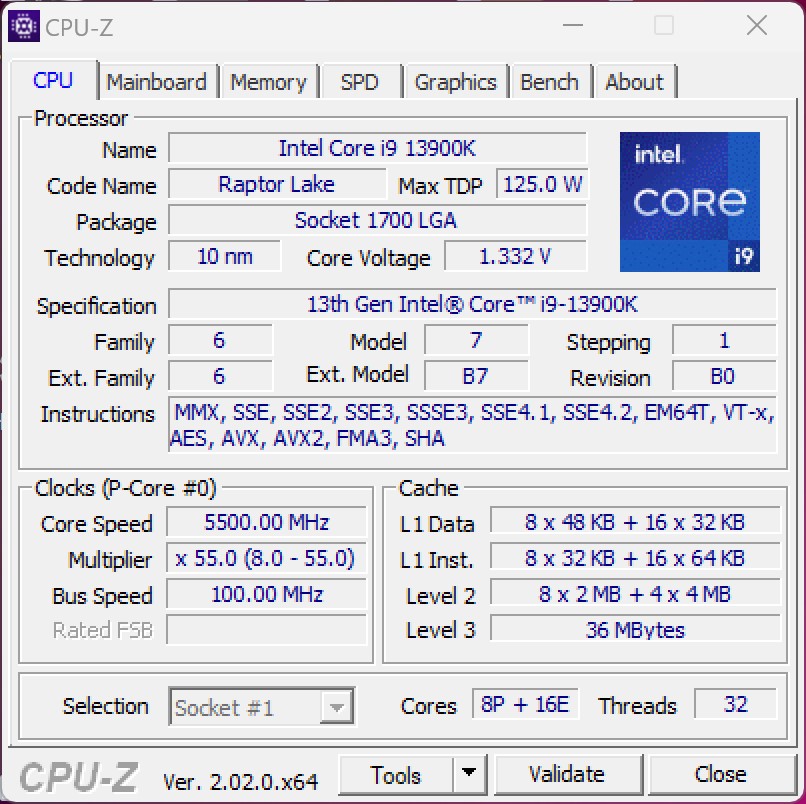
| Core i9-13900K | 16 (8P + 16E) /32 | 3.0 GHz / 5.8 GHz | 2.2 GHz / 4.3 GHz | 32 + 36 MB | UHD 770 | 125 Watt | 253 Watt | $589 |
| Core i9-13900KF | 16 (8P + 16E) /32 | 3.0 GHz / 5.8 GHz | 2.2 GHz / 4.3 GHz | 32 + 36 MB | - | 125 Watt | 253 Watt | $564 |
| Core i9-12900K | 16 (8P + 8E) /24 | 3.2 GHz / 5.1 GHz | 2.4 GHz / 3.9 GHz | 14 + 30 MB | UHD 770 | 125瓦 | 241瓦 | 589美元 |
| Core i9-12900KF | 16 (8P + 8E) /24 | 3.2 GHz / 5.1 GHz | 2.4 GHz / 3.9 GHz | 14 + 30 MB | - | 125 Watt | 241 Watt | $564 |
| Core i7-13700K | 16 (8P + 8E) /24 | 3.4 GHz / 5.4 GHz | 2.5 GHz / 4.2 GHz | 24 + 30 MB | UHD 770 | 125 瓦 | 253 瓦 | $409 |
| Core i7-13700KF | 16 (8P + 8E) /24 | 3.4 GHz / 5.4 GHz | 2.5 GHz / 4.2 GHz | 24 + 30 MB | - | 125 Watt | 253 Watt | $384 |
| Core i7-12700K | 12 (8P + 4E) /20 | 3.6 GHz / 4.9 GHz | 2.7 GHz / 3.8 GHz | 12 + 25 MB | UHD 770 | 125 Watt | 190 Watt | $409 |
| Core i7-12700KF | 12 (8P + 4E) /20 | 3.6 GHz / 4.9 GHz | 2.7 GHz / 3.8 GHz | 12 + 25 MB | - | 125 Watt | 190 Watt | $384 |
| Core i5-13600K | 14 (6P + 8E) /20 | 3.5 GHz / 5.1 GHz | 2.6 GHz / 3.9 GHz | 20 + 24 MB | UHD 770 | 125 Watt | 181 Watt | $19 |
| Core i5-13600KF | 14 (6P + 8E) /20 | 3.5 GHz / 5.1 GHz | 2.6 GHz / 3.9 GHz | 20 + 24 MB | - | 125 Watt | 181 Watt | $294 |
| Core i5-12600K | 10 (6P + 4E) /16 | 3.7 GHz / 4.9 GHz | 2.8 GHz / 3.6 GHz | 9.5 + 20 MB | UHD 770 | 125 Watt | 150 Watt | 289元 |
| Core i5-12600KF | 10 (6P + 4E) /16 | 3.7 GHz / 4.9 GHz | 2.8 GHz / 3.6 GHz | 9.5 + 20 MB | - | 125 Watt | 150 Watt | $264 |
我们测试系统的细节
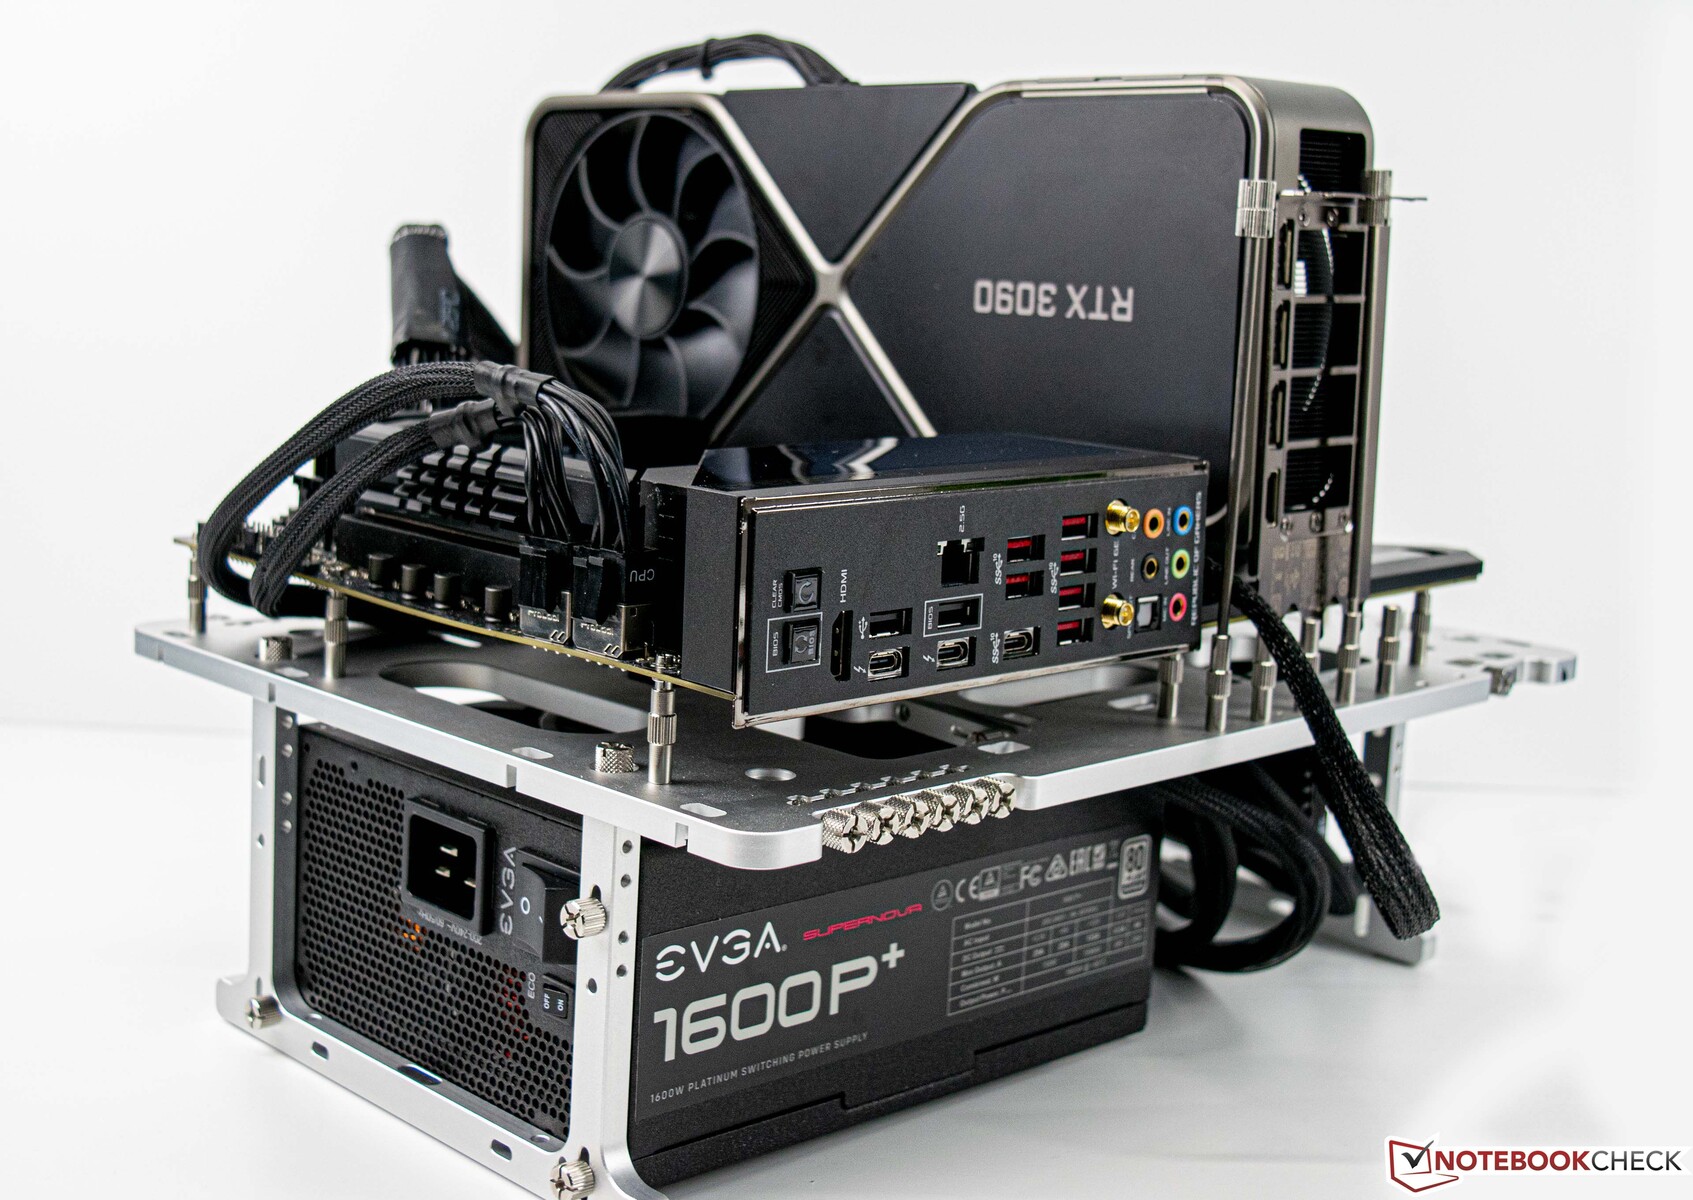
我们使用下面的系统进行基准测试和试验。
- Streacom BC1 V2开放式工作台
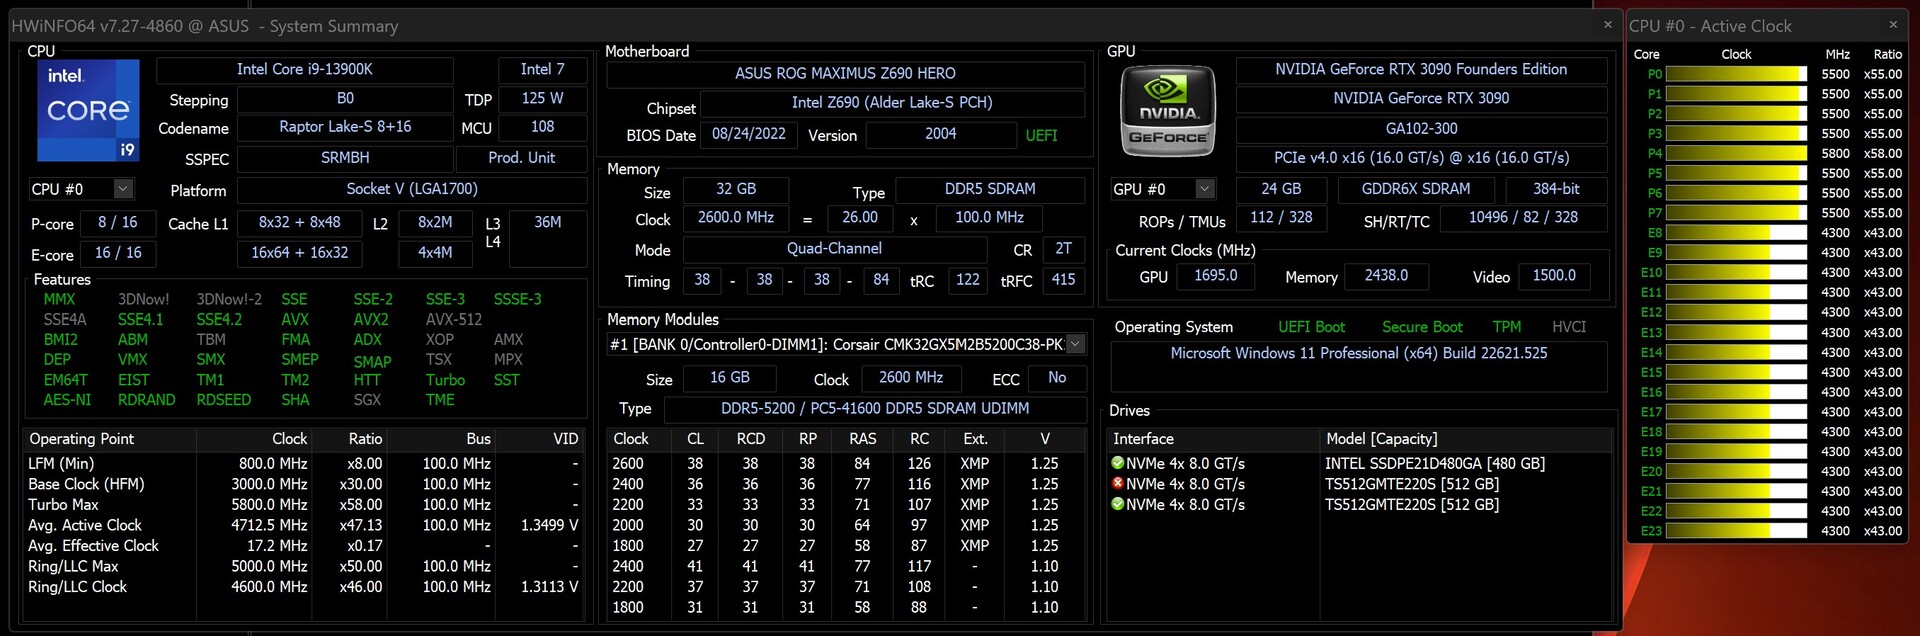
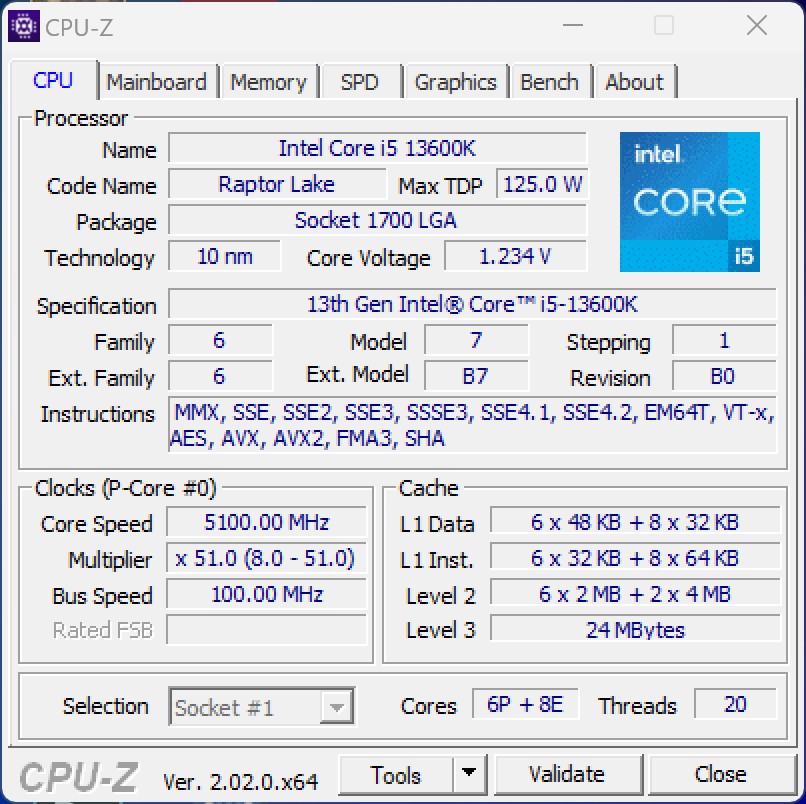
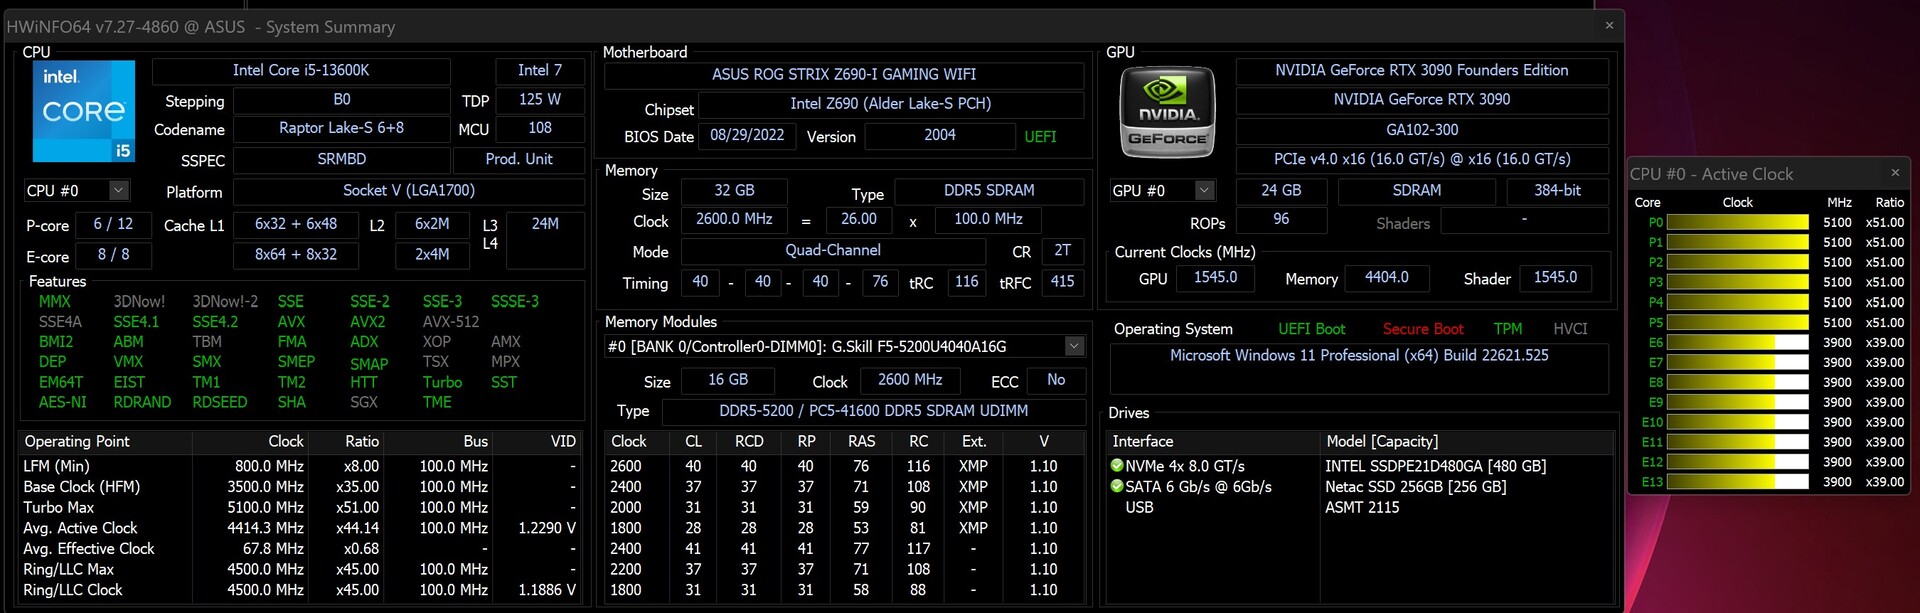
- 英特尔酷睿i9-13900K,英特尔酷睿i5-13600K
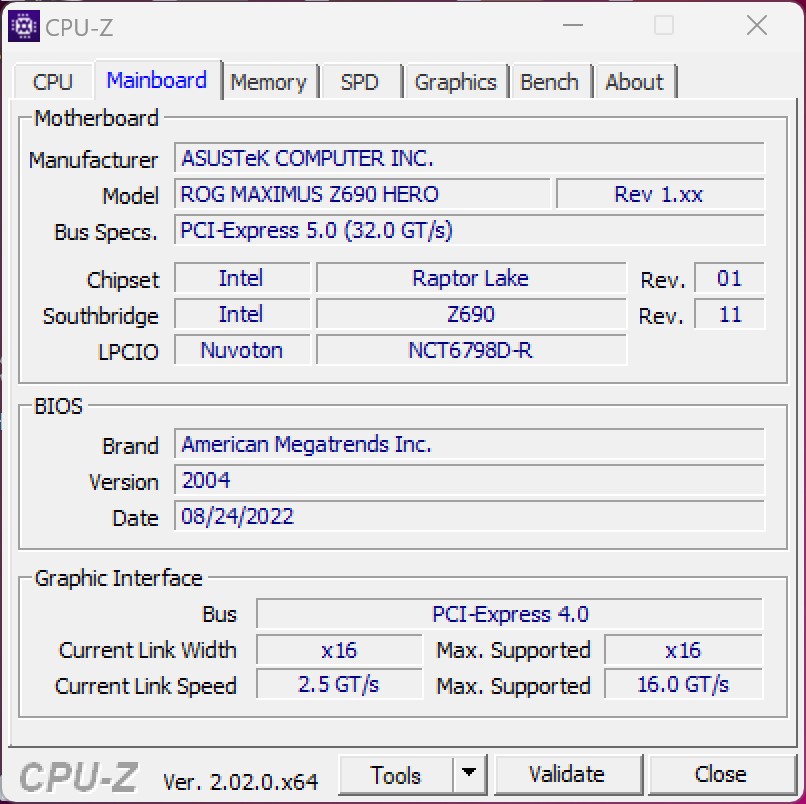
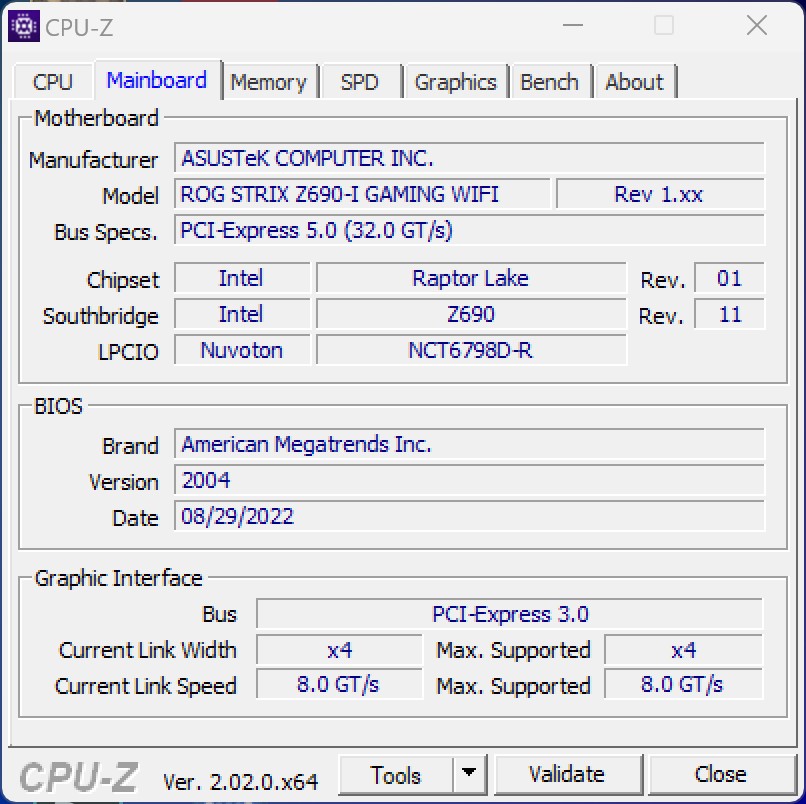
- 华硕ROG Maximus Z690 Hero(BIOS v2004)/华硕ROG Strix Z690-I Gaming WiFi(BIOS v2004)。
- 定制循环水冷却(泵:Alphacool Aquastream XT Ultra,散热器:EK MO-RA3 420 LT BLACK)。
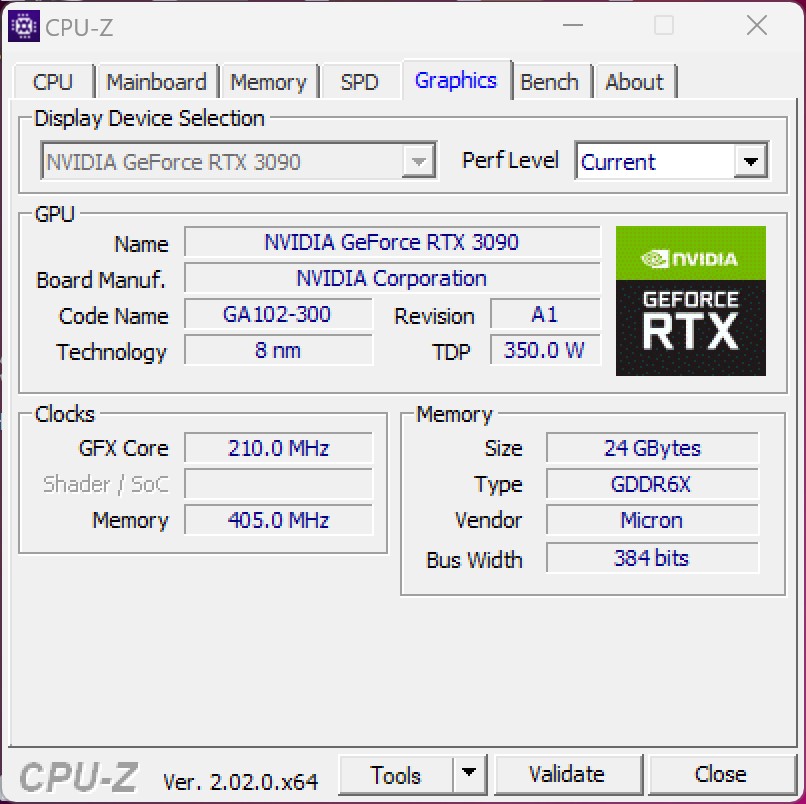
- NvidiaGeForce RTX 3090 Founders Edition (驱动:517.48)
- EVGA SuperNOVA P+ 1600W
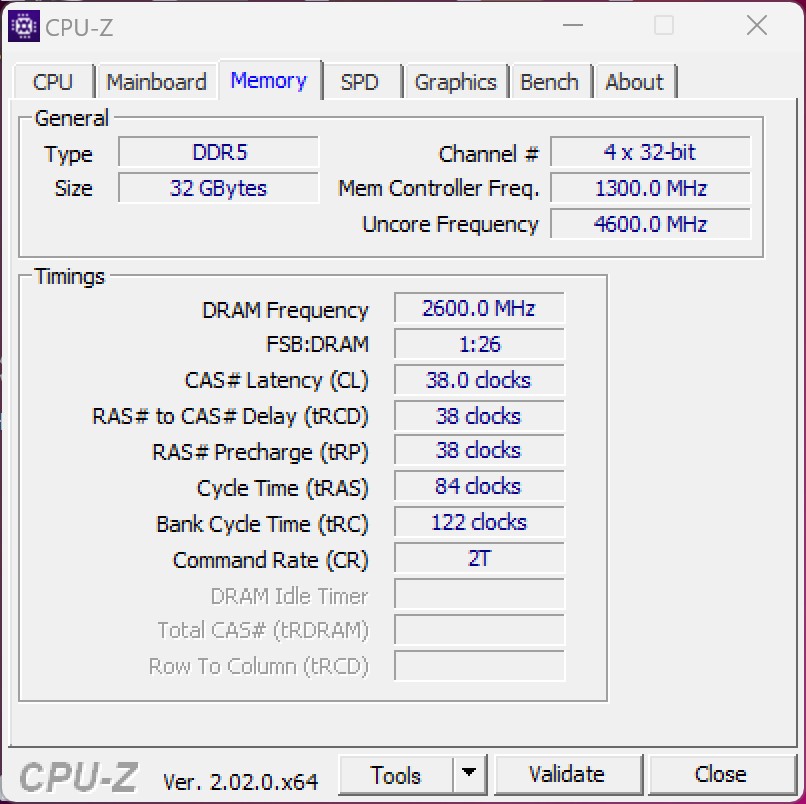
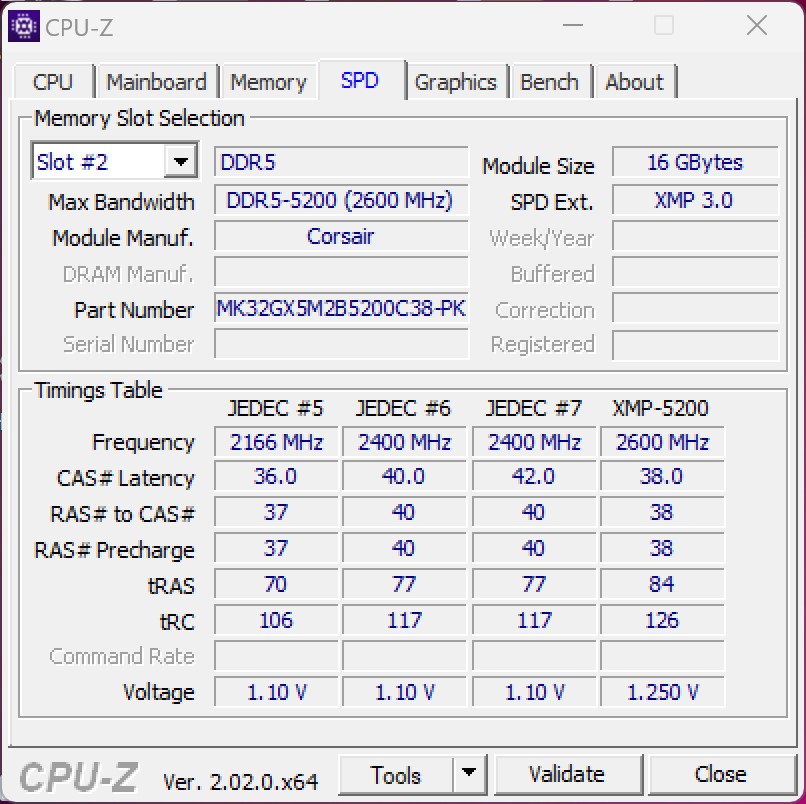
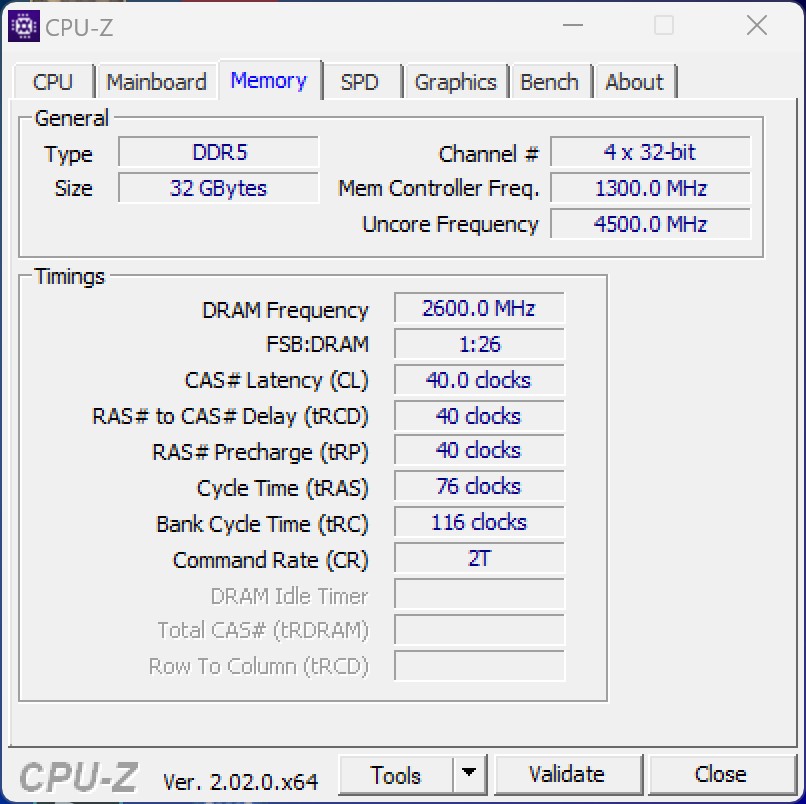
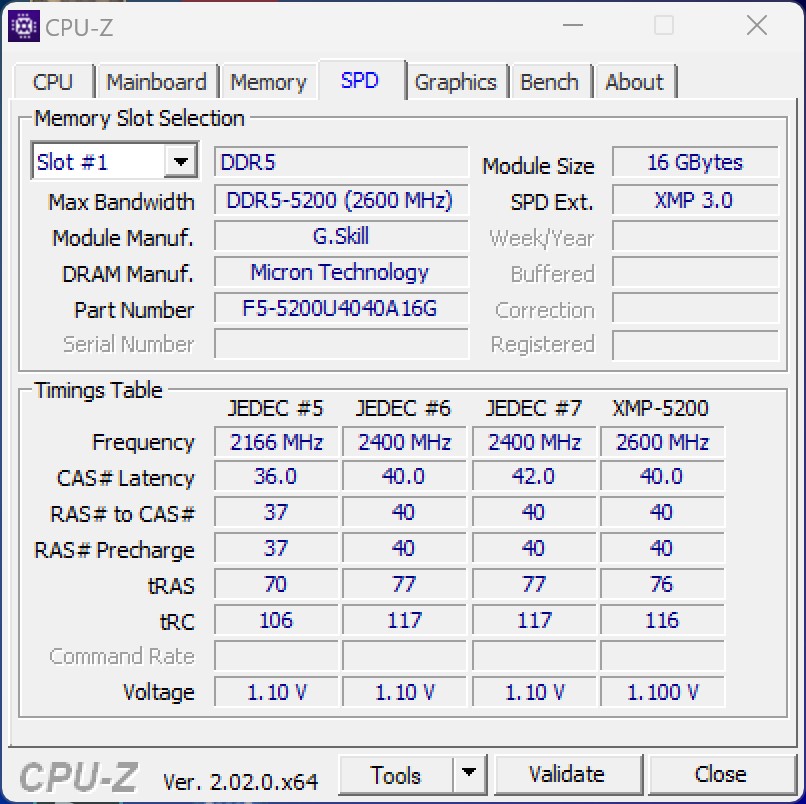
- G.Skill Ripjaws S5 (2x 16 GB - DDR5-5200)
- 英特尔Optane 905p(480GB系统+基准)。
- 微软Windows 11专业版64位(版本22H2)。

测试条件 - Z690在更新BIOS后可以使用
在这次测试中,我们使用了华硕ROG Maximus Z690 Hero,它在Alder Lake S发布期间已经被使用。尽管如此,随着新的Z790芯片组的出现,将会有更新的主板支持第12代以及第13代的英特尔处理器。然而,你仍然应该记住,英特尔火箭湖系列可能将是使用1700插座的最后一代产品。
所有测试都是在激活最新的BIOS和XMP配置文件的情况下进行的。此外,为了获得处理器的全部性能,所有的电源限制都被停用了。
注意。
由于华硕ROG Maximus Z690 Hero在测试中出现了一些问题,我们不得不使用华硕ROG Strix Z690-I Gaming WiFi来代替英特尔酷睿i5-13600K的所有基准测试。与华硕ROG Maximus Z690 Hero的简要性能比较,没有显示出任何明显的性能差异。在与华硕交谈后,我们能够确定在此之前使用的版本的BIOS存在问题。华硕立即作出回应,并以2103版本补救了这些问题。
处理器基准测试
与旧的Alder Lake S处理器相比,各方面的性能提升都很巨大。伴随着IPC的提高,Boost速度也明显提高,这意味着英特尔酷睿i9-13900K的性能也足以比 英特尔酷睿i9-12900K.在单一的比较中,性能跳跃甚至可能达到49%。通过较小的Core-i5型号,我们测得与较早的Alder Lake样品相比,性能提高了14%。
在顶级型号的对决中,英特尔酷睿i9-13900K能够仅仅领先于AMD Ryzen 9 7950X。从主观上讲,两个顶级型号的操作都是眼见为实。 然而,我们仍然看到,在一些测试中,英特尔领先,而在其他测试中,AMD领先。作为一个例子,我们可以以3DMark为例,在CPU基准测试方面,英特尔处理器明显领先于AMD机型。另一方面,AMD能够在wPrime测试中得分,而英特尔显然被甩在后面。
较小的英特尔酷睿i5-13600K与 AMD Ryzen 5 7600X.在这里,明显更多的线程数(20对12)是其成功的关键。然而,在性能评级中7%的优势并不十分明显。但这两款处理器仍然具有可比性,因为它们都属于同一价格级别。
为了完整起见,我们还在激活PL2的情况下进行了所有的CPU测试。从结果中可以看出,如果你设置了功率限制,就没有什么缺点了。在部分地区甚至可以得到更好的数值,因为CPU在这里不会达到临界温度。
你可以找到关于处理器的其他基准测试 这里.
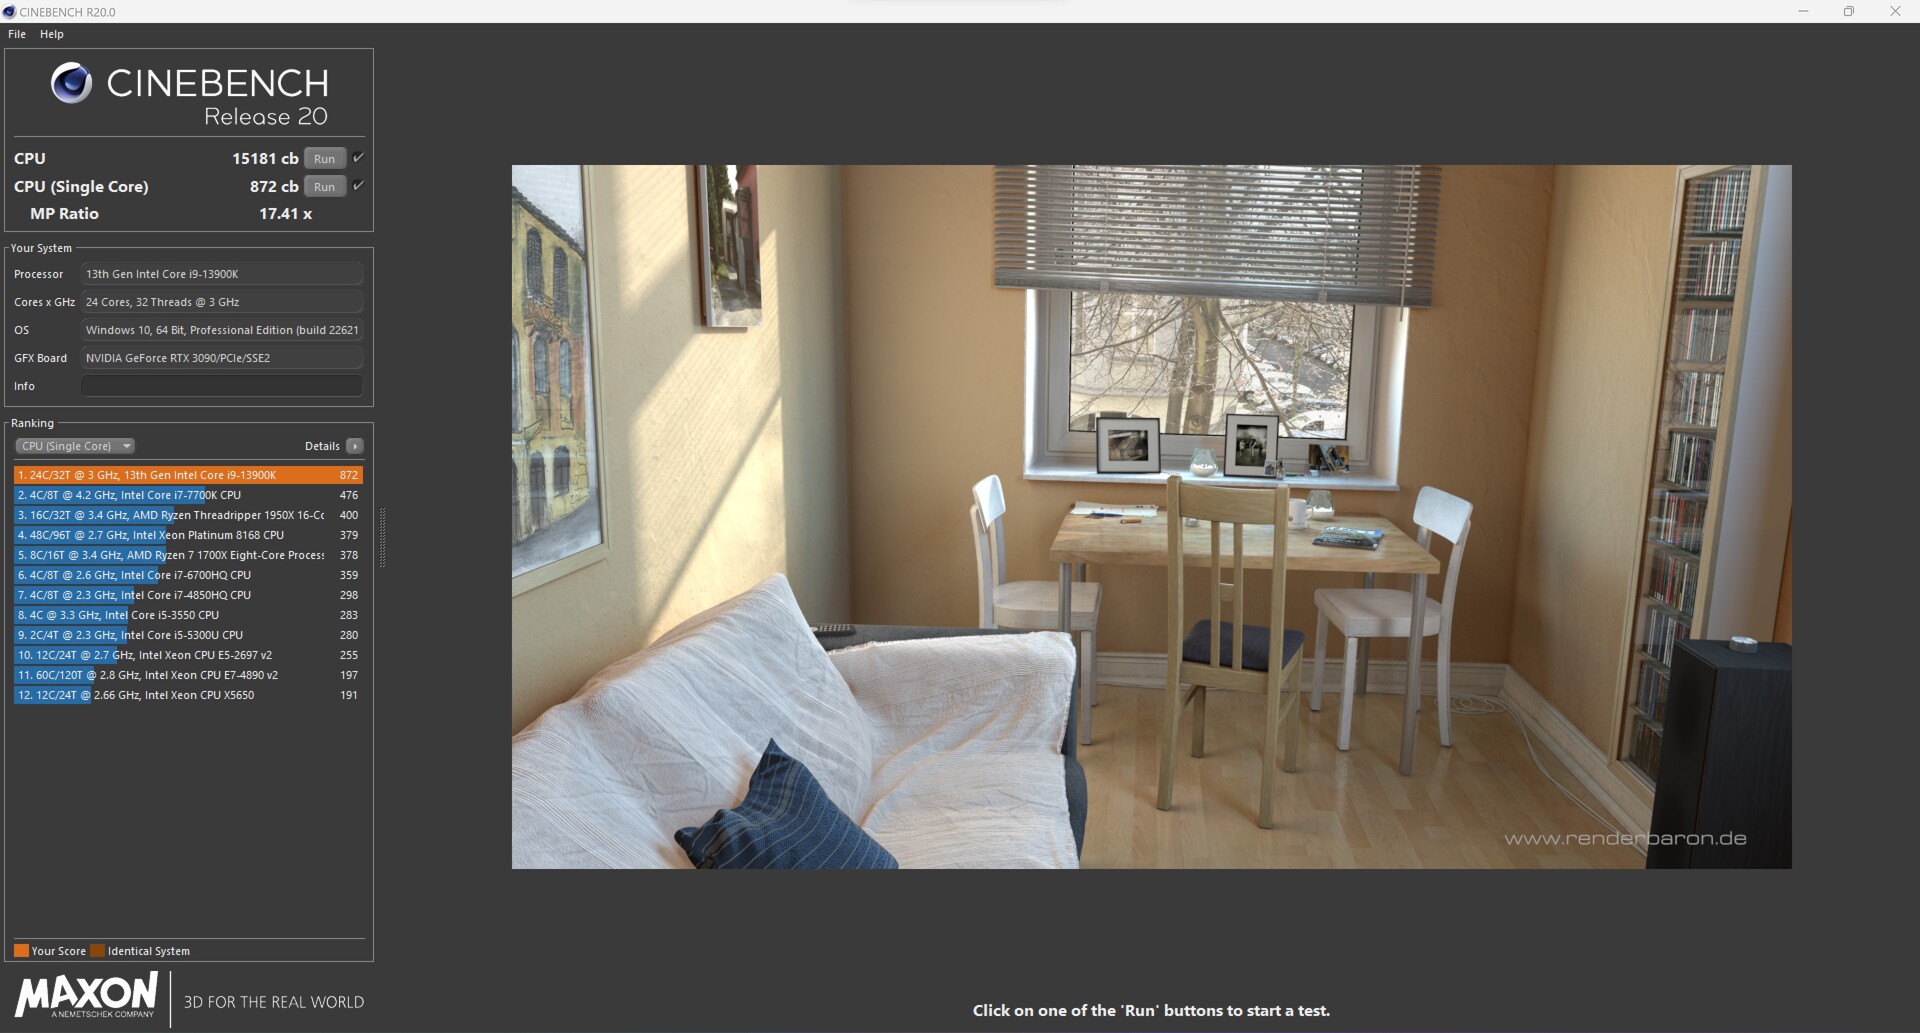
英特尔酷睿i9-13900K

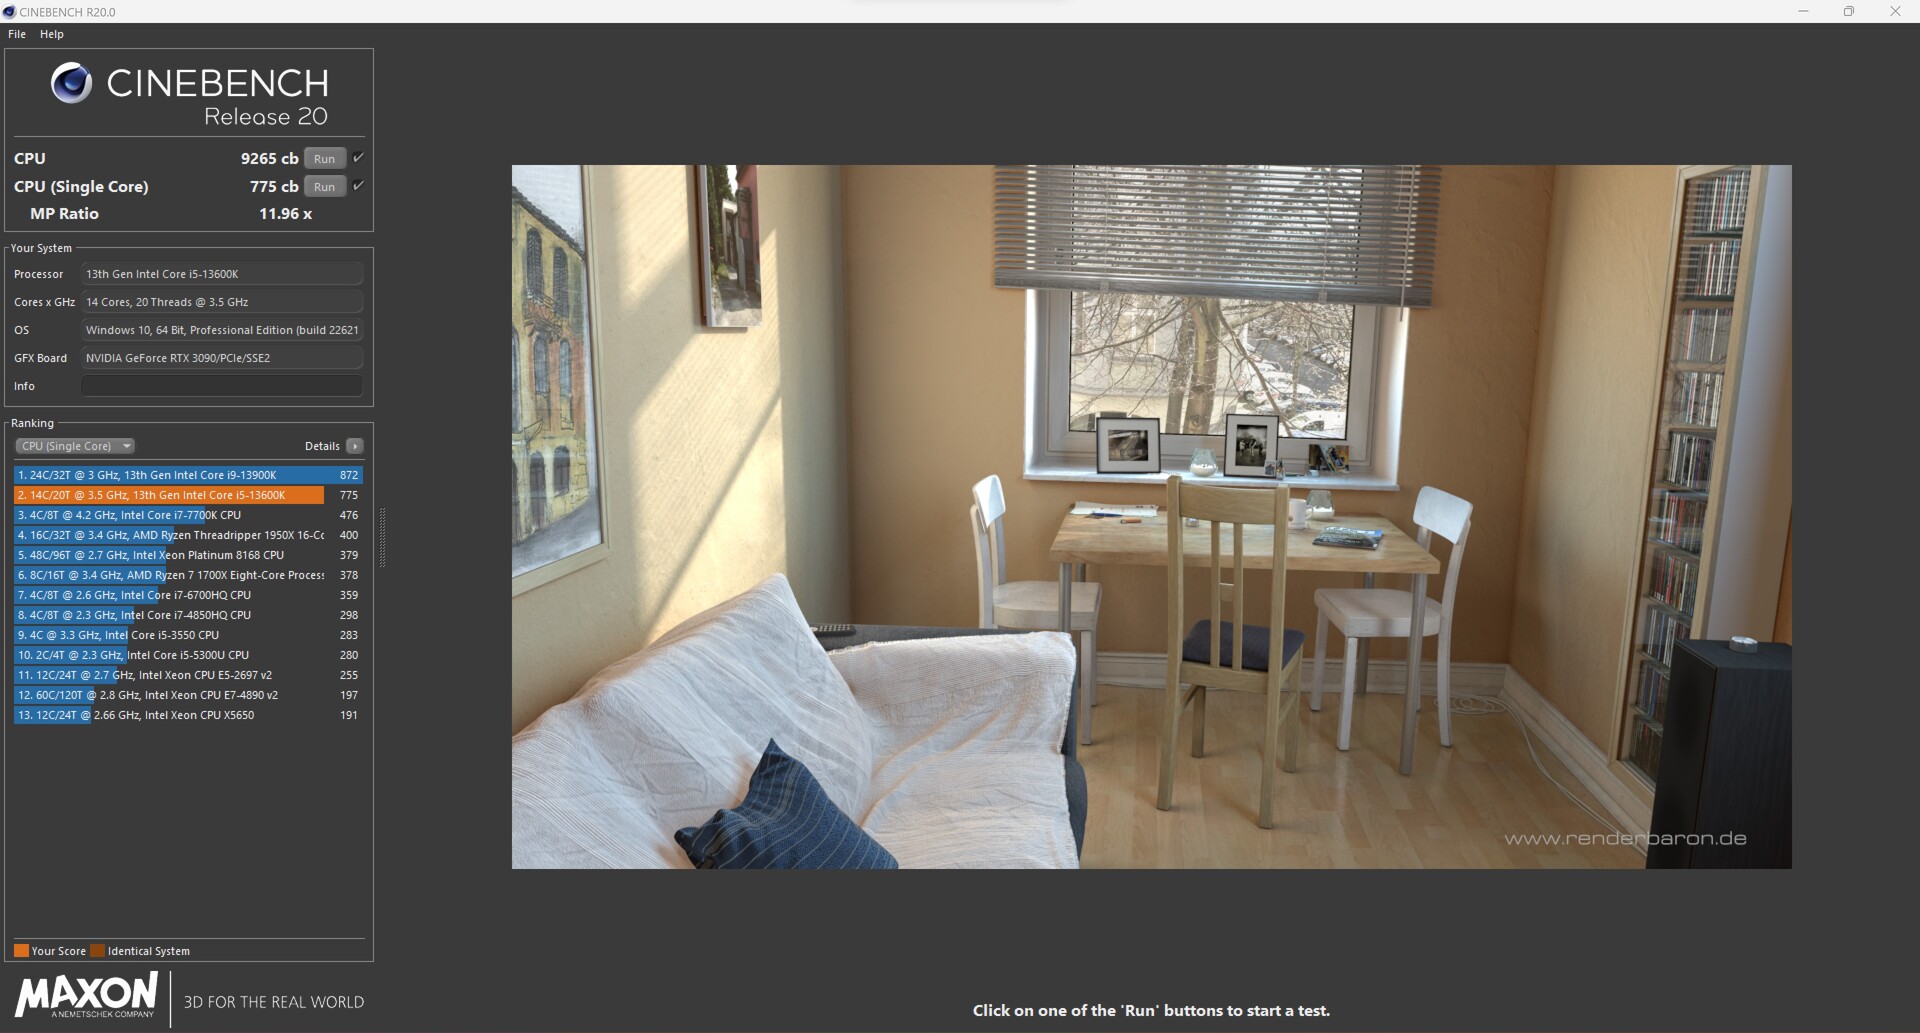
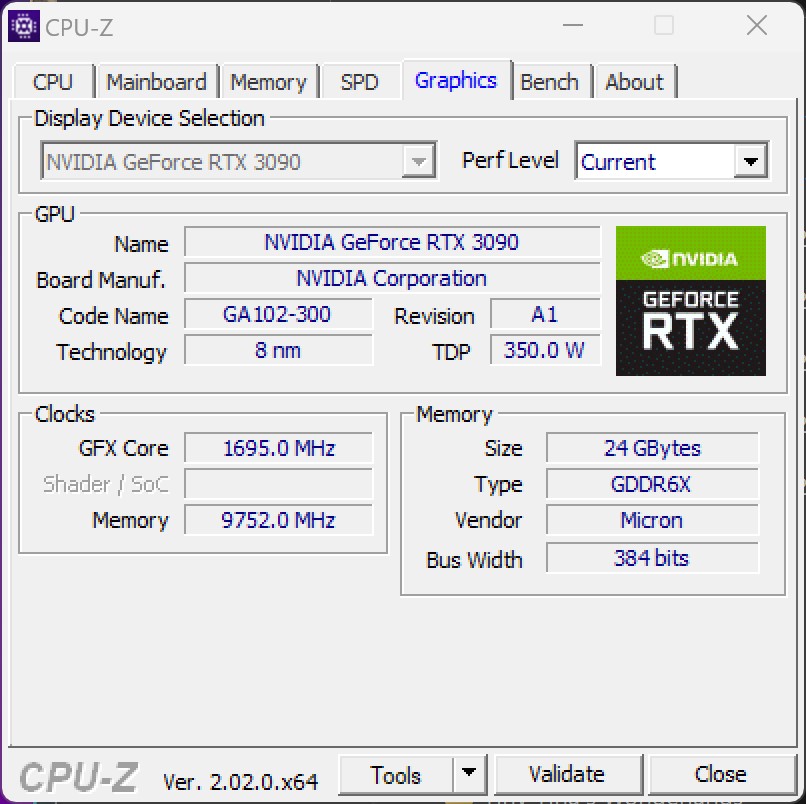
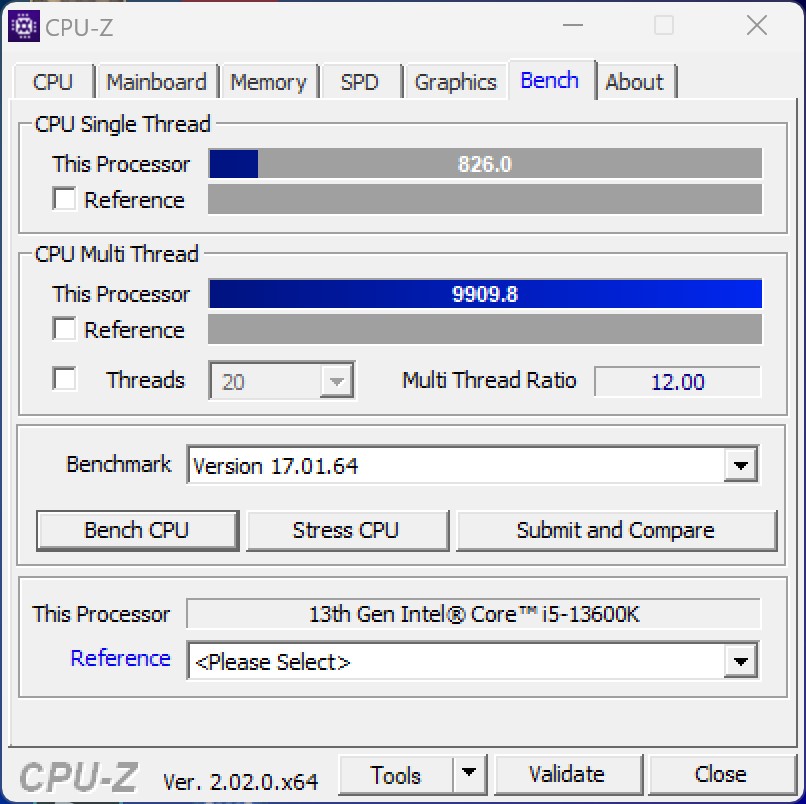
英特尔酷睿i5-13600K
| Performance rating - Percent | |
| Intel Core i9-13900K | |
| Intel Core i9-13900K @253W | |
| NVIDIA GeForce RTX 3090 Founders Edition | |
| AMD Ryzen 9 7900X | |
| Intel Core i9-12900K | |
| Intel Core i5-13600K | |
| Intel Core i5-13600K @181W | |
| AMD Ryzen 5 7600X | |
| Intel Core i5-12600K | |
| Cinebench R15 | |
| CPU Single 64Bit | |
| NVIDIA GeForce RTX 3090 Founders Edition | |
| Intel Core i9-13900K @253W | |
| Intel Core i9-13900K | |
| AMD Ryzen 9 7900X | |
| AMD Ryzen 5 7600X | |
| Intel Core i5-13600K | |
| Intel Core i9-12900K | |
| Intel Core i5-13600K @181W | |
| Intel Core i5-12600K | |
| CPU Multi 64Bit | |
| NVIDIA GeForce RTX 3090 Founders Edition | |
| Intel Core i9-13900K | |
| Intel Core i9-13900K @253W | |
| AMD Ryzen 9 7900X | |
| Intel Core i9-12900K | |
| Intel Core i5-13600K | |
| Intel Core i5-13600K @181W | |
| Intel Core i5-12600K | |
| AMD Ryzen 5 7600X | |
| Cinebench R20 | |
| CPU (Single Core) | |
| Intel Core i9-13900K @253W | |
| Intel Core i9-13900K | |
| NVIDIA GeForce RTX 3090 Founders Edition | |
| AMD Ryzen 9 7900X | |
| Intel Core i5-13600K | |
| Intel Core i9-12900K | |
| Intel Core i5-13600K @181W | |
| AMD Ryzen 5 7600X | |
| Intel Core i5-12600K | |
| CPU (Multi Core) | |
| Intel Core i9-13900K | |
| NVIDIA GeForce RTX 3090 Founders Edition | |
| Intel Core i9-13900K @253W | |
| AMD Ryzen 9 7900X | |
| Intel Core i9-12900K | |
| Intel Core i5-13600K | |
| Intel Core i5-13600K @181W | |
| Intel Core i5-12600K | |
| AMD Ryzen 5 7600X | |
| Cinebench R23 | |
| Single Core | |
| Intel Core i9-13900K @253W | |
| Intel Core i9-13900K | |
| NVIDIA GeForce RTX 3090 Founders Edition | |
| AMD Ryzen 9 7900X | |
| Intel Core i5-13600K | |
| Intel Core i9-12900K | |
| Intel Core i5-13600K @181W | |
| AMD Ryzen 5 7600X | |
| Intel Core i5-12600K | |
| Multi Core | |
| Intel Core i9-13900K | |
| Intel Core i9-13900K @253W | |
| NVIDIA GeForce RTX 3090 Founders Edition | |
| AMD Ryzen 9 7900X | |
| Intel Core i9-12900K | |
| Intel Core i5-13600K | |
| Intel Core i5-13600K @181W | |
| Intel Core i5-12600K | |
| AMD Ryzen 5 7600X | |
| Cinebench R11.5 | |
| CPU Single 64Bit | |
| Intel Core i9-13900K @253W | |
| Intel Core i9-13900K | |
| NVIDIA GeForce RTX 3090 Founders Edition | |
| AMD Ryzen 9 7900X | |
| AMD Ryzen 5 7600X | |
| Intel Core i9-12900K | |
| Intel Core i5-13600K | |
| Intel Core i5-13600K @181W | |
| Intel Core i5-12600K | |
| CPU Multi 64Bit | |
| Intel Core i9-13900K | |
| NVIDIA GeForce RTX 3090 Founders Edition | |
| Intel Core i9-13900K @253W | |
| AMD Ryzen 9 7900X | |
| Intel Core i9-12900K | |
| Intel Core i5-13600K | |
| Intel Core i5-13600K @181W | |
| Intel Core i5-12600K | |
| AMD Ryzen 5 7600X | |
| Cinebench R10 | |
| Rendering Single CPUs 64Bit | |
| Intel Core i9-13900K @253W | |
| Intel Core i9-13900K | |
| AMD Ryzen 9 7900X | |
| NVIDIA GeForce RTX 3090 Founders Edition | |
| Intel Core i5-13600K | |
| Intel Core i9-12900K | |
| Intel Core i5-13600K @181W | |
| AMD Ryzen 5 7600X | |
| Intel Core i5-12600K | |
| Rendering Multiple CPUs 64Bit | |
| Intel Core i9-13900K @253W | |
| Intel Core i9-13900K | |
| NVIDIA GeForce RTX 3090 Founders Edition | |
| AMD Ryzen 9 7900X | |
| Intel Core i9-12900K | |
| Intel Core i5-13600K @181W | |
| Intel Core i5-13600K | |
| AMD Ryzen 5 7600X | |
| Intel Core i5-12600K | |
| Blender - v2.79 BMW27 CPU | |
| AMD Ryzen 5 7600X | |
| Intel Core i5-12600K | |
| Intel Core i5-13600K | |
| Intel Core i5-13600K @181W | |
| Intel Core i9-12900K | |
| AMD Ryzen 9 7900X | |
| NVIDIA GeForce RTX 3090 Founders Edition | |
| Intel Core i9-13900K @253W | |
| Intel Core i9-13900K | |
| wPrime 2.10 | |
| 32m | |
| Intel Core i9-12900K | |
| Intel Core i5-12600K | |
| AMD Ryzen 5 7600X | |
| Intel Core i5-13600K | |
| Intel Core i5-13600K @181W | |
| Intel Core i9-13900K @253W | |
| Intel Core i9-13900K | |
| AMD Ryzen 9 7900X | |
| NVIDIA GeForce RTX 3090 Founders Edition | |
| 1024m | |
| Intel Core i5-12600K | |
| Intel Core i9-12900K | |
| Intel Core i5-13600K | |
| Intel Core i5-13600K @181W | |
| Intel Core i9-13900K @253W | |
| Intel Core i9-13900K | |
| AMD Ryzen 5 7600X | |
| AMD Ryzen 9 7900X | |
| NVIDIA GeForce RTX 3090 Founders Edition | |
| X264 HD Benchmark 4.0 | |
| Pass 1 | |
| Intel Core i9-13900K @253W | |
| Intel Core i9-13900K | |
| Intel Core i5-13600K | |
| Intel Core i5-13600K @181W | |
| NVIDIA GeForce RTX 3090 Founders Edition | |
| AMD Ryzen 9 7900X | |
| Intel Core i9-12900K | |
| AMD Ryzen 5 7600X | |
| Intel Core i5-12600K | |
| Pass 2 | |
| Intel Core i9-13900K | |
| NVIDIA GeForce RTX 3090 Founders Edition | |
| Intel Core i9-13900K @253W | |
| AMD Ryzen 9 7900X | |
| Intel Core i9-12900K | |
| Intel Core i5-13600K | |
| Intel Core i5-13600K @181W | |
| Intel Core i5-12600K | |
| AMD Ryzen 5 7600X | |
| WinRAR - Result | |
| AMD Ryzen 9 7900X | |
| NVIDIA GeForce RTX 3090 Founders Edition | |
| AMD Ryzen 5 7600X | |
| Intel Core i9-13900K @253W | |
| Intel Core i9-13900K | |
| Intel Core i5-13600K @181W | |
| Intel Core i5-13600K | |
| Intel Core i9-12900K | |
| Intel Core i5-12600K | |
| TrueCrypt | |
| AES Mean 100MB | |
| NVIDIA GeForce RTX 3090 Founders Edition | |
| Intel Core i9-13900K | |
| Intel Core i9-13900K @253W | |
| Intel Core i5-13600K @181W | |
| Intel Core i5-13600K | |
| Intel Core i9-12900K | |
| AMD Ryzen 9 7900X | |
| AMD Ryzen 5 7600X | |
| Intel Core i5-12600K | |
| Twofish Mean 100MB | |
| Intel Core i9-13900K | |
| Intel Core i9-13900K @253W | |
| NVIDIA GeForce RTX 3090 Founders Edition | |
| Intel Core i9-12900K | |
| Intel Core i5-13600K @181W | |
| Intel Core i5-13600K | |
| AMD Ryzen 9 7900X | |
| Intel Core i5-12600K | |
| AMD Ryzen 5 7600X | |
| Serpent Mean 100MB | |
| Intel Core i9-13900K | |
| Intel Core i9-13900K @253W | |
| NVIDIA GeForce RTX 3090 Founders Edition | |
| Intel Core i9-12900K | |
| Intel Core i5-13600K | |
| Intel Core i5-13600K @181W | |
| AMD Ryzen 9 7900X | |
| Intel Core i5-12600K | |
| AMD Ryzen 5 7600X | |
| Geekbench 5.5 | |
| Multi-Core | |
| NVIDIA GeForce RTX 3090 Founders Edition | |
| Intel Core i9-13900K | |
| Intel Core i9-13900K @253W | |
| AMD Ryzen 9 7900X | |
| Intel Core i9-12900K | |
| Intel Core i5-13600K @181W | |
| Intel Core i5-13600K | |
| Intel Core i5-12600K | |
| AMD Ryzen 5 7600X | |
| Single-Core | |
| NVIDIA GeForce RTX 3090 Founders Edition | |
| Intel Core i9-13900K | |
| Intel Core i9-13900K @253W | |
| AMD Ryzen 9 7900X | |
| AMD Ryzen 5 7600X | |
| Intel Core i9-12900K | |
| Intel Core i5-13600K @181W | |
| Intel Core i5-13600K | |
| Intel Core i5-12600K | |
| Geekbench 5.0 | |
| 5.0 Multi-Core | |
| NVIDIA GeForce RTX 3090 Founders Edition | |
| Intel Core i9-13900K | |
| Intel Core i9-13900K @253W | |
| AMD Ryzen 9 7900X | |
| Intel Core i9-12900K | |
| Intel Core i5-13600K | |
| Intel Core i5-13600K @181W | |
| Intel Core i5-12600K | |
| AMD Ryzen 5 7600X | |
| 5.0 Single-Core | |
| Intel Core i9-13900K @253W | |
| NVIDIA GeForce RTX 3090 Founders Edition | |
| Intel Core i9-13900K | |
| AMD Ryzen 9 7900X | |
| AMD Ryzen 5 7600X | |
| Intel Core i9-12900K | |
| Intel Core i5-13600K @181W | |
| Intel Core i5-13600K | |
| Intel Core i5-12600K | |
| Geekbench 4.4 | |
| 64 Bit Single-Core Score | |
| Intel Core i9-13900K @253W | |
| Intel Core i9-13900K | |
| NVIDIA GeForce RTX 3090 Founders Edition | |
| AMD Ryzen 9 7900X | |
| AMD Ryzen 5 7600X | |
| Intel Core i9-12900K | |
| Intel Core i5-13600K @181W | |
| Intel Core i5-13600K | |
| Intel Core i5-12600K | |
| 64 Bit Multi-Core Score | |
| NVIDIA GeForce RTX 3090 Founders Edition | |
| Intel Core i9-13900K | |
| Intel Core i9-13900K @253W | |
| AMD Ryzen 9 7900X | |
| Intel Core i9-12900K | |
| Intel Core i5-13600K @181W | |
| Intel Core i5-13600K | |
| AMD Ryzen 5 7600X | |
| Intel Core i5-12600K | |
| 3DMark 11 - 1280x720 Performance Physics | |
| Intel Core i9-13900K | |
| Intel Core i9-13900K @253W | |
| Intel Core i5-13600K | |
| Intel Core i5-13600K @181W | |
| AMD Ryzen 9 7900X | |
| NVIDIA GeForce RTX 3090 Founders Edition | |
| Intel Core i9-12900K | |
| AMD Ryzen 5 7600X | |
| Intel Core i5-12600K | |
| 7-Zip 18.03 | |
| 7z b 4 | |
| NVIDIA GeForce RTX 3090 Founders Edition | |
| Intel Core i9-13900K | |
| Intel Core i9-13900K @253W | |
| AMD Ryzen 9 7900X | |
| Intel Core i9-12900K | |
| Intel Core i5-13600K | |
| Intel Core i5-13600K @181W | |
| AMD Ryzen 5 7600X | |
| Intel Core i5-12600K | |
| 7z b 4 -mmt1 | |
| NVIDIA GeForce RTX 3090 Founders Edition | |
| AMD Ryzen 9 7900X | |
| AMD Ryzen 5 7600X | |
| Intel Core i9-13900K @253W | |
| Intel Core i9-13900K | |
| Intel Core i9-12900K | |
| Intel Core i5-13600K | |
| Intel Core i5-13600K @181W | |
| Intel Core i5-12600K | |
| HWBOT x265 Benchmark v2.2 - 4k Preset | |
| NVIDIA GeForce RTX 3090 Founders Edition | |
| Intel Core i9-13900K | |
| Intel Core i9-13900K @253W | |
| AMD Ryzen 9 7900X | |
| Intel Core i5-12600K | |
| Intel Core i9-12900K | |
| Intel Core i5-13600K | |
| Intel Core i5-13600K @181W | |
| AMD Ryzen 5 7600X | |
| R Benchmark 2.5 - Overall mean | |
| Intel Core i5-12600K | |
| Intel Core i9-12900K | |
| Intel Core i5-13600K | |
| Intel Core i5-13600K @181W | |
| AMD Ryzen 5 7600X | |
| AMD Ryzen 9 7900X | |
| NVIDIA GeForce RTX 3090 Founders Edition | |
| Intel Core i9-13900K | |
| Intel Core i9-13900K @253W | |
| LibreOffice - 20 Documents To PDF | |
| Intel Core i5-12600K | |
| Intel Core i9-12900K | |
| AMD Ryzen 5 7600X | |
| Intel Core i9-13900K | |
| Intel Core i5-13600K @181W | |
| NVIDIA GeForce RTX 3090 Founders Edition | |
| Intel Core i5-13600K | |
| AMD Ryzen 9 7900X | |
| Intel Core i9-13900K @253W | |
| WebXPRT 3 - Overall | |
| AMD Ryzen 9 7900X | |
| Intel Core i9-13900K @253W | |
| NVIDIA GeForce RTX 3090 Founders Edition | |
| AMD Ryzen 5 7600X | |
| Intel Core i9-13900K | |
| Intel Core i5-13600K | |
| Intel Core i5-13600K @181W | |
| Intel Core i9-12900K | |
| Intel Core i5-12600K | |
| Mozilla Kraken 1.1 - Total | |
| Intel Core i5-12600K | |
| Intel Core i9-12900K | |
| Intel Core i5-13600K | |
| Intel Core i5-13600K @181W | |
| AMD Ryzen 5 7600X | |
| NVIDIA GeForce RTX 3090 Founders Edition | |
| Intel Core i9-13900K | |
| AMD Ryzen 9 7900X | |
| Intel Core i9-13900K @253W | |
| 3DMark | |
| 3840x2160 Fire Strike Ultra Physics | |
| Intel Core i9-13900K @253W | |
| Intel Core i9-13900K | |
| AMD Ryzen 9 7900X | |
| NVIDIA GeForce RTX 3090 Founders Edition | |
| Intel Core i9-12900K | |
| Intel Core i5-13600K @181W | |
| Intel Core i5-13600K | |
| AMD Ryzen 5 7600X | |
| Intel Core i5-12600K | |
| 1920x1080 Fire Strike Physics | |
| Intel Core i9-13900K @253W | |
| Intel Core i9-13900K | |
| AMD Ryzen 9 7900X | |
| NVIDIA GeForce RTX 3090 Founders Edition | |
| Intel Core i9-12900K | |
| Intel Core i5-13600K @181W | |
| Intel Core i5-13600K | |
| AMD Ryzen 5 7600X | |
| Intel Core i5-12600K | |
| 2560x1440 Time Spy CPU | |
| Intel Core i9-13900K @253W | |
| Intel Core i9-13900K | |
| Intel Core i9-12900K | |
| Intel Core i5-13600K | |
| Intel Core i5-13600K @181W | |
| AMD Ryzen 9 7900X | |
| NVIDIA GeForce RTX 3090 Founders Edition | |
| Intel Core i5-12600K | |
| AMD Ryzen 5 7600X | |
* ... smaller is better
英特尔酷睿i9-13900K + 英特尔酷睿i5-13600K与Cinebench R15多循环对比
在负载测试中,我们运行Cinebench R15恒定循环,两个测试单元都显示出非常稳定的性能。然而,我们仍然应该提到,英特尔酷睿i9-13900K在温度极限下持续运行。但是在超过2000点的时候,性能的提高与 英特尔酷睿i9-12900K仍然是巨大的。在所有50次运行中平均达到3620点,英特尔酷睿i5-13600K也是值得一提的。
合成基准和应用性能
虽然在去年的Alder Lake发布中,合成基准测试仍然明显是英特尔的领域,但今年的情况看起来并不那么清晰。AMD能够跟上其Ryzen 9处理器的步伐,而英特尔在PCMark 10基准测试中只获得第三名。然而,与Alder Lake相比,Raptor Lake能够全程领先,实施良好的性能。
| PCMark 10 - Score | |
| AMD Ryzen 9 7900X, NVIDIA GeForce RTX 3090 | |
| NVIDIA GeForce RTX 3090 Founders Edition, NVIDIA GeForce RTX 3090 | |
| Intel Core i9-13900K, NVIDIA GeForce RTX 3090 | |
| AMD Ryzen 5 7600X, NVIDIA GeForce RTX 3090 | |
| Intel Core i5-13600K, NVIDIA GeForce RTX 3090 | |
| Intel Core i9-12900K, NVIDIA Titan RTX | |
| Intel Core i5-12600K, NVIDIA Titan RTX | |
| 3DMark | |
| 1920x1080 Fire Strike Physics | |
| Intel Core i9-13900K @253W, NVIDIA GeForce RTX 3090 | |
| Intel Core i9-13900K, NVIDIA GeForce RTX 3090 | |
| AMD Ryzen 9 7900X, NVIDIA GeForce RTX 3090 | |
| NVIDIA GeForce RTX 3090 Founders Edition, NVIDIA GeForce RTX 3090 | |
| Intel Core i9-12900K, NVIDIA Titan RTX | |
| Intel Core i5-13600K @181W, NVIDIA GeForce RTX 3090 | |
| Intel Core i5-13600K, NVIDIA GeForce RTX 3090 | |
| AMD Ryzen 5 7600X, NVIDIA GeForce RTX 3090 | |
| Intel Core i5-12600K, NVIDIA Titan RTX | |
| 2560x1440 Time Spy CPU | |
| Intel Core i9-13900K @253W, NVIDIA GeForce RTX 3090 | |
| Intel Core i9-13900K, NVIDIA GeForce RTX 3090 | |
| Intel Core i9-12900K, NVIDIA Titan RTX | |
| Intel Core i5-13600K, NVIDIA GeForce RTX 3090 | |
| Intel Core i5-13600K @181W, NVIDIA GeForce RTX 3090 | |
| AMD Ryzen 9 7900X, NVIDIA GeForce RTX 3090 | |
| NVIDIA GeForce RTX 3090 Founders Edition, NVIDIA GeForce RTX 3090 | |
| Intel Core i5-12600K, NVIDIA Titan RTX | |
| AMD Ryzen 5 7600X, NVIDIA GeForce RTX 3090 | |
| 3DMark 11 - 1280x720 Performance Physics | |
| Intel Core i9-13900K, NVIDIA GeForce RTX 3090 | |
| Intel Core i9-13900K @253W, NVIDIA GeForce RTX 3090 | |
| Intel Core i5-13600K, NVIDIA GeForce RTX 3090 | |
| Intel Core i5-13600K @181W, NVIDIA GeForce RTX 3090 | |
| AMD Ryzen 9 7900X, NVIDIA GeForce RTX 3090 | |
| NVIDIA GeForce RTX 3090 Founders Edition, NVIDIA GeForce RTX 3090 | |
| Intel Core i9-12900K, NVIDIA Titan RTX | |
| AMD Ryzen 5 7600X, NVIDIA GeForce RTX 3090 | |
| Intel Core i5-12600K, NVIDIA Titan RTX | |
| Desktop-PC, NVIDIA GeForce RTX 3090 | |
| CrossMark - Overall | |
| Intel Core i9-13900K, NVIDIA GeForce RTX 3090 | |
| Intel Core i9-13900K @253W, NVIDIA GeForce RTX 3090 | |
| NVIDIA GeForce RTX 3090 Founders Edition, NVIDIA GeForce RTX 3090 | |
| AMD Ryzen 9 7900X, NVIDIA GeForce RTX 3090 | |
| Intel Core i5-13600K, NVIDIA GeForce RTX 3090 | |
| Intel Core i5-13600K @181W, NVIDIA GeForce RTX 3090 | |
| AMD Ryzen 5 7600X, NVIDIA GeForce RTX 3090 | |
| Intel Core i5-12600K, NVIDIA GeForce RTX 3090 | |
| AIDA64 / Memory Copy | |
| Intel Core i9-13900K @253W | |
| Intel Core i9-13900K | |
| Intel Core i5-13600K @181W | |
| Intel Core i9-12900K | |
| NVIDIA GeForce RTX 3090 Founders Edition | |
| Intel Core i5-13600K | |
| Intel Core i5-12600K | |
| AMD Ryzen 9 7900X | |
| AMD Ryzen 5 7600X | |
| Average of class (4514 - 234662, n=2223) | |
| AIDA64 / Memory Read | |
| Intel Core i9-13900K | |
| Intel Core i9-13900K @253W | |
| Intel Core i9-12900K | |
| NVIDIA GeForce RTX 3090 Founders Edition | |
| Intel Core i5-13600K @181W | |
| Intel Core i5-12600K | |
| Intel Core i5-13600K | |
| AMD Ryzen 9 7900X | |
| AMD Ryzen 5 7600X | |
| Average of class (4031 - 271066, n=2185) | |
| AIDA64 / Memory Write | |
| AMD Ryzen 5 7600X | |
| NVIDIA GeForce RTX 3090 Founders Edition | |
| AMD Ryzen 9 7900X | |
| Intel Core i9-13900K | |
| Intel Core i5-13600K @181W | |
| Intel Core i9-13900K @253W | |
| Intel Core i5-12600K | |
| Intel Core i9-12900K | |
| Intel Core i5-13600K | |
| Average of class (3506 - 242868, n=2190) | |
| AIDA64 / Memory Latency | |
| Average of class (6.1 - 536, n=2251) | |
| Intel Core i5-13600K | |
| Intel Core i9-13900K @253W | |
| Intel Core i9-13900K | |
| Intel Core i5-13600K @181W | |
| AMD Ryzen 5 7600X | |
| AMD Ryzen 9 7900X | |
| NVIDIA GeForce RTX 3090 Founders Edition | |
* ... smaller is better
游戏性能
如果是前几年最快的游戏CPU的问题,你总是可以依靠英特尔。然而,AMD随后能够用其Zen 4处理器混战,所以这里没有明显的赢家。在11个游戏的累计比较中,英特尔酷睿i9-13900K勉强排在AMD Ryzen 9 7950X之后。然而,如果我们也考虑到处理器的价格等级,英特尔的酷睿i9-13900K能够仅仅排在AMD Ryzen 9 7900X的前面。但我们不应该忘记,有些游戏在英特尔处理器下运行得更好,而在其他游戏中,AMD处理器的性能更好。在这两款猛禽湖S处理器的内部比较中, 英特尔酷睿i5-13600K与旗舰产品相比只输了7%。那些仍然使用AM4主板的人也可以看一下 AMD Ryzen 7 5800X3D,因为该CPU也提供了非常好的游戏性能。
英特尔酷睿i9-13900K和英特尔酷睿i5-13600K处理器都提供了非常好的游戏性能。在CPU限制中,我们测量了两个竞争对手之间的一些明显的性能差异,但随着分辨率和细节的增加,这种差异变得越来越小。 我们无法给英特尔今年最快的游戏CPU的桂冠,因为AMD的Ryzen 9 7950X略微快一点。所有竞争者的得分再次接近。那些除了游戏之外,还流媒体和希望包括公众的人将从更高的线程数量中受益,这也使目前的猛禽湖处理器对内容创作者非常有趣。
Gaming Performance - Raptor Lake vs. Alder Lake
| Performance rating - Percent | |
| Intel Core i9-13900K | |
| Intel Core i9-12900K | |
| Intel Core i5-13600K | |
| Intel Core i5-12600K -2! | |
| F1 22 | |
| 1920x1080 Low Preset AA:T AF:16x | |
| Intel Core i5-13600K | |
| Intel Core i9-13900K | |
| Intel Core i9-12900K | |
| Intel Core i5-12600K | |
| 1920x1080 Ultra High Preset AA:T AF:16x | |
| Intel Core i9-12900K | |
| Intel Core i5-12600K | |
| Intel Core i5-13600K | |
| Intel Core i9-13900K | |
| Far Cry 5 | |
| 1920x1080 Ultra Preset AA:T | |
| Intel Core i9-13900K | |
| Intel Core i5-13600K | |
| Intel Core i9-12900K | |
| Intel Core i5-12600K | |
| 1280x720 Low Preset AA:T | |
| Intel Core i9-13900K | |
| Intel Core i5-13600K | |
| Intel Core i9-12900K | |
| Intel Core i5-12600K | |
| X-Plane 11.11 | |
| 1920x1080 high (fps_test=3) | |
| Intel Core i9-13900K | |
| Intel Core i9-12900K | |
| Intel Core i5-13600K | |
| Intel Core i5-12600K | |
| 1280x720 low (fps_test=1) | |
| Intel Core i9-13900K | |
| Intel Core i9-12900K | |
| Intel Core i5-13600K | |
| Intel Core i5-12600K | |
| Final Fantasy XV Benchmark | |
| 1920x1080 High Quality | |
| Intel Core i5-13600K | |
| Intel Core i9-13900K | |
| Intel Core i9-12900K | |
| Intel Core i5-12600K | |
| 1280x720 Lite Quality | |
| Intel Core i5-13600K | |
| Intel Core i9-13900K | |
| Intel Core i9-12900K | |
| Intel Core i5-12600K | |
| Dota 2 Reborn | |
| 1920x1080 ultra (3/3) best looking | |
| Intel Core i9-13900K | |
| Intel Core i5-13600K | |
| Intel Core i9-12900K | |
| Intel Core i5-12600K | |
| 1280x720 min (0/3) fastest | |
| Intel Core i9-13900K | |
| Intel Core i5-13600K | |
| Intel Core i9-12900K | |
| Intel Core i5-12600K | |
| The Witcher 3 | |
| 1920x1080 Ultra Graphics & Postprocessing (HBAO+) | |
| Intel Core i5-13600K | |
| Intel Core i9-12900K | |
| Intel Core i9-13900K | |
| 1024x768 Low Graphics & Postprocessing | |
| Intel Core i9-13900K | |
| Intel Core i9-12900K | |
| Intel Core i5-13600K | |
| GTA V | |
| 1920x1080 Highest AA:4xMSAA + FX AF:16x | |
| Intel Core i9-13900K | |
| Intel Core i5-13600K | |
| Intel Core i9-12900K | |
| Intel Core i5-12600K | |
| 1024x768 Lowest Settings possible | |
| Intel Core i9-13900K | |
| Intel Core i5-13600K | |
| Intel Core i9-12900K | |
| Intel Core i5-12600K | |
Gaming Performance in Direct Comparison with AMD
| Performance rating - Percent | |
| AMD Ryzen 9 7950X | |
| Intel Core i9-13900K | |
| AMD Ryzen 9 7900X | |
| AMD Ryzen 5 7600X | |
| Intel Core i5-13600K | |
| F1 22 | |
| 1920x1080 Low Preset AA:T AF:16x | |
| AMD Ryzen 9 7950X | |
| AMD Ryzen 9 7900X | |
| AMD Ryzen 5 7600X | |
| Intel Core i5-13600K | |
| Intel Core i9-13900K | |
| 1920x1080 Ultra High Preset AA:T AF:16x | |
| AMD Ryzen 9 7950X | |
| Intel Core i5-13600K | |
| AMD Ryzen 5 7600X | |
| AMD Ryzen 9 7900X | |
| Intel Core i9-13900K | |
| Far Cry 5 | |
| 1920x1080 Ultra Preset AA:T | |
| Intel Core i9-13900K | |
| AMD Ryzen 9 7950X | |
| Intel Core i5-13600K | |
| AMD Ryzen 9 7900X | |
| AMD Ryzen 5 7600X | |
| 1280x720 Low Preset AA:T | |
| Intel Core i9-13900K | |
| AMD Ryzen 9 7900X | |
| Intel Core i5-13600K | |
| AMD Ryzen 9 7950X | |
| AMD Ryzen 5 7600X | |
| X-Plane 11.11 | |
| 1920x1080 high (fps_test=3) | |
| AMD Ryzen 9 7900X | |
| AMD Ryzen 9 7950X | |
| AMD Ryzen 5 7600X | |
| Intel Core i9-13900K | |
| Intel Core i5-13600K | |
| 1280x720 low (fps_test=1) | |
| Intel Core i9-13900K | |
| AMD Ryzen 5 7600X | |
| AMD Ryzen 9 7900X | |
| AMD Ryzen 9 7950X | |
| Intel Core i5-13600K | |
| Final Fantasy XV Benchmark | |
| 1920x1080 High Quality | |
| AMD Ryzen 9 7900X | |
| Intel Core i5-13600K | |
| Intel Core i9-13900K | |
| AMD Ryzen 9 7950X | |
| AMD Ryzen 5 7600X | |
| 1280x720 Lite Quality | |
| AMD Ryzen 9 7900X | |
| Intel Core i5-13600K | |
| AMD Ryzen 9 7950X | |
| Intel Core i9-13900K | |
| AMD Ryzen 5 7600X | |
| Dota 2 Reborn | |
| 1920x1080 ultra (3/3) best looking | |
| AMD Ryzen 9 7950X | |
| AMD Ryzen 9 7900X | |
| Intel Core i9-13900K | |
| AMD Ryzen 5 7600X | |
| Intel Core i5-13600K | |
| 1280x720 min (0/3) fastest | |
| AMD Ryzen 5 7600X | |
| AMD Ryzen 9 7900X | |
| AMD Ryzen 9 7950X | |
| Intel Core i9-13900K | |
| Intel Core i5-13600K | |
| The Witcher 3 | |
| 1920x1080 Ultra Graphics & Postprocessing (HBAO+) | |
| AMD Ryzen 9 7950X | |
| AMD Ryzen 9 7900X | |
| AMD Ryzen 5 7600X | |
| Intel Core i5-13600K | |
| Intel Core i9-13900K | |
| 1024x768 Low Graphics & Postprocessing | |
| AMD Ryzen 9 7950X | |
| AMD Ryzen 9 7900X | |
| Intel Core i9-13900K | |
| AMD Ryzen 5 7600X | |
| Intel Core i5-13600K | |
| GTA V | |
| 1920x1080 Highest AA:4xMSAA + FX AF:16x | |
| Intel Core i9-13900K | |
| AMD Ryzen 9 7950X | |
| AMD Ryzen 9 7900X | |
| AMD Ryzen 5 7600X | |
| Intel Core i5-13600K | |
| 1024x768 Lowest Settings possible | |
| Intel Core i9-13900K | |
| AMD Ryzen 9 7900X | |
| AMD Ryzen 5 7600X | |
| Intel Core i5-13600K | |
| AMD Ryzen 9 7950X | |
| Borderlands 3 | |
| 1280x720 Very Low Overall Quality (DX11) | |
| AMD Ryzen 9 7900X | |
| Intel Core i9-13900K | |
| AMD Ryzen 9 7950X | |
| AMD Ryzen 5 7600X | |
| Intel Core i5-13600K | |
| 1920x1080 Badass Overall Quality (DX11) | |
| AMD Ryzen 9 7950X | |
| AMD Ryzen 9 7900X | |
| Intel Core i9-13900K | |
| AMD Ryzen 5 7600X | |
| Intel Core i5-13600K | |
| Far Cry New Dawn | |
| 1280x720 Low Preset | |
| Intel Core i9-13900K | |
| AMD Ryzen 9 7950X | |
| Intel Core i5-13600K | |
| AMD Ryzen 9 7900X | |
| AMD Ryzen 5 7600X | |
| 1920x1080 Ultra Preset | |
| Intel Core i9-13900K | |
| AMD Ryzen 9 7950X | |
| Intel Core i5-13600K | |
| AMD Ryzen 9 7900X | |
| AMD Ryzen 5 7600X | |
| Shadow of the Tomb Raider | |
| 1280x720 Lowest Preset | |
| AMD Ryzen 9 7950X | |
| AMD Ryzen 9 7900X | |
| Intel Core i9-13900K | |
| AMD Ryzen 5 7600X | |
| Intel Core i5-13600K | |
| 1920x1080 Highest Preset AA:T | |
| AMD Ryzen 9 7900X | |
| AMD Ryzen 9 7950X | |
| Intel Core i9-13900K | |
| AMD Ryzen 5 7600X | |
| Intel Core i5-13600K | |
| Tiny Tina's Wonderlands | |
| 1920x1080 Low Preset (DX12) | |
| AMD Ryzen 9 7950X | |
| Intel Core i9-13900K | |
| AMD Ryzen 5 7600X | |
| AMD Ryzen 9 7900X | |
| Intel Core i5-13600K | |
| 1920x1080 Badass Preset (DX12) | |
| AMD Ryzen 9 7900X | |
| AMD Ryzen 5 7600X | |
| AMD Ryzen 9 7950X | |
| Intel Core i9-13900K | |
| Intel Core i5-13600K | |
Intel Core i9-13900K with Nvidia GeForce RTX 3090
| low | med. | high | ultra | QHD | 4K | |
|---|---|---|---|---|---|---|
| GTA V (2015) | 187.7 | 187.7 | 187.4 | 165.6 | 156.7 | 182.5 |
| The Witcher 3 (2015) | 752 | 584 | 368 | 179.8 | 151.6 | |
| Dota 2 Reborn (2015) | 285.3 | 256.1 | 243.7 | 229.2 | 215.9 | |
| Final Fantasy XV Benchmark (2018) | 234 | 233 | 188.9 | 148.2 | 88.5 | |
| X-Plane 11.11 (2018) | 234 | 202 | 148.4 | 128.4 | ||
| Far Cry 5 (2018) | 263 | 232 | 220 | 205 | 186 | 110 |
| Strange Brigade (2018) | 749 | 506 | 402 | 350 | 266 | 159 |
| Shadow of the Tomb Raider (2018) | 314 | 265 | 250 | 230 | 167.4 | 97.1 |
| Far Cry New Dawn (2019) | 221 | 191 | 183 | 166 | 156 | 111 |
| Metro Exodus (2019) | 285 | 217 | 173.9 | 141.3 | 116.4 | 76.2 |
| Borderlands 3 (2019) | 243 | 215 | 190.3 | 163 | 128.3 | 73.1 |
| F1 2020 (2020) | 515 | 438 | 407 | 297 | 233 | 142.4 |
| F1 2021 (2021) | 590 | 520 | 435 | 224 | 171.8 | 103.4 |
| Far Cry 6 (2021) | 226 | 192.3 | 169.2 | 159.1 | 133.5 | 84.5 |
| Forza Horizon 5 (2021) | 334 | 214 | 196 | 127 | 113 | 85 |
| God of War (2022) | 240 | 204 | 170.8 | 121.9 | 108.4 | 77.1 |
| Tiny Tina's Wonderlands (2022) | 368 | 297 | 209 | 165.8 | 121.7 | 69.2 |
| F1 22 (2022) | 320 | 338 | 308 | 122.6 | 82.5 | 41.8 |
| The Quarry (2022) | 279 | 217 | 177.3 | 146.1 | 104.6 | 59 |
Intel Core i5-13600K with Nvidia GeForce RTX 3090
| low | med. | high | ultra | QHD | 4K | |
|---|---|---|---|---|---|---|
| GTA V (2015) | 187.5 | 187.5 | 186.7 | 154.9 | 148.5 | 180.7 |
| The Witcher 3 (2015) | 611 | 551 | 369 | 183.2 | 152.8 | |
| Dota 2 Reborn (2015) | 246.2 | 224.6 | 216.8 | 205.4 | 200.4 | |
| Final Fantasy XV Benchmark (2018) | 235 | 230 | 189.7 | 145.6 | 86.8 | |
| X-Plane 11.11 (2018) | 200 | 175.3 | 131.4 | 112.7 | ||
| Far Cry 5 (2018) | 240 | 212 | 201 | 188 | 177 | 108 |
| Strange Brigade (2018) | 679 | 487 | 398 | 348 | 265 | 158.4 |
| Shadow of the Tomb Raider (2018) | 269 | 240 | 234 | 220 | 167.1 | 96.4 |
| Far Cry New Dawn (2019) | 201 | 176 | 170 | 153 | 146 | 108 |
| Metro Exodus (2019) | 272 | 218 | 173 | 140.8 | 115.5 | 75.7 |
| Borderlands 3 (2019) | 223 | 195.3 | 176.3 | 156.3 | 128.3 | 73.2 |
| F1 2020 (2020) | 456 | 383 | 376 | 295 | 233 | 142.1 |
| F1 2021 (2021) | 512 | 474 | 399 | 223 | 171.8 | 101.8 |
| Far Cry 6 (2021) | 195.3 | 183.1 | 170.8 | 151.2 | 132.4 | 84.1 |
| God of War (2022) | 228 | 205 | 168.9 | 122 | 106.5 | 76.5 |
| GRID Legends (2022) | 287 | 261 | 232 | 156 | 177.8 | 115.1 |
| Tiny Tina's Wonderlands (2022) | 358 | 290 | 208 | 165.1 | 120.8 | 68.8 |
| F1 22 (2022) | 322 | 373 | 432 | 128.1 | 84.1 | 42.4 |
| The Quarry (2022) | 270 | 213 | 177.9 | 145.9 | 105 | 59.4 |
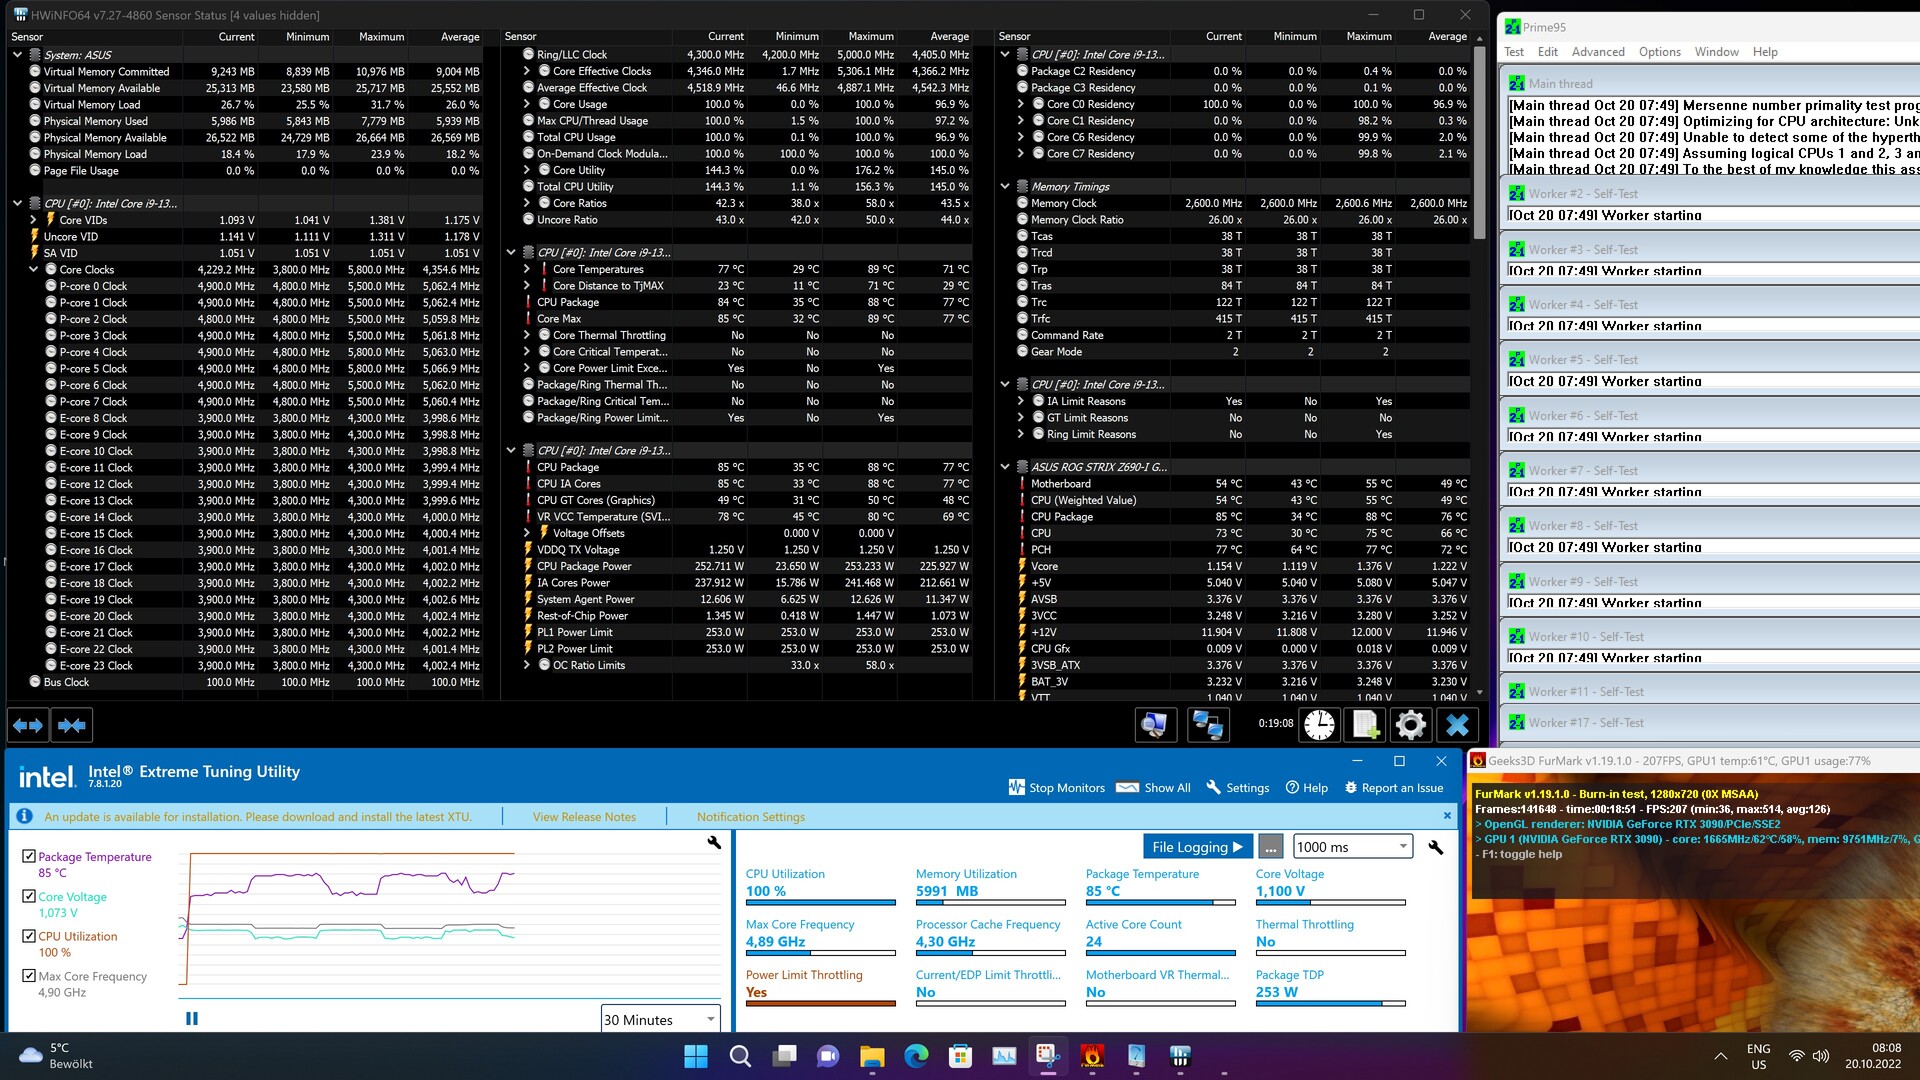
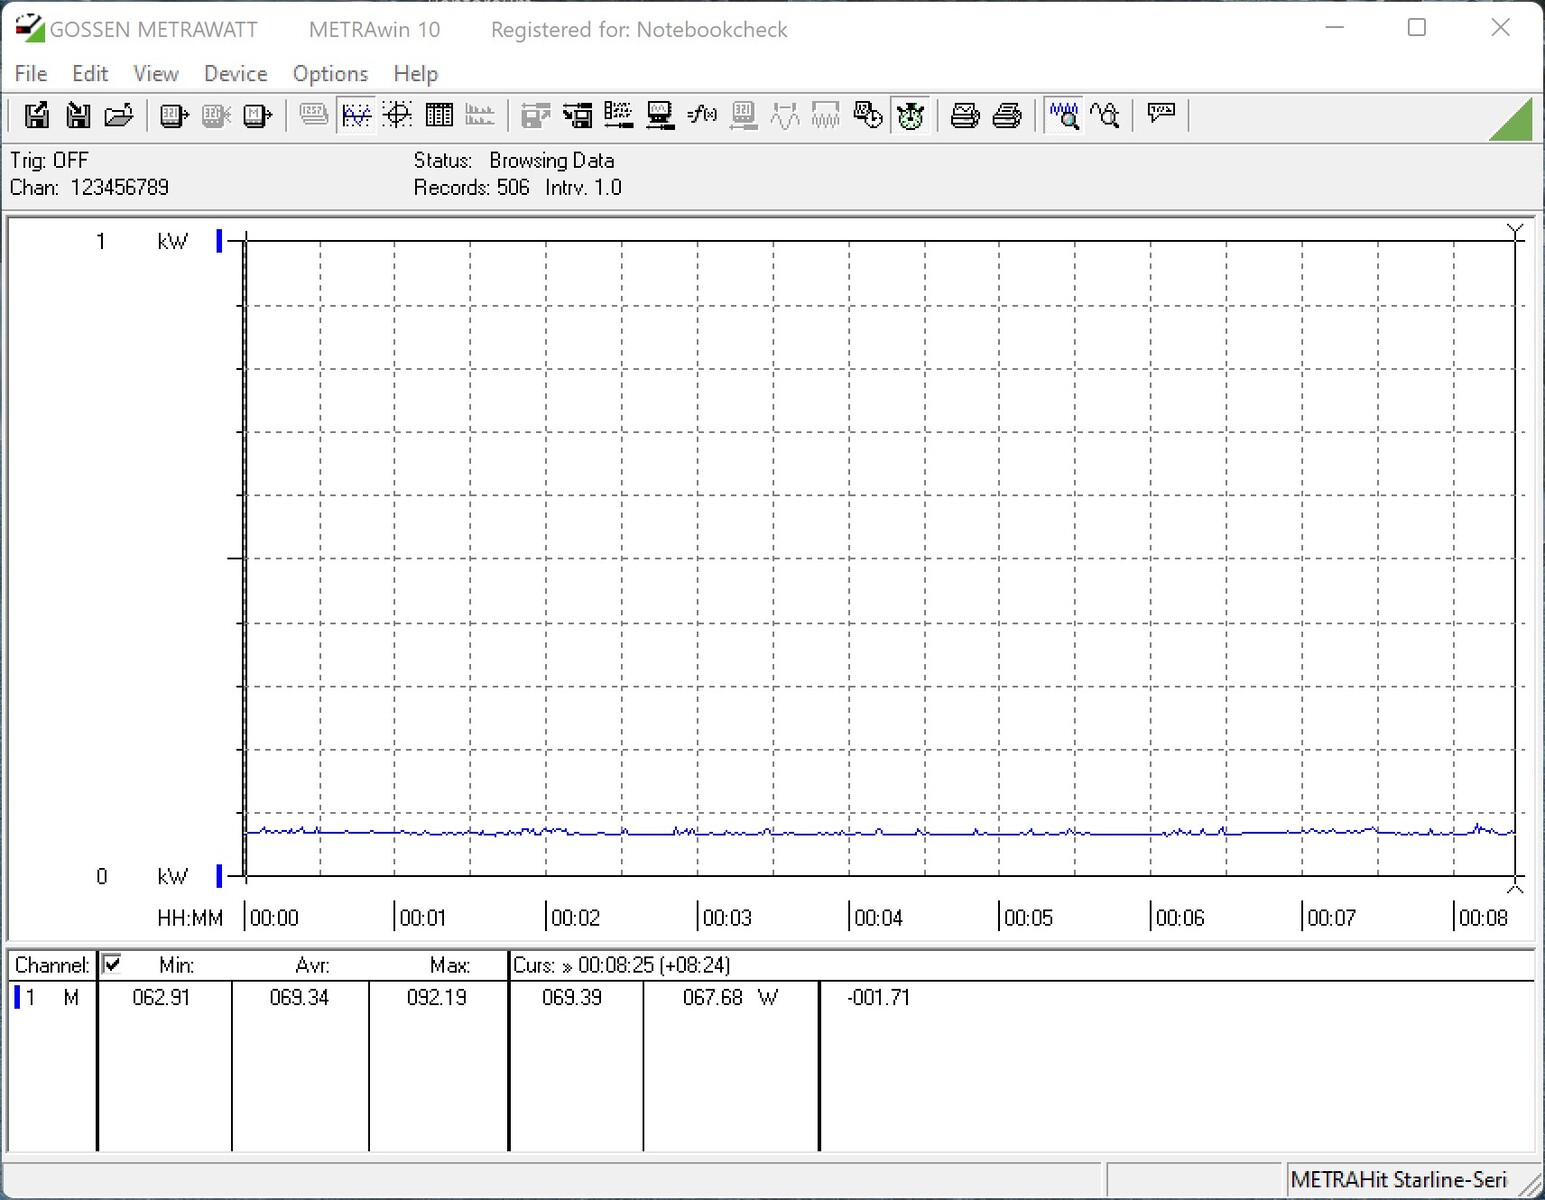
消耗功率
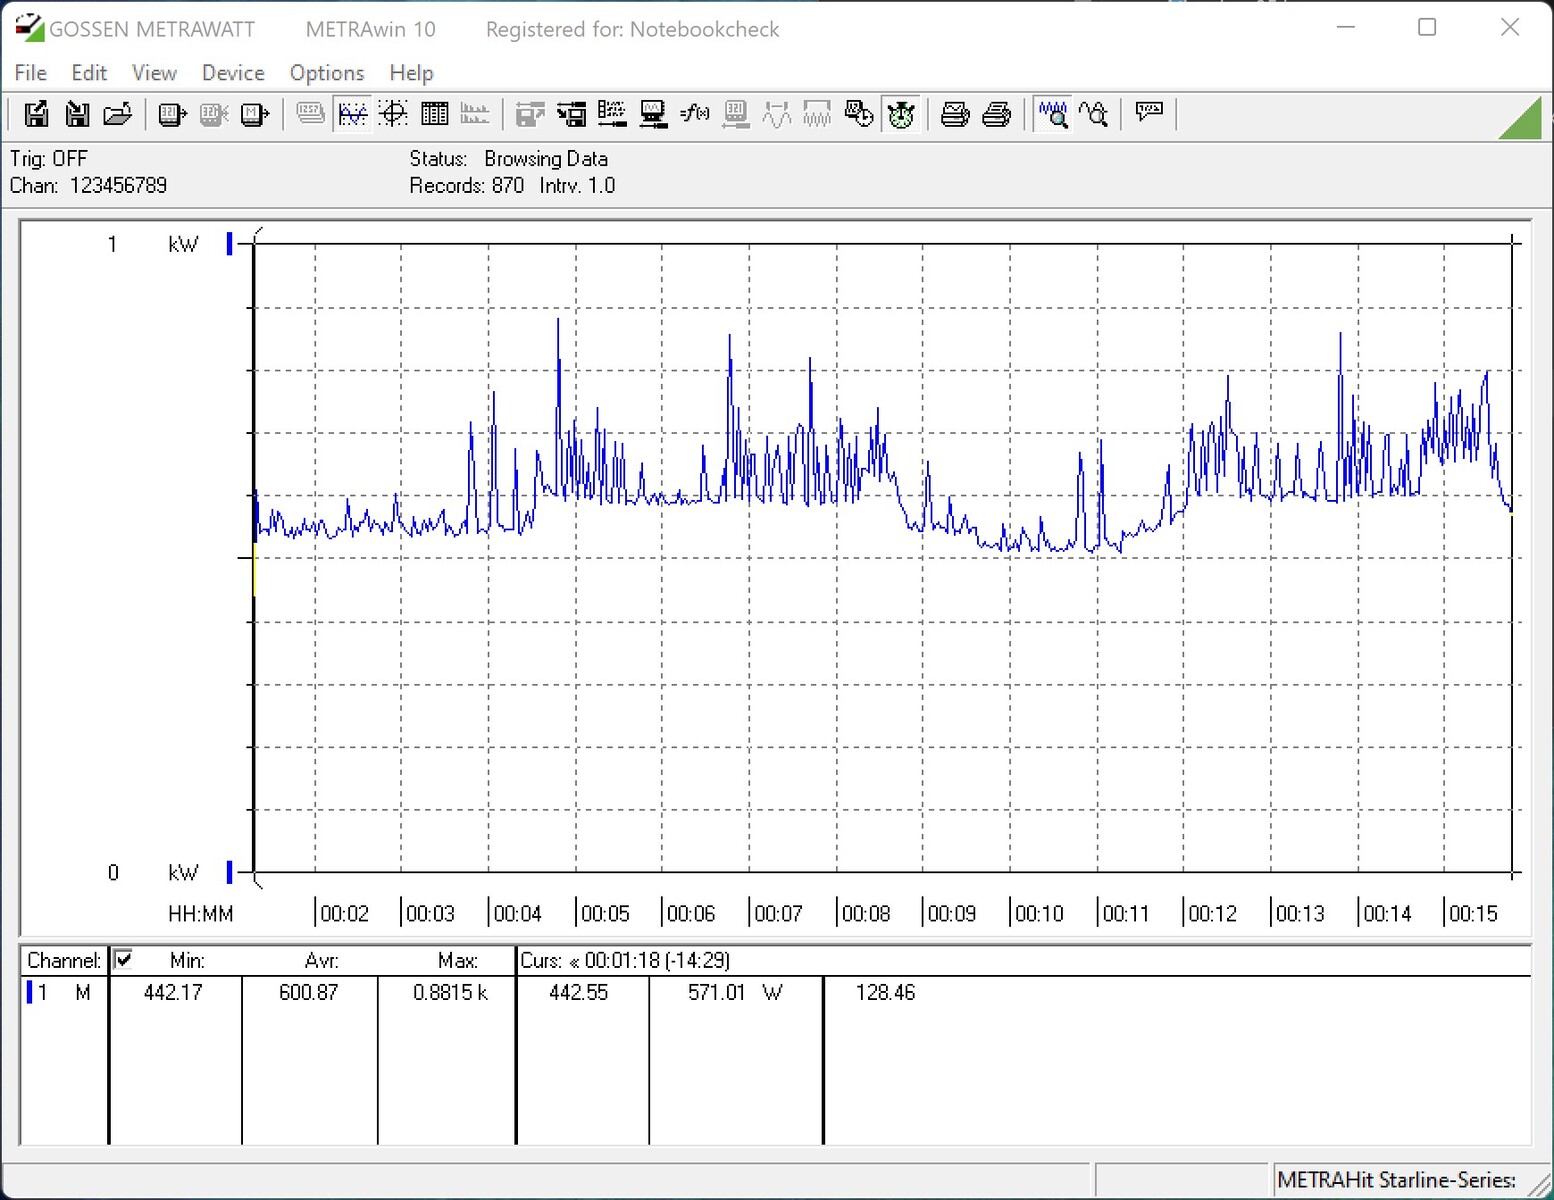
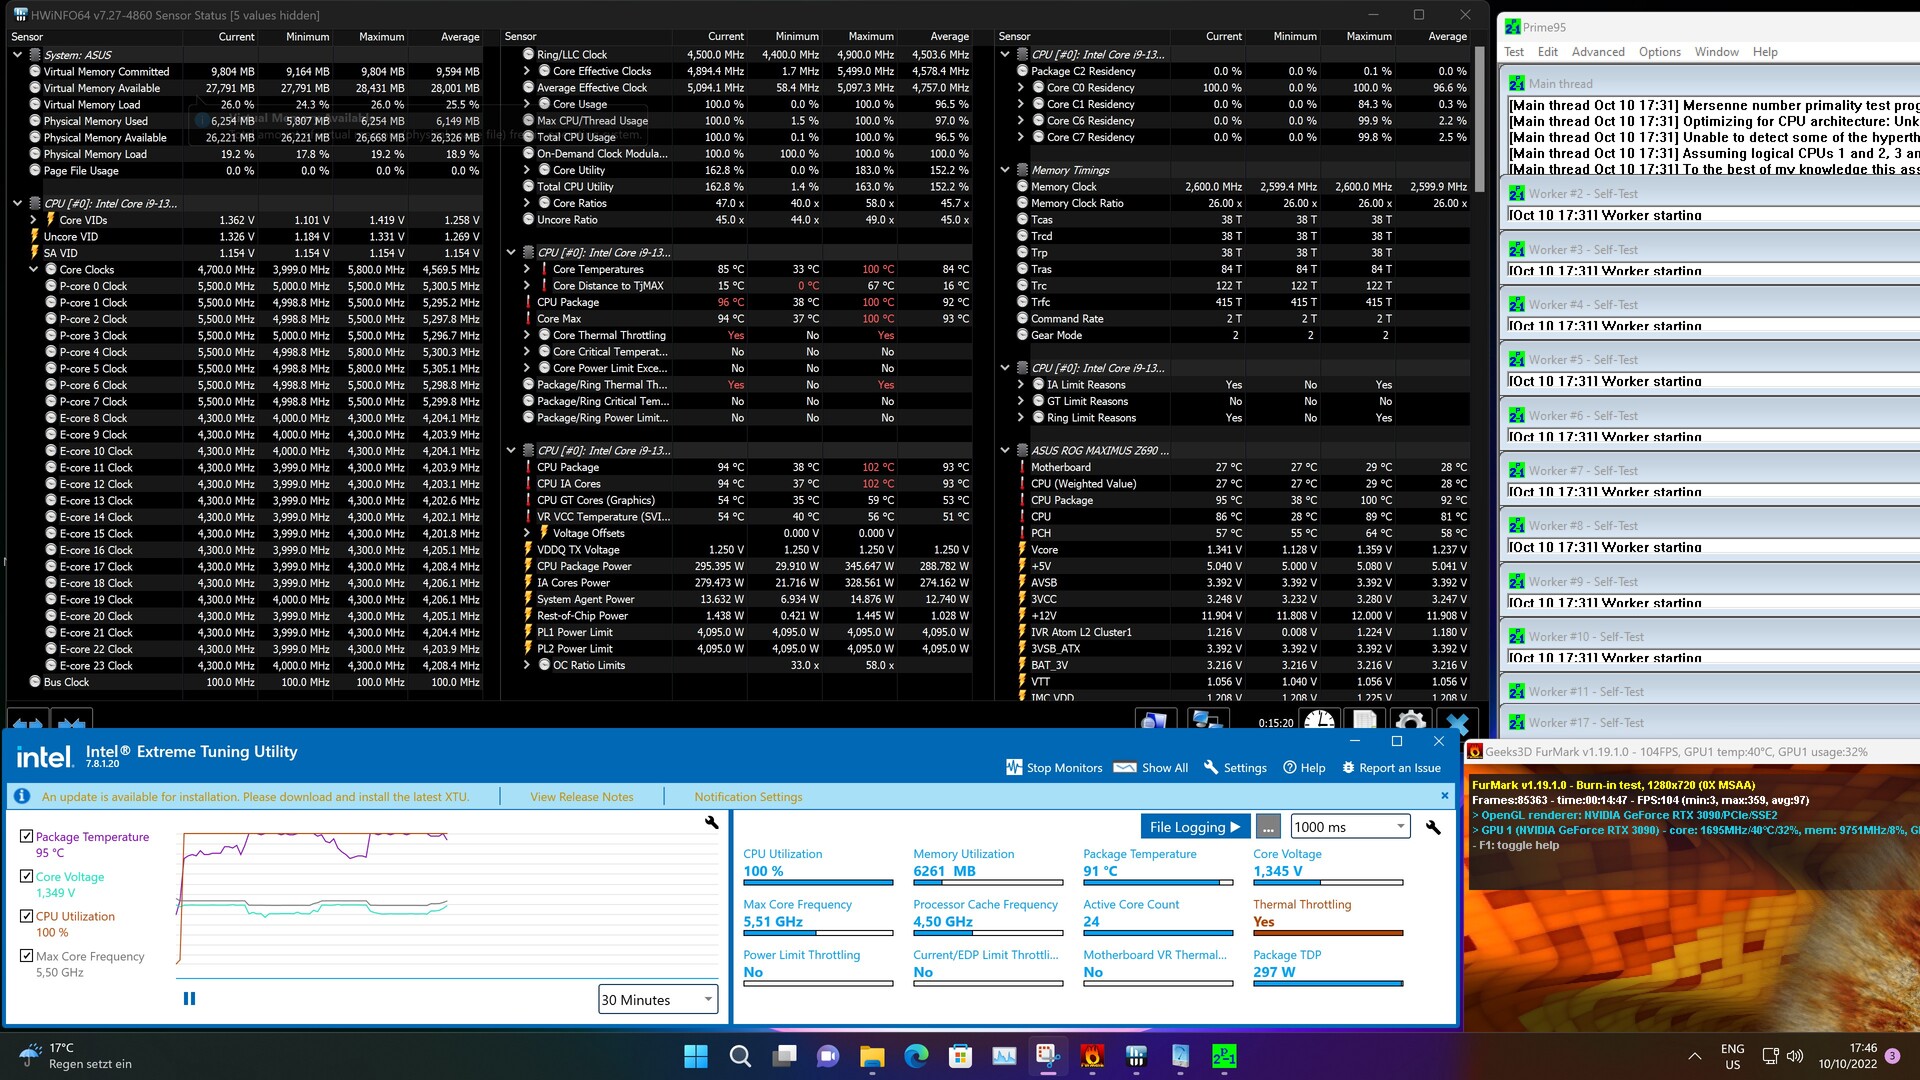
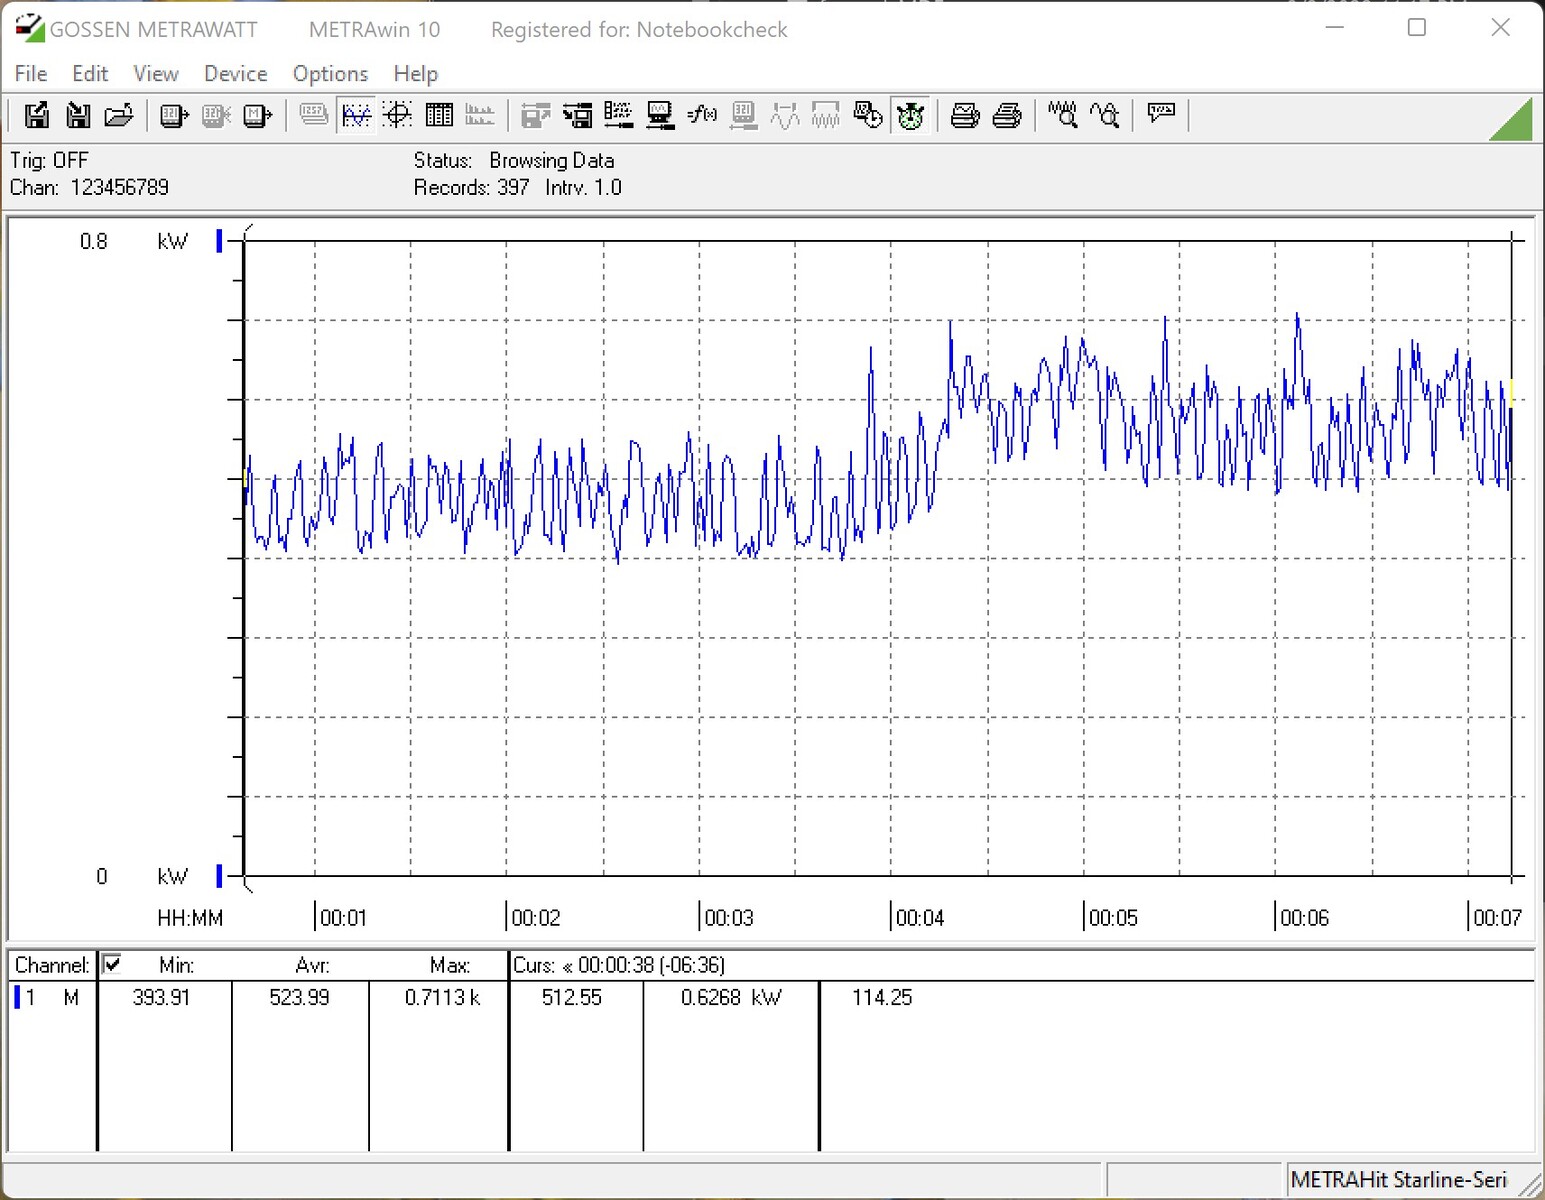
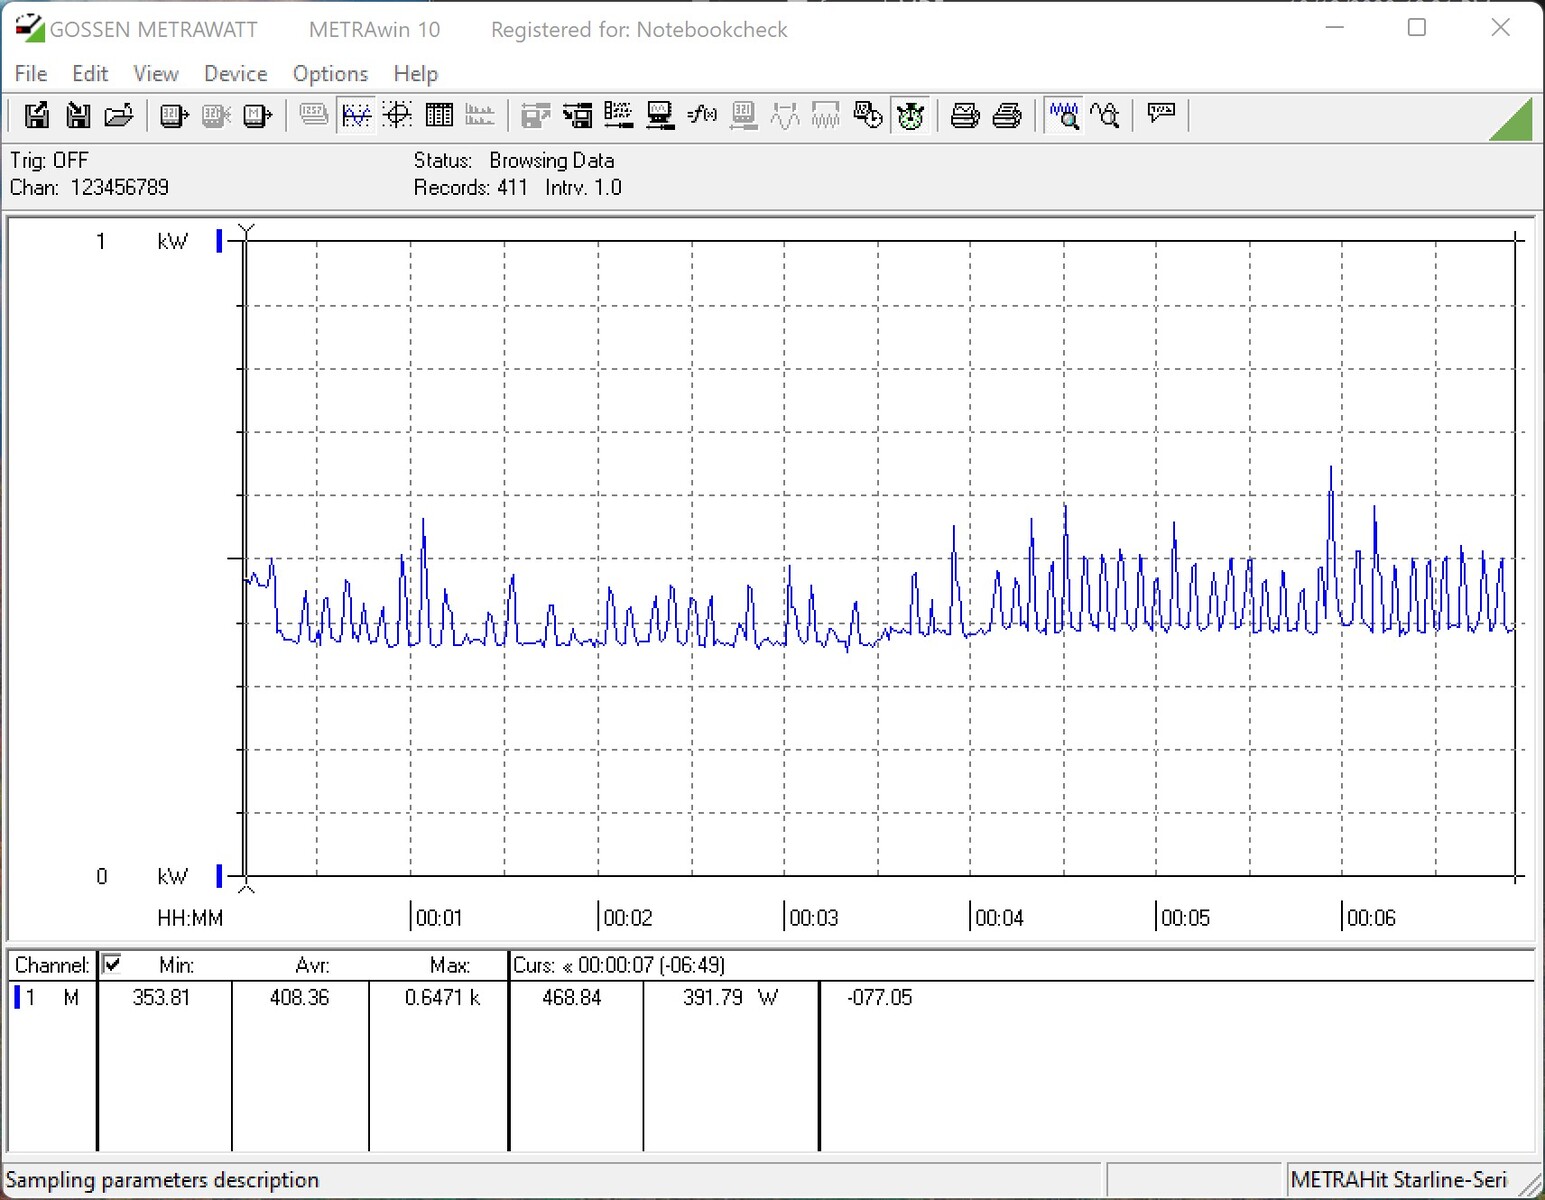
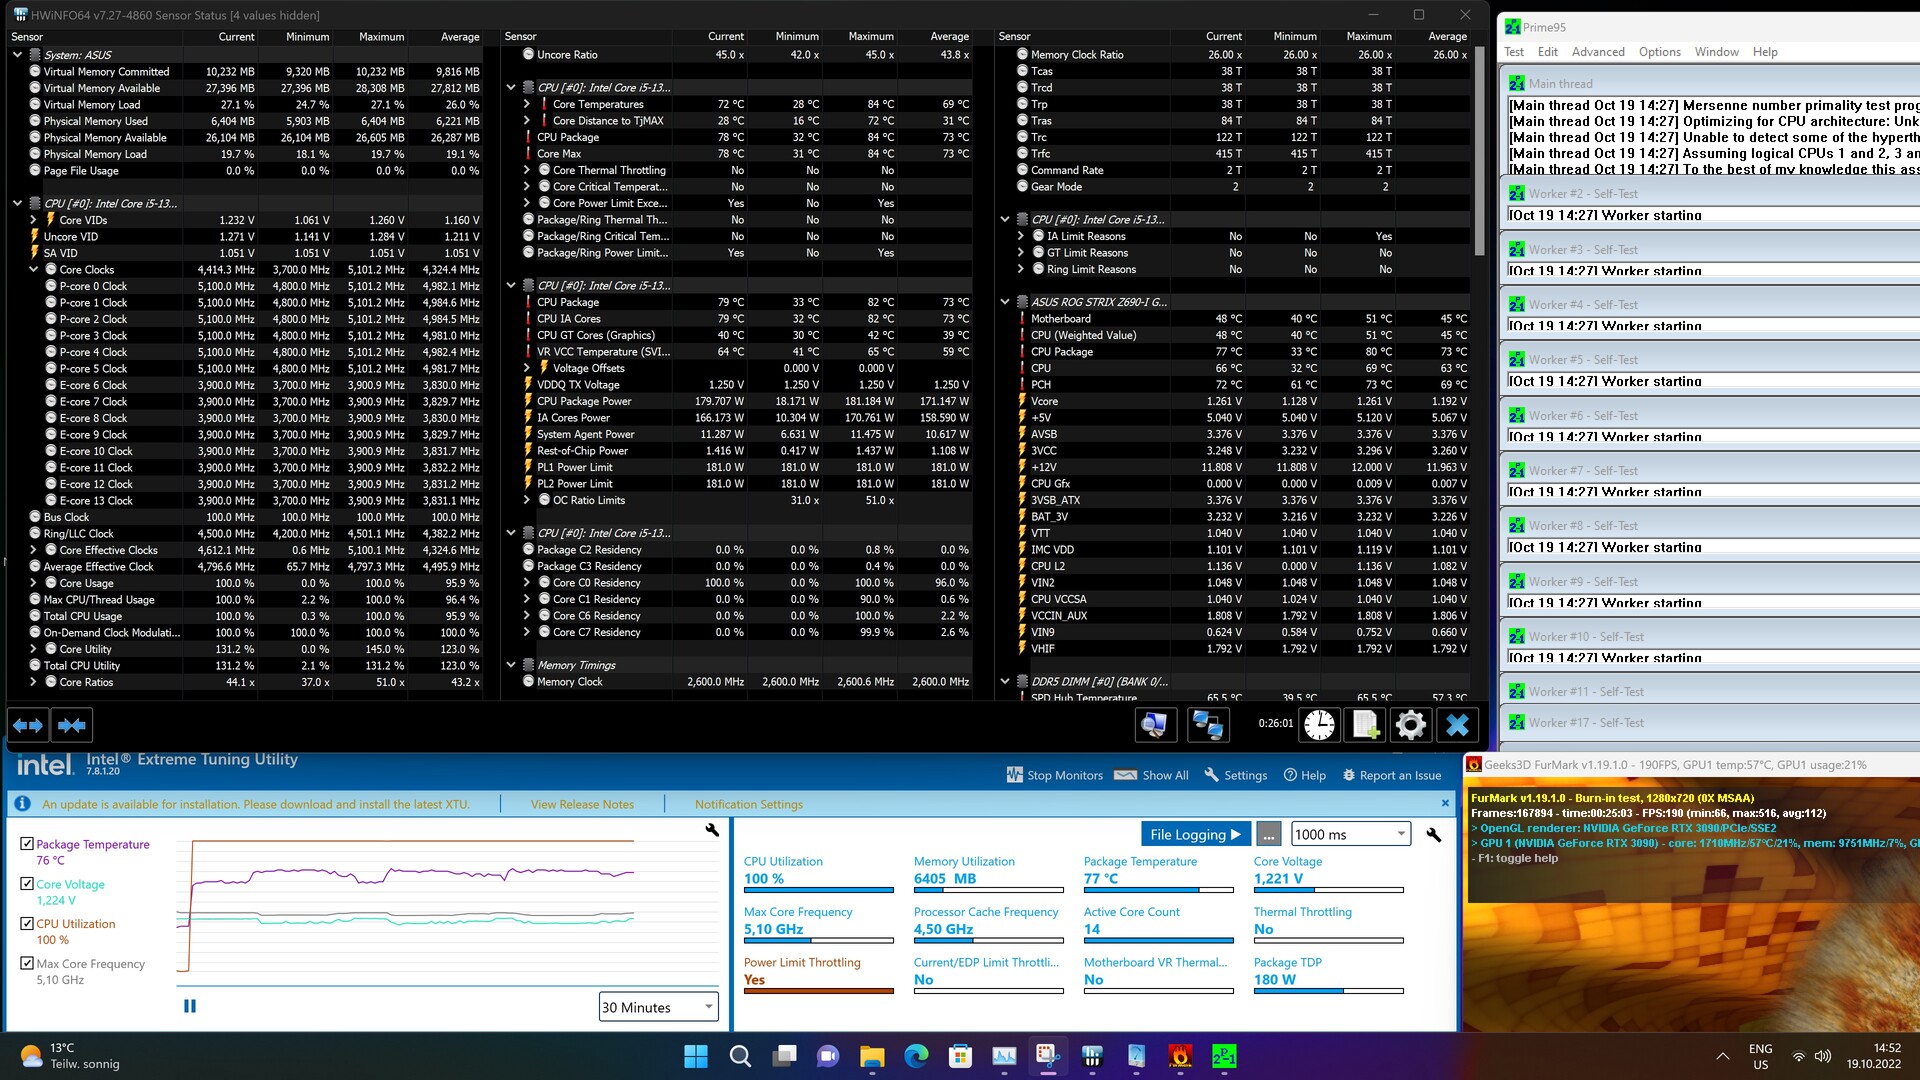
根据技术规格,这些处理器继续提供125瓦的TDP。这指的是PL1值。PL2值规定了在满足所有要求的情况下,允许处理器在全负荷下消耗多少瓦特。如果在BIOS中激活所有的限制,英特尔酷睿i9-13900K允许消耗的最大功率为253瓦。对于英特尔酷睿i5-13600K来说,它仍然是181瓦。如果所有的限制都被停用,那么就没有对功耗的直接限制,这意味着只有温度限制能够减缓CPU的速度。因此,我们在压力测试中不断达到100°C(212°F)大关也就不奇怪了。在这一点上,我们测量酷睿i9-13900K的功率为345瓦,酷睿i5-13600K的功率为240瓦。有了这个,使用一个好的冷却系统将增加相当多的功耗。
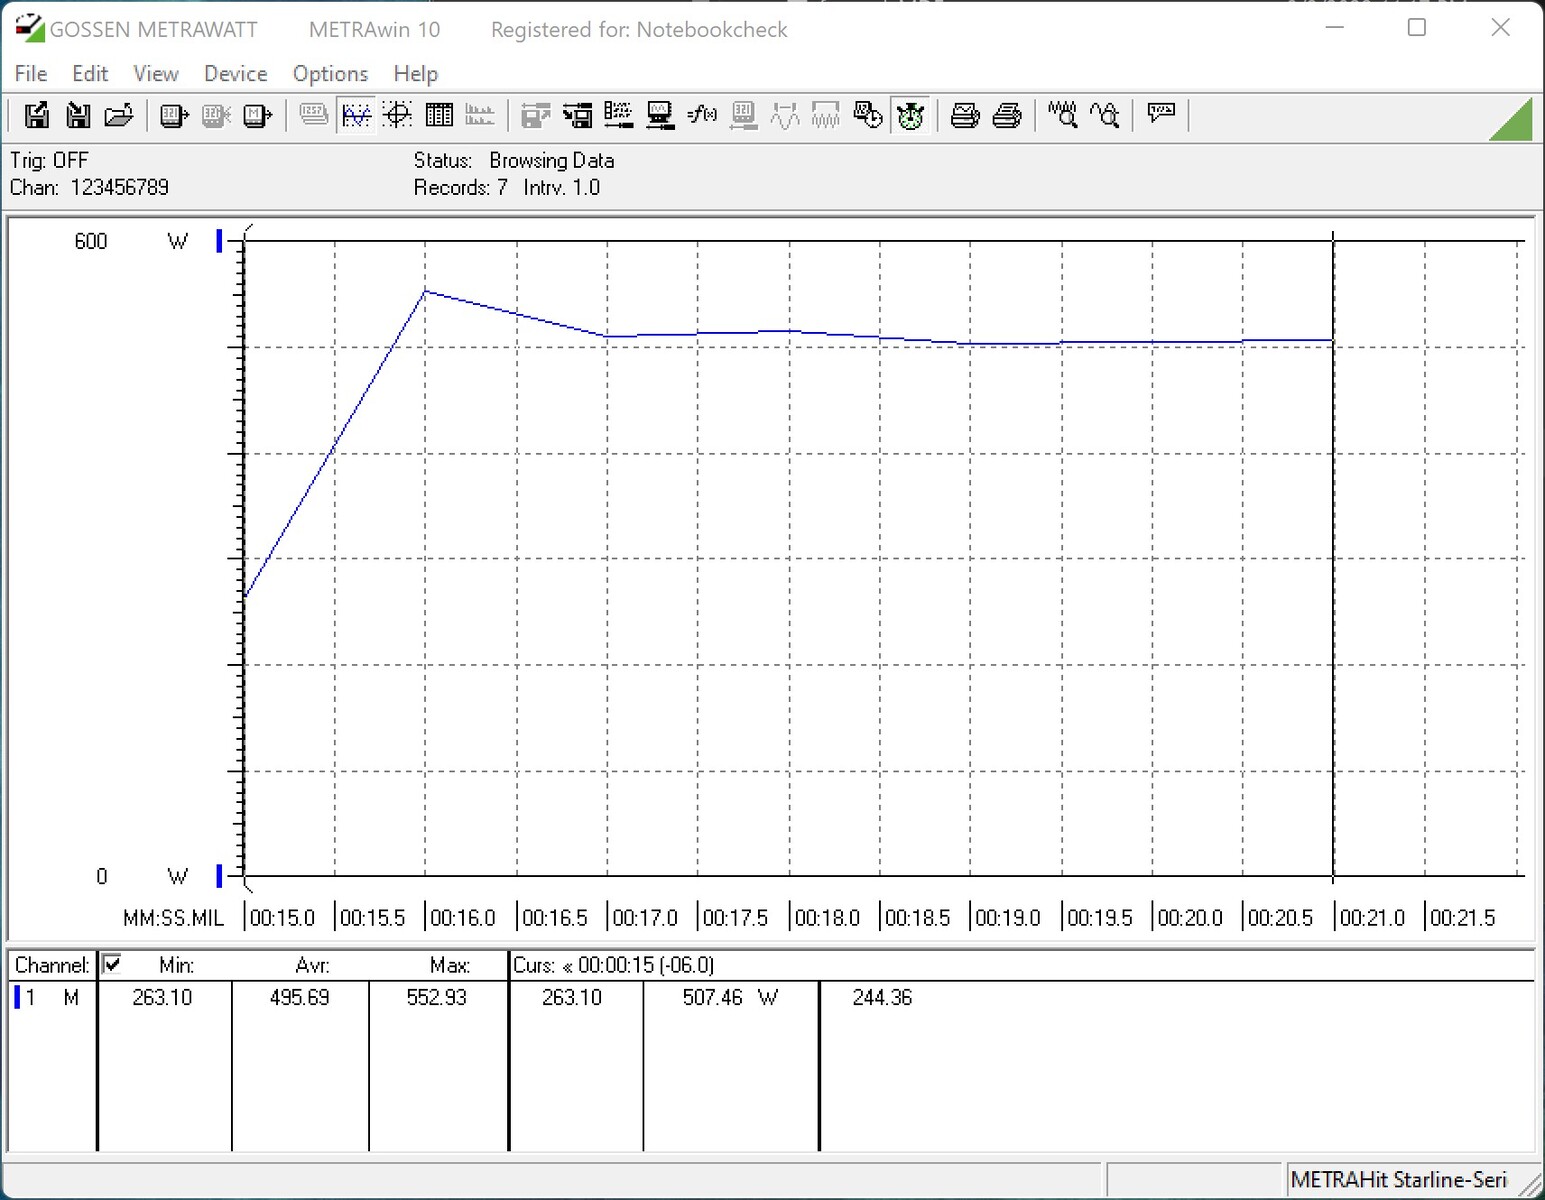
在Cinebench R15多重测试中,我们测量的测试系统的功耗为480瓦。与英特尔酷睿i9-12900K相比,这是48%或几乎160瓦的电源输送量。对于英特尔酷睿i5-13600K,增幅也不小,为39%或额外80瓦。在游戏时,耗电量略低。然而,我们仍然测量到平均至少500瓦。
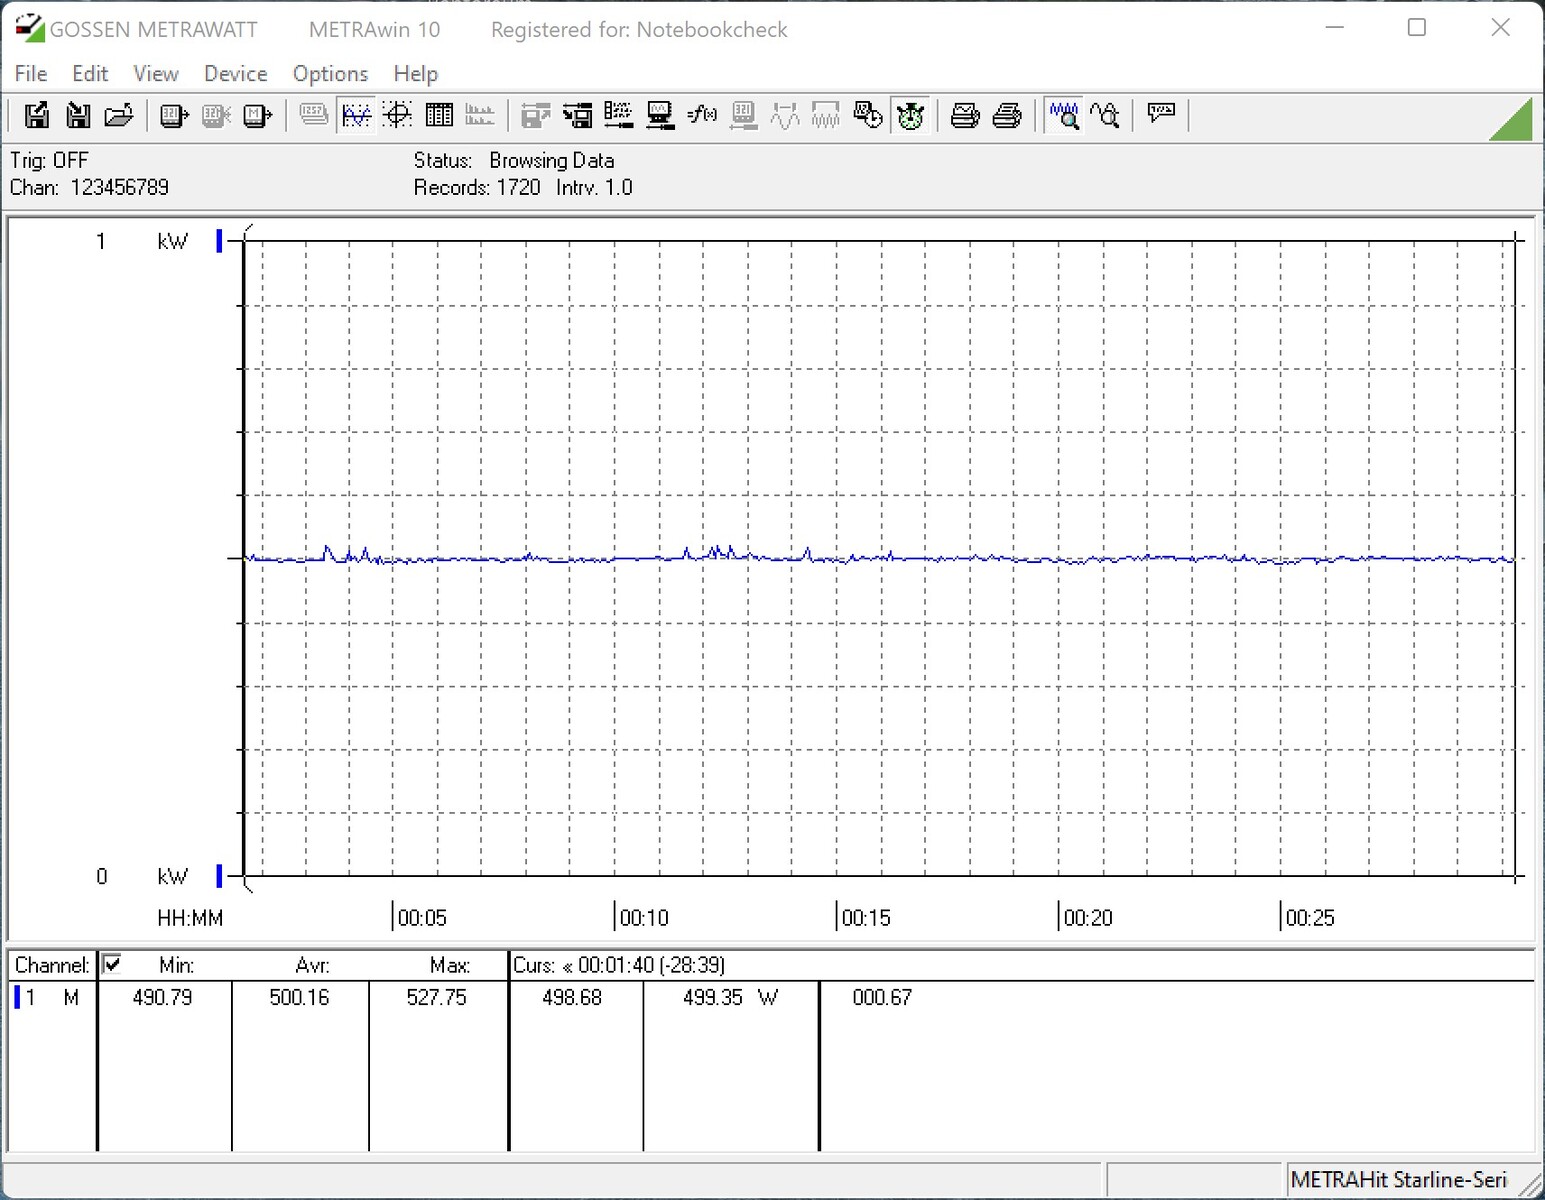
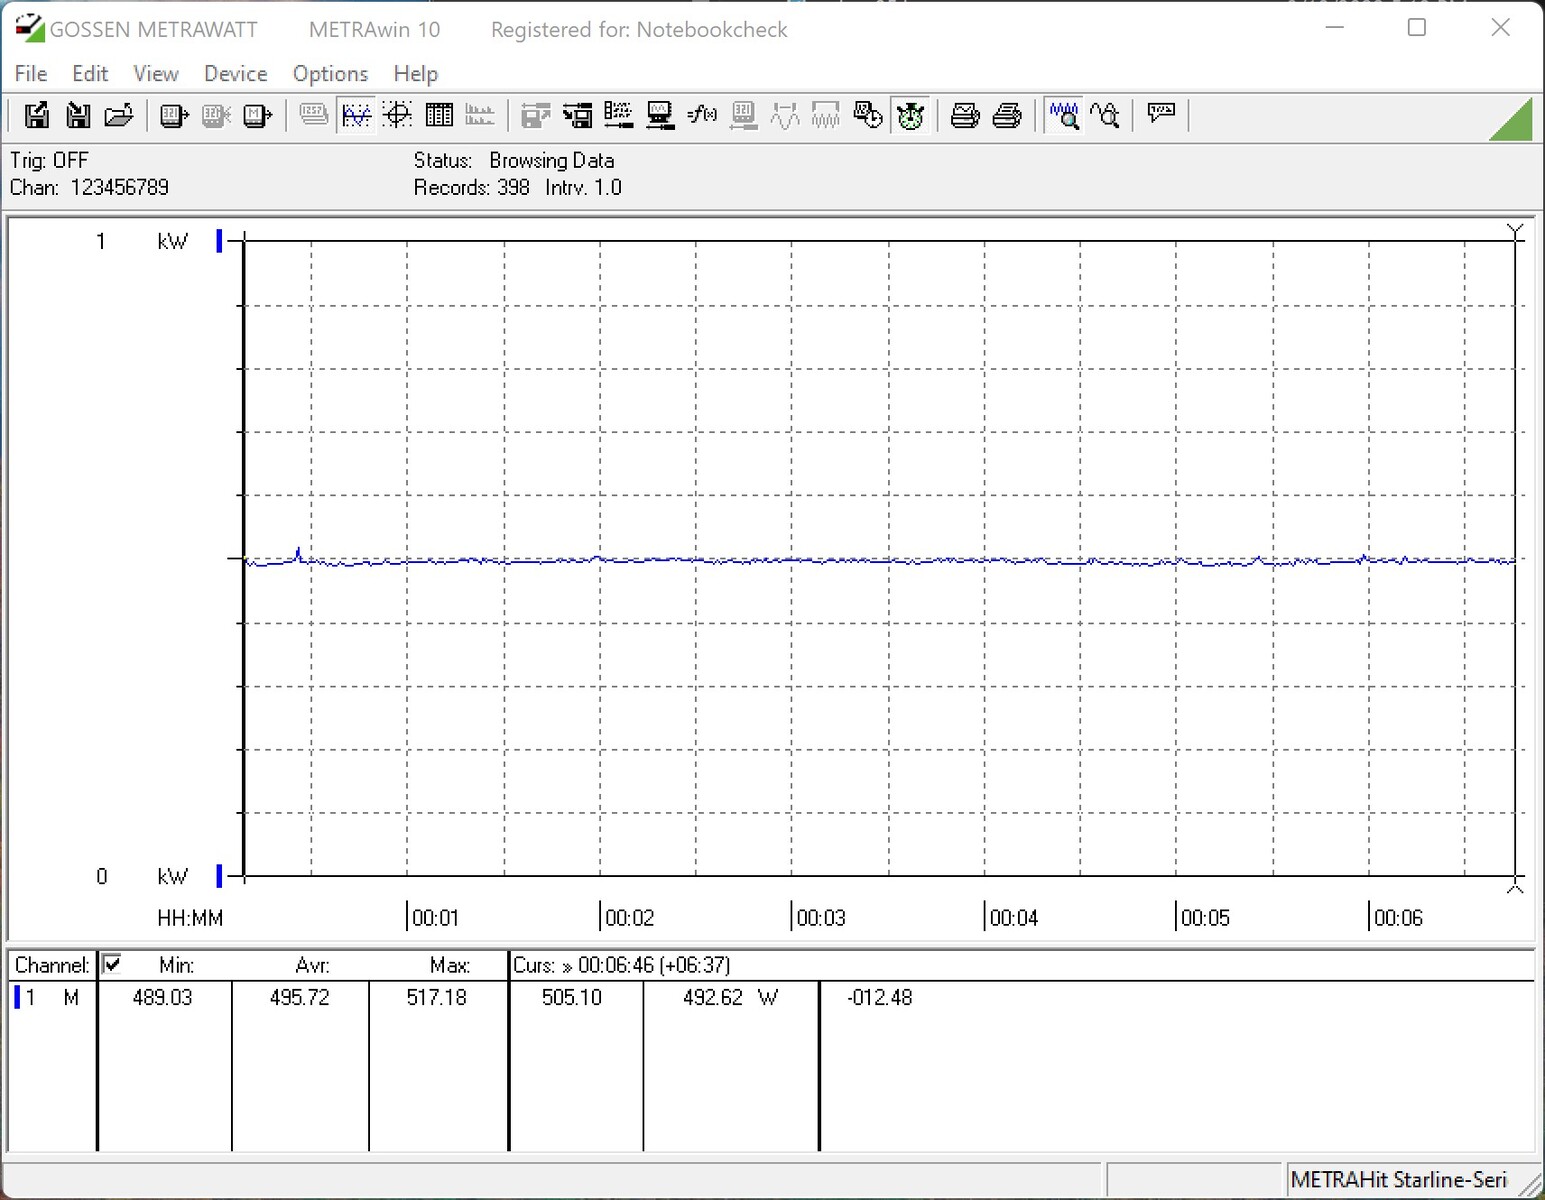
你需要一个非常好的冷却系统来处理Raptor Lake处理器。有了定制的水冷系统,你也可以让新的猛禽处理器不受任何限制地运行,只要你没有高温问题。那些想要安全的人应该激活PL2的限制。 那么最大分别为253或181瓦的限制。我们绝对建议保持在猛禽湖处理器的功率限制之内。明显降低的功耗和低温度是这样做的很好理由。在纯粹的性能方面也没有什么缺点,我们在上面已经提到。
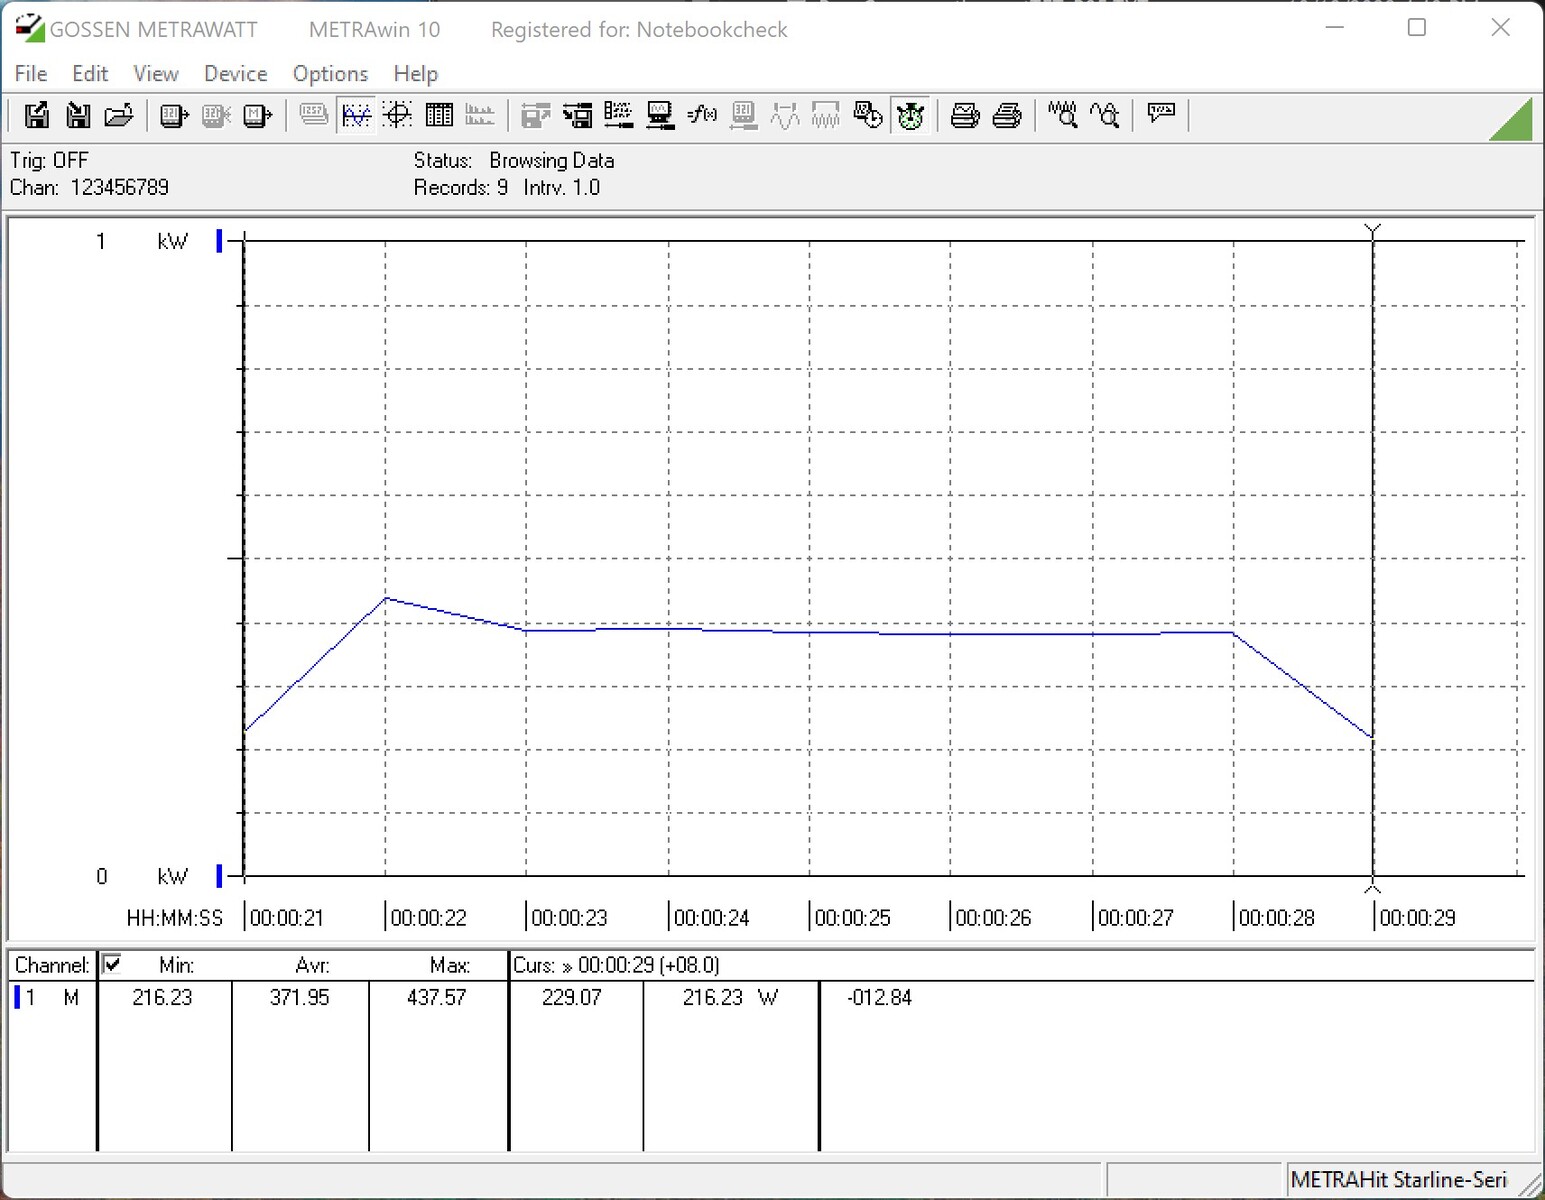
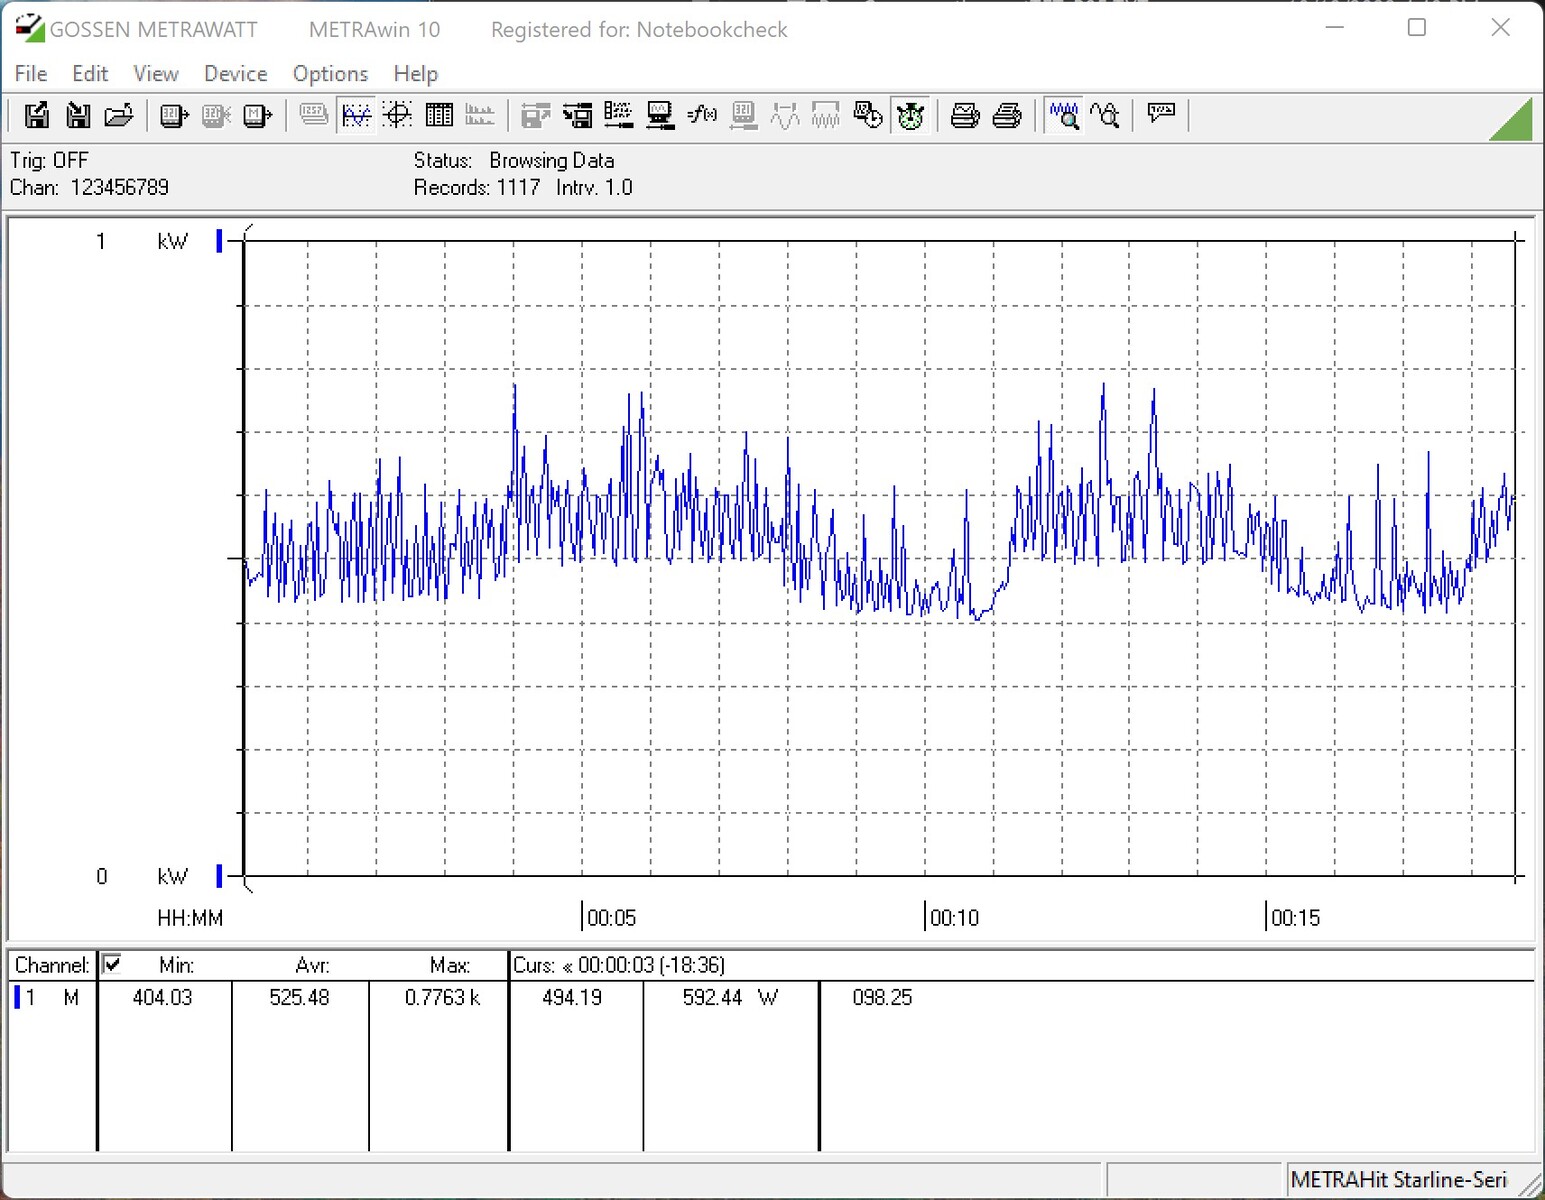
英特尔酷睿i9-13900K - 开放式功率限制

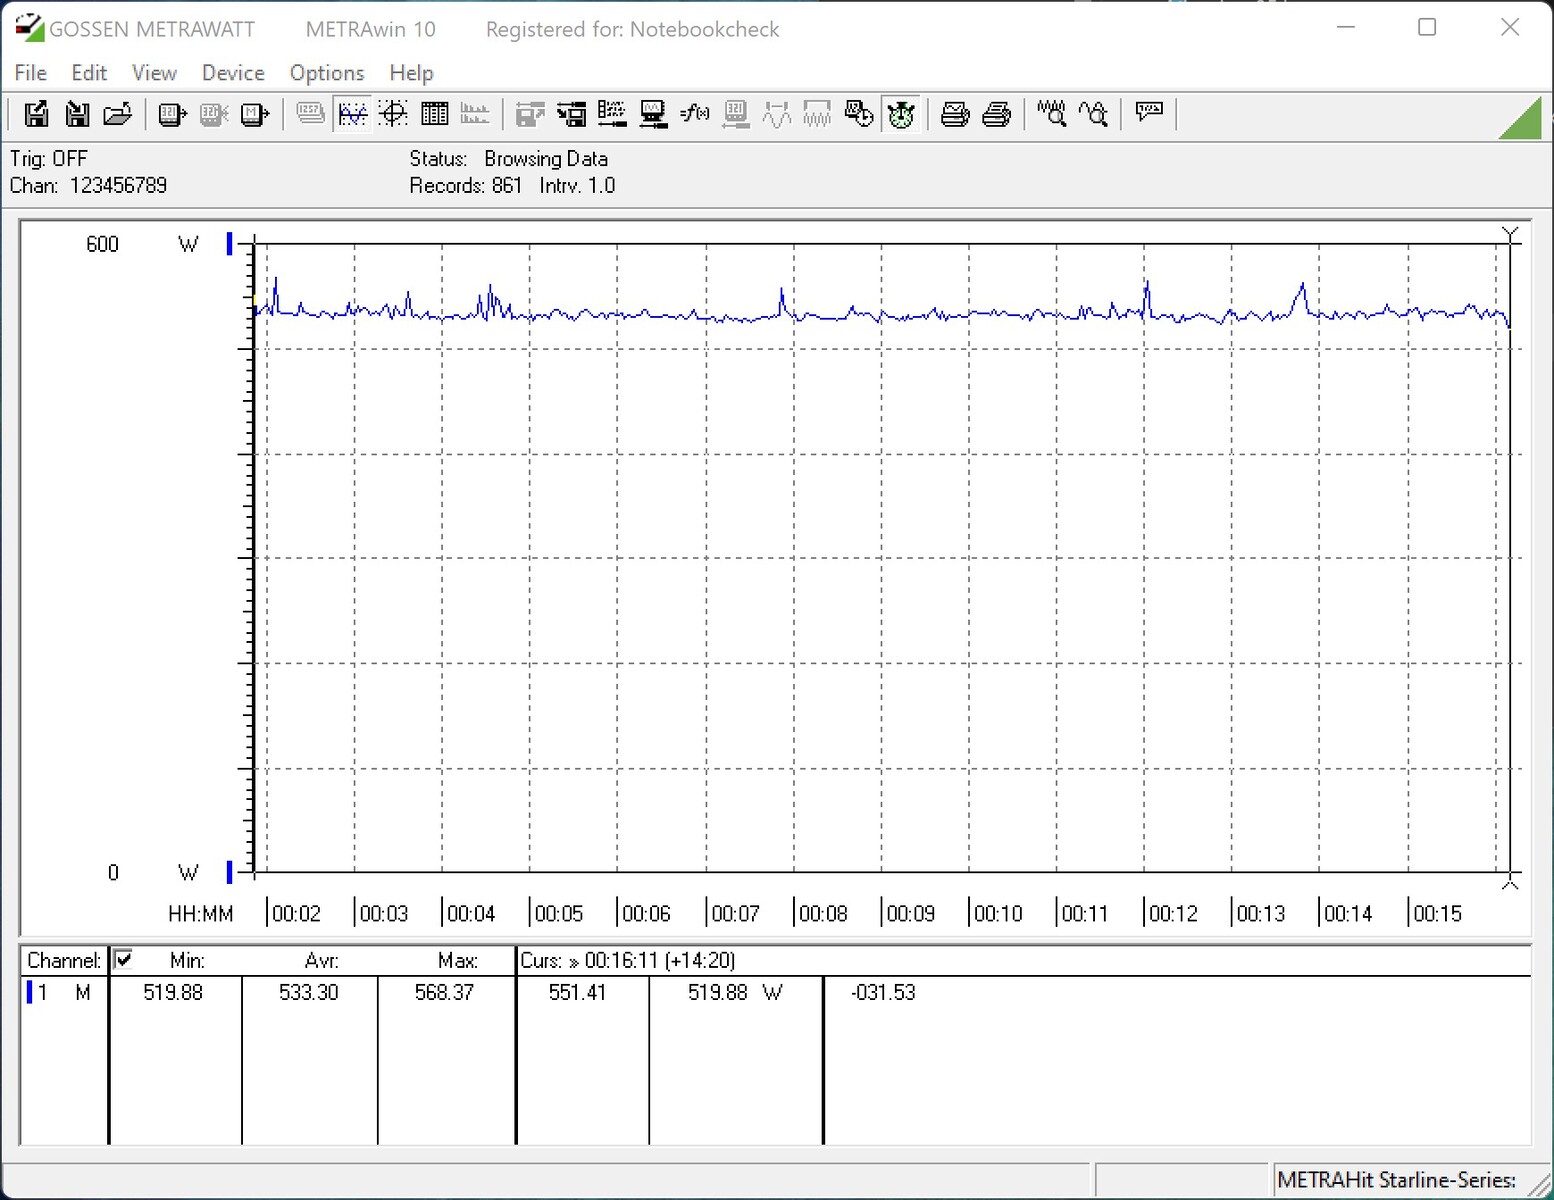
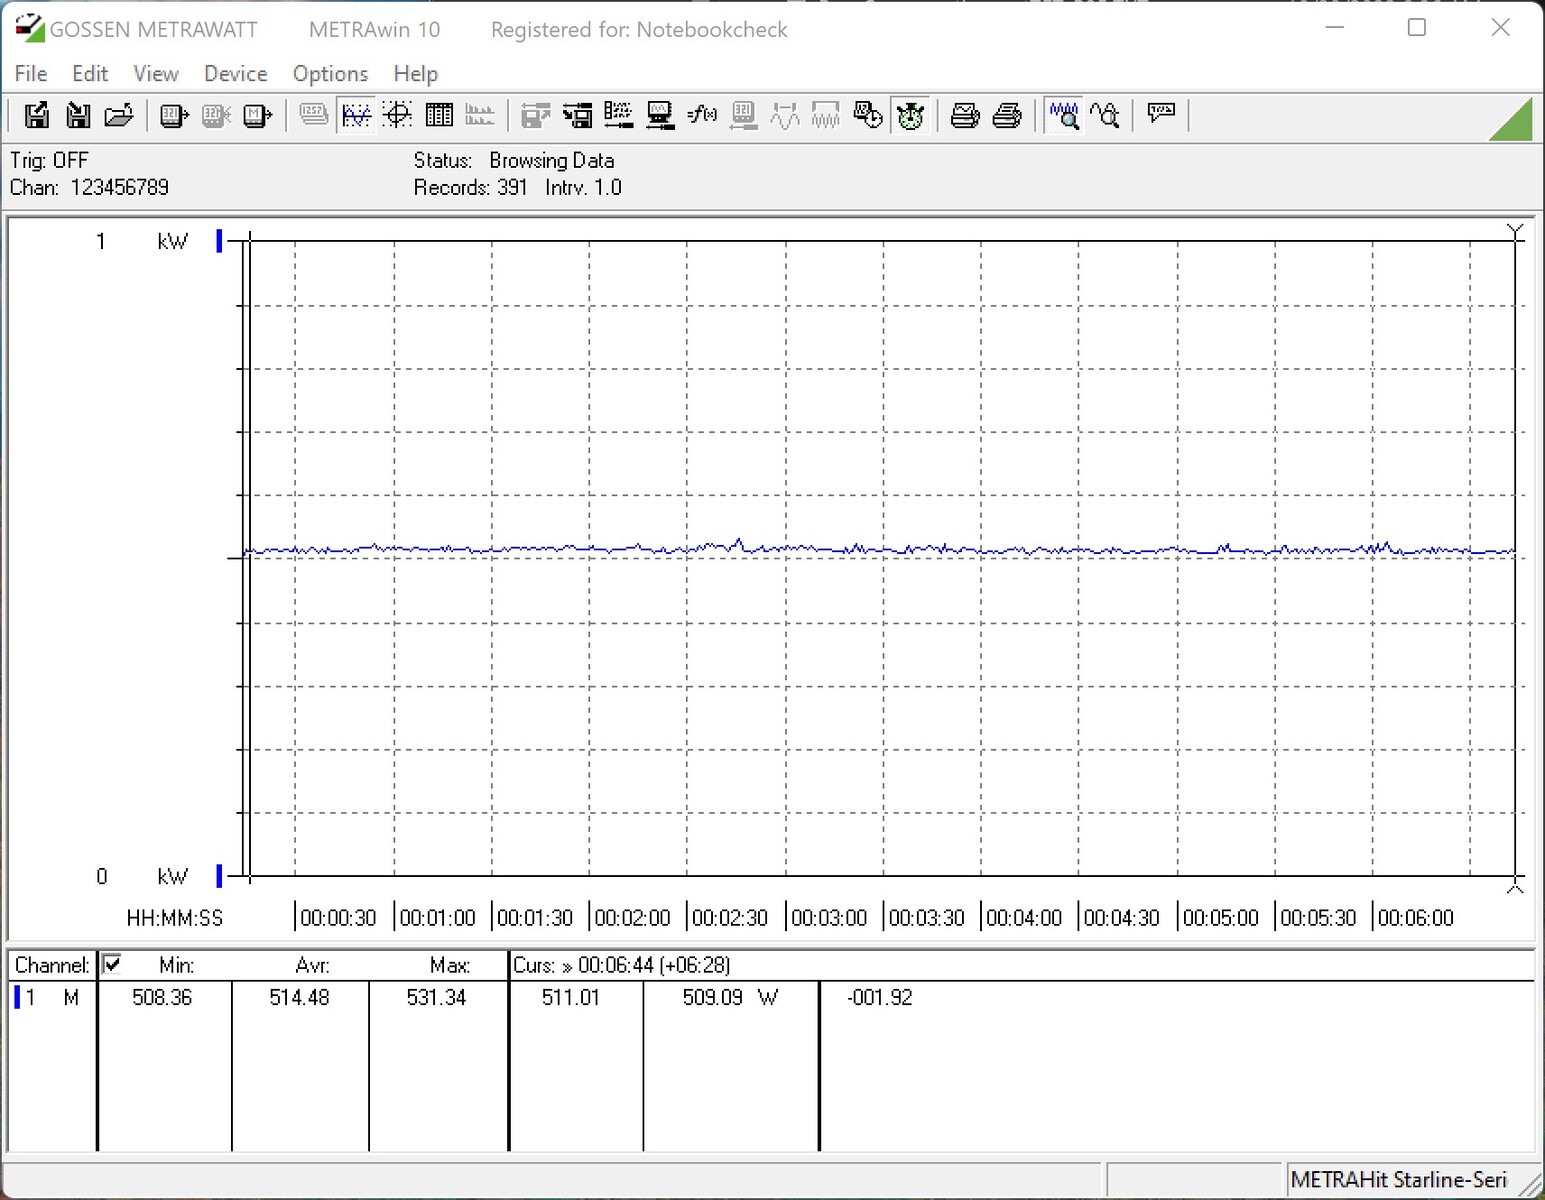
英特尔酷睿i9-13900K - 253瓦的功率限制
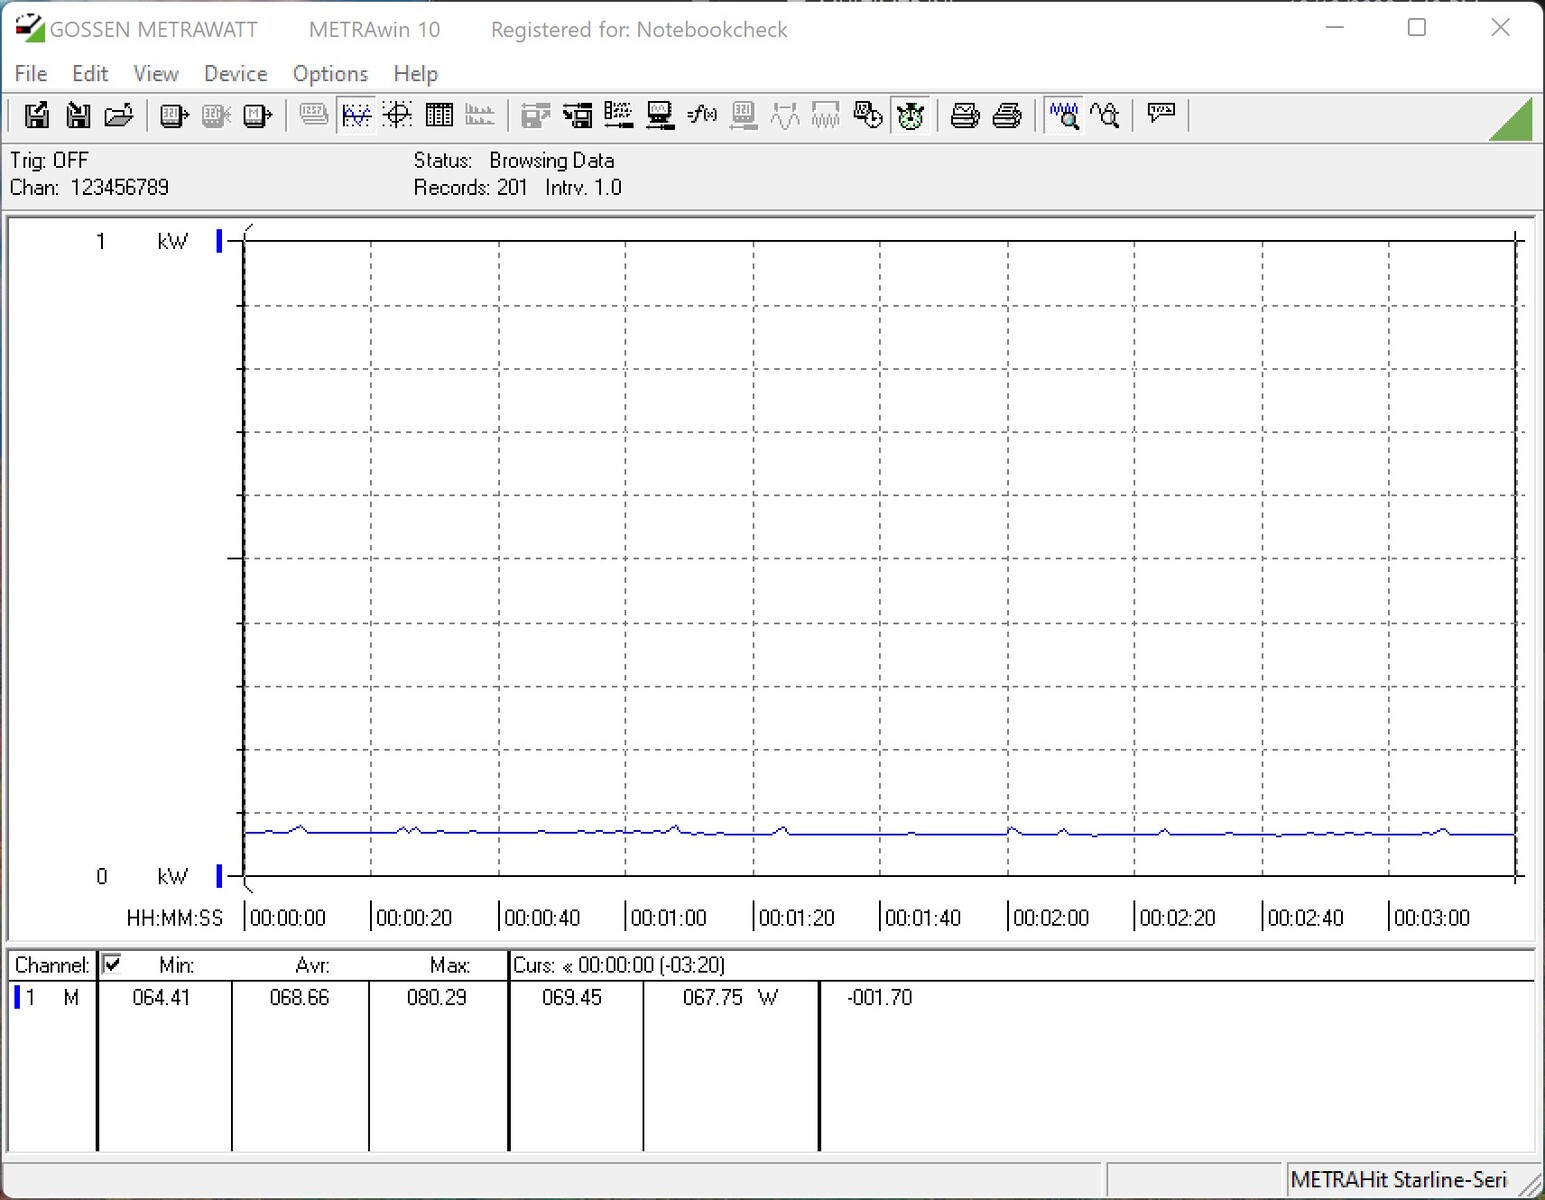
英特尔酷睿i5-13600K - 开放式功率限制
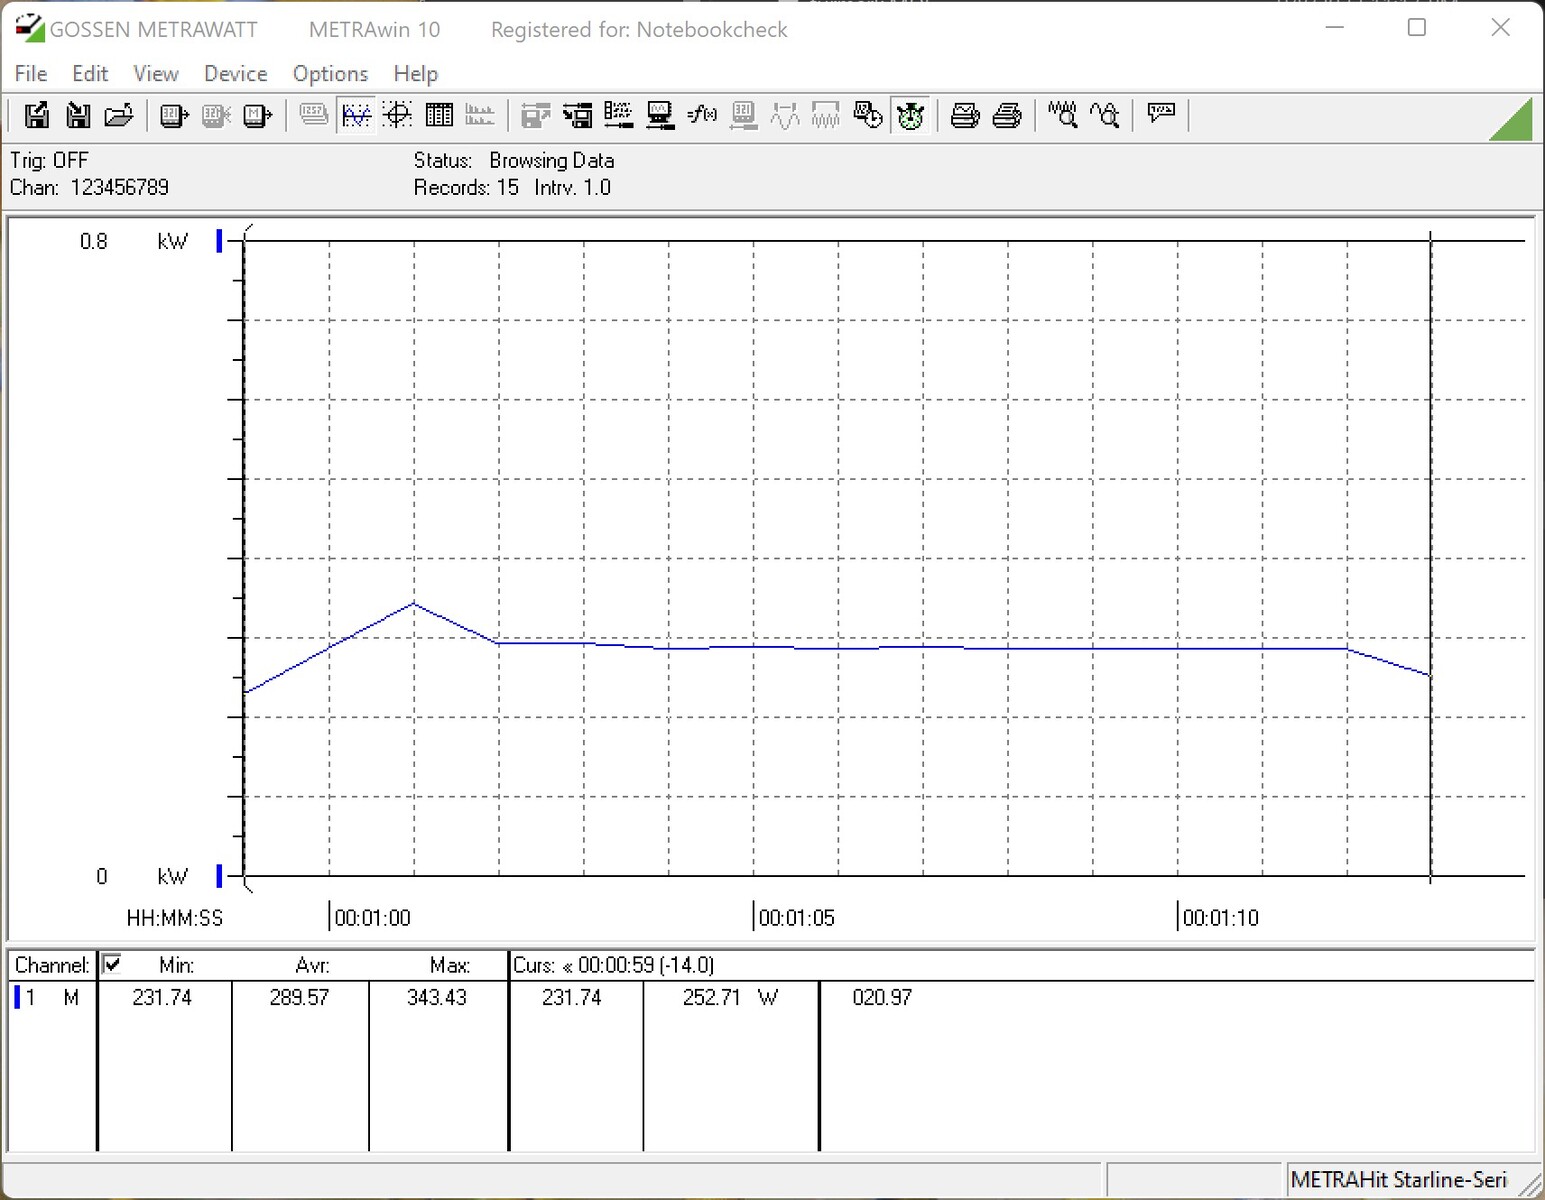

英特尔酷睿i5-13600K - 181瓦的功率限制

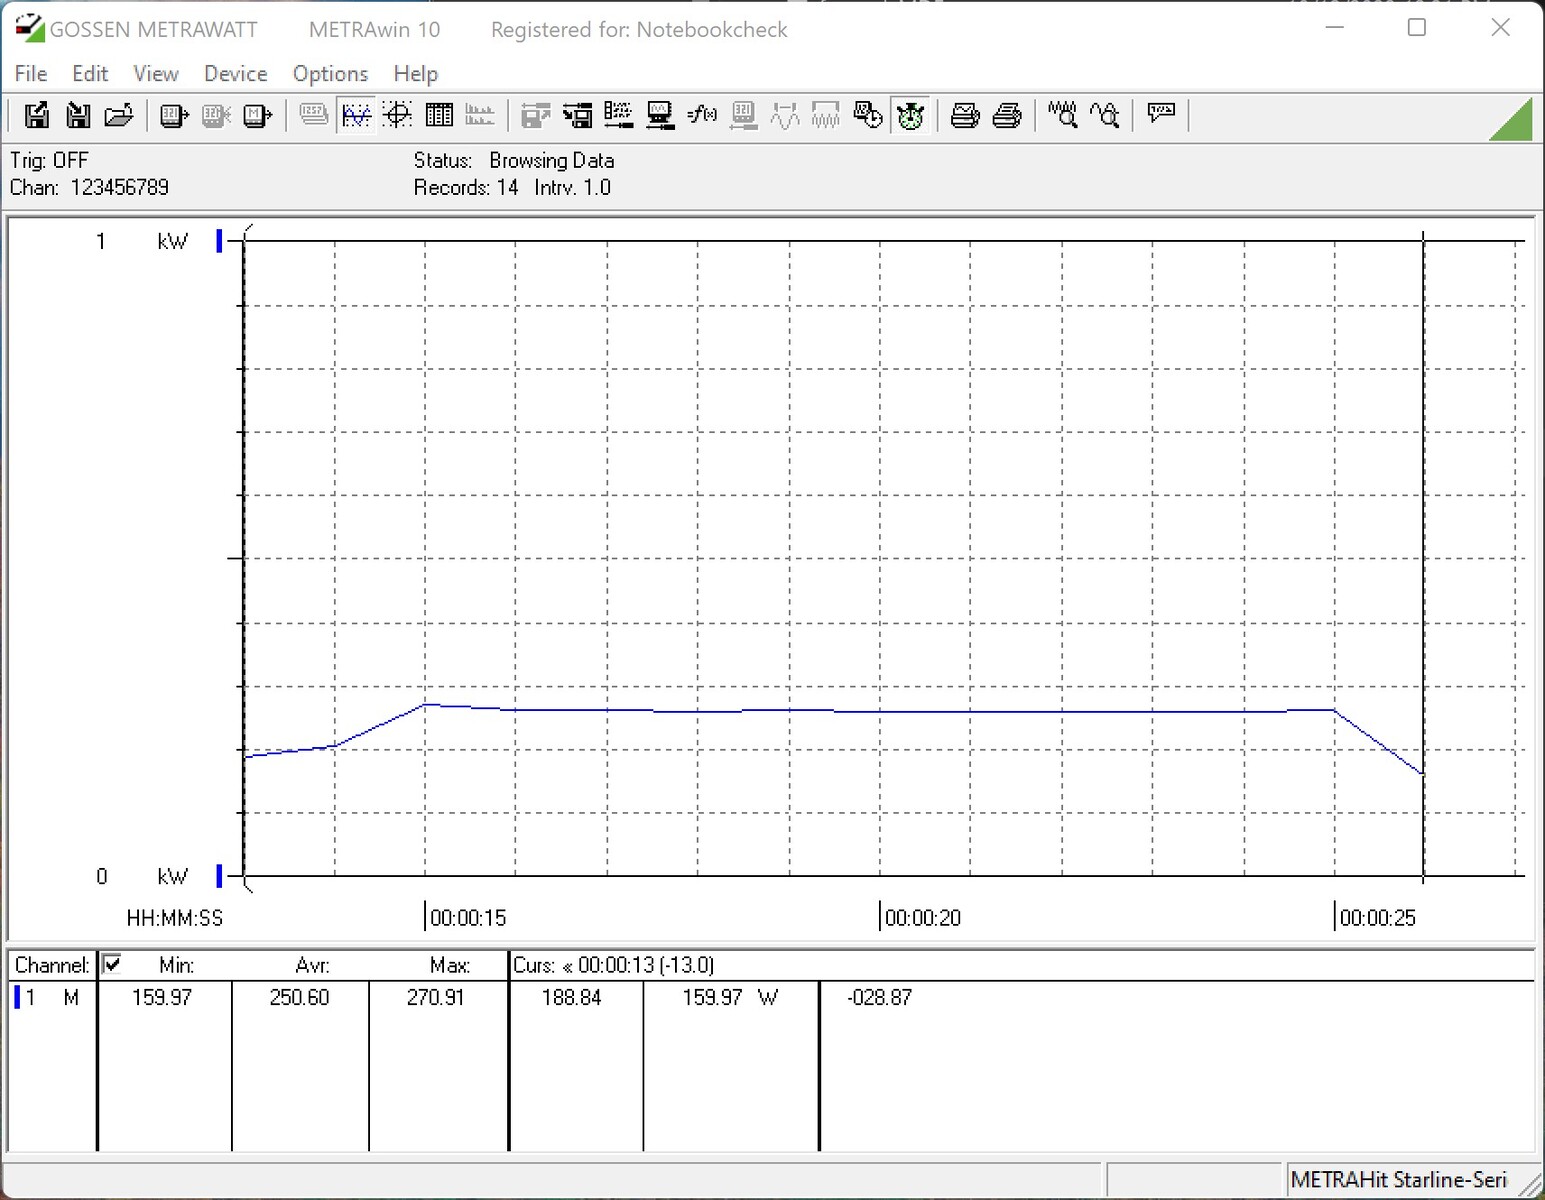
| Power Consumption / Cinebench R15 Multi (external Monitor) | |
| Intel Core i9-13900K | |
| Intel Core i9-13900K @253W | |
| Intel Core i9-12900K (Idle: 70.5 W) | |
| NVIDIA GeForce RTX 3090 Founders Edition | |
| AMD Ryzen 9 7900X | |
| Intel Core i5-13600K | |
| Intel Core i5-13600K @181W | |
| AMD Ryzen 5 7600X | |
| Intel Core i5-12600K (Idle: 70.45 W) | |
| Power Consumption / Prime95 V2810 Stress (external Monitor) | |
| Intel Core i9-13900K | |
| Intel Core i9-13900K @253W | |
| Intel Core i5-13600K | |
| NVIDIA GeForce RTX 3090 Founders Edition | |
| AMD Ryzen 9 7900X | |
| Intel Core i9-12900K (Idle: 70.5 W) | |
| Intel Core i5-13600K @181W | |
| Intel Core i5-12600K (Idle: 70.45 W) | |
| AMD Ryzen 5 7600X | |
| Power Consumption / The Witcher 3 ultra (external Monitor) | |
| AMD Ryzen 9 7900X | |
| NVIDIA GeForce RTX 3090 Founders Edition | |
| Intel Core i9-13900K | |
| AMD Ryzen 5 7600X | |
| Intel Core i9-13900K @253W | |
| Intel Core i5-13600K | |
| Intel Core i5-13600K @181W | |
| Intel Core i9-12900K (Idle: 70.5 W) | |
| Intel Core i5-12600K (Idle: 70.45 W) | |
* ... smaller is better
Pros
Cons
结论 - 极端耗电
通过Raptor Lake,英特尔向Alder Lake一代送去了一个值得信赖的继任者。这也是时候了,因为凭借其目前的阵容,AMD已经在Alder Lake处理器面前飞速发展。然而,英特尔无法凭借其目前的处理器完全领先于竞争对手。不过,它能够追上,有时甚至略微超过竞争对手。两个顶级型号之间的差异非常小,并不真正引人注目。然而,如果我们根据目前的建议零售价进行性能比较,英特尔酷睿i9-13900K领先于 AMD Ryzen 9 7900X在许多基准测试中。
英特尔以更高的时钟速度、更多的内核和更高的功耗来争夺这一地位。后者也是AMD追求的方法,尽管英特尔酷睿i9-13900K的TDP达到新的最高值253瓦(PL2)。在较小的英特尔酷睿i5-13600K中,它在全负荷下仍为181瓦。这意味着,如果顶级型号在你的愿望清单上,那么一个非常好的冷却是一个要求。
目前英特尔猛禽湖处理器提供了非常好的游戏和应用性能。其非常高的性能使英特尔酷睿i9-13900K成为内容创建者的最佳CPU。
对于底座,你可以安全地使用600芯片组,因为猛禽湖在BIOS更新后可以兼容。这不会对你的升级预算造成太大压力。不过,也会有采用新的700芯片组的新主板。但是你也应该知道,目前的1700插座将不会有新的CPU一代。目前的传言说,1851插座将与Meteor Lake一起推出,这与目前的插座不再兼容。
价格和可用性
一些商店已经列出了新的猛禽湖处理器。例如,英特尔酷睿i5-13600K在亚马逊的售价为340美元而顶级型号,英特尔酷睿i9-13900K,在那里上市,价格为750美元.

