Notebookcheck Logo

Intel Processor N200

Intel N200

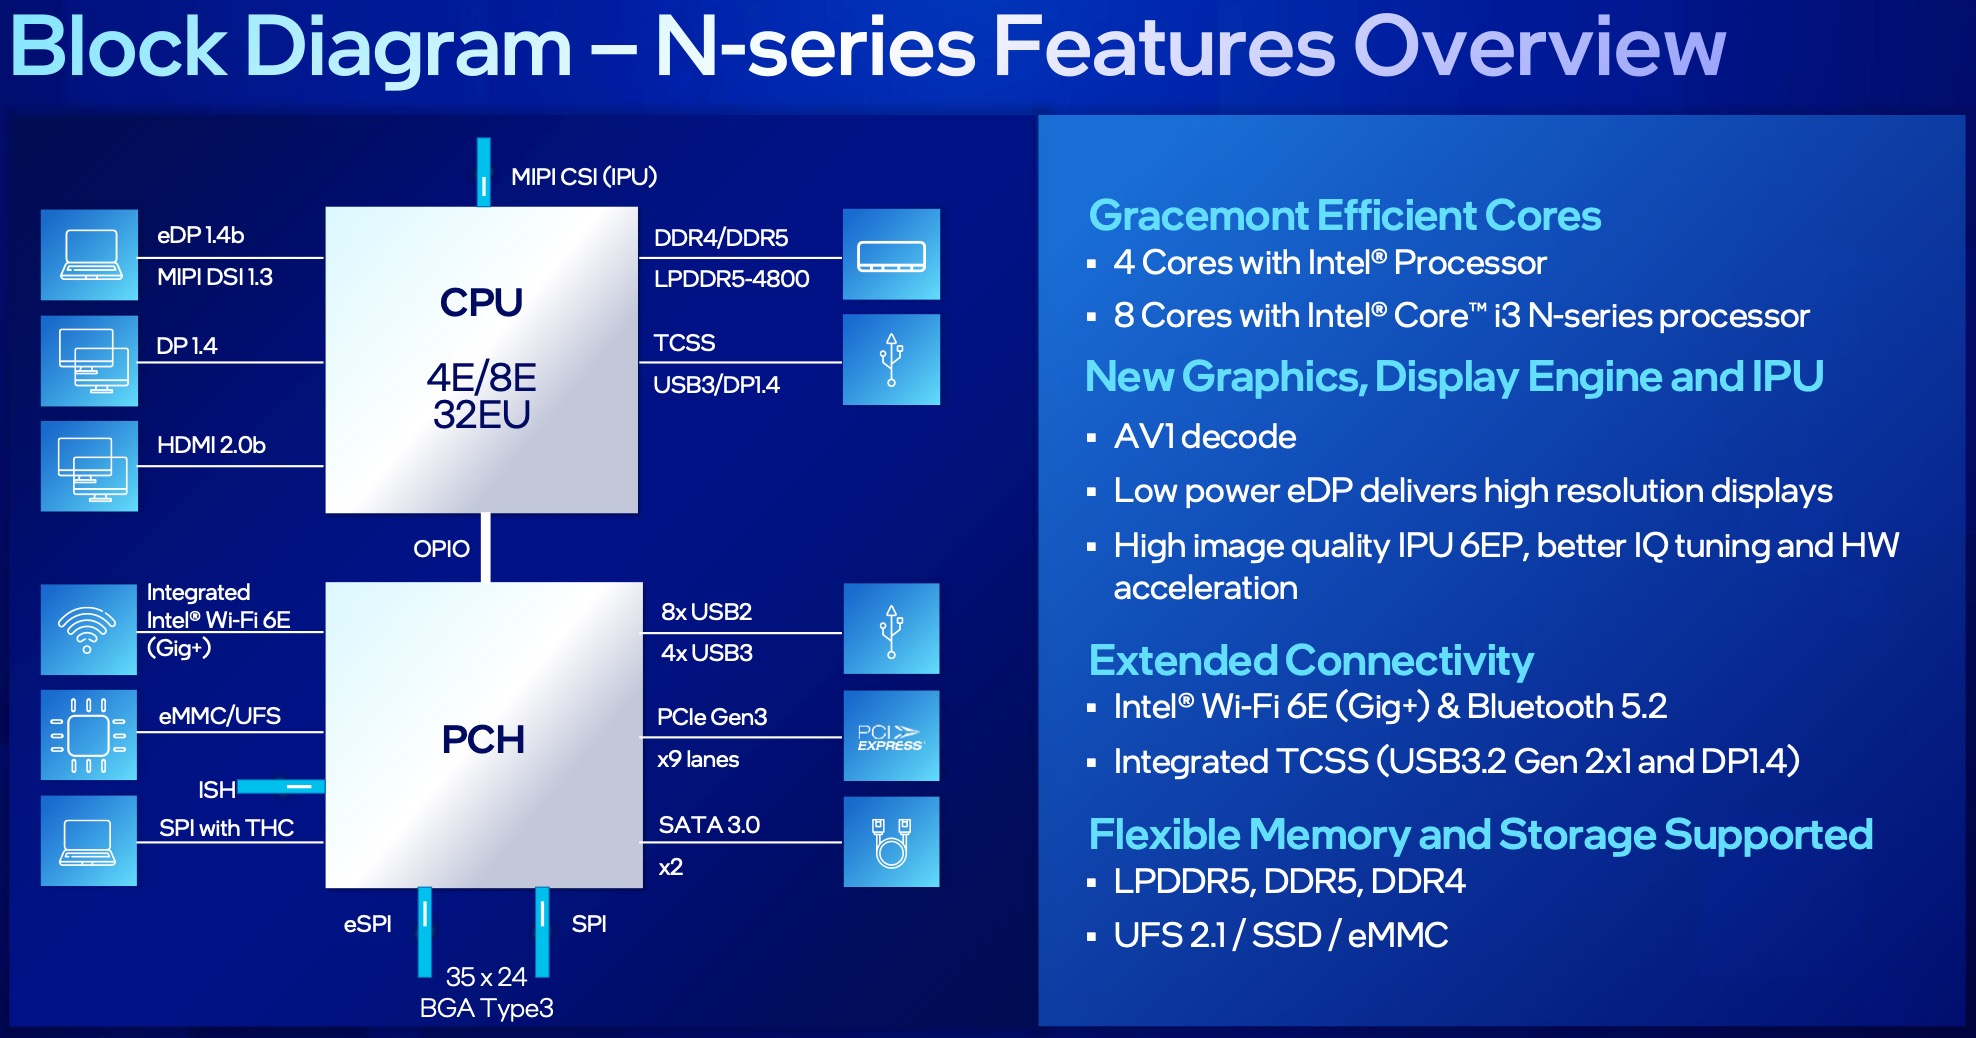
英特尔处理器 N200 是 Alder Lake-N 系列中面向轻薄笔记本电脑的入门级移动 CPU。它于 2023 年初发布,不提供性能内核和 8 个高效内核中的 4 个(E-cores,Gracemont 架构)。该芯片不支持超线程技术,时钟频率高达 3.7 GHz。E 核心的性能应与旧的 Skylake 核心类似(与酷睿 i7-6700HQ 比较 酷睿 i7-6700HQ).所有内核最高可使用 6 MB L3 高速缓存。

性能

性能明显低于 酷睿 i3-N300N305性能明显低于酷睿 i3-N300 和 N305。与老款处理器相比,在功耗不受限制的情况下,N200 的性能应与酷睿 i5-8250U(4 核,超线程,3.4 GHz,15W)相近。

功能特点

Alder Lake-N 芯片仅支持高达 DDR5-4800、DDR4-3200 或 LPDDR5-4800 的单通道内存。该芯片还支持快速同步和 AV1 解码(很可能与 Alder Lake 中的引擎相同)。此外,还部分集成了 Wi-Fi 6E 和蓝牙 5.2(但没有 Thunderbolt)。外部芯片可通过 PCIe Gen3 x9(通过 PCH)连接。

集成图形适配器基于 Xe 架构,提供全部 32 个 EU(执行单元),工作频率仅为 450 - 750 MHz。由于采用单通道内存、低时钟速度和低着色器数量,iGPU 的游戏性能非常有限。

功耗

N200 的基本功耗仅为 6 W,因此适合无风扇冷却。CPU 采用了英特尔公司进一步改进的 10 纳米 SuperFin 工艺(称为英特尔 7)。

SeriesIntel Alder Lake-N
CodenameAlder Lake-N

Series: Alder Lake-N Alder Lake-N

Intel Core i3-N3051.8 - 3.8 GHz8 / 8 cores6 MB L3
Intel Core i3-N300 - 3.8 GHz8 / 8 cores6 MB L3
Intel Processor N200 « 1 - 3.7 GHz4 / 4 cores6 MB L3
Intel Processor N97 - 3.6 GHz4 / 4 cores6 MB L3
Intel Processor N95 - 3.4 GHz4 / 4 cores6 MB L3
Intel Processor N1001 - 3.4 GHz4 / 4 cores6 MB L3
Intel Processor N501 - 3.4 GHz2 / 2 cores6 MB L3
Clock Rate1000 - 3700 MHz
Level 3 Cache6 MB
Number of Cores / Threads4 / 4
4 x 3.7 GHz Intel Crestmont E-Core
Power Consumption (TDP = Thermal Design Power)6 Watt
Manufacturing Technology10 nm
Max. Temperature105 °C
GPUIntel UHD Graphics Xe 750 32EUs (Rocket Lake) (450 - 750 MHz)
64 Bit64 Bit support
Architecturex86
Announcement Date01/03/2023
Product Link (external)ark.intel.com

Benchmarks

Performance Rating - CB R15 + R20 + 7-Zip + X265 + Blender + 3DM11 CPU
21.5 pt (30%)
AMD E1-2100
2.47 -89%
...
Intel Core i3-5005U
18.4 -14%
18.8 -13%
Intel Pentium Gold 4415U
18.9 -12%
19.1 -11%
19.5 -9%
19.9 -7%
20 -7%
20.2 -6%
21.1 -2%
Intel Processor N200
21.5
21.6 0%
21.7 1%
Intel Core i5-4258U
21.8 1%
21.9 2%
22.1 3%
22.4 4%
22.7 6%
22.8 6%
Intel Core i3-10100Y
23 7%
...
57 165%
max:
72.1 235%
0%
100%
Cinebench R23 - Cinebench R23 Multi Core
1406 Points (1%)
AMD E1-2100
202 -86%
...
Intel Celeron J4125
1203 -14%
Intel Core i3-5005U
1225 -13%
1232 -12%
Intel Core m3-7Y32
1293 -8%
1341 -5%
Intel Pentium Gold 4415U
1366 -3%
Intel Core i3-10100Y
1375 -2%
1390 -1%
1390 -1%
Intel Processor N200
1406
Intel Core i5-4258U
1496 6%
Intel Core i5-5250U
1529 9%
Intel Core i3-6157U
1614 15%
1618 15%
1730 23%
1786 27%
1810 29%
AMD Ryzen Embedded R1606G
1842 31%
1868 33%
...
32782 2232%
max:
107681 7559%
0%
100%
Cinebench R23 - Cinebench R23 Single Core
690 Points (29%)
AMD A10-5745M
74.4 -89%
...
Intel Core i5-4258U
619 -10%
Intel Core i5-8260U
629 -9%
Intel Core m3-7Y32
637 -8%
Intel Core i3-6157U
638 -8%
Intel Core i5-5250U
660 -4%
663 -4%
669 -3%
671 -3%
679 -2%
Intel Processor N200
690
Intel Core i7-2860QM
692 0%
710 3%
721 4%
785 14%
Intel Core i3-10100Y
788 14%
820 19%
AMD Ryzen Embedded V1605B
841 22%
863 25%
874 27%
...
2178 216%
max:
2351 241%
0%
100%
Cinebench R20 - Cinebench R20 CPU (Single Core)
265 Points (29%)
Cinebench R20 - Cinebench R20 CPU (Multi Core)
542 Points (1%)
Cinebench R15 - Cinebench R15 CPU Multi 64 Bit
219 Points (1%)
AMD A4-1200
31 -86%
...
Intel Core i3-5005U
208 -5%
Intel Core i3-3110M
209 -5%
AMD A10-9600P
211 -4%
Intel Core i5-3337U
211 -4%
212.5 -3%
213.4 -3%
Intel Core i3-5015U
214 -2%
Intel Core m5-6Y54
215 -2%
Intel Core i3-5010U
216.8 -1%
Intel Processor N200
219
Intel Core i3-10100Y
220 0%
Intel Celeron J4125
223.4 2%
223.7 2%
Intel Core i5-3437U
224 2%
AMD PRO A12-9800B
225.3 3%
225.5 3%
226 3%
226.5 3%
Intel Core i5-4200U
226.6 3%
...
5600 2457%
max:
15842 7134%
0%
100%
0153045607590105120135150165180195210Tooltip
Cinebench R15 - Cinebench R15 CPU Single 64 Bit
113 Points (34%)
AMD A4-1200
19 -83%
...
Intel Core i5-4310U
106.8 -5%
Intel Core i7-4610Y
107 -5%
Intel Core i3-6100H
108 -4%
108.1 -4%
Intel Core i5-4258U
110.3 -2%
Intel Core i3-7130U
111 -2%
111.8 -1%
Intel Core i7-5650U
112 -1%
Intel Core i7-3632QM
112.3 -1%
Intel Processor N200
113
114.3 1%
Intel Core i5-5300U
114.3 1%
Intel Core i5-7Y54
115.4 2%
115.9 3%
Intel Core i5-5350U
116 3%
116.8 3%
Intel Core i5-6260U
117 4%
117 4%
117 4%
...
311 175%
max:
332 194%
0%
100%
Cinebench R11.5 - Cinebench R11.5 CPU Multi 64 Bit
2.7 Points (4%)
Cinebench R11.5 - Cinebench R11.5 CPU Single 64 Bit
1.4 Points (34%)
Cinebench R10 - Cinebench R10 Rend. Single (32bit)
3937 points (24%)
Cinebench R10 - Cinebench R10 Rend. Multi (32bit)
7549 points (5%)
Cinebench R10 - Cinebench R10 Rend. Multi (64bit)
11030 Points (8%)
Cinebench R10 - Cinebench R10 Rend. Single (64bit)
5971 Points (7%)
wPrime 2.10 - wPrime 2.0 1024m *
875 s (10%)
wPrime 2.10 - wPrime 2.0 32m *
26 s (5%)
WinRAR - WinRAR 4.0
2115 points (3%)
7-Zip 18.03 - 7-Zip 18.03 Multli Thread 4 runs
7146 MIPS (4%)
7-Zip 18.03 - 7-Zip 18.03 Single Thread 4 runs
3230 MIPS (39%)
X264 HD Benchmark 4.0 - x264 Pass 2
16.3 fps (6%)
X264 HD Benchmark 4.0 - x264 Pass 1
80 fps (18%)
HWBOT x265 Benchmark v2.2 - HWBOT x265 4k Preset
1.5 fps (3%)
00.20.40.60.811.21.41.61.81.92.12.32.52.72.93.13.33.53.7Tooltip
TrueCrypt - TrueCrypt Serpent
0.3 GB/s (0%)
TrueCrypt - TrueCrypt Twofish
0.6 GB/s (10%)
TrueCrypt - TrueCrypt AES
3.2 GB/s (8%)
Blender - Blender 3.3 Classroom CPU *
4297 Seconds (55%)
Blender - Blender 2.79 BMW27 CPU *
2150 Seconds (15%)
R Benchmark 2.5 - R Benchmark 2.5 *
1.1 sec (25%)
3DMark 06 - CPU - 3DMark 06 - CPU
3902 Points (8%)
Super Pi mod 1.5 XS 1M - Super Pi mod 1.5 XS 1M *
18.8 s (4%)
Super Pi mod 1.5 XS 2M - Super Pi mod 1.5 XS 2M *
42.7 s (2%)
Super Pi Mod 1.5 XS 32M - Super Pi mod 1.5 XS 32M *
1011 s (4%)
3DMark Vantage - 3DM Vant. Perf. CPU no Physx
9491 Points (8%)
3DMark 11 - 3DM11 Performance Physics
2765 Points (7%)
3DMark - 3DMark Ice Storm Physics
27649 Points (22%)
3DMark - 3DMark Ice Storm Extreme Physics
28655 Points (23%)
3DMark - 3DMark Ice Storm Unlimited Physics
34749 Points (29%)
3DMark - 3DMark Cloud Gate Physics
2848 Points (7%)
3DMark - 3DMark Fire Strike Standard Physics
4135 Points (7%)
3DMark - 3DMark Time Spy CPU
1251 Points (5%)
Geekbench 6.2 - Geekbench 6.2 Single-Core
956 points (29%)
Geekbench 6.2 - Geekbench 6.2 Multi-Core
1660 points (7%)
662 -60%
Intel Pentium B970
668 -60%
Intel Pentium Gold 4425Y
763 -54%
1332 -20%
Intel Processor N200
1660
2024 22%
2803 69%
2958 78%
3012 81%
3181 92%
4090 146%
4587 176%
4798 189%
Intel Core i5-8400H
4963 199%
...
21254 1180%
max:
25365 1428%
0%
100%
Geekbench 5.5 - Geekbench 5.1 - 5.4 64 Bit Single-Core
928 points (39%)
Geekbench 5.5 - Geekbench 5.1 - 5.4 64 Bit Multi-Core
1540 points (3%)
Geekbench 5.0 - Geekbench 5.0 64 Bit Single-Core
891 points (4%)
Geekbench 5.0 - Geekbench 5.0 64 Bit Multi-Core
1518 points (5%)
Geekbench 4.4 - Geekbench 4.1 - 4.4 64 Bit Single-Core
4552 points (45%)
Geekbench 4.4 - Geekbench 4.1 - 4.4 64 Bit Multi-Core
9989 points (11%)
Mozilla Kraken 1.1 - Kraken 1.1 Total Score *
1460 ms (2%)
WebXPRT 3 - WebXPRT 3 Score
171.3 Points (36%)
CrossMark - CrossMark Overall
614 Points (24%)
Power Consumption - Prime95 Power Consumption - external Monitor *
14.1 Watt (2%)
051015202530Tooltip
Power Consumption - Cinebench R15 Multi Power Consumption - external Monitor *
13.6 Watt (2%)
0510152025Tooltip
Power Consumption - Idle Power Consumption - external Monitor *
6.1 Watt (4%)
0123456789Tooltip
Power Consumption - Cinebench R15 Multi Power Efficiency - external Monitor
16.1 Points per Watt (12%)
- Range of benchmark values for this graphics card
- Average benchmark values for this graphics card
* Smaller numbers mean a higher performance

v1.26
log 24. 13:18:39

#0 no ids found in url (should be separated by "_") +0s ... 0s

#1 not redirecting to Ajax server +0s ... 0s

#2 did not recreate cache, as it is less than 5 days old! Created at Tue, 23 Apr 2024 05:40:15 +0200 +0.001s ... 0.001s

#3 no comparison url found in template nbc.compare_page_2 needed +0.013s ... 0.014s

#4 no comparison url found in template nbc.compare_page_2 needed +0s ... 0.015s

#5 no comparison url found in template nbc.compare_page_2 needed +0s ... 0.015s

#6 no comparison url found in template nbc.compare_page_2 needed +0s ... 0.015s

#7 no comparison url found in template nbc.compare_page_2 needed +0s ... 0.015s

#8 no comparison url found in template nbc.compare_page_2 needed +0s ... 0.016s

#9 composed specs +0.001s ... 0.016s

#10 did output specs +0s ... 0.016s

#11 getting avg benchmarks for device 14930 +0.019s ... 0.035s

#12 got single benchmarks 14930 +0.013s ... 0.048s

#13 got avg benchmarks for devices +0s ... 0.048s

#14 min, max, avg, median took s +1.001s ... 1.05s

#15 no comparison url found in template nbc.compare_page_2 needed +0s ... 1.05s

#16 return log +0s ... 1.05s

Reviews for the Intel Processor N200 processor

华硕专家中心 PN42

评测华硕 ExpertCenter PN42 裸机配备了节俭的英特尔 N200 和 DDR4 内存

华硕 ExpertCenter PN42 是一款迷你 PC,配备了英特尔 N200 等处理器。SoC 采用被动冷却方式,这既有优点也有缺点。在这篇评测中,我们将分析华硕这样做是否有失偏颇,并将借助各种测量和基准测试来考察该设备的性能,同时将其与配置类似的微型 PC 进行比较。...
Intel Processor N200 | Intel UHD Graphics Xe 750 32EUs (Rocket Lake) | | 828 g

Lenovo IdeaPad Duet 3 11IAN8: Intel UHD Graphics Xe 750 32EUs (Rocket Lake), 11.50", 0.7 kg
  External Review » Lenovo IdeaPad Duet 3 11IAN8

Microsoft Surface Go 4: Intel UHD Graphics Xe 750 32EUs (Rocket Lake), 10.50", 0.5 kg
  External Review » Microsoft Surface Go 4

HP Pro x360 Fortis 11 G11: Intel UHD Graphics Xe 750 32EUs (Rocket Lake), 11.60", 1.5 kg
  External Review » HP Pro x360 Fortis 11 G11

Lenovo IdeaPad Flex 3 Chrome 12IAN8: Intel UHD Graphics Xe 750 32EUs (Rocket Lake), 12.20", 1.3 kg
  External Review » Lenovo IdeaPad Flex 3 Chrome 12IAN8

Please share our article, every link counts!

»移动处理器 对比
所有移动处理器的对比


»移动处理器 基准测试
所有已有笔记本电脑中使用的处理器的基准测试成绩 (桌面处理器或移动处理器)

Other CPUs of the series Alder Lake-N

» Intel Core i3-N305
   8x 1.8 GHz - 3.8 GHz
» Intel Core i3-N300
   8x - 3.8 GHz
» Intel Processor N200
   4x 1 GHz - 3.7 GHz
» Intel Processor N97
   4x - 3.6 GHz
» Intel Processor N95
   4x - 3.4 GHz
» Intel Processor N100
   4x 1 GHz - 3.4 GHz
» Intel Processor N50
   2x 1 GHz - 3.4 GHz

Surrounding CPUs

+ Intel Core i5-7287U
   2x 3.3 GHz - 3.7 GHz
+ Microsoft SQ1
   8x 3 GHz
+ Intel Core i7-7560U
   2x 2.4 GHz - 3.8 GHz
+ Intel Core i3-1110G4
   2x 2.5 GHz - 3.9 GHz
+ Qualcomm Snapdragon 8cx
   8x 2.84 GHz
» Intel Processor N200
   4x 1 GHz - 3.7 GHz
- Intel Core i7-2820QM
   4x 2.3 GHz - 3.4 GHz
- Intel Core i7-3612QM
   4x 2.1 GHz - 3.1 GHz
- Intel Core i7-2720QM
   4x 2.2 GHz - 3.3 GHz
- Intel Core i7-2675QM
   4x 2.2 GHz - 3.1 GHz
- Intel Core i7-2670QM
   4x 2.2 GHz - 3.1 GHz
> Notebookcheck中文版(NBC中国) > FAQ / 小提示/ 技术参数 > 移动处理器 —— 基准测试成绩列表 > Intel Alder Lake-N N200 笔记本处理器
Klaus Hinum (Update: 2023-11-27)