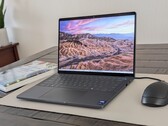
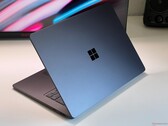
Notebookcheck Logo

Intel Core Ultra 7 268V

Intel Core Ultra 7 268V

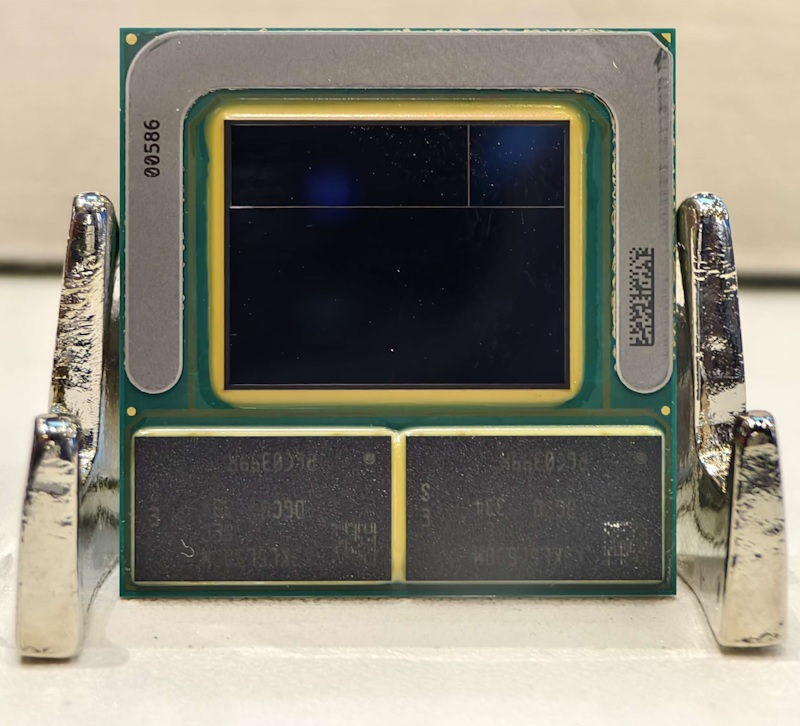
酷睿至尊 7 268V是发布时(2024 年 9 月 3 日)速度第二快的 Lunar Lake 系列处理器。这是一款用于平板电脑和轻薄型笔记本电脑的 SoC,配备了 4 个全新的 E 核和 4 个略带新意的 P 核,主频高达 5.0 GHz,同时还配备了极具潜力的全新的 Arc 140ViGPU 和 32 GB 内置 LPDDR5x-8533 内存。此外,还包括一个新的 48 TOPS 神经引擎、TB 4 和 PCIe 5 SSD 支持。

速度略快的 酷睿至尊 9 288V的 iGPU 和 P 核时钟速度略高,但功耗也略高。

架构和特性

Lunar Lake 采用了 Foveros 技术(将多个芯片堆叠在一起,彼此相邻),就像 Meteor Lake 一样。据报道,新芯片使用了巨大的 BGA2833 插座接口;Lion Cove P 核心取代了 Redwood 核心,而 Crestwood E 核心则被 Skymont 所取代,据说后者的能效非常高,使得 Meteor Lake 多出的 2 个低功耗岛 CPU 核心完全多余。在这 8 个内核中,没有一个支持超线程技术。

英特尔声称,Lion Cove 的 IPC 性能提高了 14%。而 Skymont 则提高了 68%。此外,还有其他方面的改进,例如低延迟架构(Low Latency Fabric),据说它能使内核/缓存之间的小数据传输更快。在其他方面,268V 有 4 条 PCIe 5 和 5 条 PCIe 4 通道,可连接各种设备,包括 NVMe SSD,速度高达 15.75 GB/s。默认板载支持 TB 4,支持英特尔的 CNVi WiFi 7 + BT 5.4 卡。48 TOPS NPU 4 神经引擎的出现,使 Windows Defender 等支持人工智能的应用更加强大。

268V 配备了 32 GB 的封装内不可更换 LPDDR5X-8533 内存。

性能

268V 不太可能创造新的性能记录。我们预计它的多核性能将与 酷睿 i7-1260P酷睿 5 120U.一个令人好奇的 Geekbench 泄露为酷睿 Ultra 7 芯片描绘了一幅更好的图景,但这些分数是通过测试迷你 PC 而不是笔记本电脑获得的。迷你 PC 的 TDP 功耗目标可能比英特尔建议的要高得多。

图形

显卡 Arc Graphics 140V拥有 8 个 Xe² 架构内核,运行频率高达 2,000 MHz,并有 8 个光线追踪单元可供选择。它支持 DirectX 12 Ultimate,能够对 h.266 VVC、h.265 HEVC、h.264 AVC、AV1 和 VP9 等众多流行视频编解码器进行硬件解码。该 iGPU 可同时使用至少三台(最有可能是四台)SUHD 4320p 显示器。

其性能比 Radeon 780M弧 8性能。

功耗

大多数 Lunar Lake 处理器的长期功耗目标应该是 17 W。与此同时,英特尔建议该芯片的短期 PL 值为 37 W。

CodenameLunar Lake
SeriesIntel Lunar Lake

Series: Lunar Lake Lunar Lake

Intel Core Ultra 9 288V3.3 - 5.1 GHz8 / 8 cores12 MB L3
Intel Core Ultra 7 268V « 2.2 - 5 GHz8 / 8 cores12 MB L3
Intel Core Ultra 7 266V2.2 - 5 GHz8 / 8 cores12 MB L3
Intel Core Ultra 7 258V2.2 - 4.8 GHz8 / 8 cores12 MB L3
Intel Core Ultra 7 256V2.2 - 4.8 GHz8 / 8 cores12 MB L3
Intel Core Ultra 5 238V2.1 - 4.7 GHz8 / 8 cores8 MB L3
Intel Core Ultra 5 236V2.1 - 4.7 GHz8 / 8 cores8 MB L3
Intel Core Ultra 5 228V2.1 - 4.5 GHz8 / 8 cores8 MB L3
Intel Core Ultra 5 226V2.1 - 4.5 GHz8 / 8 cores8 MB L3
Clock Rate2200 - 5000 MHz
Level 1 Cache1.4 MB
Level 2 Cache14 MB
Level 3 Cache12 MB
Number of Cores / Threads8 / 8
4 x 5.0 GHz Intel Lion Cove P-core
4 x 3.7 GHz Intel Skymont E-core
Power Consumption (TDP = Thermal Design Power)17 Watt
TDP Turbo PL237 Watt
Manufacturing Technology3 nm
Max. Temperature100 °C
SocketBGA2833
FeaturesLPDDR5x-8533 RAM, PCIe 5 + PCIe 4, USB 4, AI Boost NPU (48 TOPS), Thread Director, PSE, Threat Detection, MMX, SSE, SSE2, SSE3, SSSE3, SSE4.1, SSE4.2, AES, AVX, AVX2, AVX-VNNi, FMA3, SHA
GPUIntel Arc Graphics 140V ( - 2000 MHz)
64 Bit64 Bit support
Architecturex86
Announcement Date09/03/2024
Product Link (external)ark.intel.com

Benchmarks

Performance Rating - CB R15 + R20 + 7-Zip + X265 + Blender + 3DM11 CPU
39.4 pt (66%)
Restrict / Search: Model: Max. age: years
Cinebench 2024 - Cinebench 2024 CPU Single Core
min: 123.3     avg: 124.1     median: 124.1 (70%)     max: 124.9 Points
Cinebench 2024 - Cinebench 2024 CPU Multi Core
min: 600     avg: 610     median: 609.5 (11%)     max: 619 Points
Cinebench R23 - Cinebench R23 Multi Core
min: 9835     avg: 10413     median: 10535 (10%)     max: 10868 Points
AMD E1-2100
202 -98%
...
10085 -3%
10095 -3%
10138 -3%
10179 -2%
10275 -1%
10291 -1%
10327 -1%
10383 0%
10387 0%
Intel Core Ultra 7 268V
10413
10433 0%
10454 0%
10472 1%
10605 2%
10653 2%
10857 4%
10889 5%
AMD Ryzen 7 7735H
10920 5%
10921 5%
...
40117 285%
max:
107681 934%
0%
100%
Restrict / Search: Model: Max. age: years
Cinebench R23 - Cinebench R23 Single Core
min: 1910     avg: 1939     median: 1921 (82%)     max: 1985 Points
Restrict / Search: Model: Max. age: years
Cinebench R20 - Cinebench R20 CPU (Single Core)
min: 736     avg: 746     median: 739 (82%)     max: 764 Points
Cinebench R20 - Cinebench R20 CPU (Multi Core)
min: 3811     avg: 4065     median: 4129 (10%)     max: 4255 Points
Cinebench R15 - Cinebench R15 CPU Multi 64 Bit
min: 1601     avg: 1623     median: 1616 (10%)     max: 1651 Points
Restrict / Search: Model: Max. age: years
08517025534042551059568076585093510201105119012751360144515301615Tooltip
Cinebench R15 - Cinebench R15 CPU Single 64 Bit
min: 287     avg: 296     median: 299 (84%)     max: 302 Points
AMD A4-1200
19 -94%
...
284.1 -4%
285.5 -4%
287 -3%
287 -3%
289 -2%
291.7 -1%
292.9 -1%
294.5 -1%
295 0%
Intel Core Ultra 7 268V
296
299.3 1%
301 2%
301.5 2%
301.8 2%
302 2%
303.6 3%
304.3 3%
305.2 3%
306.1 3%
...
AMD Ryzen 9 9955HX
336.5 14%
max:
Intel Core Ultra 9 285K
355.5 20%
0%
100%
Restrict / Search: Model: Max. age: years
7-Zip 18.03 - 7-Zip 18.03 Multi Thread 4 runs
min: 32797     avg: 35031     median: 35687 (20%)     max: 36610 MIPS
7-Zip 18.03 - 7-Zip 18.03 Single Thread 4 runs
min: 5884     avg: 5965     median: 5991 (71%)     max: 6021 MIPS
HWBOT x265 Benchmark v2.2 - HWBOT x265 4k Preset
min: 10.4     avg: 12.1     median: 12.9 (23%)     max: 12.9 fps
012345678910111213141516171819Tooltip
Blender - Blender 3.3 Classroom CPU *
min: 555     avg: 606     median: 564 (7%)     max: 698 Seconds
Blender - Blender 2.79 BMW27 CPU *
min: 337     avg: 361.3     median: 337 (2%)     max: 410 Seconds
R Benchmark 2.5 - R Benchmark 2.5 *
min: 0.4344     avg: 0.4     median: 0.4 (9%)     max: 0.4565 sec
3DMark 11 - 3DM11 Performance Physics
min: 12177     avg: 14494     median: 15475 (39%)     max: 15830 Points
3DMark - 3DMark Cloud Gate Physics
10990 Points (28%)
3DMark - 3DMark Fire Strike Standard Physics
min: 16799     avg: 20271     median: 21928 (39%)     max: 22087 Points
3DMark - 3DMark Time Spy CPU
min: 5865     avg: 7291     median: 7784 (33%)     max: 8224 Points
Geekbench 6.4 - Geekbench 6.4 Single-Core
min: 2583     avg: 2780     median: 2832 (71%)     max: 2871 points
Geekbench 6.4 - Geekbench 6.4 Multi-Core
min: 10589     avg: 11042     median: 11095 (43%)     max: 11388 points
Restrict / Search: Model: Max. age: years
Geekbench 5.5 - Geekbench 5.1 - 5.5 64 Bit Single-Core
min: 2008     avg: 2051     median: 2049.5 (80%)     max: 2097 points
Geekbench 5.5 - Geekbench 5.1 - 5.5 64 Bit Multi-Core
min: 9491     avg: 9728     median: 9783.5 (18%)     max: 9855 points
Mozilla Kraken 1.1 - Kraken 1.1 Total Score *
min: 468     avg: 473     median: 475 (1%)     max: 476 ms
Octane V2 - Octane V2 Total Score
min: 111219     avg: 113072     median: 113072 (87%)     max: 114924 Points
WebXPRT 4 - WebXPRT 4 Score
min: 245     avg: 269.7     median: 277 (76%)     max: 287 Points
WebXPRT 3 - WebXPRT 3 Score
min: 266     avg: 288.7     median: 290 (52%)     max: 310 Points
CrossMark - CrossMark Overall
min: 1643     avg: 1715     median: 1738 (65%)     max: 1763 Points
Power Consumption - Prime95 Power Consumption - external Monitor *
min: 41     avg: 44.3     median: 41.5 (7%)     max: 50.4 Watt
0510152025303540455055Tooltip
Power Consumption - Cinebench R15 Multi Power Consumption - external Monitor *
min: 41.5     avg: 49.8     median: 51.2 (9%)     max: 56.8 Watt
0510152025303540455055Tooltip
Power Consumption - Idle Power Consumption - external Monitor *
min: 3.2     avg: 3.5     median: 3.7 (2%)     max: 3.7 Watt
00.20.50.70.91.21.41.61.92.12.32.62.833.23.53.73.94.24.4Tooltip
Power Consumption - Idle Power Consumption 150cd 1min *
min: 3.2     avg: 4.8     median: 5.2 (6%)     max: 5.92 Watt
0123456Tooltip
Power Consumption - Power Efficiency - Cinebench R15 Multi external Monitor
min: 28.5     avg: 33.2     median: 31.3 (23%)     max: 39.8 Points per Watt
- Range of benchmark values for this graphics card
red legend - Average benchmark values for this graphics card
* Smaller numbers mean a higher performance

v1.33
log 29. 02:52:56

#0 ran 0s before starting gpusingle class +0s ... 0s

#1 no ids found in url (should be separated by "_") +0s ... 0s

#2 not redirecting to Ajax server +0s ... 0s

#3 did not recreate cache, as it is less than 5 days old! Created at Mon, 28 Apr 2025 05:29:55 +0200 +0.001s ... 0.001s

#4 no comparison url found in template nbc.compare_page_2 needed +0.015s ... 0.016s

#5 no comparison url found in template nbc.compare_page_2 needed +0s ... 0.016s

#6 no comparison url found in template nbc.compare_page_2 needed +0s ... 0.016s

#7 no comparison url found in template nbc.compare_page_2 needed +0s ... 0.016s

#8 no comparison url found in template nbc.compare_page_2 needed +0s ... 0.016s

#9 no comparison url found in template nbc.compare_page_2 needed +0s ... 0.017s

#10 no comparison url found in template nbc.compare_page_2 needed +0s ... 0.017s

#11 no comparison url found in template nbc.compare_page_2 needed +0s ... 0.017s

#12 composed specs +0.001s ... 0.018s

#13 did output specs +0s ... 0.018s

#14 getting avg benchmarks for device 17991 +0.015s ... 0.033s

#15 got single benchmarks 17991 +0.01s ... 0.043s

#16 got avg benchmarks for devices +0s ... 0.043s

#17 min, max, avg, median took s +0.481s ... 0.524s

#18 no comparison url found in template nbc.compare_page_2 needed +0s ... 0.524s

#19 return log +0s ... 0.524s

Reviews for the Intel Core Ultra 7 268V processor

敞篷车内的 Lunar Lake 与 Snapdragon - Microsoft Surface Pro OLED for Business 评测

敞篷车内的 Lunar Lake 与 Snapdragon - Microsoft Surface Pro OLED for Business 评测

微软现在也推出了配备英特尔 Lunar Lake 处理器的 Surface Pro 可转换机型,但专门面向企业客户。我们测试了 OLED 版本,并调查了私人客户是否会错过更好的机型。...
Intel Core Ultra 7 268V | Intel Arc Graphics 140V | 13.00" | 882 g
微软 Surface Laptop 7 15 Lunar Lake 评测--ARM 架构 Windows 系统的一记耳光

微软 Surface Laptop 7 15 Lunar Lake 评测--ARM 架构 Windows 系统的一记耳光

去年,微软将其 Surface 设备完全换成了高通公司的 ARM 处理器。不过,企业客户似乎并不想要这些设备,因为 Surface Laptop 15 for Business 现在已经采用了英特尔的 Lunar Lake 处理器。这样做的结果在很多方面都更好。...
Intel Core Ultra 7 268V | Intel Arc Graphics 140V | 15.00" | 1.7 kg
戴尔 Pro 13 Premium 评测:几乎完美的商务笔记本电脑

戴尔 Pro 13 Premium 评测:几乎完美的商务笔记本电脑

我们将抓住这个机会,对戴尔产品线中的 13 英寸商务笔记本电脑进行评测。戴尔 Pro 13 Premium 主要面向要求苛刻的商务用户,其现代化的端口设计吸引了众多企业家,它采用坚固而轻巧的镁合金机身、AI,电池续航时间也非常长。...
Intel Core Ultra 7 268V | Intel Arc Graphics 140V | 13.30" | 1.1 kg

Microsoft Surface Laptop 7 15 Lunar Lake: Intel Arc Graphics 140V, 15.00", 1.7 kg
   » 微软应让 Surface Laptop 7 购买者在英特尔和高通之间做出选择

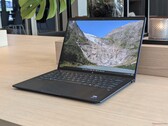
Dell Pro 13 Premium PA13250: Intel Arc Graphics 140V, 13.30", 1.1 kg
   » 几乎完美,得分 90%:戴尔 Pro 13 Premium 的评价

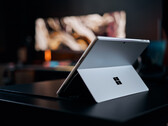
Microsoft Surface Pro OLED Lunar Lake: Intel Arc Graphics 140V, 13.00", 0.9 kg
   » 微软面向个人用户的 Windows-on-ARM 方法损害了 Surface 设备的声誉

Please share our article, every link counts!
Mail Logo

»移动处理器 对比
所有移动处理器的对比


»移动处理器 基准测试
所有已有笔记本电脑中使用的处理器的基准测试成绩 (桌面处理器或移动处理器)

Other CPUs of the series Lunar Lake

» Intel Core Ultra 9 288V
   8x 3.3 GHz - 5.1 GHz
» Intel Core Ultra 7 268V
   8x 2.2 GHz - 5 GHz
» Intel Core Ultra 7 266V
   8x 2.2 GHz - 5 GHz
» Intel Core Ultra 7 258V
   8x 2.2 GHz - 4.8 GHz
» Intel Core Ultra 7 256V
   8x 2.2 GHz - 4.8 GHz
» Intel Core Ultra 5 238V
   8x 2.1 GHz - 4.7 GHz
» Intel Core Ultra 5 236V
   8x 2.1 GHz - 4.7 GHz
» Intel Core Ultra 5 228V
   8x 2.1 GHz - 4.5 GHz
» Intel Core Ultra 5 226V
   8x 2.1 GHz - 4.5 GHz

Surrounding CPUs

+ AMD Ryzen 7 PRO 6850HS
   8x 3.2 GHz - 4.7 GHz
+ AMD Ryzen 7 6800HS
   8x 3.2 GHz - 4.7 GHz
+ AMD Ryzen 7 7435H
   8x 3.1 GHz - 4.5 GHz
+ AMD Ryzen 7 7435HS
   8x 3.1 GHz - 4.5 GHz
+ AMD Ryzen 9 5900HS
   8x 3 GHz - 4.6 GHz
» Intel Core Ultra 7 268V
   8x 2.2 GHz - 5 GHz
- Intel Core Ultra 7 266V
   8x 2.2 GHz - 5 GHz
- Intel Core Ultra 7 265U
   12x 2.4 GHz - 5.3 GHz
- Intel Core Ultra 7 255U
   12x 3.8 GHz - 4.8 GHz
- AMD Ryzen AI 5 340
   6x 2 GHz - 4.8 GHz
- AMD Ryzen AI 5 PRO 340
   6x 2 GHz - 4.8 GHz
Klaus Hinum (Update: 2024-10-13)