Notebookcheck Logo

Intel Celeron J4115

Intel Celeron J4115

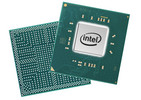
英特尔赛扬J4115是四核SoC,主要面向价格低廉的迷你PC,于2019年末发布。 以1.8~2.5GHz(单核突发)运行,基于Gemini Lake平台(2019刷新)。 与前作相比,刷新时的Boost时钟稍微高一些。 与 Apollo Lake 前作一样,芯片采用 FinFET 14nm 工艺制造,但处理器内核略有改进,L2 高速缓存数量翻了一番,封装更小,新一代监视器输出 (Gen 10) 和部分集成 WiFi 芯片。 除了四个 CPU 核心外,芯片还包括支持 DirectX 12 的 GPU 和 DDR4/LPDDR4 内存控制器(双通道,最高 2400 MHz)。 处理器直接焊接在主板上,因此无法更换。

建筑学

处理器体系结构仍称为Goldmont Plus。 与阿波罗湖的旧Goldmont核心相比,2级高速缓存(最高可达4MB)。 也就是说,每个时钟的性能应该有所提高,但不能接近Kaby Lake Y等核心CPU。

表演

与小型笔记本电脑相比,Celeron J4115的CPU性能比旧N4100稍高。这是因为基本速度快、TDP快、冷却性能(通常)好。 性能位于2020年处理器入门级较低的位置。 此外,在办公服等基本任务中,通过适度多任务浏览处理器性能也不错。

GPU性能

UHD 图形 600 (Gemini Lake) 基于英特尔 Gen9 体系结构,支持 DirectX 12,还用于 Kaby Lake/Skylake/Apollo Lake 图形适配器(如 HD Graphics 520)。 配备12个EU和高达750MHz的时钟,性能与旧HD显卡500(Apollo Lake)大致相同。

此芯片还提供高级视频引擎,支持 VP9 和 H.265 材质(8 位颜色深度)的硬件)。

耗电量

与前作相同,英特尔将TDP指定为10瓦特(移动式N4120为6瓦特)。 因此,理论上可以被动冷却芯片,但也可以使用带有风扇的SKU。

SeriesIntel Gemini Lake
CodenameGemini Lake

Series: Gemini Lake Gemini Lake

Intel Celeron J41051.5 - 2.5 GHz4 / 4 cores
Intel Pentium Silver N50001.1 - 2.7 GHz4 / 4 cores
Intel Celeron J40052 - 2.7 GHz2 / 2 cores
Intel Celeron J4115 « 1.8 - 2.5 GHz4 / 4 cores
Intel Celeron N41001.1 - 2.4 GHz4 / 4 cores
Intel Celeron N40001.1 - 2.6 GHz2 / 2 cores
Clock Rate1800 - 2500 MHz
Level 2 Cache4 MB
Number of Cores / Threads4 / 4
Power Consumption (TDP = Thermal Design Power)10 Watt
Manufacturing Technology14 nm
Max. Temperature105 °C
SocketBGA1090
FeaturesDDR4-2400/LPDDR4-2400 RAM, PCIe 2, MMX, SSE, SSE2, SSE3, SSSE3, SSE4.1, SSE4.2, VMX, SMEP, SMAP, MPX, EIST, TM1, TM2, Turbo, AES-NI, RDRAND, RDSEED, SHA, SGX
GPUIntel UHD Graphics 600 (250 - 750 MHz)
64 Bit64 Bit support
Architecturex86
Announcement Date11/04/2019
Product Link (external)ark.intel.com

Benchmarks

Performance Rating - CB R15 + R20 + 7-Zip + X265 + Blender + 3DM11 CPU
17.2 pt (24%)
AMD E1-2100
2.47 -86%
...
Intel Celeron N3350
11.6 -33%
Intel Atom x7-E3950
12.4 -28%
AMD A6-5200
13.7 -20%
AMD A4-5150M
14.4 -16%
15.2 -12%
AMD A10-4600M
15.8 -8%
16.1 -6%
Intel Celeron N4100
16.3 -5%
16.7 -3%
Intel Celeron J4115
17.2
17.2 0%
Intel Celeron N4120
17.4 1%
17.6 2%
17.7 3%
17.8 3%
Intel Celeron J4125
17.8 3%
AMD A10-5750M
18.2 6%
Intel Core i3-5005U
18.4 7%
18.8 9%
...
57 231%
max:
72.1 319%
0%
100%
Cinebench R20 - Cinebench R20 CPU (Single Core)
min: 156     avg: 156.5     median: 156.5 (17%)     max: 157 Points
Cinebench R20 - Cinebench R20 CPU (Multi Core)
min: 503     avg: 547     median: 546.5 (1%)     max: 590 Points
Cinebench R15 - Cinebench R15 CPU Multi 64 Bit
min: 225     avg: 244     median: 244 (2%)     max: 263 Points
AMD A4-1200
31 -87%
...
Intel Core i5-4210U
234.4 -4%
AMD A12-9720P
234.5 -4%
236 -3%
Intel Core i7-4600U
238.8 -2%
Intel Core i5-4260U
239 -2%
Intel Pentium Gold 4415U
239.5 -2%
Intel Core i3-4000M
239.8 -2%
240.2 -2%
Intel Core i3-6157U
242 -1%
Intel Celeron J4115
244
244.7 0%
Intel Core i3-6100U
246.9 1%
Intel Core i7-3537U
247 1%
248.3 2%
Intel Core i7-4500U
250.7 3%
251.3 3%
Intel Core i7-8500Y
252.3 3%
Intel Core i7-4550U
253 4%
255 5%
...
5600 2195%
max:
15842 6393%
0%
100%
0153045607590105120135150165180195210225240255Tooltip
Cinebench R15 - Cinebench R15 CPU Single 64 Bit
min: 70.1     avg: 70.6     median: 70.6 (21%)     max: 71.1 Points
AMD A4-1200
19 -73%
...
Intel Pentium 3558U
67 -5%
67.6 -4%
AMD A8-5550M
68 -4%
Intel Celeron N4100
68.1 -4%
AMD A6-9220
68.5 -3%
AMD Pro A8-8600B
69 -2%
Intel Core i3-4030U
69.6 -1%
AMD Pro A10-8700B
70 -1%
70.3 0%
Intel Celeron J4115
70.6
Intel Core i5-3339Y
71 1%
AMD PRO A8-9600B
71 1%
Intel Celeron 3865U
72 2%
AMD A10-9620P
72 2%
Intel Celeron J4125
72.5 3%
AMD A12-9720P
72.5 3%
73 3%
73.3 4%
Intel Celeron N4120
73.6 4%
...
311 341%
max:
332 370%
0%
100%
Cinebench R11.5 - Cinebench R11.5 CPU Multi 64 Bit
3.2 Points (4%)
Cinebench R11.5 - Cinebench R11.5 CPU Single 64 Bit
0.8 Points (21%)
Cinebench R10 - Cinebench R10 Rend. Single (32bit)
2087 points (13%)
Cinebench R10 - Cinebench R10 Rend. Multi (32bit)
7426 points (5%)
wPrime 2.10 - wPrime 2.0 1024m *
564 s (7%)
wPrime 2.10 - wPrime 2.0 32m *
19.1 s (4%)
WinRAR - WinRAR 4.0
1203 points (2%)
7-Zip 18.03 - 7-Zip 18.03 Multli Thread 4 runs
min: 7129     avg: 7614     median: 7613.5 (4%)     max: 8098 MIPS
7-Zip 18.03 - 7-Zip 18.03 Single Thread 4 runs
min: 2184     avg: 2200     median: 2199.5 (26%)     max: 2215 MIPS
X264 HD Benchmark 4.0 - x264 Pass 2
17.5 fps (6%)
X264 HD Benchmark 4.0 - x264 Pass 1
76.3 fps (18%)
HWBOT x265 Benchmark v2.2 - HWBOT x265 4k Preset
min: 1.34     avg: 1.4     median: 1.4 (2%)     max: 1.49 fps
00.10.30.40.50.60.80.911.21.31.41.51.71.81.92.12.22.32.5Tooltip
TrueCrypt - TrueCrypt Serpent
0.2 GB/s (0%)
TrueCrypt - TrueCrypt Twofish
0.2 GB/s (4%)
TrueCrypt - TrueCrypt AES
1.7 GB/s (4%)
Blender - Blender 2.79 BMW27 CPU *
min: 2380     avg: 2515     median: 2515 (18%)     max: 2650 Seconds
R Benchmark 2.5 - R Benchmark 2.5 *
1.7 sec (37%)
3DMark 06 - CPU - 3DMark 06 - CPU
3683 Points (8%)
Super Pi mod 1.5 XS 1M - Super Pi mod 1.5 XS 1M *
27.4 s (6%)
Super Pi mod 1.5 XS 2M - Super Pi mod 1.5 XS 2M *
63.3 s (3%)
Super Pi Mod 1.5 XS 32M - Super Pi mod 1.5 XS 32M *
1472 s (7%)
3DMark 11 - 3DM11 Performance Physics
min: 2688     avg: 2793     median: 2792.5 (8%)     max: 2897 Points
3DMark - 3DMark Ice Storm Physics
27642 Points (22%)
3DMark - 3DMark Ice Storm Extreme Physics
min: 26282     avg: 28448     median: 28448 (23%)     max: 30614 Points
3DMark - 3DMark Cloud Gate Physics
min: 2318     avg: 2482     median: 2481.5 (6%)     max: 2645 Points
3DMark - 3DMark Fire Strike Standard Physics
min: 3560     avg: 3758     median: 3758 (7%)     max: 3956 Points
3DMark - 3DMark Time Spy CPU
1063 Points (4%)
Geekbench 5.5 - Geekbench 5.1 - 5.4 64 Bit Single-Core
min: 388     avg: 399     median: 399 (17%)     max: 410 points
AMD E1-2100
125 -69%
...
Intel Core 2 Duo SU7300
207 -48%
221 -45%
Intel Atom x7-Z8750
233 -42%
AMD A6-5200
248 -38%
Intel Celeron J3455
293 -27%
Intel Celeron N3350
320 -20%
345 -14%
Qualcomm Snapdragon 835 (8998)
386 -3%
AMD A8-5550M
395 -1%
Intel Celeron J4115
399
Intel Celeron N4100
403.3 1%
418.7 5%
421 6%
Intel Pentium Gold 4425Y
423 6%
433.5 9%
Intel Celeron 3867U
434 9%
Intel Celeron N4120
442 11%
AMD A10-4600M
446 12%
AMD A4-5150M
454 14%
...
2331 484%
0%
100%
Geekbench 5.5 - Geekbench 5.1 - 5.4 64 Bit Multi-Core
min: 1410     avg: 1421     median: 1420.5 (3%)     max: 1431 points
AMD E1-2100
238.5 -83%
...
Intel Pentium Gold 6405U
1320 -7%
1324 -7%
AMD A10-5750M
1326 -7%
1339 -6%
1349 -5%
AMD Ryzen Embedded R1505G
1353 -5%
Intel Celeron J4125
1367 -4%
Intel Pentium Gold 4415U
1374 -3%
1397 -2%
Intel Celeron J4115
1421
Intel Core i5-5250U
1427 0%
1429 1%
1438 1%
Intel Core i3-6157U
1519 7%
Intel Celeron N4120
1525 7%
1532 8%
1534 8%
1540 8%
Intel Core m3-7Y32
1576 11%
...
22938 1514%
max:
55811 3828%
0%
100%
Mozilla Kraken 1.1 - Kraken 1.1 Total Score *
min: 2457     avg: 2482     median: 2482 (3%)     max: 2507 ms
WebXPRT 3 - WebXPRT 3 Score
min: 80.1     avg: 81.7     median: 81.7 (17%)     max: 83.2 Points
Power Consumption - Prime95 Power Consumption - external Monitor *
14.1 Watt (2%)
Power Consumption - Cinebench R15 Multi Power Consumption - external Monitor *
12.2 Watt (2%)
Power Consumption - Cinebench R15 Multi Power Efficiency - external Monitor
21.6 Points per Watt (16%)
- Range of benchmark values for this graphics card
- Average benchmark values for this graphics card
* Smaller numbers mean a higher performance

v1.26
log 19. 19:51:07

#0 no ids found in url (should be separated by "_") +0s ... 0s

#1 not redirecting to Ajax server +0s ... 0s

#2 did not recreate cache, as it is less than 5 days old! Created at Fri, 19 Apr 2024 05:38:49 +0200 +0.002s ... 0.002s

#3 no comparison url found in template nbc.compare_page_2 needed +0.008s ... 0.01s

#4 no comparison url found in template nbc.compare_page_2 needed +0s ... 0.01s

#5 no comparison url found in template nbc.compare_page_2 needed +0s ... 0.01s

#6 no comparison url found in template nbc.compare_page_2 needed +0s ... 0.01s

#7 no comparison url found in template nbc.compare_page_2 needed +0s ... 0.01s

#8 composed specs +0s ... 0.011s

#9 did output specs +0s ... 0.011s

#10 getting avg benchmarks for device 12643 +0.015s ... 0.026s

#11 got single benchmarks 12643 +0.011s ... 0.037s

#12 got avg benchmarks for devices +0s ... 0.037s

#13 min, max, avg, median took s +0.899s ... 0.936s

#14 no comparison url found in template nbc.compare_page_2 needed +0s ... 0.936s

#15 return log +0s ... 0.936s

Reviews for the Intel Celeron J4115 processor

Chuwi GemiBook CWI528: Intel UHD Graphics 600, 13.00", 1.3 kg
  External Review » Chuwi GemiBook CWI528

Please share our article, every link counts!

»移动处理器 对比
所有移动处理器的对比


»移动处理器 基准测试
所有已有笔记本电脑中使用的处理器的基准测试成绩 (桌面处理器或移动处理器)

Other CPUs of the series Gemini Lake

» Intel Pentium Silver J5040
   4x 2 GHz - 3.2 GHz
» Intel Pentium Silver N5030
   4x 1.1 GHz - 3.1 GHz
» Intel Celeron J4125
   4x 2 GHz - 2.7 GHz
» Intel Celeron J4105
   4x 1.5 GHz - 2.5 GHz
» Intel Pentium Silver N5000
   4x 1.1 GHz - 2.7 GHz
» Intel Celeron J4005
   2x 2 GHz - 2.7 GHz
» Intel Celeron N4120
   4x 1.1 GHz - 2.6 GHz
» Intel Celeron J4115
   4x 1.8 GHz - 2.5 GHz
» Intel Celeron N4100
   4x 1.1 GHz - 2.4 GHz
» Intel Celeron J4025
   2x 2 GHz - 2.9 GHz
» Intel Celeron N4020
   2x 1.1 GHz - 2.8 GHz
» Intel Celeron N4000
   2x 1.1 GHz - 2.6 GHz

Surrounding CPUs

+ Intel Core i3-4102E
   2x 1.6 GHz
+ Intel Core i3-4030Y
   2x 1.6 GHz
+ Qualcomm Snapdragon 835 (8998)
   8x 2.45 GHz
+ AMD A8-3550MX
   4x 2 GHz - 2.7 GHz
+ Intel Core 2 Duo P8800
   2x 2.66 GHz
» Intel Celeron J4115
   4x 1.8 GHz - 2.5 GHz
- Intel Celeron N4100
   4x 1.1 GHz - 2.4 GHz
- Intel Core 2 Duo T9300
   2x 2.5 GHz
- AMD Phenom II X2 N660
   2x 3 GHz
- Intel Celeron 1020M
   2x 2.1 GHz
- Intel Core i3-350M
   2x 2.26 GHz
> Notebookcheck中文版(NBC中国) > FAQ / 小提示/ 技术参数 > 移动处理器 —— 基准测试成绩列表 > Intel Gemini Lake Celeron J4115 笔记本处理器
Klaus Hinum (Update: 2021-08-13)