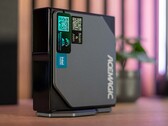
Notebookcheck Logo

Intel Processor N97

Intel N97

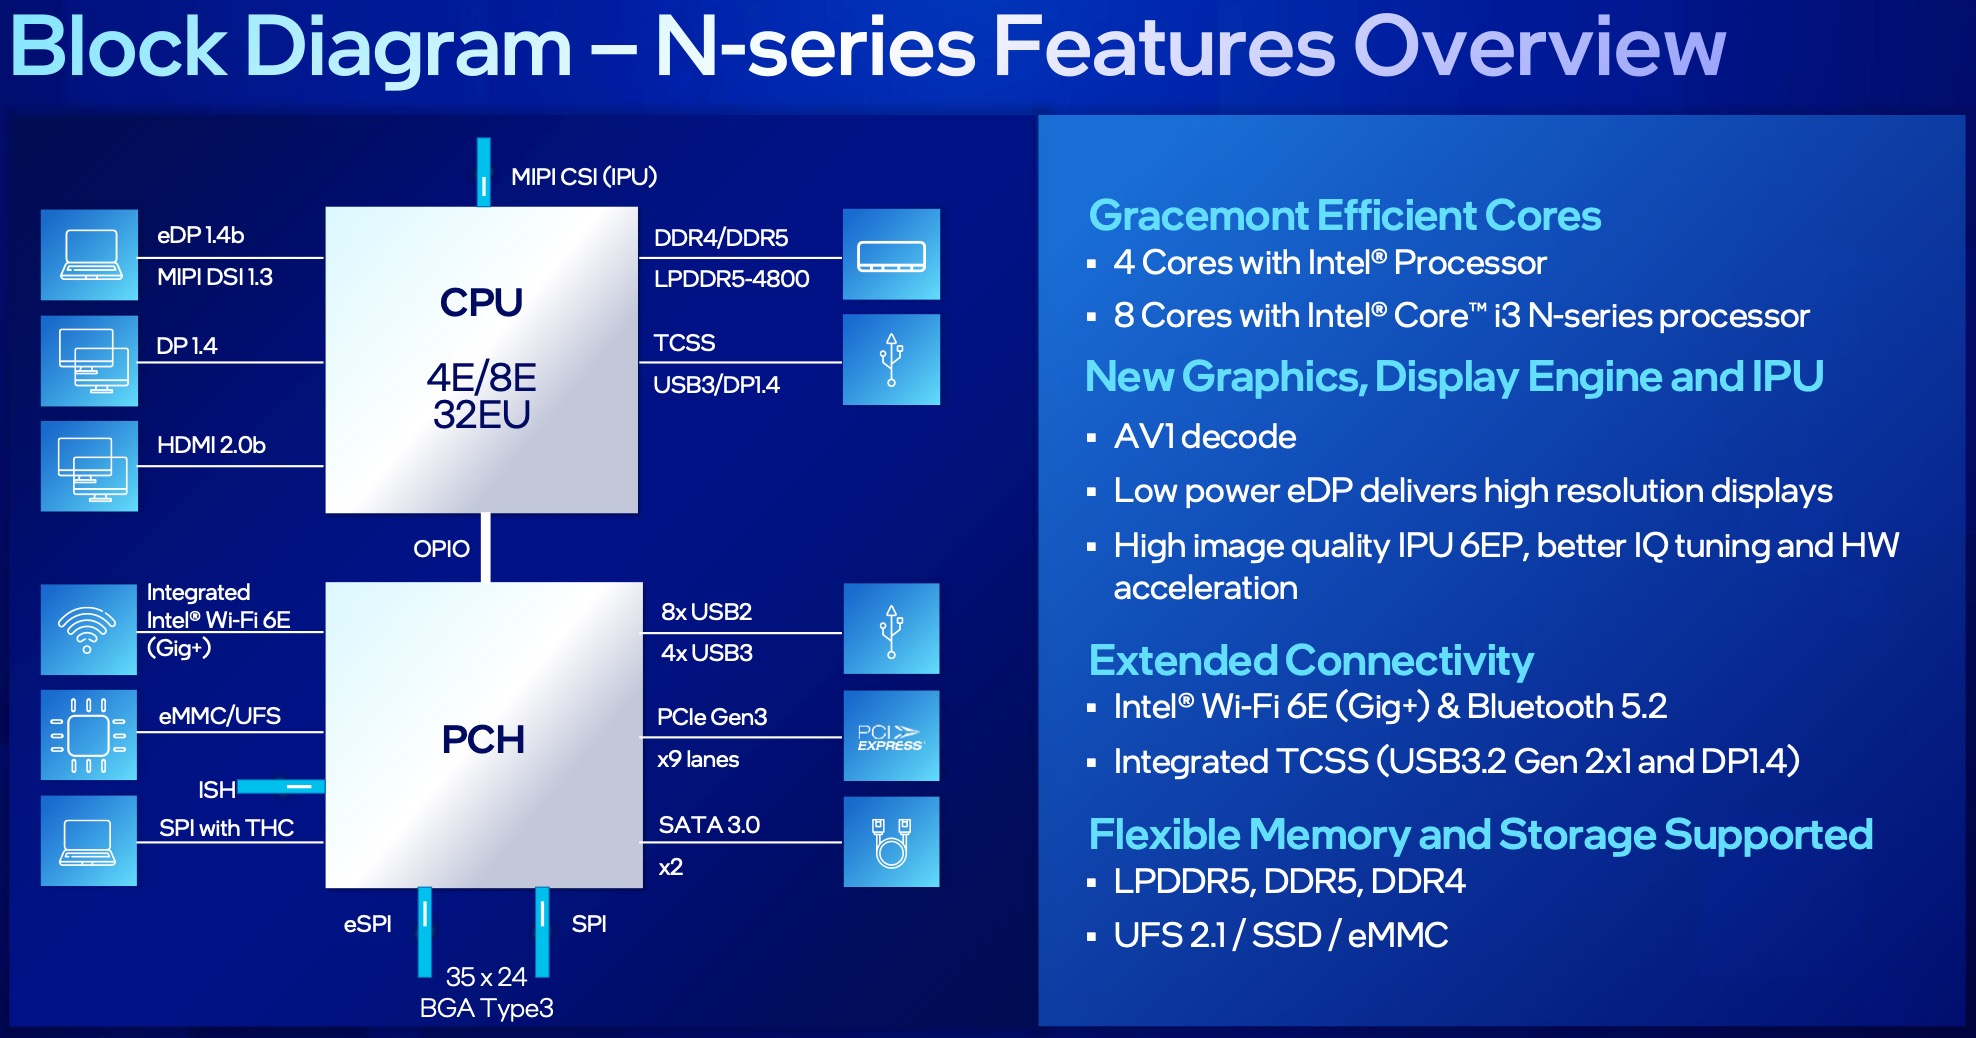
英特尔处理器 N97 是 Alder Lake-N 系列中面向轻薄笔记本电脑的入门级移动 CPU。它于 2023 年初发布,不提供性能内核和 8 个高效内核中的 4 个(E-cores,Gracemont 架构)。该芯片不支持超线程技术,时钟频率高达 3.7 GHz。E 核心的性能应与旧的 Skylake 核心类似(与酷睿 i7-6700HQ 比较 酷睿 i7-6700HQ).所有内核最高可使用 6 MB L3 高速缓存。

性能

性能应介于 英特尔处理器 N100英特尔处理器 N200之间,明显低于 酷睿 i3-N300N305明显低于酷睿 i3-N300 和 N305。

功能特点

Alder Lake-N 芯片仅支持高达 DDR5-4800、DDR4-3200 或 LPDDR5-4800 的单通道内存。该芯片还支持快速同步和 AV1 解码(很可能与 Alder Lake 中的引擎相同)。此外,还部分集成了 Wi-Fi 6E 和蓝牙 5.2(但没有 Thunderbolt)。外部芯片可通过 PCIe Gen3 x9(通过 PCH)连接。

集成图形适配器基于 Xe 架构,32 个 EU(执行单元)中只有 24 个能以 1200 MHz 的频率运行。由于采用单通道内存、低时钟速度和低着色器数量,iGPU 的游戏性能非常有限。

功耗

N97 的基本功耗为 12 W,是 N100 的两倍。CPU 采用了英特尔公司进一步改进的 10 纳米 SuperFin 工艺(称为英特尔 7)。

SeriesIntel Alder Lake-N
CodenameAlder Lake-N

Series: Alder Lake-N Alder Lake-N

Intel Core i3-N3051.8 - 3.8 GHz8 / 8 cores6 MB L3
Intel Core i3-N300 - 3.8 GHz8 / 8 cores6 MB L3
Intel Processor N2001 - 3.7 GHz4 / 4 cores6 MB L3
Intel Processor N97 « - 3.6 GHz4 / 4 cores6 MB L3
Intel Processor N95 - 3.4 GHz4 / 4 cores6 MB L3
Intel Processor N1001 - 3.4 GHz4 / 4 cores6 MB L3
Intel Processor N501 - 3.4 GHz2 / 2 cores6 MB L3
Clock Rate <=3600 MHz
Level 3 Cache6 MB
Number of Cores / Threads4 / 4
4 x 3.6 GHz Intel Crestmont E-Core
Power Consumption (TDP = Thermal Design Power)12 Watt
Manufacturing Technology10 nm
Max. Temperature105 °C
GPUIntel UHD Graphics 24EUs (Alder Lake-N) ( - 1200 MHz)
64 Bit64 Bit support
Architecturex86
Announcement Date01/03/2023
Product Link (external)ark.intel.com

Benchmarks

Performance Rating - CB R15 + R20 + 7-Zip + X265 + Blender + 3DM11 CPU
27.1 pt (38%)
AMD E1-2100
2.47 -91%
...
AMD Ryzen 5 3580U
26.2 -3%
26.2 -3%
26.3 -3%
AMD Ryzen 7 2700U
26.5 -2%
26.5 -2%
26.7 -1%
26.7 -1%
26.9 -1%
27 0%
Intel Processor N97
27.1
27.1 0%
Intel Core i5-8259U
27.6 2%
27.7 2%
Intel Core i5-8265U
27.9 3%
28.1 4%
Intel Core i5-8260U
28.2 4%
28.2 4%
Intel Core i7-7700HQ
28.2 4%
Intel Core i5-1035G4
28.3 4%
...
57 110%
max:
72.1 166%
0%
100%
Cinebench R23 - Cinebench R23 Multi Core
2913 Points (3%)
AMD E1-2100
202 -93%
...
2303 -21%
2546 -13%
2600 -11%
2611 -10%
Intel Core i7-2860QM
2699 -7%
2711 -7%
2729 -6%
2730 -6%
2739 -6%
Intel Processor N97
2913
2914 0%
2927 0%
Intel Core i5-8260U
3028 4%
Intel Core i3-1115G4
3038 4%
Intel Core i5-10310U
3094 6%
3108 7%
AMD Ryzen Embedded V1605B
3160 8%
3321 14%
3434 18%
...
32782 1025%
max:
107681 3597%
0%
100%
Cinebench R23 - Cinebench R23 Single Core
973 Points (41%)
AMD A10-5745M
74.4 -92%
...
874 -10%
875 -10%
877 -10%
AMD Ryzen 7 2700U
886 -9%
886 -9%
AMD Ryzen Embedded R1606G
888 -9%
Intel Core i3-8109U
906 -7%
918 -6%
971 0%
Intel Processor N97
973
974 0%
Intel Core i5-8259U
976 0%
983 1%
988 2%
1003 3%
Intel Core i5-8265U
1008 4%
Intel Core i5-1035G1
1016 4%
1021 5%
1033 6%
...
2103 116%
max:
2351 142%
0%
100%
Cinebench R20 - Cinebench R20 CPU (Single Core)
371 Points (41%)
Cinebench R20 - Cinebench R20 CPU (Multi Core)
1115 Points (3%)
Cinebench R15 - Cinebench R15 CPU Multi 64 Bit
479 Points (3%)
AMD A4-1200
31 -94%
...
416 -13%
AMD Ryzen 3 2300U
422.5 -12%
429.8 -10%
Intel Core i7-7567U
432 -10%
437 -9%
448 -6%
Intel Core i3-1115G4
461.6 -4%
466.8 -3%
AMD Ryzen 3 3300U
471 -2%
Intel Processor N97
479
AMD Ryzen 3 PRO 3300U
481 0%
Intel Core i7-4702HQ
501 5%
Intel Core i5-6440HQ
510 6%
512 7%
Intel Core i7-4712HQ
518 8%
Intel Core i7-3632QM
521 9%
Intel Core i7-2860QM
533 11%
Intel Core i5-8350U
548 14%
549 15%
...
5600 1069%
max:
15842 3207%
0%
100%
0255075100125150175200225250275300325350375400425450Tooltip
Cinebench R15 - Cinebench R15 CPU Single 64 Bit
161 Points (48%)
AMD A4-1200
19 -88%
...
Intel Core i7-8709G
158 -2%
Intel Core i7-7660U
158.5 -2%
159 -1%
Intel Core i7-7567U
159 -1%
Intel Xeon E3-1535M v5
159.3 -1%
159.5 -1%
159.5 -1%
160.4 0%
160.9 0%
Intel Processor N97
161
162.7 1%
163 1%
Intel Core i7-7820HQ
163 1%
163.9 2%
Intel Core i5-1035G4
164.4 2%
Intel Core i5-1035G1
164.6 2%
165 2%
Intel Core i5-1035G7
165 2%
Intel Core i7-8650U
165 2%
...
311 93%
max:
332 106%
0%
100%
Cinebench R11.5 - Cinebench R11.5 CPU Multi 64 Bit
6 Points (8%)
Cinebench R11.5 - Cinebench R11.5 CPU Single 64 Bit
1.9 Points (48%)
Cinebench R10 - Cinebench R10 Rend. Single (32bit)
5445 points (33%)
Cinebench R10 - Cinebench R10 Rend. Multi (32bit)
15323 points (11%)
Cinebench R10 - Cinebench R10 Rend. Multi (64bit)
24158 Points (17%)
Cinebench R10 - Cinebench R10 Rend. Single (64bit)
8567 Points (10%)
wPrime 2.10 - wPrime 2.0 1024m *
523 s (6%)
wPrime 2.10 - wPrime 2.0 32m *
16.8 s (3%)
WinRAR - WinRAR 4.0
2321 points (4%)
7-Zip 18.03 - 7-Zip 18.03 Multli Thread 4 runs
13174 MIPS (8%)
7-Zip 18.03 - 7-Zip 18.03 Single Thread 4 runs
4019 MIPS (48%)
X264 HD Benchmark 4.0 - x264 Pass 2
34.9 fps (12%)
X264 HD Benchmark 4.0 - x264 Pass 1
174.8 fps (40%)
HWBOT x265 Benchmark v2.2 - HWBOT x265 4k Preset
3.5 fps (6%)
0123456Tooltip
TrueCrypt - TrueCrypt Serpent
0.3 GB/s (0%)
TrueCrypt - TrueCrypt Twofish
0.5 GB/s (9%)
TrueCrypt - TrueCrypt AES
2.9 GB/s (8%)
Blender - Blender 3.3 Classroom CPU *
2014 Seconds (26%)
Blender - Blender 2.79 BMW27 CPU *
1020 Seconds (7%)
R Benchmark 2.5 - R Benchmark 2.5 *
0.8 sec (17%)
3DMark 06 - CPU - 3DMark 06 - CPU
6461 Points (14%)
Super Pi mod 1.5 XS 1M - Super Pi mod 1.5 XS 1M *
18.4 s (4%)
Super Pi mod 1.5 XS 2M - Super Pi mod 1.5 XS 2M *
38.3 s (2%)
Super Pi Mod 1.5 XS 32M - Super Pi mod 1.5 XS 32M *
786 s (3%)
3DMark Vantage - 3DM Vant. Perf. CPU no Physx
15578 Points (14%)
3DMark 11 - 3DM11 Performance Physics
6118 Points (17%)
3DMark - 3DMark Ice Storm Physics
50003 Points (41%)
3DMark - 3DMark Ice Storm Extreme Physics
50545 Points (41%)
3DMark - 3DMark Ice Storm Unlimited Physics
52858 Points (45%)
3DMark - 3DMark Cloud Gate Physics
4565 Points (12%)
3DMark - 3DMark Fire Strike Standard Physics
6473 Points (12%)
3DMark - 3DMark Time Spy CPU
2493 Points (11%)
Geekbench 6.2 - Geekbench 6.2 Single-Core
1300 points (39%)
Geekbench 6.2 - Geekbench 6.2 Multi-Core
3181 points (13%)
662 -79%
Intel Pentium B970
668 -79%
Intel Pentium Gold 4425Y
763 -76%
1332 -58%
1660 -48%
2024 -36%
2803 -12%
2958 -7%
3012 -5%
Intel Processor N97
3181
4090 29%
4587 44%
4798 51%
Intel Core i5-8400H
4963 56%
5213 64%
5340 68%
5548 74%
Intel Core i7-11390H
5630 77%
5901 86%
...
21254 568%
max:
25365 697%
0%
100%
Geekbench 5.5 - Geekbench 5.1 - 5.4 64 Bit Single-Core
1060 points (45%)
Geekbench 5.5 - Geekbench 5.1 - 5.4 64 Bit Multi-Core
2757 points (5%)
Geekbench 5.0 - Geekbench 5.0 64 Bit Single-Core
1052 points (5%)
Geekbench 5.0 - Geekbench 5.0 64 Bit Multi-Core
2738 points (9%)
Geekbench 4.4 - Geekbench 4.1 - 4.4 64 Bit Single-Core
4703 points (47%)
Geekbench 4.4 - Geekbench 4.1 - 4.4 64 Bit Multi-Core
10893 points (12%)
Mozilla Kraken 1.1 - Kraken 1.1 Total Score *
975 ms (1%)
WebXPRT 4 - WebXPRT 4 Score
145.3 Points (42%)
WebXPRT 3 - WebXPRT 3 Score
191.4 Points (40%)
CrossMark - CrossMark Overall
844 Points (32%)
Power Consumption - Prime95 Power Consumption - external Monitor *
37.1 Watt (6%)
05101520253035Tooltip
Power Consumption - Cinebench R15 Multi Power Consumption - external Monitor *
28.4 Watt (5%)
051015202530Tooltip
Power Consumption - Idle Power Consumption - external Monitor *
13.5 Watt (9%)
0123456789101112131415Tooltip
- Range of benchmark values for this graphics card
- Average benchmark values for this graphics card
* Smaller numbers mean a higher performance

v1.26
log 26. 01:21:38

#0 no ids found in url (should be separated by "_") +0s ... 0s

#1 not redirecting to Ajax server +0s ... 0s

#2 did not recreate cache, as it is less than 5 days old! Created at Thu, 25 Apr 2024 05:38:32 +0200 +0.001s ... 0.001s

#3 no comparison url found in template nbc.compare_page_2 needed +0.017s ... 0.019s

#4 no comparison url found in template nbc.compare_page_2 needed +0s ... 0.019s

#5 no comparison url found in template nbc.compare_page_2 needed +0s ... 0.019s

#6 no comparison url found in template nbc.compare_page_2 needed +0s ... 0.02s

#7 no comparison url found in template nbc.compare_page_2 needed +0s ... 0.02s

#8 no comparison url found in template nbc.compare_page_2 needed +0s ... 0.02s

#9 composed specs +0.001s ... 0.021s

#10 did output specs +0s ... 0.021s

#11 getting avg benchmarks for device 14969 +0.018s ... 0.039s

#12 got single benchmarks 14969 +0.012s ... 0.05s

#13 got avg benchmarks for devices +0s ... 0.05s

#14 min, max, avg, median took s +1.386s ... 1.436s

#15 no comparison url found in template nbc.compare_page_2 needed +0s ... 1.436s

#16 return log +0s ... 1.436s

Please share our article, every link counts!

»移动处理器 对比
所有移动处理器的对比


»移动处理器 基准测试
所有已有笔记本电脑中使用的处理器的基准测试成绩 (桌面处理器或移动处理器)

Other CPUs of the series Alder Lake-N

» Intel Core i3-N305
   8x 1.8 GHz - 3.8 GHz
» Intel Core i3-N300
   8x - 3.8 GHz
» Intel Processor N200
   4x 1 GHz - 3.7 GHz
» Intel Processor N97
   4x - 3.6 GHz
» Intel Processor N95
   4x - 3.4 GHz
» Intel Processor N100
   4x 1 GHz - 3.4 GHz
» Intel Processor N50
   2x 1 GHz - 3.4 GHz

Surrounding CPUs

+ AMD Ryzen 3 3350U
   4x 2.1 GHz - 3.5 GHz
+ AMD Ryzen 3 3300U
   4x 2.1 GHz - 3.5 GHz
+ AMD Ryzen 3 PRO 3300U
   4x 2.1 GHz - 3.5 GHz
+ AMD Ryzen 3 2300U
   4x 2 GHz - 3.4 GHz
+ AMD Ryzen 3 PRO 2300U
   4x 2 GHz - 3.4 GHz
» Intel Processor N97
   4x - 3.6 GHz
- Intel Processor N95
   4x - 3.4 GHz
- Intel Processor N100
   4x 1 GHz - 3.4 GHz
- Intel Core i7-7500U
   2x 2.7 GHz - 3.5 GHz
- Intel Core i5-5350H
   2x 3 GHz - 3.5 GHz
- Intel Core i5-7300U
   2x 2.6 GHz - 3.5 GHz
> Notebookcheck中文版(NBC中国) > FAQ / 小提示/ 技术参数 > 移动处理器 —— 基准测试成绩列表 > Intel Alder Lake-N N97 笔记本处理器
Klaus Hinum (Update: 2023-11-27)