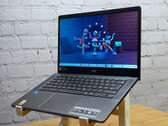
Intel Core i3-N305
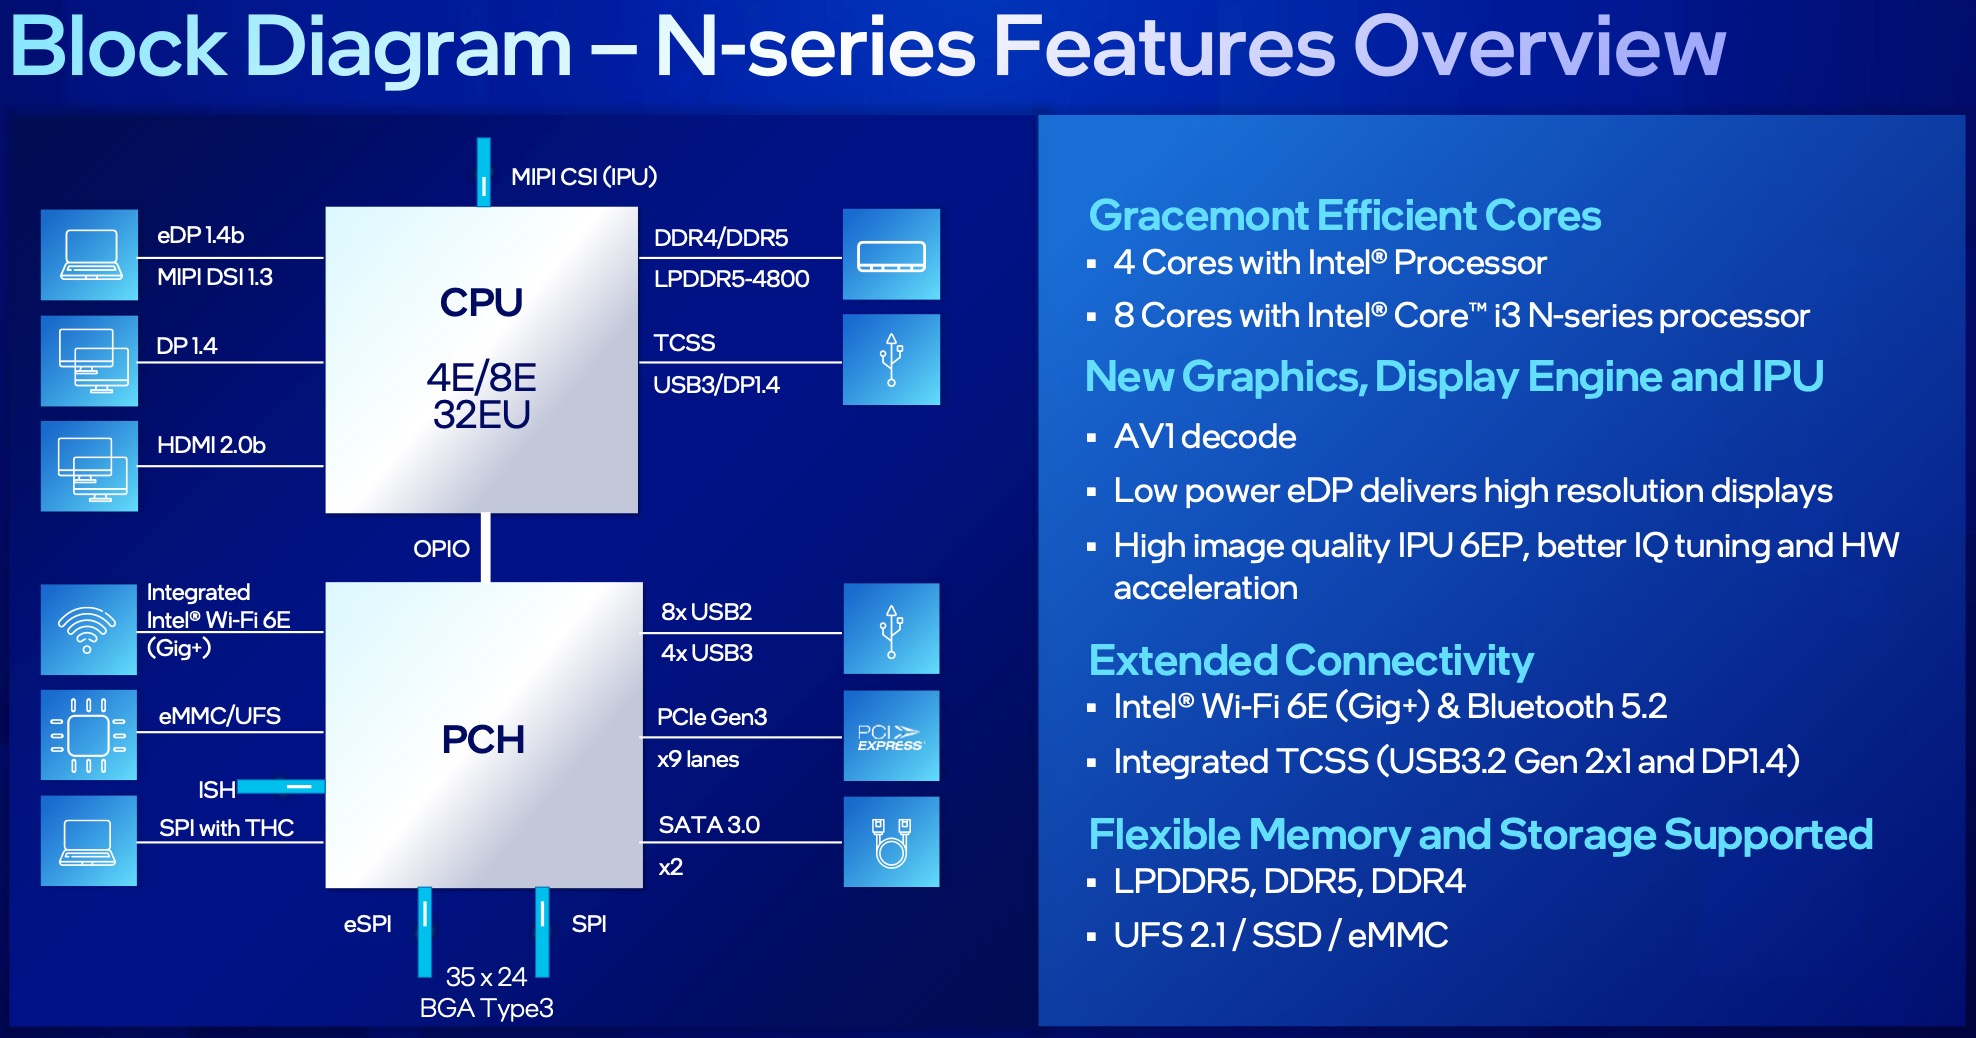
英特尔酷睿 i3-N305是 Alder Lake-N 系列中面向轻薄笔记本电脑的入门级移动 CPU。它于 2023 年初发布,不提供性能内核和 8 个高效内核(E-cores,Gracemont 架构)。该芯片不支持超线程技术,主频高达 3.8 GHz。E 核心的性能应与旧的 Skylake 核心类似(与酷睿 i7-6700HQ 比较 酷睿 i7-6700HQ).所有内核最高可使用 6 MB L3 高速缓存。
性能
截至 2023 年 9 月,我们尚未测试过围绕 N305 构建的单个系统。预计该芯片的速度将比 N95(4 核、4 线程、最高 3.4 GHz)。
具体情况可能会有所不同,这取决于 CPU 功耗限制有多高,以及系统的散热解决方案有多好。
功能特性
Alder Lake-N 芯片仅支持高达 DDR5-4800、DDR4-3200 或 LPDDR5-4800 的单通道内存。该芯片还支持快速同步和 AV1 解码(很可能与 Alder Lake 中的引擎相同)。此外,还部分集成了 Wi-Fi 6E 和蓝牙 5.2(但没有 Thunderbolt)。外部芯片可通过 PCIe Gen3 x9(通过 PCH)连接。
集成图形适配器基于 Xe 架构,提供 32 个 EU(执行单元),工作频率高达 1.25 GHz。除了单通道内存外,iGPU 的游戏性能非常有限。
功耗
i3 的基本功耗为 15 W,配置后可降至 9 W。该 CPU 采用英特尔进一步改进的 10 纳米 SuperFin 工艺制造(称为英特尔 7)。
Series | Intel Alder Lake-N |
Codename | Alder Lake-N |
Series: Alder Lake-N Alder Lake-N |
Clock Rate | 1800 - 3800 MHz |
Level 1 Cache | 768 KB |
Level 2 Cache | 4 MB |
Level 3 Cache | 6 MB |
Number of Cores / Threads | 8 / 8 8 x 3.8 GHz Intel Gracemont E-Core |
Power Consumption (TDP = Thermal Design Power) | 15 Watt |
Manufacturing Technology | 10 nm |
Max. Temperature | 105 °C |
Socket | BGA1264 |
Features | DDR4-3200/DDR5-4800/LPDDR5-4800 RAM (sin. chan.), PCIe 3, GNA, MMX, SSE, SSE2, SSE3, SSSE3, SSE4.1, SSE4.2, AVX, AVX2, BMI2, ABM, FMA, ADX, VMX, SMEP, SMAP, EIST, TM1, TM2, Turbo, SST, AES-NI, RDRAND, RDSEED, SHA |
GPU | Intel UHD Graphics 32EUs (Alder Lake) (1000 - 1250 MHz) |
64 Bit | 64 Bit support |
Architecture | x86 |
Announcement Date | 01/03/2023 |
Product Link (external) | ark.intel.com |
Benchmarks
Performance Rating - CB R15 + R20 + 7-Zip + X265 + Blender + 3DM11 CPU
28.8 pt (40%)
...
Intel Core i7-7700HQ
Intel Core i5-8260U
Intel Core i5-1035G4
Intel Core i5-1035G1
Intel Core i5-8365U
Intel Core i5-10310U
Intel Core i5-1035G7
Intel Core i7-8809G
Intel Core i7-1065G7
...
max:
Cinebench 2024 - CB24 CPU Single Core
65 Points (45%)
...
Cinebench 2024 - CB24 CPU Multi Core
324 Points (6%)
Intel Core i7-11390H
...
max:
Cinebench R23 - Cinebench R23 Multi Core
min: 4832 avg: 5049 median: 5092 (5%) max: 5181 Points
CPU TDP 15 W | TDP 17 W |
---|
95% | 100% |
...
Intel Core i5-8400H
Intel Core i5-1230U
...
max:
Cinebench R23 - Cinebench R23 Single Core
min: 939 avg: 983 median: 995 (42%) max: 1001 Points
CPU TDP 15 W | TDP 17 W |
---|
100% | 97% |
...
AMD Ryzen 7 2700U
AMD Ryzen Embedded R1606G
Intel Core i3-8109U
Intel Core i5-8259U
Intel Core i5-8265U
Intel Core i5-1035G1
Intel Core i5-10310U
...
max:
Cinebench R20 - Cinebench R20 CPU (Single Core)
min: 375 avg: 377 median: 376 (42%) max: 380 Points
CPU TDP 15 W | TDP 17 W |
---|
100% | 100% |
...
Intel Core i5-6287U
AMD Ryzen 7 2700U
Intel Core i7-6567U
Intel Core i7-7700HQ
Apple M2
Intel Core i5-8259U
Intel Core i5-8265U
Intel Core i5-8400H
Intel Core i5-8260U
...
max:
Cinebench R20 - Cinebench R20 CPU (Multi Core)
min: 1855 avg: 1943 median: 1976 (5%) max: 1998 Points
CPU TDP 15 W | TDP 17 W |
---|
96% | 100% |
...
Intel Core i7-7700HQ
Intel Core i5-8400H
Intel Core i5-1230U
Intel Core i7-8705G
Intel Core i5-1038NG7
Intel Core i7-8809G
Apple M1
...
max:
Cinebench R15 - Cinebench R15 CPU Multi 64 Bit
min: 828 avg: 845 median: 829 (5%) max: 878 Points
CPU TDP 15 W | TDP 17 W |
---|
94% | 100% |
...
Intel Core i7-8559U
Intel Core i5-9400H
Intel Core i7-8809G
...
max:
Maxtang MTN-ALN50: Ø796 (767.84-856.33)
Acer Aspire Go 15 AG15-31P-34JP: Ø733 (725.02-829.14)
Asus BR1402FG: Ø805 (794.06-878.19)
Cinebench R15 - Cinebench R15 CPU Single 64 Bit
min: 163.6 avg: 165.1 median: 164.7 (50%) max: 167 Points
CPU TDP 15 W | TDP 17 W |
---|
100% | 100% |
...
Intel Core i7-7820HQ
Intel Core i5-1035G4
Intel Core i5-1035G1
Intel Core i7-8650U
Intel Core i5-1035G7
AMD Ryzen 7 3780U
Intel Core i5-8365U
Intel Core i5-8279U
Intel Core i5-1038NG7
Intel Core i5-10310U
...
max:
Cinebench R11.5 - Cinebench R11.5 CPU Multi 64 Bit
min: 10.6 avg: 11.3 median: 11.3 (15%) max: 12.05 Points
CPU TDP 15 W | TDP 17 W |
---|
88% | 100% |
...
Intel Core i7-11390H
Intel Xeon E-2176M
Intel Core i7-8850H
...
max:
Cinebench R11.5 - Cinebench R11.5 CPU Single 64 Bit
min: 2.04 avg: 2 median: 2 (51%) max: 2.05 Points
CPU TDP 15 W | TDP 17 W |
---|
100% | 100% |
...
Intel Core i7-8809G
Intel Core i5-1038NG7
Intel Core i5-1035G4
Intel Core i7-8850H
Intel Xeon E-2176M
Intel Core i7-9750H
Intel Core i7-1065G7
...
max:
Cinebench R10 - Cinebench R10 Rend. Single (32bit)
min: 5622 avg: 5651 median: 5651 (34%) max: 5680 points
CPU TDP 15 W | TDP 17 W |
---|
99% | 100% |
...
Intel Core i5-7300U
Intel Core i7-6770HQ
Intel Xeon E3-1505M v5
Intel Core i7-6567U
Intel Core i5-8259U
Intel Core i7-4980HQ
Intel Xeon E3-1535M v5
...
max:
Cinebench R10 - Cinebench R10 Rend. Multi (32bit)
min: 25813 avg: 26169 median: 26168.5 (19%) max: 26524 points
CPU TDP 15 W | TDP 17 W |
---|
97% | 100% |
...
Intel Core i7-8809G
Intel Core i7-11390H
...
max:
Cinebench R10 - Cinebench R10 Rend. Multi (64bit)
min: 39133 avg: 39930 median: 39929.5 (28%) max: 40726 Points
CPU TDP 15 W | TDP 17 W |
---|
96% | 100% |
...
Intel Core i7-11390H
Intel Core i7-9750H
Intel Core i9-8950HK
...
max:
Cinebench R10 - Cinebench R10 Rend. Single (64bit)
min: 8648 avg: 8708 median: 8708 (11%) max: 8768 Points
CPU TDP 15 W | TDP 17 W |
---|
100% | 99% |
...
Intel Core i5-1035G7
Intel Xeon E3-1535M v6
Intel Core i7-9750H
Intel Core i5-1035G1
Intel Core i9-8950HK
...
max:
wPrime 2.10 - wPrime 2.0 1024m *
min: 246.308 avg: 1175 median: 1174.7 (14%) max: 2103.1 s
CPU TDP 15 W | TDP 17 W |
---|
129% | 100% |
...
Intel Core i3-2375M
AMD Turion X2 Ultra ZM-85
Intel Core i3-2365M
AMD Athlon II P320
Intel Atom x5-E8000
Intel Core 2 Duo T6570
Intel Core 2 Duo T6500
AMD Athlon II M320
AMD Turion X2 RM-75
Intel Pentium Dual Core T4400
Intel Core i3-2367M
Intel Celeron 3865U
Intel Celeron Dual-Core T3500
Intel Core 2 Duo P7450
AMD Athlon II M300
AMD Athlon X2 QL-65
...
VIA C3-M C3-M-1200
wPrime 2.10 - wPrime 2.0 32m *
min: 8.142 avg: 35.8 median: 35.8 (7%) max: 63.4 s
CPU TDP 15 W | TDP 17 W |
---|
113% | 100% |
...
AMD Athlon II P340
Intel Pentium B950
AMD Turion X2 Ultra ZM-86
AMD A10-5745M
Intel Core i5-520UM
AMD A6-9220e
Intel Core i7-820QM
Intel Core i3-4020Y
Intel Core 2 Duo P7550
Intel Pentium Dual Core T4500
Intel Core i3-2377M
Intel Pentium P6000
AMD E2-9000
Intel Atom x5-Z8300
AMD Turion X2 Ultra ZM-85
...
Transmeta Crusoe TM-5800
min: 3300 avg: 3377 median: 3377 (5%) max: 3454 points
CPU TDP 15 W | TDP 17 W |
---|
96% | 100% |
...
Intel Core i5-6267U
Intel Core i5-8365U
Intel Core i5-4210M
Intel Core i5-3230M
Intel Core i5-7267U
Intel Core i5-3437U
Intel Core i5-7360U
Intel Core i7-3615QM
...
max:
7-Zip 18.03 - 7-Zip 18.03 Multli Thread 4 runs
min: 21080 avg: 21623 median: 21239 (12%) max: 22551 MIPS
CPU TDP 15 W | TDP 17 W |
---|
94% | 100% |
...
Intel Core i5-8259U
Intel Core i7-7700HQ
Intel Core i5-8400H
Intel Core i5-1230U
Intel Core i5-8279U
...
max:
7-Zip 18.03 - 7-Zip 18.03 Single Thread 4 runs
min: 3871 avg: 4033 median: 4105 (49%) max: 4123 MIPS
CPU TDP 15 W | TDP 17 W |
---|
97% | 100% |
...
Intel Core i5-6287U
Intel Core i3-8109U
Intel Core i7-2860QM
Intel Core i5-8259U
Intel Core i5-8265U
Intel Core i5-8260U
Intel Core i5-1035G1
Intel Core i7-8809G
AMD Ryzen 5 PRO 2500U
...
max:
X264 HD Benchmark 4.0 - x264 Pass 2
min: 55.6 avg: 55.9 median: 55.9 (20%) max: 56.2 fps
CPU TDP 15 W | TDP 17 W |
---|
99% | 100% |
...
Intel Core i7-8706G
Intel Core i7-8705G
Intel Core i7-8809G
Intel Core i7-11390H
Intel Xeon E-2176M
Intel Core i5-11500B
...
max:
X264 HD Benchmark 4.0 - x264 Pass 1
min: 201.6 avg: 202.6 median: 202.6 (47%) max: 203.5 fps
CPU TDP 15 W | TDP 17 W |
---|
100% | 99% |
...
Intel Core i7-8809G
Intel Xeon E-2176M
Intel Core i7-9750H
Intel Core i7-8850H
...
max:
HWBOT x265 Benchmark v2.2 - HWBOT x265 4k Preset
min: 5.41 avg: 5.5 median: 5.6 (10%) max: 5.62 fps
CPU TDP 15 W | TDP 17 W |
---|
99% | 100% |
...
Intel Core i5-1035G7
Intel Core i5-8259U
Intel Core i7-8559U
Intel Core i5-1230U
Intel Core i5-1038NG7
Intel Core i5-8279U
...
max:
Acer Aspire Go 15 AG15-31P-34JP: Ø5.61 (0.24-8.23)
Asus BR1402FG: Ø5.69 (0.23-7.87)
Maxtang MTN-ALN50: Ø5.93 (0.65-9.9)
TrueCrypt - TrueCrypt Serpent
min: 0.52 avg: 0.5 median: 0.5 (0%) max: 0.539 GB/s
CPU TDP 15 W | TDP 17 W |
---|
100% | 96% |
...
Intel Core i7-8559U
Intel Core i7-8809G
Intel Core i7-11390H
...
max:
TrueCrypt - TrueCrypt Twofish
min: 1 avg: 1.1 median: 1.1 (18%) max: 1.1 GB/s
CPU TDP 15 W | TDP 17 W |
---|
100% | 91% |
...
Intel Xeon E-2176M
Intel Core i7-8850H
Intel Core i9-8950HK
...
max:
TrueCrypt - TrueCrypt AES
min: 5.1 avg: 5.5 median: 5.5 (14%) max: 5.9 GB/s
CPU TDP 15 W | TDP 17 W |
---|
100% | 86% |
...
Intel Core i7-8559U
Intel Core i7-11390H
...
max:
Blender - Blender 3.3 Classroom CPU *
min: 1152 avg: 1199 median: 1198.5 (15%) max: 1245 Seconds
...
Intel Core i7-11390H
Intel Core i5-8400H
Intel Core i5-8259U
Intel Core i5-8260U
Intel Core i5-1230U
Intel Core i5-8265U
...
Intel Celeron J4125
Blender - Blender 2.79 BMW27 CPU *
min: 583 avg: 598 median: 589 (4%) max: 622 Seconds
CPU TDP 15 W | TDP 17 W |
---|
100% | 100% |
...
Intel Core i7-11390H
Apple M1
Intel Core i5-8400H
Apple M2
Intel Core i7-8706G
Intel Core i5-8279U
Intel Core i7-7700HQ
...
AMD E1-2100
R Benchmark 2.5 - R Benchmark 2.5 *
min: 0.766 avg: 0.8 median: 0.8 (17%) max: 0.786 sec
CPU TDP 15 W | TDP 17 W |
---|
100% | 100% |
...
Intel Core i5-1035G4
AMD Ryzen 3 3300U
Intel Core i5-6287U
AMD Ryzen Embedded V1605B
AMD Ryzen Embedded R1606G
Intel Core i5-8259U
Intel Core i5-1035G7
AMD Ryzen 7 2700U
Intel Core i7-5557U
...
AMD E1-2100
3DMark 06 - CPU - 3DMark 06 - CPU
9081 Points (19%)
...
Intel Core i5-1035G7
Intel Core i5-8279U
Intel Core i7-8809G
Intel Xeon E-2176M
Intel Core i7-1065G7
Intel Core i7-1265U
Intel Core i7-8850H
...
max:
Super Pi mod 1.5 XS 1M - Super Pi mod 1.5 XS 1M *
min: 17.549 avg: 17.8 median: 17.8 (4%) max: 18 s
CPU TDP 15 W | TDP 17 W |
---|
100% | 100% |
...
Intel Core i5-430M
Intel Celeron 2970M
Intel Core 2 Duo T9500
Intel Core i3-2330M
Intel Core 2 Duo T9300
Intel Pentium B970
Intel Core i3-2328M
Intel Core 2 Duo P9500
Intel Core 2 Extreme QX9300
Intel Core 2 Duo SP9600
Intel Core 2 Duo SP9400
Intel Core 2 Duo T9400
Intel Core i3-370M
...
VIA C3-M C3-M-1200
Super Pi mod 1.5 XS 2M - Super Pi mod 1.5 XS 2M *
36.5 s (2%)
...
Intel Core M-5Y51
Intel Core m5-6Y54
Intel Core i3-4000M
Intel Core i3-3110M
Intel Core i7-720QM
Intel Core i5-480M
Intel Core i5-540M
Intel Core M-5Y31
Intel Core i5-4300Y
Intel Core i7-640LM
Intel Core 2 Duo T9900
Intel Core i5-460M
Intel Pentium Gold 4415U
Intel Core i3-2370M
Intel Core i3-6100U
Intel Core 2 Duo T9800
...
Intel Celeron Dual-Core T1400
Super Pi Mod 1.5 XS 32M - Super Pi mod 1.5 XS 32M *
min: 744.681 avg: 758 median: 758.3 (3%) max: 772 s
CPU TDP 15 W | TDP 17 W |
---|
100% | 100% |
...
Intel Core m5-6Y57
Intel Core i5-4200U
Intel Core i7-2657M
Intel Core i5-3427U
Intel Core i7-2637M
Intel Core i5-1038NG7
Intel Core i5-2410M
Intel Core i7-2677M
Intel Core i3-7100U
Intel Core i5-2557M
Intel Core i5-4250U
Intel Core i5-3337U
Intel Core i5-580M
Intel Core i7-620M
...
VIA C3-M C3-M-1200
3DMark Vantage - 3DM Vant. Perf. CPU no Physx
min: 28884 avg: 28911 median: 28910.5 (25%) max: 28937 Points
CPU TDP 15 W | TDP 17 W |
---|
100% | 100% |
...
Intel Core i5-1035G4
Intel Core i7-3940XM
Intel Core i7-1065G7
Intel Xeon E3-1505M v5
Intel Core i7-7820HQ
Intel Xeon E3-1535M v5
Intel Xeon E3-1535M v6
Intel Core i7-11390H
...
max:
3DMark 11 - 3DM11 Performance Physics
min: 8651 avg: 8896 median: 8926 (24%) max: 9111 Points
CPU TDP 15 W | TDP 17 W |
---|
100% | 96% |
...
Intel Core i7-7700HQ
Intel Core i7-3940XM
Intel Core i7-4870HQ
Intel Core i7-8705G
Intel Core i7-3820QM
Intel Core i7-7820HQ
Intel Xeon E3-1505M v5
Intel Core i7-8559U
Intel Core i7-6770HQ
...
max:
3DMark - 3DMark Ice Storm Physics
55544 Points (45%)
...
Intel Core i7-8559U
Intel Core i7-8809G
Intel Core i7-9750H
Intel Core i7-8850H
...
max:
3DMark - 3DMark Ice Storm Extreme Physics
56367 Points (46%)
...
Intel Core i7-8850H
Intel Core i3-1115G4
Intel Core i7-8809G
Intel Core i7-9750H
...
max:
3DMark - 3DMark Ice Storm Unlimited Physics
61854 Points (52%)
...
Intel Core i7-9750H
Intel Xeon E-2176M
Intel Core i5-10310U
Intel Core i9-9980HK
...
max:
3DMark - 3DMark Cloud Gate Physics
min: 8263 avg: 8470 median: 8567 (22%) max: 8580 Points
CPU TDP 15 W | TDP 17 W |
---|
98% | 100% |
...
Intel Xeon E3-1535M v5
Intel Xeon E3-1535M v6
Intel Xeon E-2176M
Intel Core i7-8809G
Intel Core i7-11390H
unknown
...
max:
3DMark - 3DMark Fire Strike Standard Physics
min: 11357 avg: 11598 median: 11625 (21%) max: 11813 Points
CPU TDP 15 W | TDP 17 W |
---|
100% | 100% |
...
Intel Core i7-8706G
Intel Xeon E3-1535M v6
Intel Core i7-11390H
Intel Core i5-1230U
Intel Core i7-8809G
...
max:
3DMark - 3DMark Time Spy CPU
min: 3455 avg: 3514 median: 3493 (15%) max: 3593 Points
CPU TDP 15 W | TDP 17 W |
---|
100% | 99% |
...
Intel Core i5-1035G1
Intel Core i7-1065G7
Intel Core i5-8279U
Intel Core i7-8705G
Intel Core i5-1038NG7
Intel Core i5-1035G7
Intel Core i7-8559U
...
max:
Geekbench 6.2 - Geekbench 6.2 Single-Core
min: 1304 avg: 1316 median: 1318 (40%) max: 1326 points
CPU TDP 15 W | TDP 17 W |
---|
99% | 100% |
...
Intel Pentium B970
Intel Core i5-8400H
AMD Ryzen 5 5560U
...
Geekbench 6.2 - Geekbench 6.2 Multi-Core
min: 4632 avg: 4798 median: 4727 (19%) max: 5034 points
CPU TDP 15 W | TDP 17 W |
---|
100% | 95% |
...
Intel Core i5-8400H
Intel Core i7-11390H
...
max:
Geekbench 5.5 - Geekbench 5.1 - 5.4 64 Bit Single-Core
min: 1050 avg: 1068 median: 1071 (45%) max: 1083 points
CPU TDP 15 W | TDP 17 W |
---|
100% | 100% |
...
Intel Core i5-8265U
Intel Core i7-8705G
Intel Core i7-8557U
Intel Core i9-8950HK
...
Geekbench 5.5 - Geekbench 5.1 - 5.4 64 Bit Multi-Core
min: 4492 avg: 4680 median: 4644 (8%) max: 4905 points
CPU TDP 15 W | TDP 17 W |
---|
100% | 94% |
...
Intel Core i5-8400H
Intel Core i7-1068G7
Intel Core i5-1038NG7
Intel Core i7-8850H
Intel Core i9-8950HK
...
max:
Geekbench 5.0 - Geekbench 5.0 64 Bit Single-Core
min: 1006 avg: 1044 median: 1053 (5%) max: 1072 points
CPU TDP 15 W | TDP 17 W |
---|
100% | 95% |
...
Intel Core i3-8145U
Intel Core i7-8850H
Intel Core i5-8265U
Intel Core i7-7700HQ
Intel Core i5-10310U
Intel Xeon E3-1575M v5
Intel Core i7-8705G
Intel Core i5-1035G1
...
max:
Geekbench 5.0 - Geekbench 5.0 64 Bit Multi-Core
min: 4218 avg: 4496 median: 4497 (14%) max: 4774 points
CPU TDP 15 W | TDP 17 W |
---|
100% | 91% |
...
Intel Core i5-1035G4
Intel Core i5-8400H
Intel Core i7-1065G7
Intel Core i7-8559U
Intel Core i7-8850H
Intel Core i7-11390H
AMD Ryzen 5 PRO 5675U
...
max:
AMD Ryzen Threadripper PRO 3995WX
Geekbench 4.4 - Geekbench 4.1 - 4.4 64 Bit Single-Core
min: 4469 avg: 4633 median: 4632.5 (46%) max: 4796 points
CPU TDP 15 W | TDP 17 W |
---|
100% | 93% |
...
Intel Core i3-8109U
Intel Core i5-8200Y
Intel Core i7-7700HQ
Intel Xeon E-2176M
Intel Core i7-7660U
Intel Core i5-10310U
...
max:
Geekbench 4.4 - Geekbench 4.1 - 4.4 64 Bit Multi-Core
min: 16566 avg: 17128 median: 17128 (19%) max: 17690 points
CPU TDP 15 W | TDP 17 W |
---|
100% | 94% |
...
Intel Core i5-1035G7
Intel Core i7-8705G
Intel Core i7-8706G
Intel Core i5-1034G1
Intel Core i7-8809G
Intel Core i5-1035G4
Intel Core i5-8279U
Intel Core i7-1065G7
Intel Core i7-8559U
...
max:
Mozilla Kraken 1.1 - Kraken 1.1 Total Score *
min: 981 avg: 986 median: 984 (1%) max: 993 ms
CPU TDP 15 W | TDP 17 W |
---|
100% | 100% |
...
Intel Core i7-7820HQ
Intel Core i5-1035G7
Intel Core i7-7700HQ
Intel Core i5-8400H
Intel Core i7-7560U
Intel Core i5-10310U
...
AMD A4-1250
max:
Apple S7
WebXPRT 4 - WebXPRT 4 Score
min: 140.3 avg: 158.2 median: 145.3 (42%) max: 189 Points
CPU TDP 15 W | TDP 17 W |
---|
76% | 100% |
...
Intel Core i5-8265U
Intel Core i3-1115G4
Intel Core i5-8400H
Apple M1
...
max:
WebXPRT 3 - WebXPRT 3 Score
min: 179.4 avg: 185.1 median: 185.4 (39%) max: 190.4 Points
CPU TDP 15 W | TDP 17 W |
---|
100% | 100% |
...
Intel Core i5-8259U
Intel Core i5-1035G4
Intel Core i5-1038NG7
Intel Core i5-1035G1
Intel Core i5-8350U
Intel Core i5-1035G7
Intel Core i5-8265U
Intel Core i5-10310U
...
CrossMark - CrossMark Overall
min: 881 avg: 907 median: 881 (34%) max: 958 Points
CPU TDP 15 W | TDP 17 W |
---|
100% | 96% |
...
Intel Core i5-8260U
Intel Core i7-8850H
Intel Core i5-8259U
Intel Core i5-8265U
Intel Core i7-1065G7
...
max:
Power Consumption - Prime95 Power Consumption - external Monitor *
min: 22.9 avg: 27.6 median: 25.5 (4%) max: 34.5 Watt
CPU TDP 15 W | TDP 17 W |
---|
100% | 101% |
...
Intel Core i5-1230U
AMD A4-5000
Intel Core i5-1035G4
Intel Core i5-7200U
Intel Core i7-6600U
Intel Core i7-2637M
Intel Core i5-1035G1
Intel Core i7-1065G7
...
max:
AMD Ryzen Threadripper PRO 3975WX
Acer Aspire Go 15 AG15-31P-34JP: Ø22.9 (19.9-40.4)
Asus BR1402FG: Ø25.5 (23.8-34.3)
Maxtang MTN-ALN50: Ø34.5 (31-47.3)
Power Consumption - Cinebench R15 Multi Power Consumption - external Monitor *
36.9 Watt (7%)
...
Intel Core i7-1065G7
AMD Ryzen 5 5560U
Intel Core i5-7360U
Intel Core i3-1115G4
Intel Core i5-1230U
...
max:
Maxtang MTN-ALN50: Ø36.9 (30.3-42.2)
Power Consumption - Idle Power Consumption - external Monitor *
min: 3.01 avg: 4.6 median: 3.5 (2%) max: 7.2 Watt
CPU TDP 15 W | TDP 17 W |
---|
100% | 102% |
...
AMD Ryzen 5 5560U
...
max:
Asus BR1402FG: Ø3.01 (2.56-4.98)
Acer Aspire Go 15 AG15-31P-34JP: Ø3.52 (2.84-4.89)
Maxtang MTN-ALN50: Ø7.16 (7.03-7.64)
Power Consumption - Idle Power Consumption 150cd 1min *
min: 5.18 avg: 5.5 median: 5.5 (6%) max: 5.76 Watt
CPU TDP 15 W | TDP 17 W |
---|
100% | 101% |
...
Intel Core i7-1065G7
AMD 3015Ce
Intel Core i3-1115G4
...
max:
Asus BR1402FG: Ø5.18 (4.61-8.97)
Acer Aspire Go 15 AG15-31P-34JP: Ø5.76 (5.06-6.84)
Power Consumption - Cinebench R15 Multi Power Efficiency - external Monitor
22.4 Points per Watt (17%)
...
Intel Core i5-1035G1
...
- Range of benchmark values for this graphics card
- Average benchmark values for this graphics card
* Smaller numbers mean a higher performance
v1.26
log 26. 02:55:46
#0 no ids found in url (should be separated by "_") +0s ... 0s
#1 not redirecting to Ajax server +0s ... 0s
#2 did not recreate cache, as it is less than 5 days old! Created at Thu, 25 Apr 2024 05:38:32 +0200 +0.001s ... 0.001s
#3 no comparison url found in template nbc.compare_page_2 needed +0.01s ... 0.011s
#4 no comparison url found in template nbc.compare_page_2 needed +0s ... 0.011s
#5 no comparison url found in template nbc.compare_page_2 needed +0s ... 0.011s
#6 no comparison url found in template nbc.compare_page_2 needed +0s ... 0.011s
#7 no comparison url found in template nbc.compare_page_2 needed +0s ... 0.012s
#8 no comparison url found in template nbc.compare_page_2 needed +0s ... 0.012s
#9 composed specs +0.001s ... 0.012s
#10 did output specs +0s ... 0.012s
#11 getting avg benchmarks for device 14926 +0.013s ... 0.025s
#12 got single benchmarks 14926 +0.019s ... 0.044s
#13 got avg benchmarks for devices +0s ... 0.044s
#14 min, max, avg, median took s +1.008s ... 1.052s
#15 no comparison url found in template nbc.compare_page_2 needed +0s ... 1.052s
#16 return log +0s ... 1.052s
Reviews for the Intel Core i3-N305 processor
宏碁 Aspire Go 15 评测:运行时间长的办公笔记本,售价 429 欧元
Alder Lake 处理器、8 GB 内存、512 GB 固态硬盘和全高清面板,造就了这款预算不高的简约办公笔记本电脑。出色的电池续航时间和 USB-C Power Delivery 使 15.6 英寸笔记本电脑更具吸引力。不过,风扇并不讨人喜欢。...
Intel Core i3-N305 | Intel UHD Graphics 32EUs (Alder Lake) | 15.60" | 1.7 kg
华硕 BR1402FG 学生笔记本电脑评测:坚固耐用,适合日常使用
新款华硕 BR1402FG 采用防刮康宁大猩猩玻璃和美国军用标准 MIL-STD 810H 认证,坚固耐用。再加上二合一设计和良好的可维修性,这款笔记本是日常学习生活的理想伴侣。 ...
Intel Core i3-N305 | Intel UHD Graphics 32EUs (Alder Lake) | 14.00" | 1.7 kg
迈腾 MTN-ALN50 微型电脑评测:非常经济的办公电脑,配备英特尔酷睿 i3-N305 和 8 核,性能卓越
凭借英特尔酷睿 i3-N305,Maxtang MTN-ALN50 的日常性能令人印象深刻。得益于主动散热装置,原生 8 核处理器无需人为降速。在这篇评测中,我们分析了傲腾 MTN-ALN50 在竞争中的表现以及性价比是否合适。...
Intel Core i3-N305 | Intel UHD Graphics 32EUs (Alder Lake) | | 685 gLenovo IdeaPad Slim 3 15IAN8: Intel UHD Graphics 32EUs (Alder Lake), 15.60", 1.6 kg
External Review » Lenovo IdeaPad Slim 3 15IAN8
Lenovo IdeaPad Slim Chrome 14IAN8 (Slim 3i Chromebook Plus): Intel UHD Graphics 32EUs (Alder Lake), 14.00", 1.5 kg
External Review » Lenovo IdeaPad Slim Chrome 14IAN8
HP Chromebook Plus 15at: Intel UHD Graphics 32EUs (Alder Lake), 15.60", 1.7 kg
External Review » HP Chromebook Plus 15at
Asus Vivobook Go 15 OLED E1504G: Intel UHD Graphics 32EUs (Alder Lake), 15.60", 1.6 kg
External Review » Asus Vivobook Go 15 OLED E1504G
Asus BR1402F: Intel UHD Graphics Xe 32EUs (Tiger Lake-H), 14.00", 1.6 kg
External Review » Asus BR1402F
Acer Aspire 3 Spin 14 A3SP14-31PT: Intel UHD Graphics Xe 32EUs (Tiger Lake-H), 14.00", 1.5 kg
External Review » Acer Aspire 3 Spin 14 A3SP14-31PT
Acer Aspire 3 A314-36M: Intel UHD Graphics Xe 32EUs (Tiger Lake-H), 14.00", 1.4 kg
External Review » Acer Aspire 3 A314-36M
Please share our article, every link counts!
Other CPUs of the series Alder Lake-N
Surrounding CPUs
+ Intel Core i7-7567U
2x 3.5 GHz - 4 GHz
+ AMD Ryzen 5 2600H
4x 3.2 GHz - 3.6 GHz
+ Intel Core i5-8260U
4x 1.6 GHz - 3.9 GHz
- Intel Core i5-1030G4
4x 0.7 GHz - 3.5 GHz
- Intel Core i3-1115G4
2x 3 GHz - 4.1 GHz
Klaus Hinum (Update: 2023-11-26)