戴尔XPS 15 9510酷睿i5笔记本电脑回顾。踩着刹车的基本款
我们知道戴尔XPS 15多年来一直是高质量的多媒体笔记本电脑,通常还配备了专用显卡。然而,戴尔也总是提供一个带有纯处理器图形的模型,以防你真的不需要快速显卡。但是,由于你必须支付1599欧元(约合1862美元)来购买酷睿i5-11400H,配备8GB内存、512GB PCIe固态硬盘和哑光FHD面板(16:10),所以该设备仍然不实惠。
也有一些没有专用GPU的竞争对手,他们的价格往往明显更高。随着新的 华为MateBook 16我们目前正在测试,已经有另一个竞争者开始了。关于机箱、输入设备和扬声器的详细信息,我们建议你参考我们对i7机型的评论。
Possible Competitors in Comparison
Rating | Date | Model | Weight | Height | Size | Resolution | Price |
|---|---|---|---|---|---|---|---|
| 84.2 % v7 (old) | 10 / 2021 | Dell XPS 15 9510 i5 11400H FHD i5-11400H, UHD Graphics Xe 16EUs | 1.8 kg | 18 mm | 15.60" | 1920x1200 | |
| 88.6 % v7 (old) | 10 / 2021 | Huawei MateBook 14s i7 i7-11370H, Iris Xe G7 96EUs | 1.4 kg | 16.7 mm | 14.20" | 2520x1680 | |
| 86.4 % v7 (old) | 10 / 2021 | Acer Swift 3 SF316-51 i7-11370H, Iris Xe G7 96EUs | 1.7 kg | 15.9 mm | 16.10" | 1920x1080 | |
| 87.7 % v7 (old) | 01 / 2021 | Schenker Vision 15 i7-1165G7, Iris Xe G7 96EUs | 1.7 kg | 15 mm | 15.60" | 1920x1080 | |
| 84.5 % v7 (old) | 09 / 2020 | Honor MagicBook Pro (AMD) R5 4600H, Vega 6 | 1.7 kg | 16.9 mm | 16.10" | 1920x1080 | |
| 86.8 % v7 (old) | 07 / 2020 | Dell XPS 15 9500 Core i5 i5-10300H, UHD Graphics 630 | 1.8 kg | 18 mm | 15.60" | 1920x1200 |
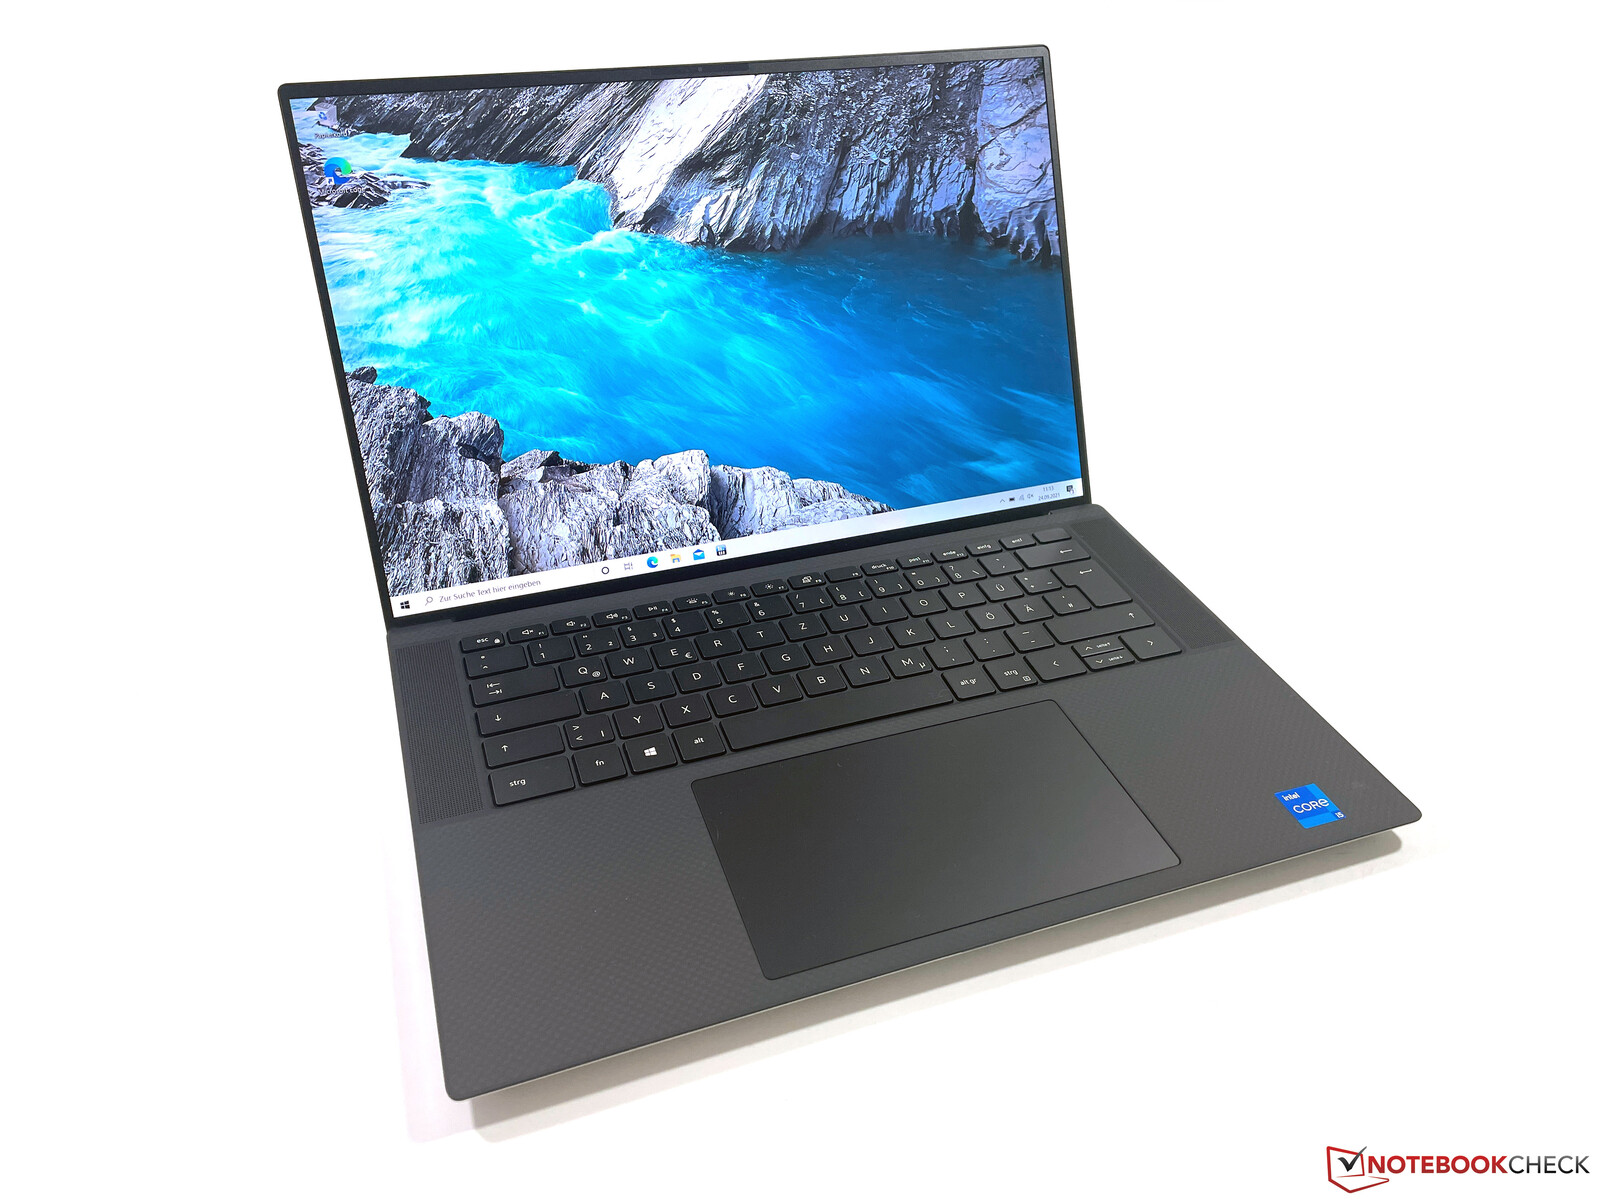
案例和设备
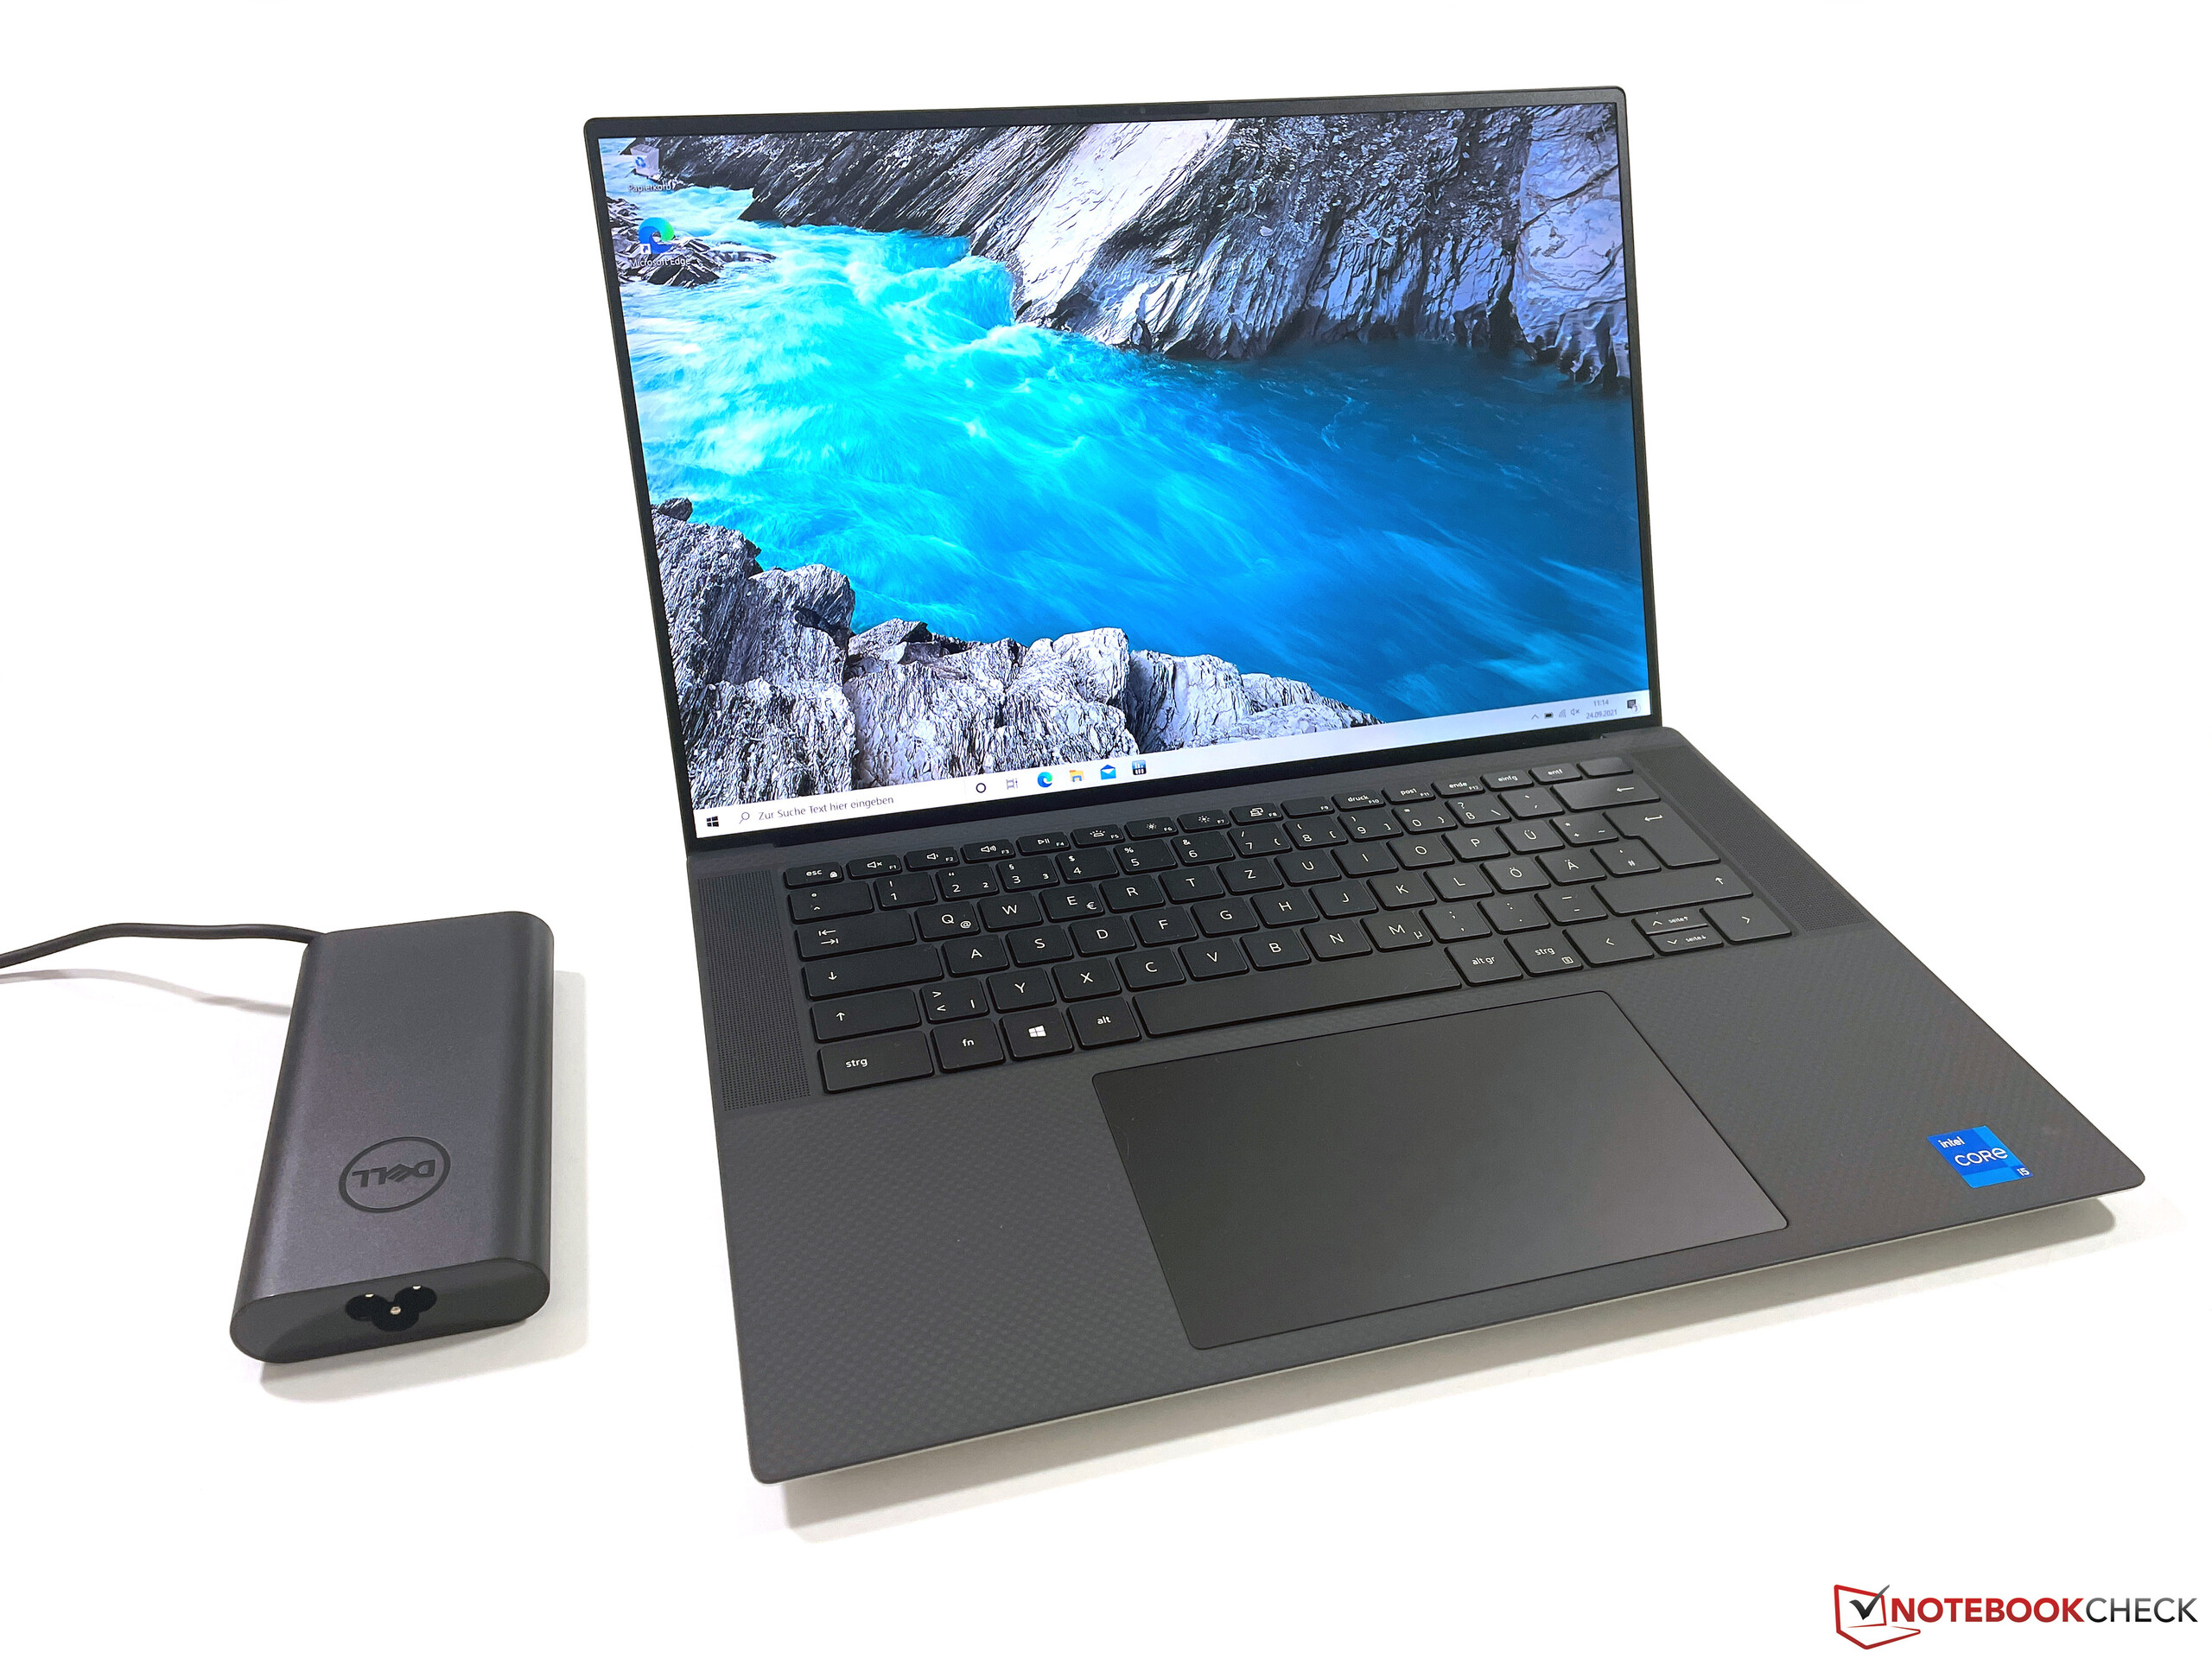
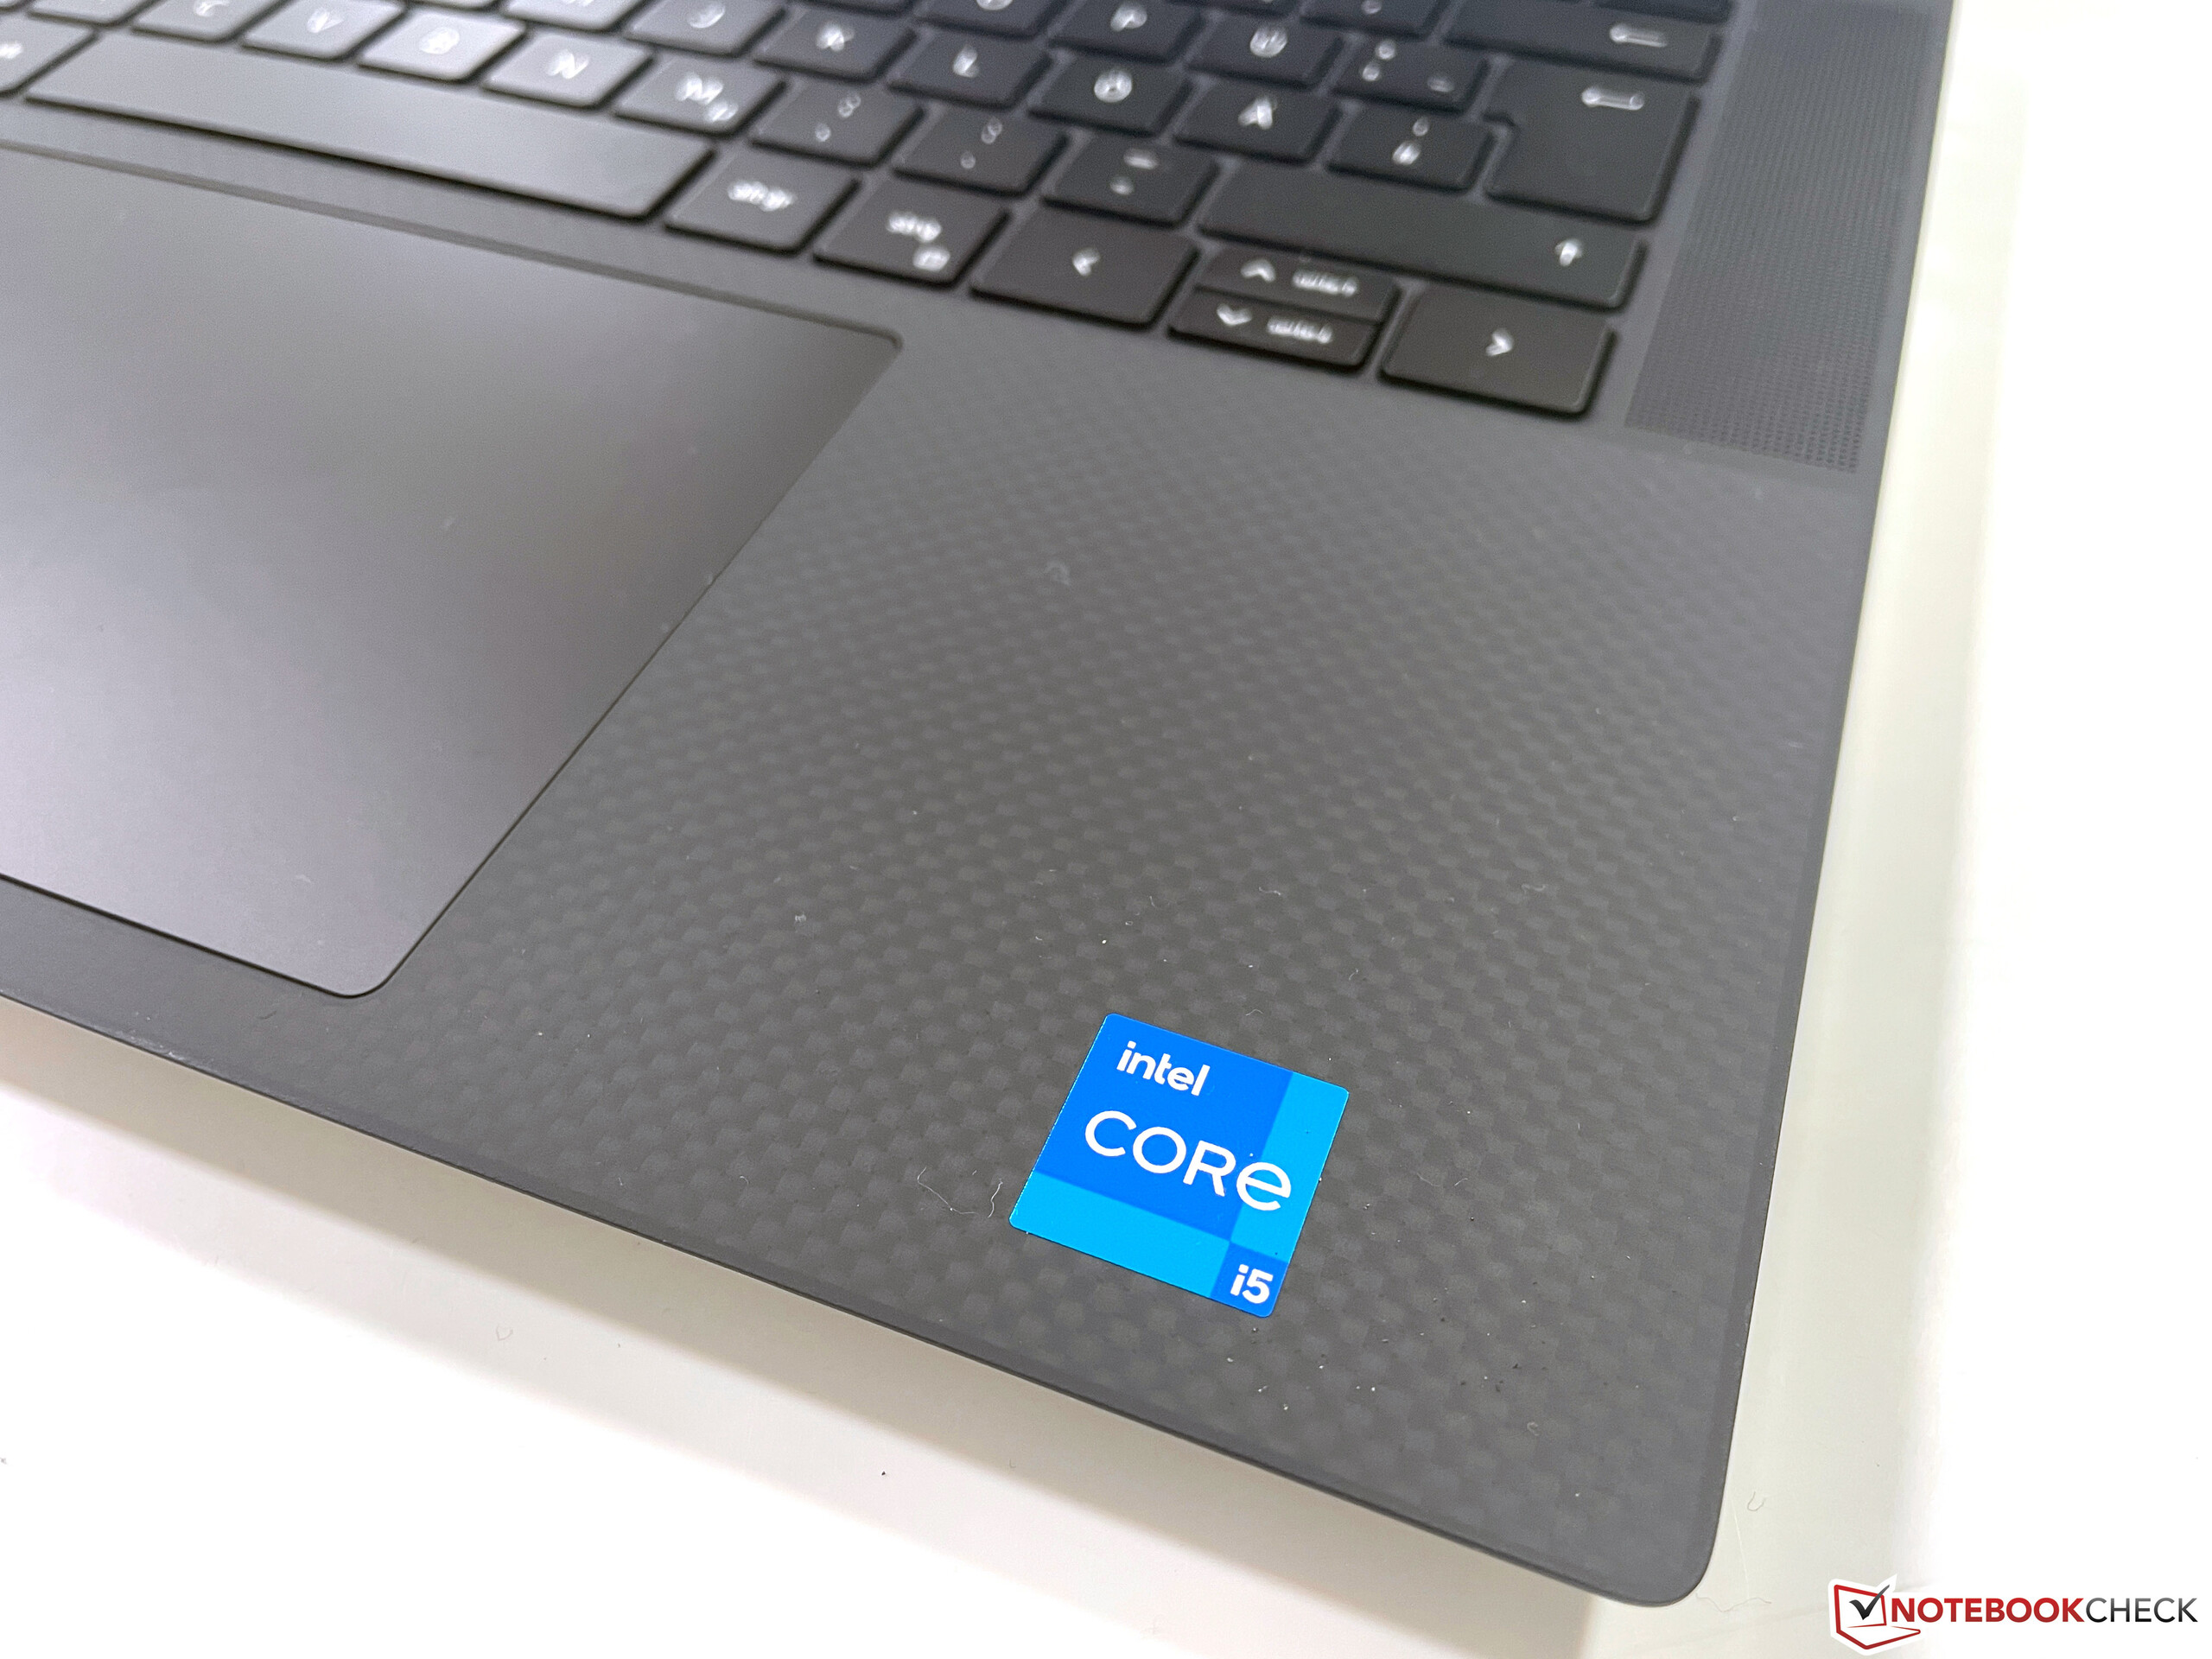
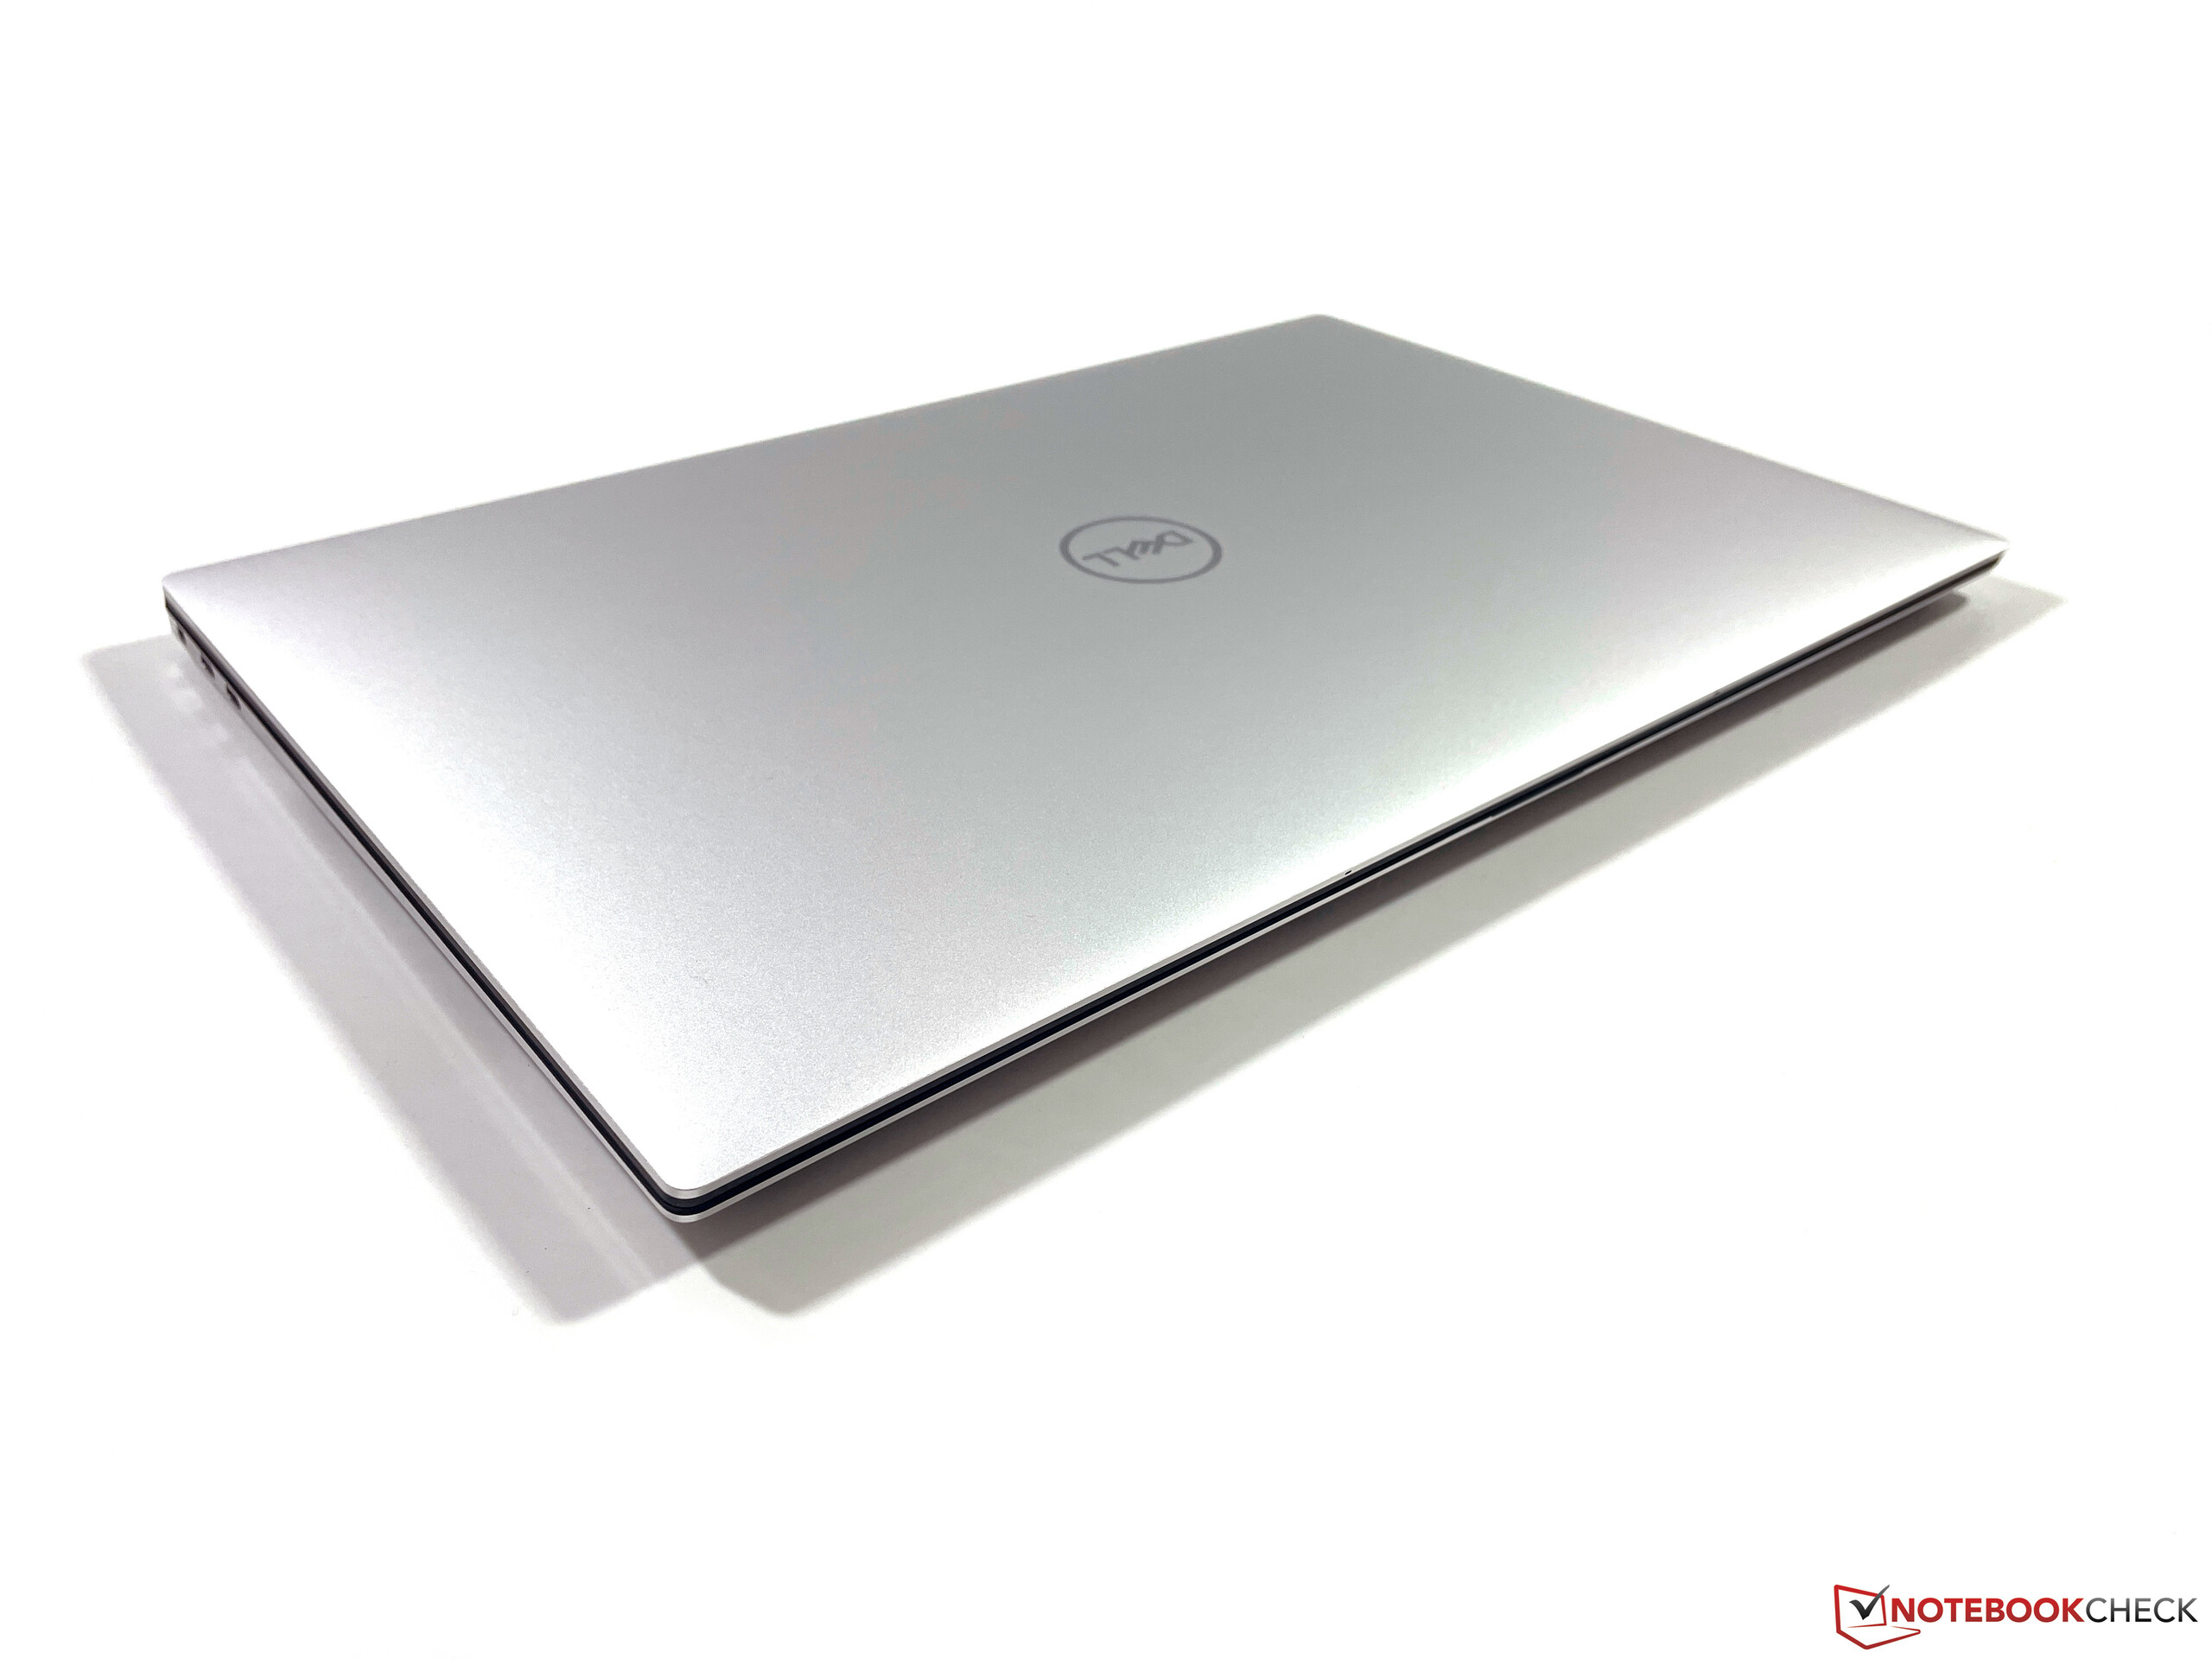
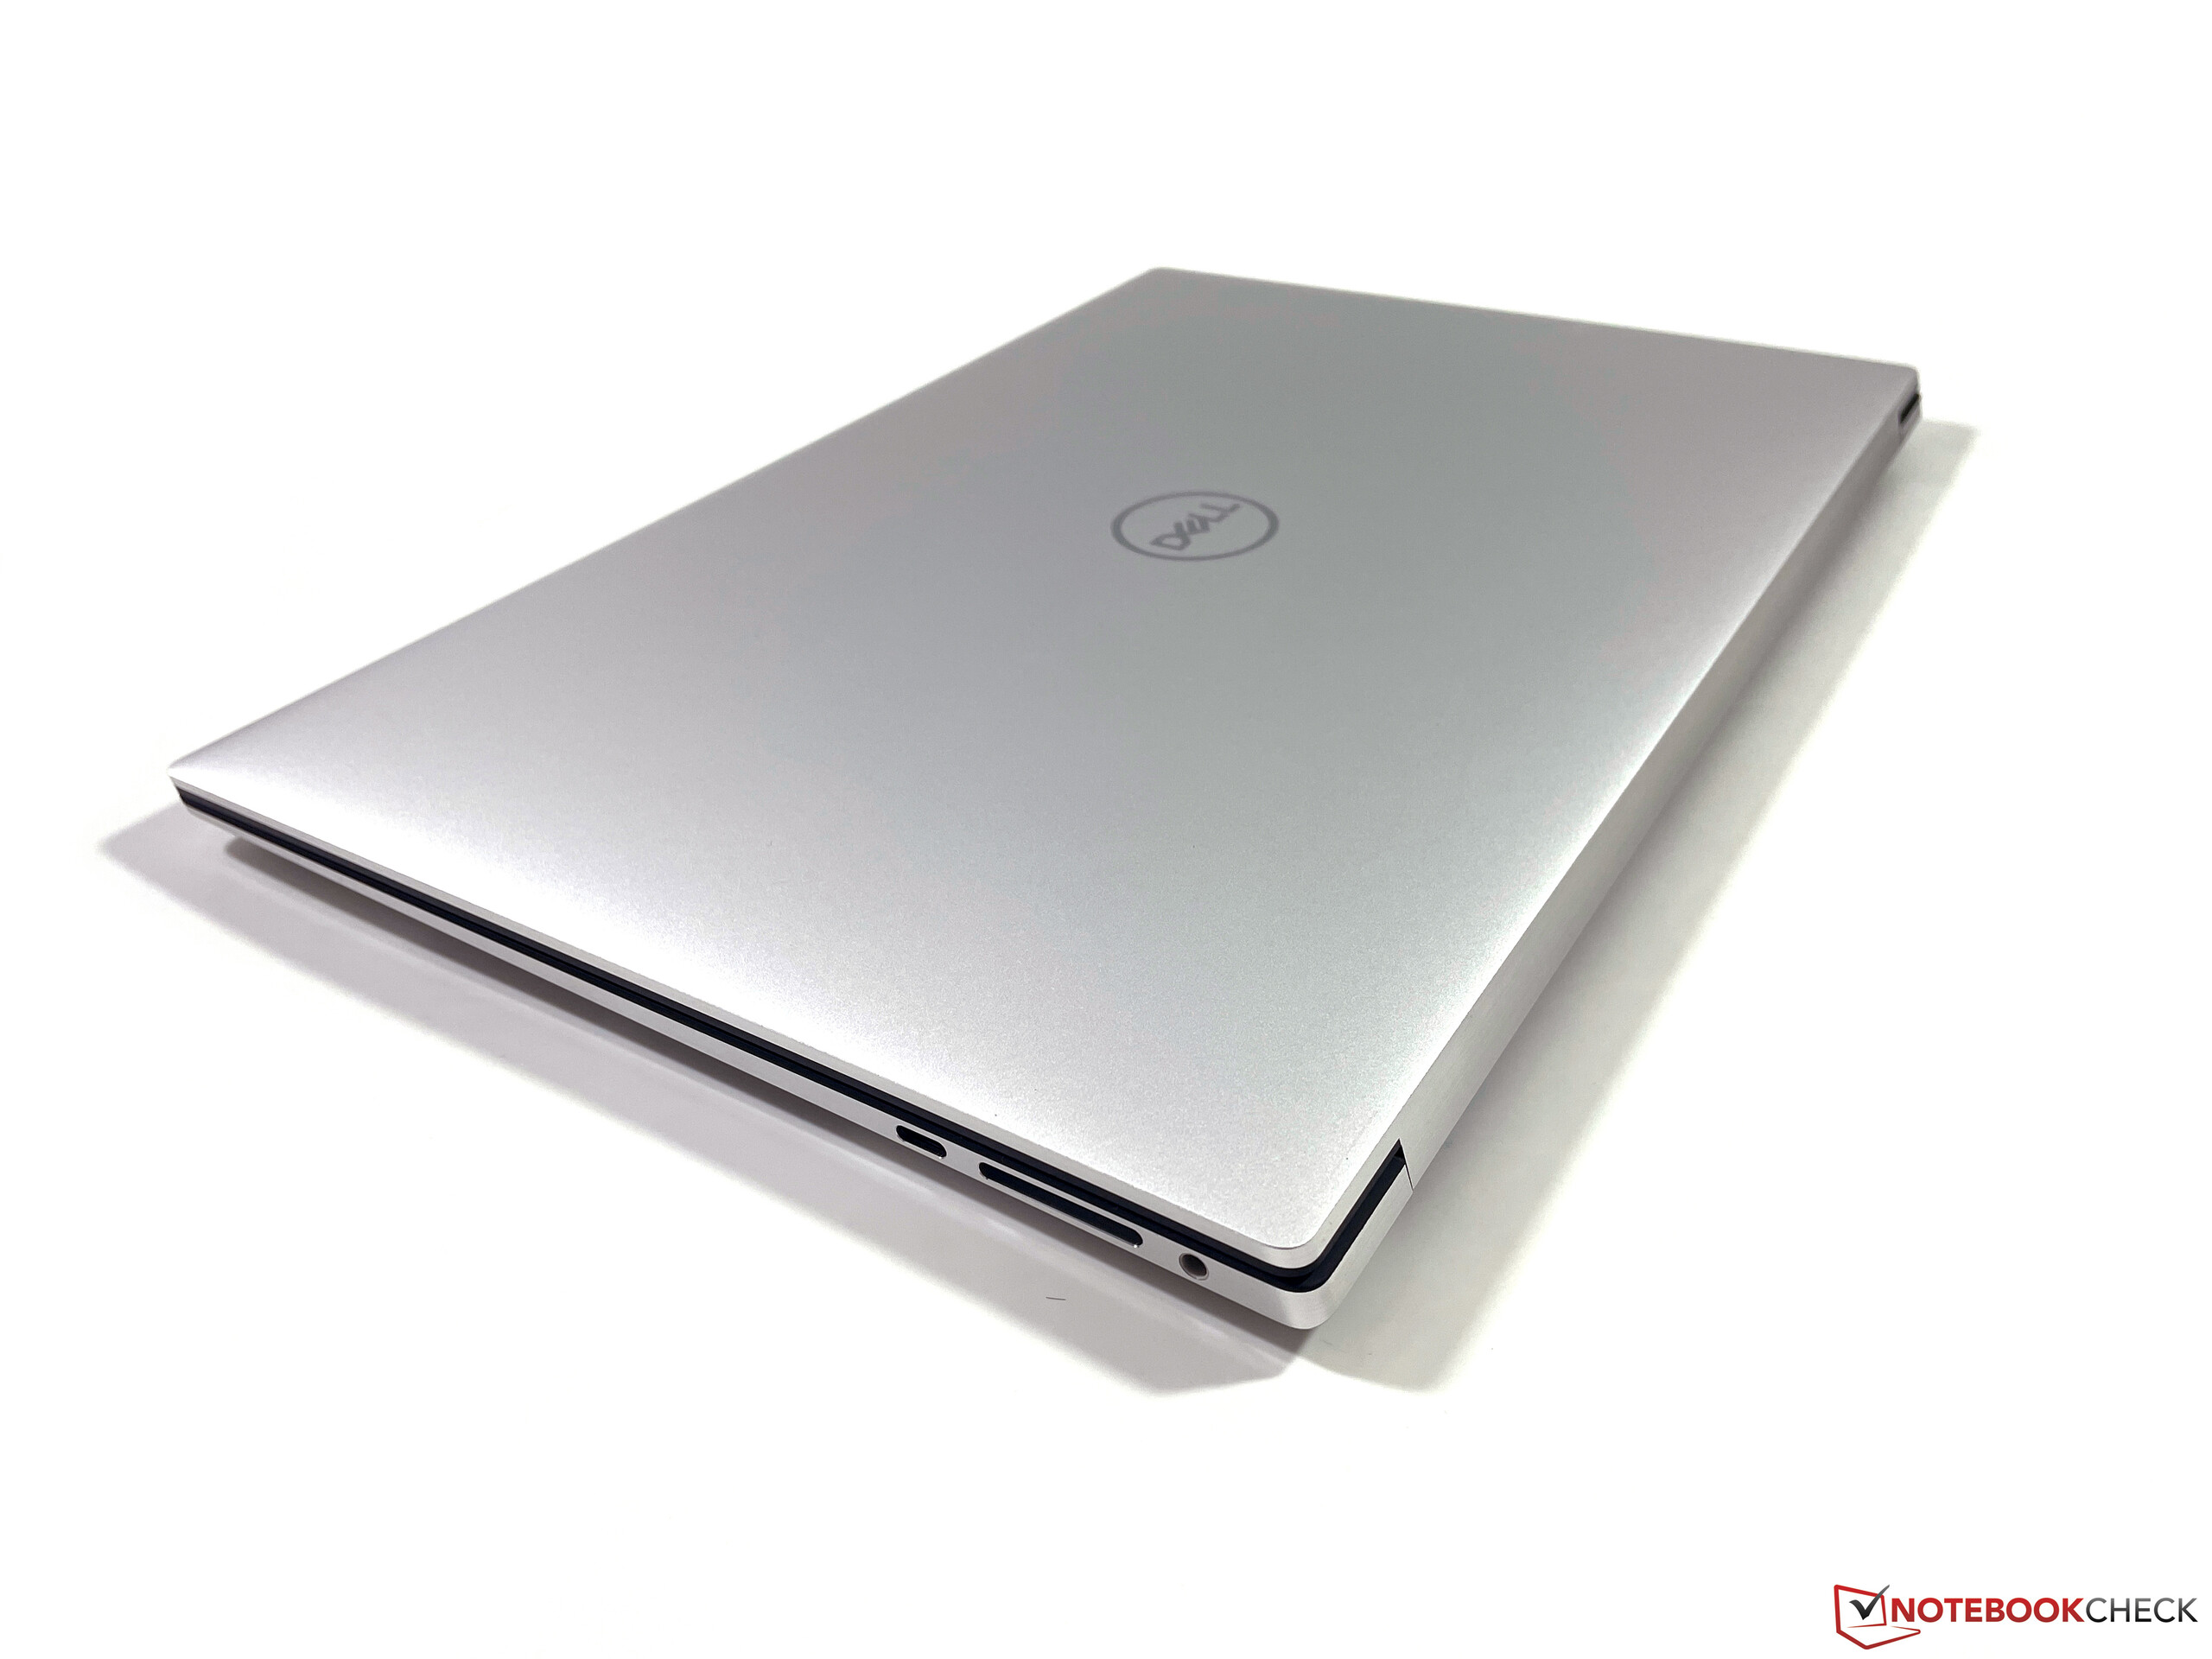
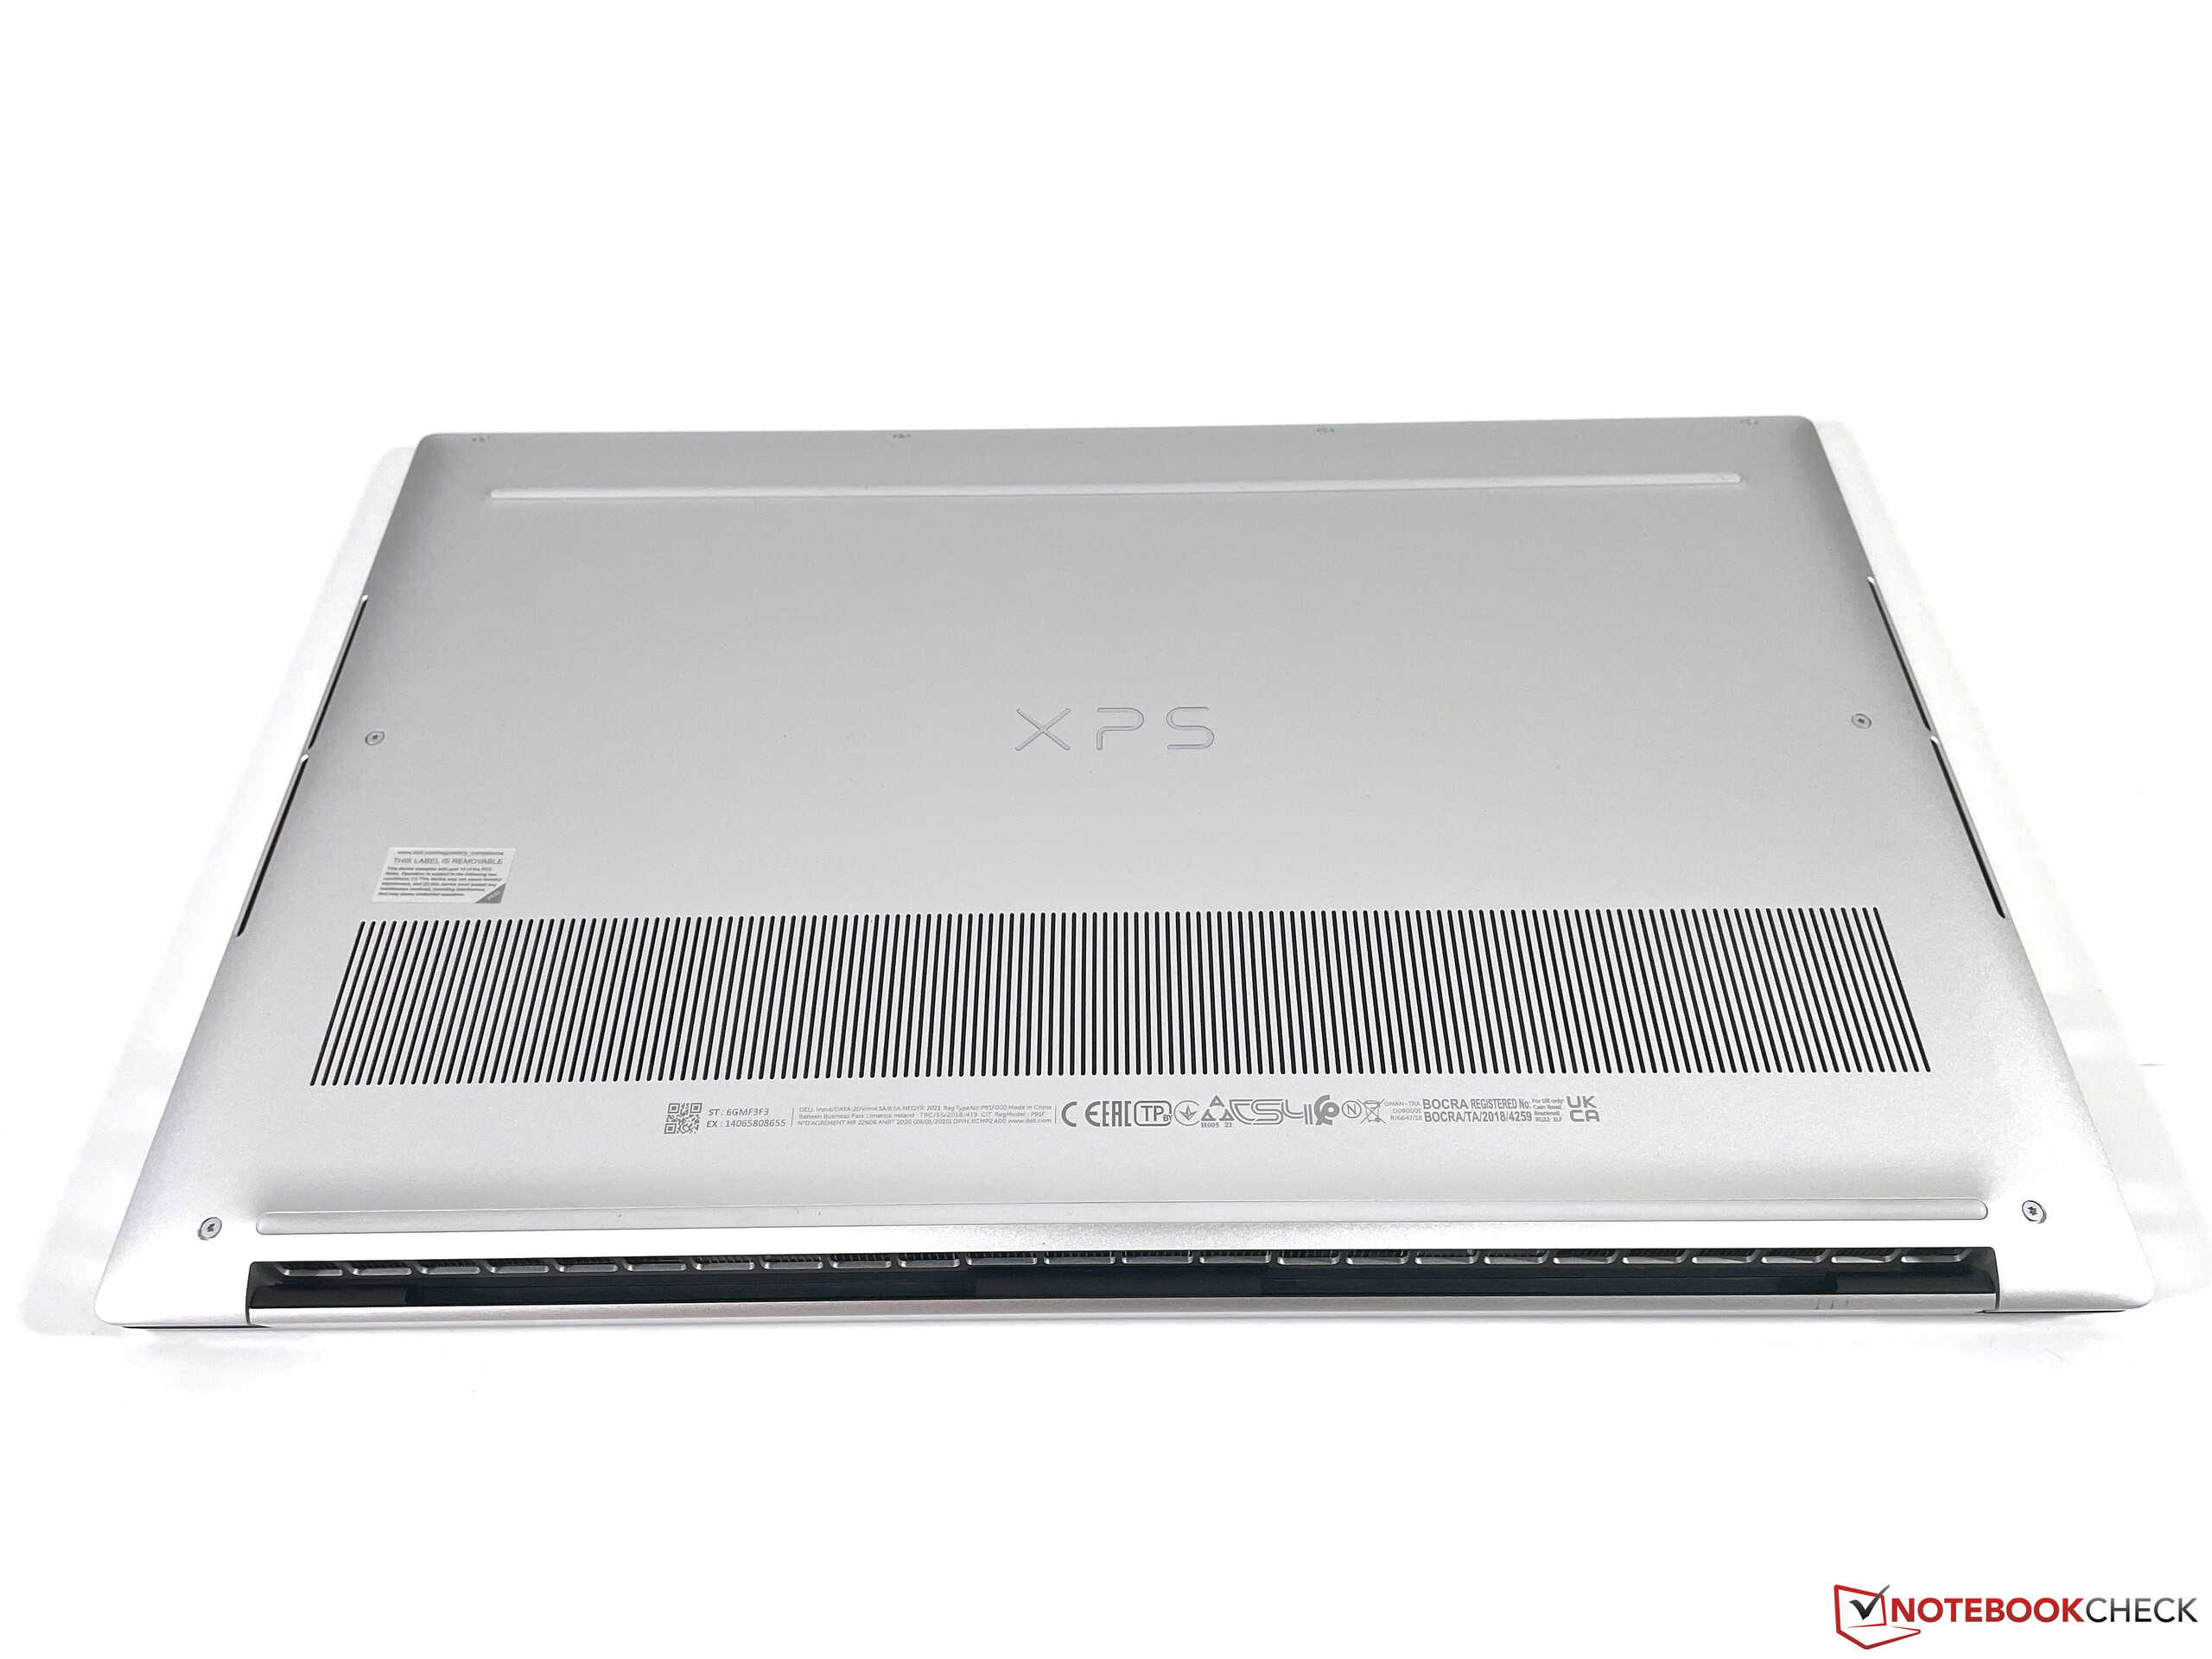
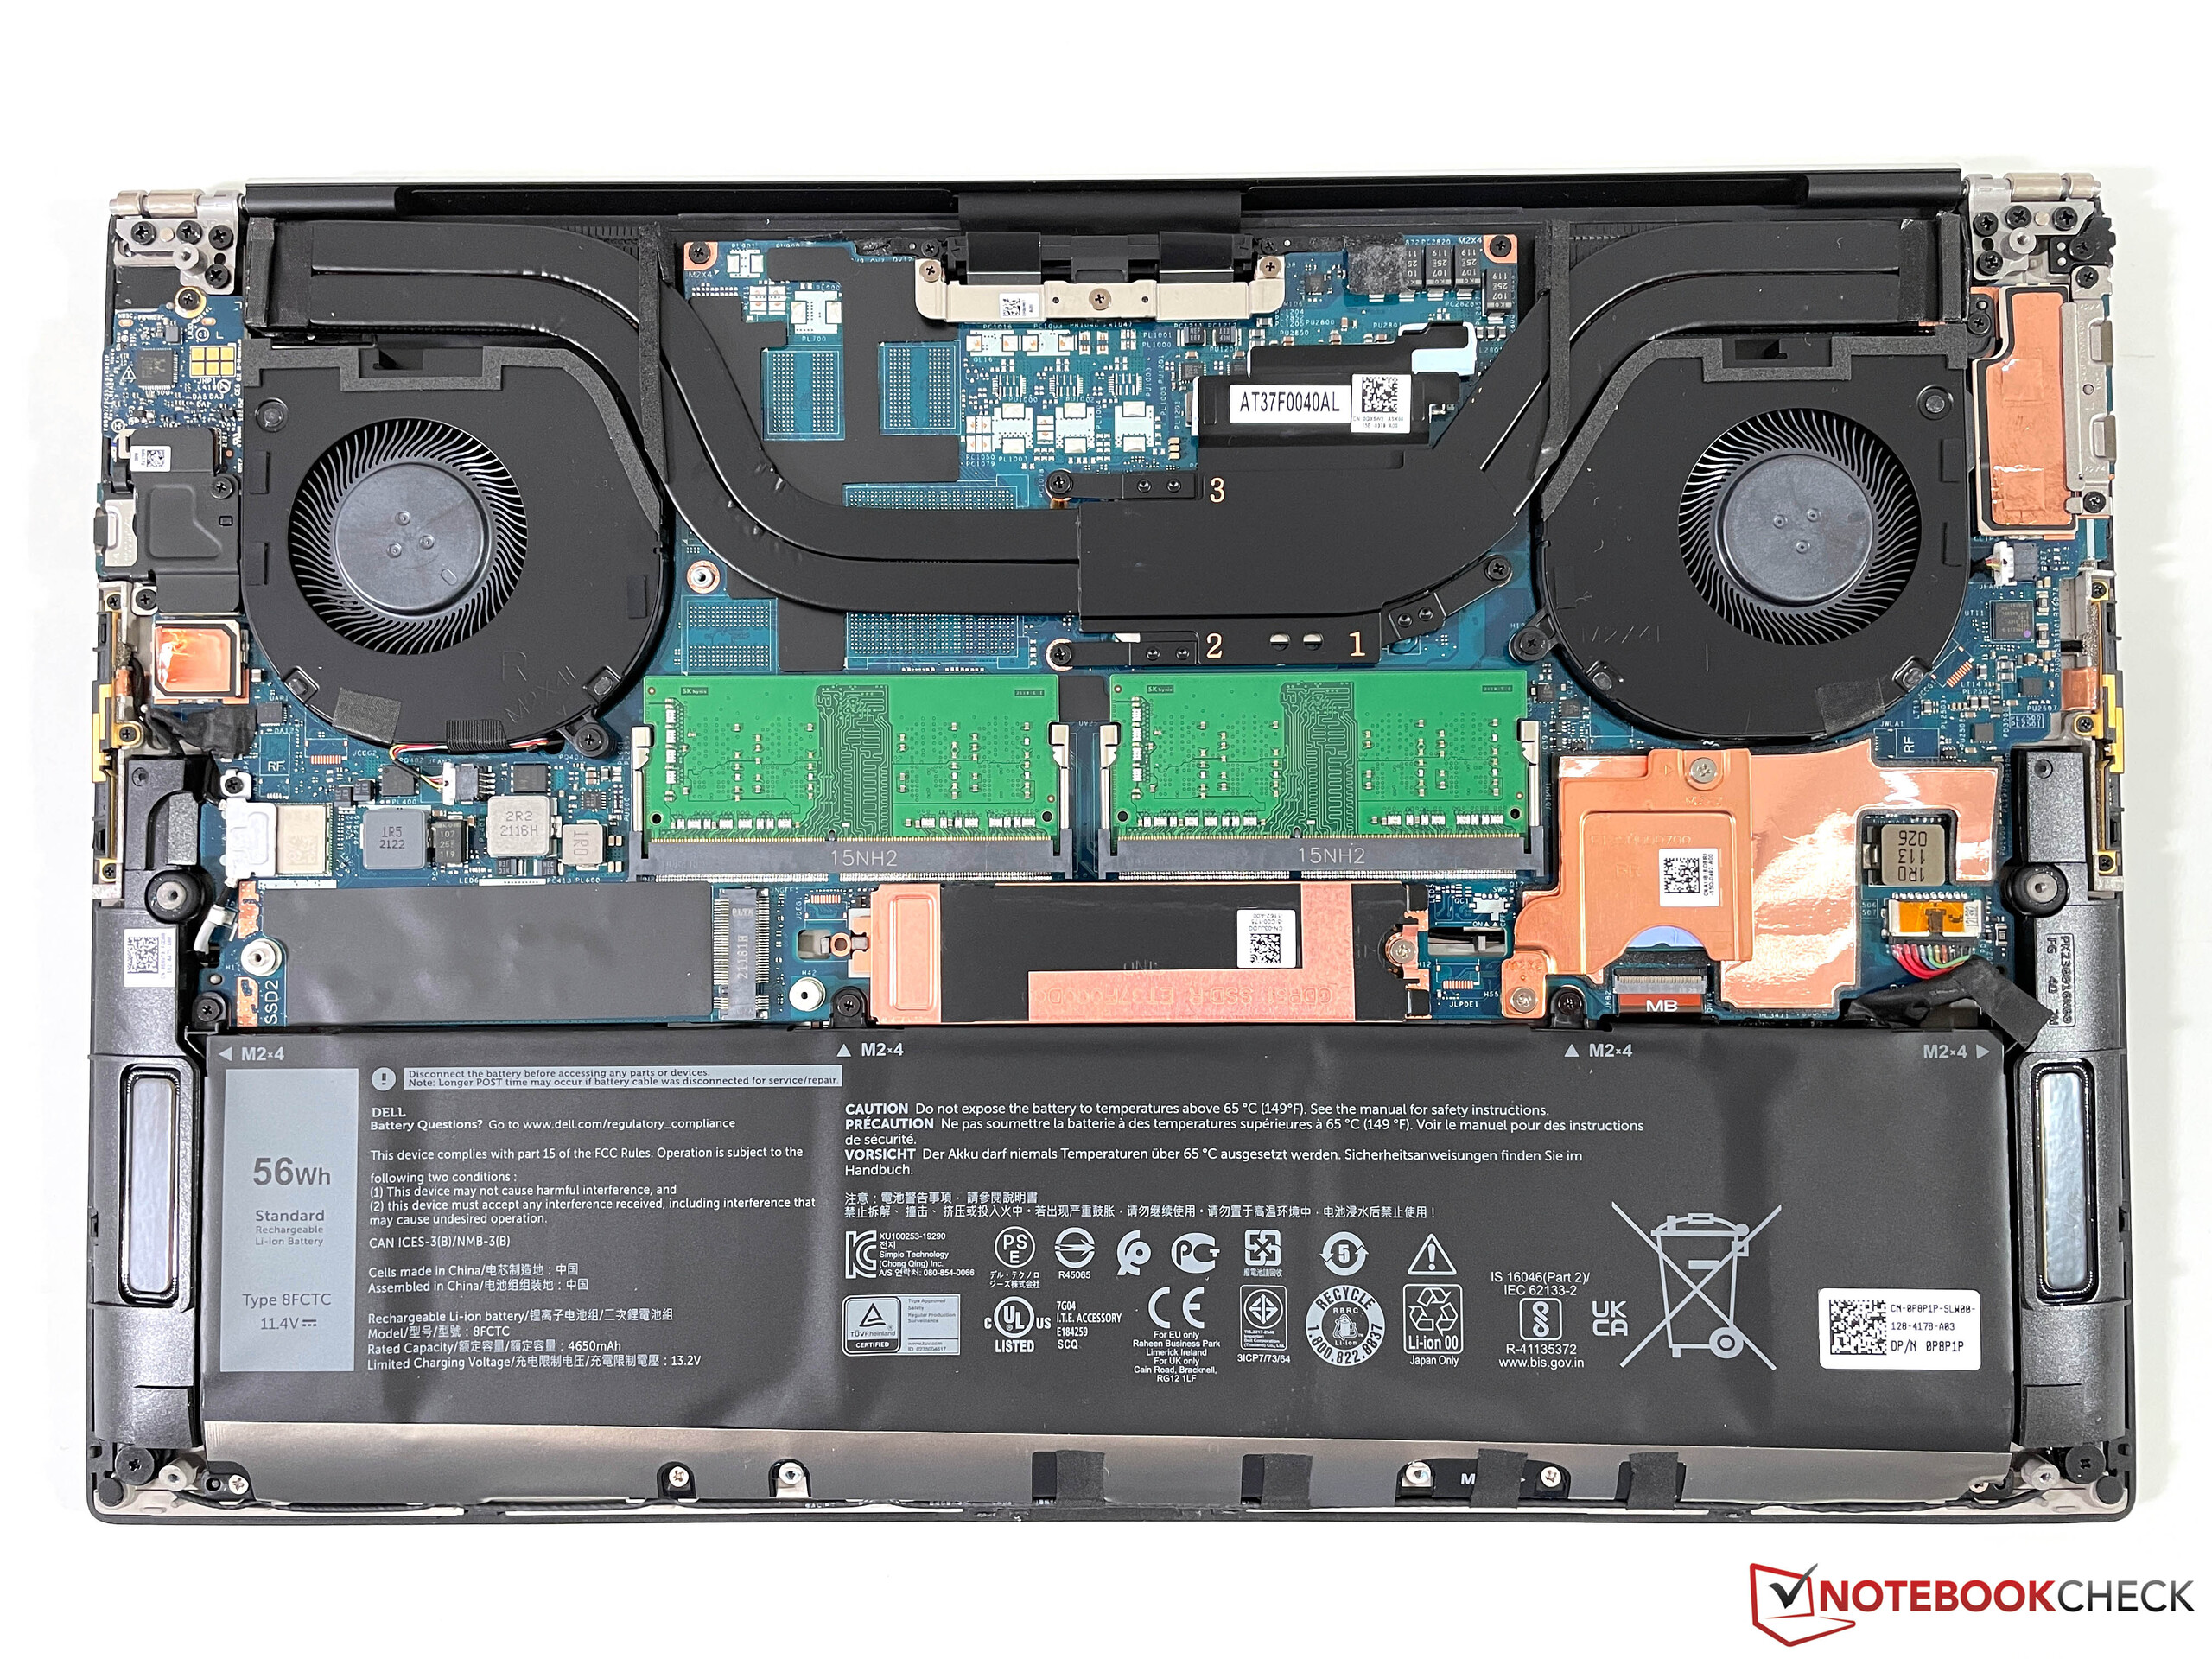
这款箱子实际上与 高端版本的XPS 15 9510我们已经测试过了。然而,这一次我们测试的是黑色底座和银色盖子的型号。与前代机型的情况一样,黑色表面仍然很容易受到灰尘和指纹的影响。看一下内部,除了缺少专用的GPU外,你不会看到任何区别。冷却系统也是相同的,电池也有相同的尺寸,尽管容量明显较小,为56而不是86Wh。至少在重量上这一点变得很明显,因为没有触摸屏的XPS 15的入门级型号要轻约200克(约7盎司)。
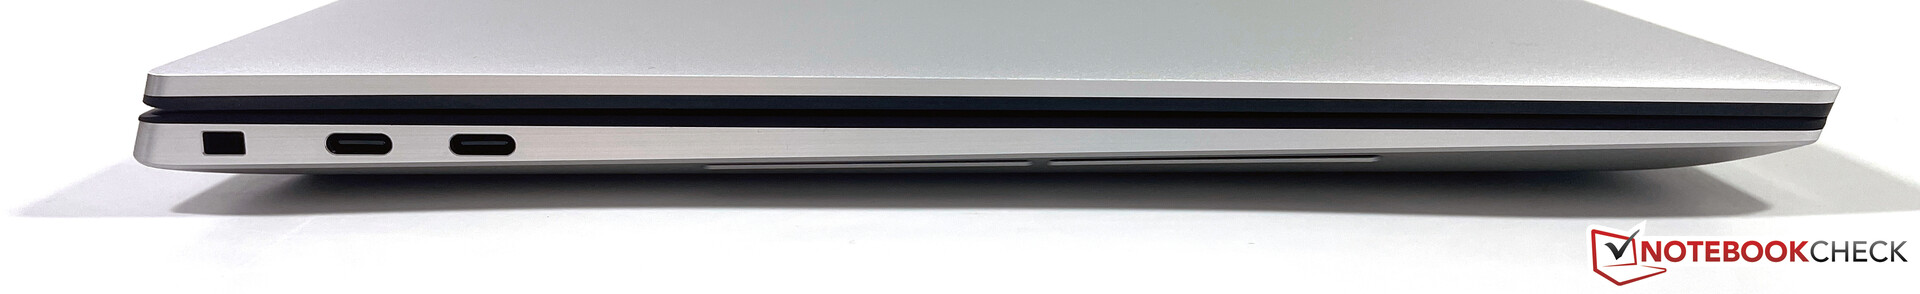
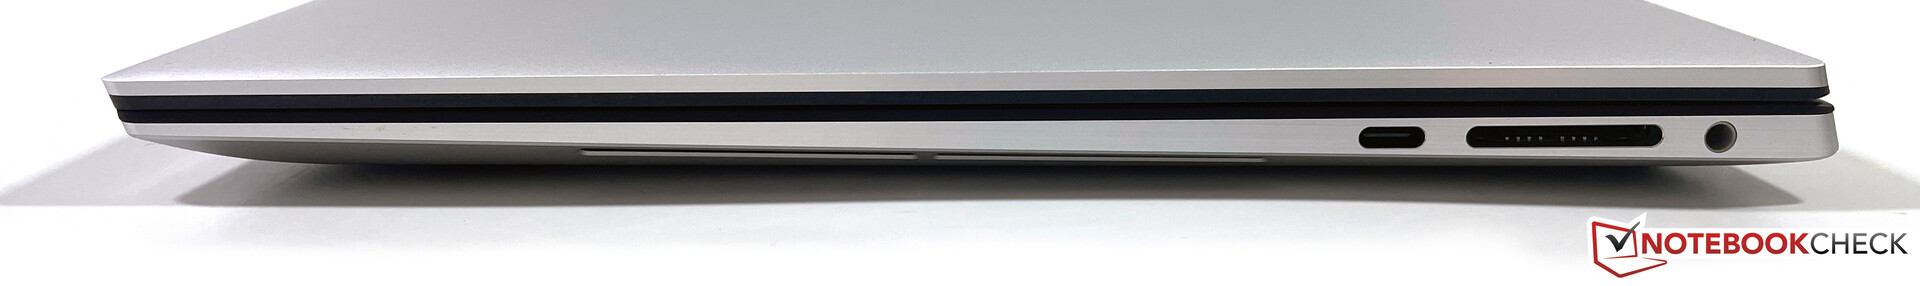
其余的设备与Thunderbolt 4连接,来自Killer的快速WLAN模块,以及SD读卡器与高端XPS 15 9510相同。
连接设备
| SD Card Reader | |
| average JPG Copy Test (av. of 3 runs) | |
| Dell XPS 15 9500 Core i5 (Toshiba Exceria Pro SDXC 64 GB UHS-II) | |
| Dell XPS 15 9510 i5 11400H FHD (AV Pro V60) | |
| Average of class Multimedia (23 - 531, n=44, last 2 years) | |
| maximum AS SSD Seq Read Test (1GB) | |
| Dell XPS 15 9510 i5 11400H FHD (AV Pro V60) | |
| Dell XPS 15 9500 Core i5 (Toshiba Exceria Pro SDXC 64 GB UHS-II) | |
| Average of class Multimedia (27.9 - 1455, n=43, last 2 years) | |


显示屏 - 一个16:10格式的哑光1080p显示屏
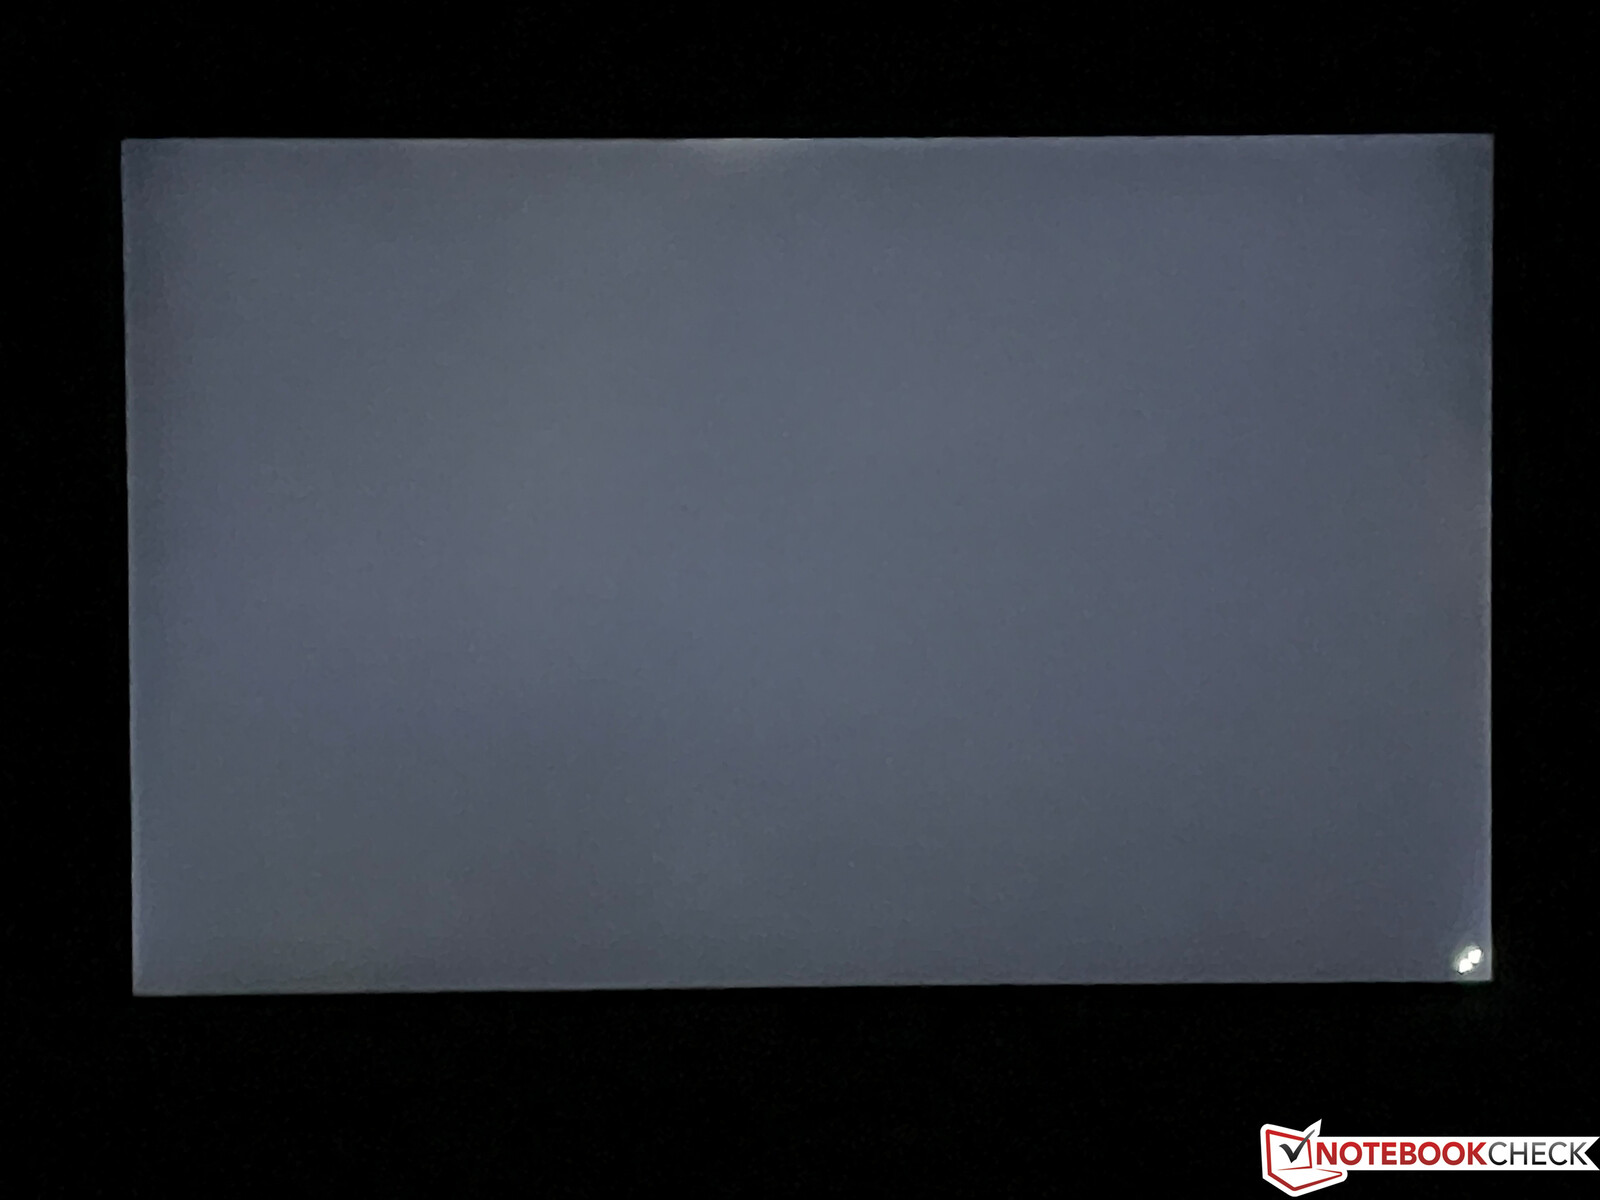
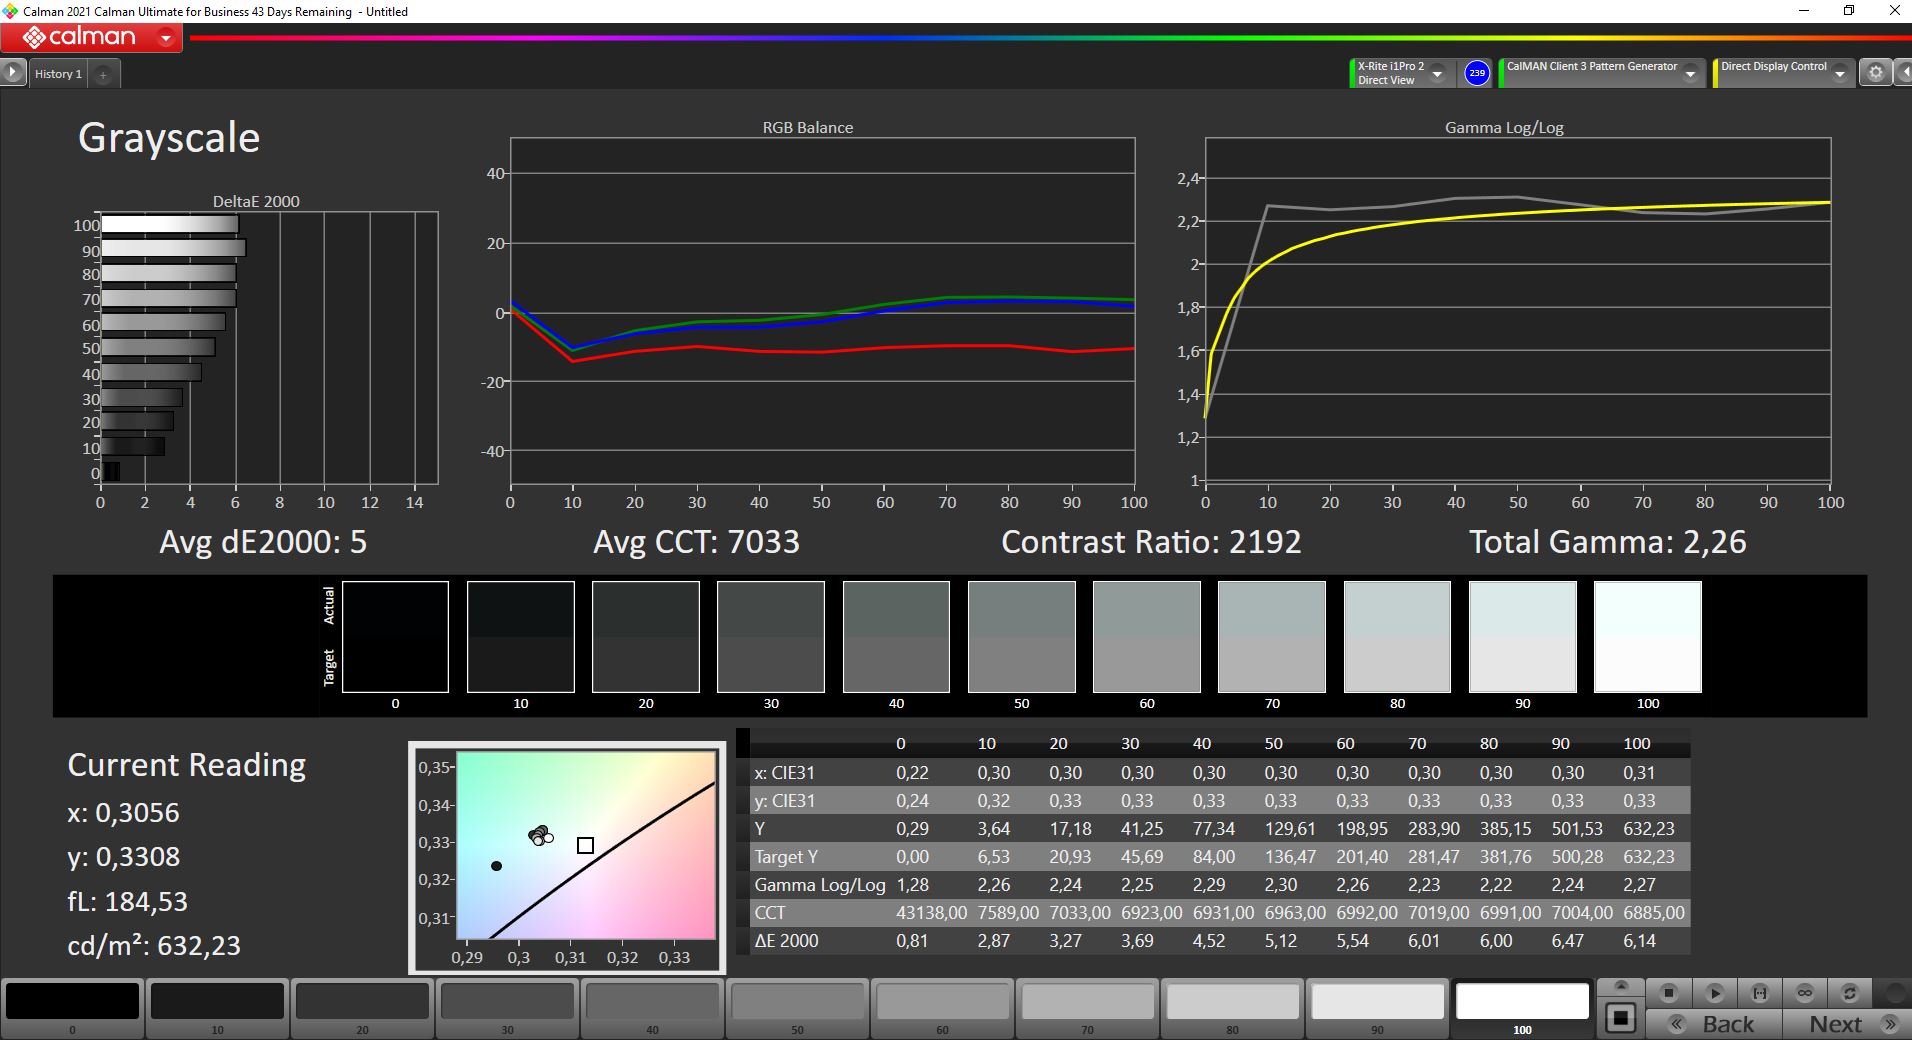
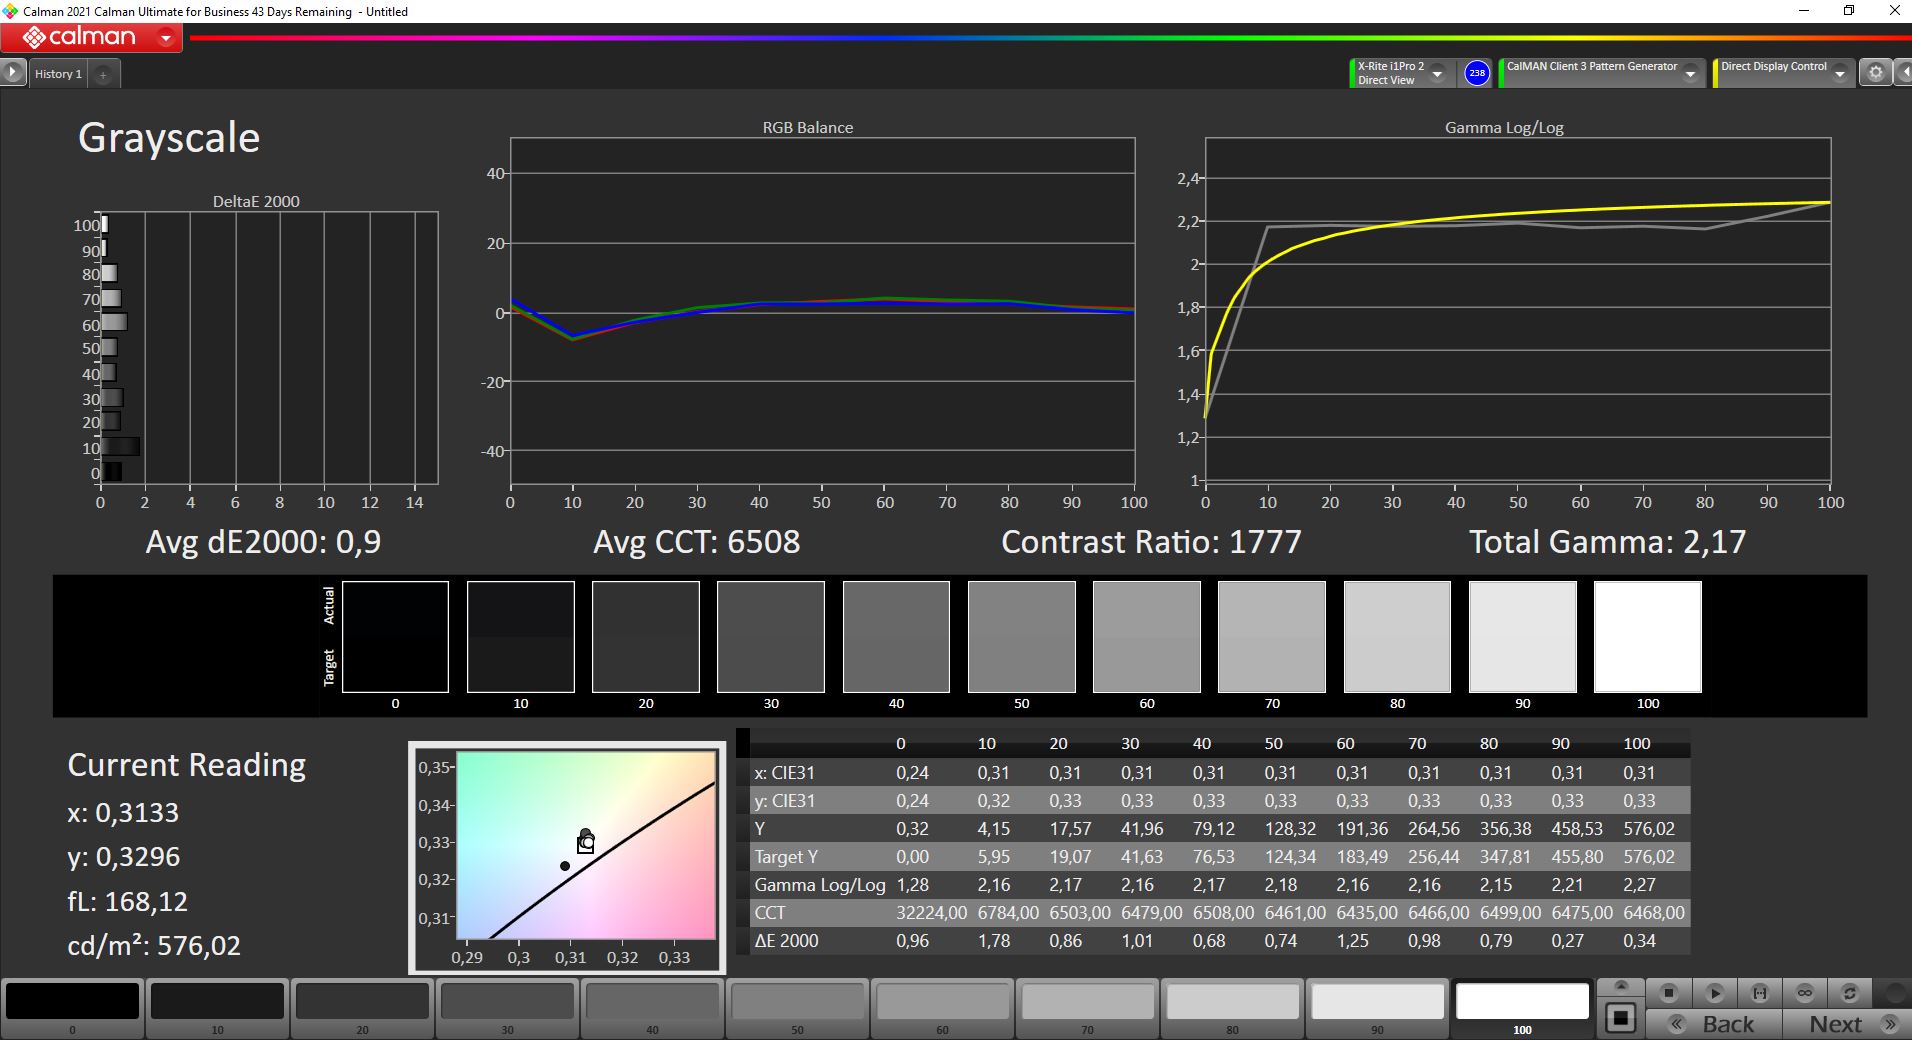
我们已经知道夏普的哑光全高清面板,分辨率为1920 x 1200像素,来自旧的 XPS 15 9500.该面板的平均亮度超过600cd/m²,继续成为市场上最亮的面板之一。 黑值相对较低,导致了超过2000:1的极高对比度。
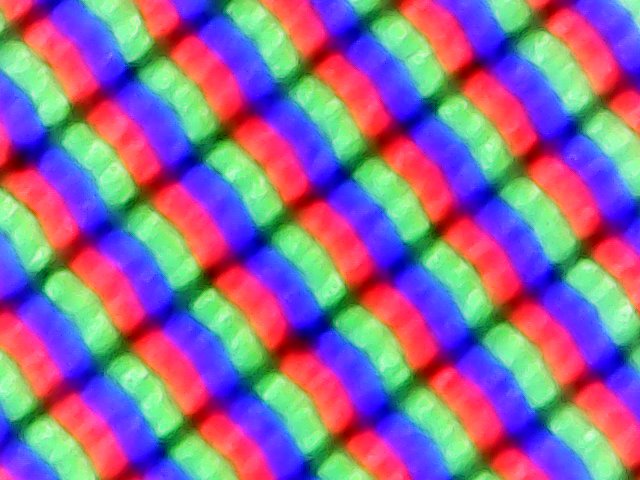
主观的图像印象非常好,即使是明亮的区域也不会出现非常多的颗粒。前代产品在这方面的问题略多(见子像素图像的比较)。没有PWM闪烁,尽管亮度很高,但屏幕出血也不是一个问题。我们只注意到在顶部边缘有一个最小的明亮区域。在实践中,亮度可以通过自动亮度传感器舒适地控制。IPS面板的可视角度稳定性非常好。有问题的是缓慢的反应时间,在实践中也会导致明显的重影。
| |||||||||||||||||||||||||
Brightness Distribution: 91 %
Center on Battery: 634 cd/m²
Contrast: 2179:1 (Black: 0.29 cd/m²)
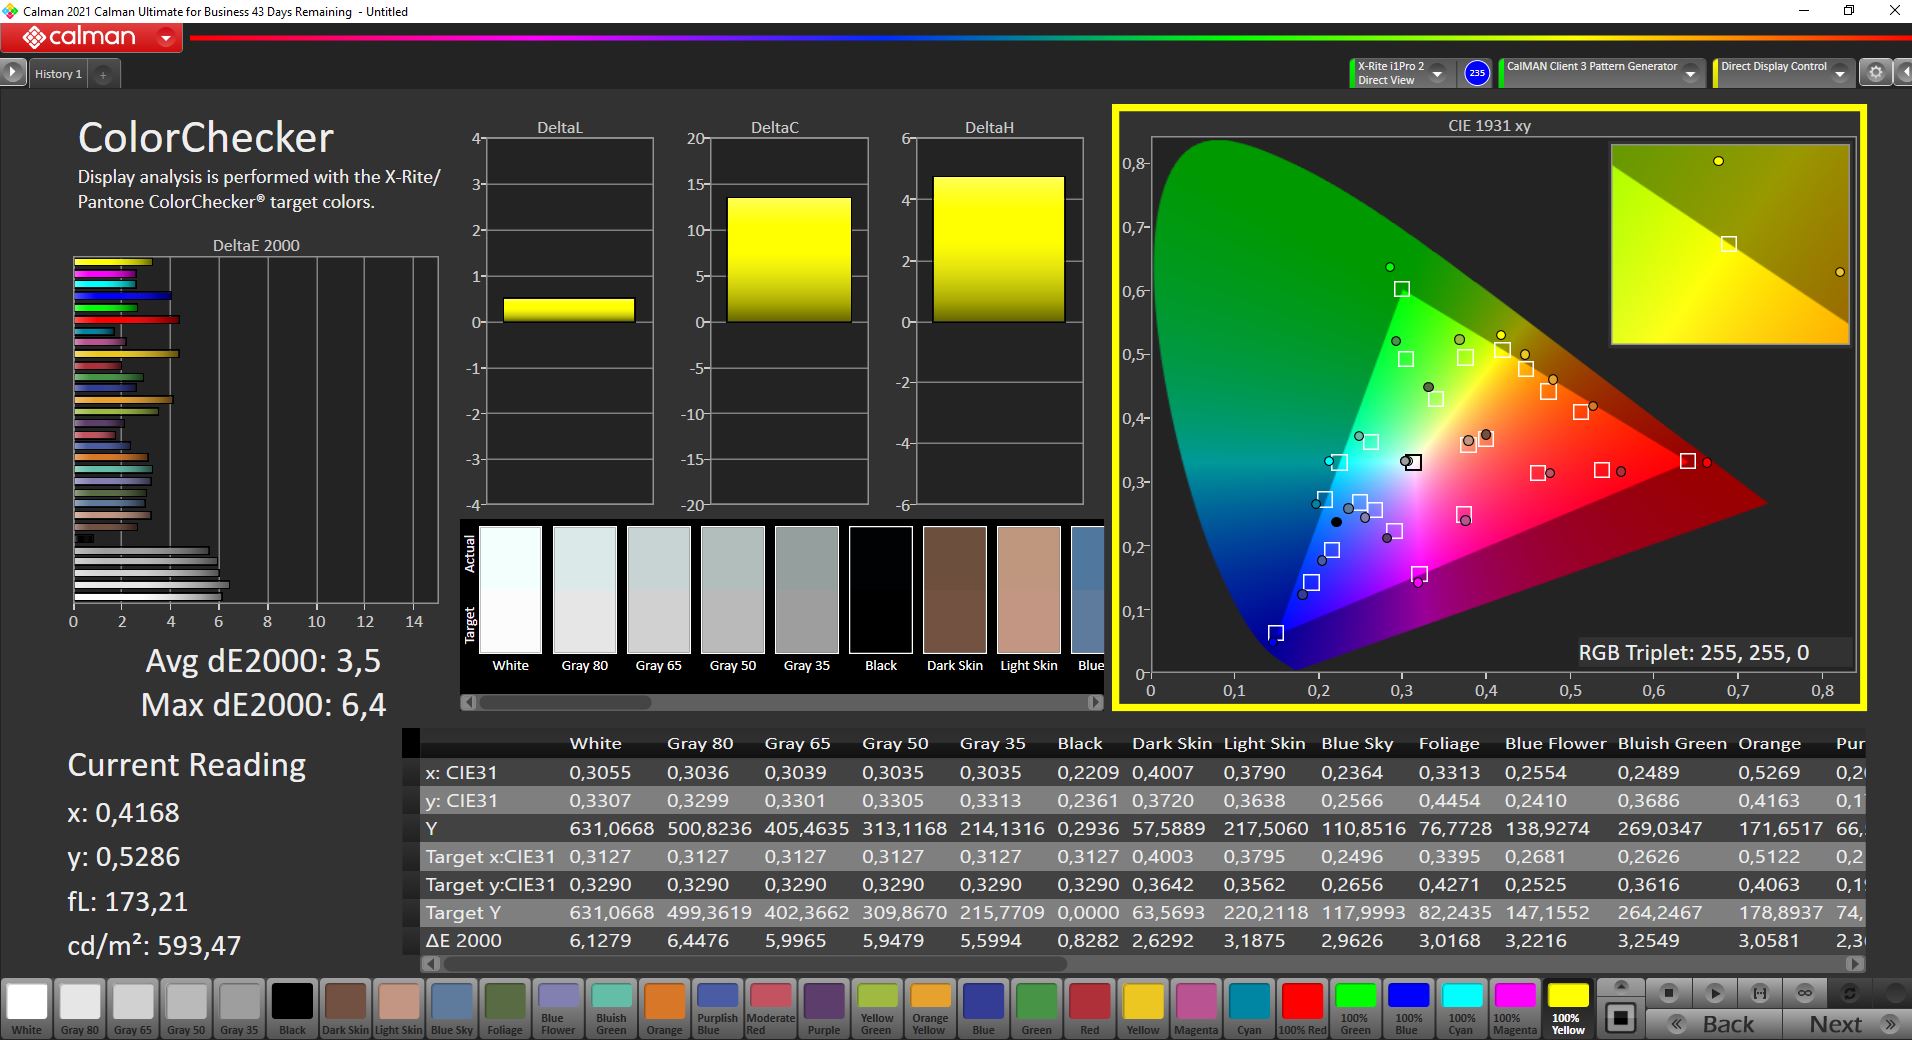
ΔE ColorChecker Calman: 3.5 | ∀{0.5-29.43 Ø4.72}
calibrated: 2
ΔE Greyscale Calman: 5 | ∀{0.09-98 Ø4.97}
79.1% AdobeRGB 1998 (Argyll 3D)
100% sRGB (Argyll 3D)
80.9% Display P3 (Argyll 3D)
Gamma: 2.26
CCT: 7033 K
| Dell XPS 15 9510 i5 11400H FHD Sharp LQ156N1, IPS, 1920x1200, 15.6" | Huawei MateBook 14s i7 CSOTT3 U17B MNE208ZA1-3, LTPS, 2520x1680, 14.2" | Acer Swift 3 SF316-51 Chi Mei CMN160B, IPS, 1920x1080, 16.1" | Honor MagicBook Pro (AMD) N161HCA-EA3, IPS, 1920x1080, 16.1" | Dell XPS 15 9500 Core i5 Sharp LQ156N1, IPS, 1920x1200, 15.6" | Dell XPS 15 9510 11800H RTX 3050 Ti OLED SDC414D, OLED, 3456x2160, 15.6" | Schenker Vision 15 BOE08F5, IPS, 1920x1080, 15.6" | |
|---|---|---|---|---|---|---|---|
| Display | -10% | -10% | -20% | 1% | 16% | -10% | |
| Display P3 Coverage (%) | 80.9 | 67.8 -16% | 66.6 -18% | 67.5 -17% | 81.5 1% | 99.9 23% | 69.3 -14% |
| sRGB Coverage (%) | 100 | 98.3 -2% | 99.5 0% | 69.7 -30% | 100 0% | 100 0% | 94 -6% |
| AdobeRGB 1998 Coverage (%) | 79.1 | 70.1 -11% | 68.5 -13% | 69.7 -12% | 79.6 1% | 98.1 24% | 70.8 -10% |
| Response Times | 42% | 49% | 37% | 30% | 94% | 2% | |
| Response Time Grey 50% / Grey 80% * (ms) | 62.4 ? | 37.6 ? 40% | 32 ? 49% | 37.6 ? 40% | 42 ? 33% | 3.6 ? 94% | 60 ? 4% |
| Response Time Black / White * (ms) | 38.8 ? | 21.6 ? 44% | 20 ? 48% | 25.6 ? 34% | 28.8 ? 26% | 2.8 ? 93% | 39 ? -1% |
| PWM Frequency (Hz) | 27780 ? | 2500 ? | 25250 ? | 59.5 ? | |||
| Screen | 14% | 9% | 24% | -8% | 34% | -8% | |
| Brightness middle (cd/m²) | 632 | 419 -34% | 304 -52% | 337 -47% | 592 -6% | 362 -43% | 478 -24% |
| Brightness (cd/m²) | 606 | 407 -33% | 284 -53% | 312 -49% | 565 -7% | 367 -39% | 462 -24% |
| Brightness Distribution (%) | 91 | 93 2% | 88 -3% | 89 -2% | 85 -7% | 97 7% | 94 3% |
| Black Level * (cd/m²) | 0.29 | 0.23 21% | 0.165 43% | 0.2 31% | 0.46 -59% | 0.06 79% | 0.27 7% |
| Contrast (:1) | 2179 | 1822 -16% | 1842 -15% | 1685 -23% | 1287 -41% | 6033 177% | 1770 -19% |
| Colorchecker dE 2000 * | 3.5 | 1.9 46% | 1.44 59% | 0.8 77% | 3.19 9% | 2.1 40% | 3.2 9% |
| Colorchecker dE 2000 max. * | 6.4 | 3.6 44% | 3.62 43% | 1.1 83% | 5.45 15% | 4.1 36% | 8.4 -31% |
| Colorchecker dE 2000 calibrated * | 2 | 0.9 55% | 0.7 65% | 2.03 -1% | 2.5 -25% | 2 -0% | |
| Greyscale dE 2000 * | 5 | 2.9 42% | 2.6 48% | 1 80% | 3.9 22% | 1.4 72% | 4.5 10% |
| Gamma | 2.26 97% | 2.14 103% | 2.41 91% | 2.2 100% | 2.25 98% | 2.18 101% | 2.16 102% |
| CCT | 7033 92% | 6733 97% | 6527 100% | 6538 99% | 6522 100% | 6608 98% | 6788 96% |
| Color Space (Percent of AdobeRGB 1998) (%) | 68.5 | 63.8 | 71.6 | 63.1 | |||
| Color Space (Percent of sRGB) (%) | 99.5 | 99.5 | 100 | 93.6 | |||
| Total Average (Program / Settings) | 15% /
13% | 16% /
10% | 14% /
16% | 8% /
-1% | 48% /
38% | -5% /
-7% |
* ... smaller is better
Display Response Times
| ↔ Response Time Black to White | ||
|---|---|---|
| 38.8 ms ... rise ↗ and fall ↘ combined | ↗ 20.8 ms rise | 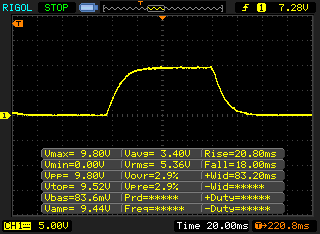 |
| ↘ 18 ms fall | ||
| The screen shows slow response rates in our tests and will be unsatisfactory for gamers. In comparison, all tested devices range from 0.1 (minimum) to 240 (maximum) ms. » 96 % of all devices are better. This means that the measured response time is worse than the average of all tested devices (19.8 ms). | ||
| ↔ Response Time 50% Grey to 80% Grey | ||
| 62.4 ms ... rise ↗ and fall ↘ combined | ↗ 31.6 ms rise | 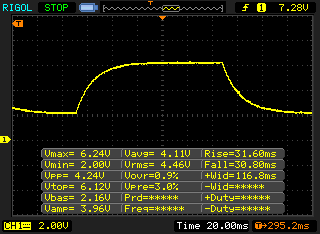 |
| ↘ 30.8 ms fall | ||
| The screen shows slow response rates in our tests and will be unsatisfactory for gamers. In comparison, all tested devices range from 0.165 (minimum) to 636 (maximum) ms. » 97 % of all devices are better. This means that the measured response time is worse than the average of all tested devices (31 ms). | ||
Screen Flickering / PWM (Pulse-Width Modulation)
| Screen flickering / PWM not detected |  | ||
In comparison: 52 % of all tested devices do not use PWM to dim the display. If PWM was detected, an average of 7781 (minimum: 5 - maximum: 343500) Hz was measured. | |||
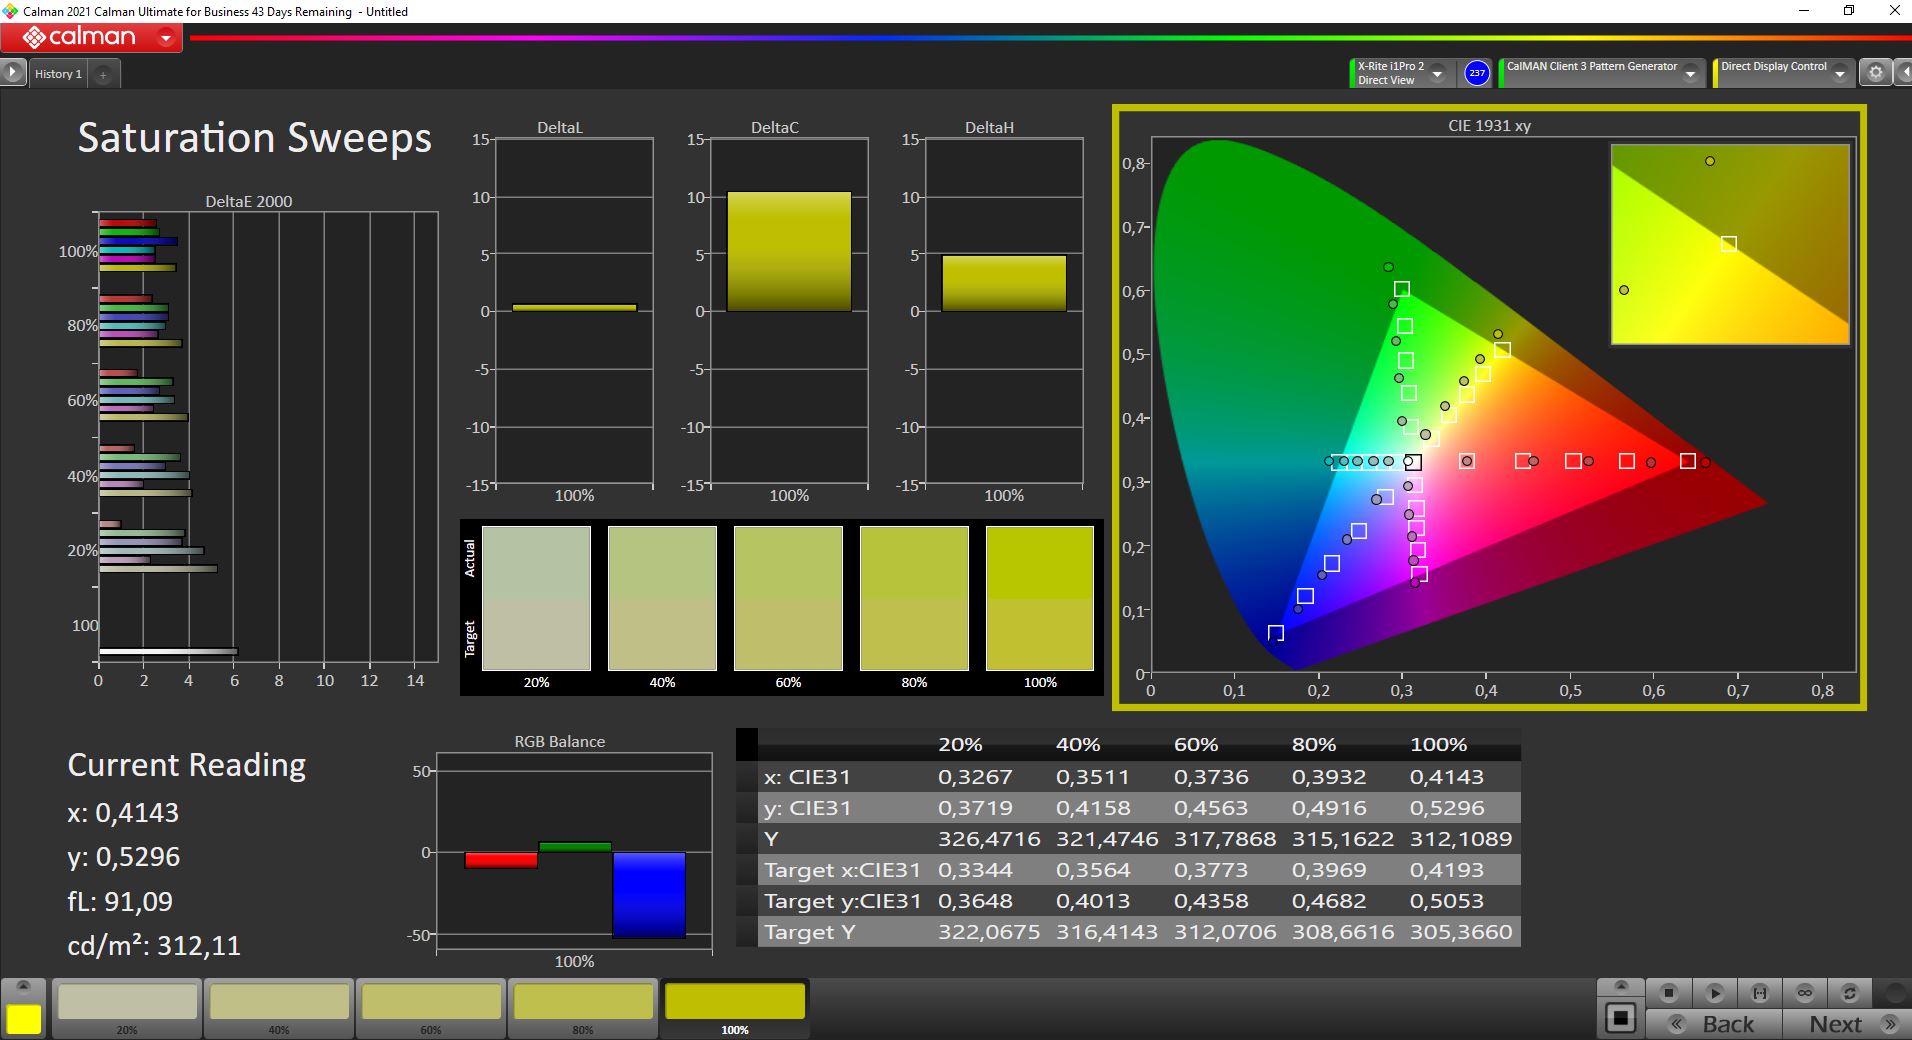
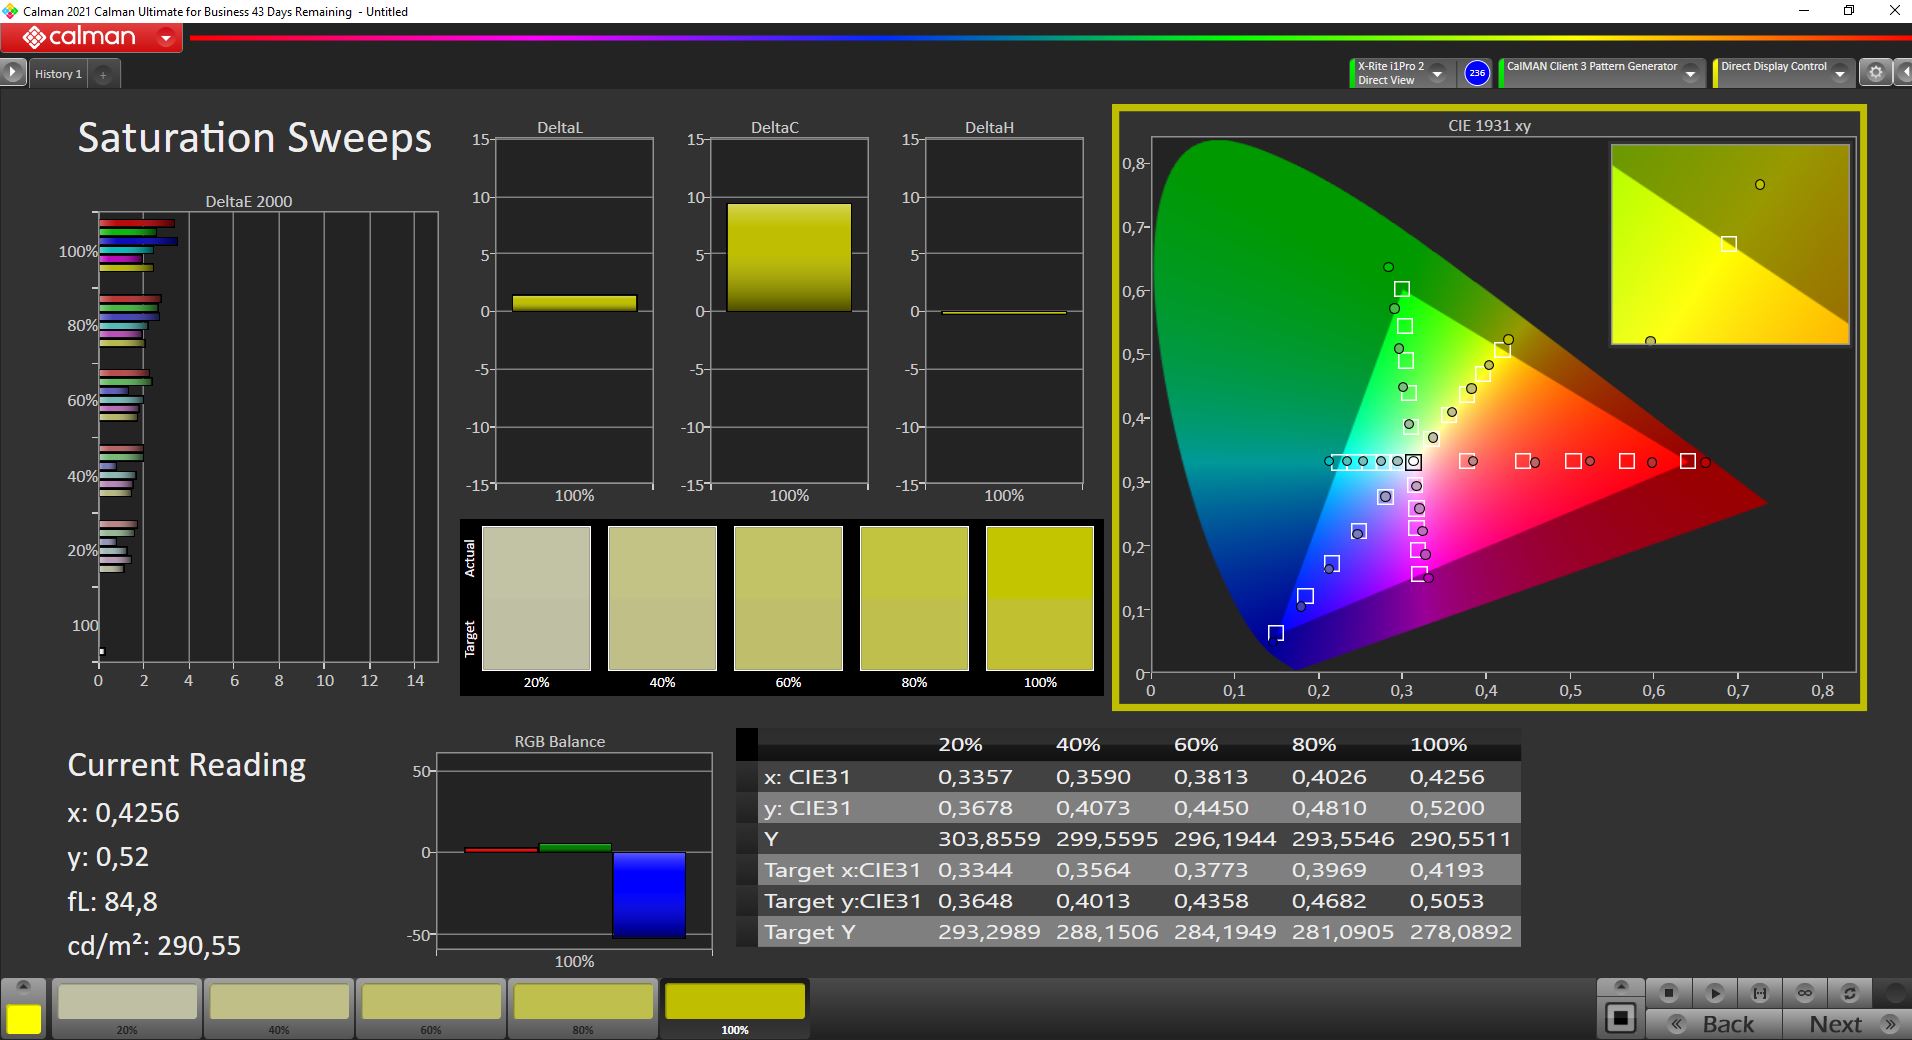
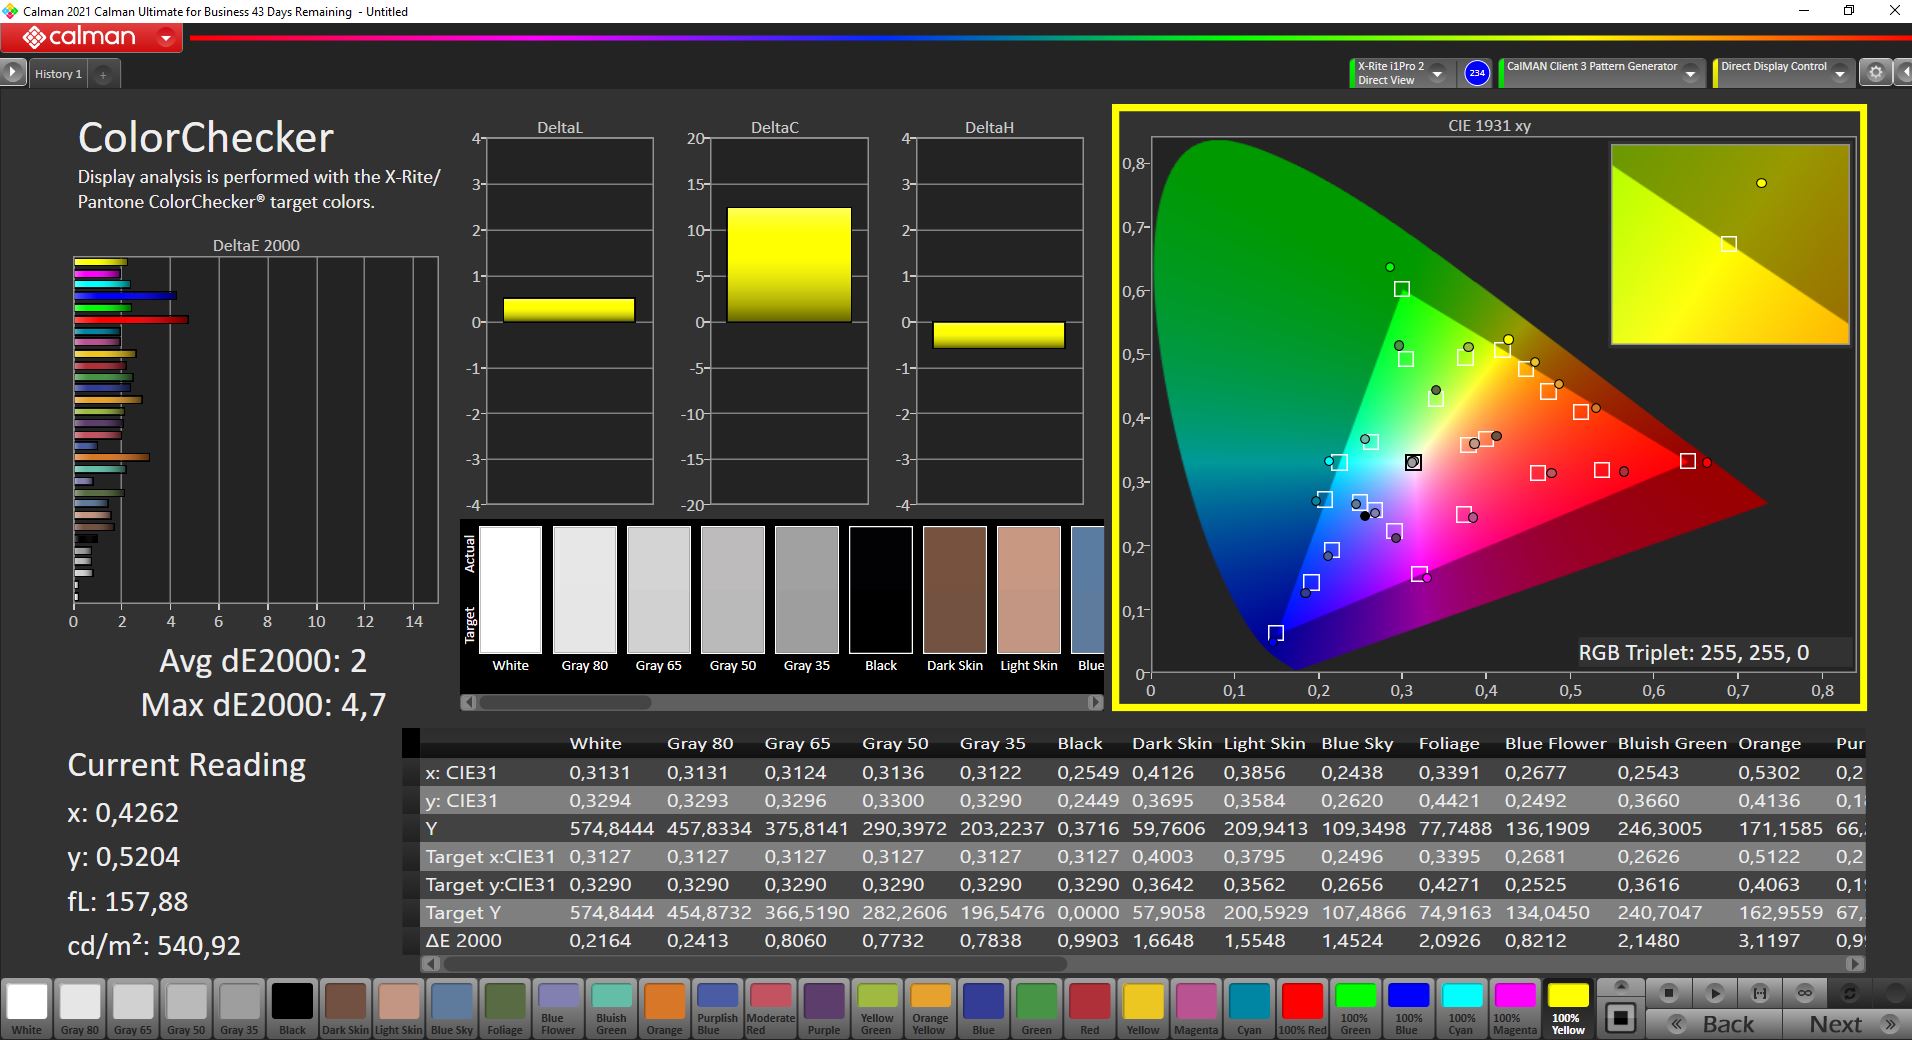
在交付状态下,面板没有被校准得特别好,而且在色温过低的情况下,有轻微的绿色色调。我们用专业的CalMAN软件和X-Rite i1 Pro 2色度计进行的分析也显示出颜色偏差略高。 通过我们的校准(在上面的信息框中可免费下载配置文件),我们能够特别改善灰度的再现,也能消除颜色的色调。与sRGB参考色彩空间(完全由面板覆盖)的色彩偏差也有所减少。只有两种颜色(100%的红色和蓝色)仍然最低限度地高于3的重要目标值,然而,该面板仍然适用于图像处理。
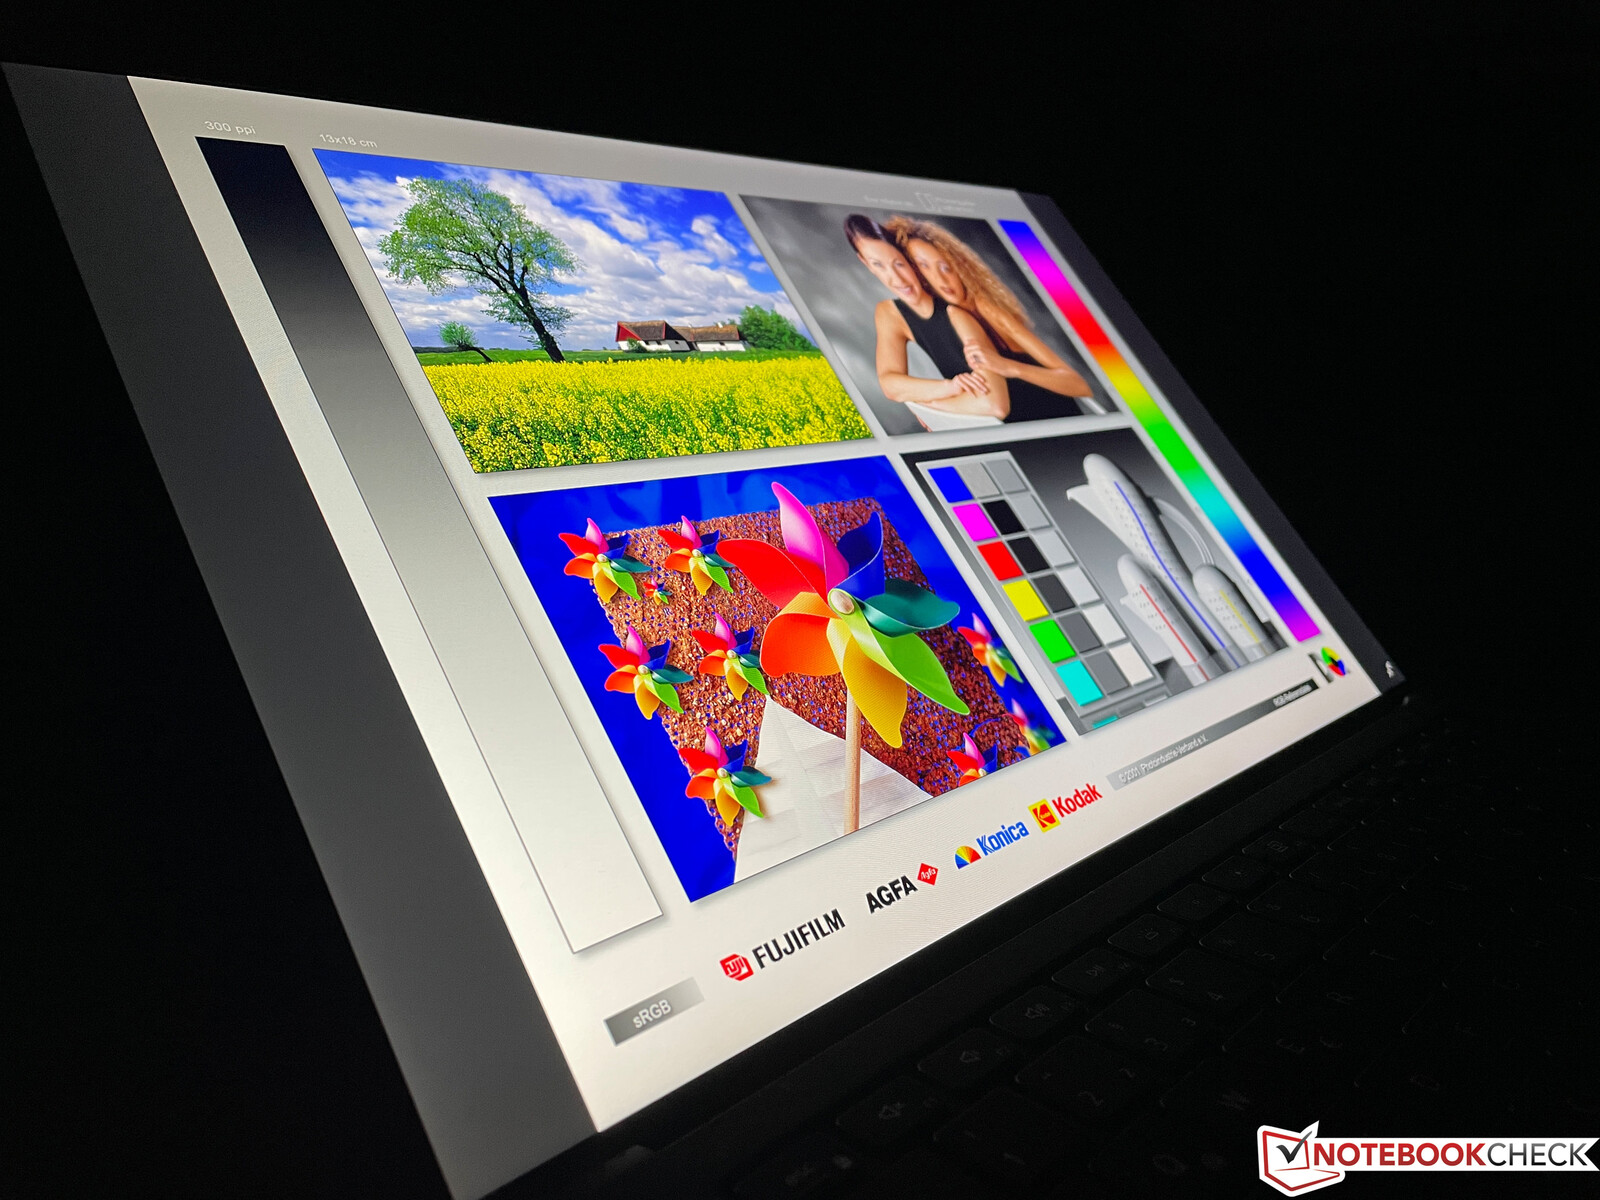
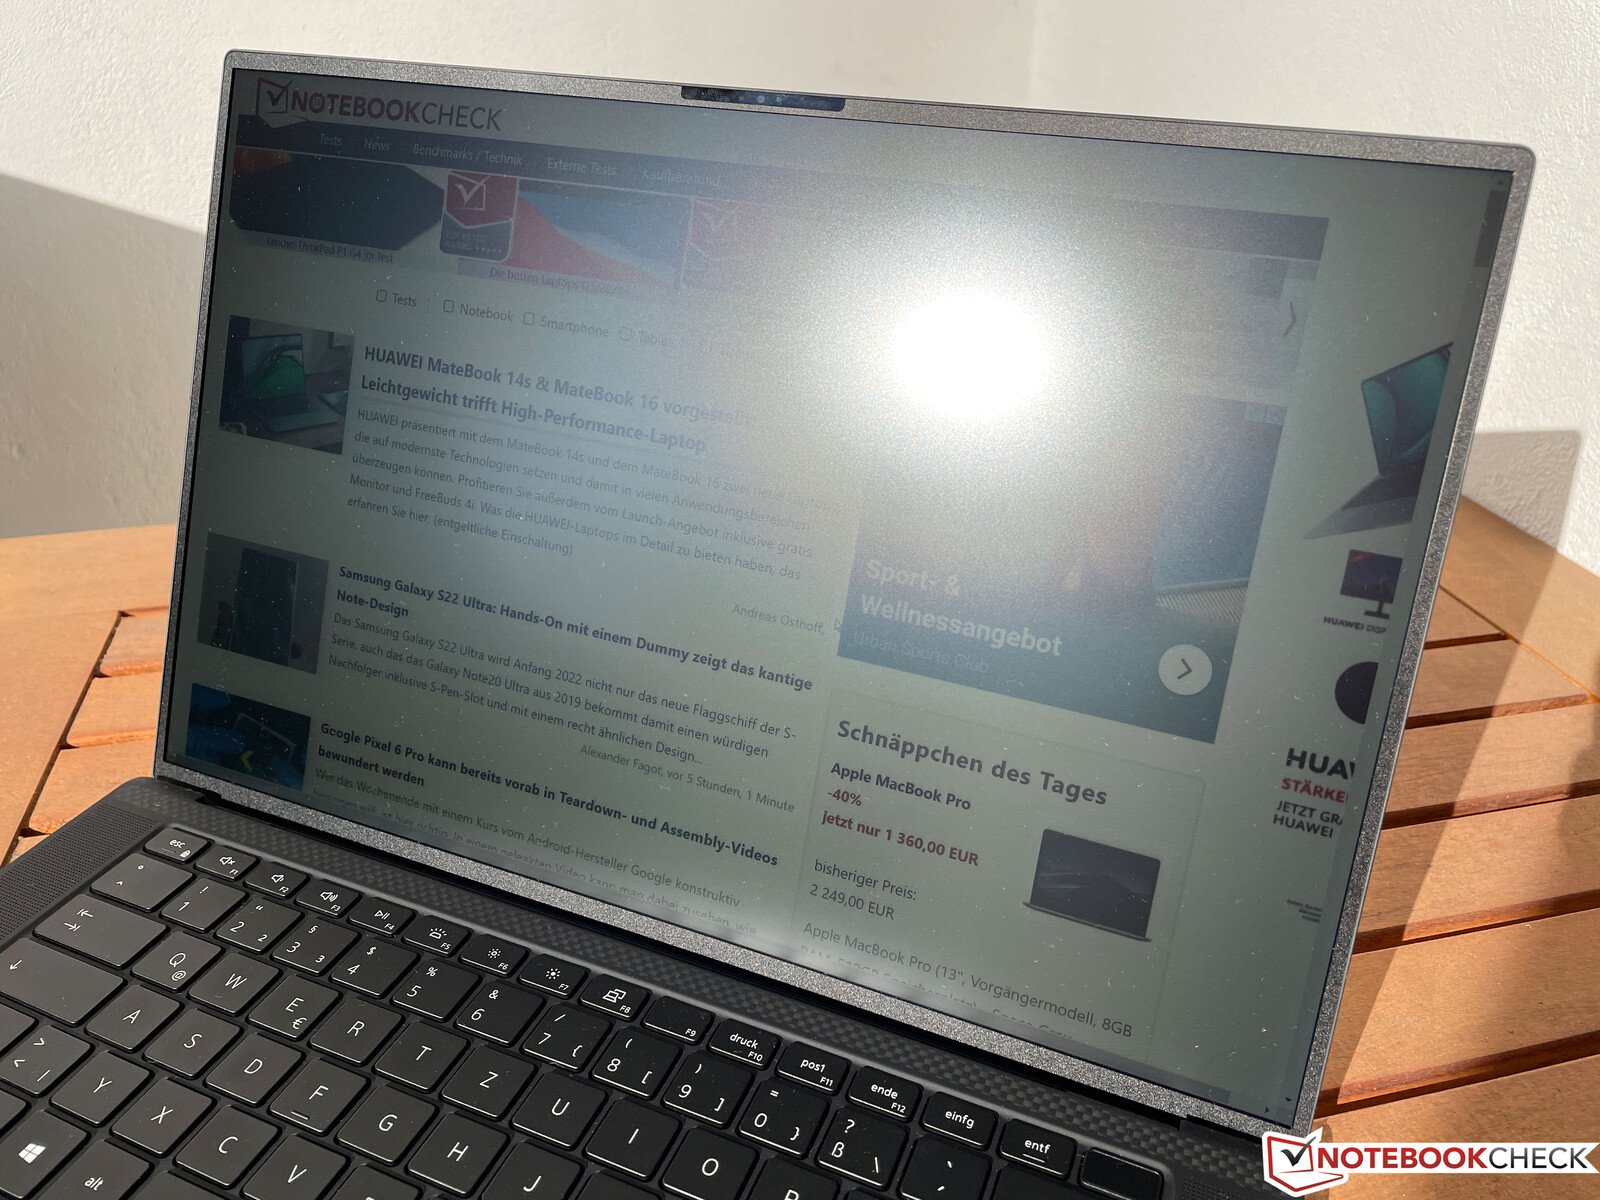
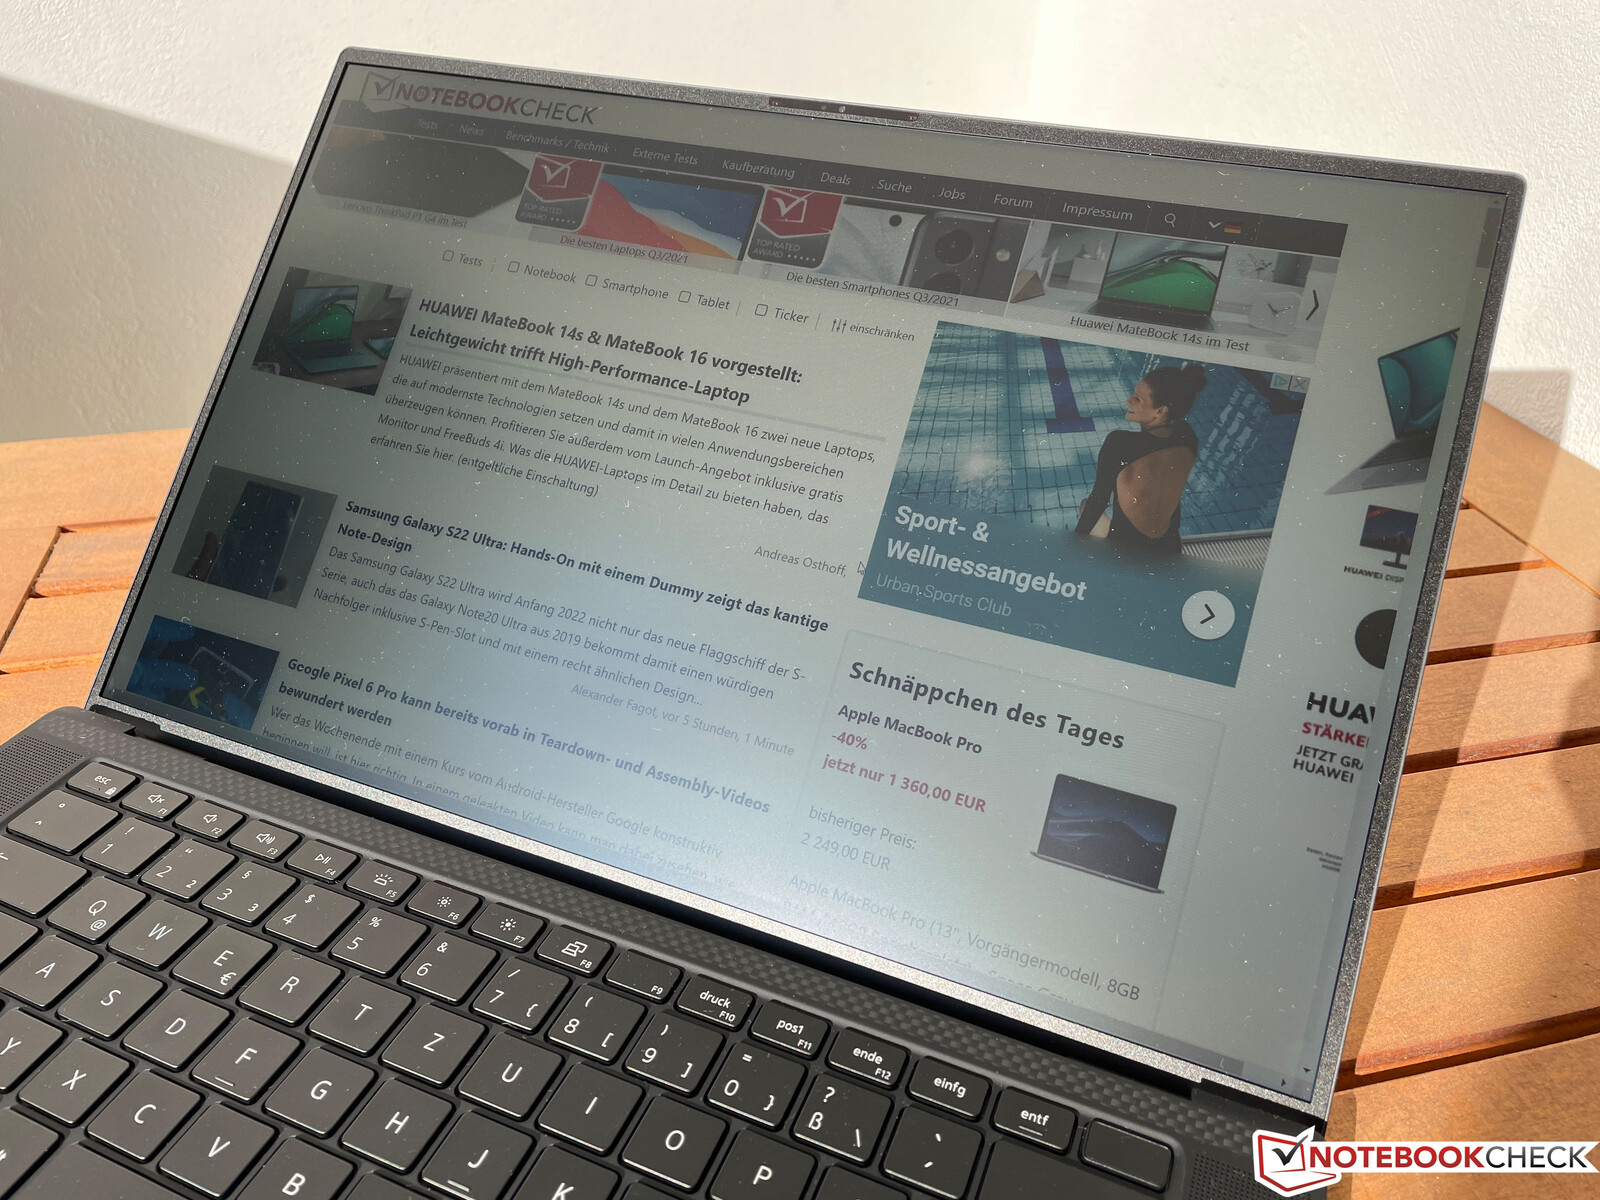
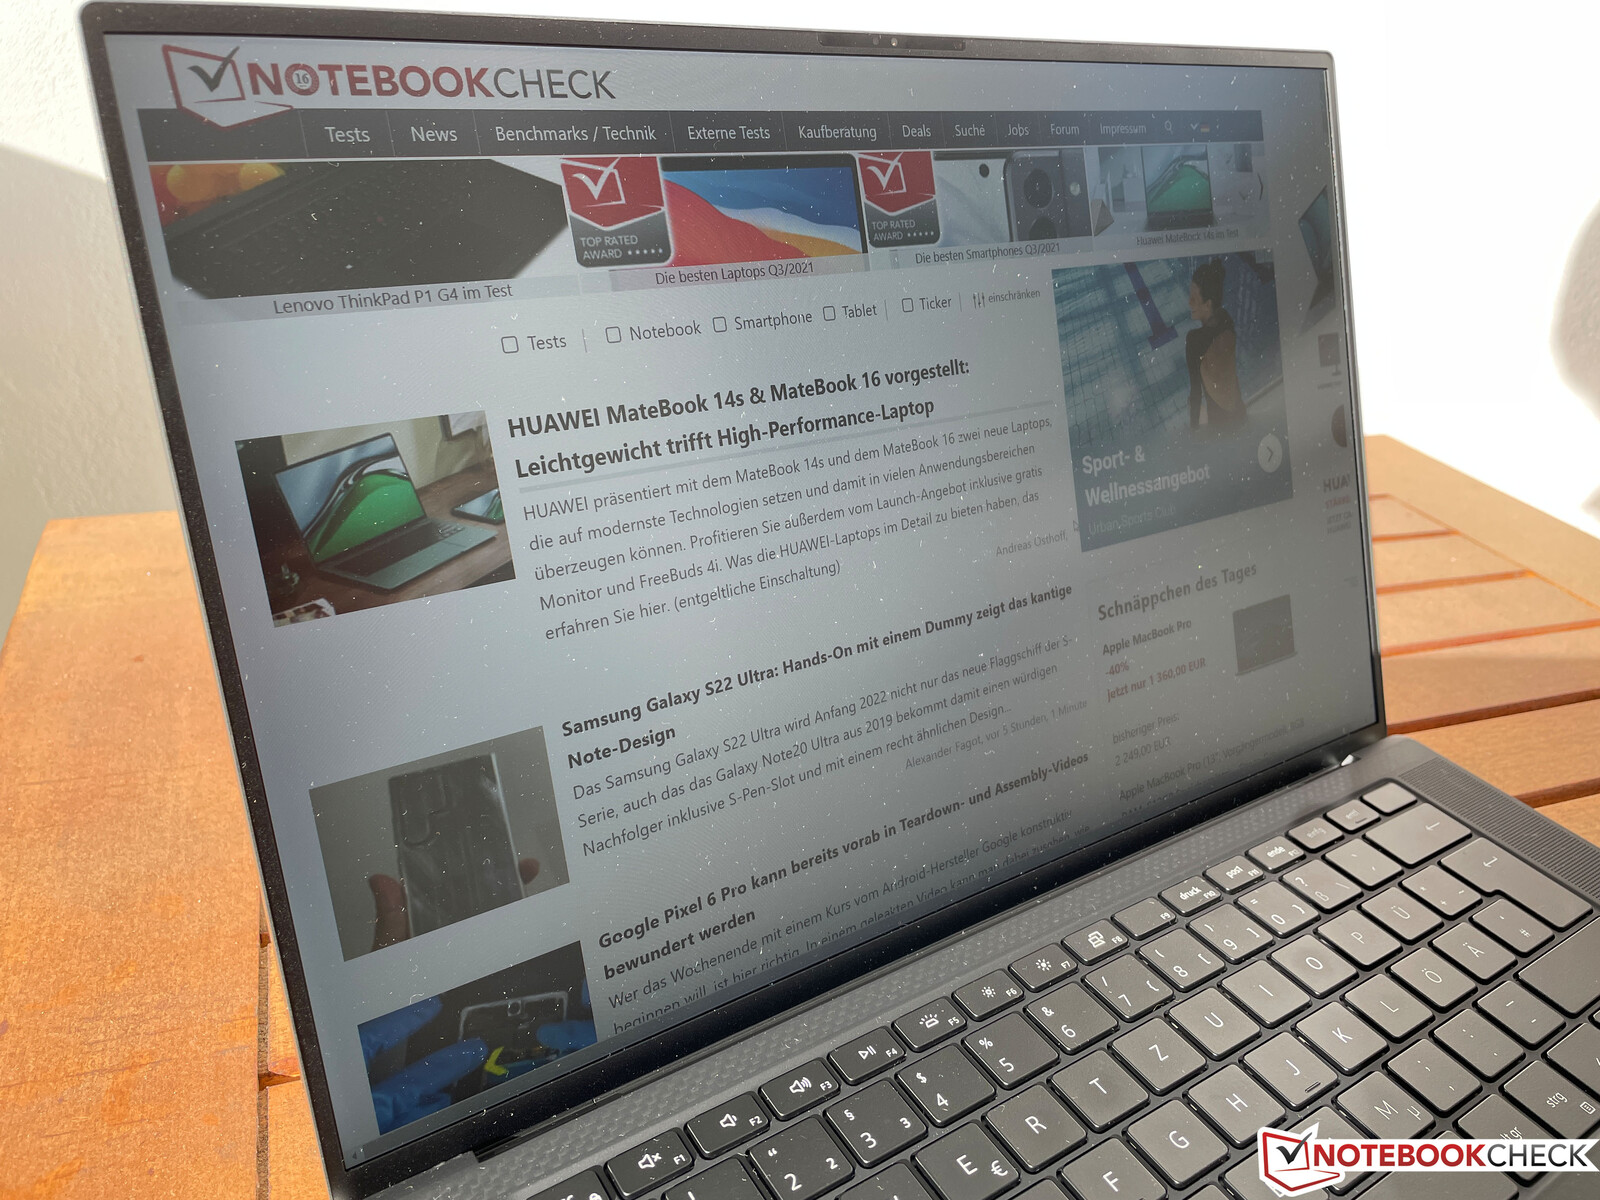
由于其高亮度,该显示器在户外完全处于其元素。如果你避免光源的直接反射,你也可以在非常明亮的环境中毫无问题地使用XPS 15。
性能 -Tiger Lake H,6个核心
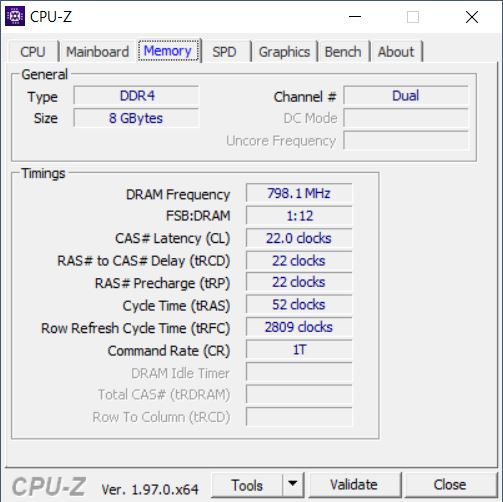
入门级型号主要适用于那些寻找大型多媒体笔记本电脑而不想用它来玩游戏的用户。戴尔为它配备了当前的英特尔Tiger Lake-H处理器,通常以45瓦的TDP运行。由于冷却方式与高端型号相同,这其实不应该造成任何问题。然而,戴尔仍然决定在只有约40瓦的情况下运行处理器,这一点我们无法解释。 8GB的工作内存数量也是偏小的。虽然你可以利用两个SODIMM插槽轻松升级,但由于戴尔使用了两个4GB的模块,你必须支付更多的钱来更换为16GB,例如。
预装的戴尔电源管理器还提供了激活超性能模式的选项,但我们一会儿就会看到为什么这没有什么效果。下面的基准测试和测量是在标准的优化设置下进行的。
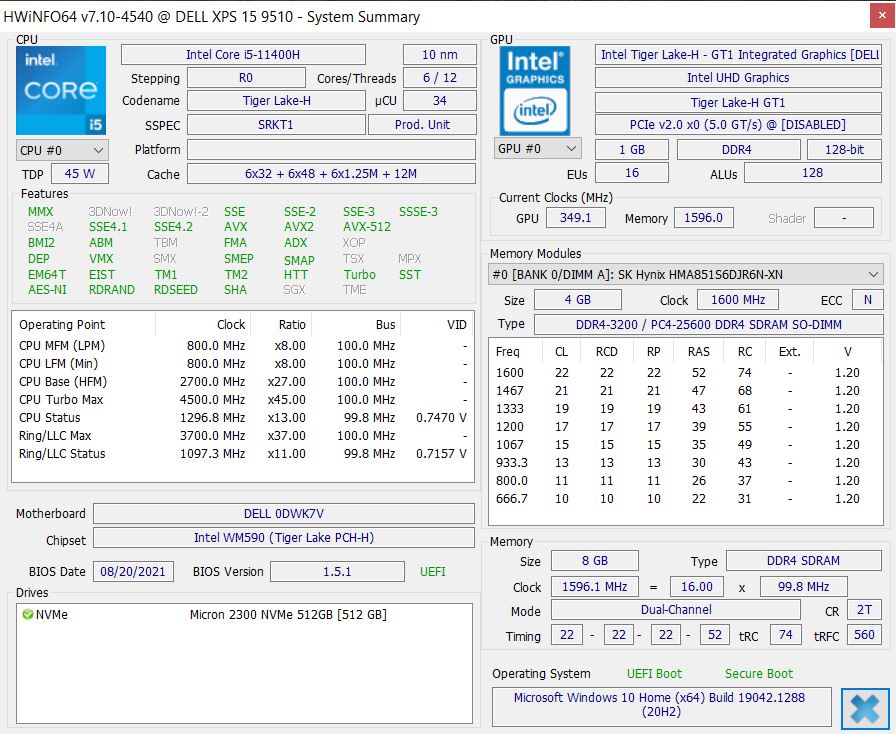
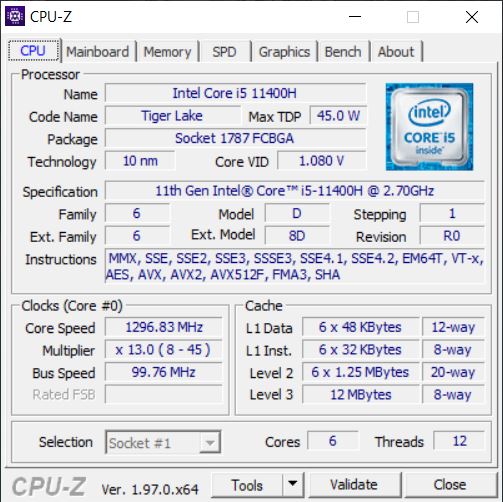
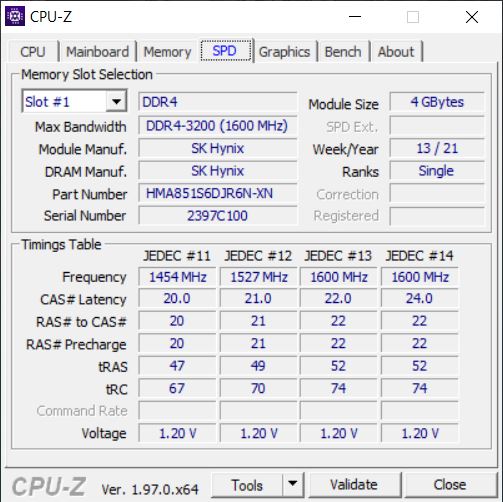
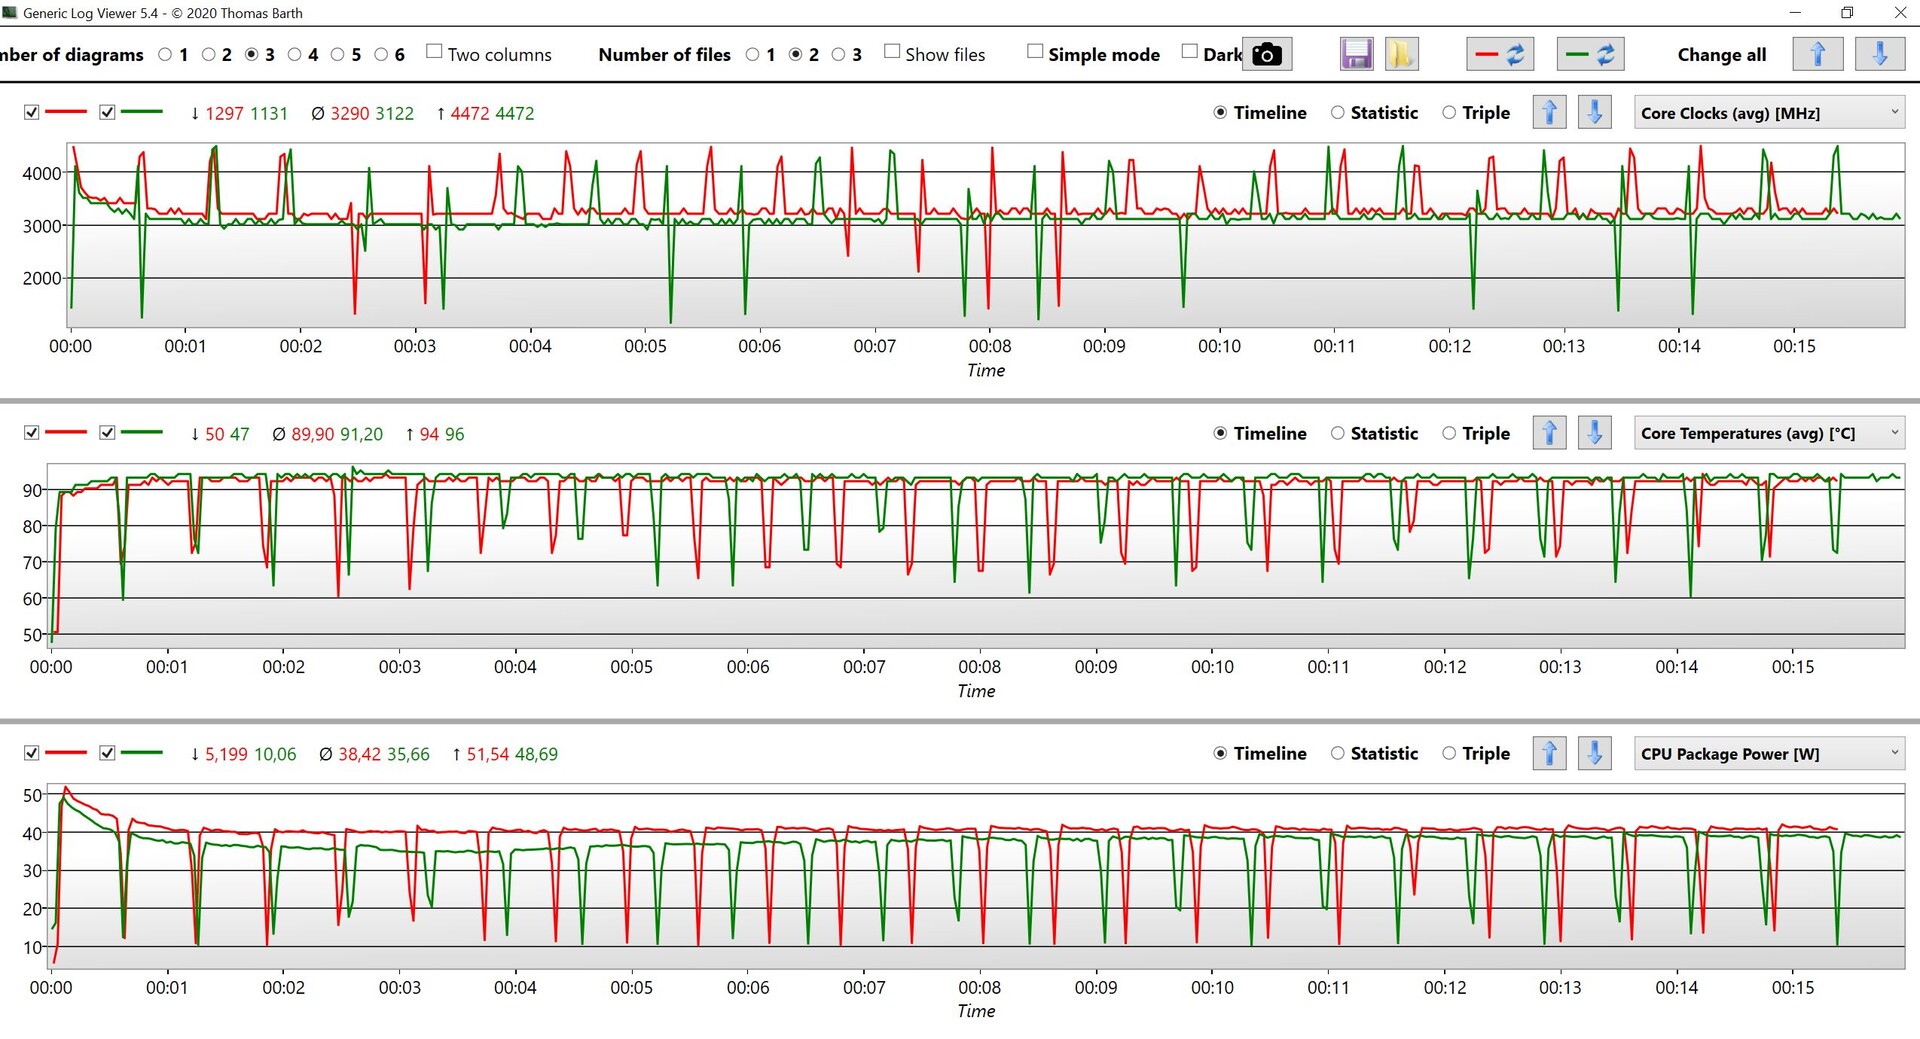
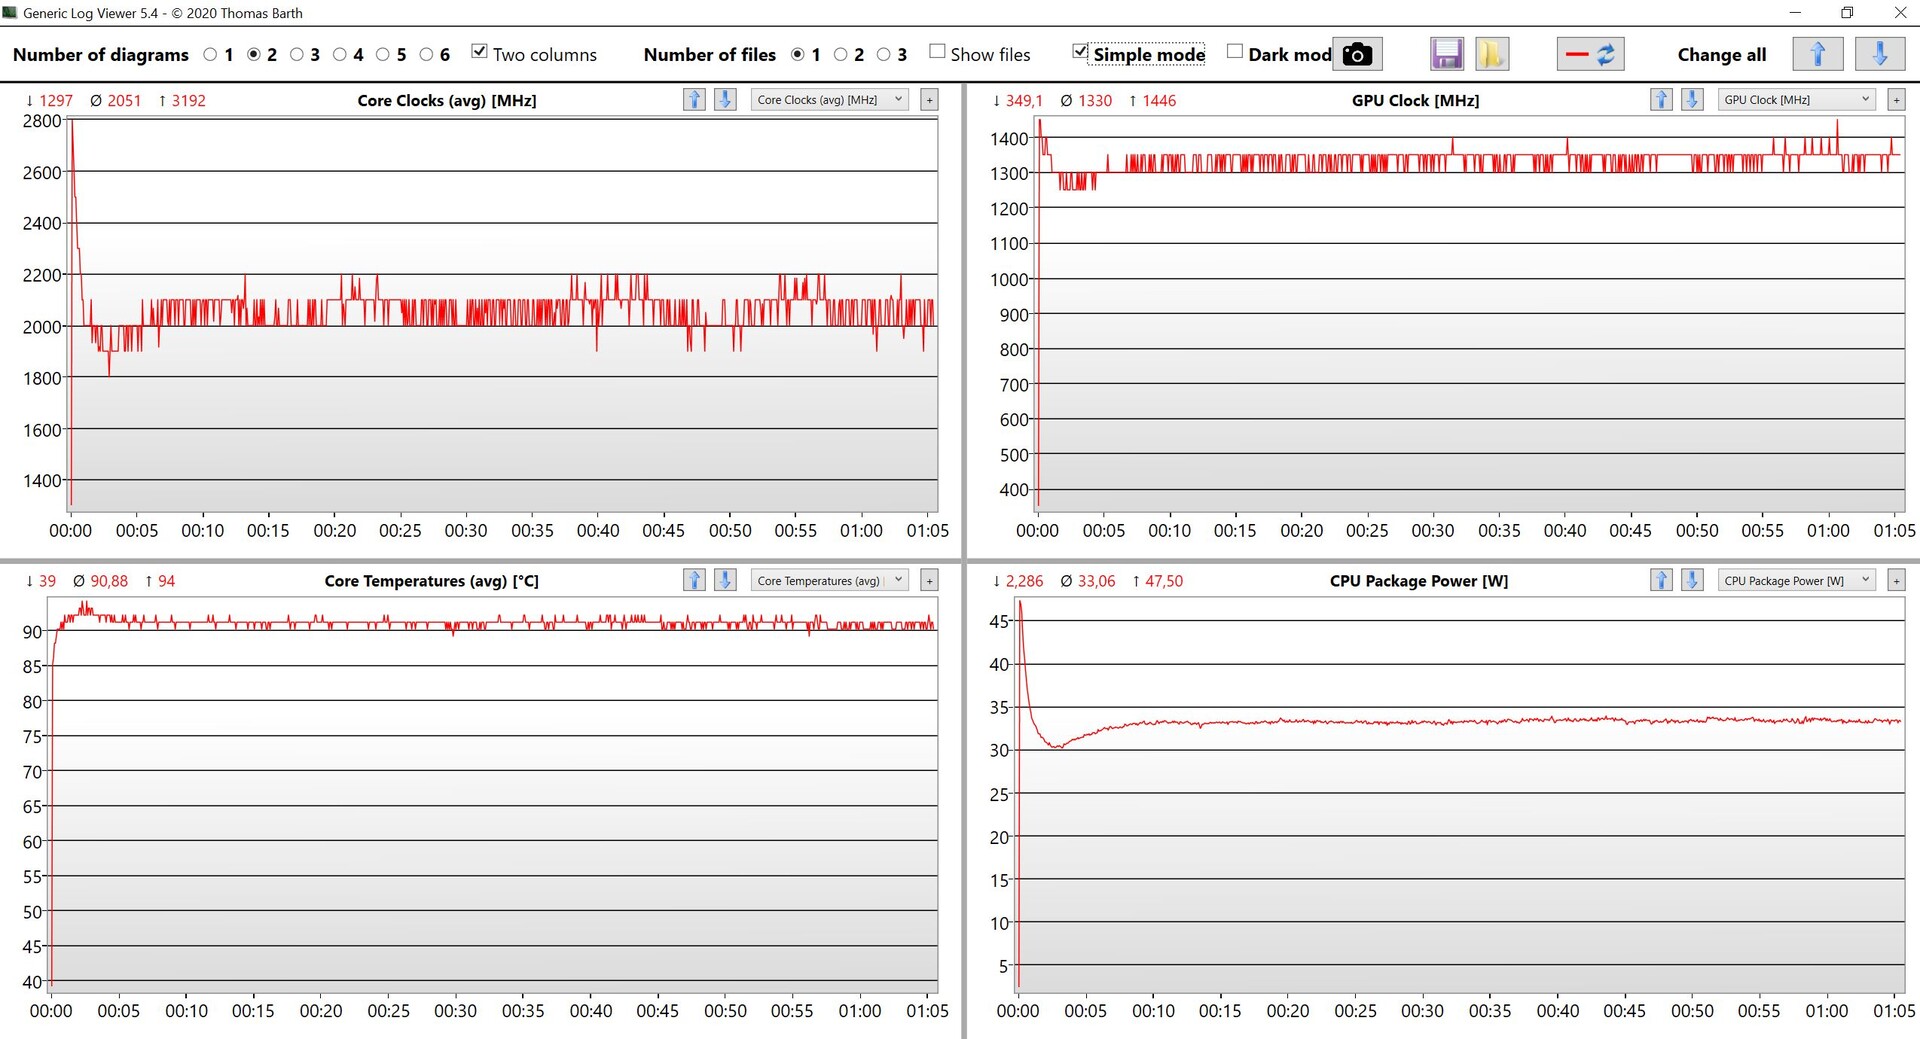
处理器 - 酷睿i5-11400H
芯片酷睿i5-11400H是一个六核处理器,能够在单核上达到4.5 GHz的最高速度,在所有内核上达到4.1 GHz。在开始时,该处理器接近50瓦的大关,但随后很快就平缓到40瓦以下(或在超性能模式下为40瓦)。由于强大的冷却功能,我们本以为它能够发挥酷睿i5-11400H的全部潜力。
与旧的 酷睿i5-10300H(四核)在XPS 15 9500的性能优势约为30%,但新的六核处理器几乎没有比 酷睿i7-11370H四核处理器的速度。 MateBook 14s.新的华为MateBook 16也令人印象深刻地展示了目前AMD的45瓦Ryzen处理器的可能性(在54瓦的多重测试中平均快70%)。虽然性能当然完全可以满足日常任务,但这里显然有一些浪费的潜力。
在电池运行时,TDP降低到只有15瓦,导致CPU性能在多核测试中下降约50%(579分@CB R15 Multi)。你可以在我们的 技术部分.
Cinebench R15 Multi Constant Load Test
Cinebench R20: CPU (Multi Core) | CPU (Single Core)
Cinebench R15: CPU Multi 64Bit | CPU Single 64Bit
Blender: v2.79 BMW27 CPU
7-Zip 18.03: 7z b 4 | 7z b 4 -mmt1
Geekbench 5.5: Multi-Core | Single-Core
HWBOT x265 Benchmark v2.2: 4k Preset
LibreOffice : 20 Documents To PDF
R Benchmark 2.5: Overall mean
| Cinebench R23 / Multi Core | |
| Average of class Multimedia (4861 - 33362, n=81, last 2 years) | |
| Dell XPS 15 9510 11800H RTX 3050 Ti OLED | |
| Average Intel Core i5-11400H (6674 - 9406, n=7) | |
| Dell XPS 15 9510 i5 11400H FHD | |
| Huawei MateBook 14s i7 | |
| Acer Swift 3 SF316-51 | |
| Schenker Vision 15 | |
| Cinebench R23 / Single Core | |
| Average of class Multimedia (1128 - 2459, n=73, last 2 years) | |
| Acer Swift 3 SF316-51 | |
| Huawei MateBook 14s i7 | |
| Dell XPS 15 9510 11800H RTX 3050 Ti OLED | |
| Average Intel Core i5-11400H (1349 - 1472, n=6) | |
| Dell XPS 15 9510 i5 11400H FHD | |
| Schenker Vision 15 | |
| Cinebench R20 / CPU (Multi Core) | |
| Average of class Multimedia (1887 - 12912, n=64, last 2 years) | |
| Dell XPS 15 9510 11800H RTX 3050 Ti OLED | |
| Honor MagicBook Pro (AMD) | |
| Average Intel Core i5-11400H (2550 - 3740, n=7) | |
| Dell XPS 15 9510 i5 11400H FHD | |
| Huawei MateBook 14s i7 | |
| Acer Swift 3 SF316-51 | |
| Dell XPS 15 9500 Core i5 | |
| Schenker Vision 15 | |
| Cinebench R20 / CPU (Single Core) | |
| Average of class Multimedia (425 - 853, n=64, last 2 years) | |
| Acer Swift 3 SF316-51 | |
| Huawei MateBook 14s i7 | |
| Dell XPS 15 9510 11800H RTX 3050 Ti OLED | |
| Dell XPS 15 9510 i5 11400H FHD | |
| Average Intel Core i5-11400H (522 - 569, n=6) | |
| Schenker Vision 15 | |
| Honor MagicBook Pro (AMD) | |
| Dell XPS 15 9500 Core i5 | |
| Cinebench R15 / CPU Multi 64Bit | |
| Average of class Multimedia (856 - 5224, n=68, last 2 years) | |
| Dell XPS 15 9510 11800H RTX 3050 Ti OLED | |
| Dell XPS 15 9510 11800H RTX 3050 Ti OLED | |
| Honor MagicBook Pro (AMD) | |
| Average Intel Core i5-11400H (1014 - 1532, n=7) | |
| Dell XPS 15 9510 i5 11400H FHD | |
| Dell XPS 15 9510 i5 11400H FHD | |
| Huawei MateBook 14s i7 | |
| Schenker Vision 15 | |
| Acer Swift 3 SF316-51 | |
| Dell XPS 15 9500 Core i5 | |
| Cinebench R15 / CPU Single 64Bit | |
| Average of class Multimedia (184.8 - 326, n=66, last 2 years) | |
| Huawei MateBook 14s i7 | |
| Acer Swift 3 SF316-51 | |
| Schenker Vision 15 | |
| Dell XPS 15 9510 11800H RTX 3050 Ti OLED | |
| Average Intel Core i5-11400H (202 - 219, n=6) | |
| Dell XPS 15 9510 i5 11400H FHD | |
| Dell XPS 15 9500 Core i5 | |
| Honor MagicBook Pro (AMD) | |
| Blender / v2.79 BMW27 CPU | |
| Schenker Vision 15 | |
| Dell XPS 15 9500 Core i5 | |
| Acer Swift 3 SF316-51 | |
| Huawei MateBook 14s i7 | |
| Dell XPS 15 9510 i5 11400H FHD | |
| Average Intel Core i5-11400H (340 - 483, n=6) | |
| Honor MagicBook Pro (AMD) | |
| Dell XPS 15 9510 11800H RTX 3050 Ti OLED | |
| Average of class Multimedia (100 - 557, n=65, last 2 years) | |
| 7-Zip 18.03 / 7z b 4 | |
| Average of class Multimedia (26062 - 130368, n=62, last 2 years) | |
| Dell XPS 15 9510 11800H RTX 3050 Ti OLED | |
| Honor MagicBook Pro (AMD) | |
| Average Intel Core i5-11400H (27615 - 40268, n=6) | |
| Dell XPS 15 9510 i5 11400H FHD | |
| Huawei MateBook 14s i7 | |
| Acer Swift 3 SF316-51 | |
| Schenker Vision 15 | |
| Dell XPS 15 9500 Core i5 | |
| 7-Zip 18.03 / 7z b 4 -mmt1 | |
| Average of class Multimedia (3666 - 7545, n=63, last 2 years) | |
| Dell XPS 15 9510 11800H RTX 3050 Ti OLED | |
| Acer Swift 3 SF316-51 | |
| Huawei MateBook 14s i7 | |
| Average Intel Core i5-11400H (4802 - 5343, n=6) | |
| Schenker Vision 15 | |
| Dell XPS 15 9510 i5 11400H FHD | |
| Dell XPS 15 9500 Core i5 | |
| Honor MagicBook Pro (AMD) | |
| Geekbench 5.5 / Multi-Core | |
| Average of class Multimedia (4652 - 20422, n=62, last 2 years) | |
| Dell XPS 15 9510 11800H RTX 3050 Ti OLED | |
| Average Intel Core i5-11400H (4679 - 7018, n=7) | |
| Acer Swift 3 SF316-51 | |
| Honor MagicBook Pro (AMD) | |
| Huawei MateBook 14s i7 | |
| Dell XPS 15 9510 i5 11400H FHD | |
| Schenker Vision 15 | |
| Dell XPS 15 9500 Core i5 | |
| Geekbench 5.5 / Single-Core | |
| Average of class Multimedia (805 - 2974, n=62, last 2 years) | |
| Acer Swift 3 SF316-51 | |
| Huawei MateBook 14s i7 | |
| Schenker Vision 15 | |
| Dell XPS 15 9510 11800H RTX 3050 Ti OLED | |
| Dell XPS 15 9510 i5 11400H FHD | |
| Average Intel Core i5-11400H (1396 - 1528, n=7) | |
| Dell XPS 15 9500 Core i5 | |
| Honor MagicBook Pro (AMD) | |
| HWBOT x265 Benchmark v2.2 / 4k Preset | |
| Average of class Multimedia (5.26 - 36.1, n=63, last 2 years) | |
| Dell XPS 15 9510 11800H RTX 3050 Ti OLED | |
| Honor MagicBook Pro (AMD) | |
| Average Intel Core i5-11400H (8.19 - 11.3, n=6) | |
| Dell XPS 15 9510 i5 11400H FHD | |
| Huawei MateBook 14s i7 | |
| Acer Swift 3 SF316-51 | |
| Schenker Vision 15 | |
| Dell XPS 15 9500 Core i5 | |
| LibreOffice / 20 Documents To PDF | |
| Dell XPS 15 9500 Core i5 | |
| Honor MagicBook Pro (AMD) | |
| Average of class Multimedia (23.9 - 146.7, n=64, last 2 years) | |
| Dell XPS 15 9510 11800H RTX 3050 Ti OLED | |
| Average Intel Core i5-11400H (41.4 - 53, n=6) | |
| Dell XPS 15 9510 i5 11400H FHD | |
| Schenker Vision 15 | |
| Huawei MateBook 14s i7 | |
| Acer Swift 3 SF316-51 | |
| R Benchmark 2.5 / Overall mean | |
| Dell XPS 15 9500 Core i5 | |
| Honor MagicBook Pro (AMD) | |
| Average Intel Core i5-11400H (0.581 - 0.644, n=6) | |
| Dell XPS 15 9510 i5 11400H FHD | |
| Schenker Vision 15 | |
| Dell XPS 15 9510 11800H RTX 3050 Ti OLED | |
| Huawei MateBook 14s i7 | |
| Acer Swift 3 SF316-51 | |
| Average of class Multimedia (0.3604 - 0.947, n=63, last 2 years) | |
* ... smaller is better
系统性能
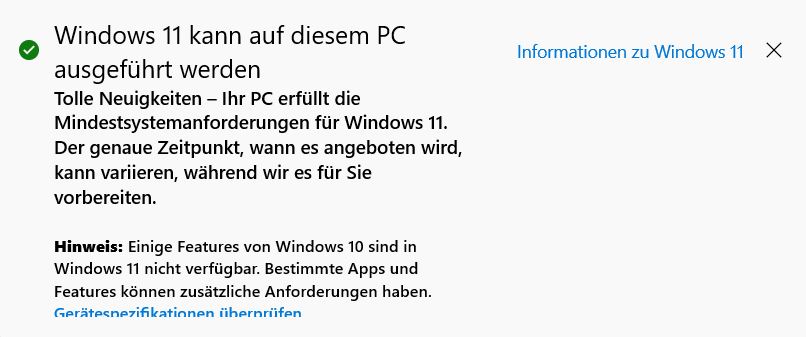
由于CPU/iGPU的组合相对较弱,XPS 15 9510只能勉强排在老款XPS 15的前面。 旧的XPS 15在合成的PCMark 10基准测试中,仅在比较组的最后一位。然而,在日常工作中,这一点并不明显,XPS 15只是一台反应非常快的电脑,这当然也是由于快速的PCIe SSD。XPS 15 9510兼容Windows 11。
| PCMark 10 / Score | |
| Average of class Multimedia (4325 - 10386, n=58, last 2 years) | |
| Dell XPS 15 9510 11800H RTX 3050 Ti OLED | |
| Acer Swift 3 SF316-51 | |
| Huawei MateBook 14s i7 | |
| Schenker Vision 15 | |
| Honor MagicBook Pro (AMD) | |
| Average Intel Core i5-11400H, Intel UHD Graphics Xe 16EUs (4502 - 4525, n=2) | |
| Dell XPS 15 9510 i5 11400H FHD | |
| Dell XPS 15 9500 Core i5 | |
| PCMark 10 / Essentials | |
| Huawei MateBook 14s i7 | |
| Schenker Vision 15 | |
| Average of class Multimedia (8025 - 11664, n=57, last 2 years) | |
| Acer Swift 3 SF316-51 | |
| Dell XPS 15 9500 Core i5 | |
| Dell XPS 15 9510 11800H RTX 3050 Ti OLED | |
| Average Intel Core i5-11400H, Intel UHD Graphics Xe 16EUs (9463 - 9513, n=2) | |
| Dell XPS 15 9510 i5 11400H FHD | |
| Honor MagicBook Pro (AMD) | |
| PCMark 10 / Productivity | |
| Average of class Multimedia (7323 - 18233, n=57, last 2 years) | |
| Dell XPS 15 9510 11800H RTX 3050 Ti OLED | |
| Acer Swift 3 SF316-51 | |
| Honor MagicBook Pro (AMD) | |
| Huawei MateBook 14s i7 | |
| Dell XPS 15 9500 Core i5 | |
| Schenker Vision 15 | |
| Average Intel Core i5-11400H, Intel UHD Graphics Xe 16EUs (6466 - 6495, n=2) | |
| Dell XPS 15 9510 i5 11400H FHD | |
| PCMark 10 / Digital Content Creation | |
| Average of class Multimedia (3651 - 16240, n=57, last 2 years) | |
| Dell XPS 15 9510 11800H RTX 3050 Ti OLED | |
| Acer Swift 3 SF316-51 | |
| Huawei MateBook 14s i7 | |
| Honor MagicBook Pro (AMD) | |
| Schenker Vision 15 | |
| Average Intel Core i5-11400H, Intel UHD Graphics Xe 16EUs (4047 - 4072, n=2) | |
| Dell XPS 15 9510 i5 11400H FHD | |
| Dell XPS 15 9500 Core i5 | |
| PCMark 10 Score | 4502 points | |
Help | ||
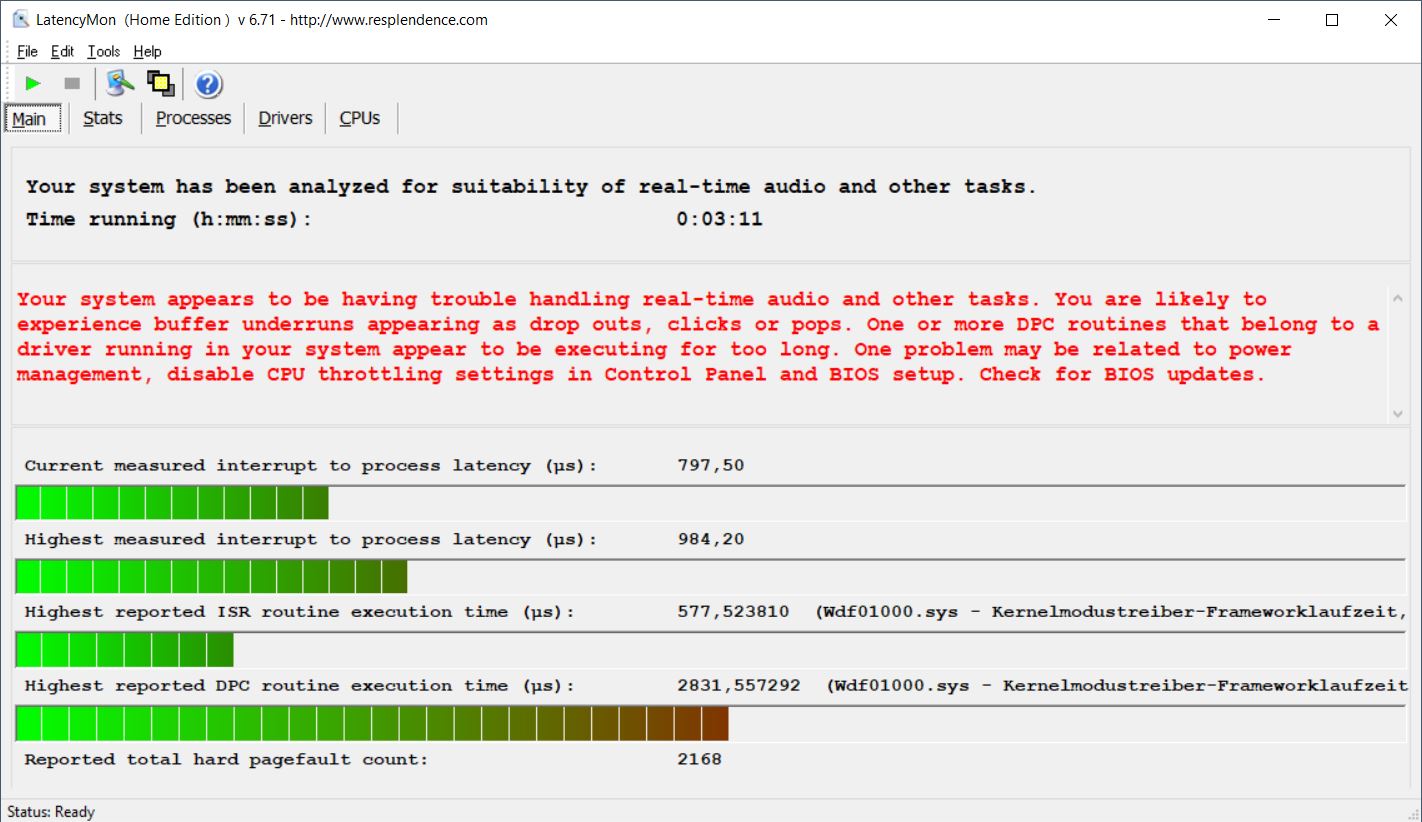
DPC延迟
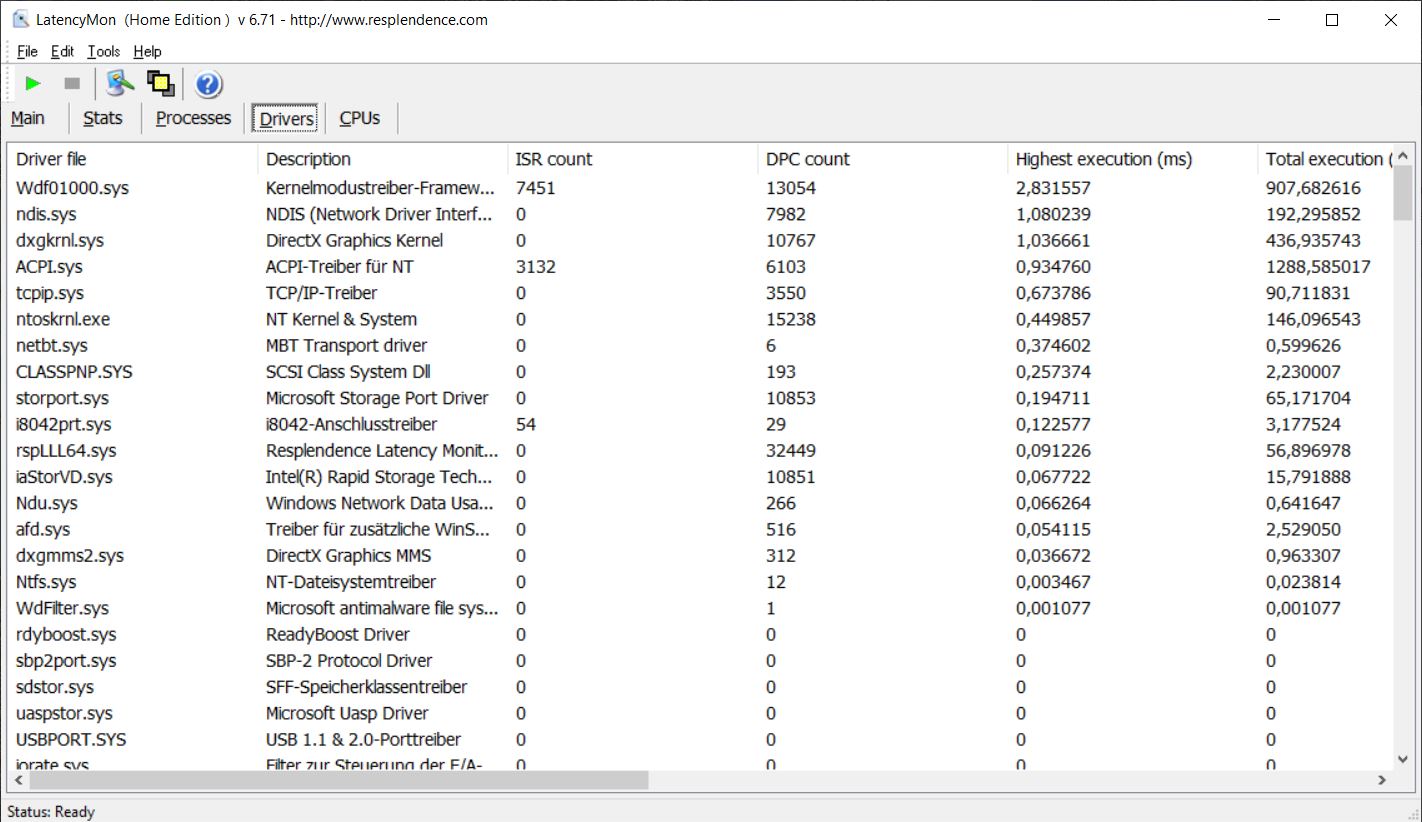
| DPC Latencies / LatencyMon - interrupt to process latency (max), Web, Youtube, Prime95 | |
| Schenker Vision 15 | |
| Dell XPS 15 9510 11800H RTX 3050 Ti OLED | |
| Dell XPS 15 9500 Core i5 | |
| Honor MagicBook Pro (AMD) | |
| Dell XPS 15 9510 i5 11400H FHD | |
| Huawei MateBook 14s i7 | |
| Acer Swift 3 SF316-51 | |
* ... smaller is better
存储解决方案
我们的测试装置配备了来自美光的快速PCIe 3.0固态硬盘,它提供了512GB的存储容量(首次打开后有411GB可用)。由于有第二个M.2 2280插槽,如果有必要,存储容量可以很容易地扩展。你可以找到更多的固态硬盘基准测试 这里.
| Dell XPS 15 9510 i5 11400H FHD Micron 2300 512GB MTFDHBA512TDV | Huawei MateBook 14s i7 Toshiba XG6 KXG60ZNV512G | Acer Swift 3 SF316-51 Micron 2210 MTFDHBA512QFD | Honor MagicBook Pro (AMD) WDC PC SN730 SDBPNTY-512G | Dell XPS 15 9500 Core i5 Toshiba KBG40ZNS256G NVMe | Dell XPS 15 9510 11800H RTX 3050 Ti OLED Micron 2300 512GB MTFDHBA512TDV | Schenker Vision 15 Samsung SSD 980 Pro 1TB MZ-V8P1T0BW | Average Micron 2300 512GB MTFDHBA512TDV | Average of class Multimedia | |
|---|---|---|---|---|---|---|---|---|---|
| CrystalDiskMark 5.2 / 6 | 28% | -2% | -6% | -30% | -2% | 88% | -1% | 42% | |
| Write 4K (MB/s) | 110.3 | 209.4 90% | 171.8 56% | 156.9 42% | 93.3 -15% | 109.3 -1% | 238.1 116% | 105.5 ? -4% | 162.8 ? 48% |
| Read 4K (MB/s) | 57.1 | 56.8 -1% | 79.4 39% | 48.81 -15% | 45.9 -20% | 53.9 -6% | 79.2 39% | 51.2 ? -10% | 67.4 ? 18% |
| Write Seq (MB/s) | 1958 | 1099 -44% | 1050 -46% | 1211 -38% | 1991 2% | 4139 111% | 2041 ? 4% | 2680 ? 37% | |
| Read Seq (MB/s) | 1781 | 1847 4% | 2517 41% | 1633 -8% | 1759 -1% | 4133 132% | 1845 ? 4% | 3133 ? 76% | |
| Write 4K Q32T1 (MB/s) | 495.7 | 606 22% | 539 9% | 408.7 -18% | 273.1 -45% | 499.8 1% | 697 41% | 494 ? 0% | 454 ? -8% |
| Read 4K Q32T1 (MB/s) | 474.4 | 792 67% | 555 17% | 504 6% | 356 -25% | 438.8 -8% | 758 60% | 445 ? -6% | 578 ? 22% |
| Write Seq Q32T1 (MB/s) | 2839 | 2322 -18% | 1095 -61% | 1087 -62% | 1198 -58% | 2835 0% | 5187 83% | 2867 ? 1% | 4604 ? 62% |
| Read Seq Q32T1 (MB/s) | 3243 | 3511 8% | 1988 -39% | 3407 5% | 2269 -30% | 3235 0% | 7117 119% | 3272 ? 1% | 5817 ? 79% |
| Write 4K Q8T8 (MB/s) | 1573 | 1077 ? | |||||||
| Read 4K Q8T8 (MB/s) | 1202 | 1365 ? | |||||||
| AS SSD | 46% | 11% | 74% | -55% | -8% | 135% | 10% | 74% | |
| Seq Read (MB/s) | 2602 | 2961 14% | 2015 -23% | 2749 6% | 1423 -45% | 1362 -48% | 5427 109% | 2300 ? -12% | 4466 ? 72% |
| Seq Write (MB/s) | 976 | 2098 115% | 1055 8% | 2348 141% | 766 -22% | 1440 48% | 3886 298% | 1550 ? 59% | 3049 ? 212% |
| 4K Read (MB/s) | 42.99 | 53 23% | 73.9 72% | 44.22 3% | 42.21 -2% | 38.43 -11% | 72.9 70% | 45 ? 5% | 60.9 ? 42% |
| 4K Write (MB/s) | 127.1 | 186.9 47% | 223.2 76% | 140.5 11% | 74.8 -41% | 121.4 -4% | 219.3 73% | 106.6 ? -16% | 184.9 ? 45% |
| 4K-64 Read (MB/s) | 383.3 | 1131 195% | 589 54% | 1450 278% | 973 154% | 370.5 -3% | 2209 476% | 676 ? 76% | 1061 ? 177% |
| 4K-64 Write (MB/s) | 1346 | 1502 12% | 1029 -24% | 2346 74% | 218.8 -84% | 1054 -22% | 2265 68% | 1616 ? 20% | 2196 ? 63% |
| Access Time Read * (ms) | 0.037 | 0.029 22% | 0.056 -51% | 0.079 -114% | 0.125 -238% | 0.042 -14% | 0.033 11% | 0.059 ? -59% | 0.05918 ? -60% |
| Access Time Write * (ms) | 0.117 | 0.026 78% | 0.039 67% | 0.027 77% | 0.552 -372% | 0.135 -15% | 0.02 83% | 0.1807 ? -54% | 0.07572 ? 35% |
| Score Read (Points) | 687 | 1480 115% | 865 26% | 1769 157% | 1157 68% | 545 -21% | 2825 311% | 952 ? 39% | 1568 ? 128% |
| Score Write (Points) | 1571 | 1899 21% | 1358 -14% | 2721 73% | 370 -76% | 1319 -16% | 2873 83% | 1877 ? 19% | 2686 ? 71% |
| Score Total (Points) | 2541 | 4102 61% | 2644 4% | 5376 112% | 2094 -18% | 2160 -15% | 7069 178% | 3290 ? 29% | 4998 ? 97% |
| Copy ISO MB/s (MB/s) | 1074 | 1512 41% | 1186 10% | 1151 7% | 1406 31% | 2775 158% | 1603 ? 49% | 2811 ? 162% | |
| Copy Program MB/s (MB/s) | 874 | 376.3 -57% | 782 -11% | 499.4 -43% | 844 -3% | 662 -24% | 843 ? -4% | 858 ? -2% | |
| Copy Game MB/s (MB/s) | 1805 | 1115 -38% | 1028 -43% | 733 -59% | 1353 -25% | 1655 -8% | 1570 ? -13% | 1724 ? -4% | |
| Total Average (Program / Settings) | 37% /
41% | 5% /
6% | 34% /
41% | -43% /
-46% | -5% /
-6% | 112% /
118% | 5% /
6% | 58% /
62% |
* ... smaller is better

Constant Performance Reading: DiskSpd Read Loop, Queue Depth 8
图形卡
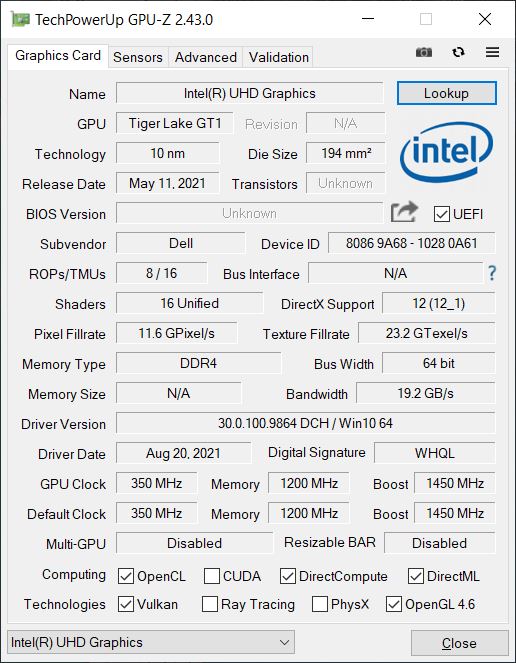
i5-11400H和其他Tiger Lake H45 CPU之间最大的区别是集成GPU,因为只有一个瘦身的UHD Graphics Xe图形芯片,有16个EU(酷睿i7-11800H:32EUs, 酷睿i7-11370H:96EUs).因此,纯粹的图形性能只达到了旧的 XPS 15 9500与UHD Graphics 630,尽管已经使用了双通道内存。新的iGPU的唯一优势是改进了Tiger Lake 代的视频解码器,在4K视频复制过程中大大降低了GPU的负载(约30%,而旧的UHD Graphics 630为60%)。
在这种配置下,XPS 15几乎不适合游戏,许多游戏即使在最小的细节设置下也不能流畅地运行。那些仍然想玩游戏的人应该集中在Windows商店的简单游戏上。
图形性能在恒定负载下,以及在电池运行期间保持稳定。你可以找到更多的基准测试 这里.
| 3DMark 06 Standard Score | 12803 points | |
| 3DMark Vantage P Result | 7609 points | |
| 3DMark 11 Performance | 1979 points | |
| 3DMark Ice Storm Standard Score | 57212 points | |
| 3DMark Cloud Gate Standard Score | 10288 points | |
| 3DMark Fire Strike Score | 1298 points | |
| 3DMark Time Spy Score | 433 points | |
Help | ||
| low | med. | high | ultra | |
|---|---|---|---|---|
| GTA V (2015) | 62.8 | 50 | 9.2 | |
| The Witcher 3 (2015) | 27 | 17 | 9 | 5 |
| Dota 2 Reborn (2015) | 108 | 57 | 23.1 | 21.5 |
| Final Fantasy XV Benchmark (2018) | 14.6 | 6.87 | 4.79 | |
| X-Plane 11.11 (2018) | 18.4 | 16.8 | 15.4 | |
| Strange Brigade (2018) | 31 | 12 | 11 | 7 |
| F1 2020 (2020) | 26 | 12 | ||
| F1 2021 (2021) | 34 |
Emissions and Power
噪声排放
低性能的优势在于安静的风扇,在日常操作中(上网、视频流),你几乎听不到。即使在满负荷的情况下,也需要几分钟时间才能达到近38dB(A)的最高水平。我们没有注意到任何其他电子噪音,如线圈啸叫。
Noise level
| Idle |
| 24.4 / 24.4 / 24.4 dB(A) |
| Load |
| 26.1 / 37.7 dB(A) |
 | ||
30 dB silent 40 dB(A) audible 50 dB(A) loud |
||
min: | ||
| Dell XPS 15 9510 i5 11400H FHD UHD Graphics Xe 16EUs, i5-11400H, Micron 2300 512GB MTFDHBA512TDV | Huawei MateBook 14s i7 Iris Xe G7 96EUs, i7-11370H, Toshiba XG6 KXG60ZNV512G | Acer Swift 3 SF316-51 Iris Xe G7 96EUs, i7-11370H, Micron 2210 MTFDHBA512QFD | Honor MagicBook Pro (AMD) Vega 6, R5 4600H, WDC PC SN730 SDBPNTY-512G | Dell XPS 15 9500 Core i5 UHD Graphics 630, i5-10300H, Toshiba KBG40ZNS256G NVMe | Dell XPS 15 9510 11800H RTX 3050 Ti OLED GeForce RTX 3050 Ti Laptop GPU, i7-11800H, Micron 2300 512GB MTFDHBA512TDV | Schenker Vision 15 Iris Xe G7 96EUs, i7-1165G7, Samsung SSD 980 Pro 1TB MZ-V8P1T0BW | |
|---|---|---|---|---|---|---|---|
| Noise | -8% | -11% | -14% | -13% | -6% | -25% | |
| off / environment * (dB) | 24.4 | 24.3 -0% | 26 -7% | 29.7 -22% | 28 -15% | 23.8 2% | 29.8 -22% |
| Idle Minimum * (dB) | 24.4 | 24.3 -0% | 26 -7% | 29.7 -22% | 28 -15% | 23.8 2% | 29.8 -22% |
| Idle Average * (dB) | 24.4 | 24.3 -0% | 26 -7% | 29.7 -22% | 28 -15% | 23.8 2% | 29.8 -22% |
| Idle Maximum * (dB) | 24.4 | 28.4 -16% | 27.7 -14% | 30.5 -25% | 28 -15% | 23.8 2% | 31.1 -27% |
| Load Average * (dB) | 26.1 | 31.7 -21% | 32.7 -25% | 31 -19% | 28 -7% | 36 -38% | 40.5 -55% |
| Witcher 3 ultra * (dB) | 33.2 | 31.7 5% | 31.3 6% | 36 -8% | 40.5 -22% | ||
| Load Maximum * (dB) | 37.7 | 46.8 -24% | 39 -3% | 36.7 3% | 41.9 -11% | 38.2 -1% | 40.5 -7% |
* ... smaller is better
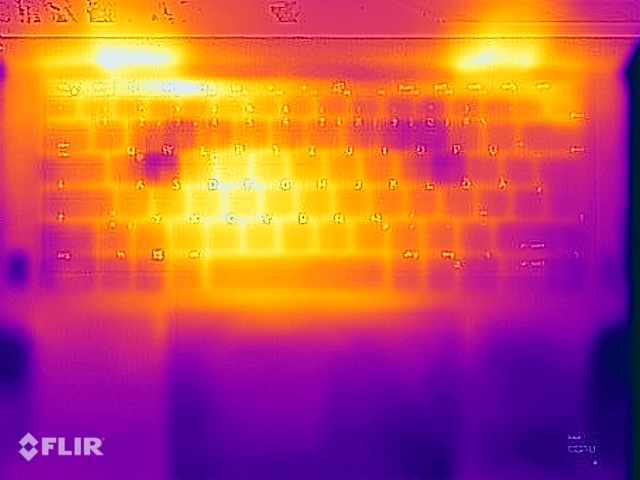
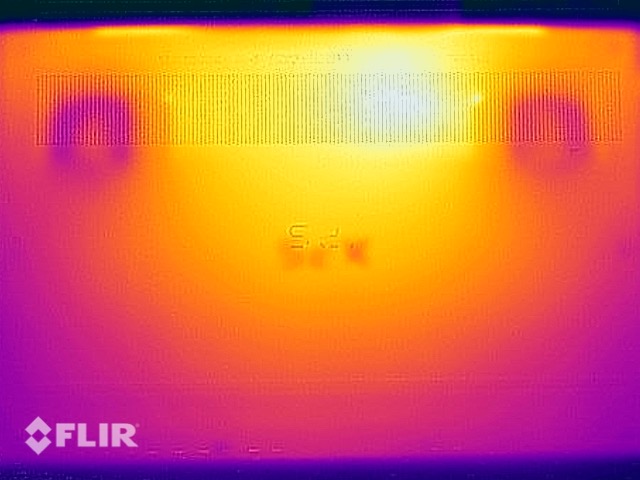
温度
在任何情况下,表面温度都没有让人担心的理由,即使在负载下,你也可以把电脑放在腿上。在压力测试期间,性能甚至进一步降低,其水平仅为34瓦(CPU:~2 GHz,iGPU:~1.3 GHz),这又是非常少的。
(±) The maximum temperature on the upper side is 42.8 °C / 109 F, compared to the average of 36.8 °C / 98 F, ranging from 21 to 71 °C for the class Multimedia.
(±) The bottom heats up to a maximum of 41.2 °C / 106 F, compared to the average of 39.1 °C / 102 F
(+) In idle usage, the average temperature for the upper side is 25.2 °C / 77 F, compared to the device average of 31.3 °C / 88 F.
(±) Playing The Witcher 3, the average temperature for the upper side is 34.5 °C / 94 F, compared to the device average of 31.3 °C / 88 F.
(+) The palmrests and touchpad are cooler than skin temperature with a maximum of 31.5 °C / 88.7 F and are therefore cool to the touch.
(-) The average temperature of the palmrest area of similar devices was 28.7 °C / 83.7 F (-2.8 °C / -5 F).
发言人
Dell XPS 15 9510 i5 11400H FHD audio analysis
(+) | speakers can play relatively loud (88.8 dB)
Bass 100 - 315 Hz
(±) | reduced bass - on average 5.6% lower than median
(+) | bass is linear (4.3% delta to prev. frequency)
Mids 400 - 2000 Hz
(+) | balanced mids - only 3.9% away from median
(+) | mids are linear (4.1% delta to prev. frequency)
Highs 2 - 16 kHz
(+) | balanced highs - only 2.4% away from median
(+) | highs are linear (4.9% delta to prev. frequency)
Overall 100 - 16.000 Hz
(+) | overall sound is linear (8.4% difference to median)
Compared to same class
» 9% of all tested devices in this class were better, 2% similar, 89% worse
» The best had a delta of 5%, average was 17%, worst was 45%
Compared to all devices tested
» 2% of all tested devices were better, 1% similar, 97% worse
» The best had a delta of 4%, average was 24%, worst was 134%
Acer Swift 3 SF316-51 audio analysis
(±) | speaker loudness is average but good (75.2 dB)
Bass 100 - 315 Hz
(-) | nearly no bass - on average 25.5% lower than median
(±) | linearity of bass is average (12.1% delta to prev. frequency)
Mids 400 - 2000 Hz
(+) | balanced mids - only 2.7% away from median
(+) | mids are linear (5.2% delta to prev. frequency)
Highs 2 - 16 kHz
(+) | balanced highs - only 3.8% away from median
(+) | highs are linear (2.9% delta to prev. frequency)
Overall 100 - 16.000 Hz
(±) | linearity of overall sound is average (17.7% difference to median)
Compared to same class
» 51% of all tested devices in this class were better, 7% similar, 42% worse
» The best had a delta of 5%, average was 17%, worst was 45%
Compared to all devices tested
» 35% of all tested devices were better, 8% similar, 57% worse
» The best had a delta of 4%, average was 24%, worst was 134%
消耗功率
考虑到大型和非常明亮的显示屏,XPS 15的空载消耗非常低。顺便说一下,基本型号交付的是一个较弱的90瓦电源(USB-C),而高端XPS 15包括一个130瓦的电源。然而,由于压力测试期间的最大消耗只有76瓦,然后迅速平息在57瓦,因此90瓦的电源完全足够。
| Off / Standby | |
| Idle | |
| Load |
|
Key:
min: | |
Power Consumption Witcher 3 / Stress Test
电池寿命
高效的FHD面板在电池寿命方面也变得很明显,尽管电池较小,但实际上在我们的WLAN测试中,电池寿命可能达到6.5至7.5小时(取决于亮度;150cd/m² @24%)。然而,这里也有一些潜力被浪费了,因为如果使用更大的86瓦时电池,这里可能会有10-11小时。尽管i5 XPS仍然领先于其 OLED兄弟姐妹但它最终在我们的比较组中排名最后。
Pros
Cons
结论 - 带有Core i5和iGPU的XPS 15 9510太贵了
原则上,提供高品质多媒体笔记本电脑而不配备专用显卡的概念肯定是有道理的,因为不是每个人都还想用笔记本电脑玩游戏。然而,新的XPS 15 9510在这方面似乎没有考虑周全,所使用的i5-11400H并不适合。众所周知,戴尔在XPS 15上不使用AMD的CPU,但如果使用酷睿i7-11370H会更好。尽管少了两个CPU核心,但在日常运行中CPU的性能并没有明显下降,但集成的GPU明显更快。
总的来说,测试装置的实际性能非常令人失望。尽管有与高端型号相同的冷却装置,但几秒钟后TDP已经被限制在40瓦。图形性能与老款相比也没有提高 XPS 15 9500 iGPU.但至少XPS 15在日常操作中几乎一直保持沉默,即使在负载下,风扇也非常安静。虽然这在日常操作中可能是积极的,但至少在可选的超性能模式下,我们希望能有最大的CPU性能,即使那时风扇的声音更大。
新的XPS 15 9510的iGPU模式对于所提供的性能来说简直太昂贵了。对于那些对没有专用GPU的XPS 15感兴趣的人,我们推荐旧的XPS 15 9500,它仍然可以从戴尔那里以1250欧元(约1456美元)的价格买到,而且速度几乎没有任何下降。
哑光全高清显示屏仍然非常明亮,因此非常适用于在户外使用。耗电量也保持在限制范围内,但不幸的是,戴尔在其入门级机型中也使用了较小的电池,这意味着电池寿命也不是特别好。这里肯定有一些潜力被浪费了。总的来说, 申克尔Vision 15是一个更好的选择,也有许多多媒体笔记本电脑具有更好的性价比,如 Honor MagicBook Pro,以及Acer Swift 3 16,还有 华为MateBook 14s其伟大的3:2显示屏。此外,还推出了另一个竞争者,即 MateBook 16这款产品由于采用了Ryzen 7-5800H处理器,性能显著提高。 Ryzen 7-5800H处理器.但是,如果它绝对必须是XPS 15与明亮的FHD面板,我们推荐的是 XPS 15 9500前身,它为日常任务提供的CPU性能几乎没有减少,并继续从戴尔获得1250欧元(约1456美元)的价格。
价格和可用性
我们的测试配置可从戴尔公司购买,价格约为1300美元。,也有许多其他配置可供选择。例如,配备酷睿i7-11800H、专用GeForce RTX 3050、16GB内存、哑光FHD面板和较大电池的机型价格约为$1900.
Dell XPS 15 9510 i5 11400H FHD
- 10/20/2021 v7 (old)
Andreas Osthoff
Price comparison

