


联想ThinkPad X13 G3 AMD笔记本电脑评论:已经非常好的ThinkPad在Ryzen 6000的帮助下变得更好了
ThinkPad X13第二代AMD已经通过Ryzen 5000提供了令人信服的出场机会。从去年开始,同样的平台可以使用Ryzen 6000。这款面向商业客户的紧凑型ThinkPad没有让人失望,即使在2023年也仍然是一个不错的选择。
AMD Ryzen 5 PRO 6650U, Radeon 660M, 13.3", 1.3 kg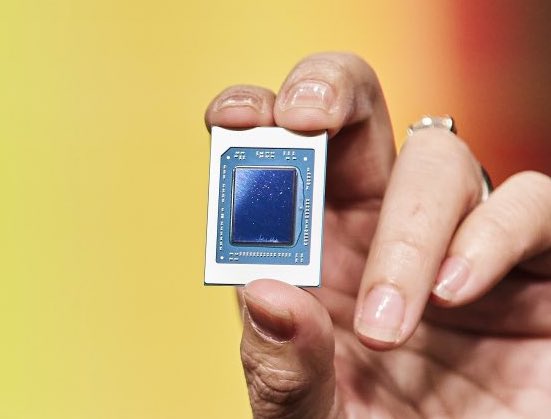
AMD Ryzen 5 PRO 6650U是基于伦勃朗一代的轻薄笔记本处理器。Ryzen 拥有基于 Zen 3+ 微架构的八个内核中的六个。它们的主频为 2.9(保证基本时钟)至 4.5 GHz(Turbo),支持 SMT/超线程(12 个线程)。芯片采用现代 6 纳米台积电工艺制造。Ryzen 5 PRO 6650U 是消费级R5 6600U具有额外的管理功能和 Microsoft Pluton 安全处理器。与类似的 R5 6650H相比,6850U 提供了更低的基本时钟速度和更低的 TDP。
新的 Zen 3+ 是 Zen 3 架构的更新,应该不会有太大变化。不过,芯片本身提供了很多新功能,如支持 USB 4(40 Gbps)、PCI-E Gen 4、DDR5-4800MT/s 或 LPDDR5-6400MT/s、WiFi 6E、蓝牙 LE 5.2、DisplayPort 2 和 AV1 解码。
性能
我们数据库中 6650U 的平均性能非常接近 酷睿 i7-1260P和 酷睿 i7-10870H就多线程基准测试成绩而言,6650U 与酷睿 i7-1260P 和酷睿 i7-10870H 非常接近。截至 2022 年底,这是一个非常不错的成绩。
得益于体面的冷却解决方案和 32 W 的 CPU 长期功耗限制,ThinkPad T16 G1 ThinkPad T16 G1是我们所知道的最快的基于 6650U 的笔记本电脑之一。截至 2023 年 8 月,它在 CPU 负载工作负载中的速度比我们数据库中采用相同芯片的最慢系统快约 20%。
在 6000 系列中,AMD 最终将 iGPU 转换为当前的 RDNA 2 图形架构。6650U 只提供小型Radeon 660M12 个 CU 中的 6 个,最大时钟频率为 1.9 GHz。
APU 的 TDP 规定为 15 - 28 瓦(默认值)。得益于改进的 6nm 工艺和 6000 系列的额外省电功能,功耗效率应该会很高。
| Codename | Rembrandt-U PRO (Zen 3+) | ||||||||
| Series | AMD Rembrandt (Zen 3+) | ||||||||
Series: Rembrandt (Zen 3+) Rembrandt-U PRO (Zen 3+)
| |||||||||
| Clock Rate | 2900 - 4500 MHz | ||||||||
| Level 1 Cache | 384 KB | ||||||||
| Level 2 Cache | 3 MB | ||||||||
| Level 3 Cache | 16 MB | ||||||||
| Number of Cores / Threads | 6 / 12 | ||||||||
| Power Consumption (TDP = Thermal Design Power) | 28 Watt | ||||||||
| Manufacturing Technology | 6 nm | ||||||||
| Max. Temperature | 95 °C | ||||||||
| Socket | FP7/FP7r2 | ||||||||
| Features | DDR5-4800/LPDDR5-6400 RAM (incl. ECC), PCIe 4, PRO, MMX, SSE, SSE2, SSE3, SSSE3, SSE4A, SSE4.1, SSE4.2, AVX, AVX2, BMI2, ABM, FMA, ADX, SMEP, SMAP, SMT, CPB, AES-NI, RDRAND, RDSEED, SHA | ||||||||
| GPU | AMD Radeon 660M ( - 1900 MHz) | ||||||||
| 64 Bit | 64 Bit support | ||||||||
| Architecture | x86 | ||||||||
| Announcement Date | 04/20/2022 | ||||||||
| Product Link (external) | www.amd.com | ||||||||


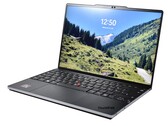
Lenovo ThinkPad Z13 21D2CTO1WW: AMD Radeon 660M, 13.30", 1.2 kg
External Review » Lenovo ThinkPad Z13 21D2CTO1WW
» Notebookcheck多媒体笔记本电脑Top 10排名
» Notebookcheck游戏笔记本电脑Top 10排名
» Notebookcheck低价办公/商务笔记本电脑Top 10排名
» Notebookcheck高端办公/商务笔记本电脑Top 10排名
» Notebookcheck工作站笔记本电脑Top 10排名
» Notebookcheck亚笔记本电脑Top 10排名
» Notebookcheck超级本产品Top 10排名
» Notebookcheck变形本产品Top 10排名
» Notebookcheck平板电脑Top 10排名
» Notebookcheck智能手机Top 10排名
» Notebookcheck评测过最出色的笔记本电脑屏幕
» Notebookcheck售价500欧元以下笔记本电脑Top 10排名
» Notebookcheck售价300欧元以下笔记本电脑Top 10排名