Intel Core i5-11600K
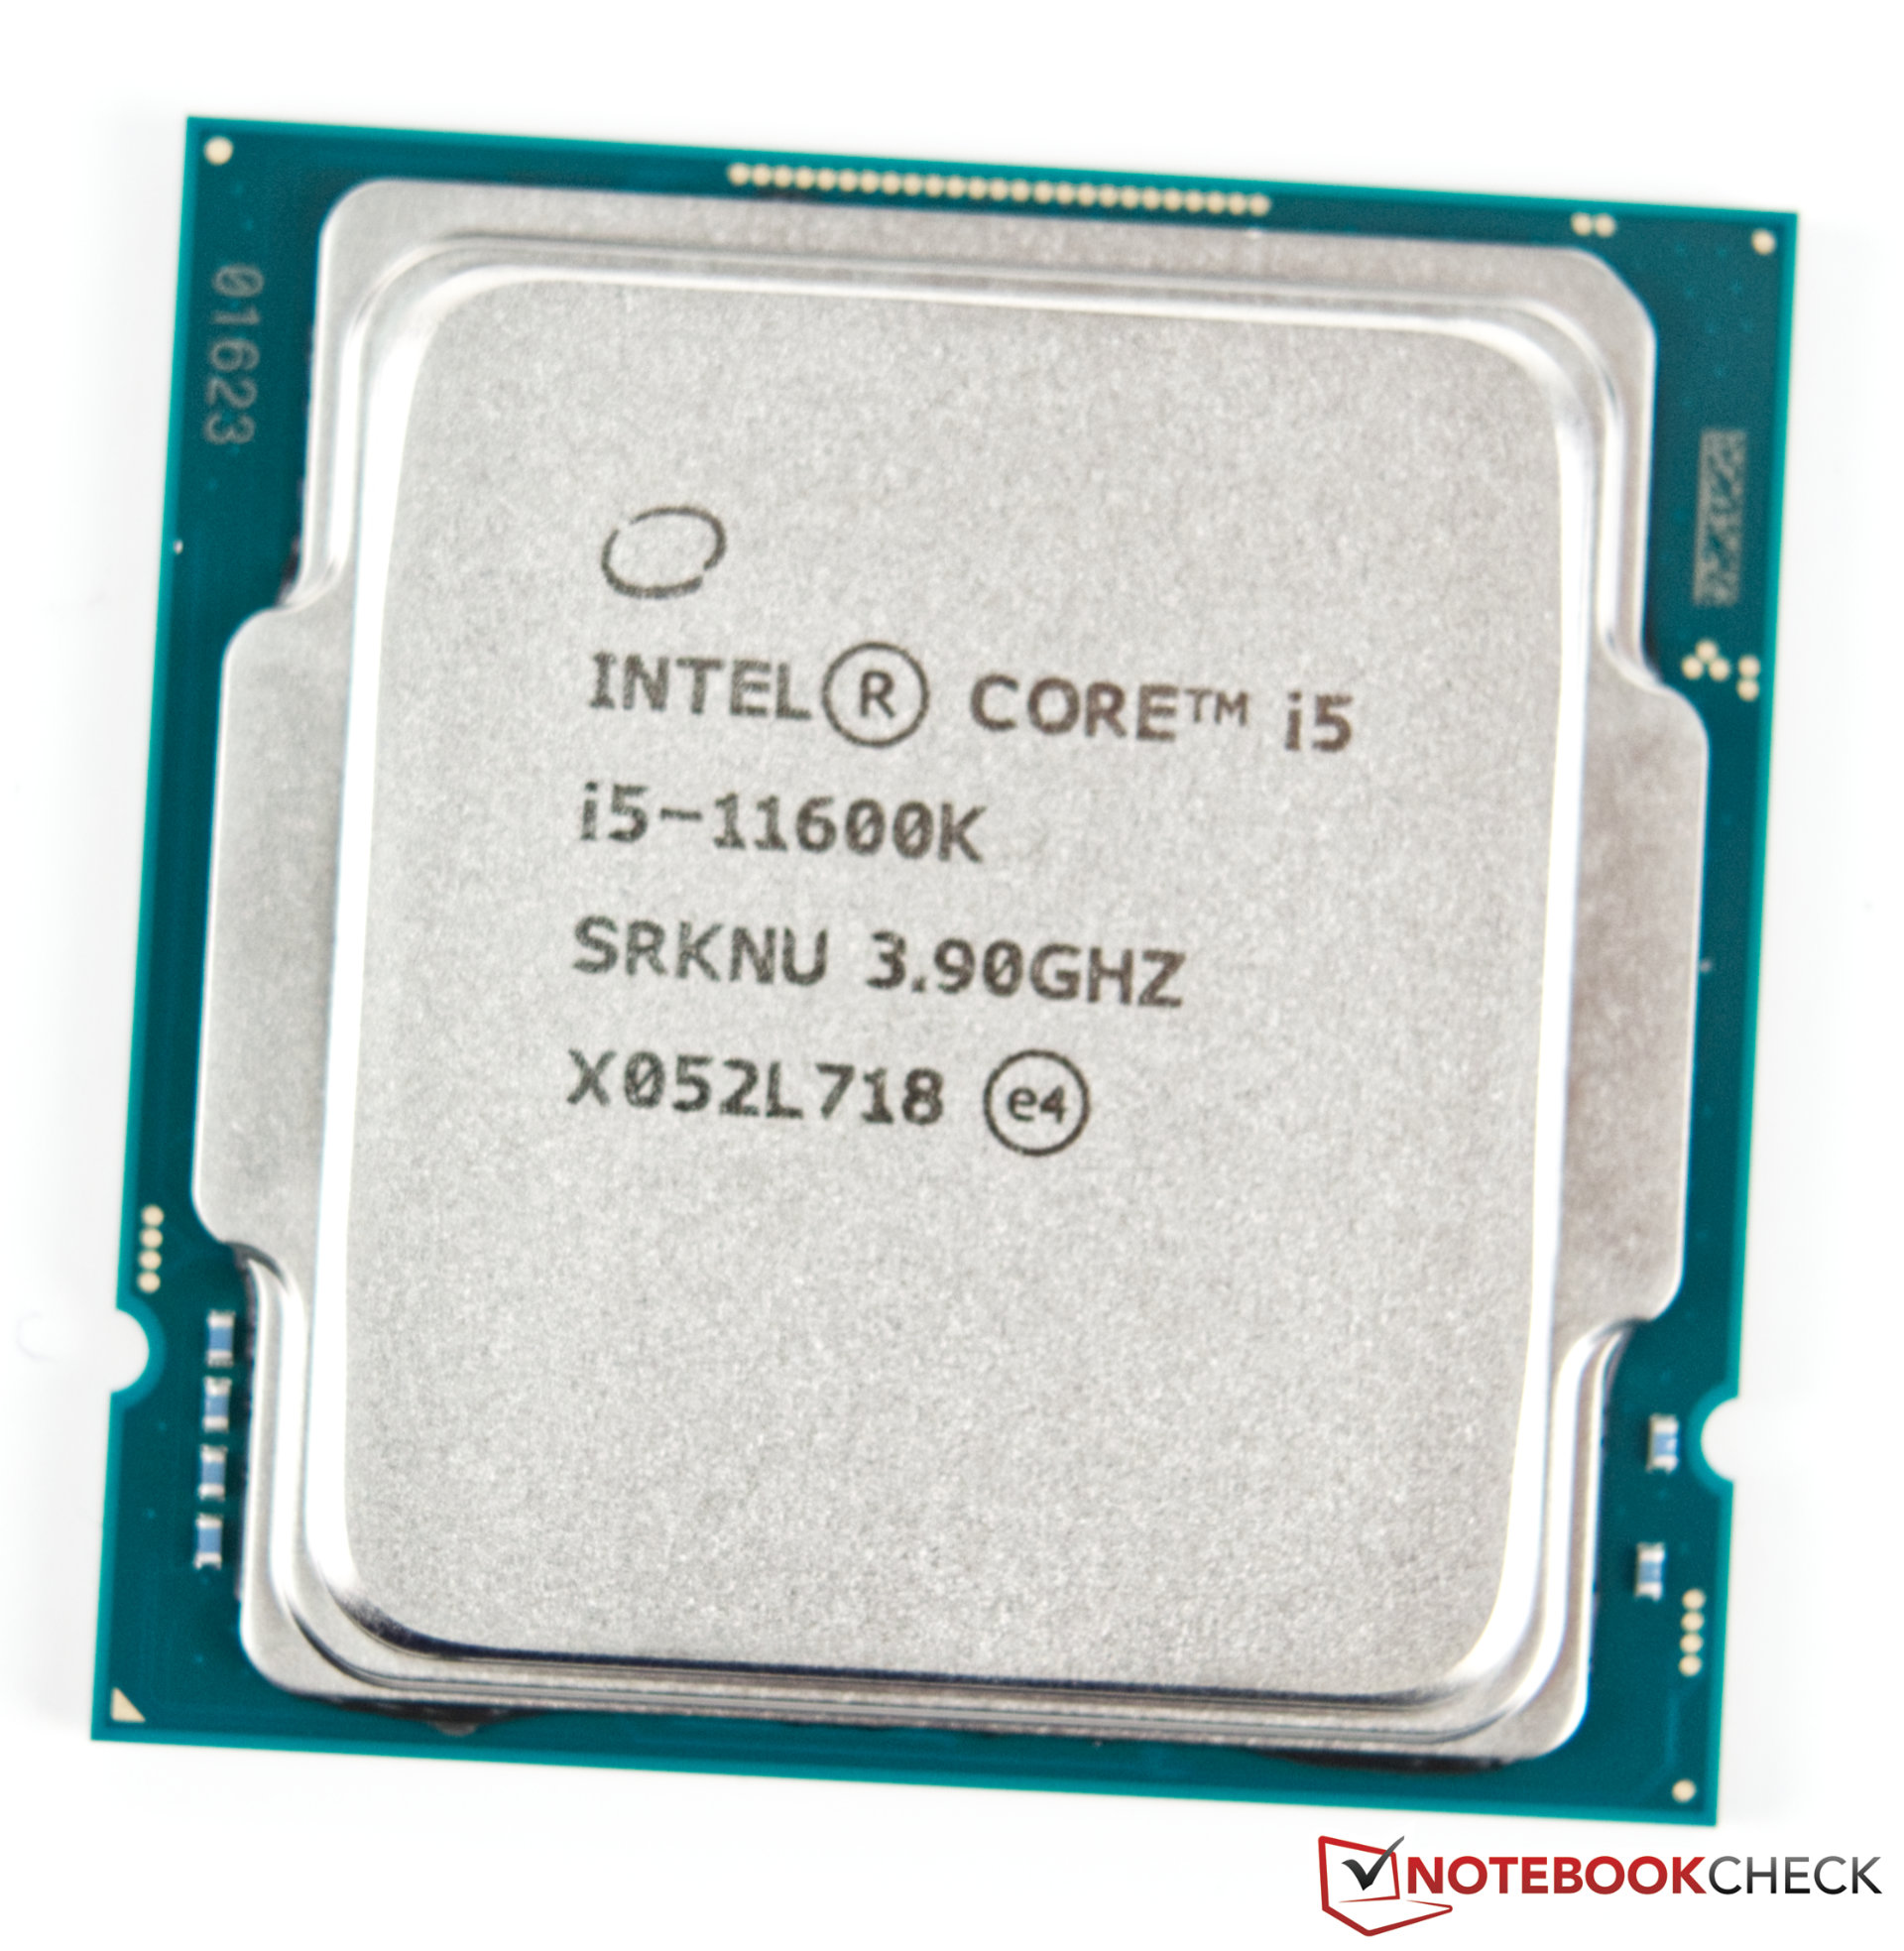
英特尔酷睿i5-11600K是基于Rocket Lake体系结构的高端台式机CPU。 CPU提供6个核心和12个线程,时钟为3.9~4.9GHz(仅限涡轮增压2.0)。 使用所有核心,CPU最多可时钟4.6GHz。
TDP的额定功率为125瓦(PL1,持续负载功率限制),但PL2设定为250瓦左右,用于短期升压(最长56秒)。
Sunny Cove 处理器核心(从 Ice Lake 移动 CPU 了解)可提供更大的高速缓存和改进的 IPC(最高 19%)。 此外,芯片还包括 (部分 )集成 WiFi 6E和 Thunderbolt 4。 此平台支持 PCIe 4.0 和 Intel DL Boost 以加速 AI。
由于核心体系结构更快,11600K比旧的i5-10600K高出约20%。 因此,i5-11600K是适合游戏的中端机型。
更快的 Rocket Lake-S CPU 还集成基于当前英特尔 Xe 体系结构(例如,移动 Tiger Lake)的新英特尔 UHD 图形 750,提供 32 个 EU。 在 11600K 中,GPU 时钟为 350~1300MHz。
CPU与彗星湖的前身一样,以14纳米工艺制造。 虽然功耗不如酷睿i9-11900K,但与高能效Ryzen 5600X相比,功耗较低。
| Codename | Rocket Lake | ||||||||||||||||||||||||
| Series | Intel Rocket Lake | ||||||||||||||||||||||||
Series: Rocket Lake Rocket Lake
| |||||||||||||||||||||||||
| Clock Rate | 3900 - 4900 MHz | ||||||||||||||||||||||||
| Level 1 Cache | 480 KB | ||||||||||||||||||||||||
| Level 2 Cache | 3 MB | ||||||||||||||||||||||||
| Level 3 Cache | 12 MB | ||||||||||||||||||||||||
| Number of Cores / Threads | 6 / 12 | ||||||||||||||||||||||||
| Power Consumption (TDP = Thermal Design Power) | 125 Watt | ||||||||||||||||||||||||
| Manufacturing Technology | 14 nm | ||||||||||||||||||||||||
| Max. Temperature | 100 °C | ||||||||||||||||||||||||
| Socket | LGA1200 | ||||||||||||||||||||||||
| Features | DDR4-3200 RAM, PCIe 4, 8 GT/s bus, DL Boost, GNA, vPro, MMX, SSE, SSE2, SSE3, SSSE3, SSE4.1, SSE4.2, AVX, AVX2, AVX-512, BMI2, ABM, FMA, ADX, VMX, SMEP, SMAP, MPX, EIST, TM1, TM2, HT, Turbo, SST, AES-NI, RDRAND, RDSEED, SHA | ||||||||||||||||||||||||
| GPU | Intel UHD Graphics Xe 750 32EUs (Rocket Lake) (350 - 1300 MHz) | ||||||||||||||||||||||||
| 64 Bit | 64 Bit support | ||||||||||||||||||||||||
| Architecture | x86 | ||||||||||||||||||||||||
| Announcement Date | 03/30/2021 | ||||||||||||||||||||||||
| Product Link (external) | ark.intel.com | ||||||||||||||||||||||||

Benchmarks
Performance Rating - CB R15 + R20 + 7-Zip + X265 + Blender + 3DM11 CPU
35.4 pt (59%)
AMD E1-2100
...
AMD Ryzen 9 5900HS
AMD Ryzen 7 PRO 5750G
AMD Ryzen 7 7735H
Intel Core i5-11600K
AMD Ryzen 9 5980HS
AMD Ryzen 7 5700G
...
0%
100%
Cinebench R23 - Cinebench R23 Multi Core
min: 11124 avg: 11218 median: 11217.5 (10%) max: 11311 Points
AMD E1-2100
...
AMD Ryzen 7 7735H
Intel Core i5-13500T
Intel Core i5-11600K
Intel Core i5-12450HX
...
0%
100%
Cinebench R23 - Cinebench R23 Single Core
min: 1500 avg: 1530 median: 1529.5 (62%) max: 1559 Points
AMD A10-5745M
...
Intel Core Ultra 5 115U
AMD Ryzen 9 5900X
Intel Core i7-11700
AMD Ryzen 9 5980HS
Intel Core i5-11600K
AMD Ryzen 7 7735H
Intel Core i7-11390H
AMD Ryzen 5 5600X
...
Apple M5 10-Core
0%
100%
Cinebench R20 - Cinebench R20 CPU (Single Core)
min: 576 avg: 586 median: 585.5 (64%) max: 595 Points
Cinebench R20 - Cinebench R20 CPU (Multi Core)
min: 4254 avg: 4302 median: 4301.5 (10%) max: 4349 Points
Cinebench R15 - Cinebench R15 CPU Multi 64 Bit
min: 1738 avg: 1744 median: 1744 (11%) max: 1750 Points
AMD A4-1250
...
Intel Core i5-11600K
Intel Core i5-12400F
Intel Core i7-11700
AMD Ryzen 7 2700X
...
0%
100%
Cinebench R15 - Cinebench R15 CPU Single 64 Bit
min: 234 avg: 238 median: 238 (66%) max: 242 Points
AMD A4-1200
...
Intel Core i5-11600K
...
Intel Core Ultra 9 285K
0%
100%
Cinebench R11.5 - Cinebench R11.5 CPU Multi 64 Bit
19.3 Points (24%)
Cinebench R11.5 - Cinebench R11.5 CPU Single 64 Bit
2.9 Points (68%)
Cinebench R10 - Cinebench R10 Rend. Single (32bit)
9745 points (59%)
Cinebench R10 - Cinebench R10 Rend. Multi (32bit)
49408 points (36%)
Cinebench R10 - Cinebench R10 Rend. Multi (64bit)
64663 Points (40%)
Cinebench R10 - Cinebench R10 Rend. Single (64bit)
12957 Points (16%)
wPrime 2.10 - wPrime 2.0 1024m *
107.6 s (1%)
7-Zip 18.03 - 7-Zip 18.03 Multi Thread 4 runs
min: 44620 avg: 44971 median: 44971 (26%) max: 45322 MIPS
7-Zip 18.03 - 7-Zip 18.03 Single Thread 4 runs
min: 5987 avg: 6062 median: 6061.5 (69%) max: 6136 MIPS
X264 HD Benchmark 4.0 - x264 Pass 2
min: 100.5 avg: 100.8 median: 100.8 (3%) max: 101 fps
X264 HD Benchmark 4.0 - x264 Pass 1
min: 279 avg: 289 median: 289 (7%) max: 299 fps
HWBOT x265 Benchmark v2.2 - HWBOT x265 4k Preset
min: 14 avg: 14.4 median: 14.4 (25%) max: 14.7 fps
TrueCrypt - TrueCrypt Serpent
0.9 GB/s (26%)
TrueCrypt - TrueCrypt Twofish
1.5 GB/s (26%)
Blender - Blender 2.79 BMW27 CPU *
min: 264.5 avg: 267.3 median: 267.3 (2%) max: 270 Seconds
R Benchmark 2.5 - R Benchmark 2.5 *
min: 0.506 avg: 0.5 median: 0.5 (11%) max: 0.528 sec
3DMark 06 - CPU - 3DMark 06 - CPU
14519 Points (24%)
Super Pi mod 1.5 XS 1M - Super Pi mod 1.5 XS 1M *
6.8 s (1%)
Super Pi mod 1.5 XS 2M - Super Pi mod 1.5 XS 2M *
14.8 s (1%)
Super Pi Mod 1.5 XS 32M - Super Pi mod 1.5 XS 32M *
353.7 s (2%)
3DMark 11 - 3DM11 Performance Physics
min: 15381 avg: 16381 median: 16381 (40%) max: 17381 Points
3DMark - 3DMark Ice Storm Physics
min: 70567 avg: 75640 median: 75640 (61%) max: 80713 Points
3DMark - 3DMark Ice Storm Extreme Physics
79747 Points (65%)
3DMark - 3DMark Ice Storm Unlimited Physics
81270 Points (65%)
3DMark - 3DMark Cloud Gate Physics
min: 14147 avg: 14403 median: 14402.5 (36%) max: 14658 Points
3DMark - 3DMark Fire Strike Standard Physics
min: 21677 avg: 22154 median: 22154 (39%) max: 22631 Points
3DMark - 3DMark Time Spy CPU
min: 8286 avg: 8884 median: 8884 (37%) max: 9482 Points
Geekbench 6.7 - Geekbench 6.7.1 Single-Core
2284 points (53%)

Geekbench 6.7 - Geekbench 6.7.1 Multi-Core
9480 points (32%)
...
AMD Ryzen 7 5700G
Intel Core i5-11600K
AMD Ryzen 9 3900
AMD Ryzen 7 7435HS
...
Apple M5 Max
0%
100%
Geekbench 5.5 - Geekbench 5.1 - 5.5 64 Bit Single-Core
min: 1694 avg: 1723 median: 1723 (58%) max: 1752 points
Geekbench 5.5 - Geekbench 5.1 - 5.5 64 Bit Multi-Core
min: 8336 avg: 8430 median: 8429.5 (15%) max: 8523 points
Geekbench 5.0 - Geekbench 5.0 64 Bit Single-Core
1731 points (8%)
Geekbench 5.0 - Geekbench 5.0 64 Bit Multi-Core
8542 points (27%)
Geekbench 4.4 - Geekbench 4.1 - 4.4 64 Bit Single-Core
7438 points (67%)
Geekbench 4.4 - Geekbench 4.1 - 4.4 64 Bit Multi-Core
33266 points (32%)
Mozilla Kraken 1.1 - Kraken 1.1 Total Score *
min: 587 avg: 598 median: 597.5 (1%) max: 608 ms
WebXPRT 3 - WebXPRT 3 Score
min: 263 avg: 271.5 median: 271.5 (46%) max: 280 Points
CrossMark - CrossMark Overall
1652 Points (58%)
Power Consumption - Prime95 Power Consumption - external Monitor *
min: 187 avg: 204.7 median: 199 (34%) max: 228 Watt
Power Consumption - Cinebench R15 Multi Power Consumption - external Monitor *
min: 177 avg: 195.3 median: 189 (34%) max: 219.9 Watt
Power Consumption - Power Efficiency - Cinebench R15 Multi external Monitor
min: 7.9 avg: 8.9 median: 8.9 (7%) max: 9.89 Points per Watt
- Range of benchmark values
 - Average benchmark values
* Smaller numbers mean a higher performance
* Smaller numbers mean a higher performance
- $149.00Intel® Core™ i5-11600K Desktop Processor 6 Cores up to 4.9 GHz Unlocked LGA1200 (Intel® 500 Series & Select 400 Series Chipset) 125W
- $169.00Intel Core i5 (11th Gen) i5-11600K Hexa-core (6 Core) 3.90 GHz Processor - Retail Pack
- $159.97Intel Core i5-11600K Desktop Processor 6 Cores up to 4.9 GHz Unlocked LGA1200 (Intel 500 Series & Select 400 Series Chipset) 125W (Renewed)
- Intel Core i5-12600KF Desktop Processor 10 (6P+4E) Cores up to 4.9 GHz Unlocked LGA1700 600 Series Chipset 125W
- $169.99Intel® Core™ i5-11600 Desktop Processor 6 Cores up to 4.8 GHz LGA1200 (Intel® 500 Series & Select 400 Series chipset) 65W
v1.35
No reviews found for this CPU (yet).