联想ThinkPad Z13笔记本电脑评测。AMD的高端ThinkPad,电池寿命长
不是每天都有PC制造商想在高端领域建立一个新品牌。然而,联想已经通过ThinkPad Z系列走上了这条道路。除了已经存在的ThinkPad X1系列,联想还向市场推出了ThinkPad Z13和ThinkPad Z16,它们将在价格和质量方面参与高端市场的竞争。为了使其面向商业客户的两个高端系列与众不同,联想为Z系列专门配备了AMD处理器,并采用了新的设计,以达到其他年轻客户层的要求。
根据它的名字,今天的评测单位,紧凑的联想ThinkPad Z13,目标是13英寸领域,使其成为戴尔XPS 13 Plus的竞争对手。 戴尔XPS 13 Plus和Apple MacBook Air.
潜在的竞争对手比较
Rating | Date | Model | Weight | Height | Size | Resolution | Price |
|---|---|---|---|---|---|---|---|
| 90.5 % v7 (old) | 08 / 2022 | Lenovo ThinkPad Z13 21D2CTO1WW R5 PRO 6650U, Radeon 660M | 1.2 kg | 13.99 mm | 13.30" | 1920x1200 | |
| 86.9 % v7 (old) | 07 / 2022 | Dell XPS 13 Plus 9320 4K i7-1260P, Iris Xe G7 96EUs | 1.2 kg | 15.3 mm | 13.40" | 3840x2400 | |
| 90.2 % v7 (old) | 06 / 2022 | Lenovo ThinkPad X1 Carbon G10 21CC001RGE i5-1250P, Iris Xe G7 80EUs | 1.2 kg | 15.36 mm | 14.00" | 1920x1200 | |
| 92.3 % v7 (old) | 07 / 2022 | Apple MacBook Air M2 Entry M2, M2 8-Core GPU | 1.2 kg | 11.3 mm | 13.60" | 2560x1664 | |
| 89.8 % v7 (old) | 02 / 2021 | Lenovo ThinkPad X1 Nano-20UN002UGE i7-1160G7, Iris Xe G7 96EUs | 946 g | 16 mm | 13.00" | 2160x1350 |
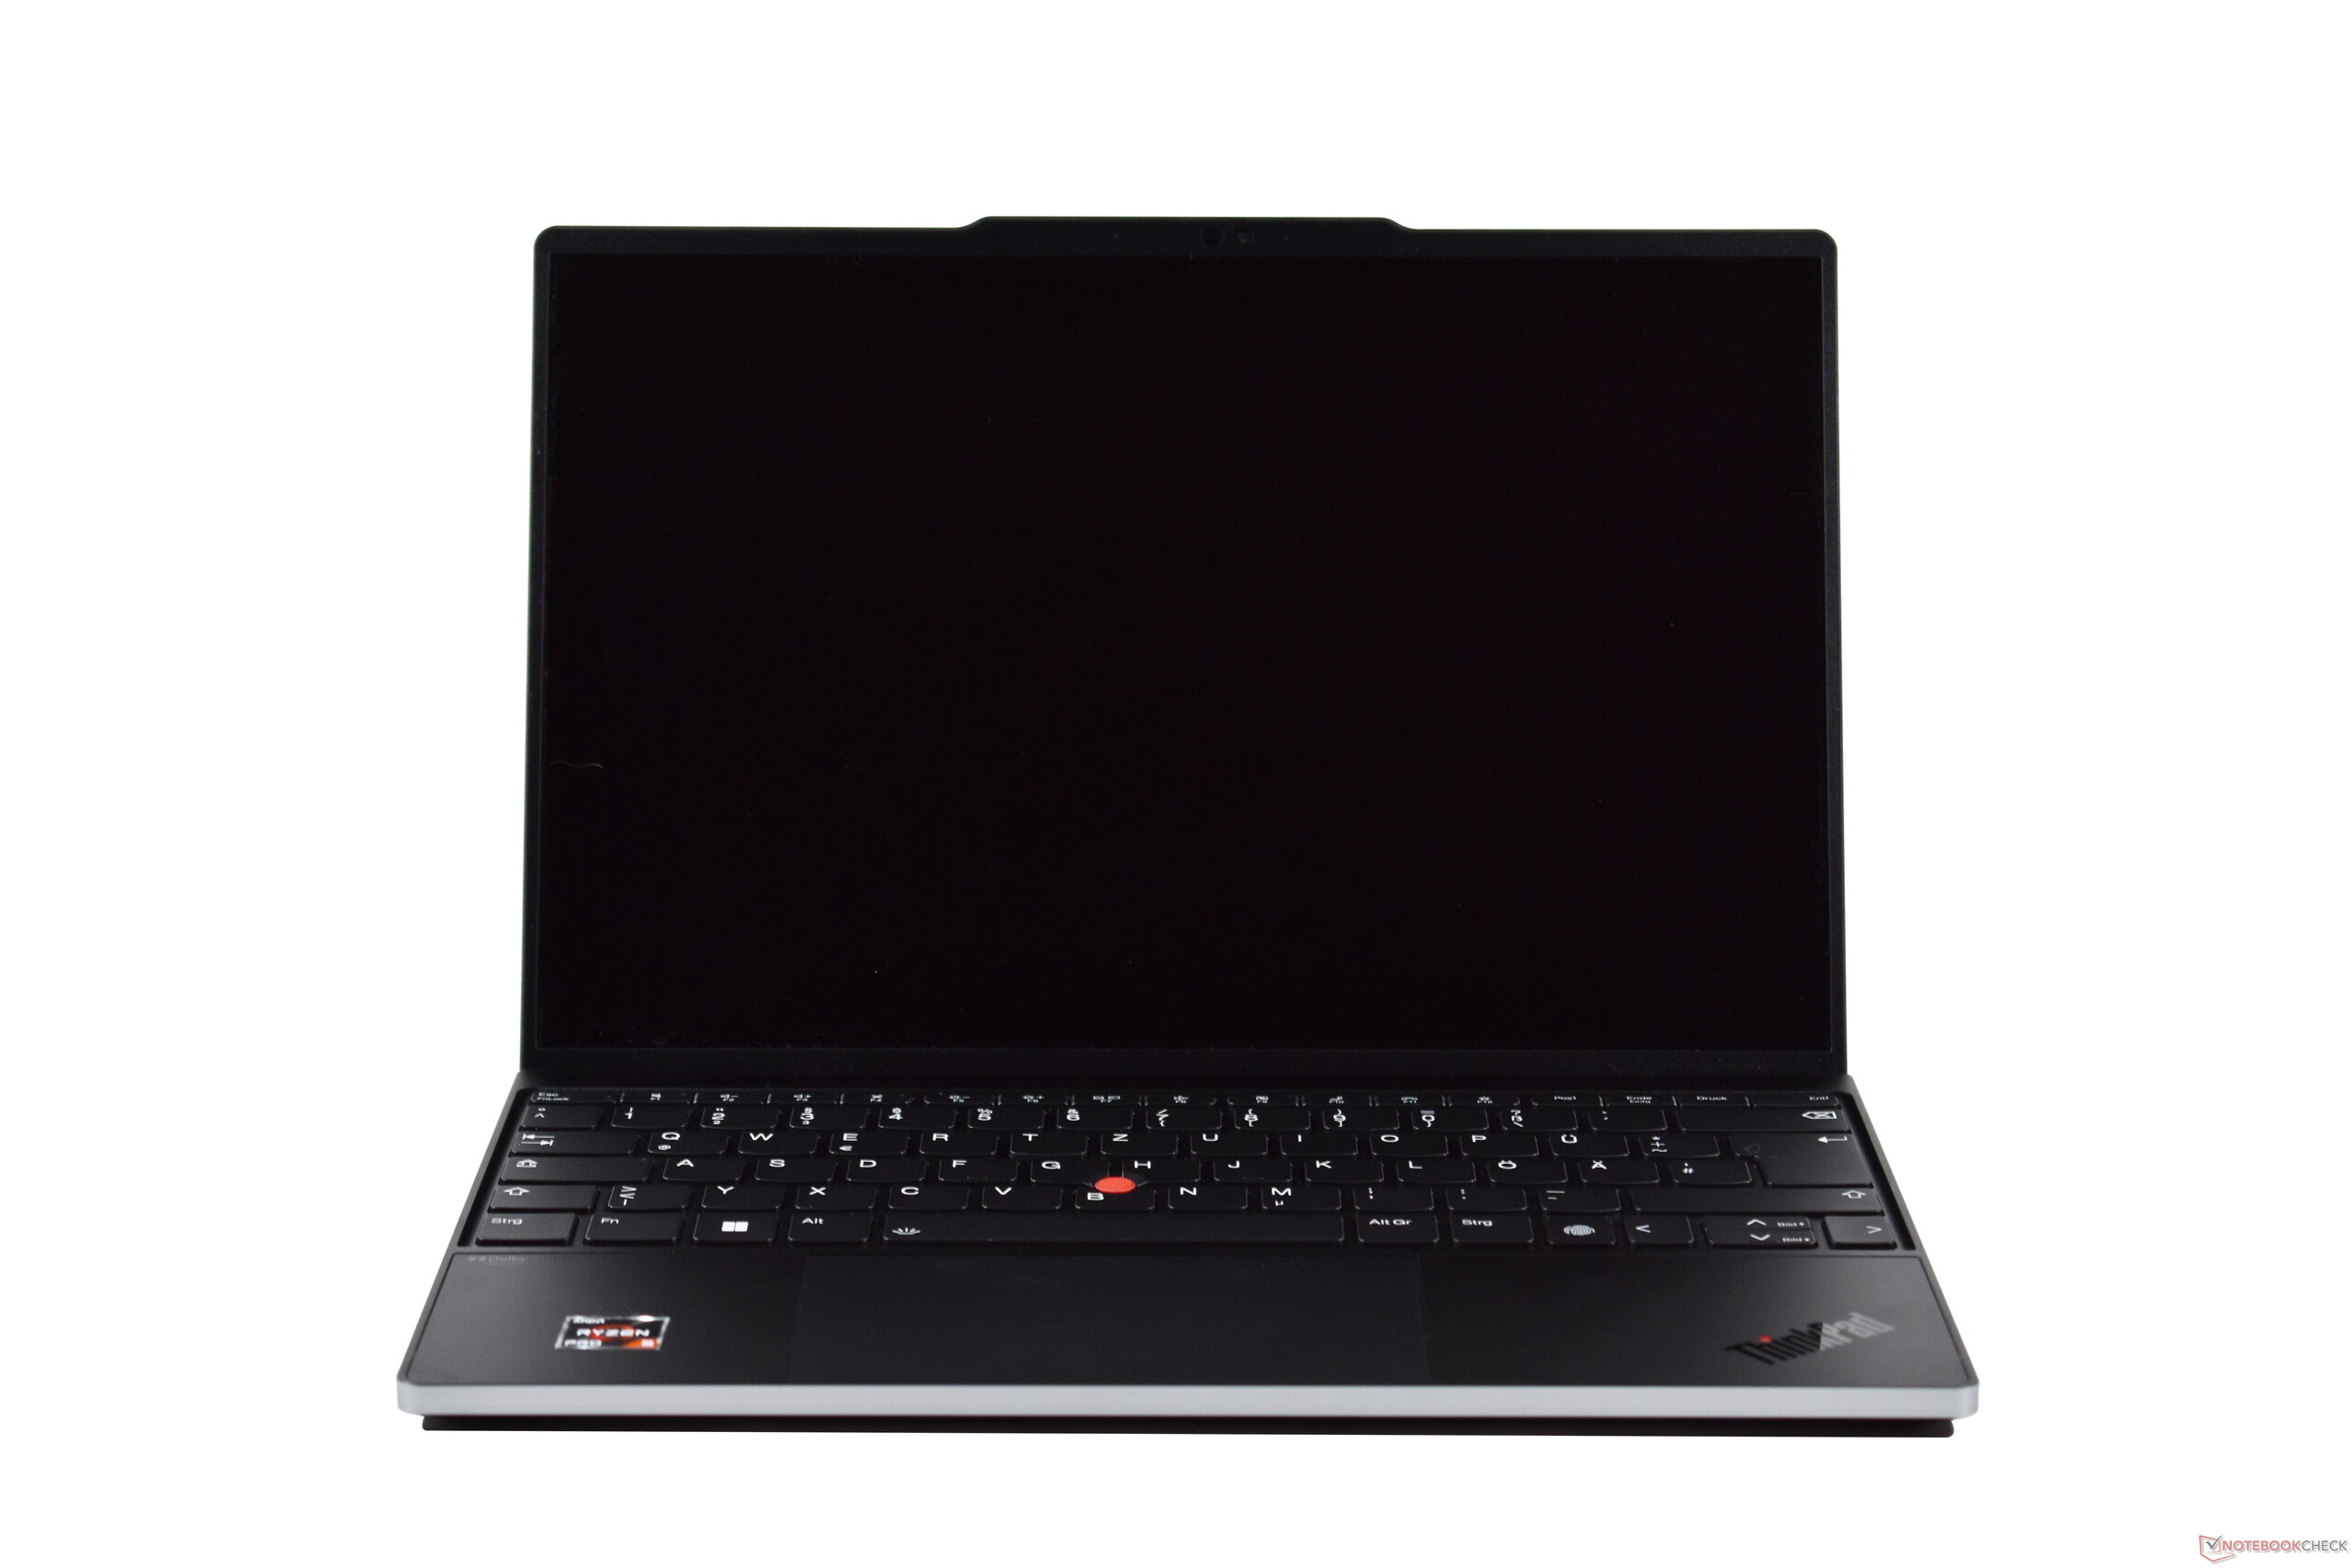
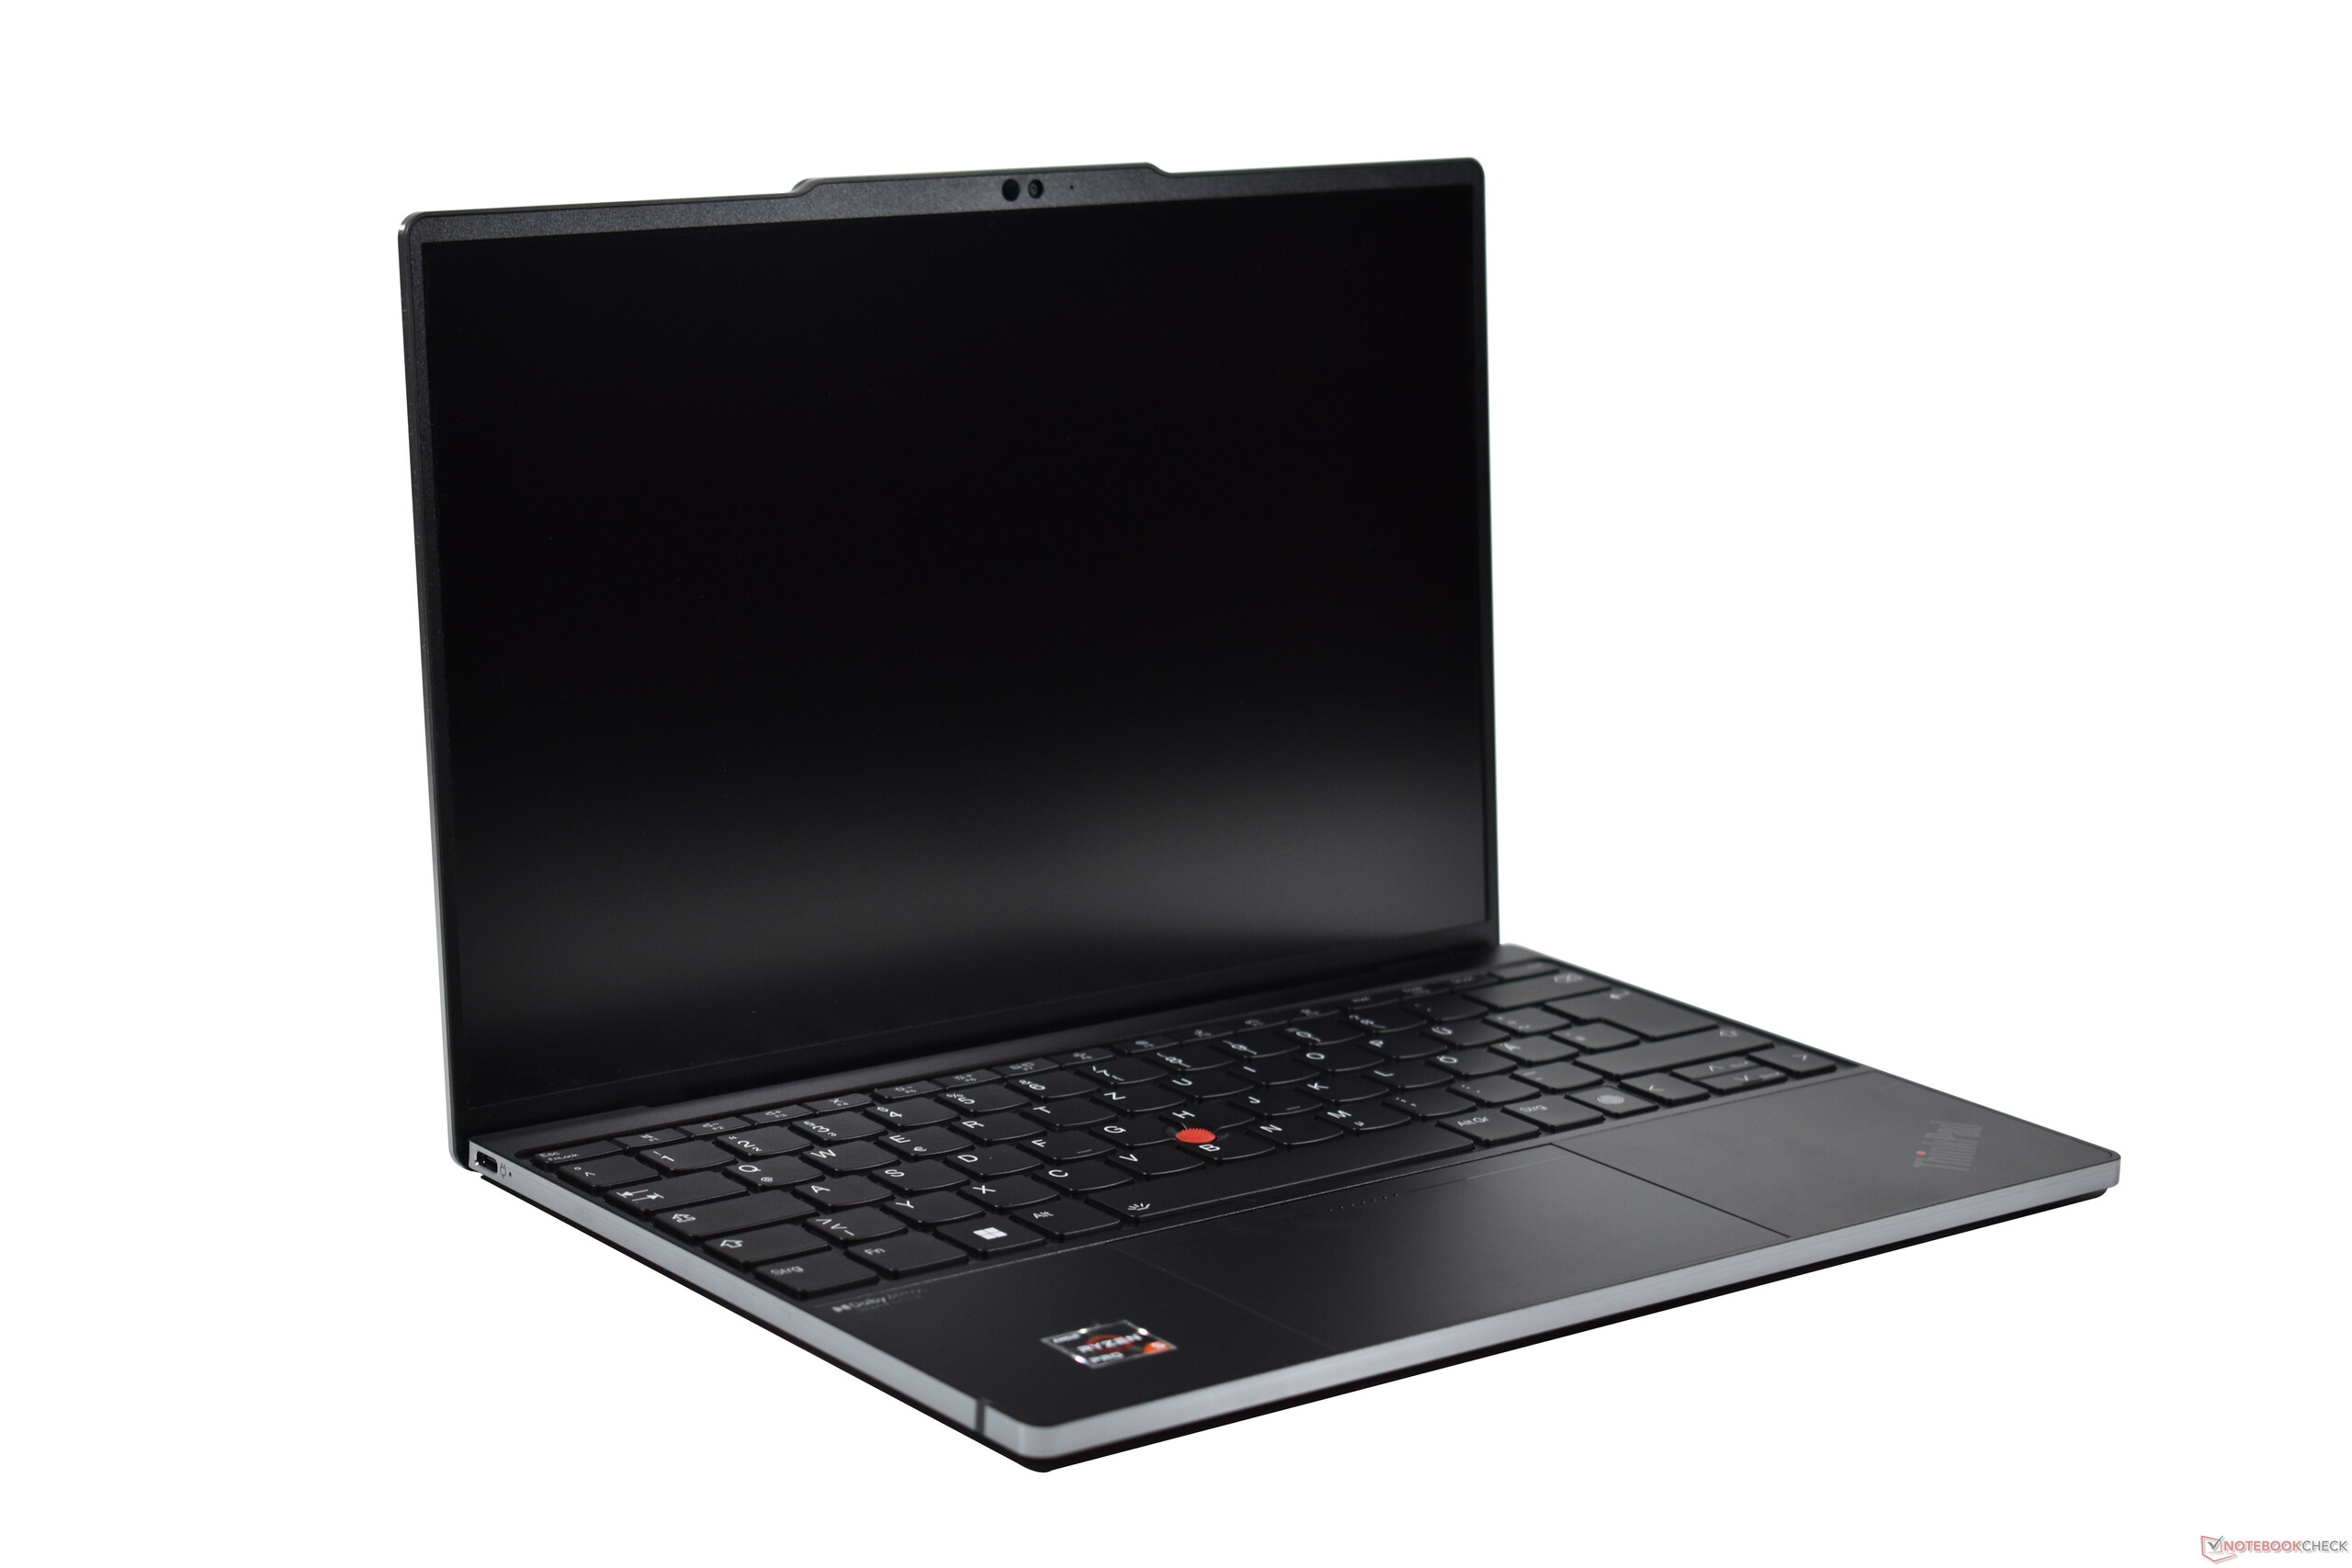
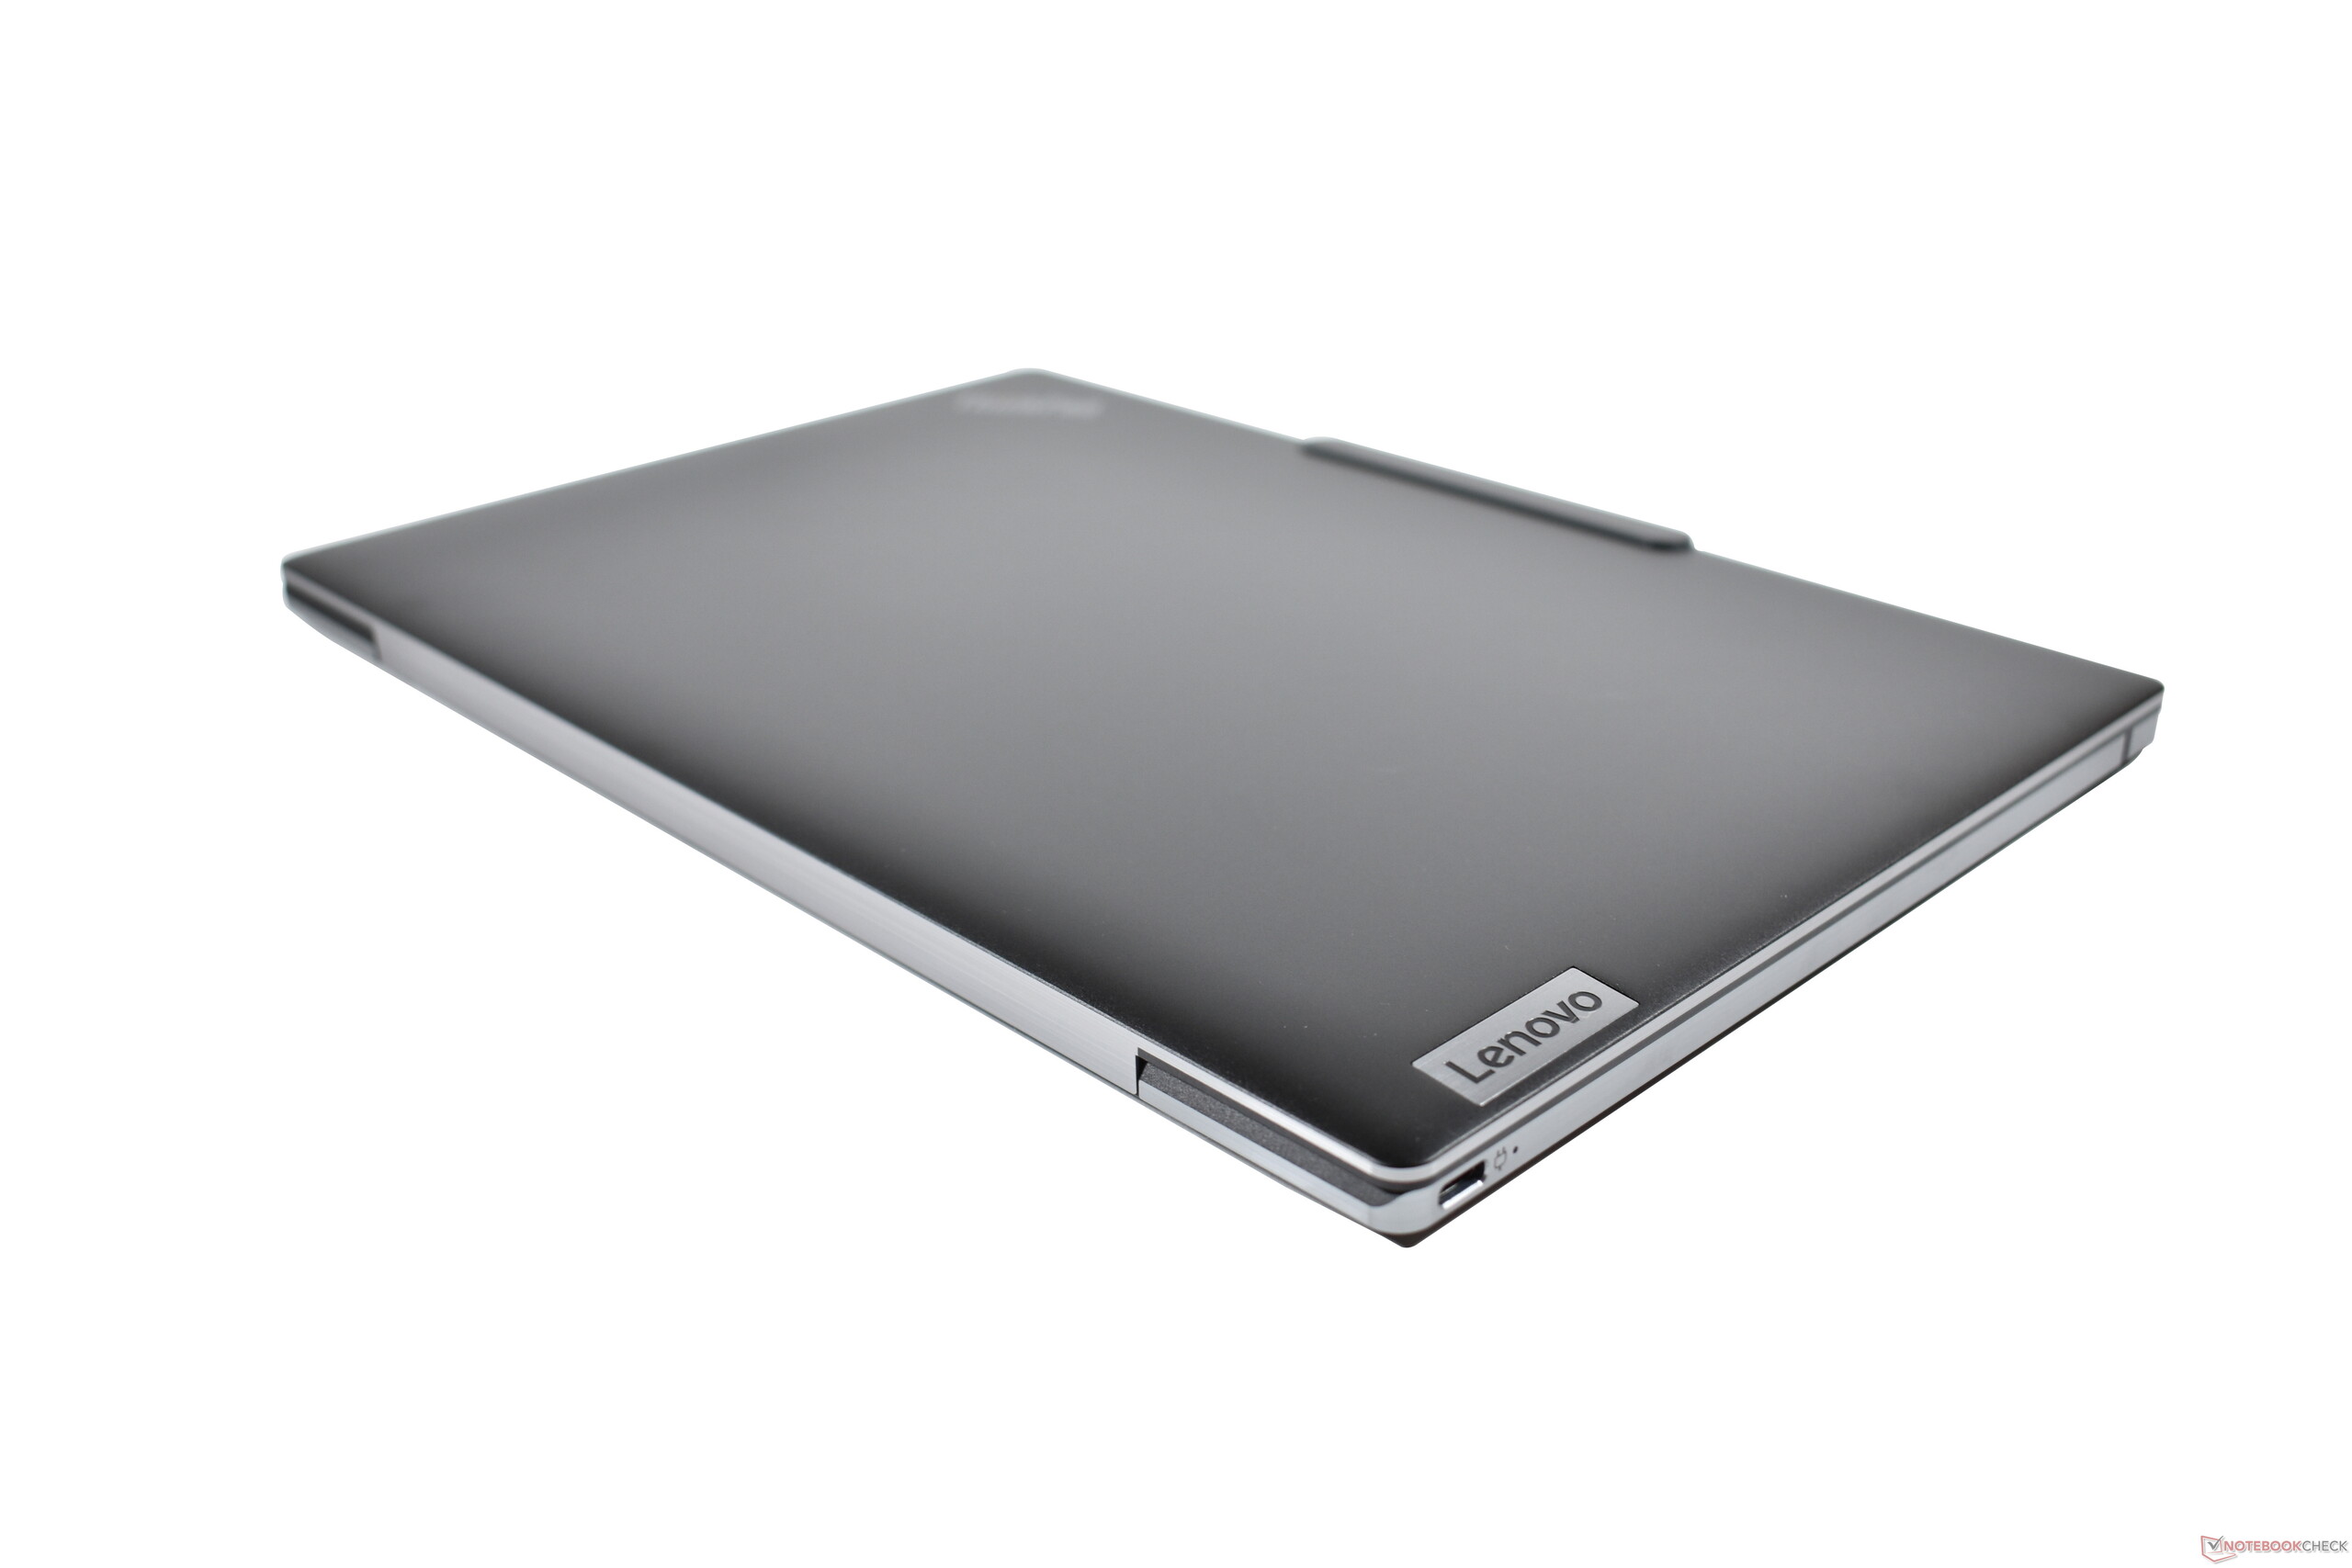
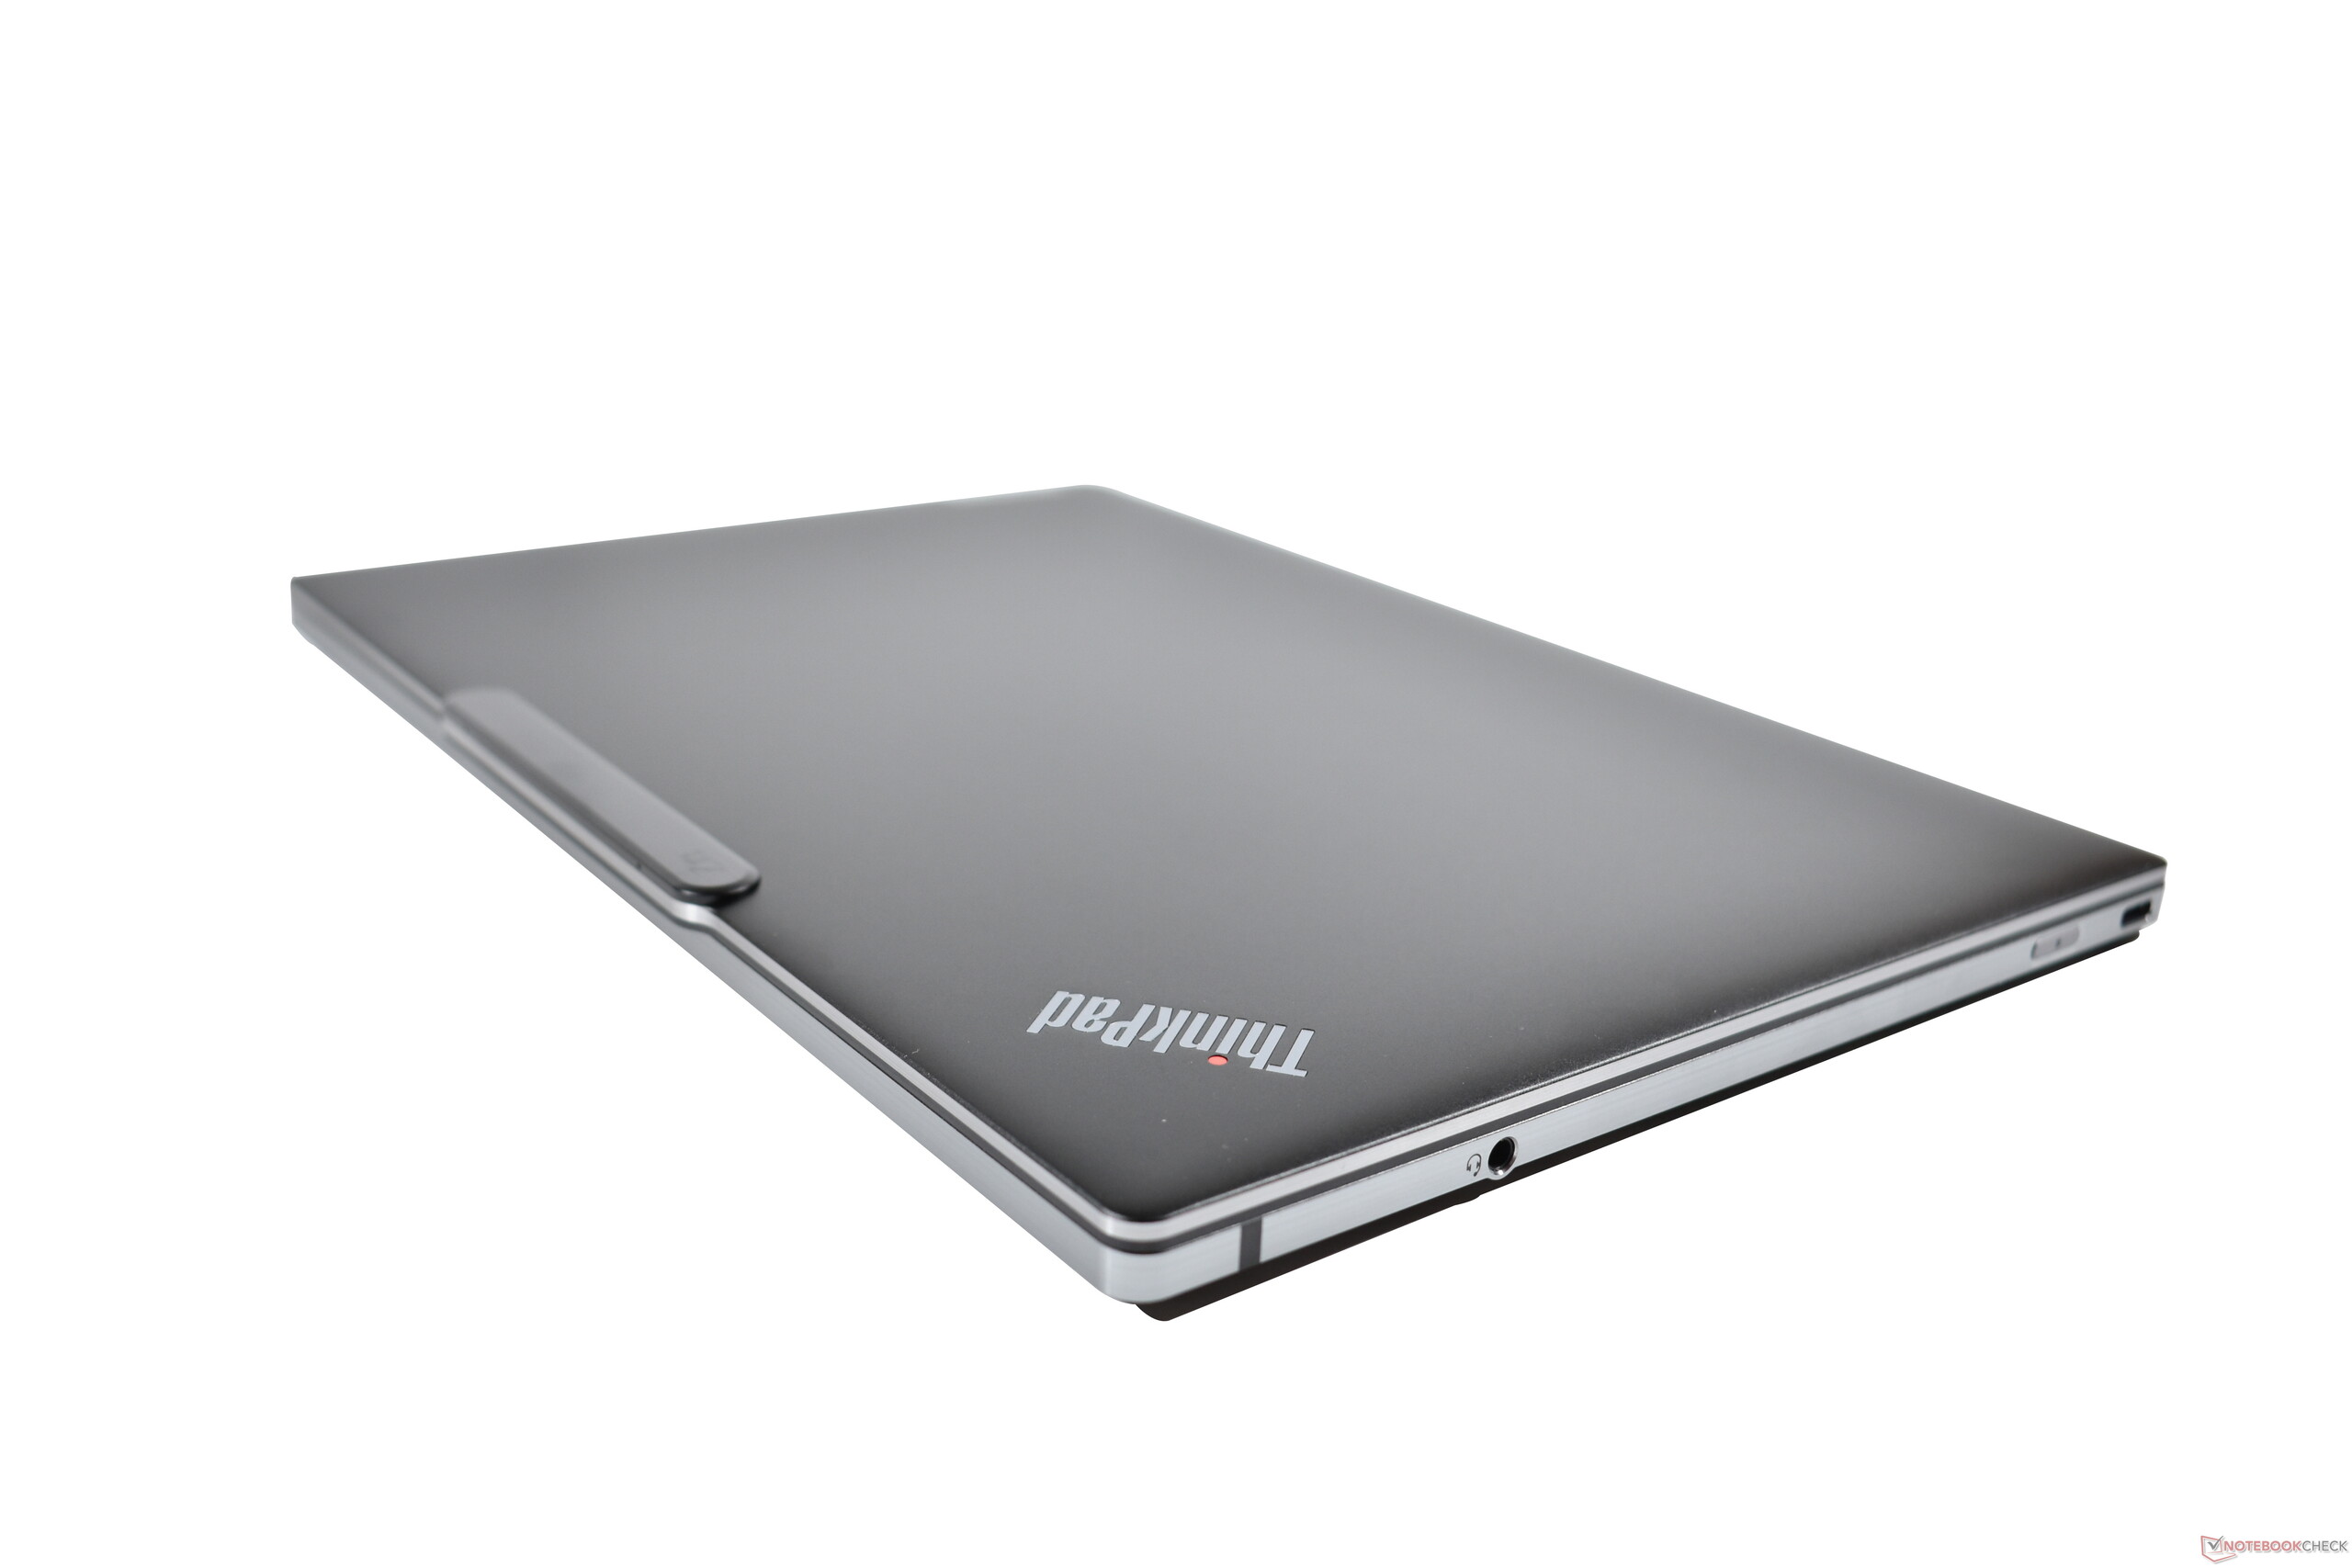
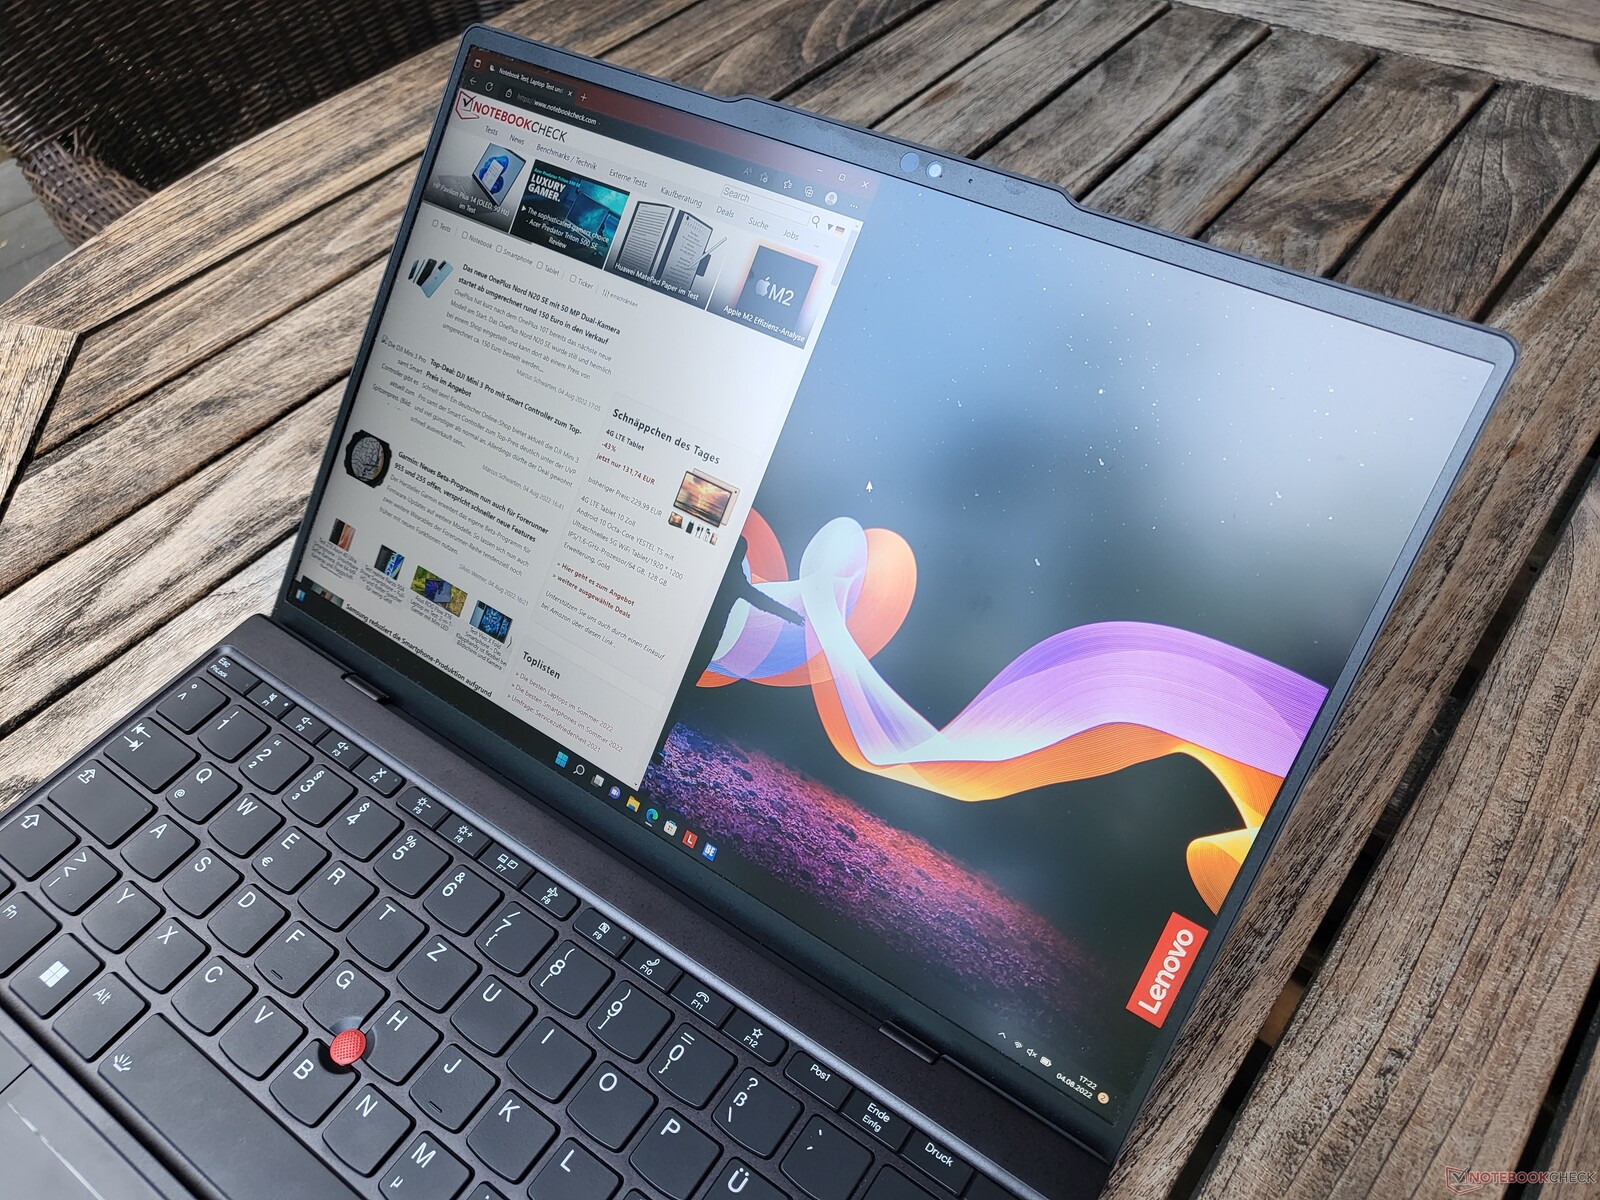
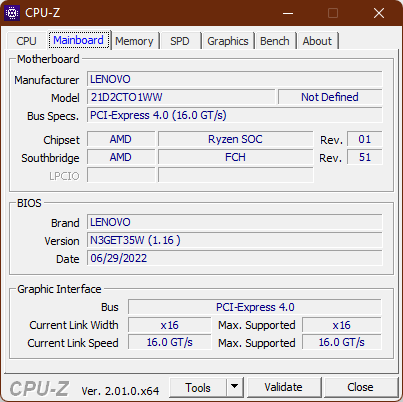
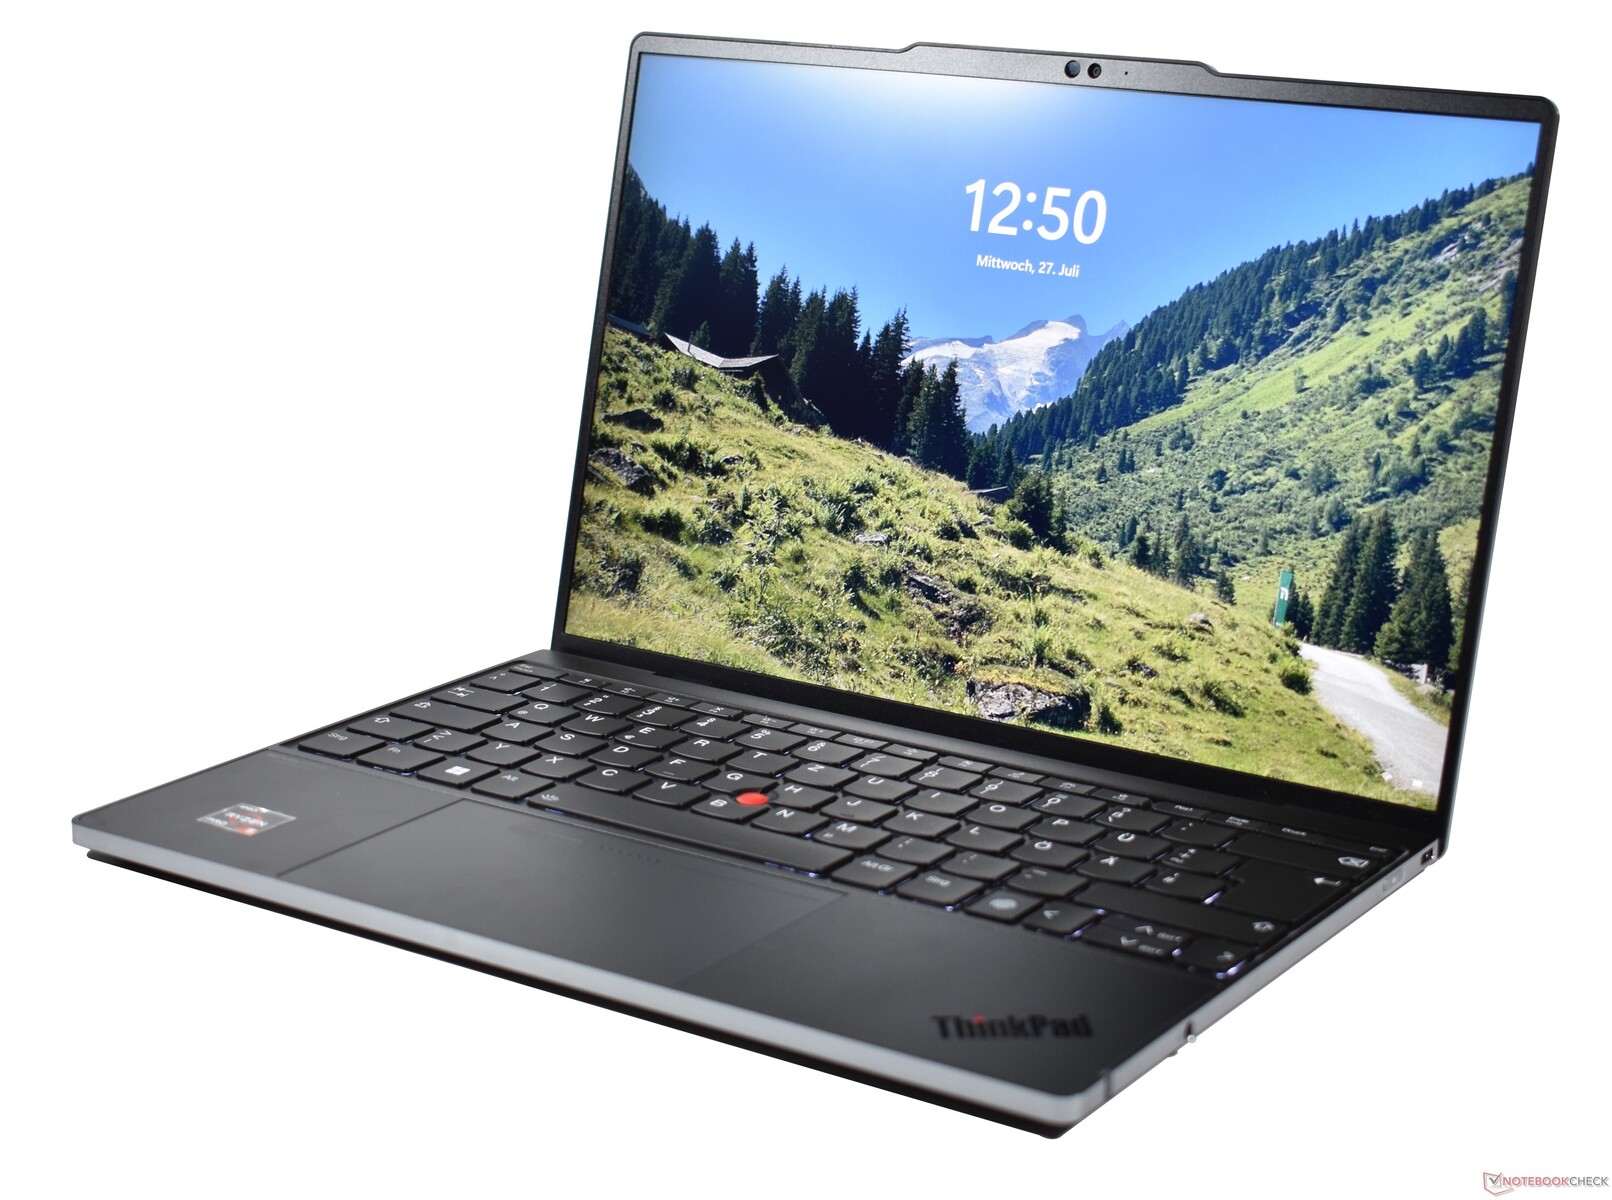
外壳:ThinkPad由玻璃和铝制成
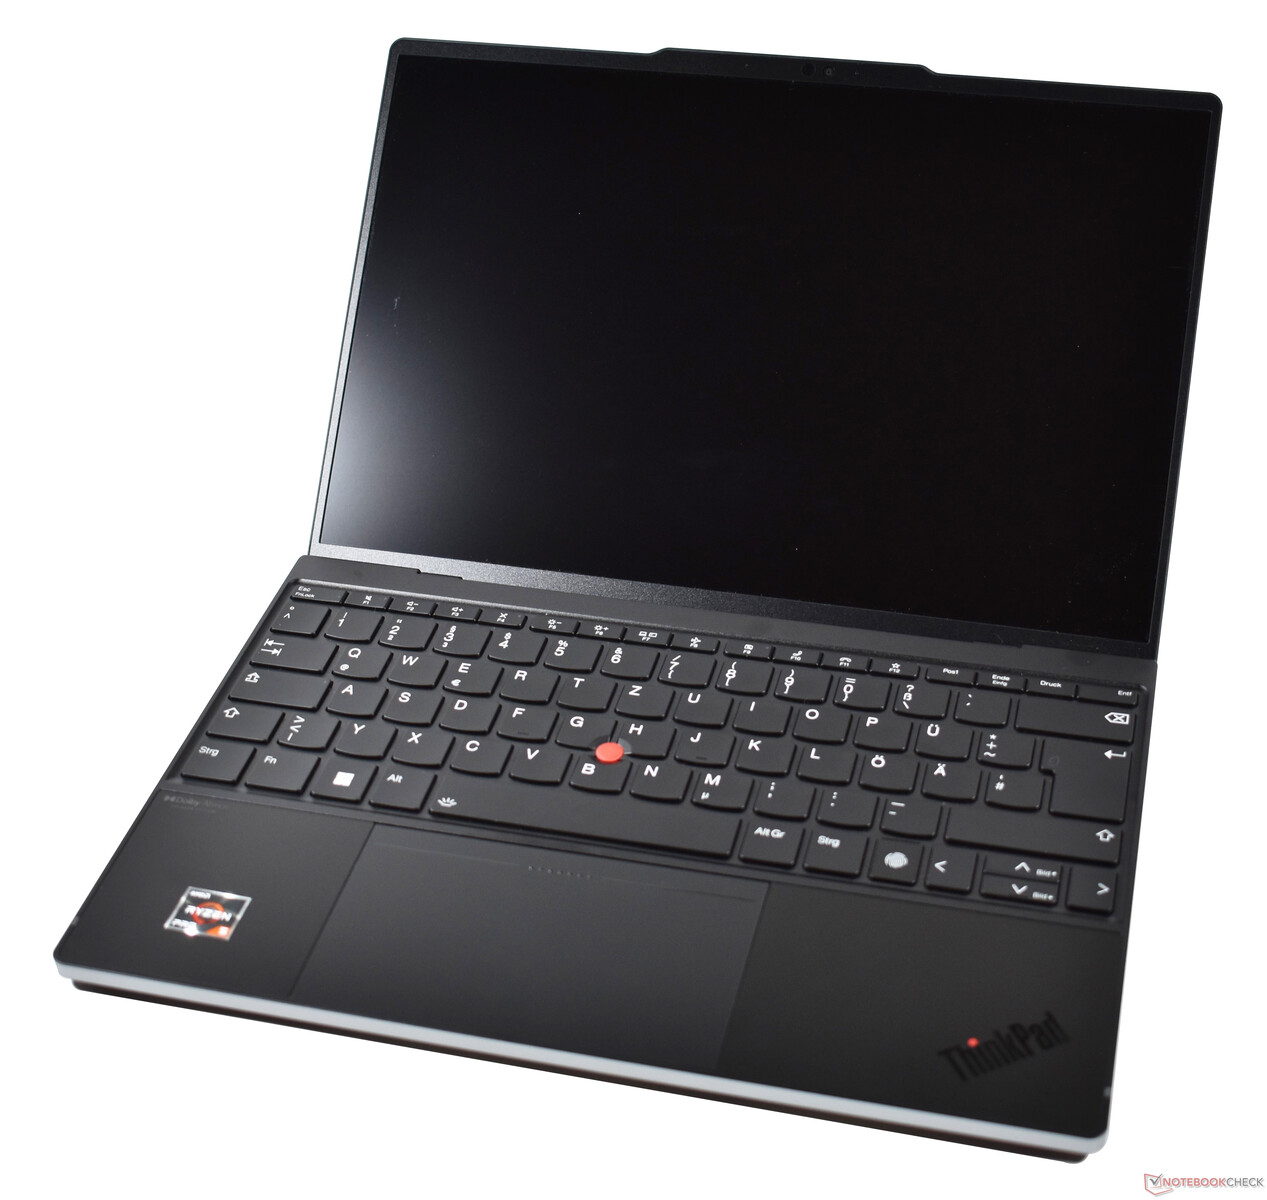
ThinkPads有一个声誉。黑盒子、大量的塑料、功利主义。ThinkPad Z13并没有完全远离这些根源,但它显然试图将设计推向另一个方向。这就是为什么我们有银色的金属侧面,还有哑光玻璃制成的手掌托。最初的ThinkPad Z系列在2005年推出,当时预示着联想的宽屏时代,就是这样一个案例。新的Z系列的设计也许不那么具有突破性,但由于其几乎不存在显示屏边框,它看起来已经比其他ThinkPad明显更现代。
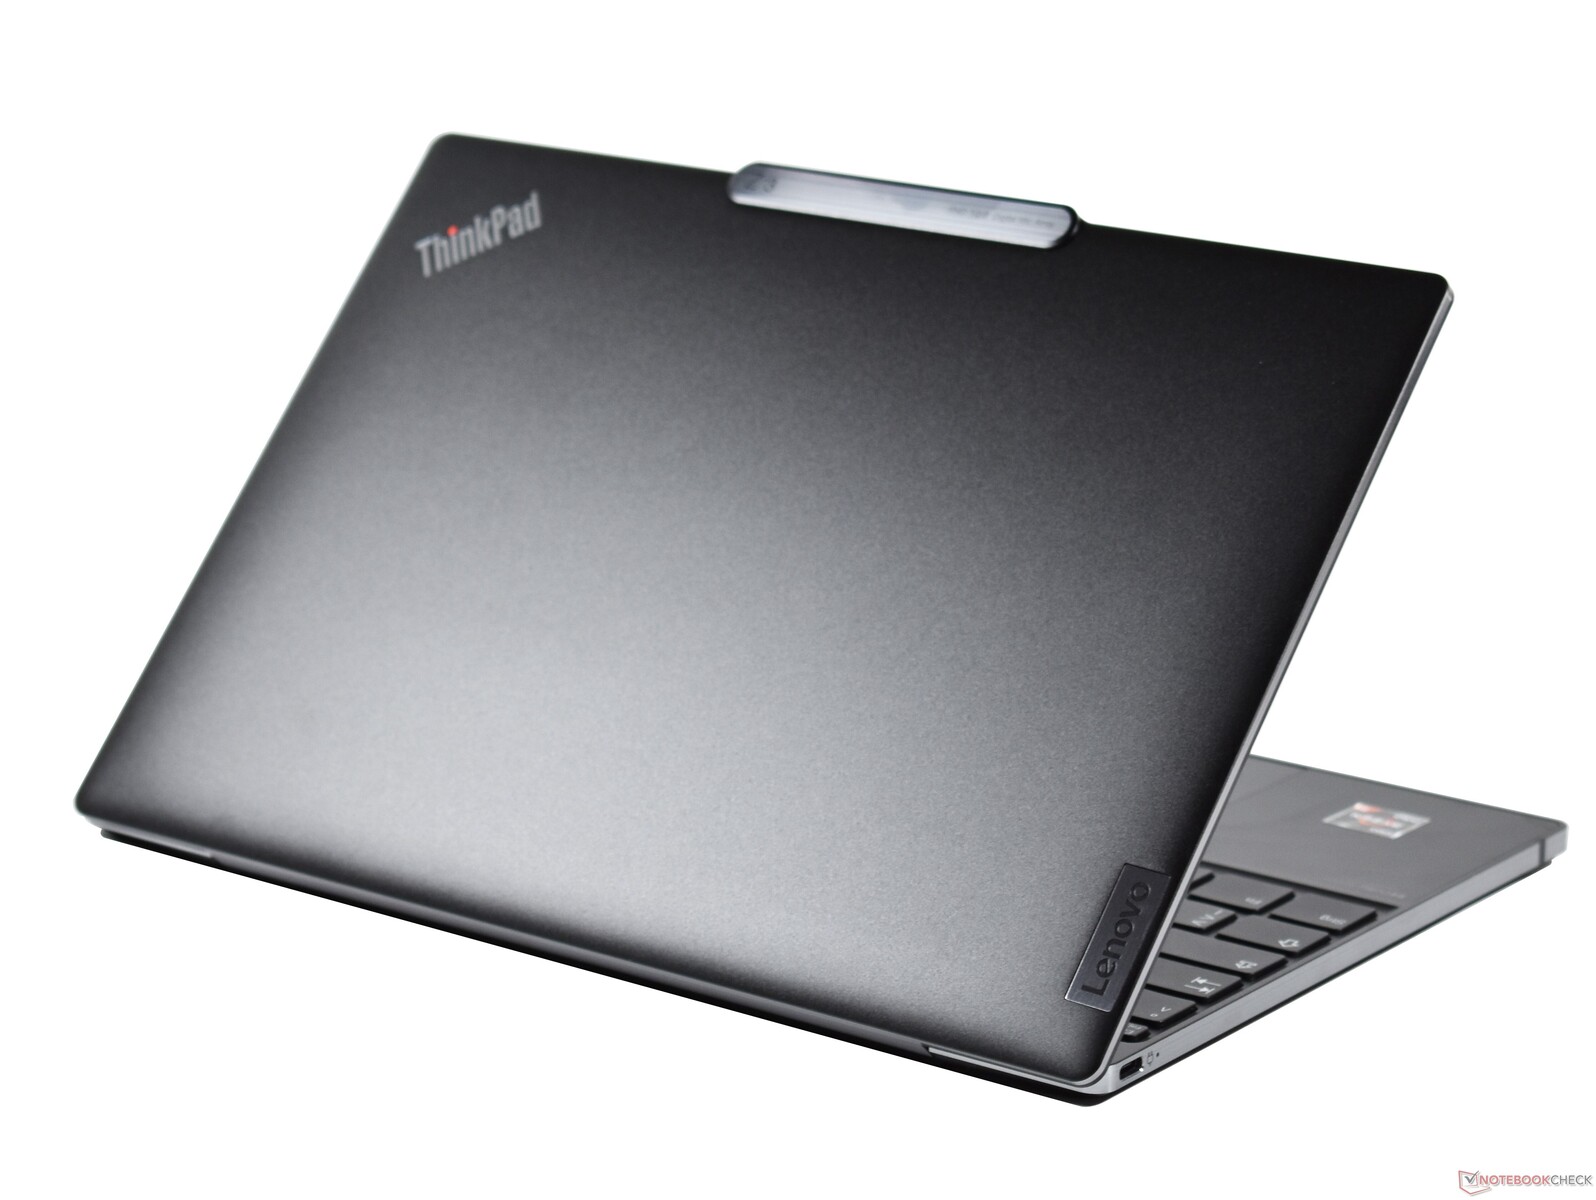
ThinkPad Z13第一代的大部分是由铝制成的。塑料只出现在底盖和显示屏边框上。说到显示屏的盖子。我们的变体有黑色铝制盖子,但也有银色和黑色仿皮的。仿皮的型号没有银色的边,但它有青铜色的边。
就制造质量和坚固性而言,ThinkPad Z13的基本单元无可挑剔;外壳的质量和坚固程度极高。显示屏的盖子也很坚固,尽管没有基本单元那么坚固,因为后者比超薄的盖子要厚。
在铰链方面,联想也有新的突破,因为这种设计以前在ThinkPads上还没有出现过。铰链实际上是隐藏的,它们允许只用一只手打开显示器盖子。然而,它们在开启角度约为100度时变得僵硬。之后不久,它们就停止工作了,最大开启角度只有135度。这是一个遗憾,因为180度的铰链实际上是ThinkPad的商标。
显示屏盖上非常明显的反向凹槽也不是以前的商标。对于ThinkPad Z系列来说,这倒是一个与众不同的特征,而且它也有实际用途。它可以在打开笔记本电脑时用来固定屏幕。
淘宝网戴尔XPS 13 Plus和Apple MacBook Air都和Z13一样重。这种情况也适用于 ThinkPad X1 Carbon Gen 10然而,它有一个更大的显示屏。这款ThinkPad X1 Nano明显更轻,不到一公斤。因此,虽然X1系列在重量上领先,但ThinkPad Z13却更加紧凑。它实际上与戴尔XPS 13 Plus 9320的尺寸相同,但厚度略小。MacBook Air更薄,但也更大。
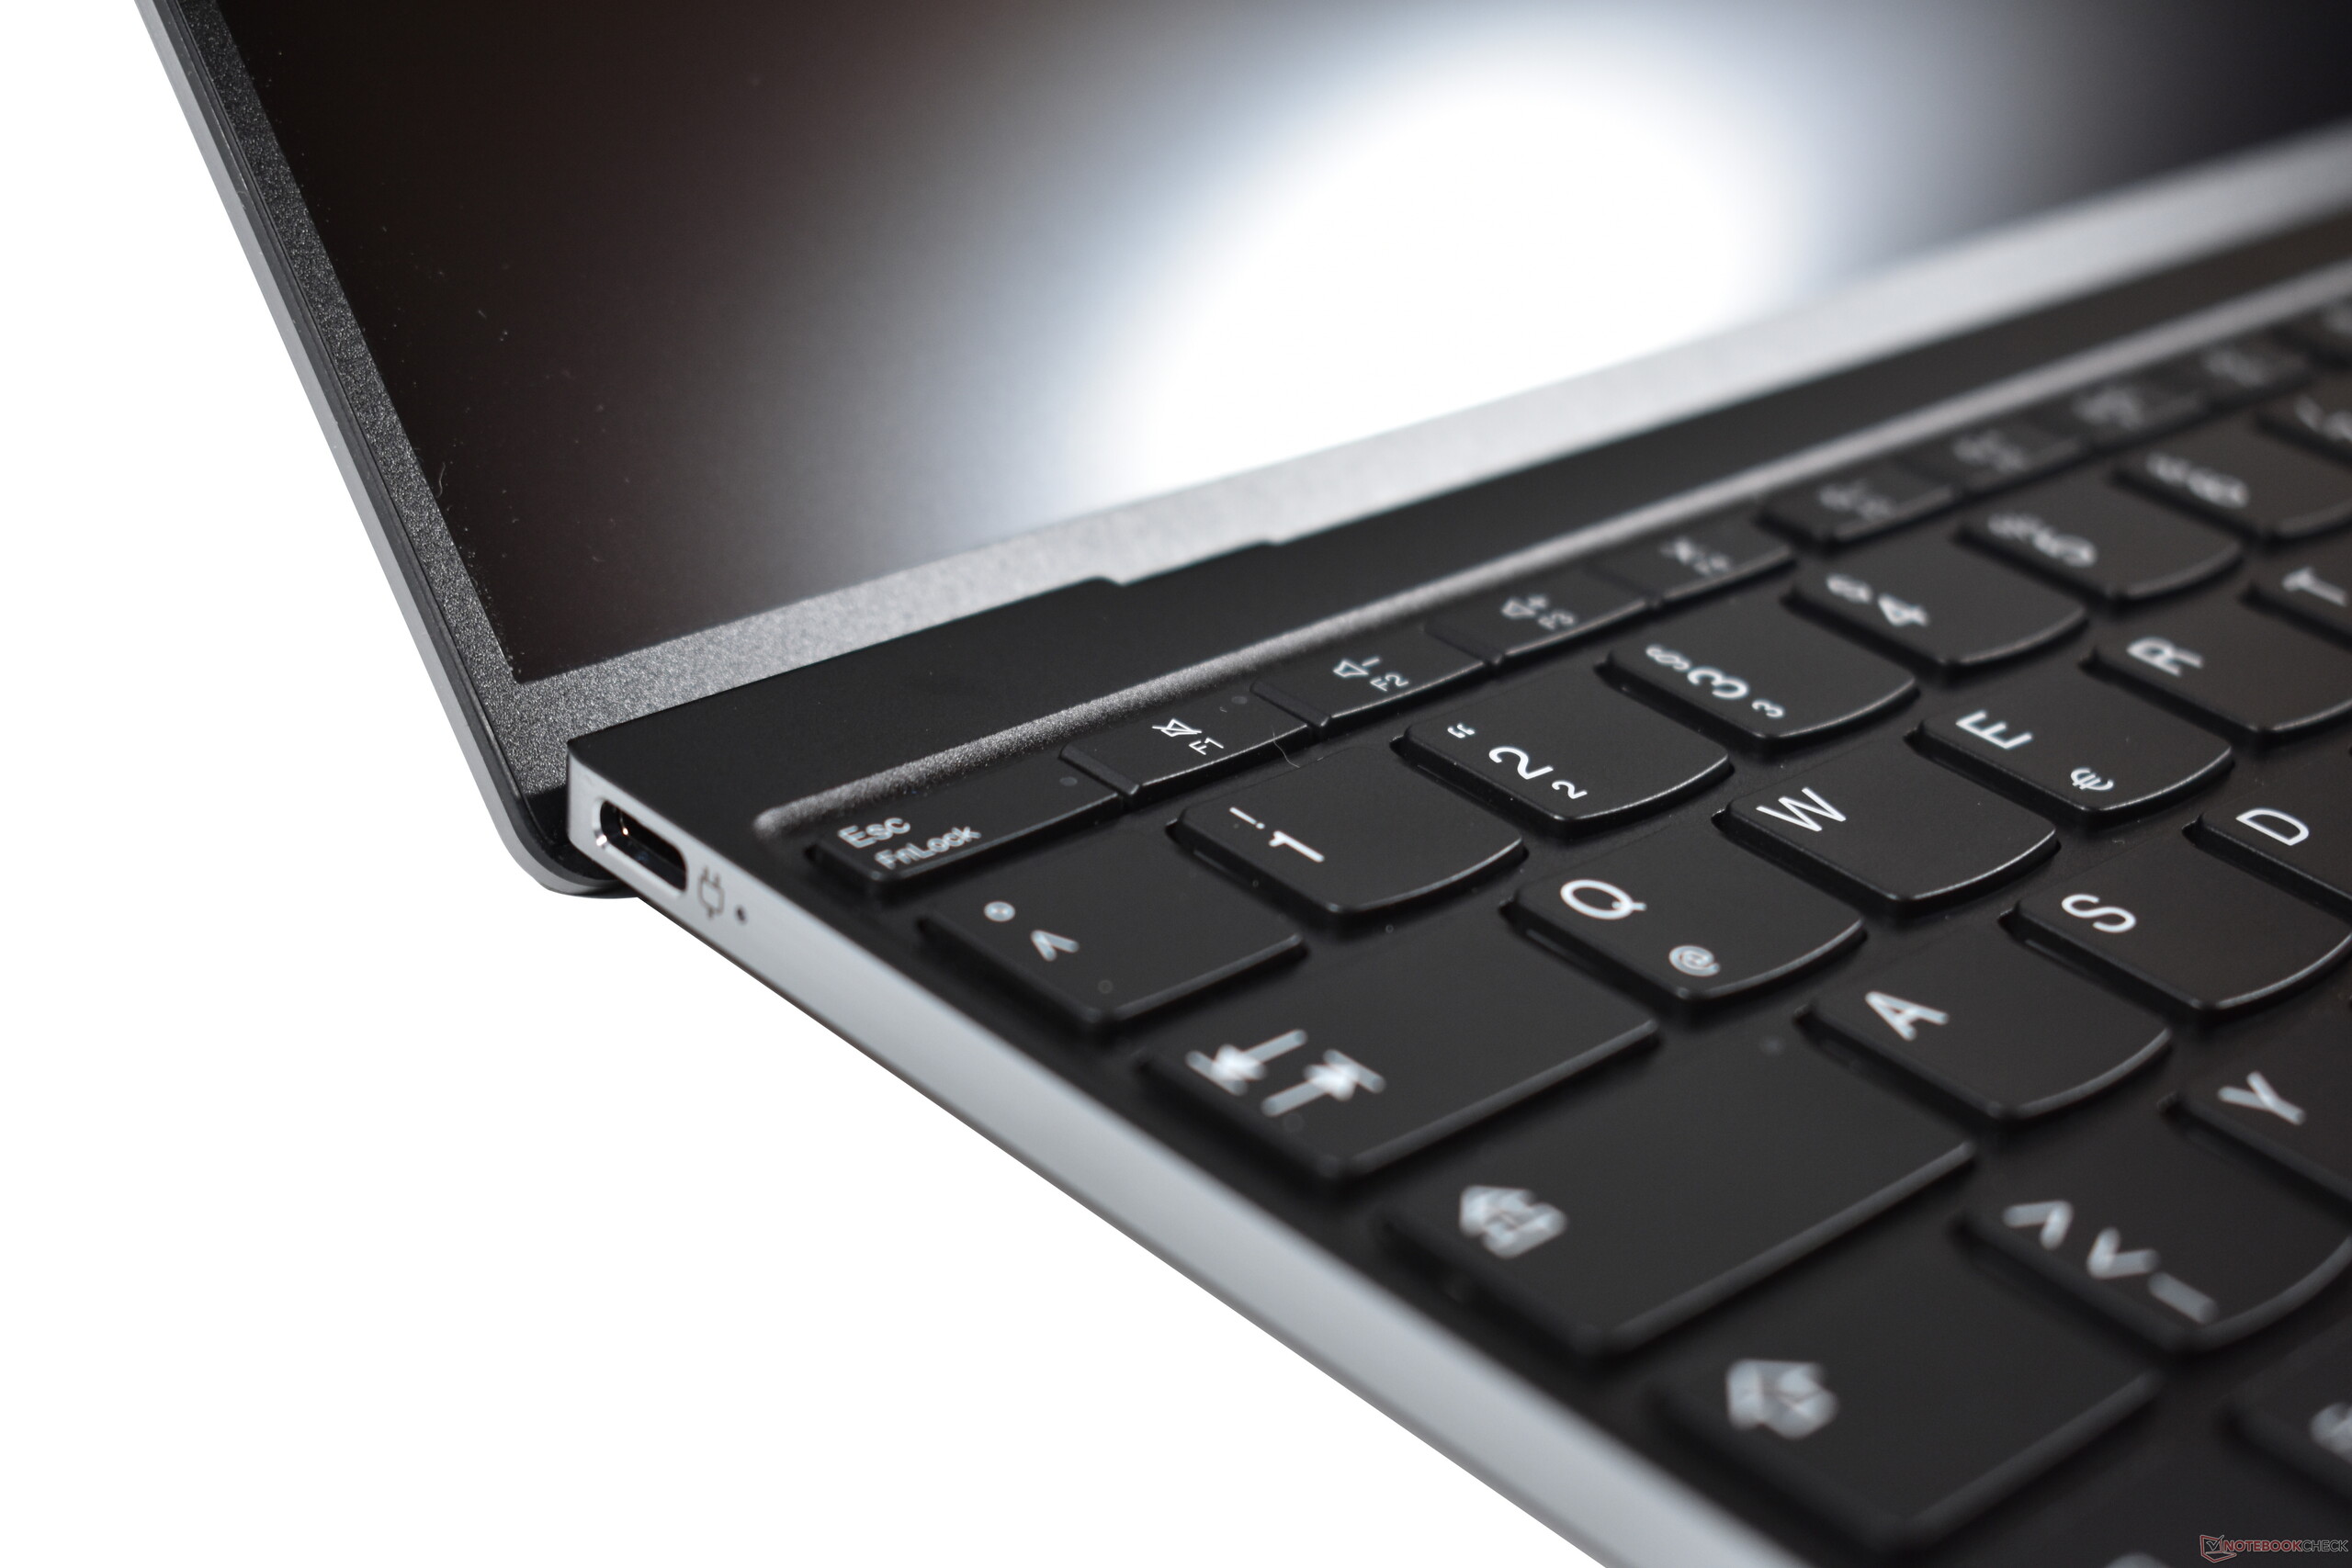
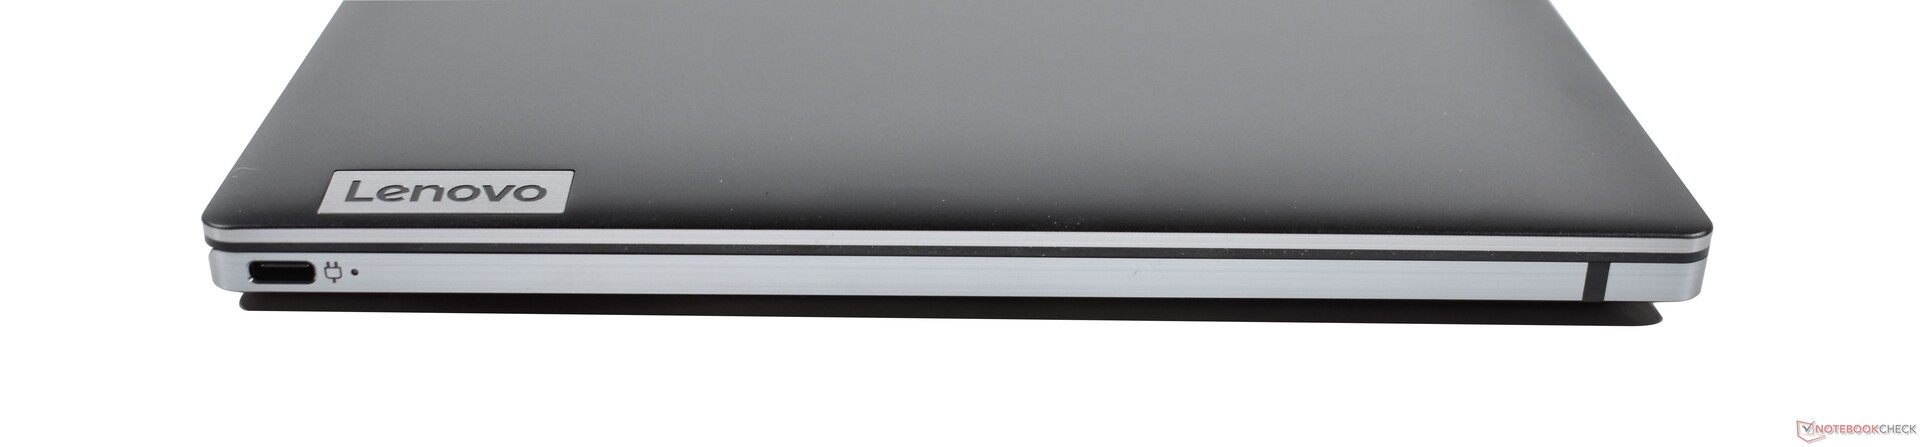
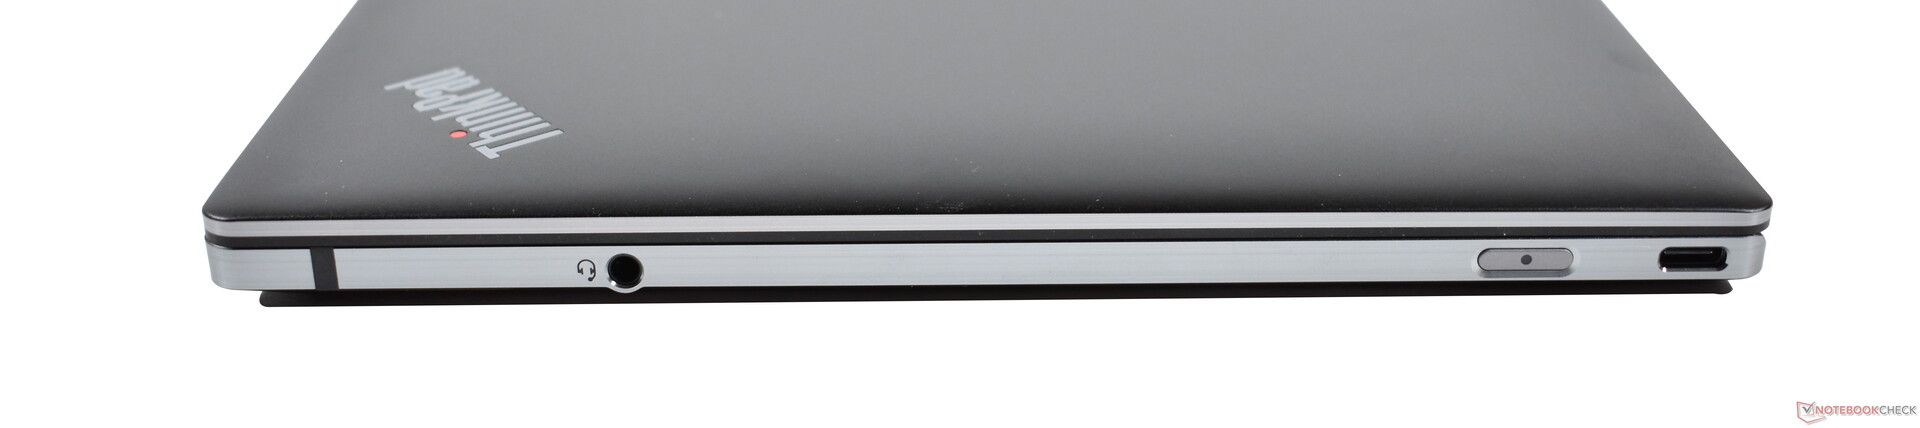
连接性。带有USB4的ThinkPad笔记本电脑
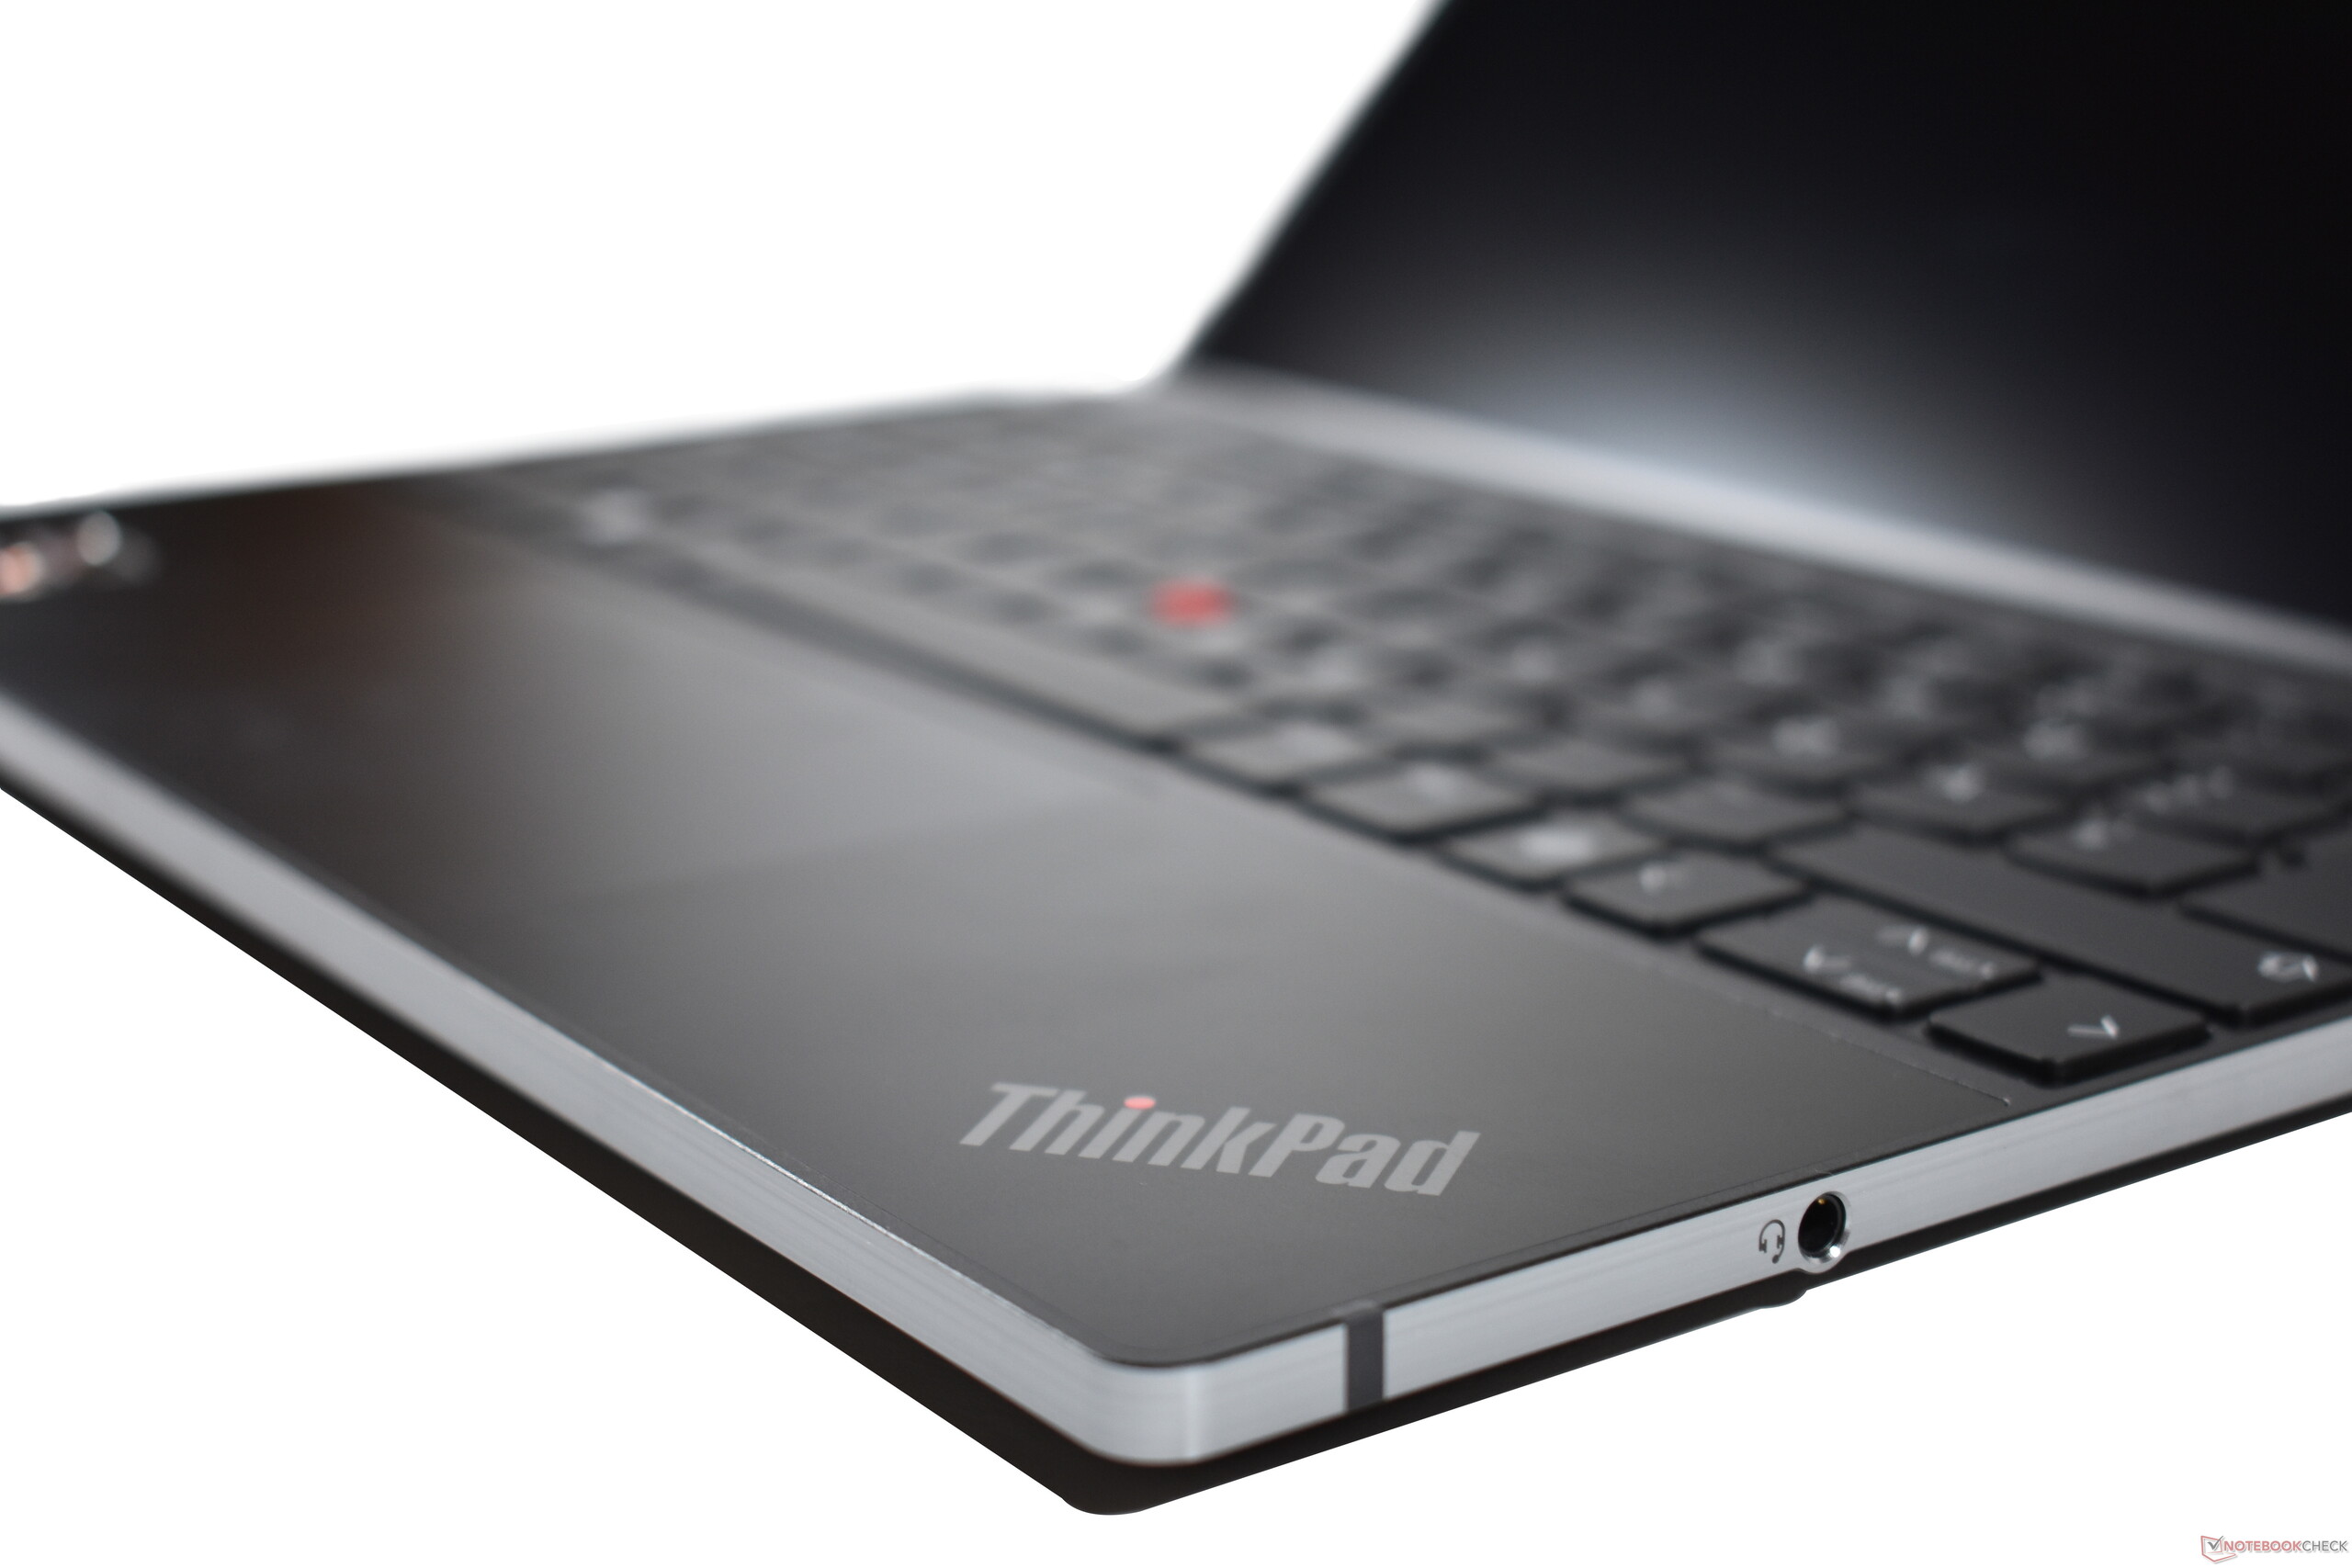
联想只为ThinkPad Z13 G1提供了数量有限的端口--两个USB4和一个3.5毫米音频插孔。因此,ThinkPad Z13的端口与 X1 Nano.然而,Z13的两侧各有一个USB-C接口,这意味着它可以方便地在两侧充电。由于有音频输出,它的配置要比 XPS 13 Plus.
当然,这只适用于USB4真正支持Thunderbolt时。幸运的是,我们有一个Thunderbolt 3 eGPU底座。它与ThinkPad Z13配合得完美无缺,所以我们可以说。通过USB4的Thunderbolt技术是可行的。
沟通
联想ThinkPad Z13的所有型号都支持现代Wi-Fi 6E标准--但不是采用英特尔的Wi-Fi解决方案,而是高通公司的。高通公司WCN685x,也被称为高通NFA-75A,是一个2x2的Wi-Fi 6E模块,在ThinkPad Z13上没有任何重大问题,尽管有一些波动。总的来说,实现了高传输率,但在我们的测试中,它们被限制在Wi-Fi 6的速度。
ThinkPad Z13可以选择配备4G模块。尽管如此,没有WWAN配置,所以不能加装。
| Networking | |
| iperf3 receive AXE11000 | |
| Dell XPS 13 Plus 9320 4K | |
| Average Qualcomm WCN685x (852 - 1777, n=21) | |
| Average of class Subnotebook (504 - 1827, n=51, last 2 years) | |
| Apple MacBook Air M2 Entry | |
| iperf3 transmit AXE11000 | |
| Dell XPS 13 Plus 9320 4K | |
| Average Qualcomm WCN685x (521 - 1838, n=21) | |
| Average of class Subnotebook (467 - 1811, n=51, last 2 years) | |
| Apple MacBook Air M2 Entry | |
| iperf3 transmit AX12 | |
| Lenovo ThinkPad X1 Nano-20UN002UGE | |
| Average Qualcomm WCN685x (1049 - 1094, n=2) | |
| iperf3 receive AX12 | |
| Average Qualcomm WCN685x (1371 - 1537, n=2) | |
| Lenovo ThinkPad X1 Nano-20UN002UGE | |
网络摄像头
网络摄像头被放在显示屏盖板上非常显眼的位置。它的质量对于一台笔记本电脑来说是好的,但并不突出。


安全问题
除了指纹传感器,联想ThinkPad Z13还有一个红外摄像头,用于生物识别登录。电子快门是一项新功能:不使用物理快门,而是按F9键就能以电子方式锁定相机。另一个新功能是微软的Pluton安全芯片,它执行dTPM芯片的任务。它还默认阻止了Linux的安装,但这可以在BIOS中轻松改变。
辅料
除了65瓦的电源适配器外,没有其他附件。
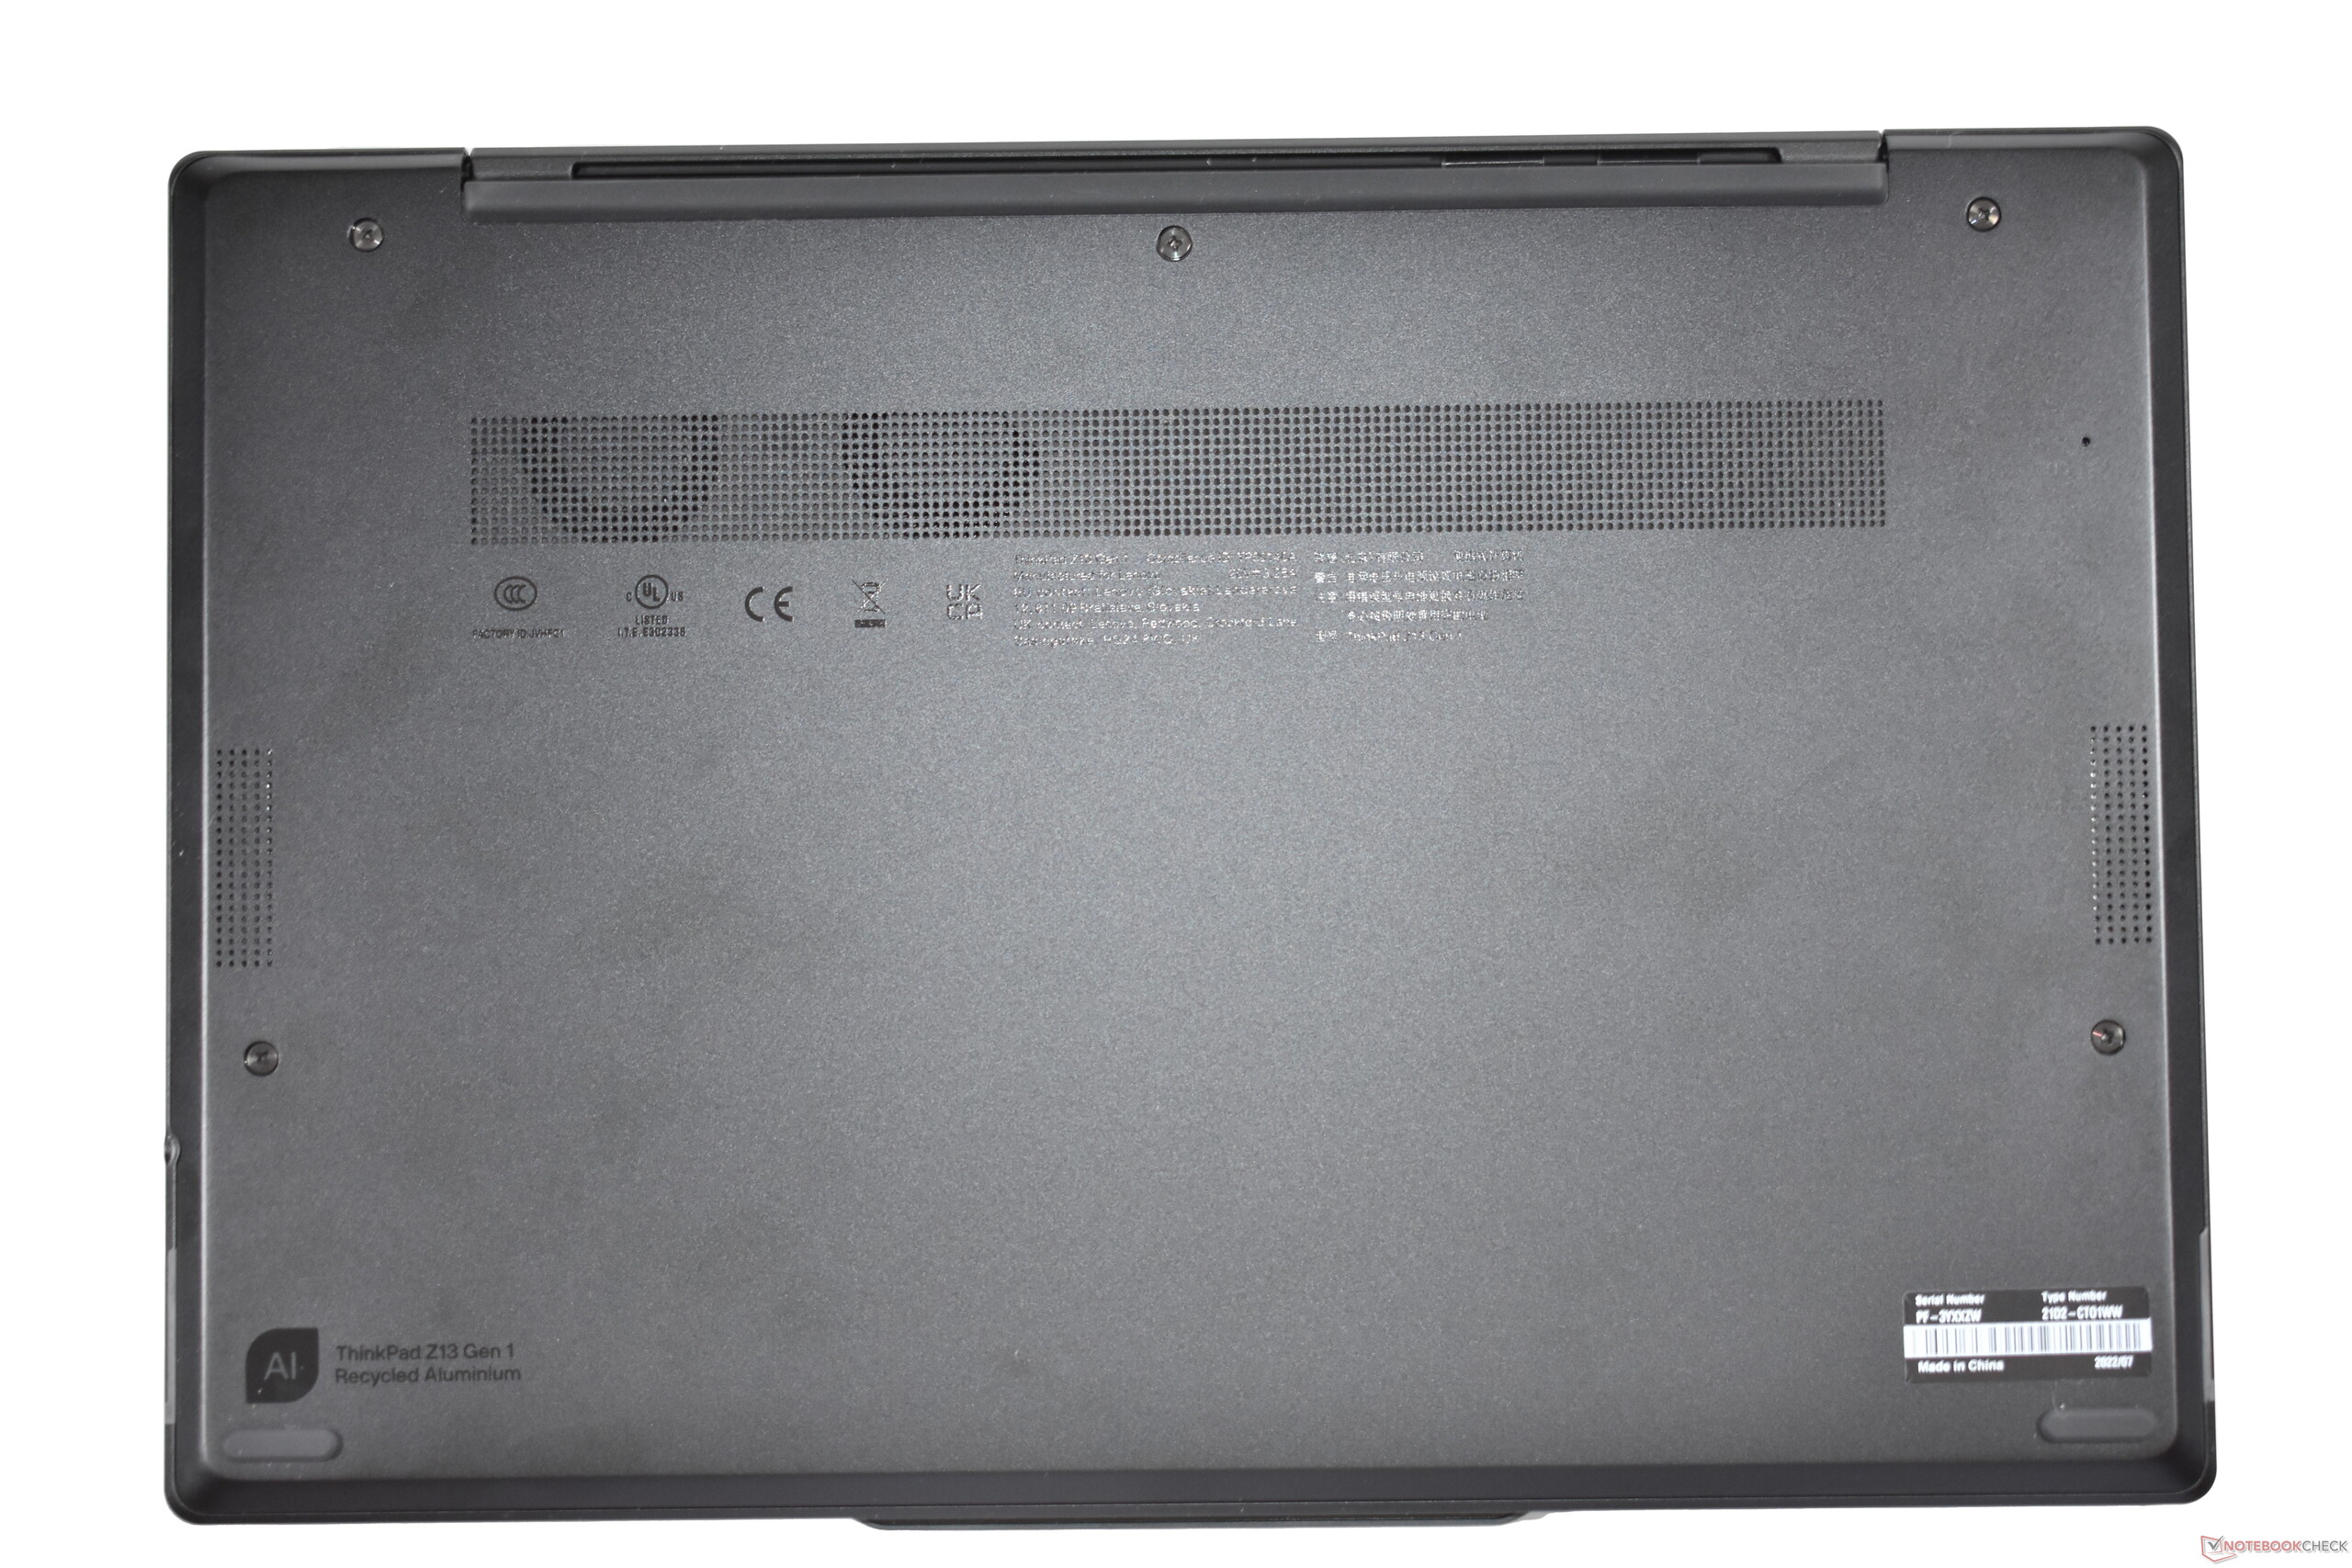
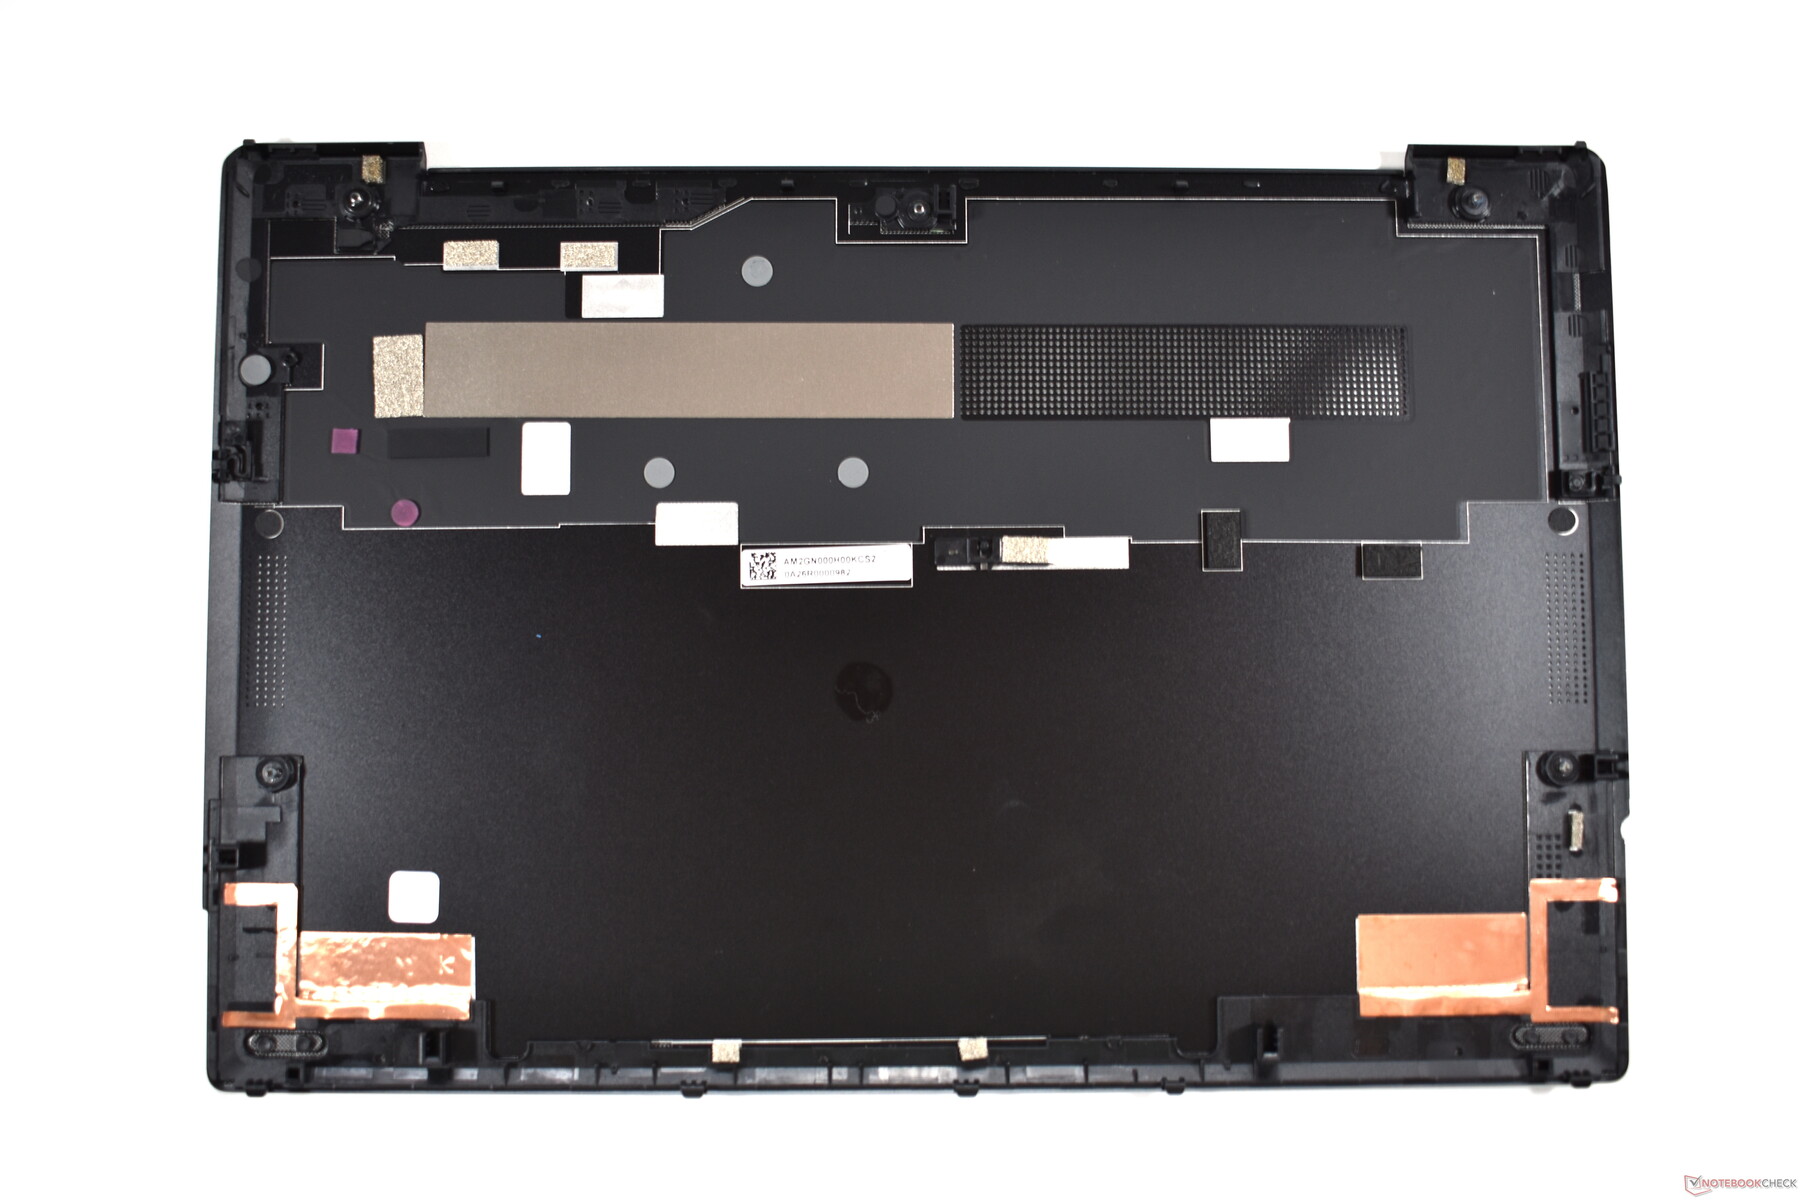
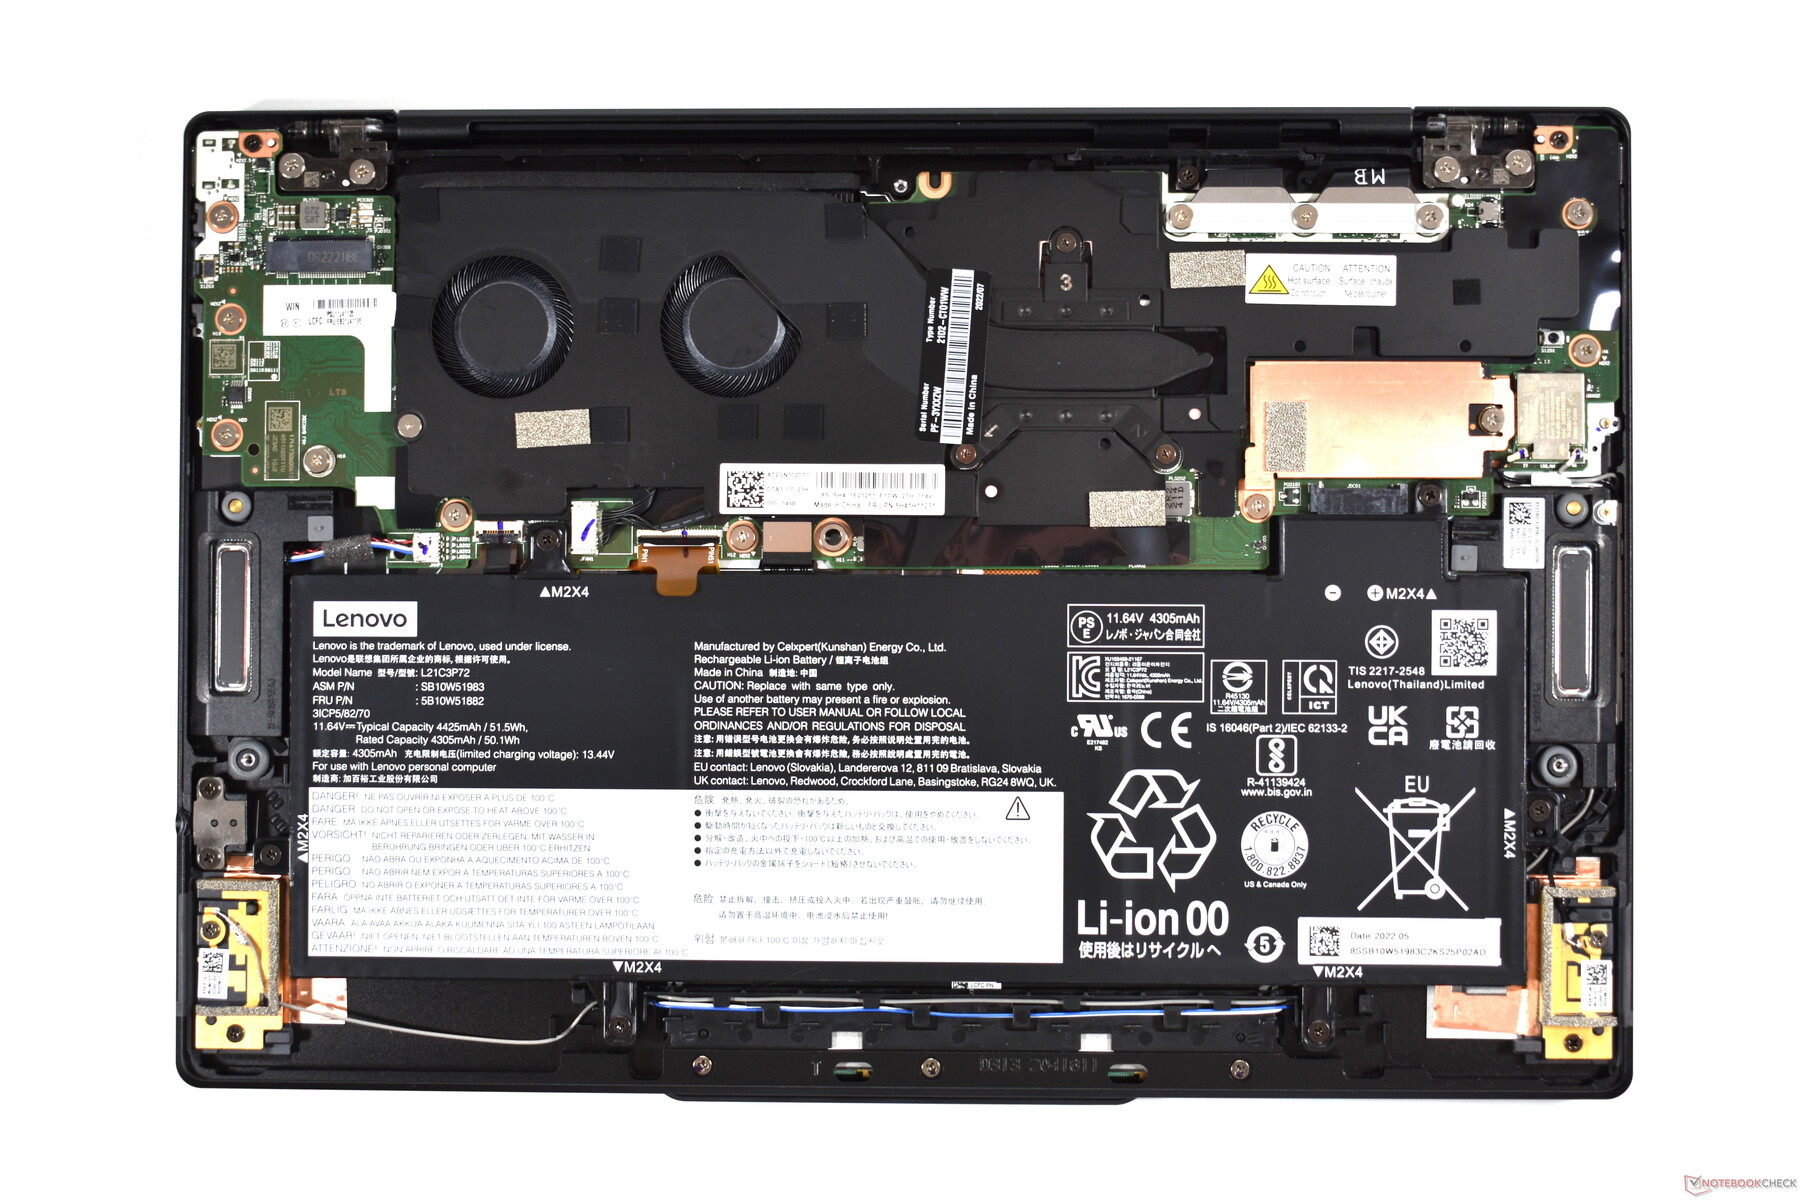
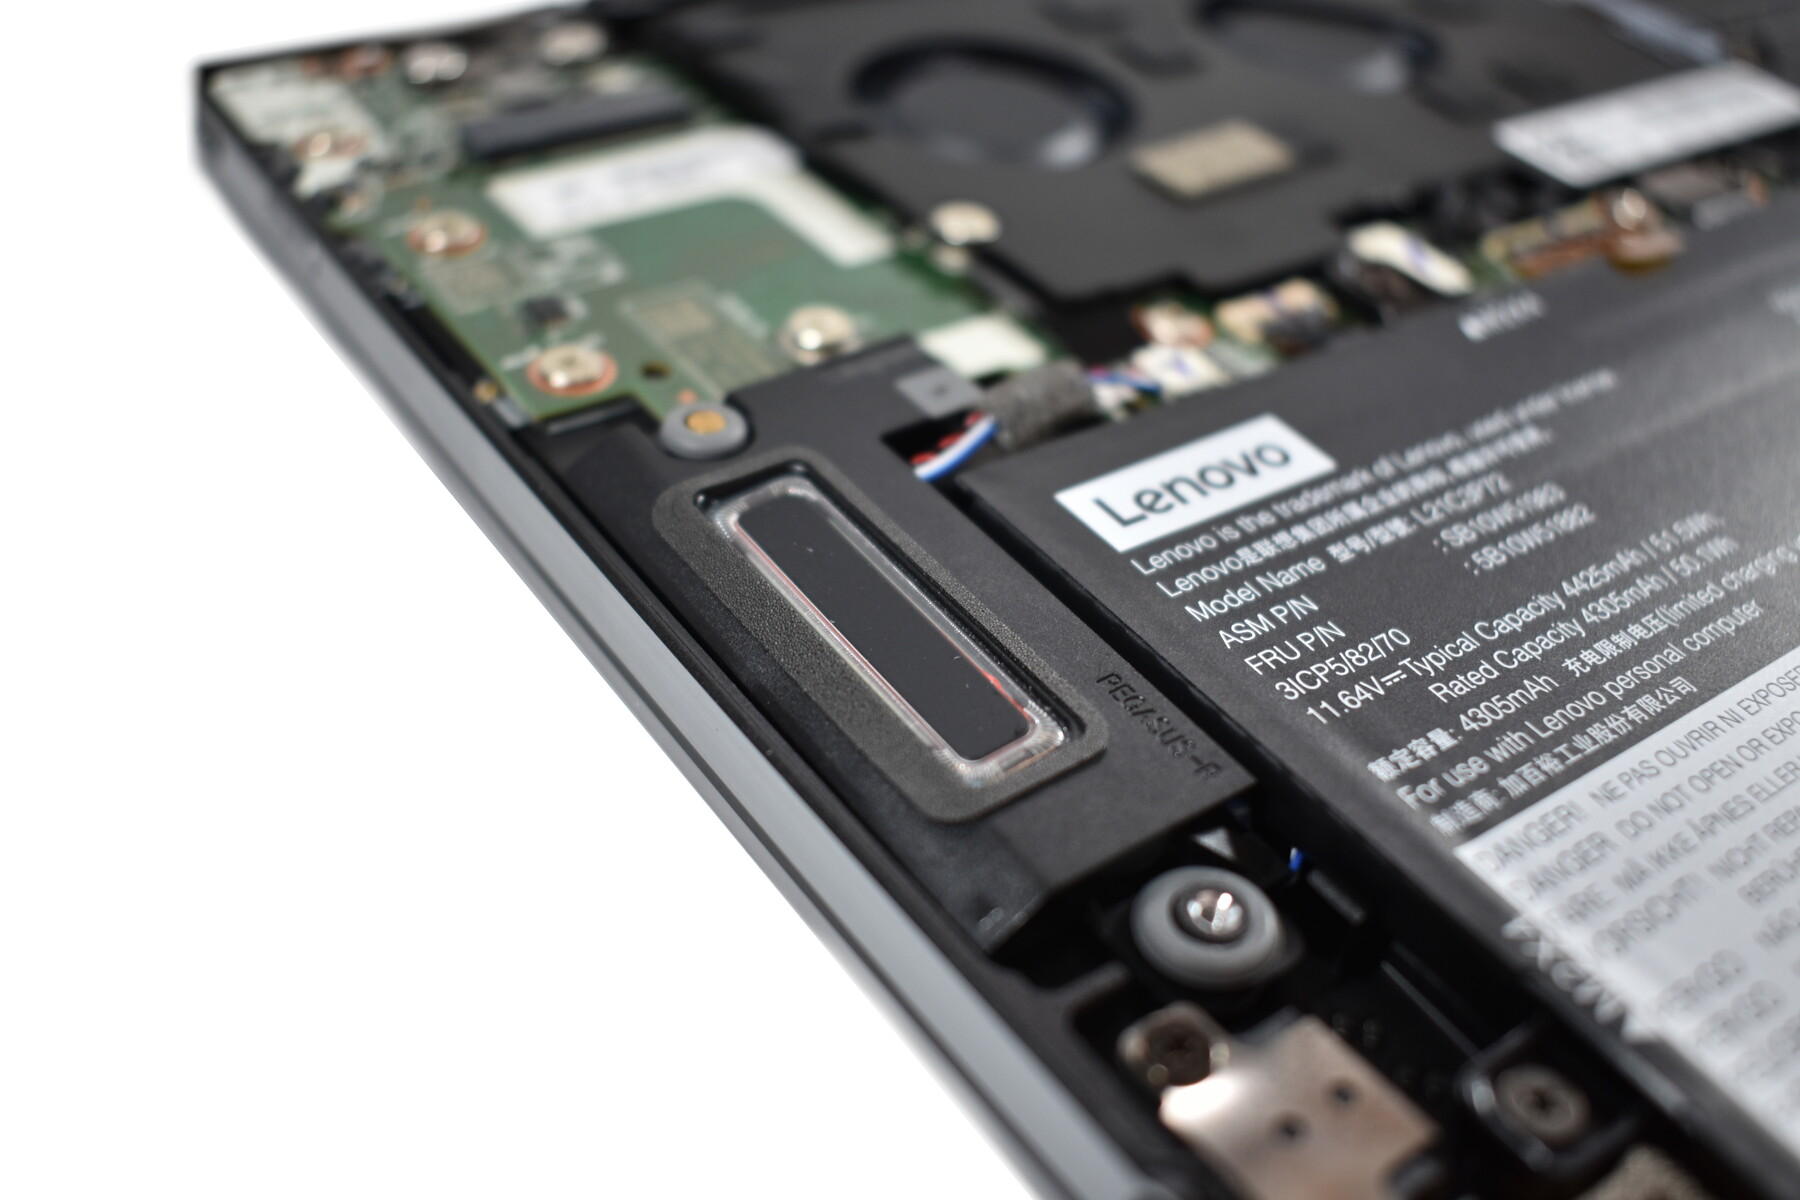
维护
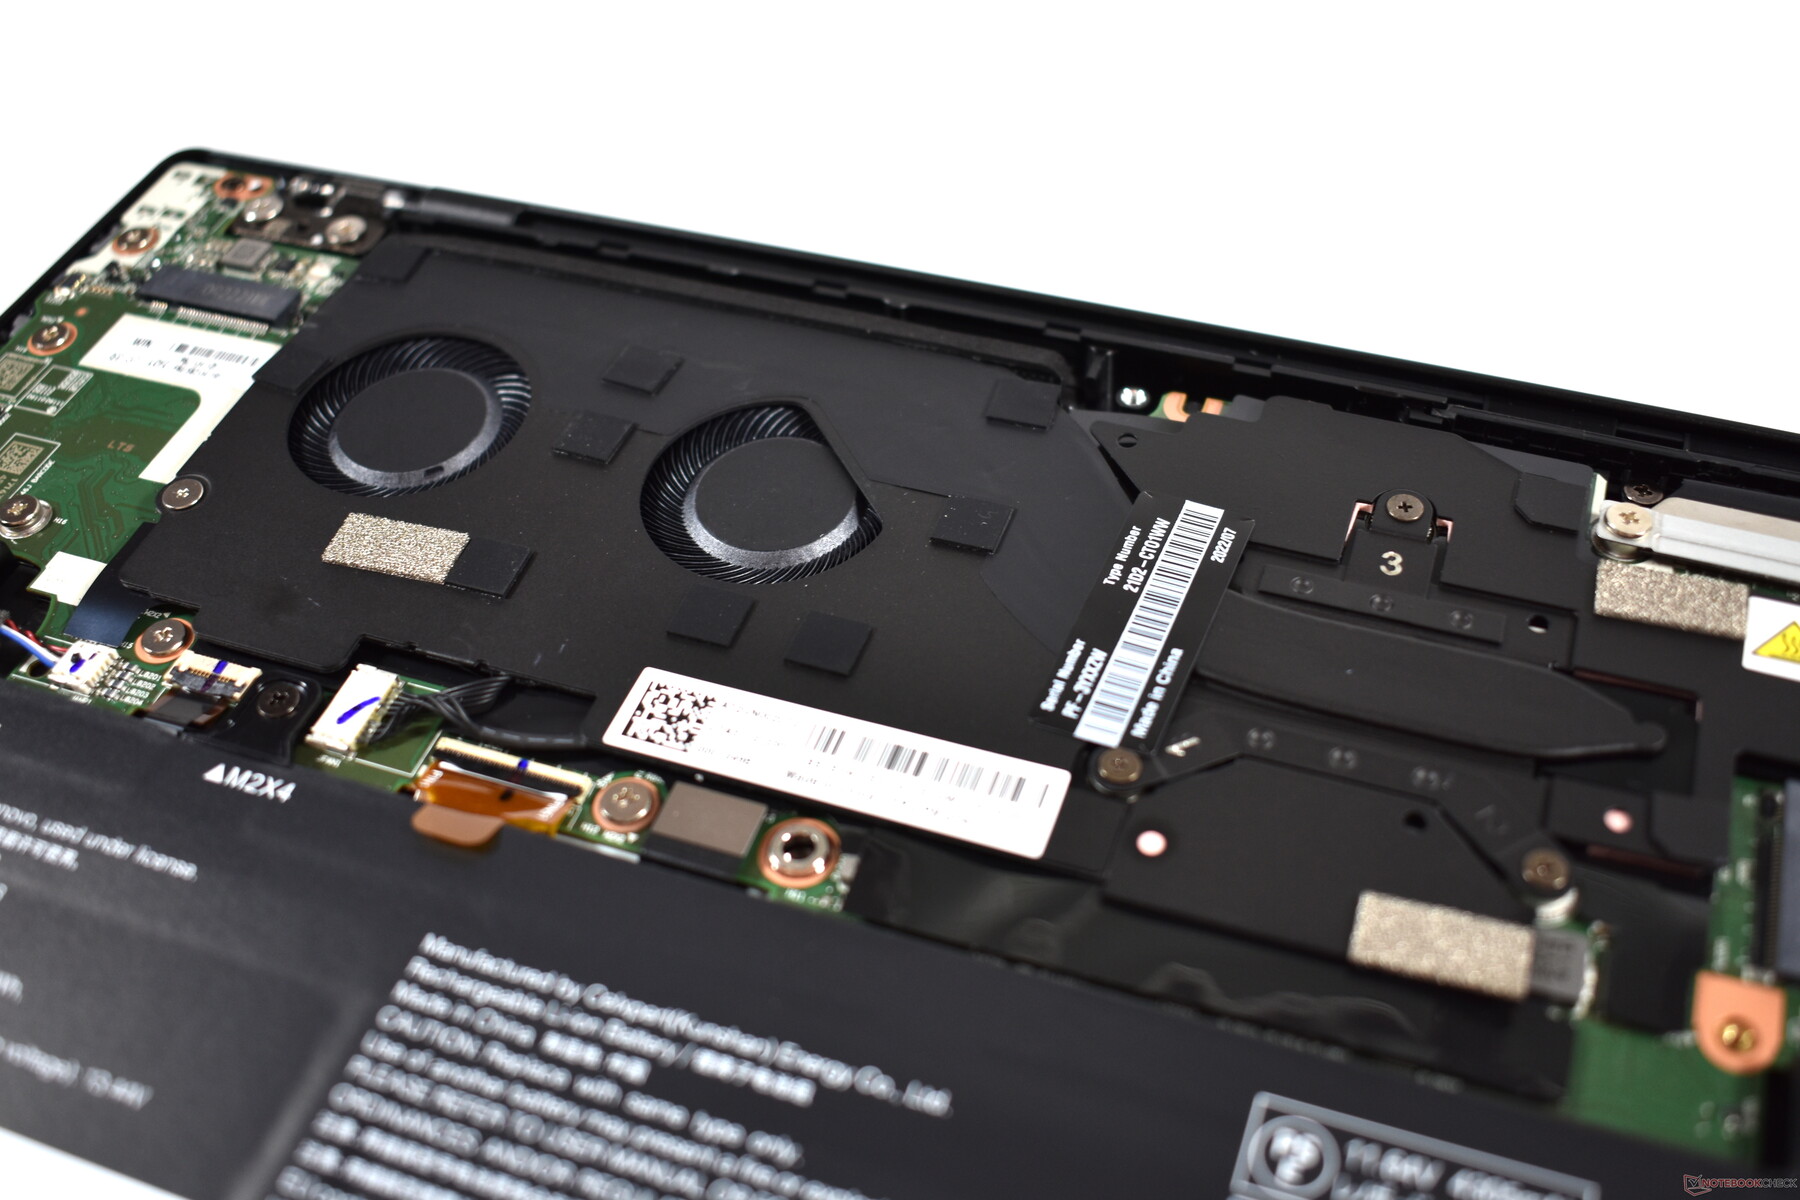
联想并没有让看一下里面的东西太难。只有五个十字头的螺丝需要松开,它们仍然卡在盖子里。然后,在铰链周围的区域有几个夹子。这些可以用铲刀工具快速松开,然后底盖就可以马上取下来。
在联想ThinkPad Z13中,只有M.2固态硬盘是可以升级的;内存以及Wi-Fi卡是焊接的,而没有WWAN配置。需要注意的是,M.2固态硬盘是单面的2242固态硬盘;两面都有存储芯片的型号将不适合。当然,除了SSD的升级,你也可以更换电池或清洁风扇。
担保
Z13有三年的保修期,默认情况下是带入服务。延长至五年是可能的,也可以增加意外损坏保护或高级支持等服务。
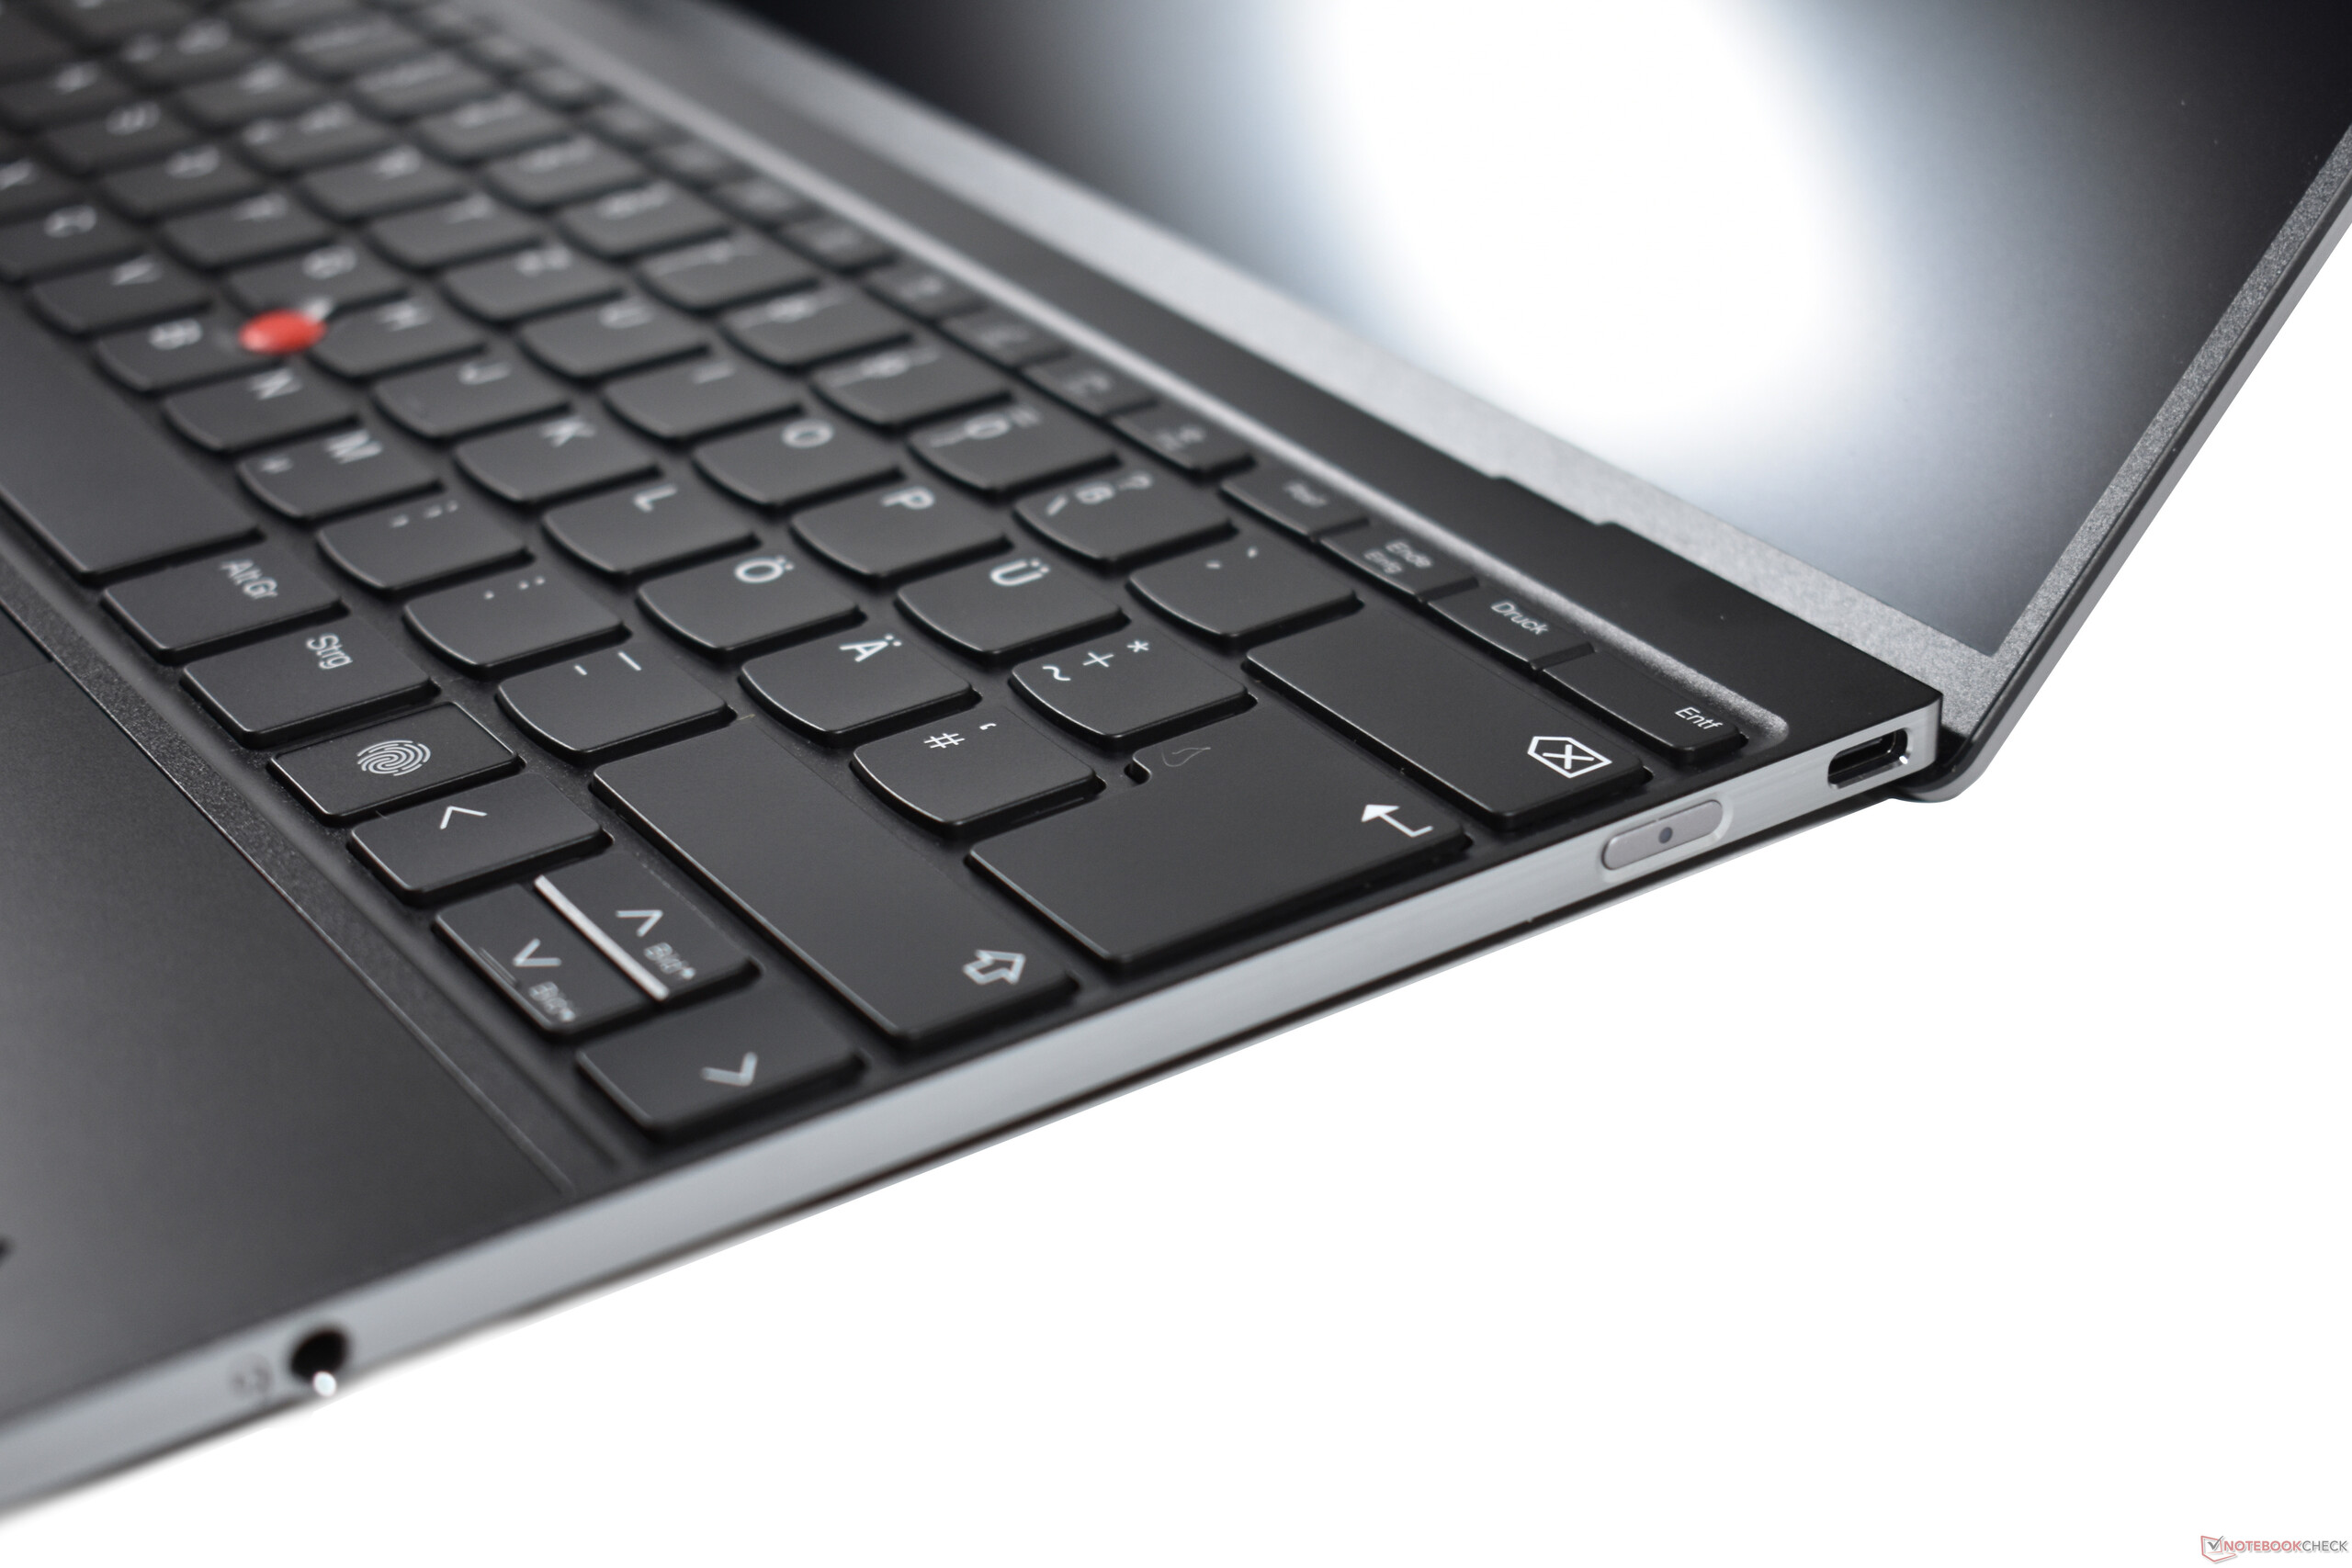
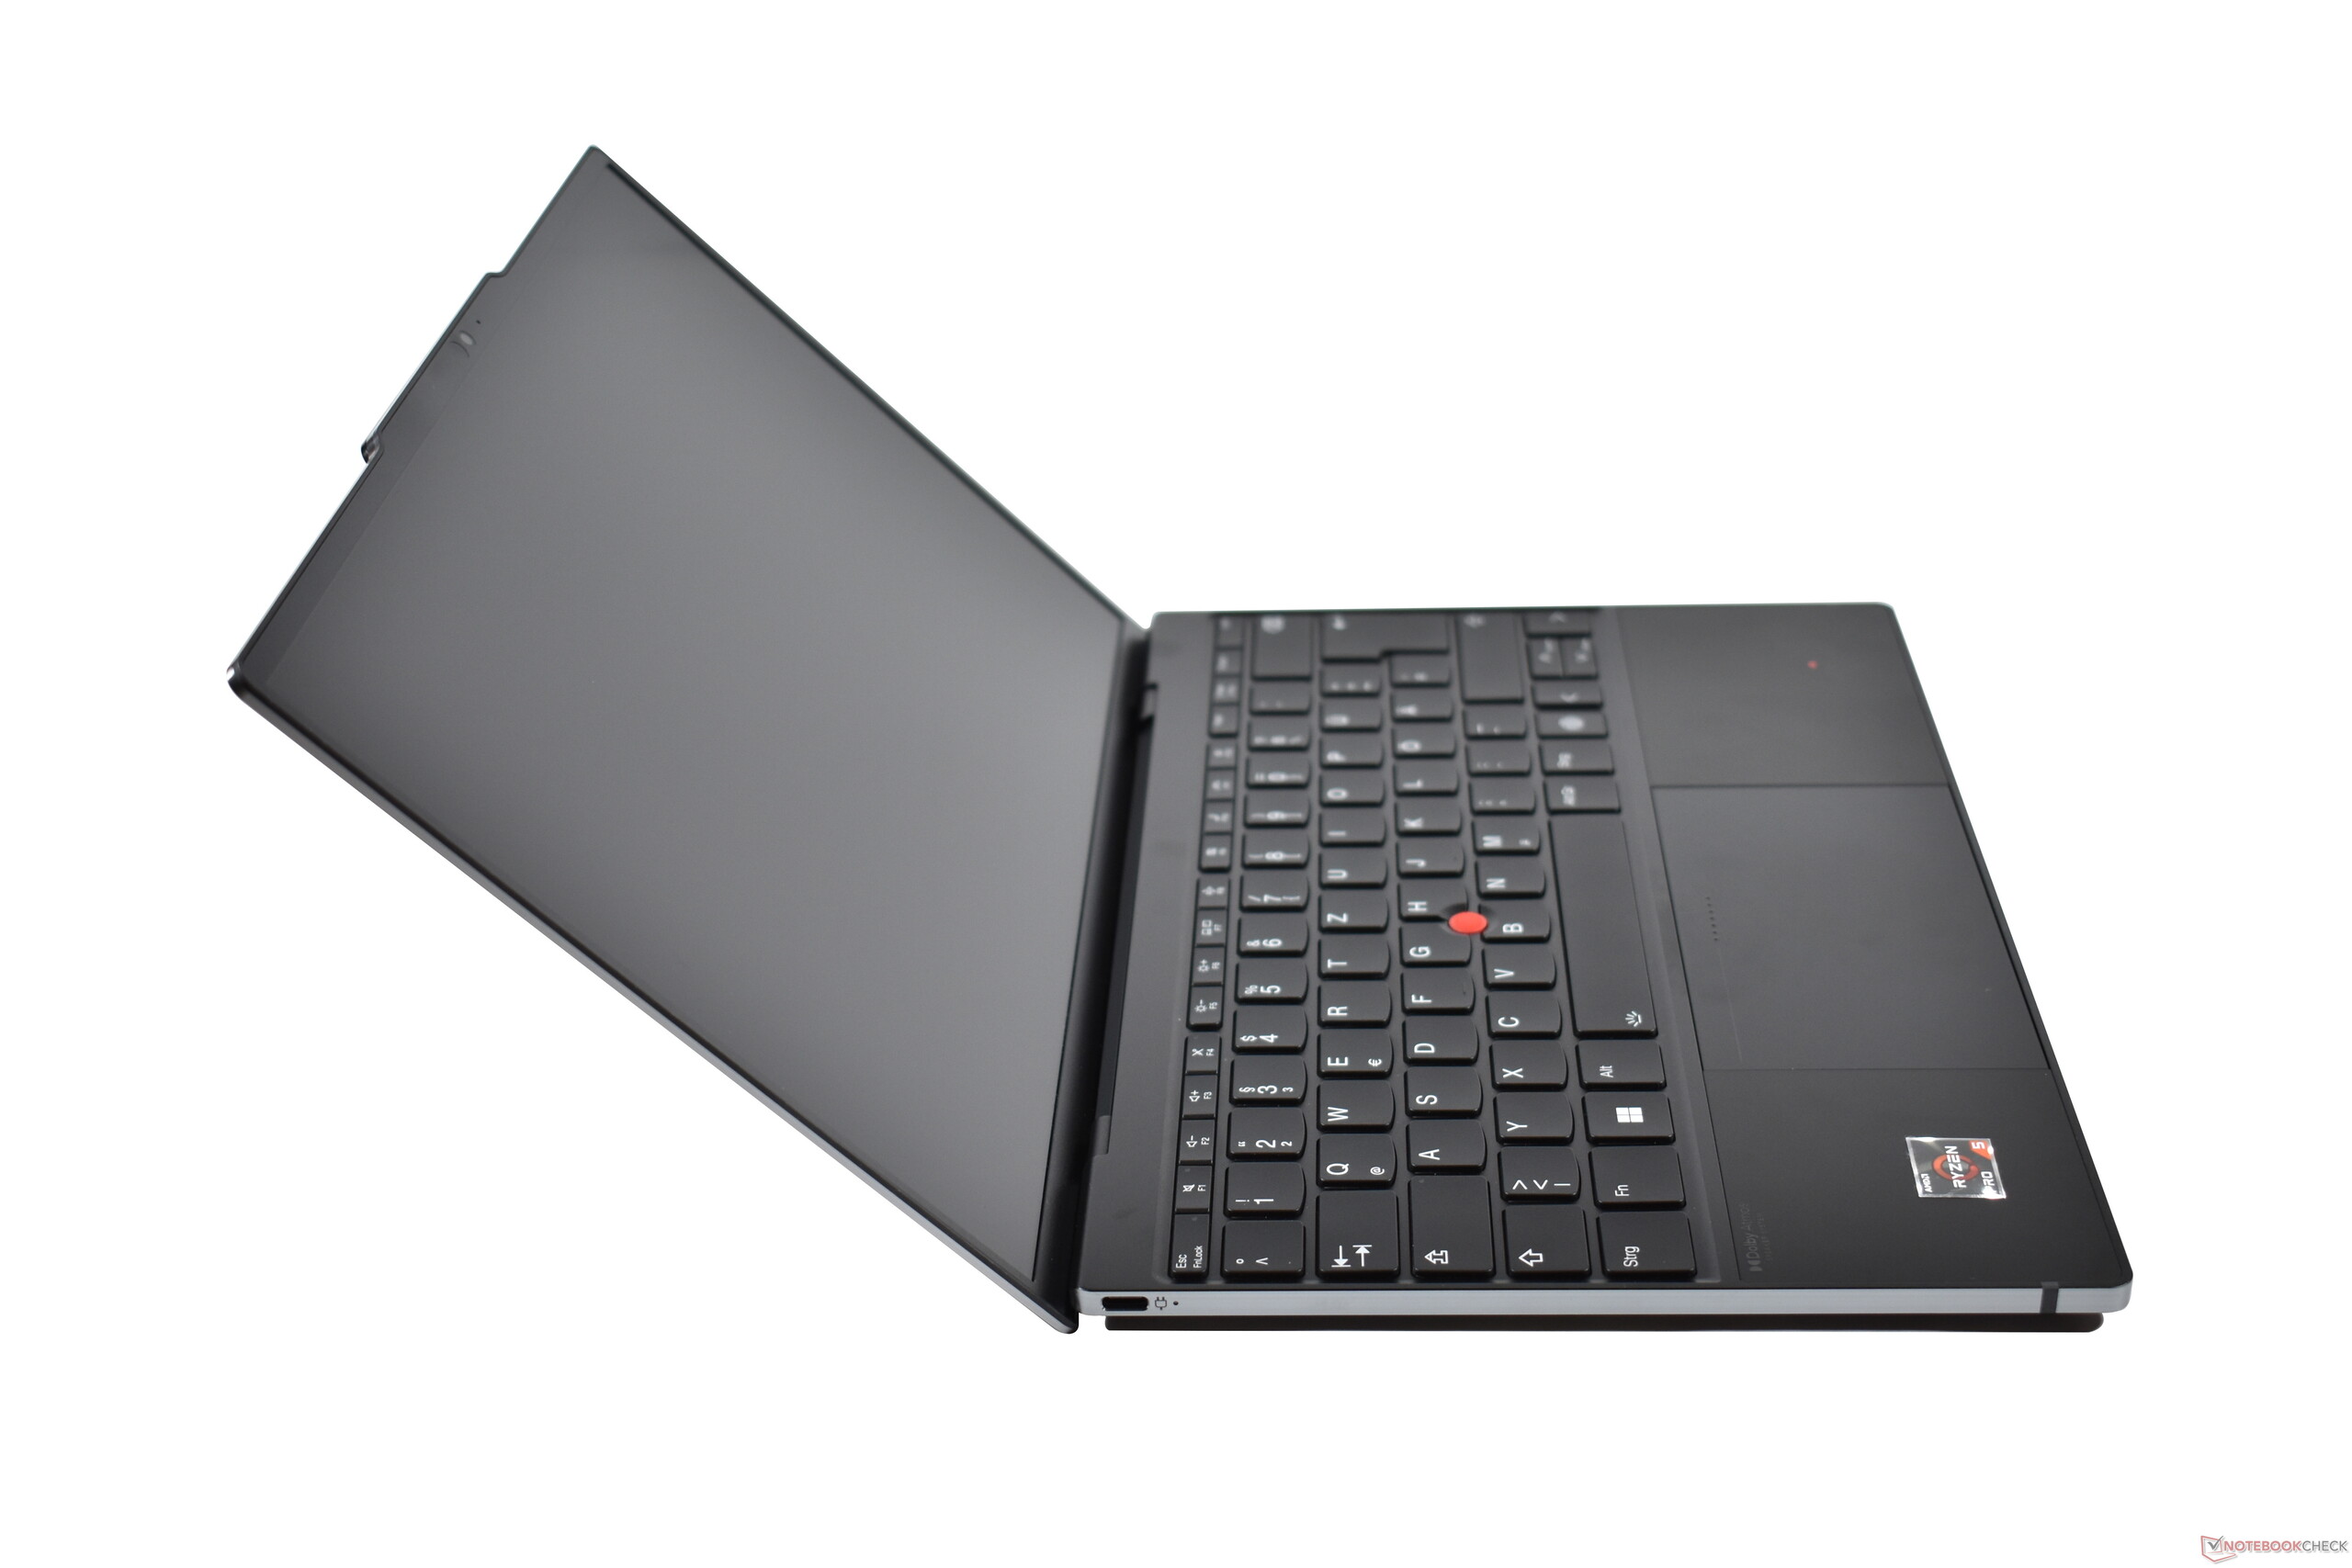
输入设备。全宽键盘和触觉跟踪板
键盘
两段式背光键盘类似于 联想ThinkPad X1 Nano,但并不完全相同。其共同点是键程为1.35毫米。键盘的尺寸是不同的。联想在ThinkPad Z13中安装了一个标准宽度的键盘,这导致键盘在两侧几乎没有边框。这是一个值得欢迎的变化,因为更大的按键增加了打字时的舒适度。Z13是同尺寸级别中唯一拥有全尺寸键盘的ThinkPad。
对方向键的重新设计不太受欢迎,而且Z13不再有专用的上/下页键。一台商务笔记本应该有这些键。联想还修改了Ctrl键的布局,现在首次在ThinkPad上位于Fn键的左边--几乎所有笔记本电脑的标准布局。这对ThinkPad的长期用户来说肯定是一个调整,但如果需要,可以在BIOS中改变按键布局。
总的来说,该键盘非常出色,肯定是这个尺寸和重量级别中最好的键盘之一。更大的ThinkPad和更深的键程肯定有其优势,但在ThinkPad Z13上仍然可以非常舒适地输入长篇文字。
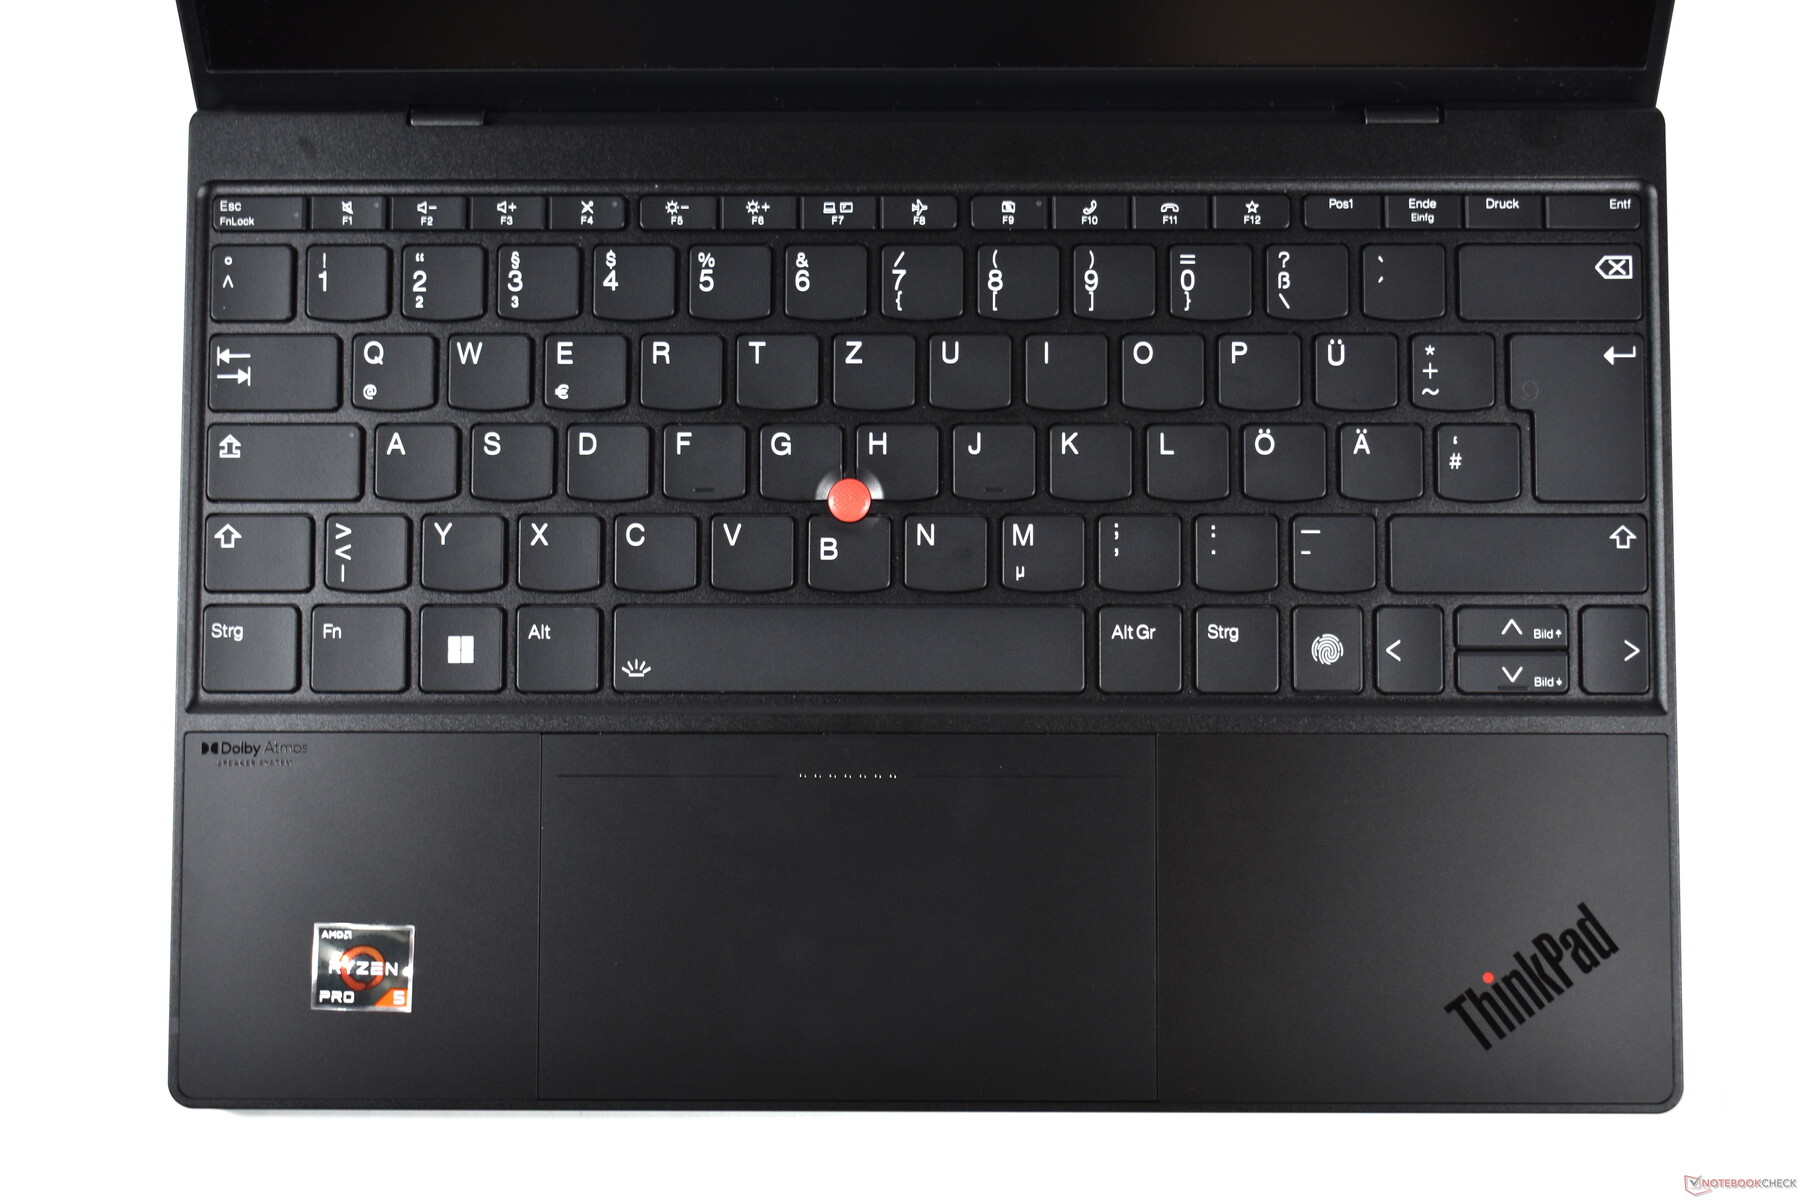
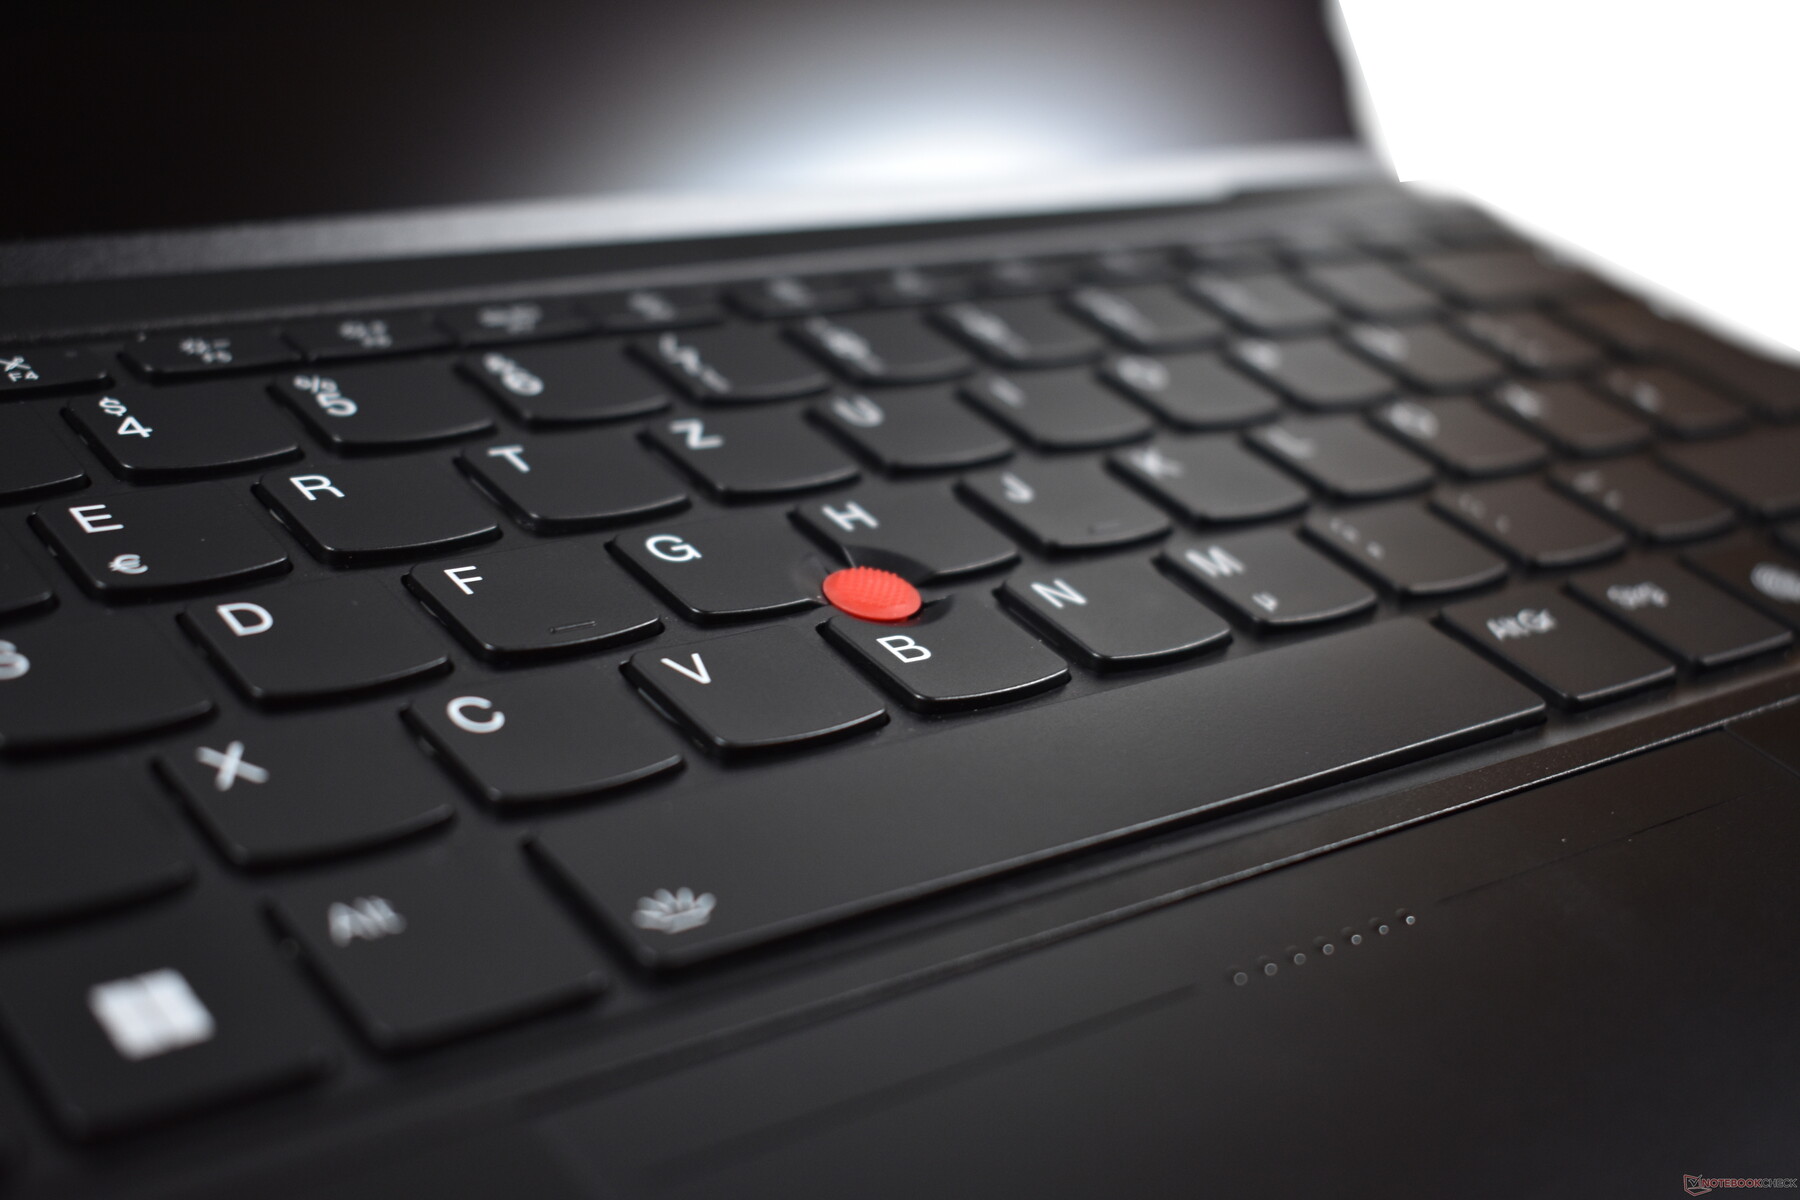
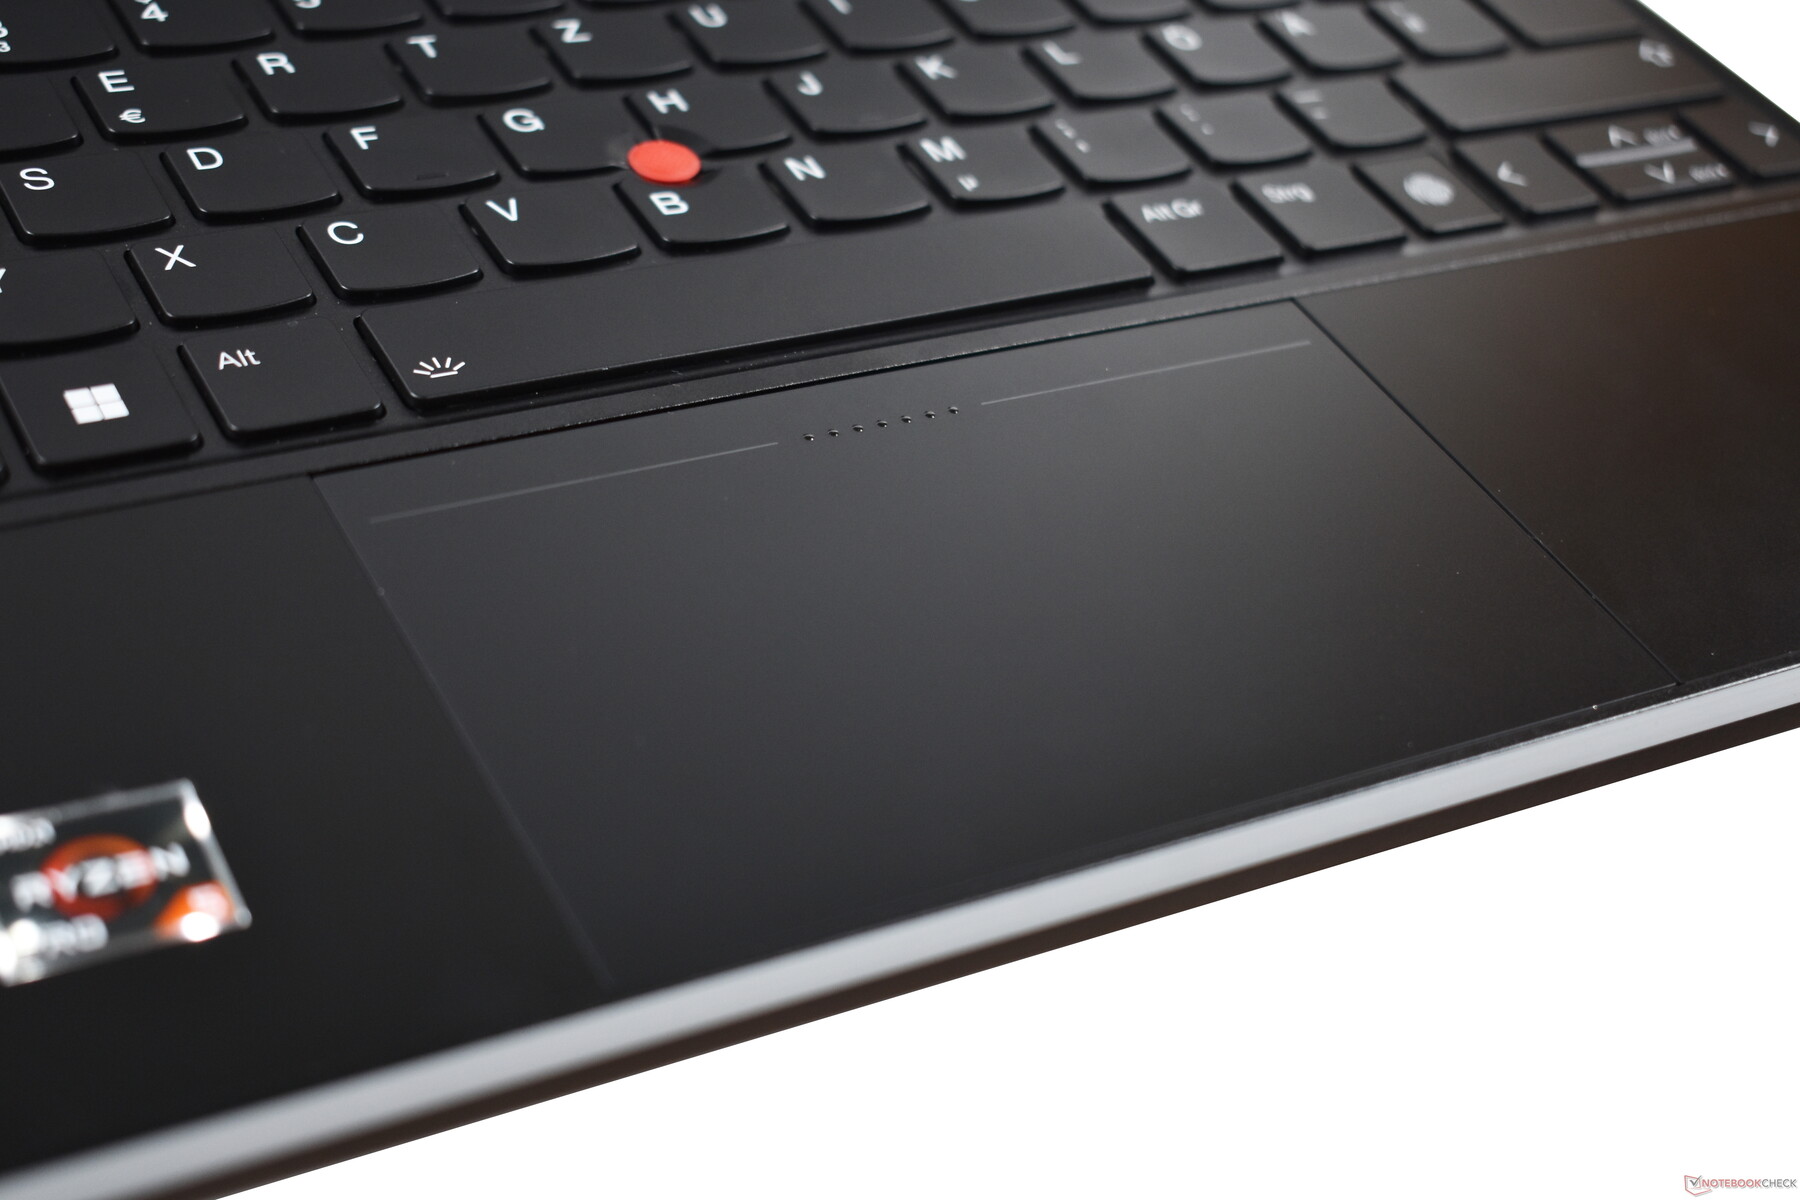
触摸板和TrackPoint
与键盘的变化相比,新的触控板具有相当大的突破性。这是自2014年和 X1 Carbon第二代以来的第一次以来,联想再次发布了一款没有专用TrackPoint按钮的ThinkPad。然而,与那时不同的是,我们现在有一个触觉解决方案,即点击只是模拟的,而ClickPad并不移动。通过这样做,联想实现了一件最重要的事情。增加了触摸板的面积。
这些修改有利于玻璃触摸板的用户体验,因为它比其他ThinkPads的触摸板更好。滑动性能很好,捏合变焦等手势也能顺利实现。更大的表面也使得你的手指不太可能没有空间来移动指针了。此外,触摸板现在可以随处点击了。
对标志性的红色指点杆--TrackPoint--所做的改变则不那么有利。先说一件事。新设计比2014年的设计要好得多,因为虚拟TrackPoint按钮非常容易配置。用户可以决定需要多大的力量来触发点击,以及点击的声音应该有多大--它甚至可以是无声的。
然而,联想未能解决这种设计的一个基本问题。没有物理按钮,就没有办法盲目地感知在哪里按压进行右键或左键。这只有在中央按钮上才能实现,联想在触摸板上放置了一些触觉点。这意味着,在使用过程中,你有时无法触发所需的按钮。随着时间的推移,这种错误会减少,你会习惯于新的解决方案,但这并不比拥有专用按钮更好。
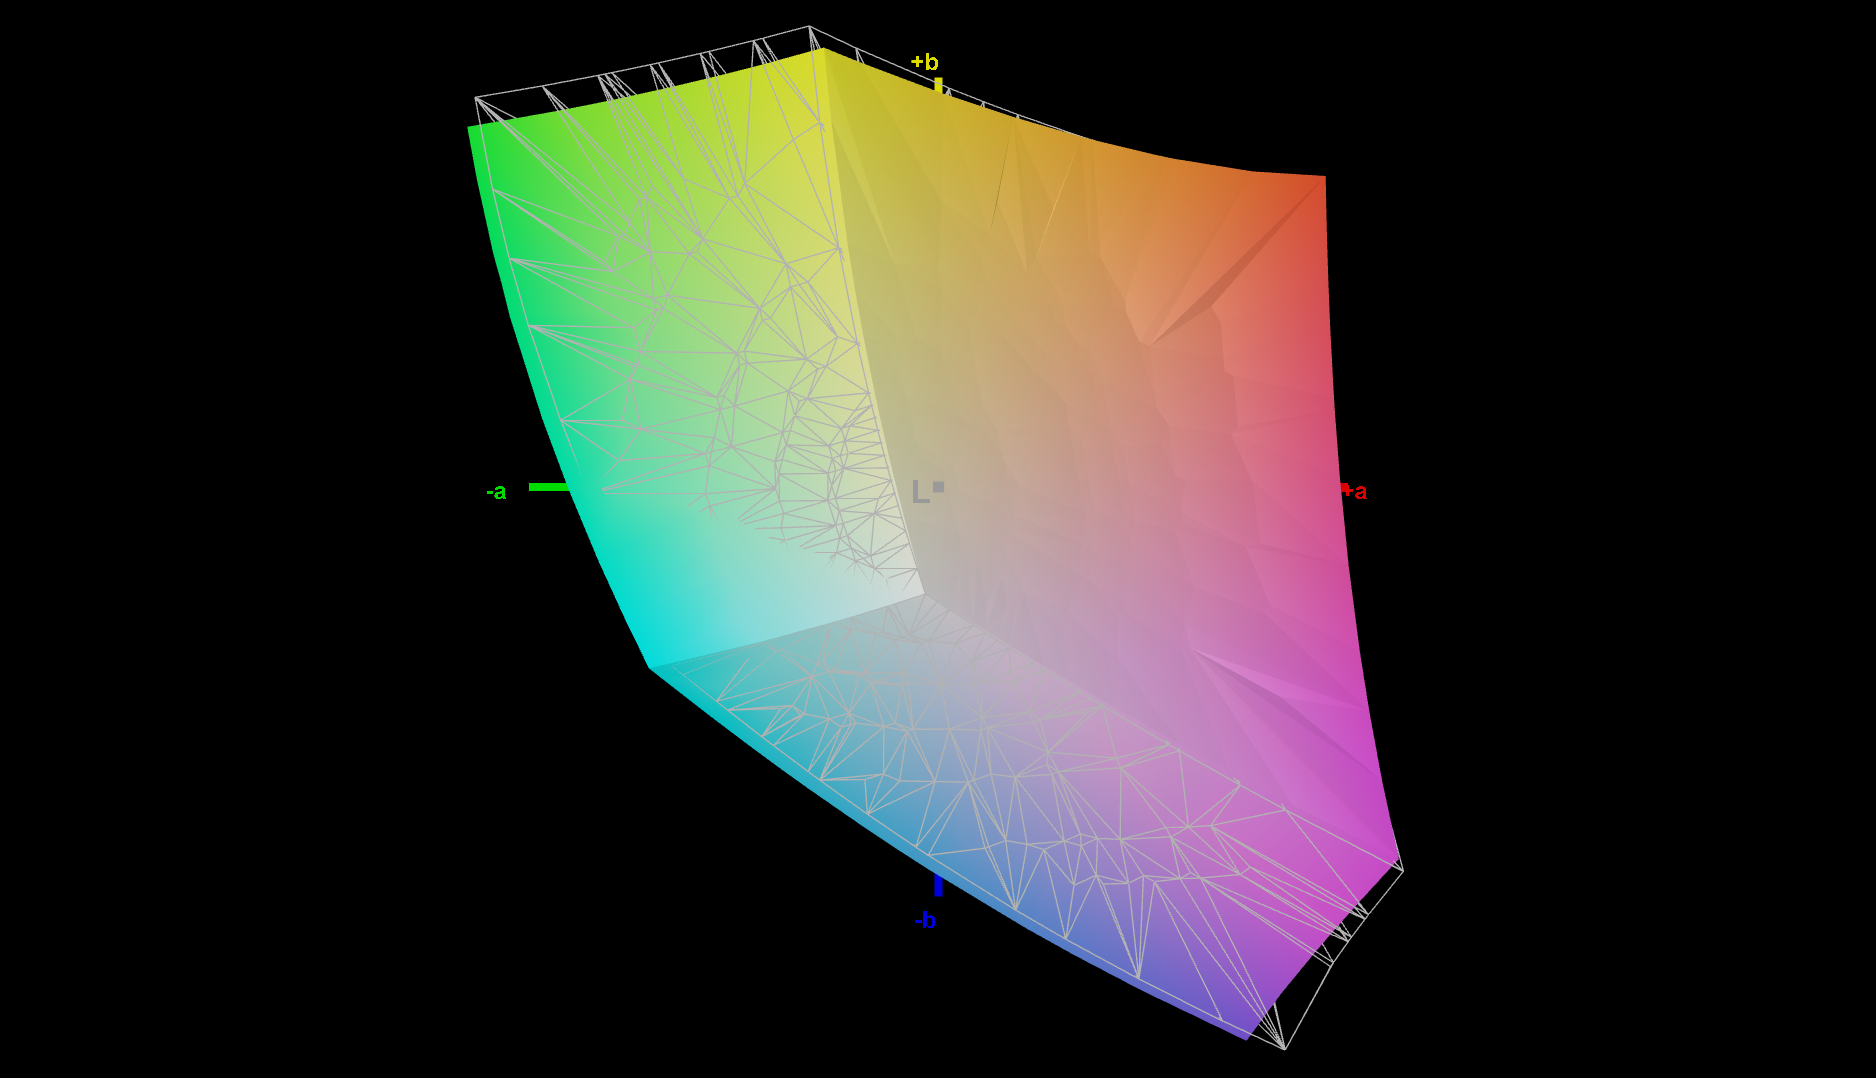
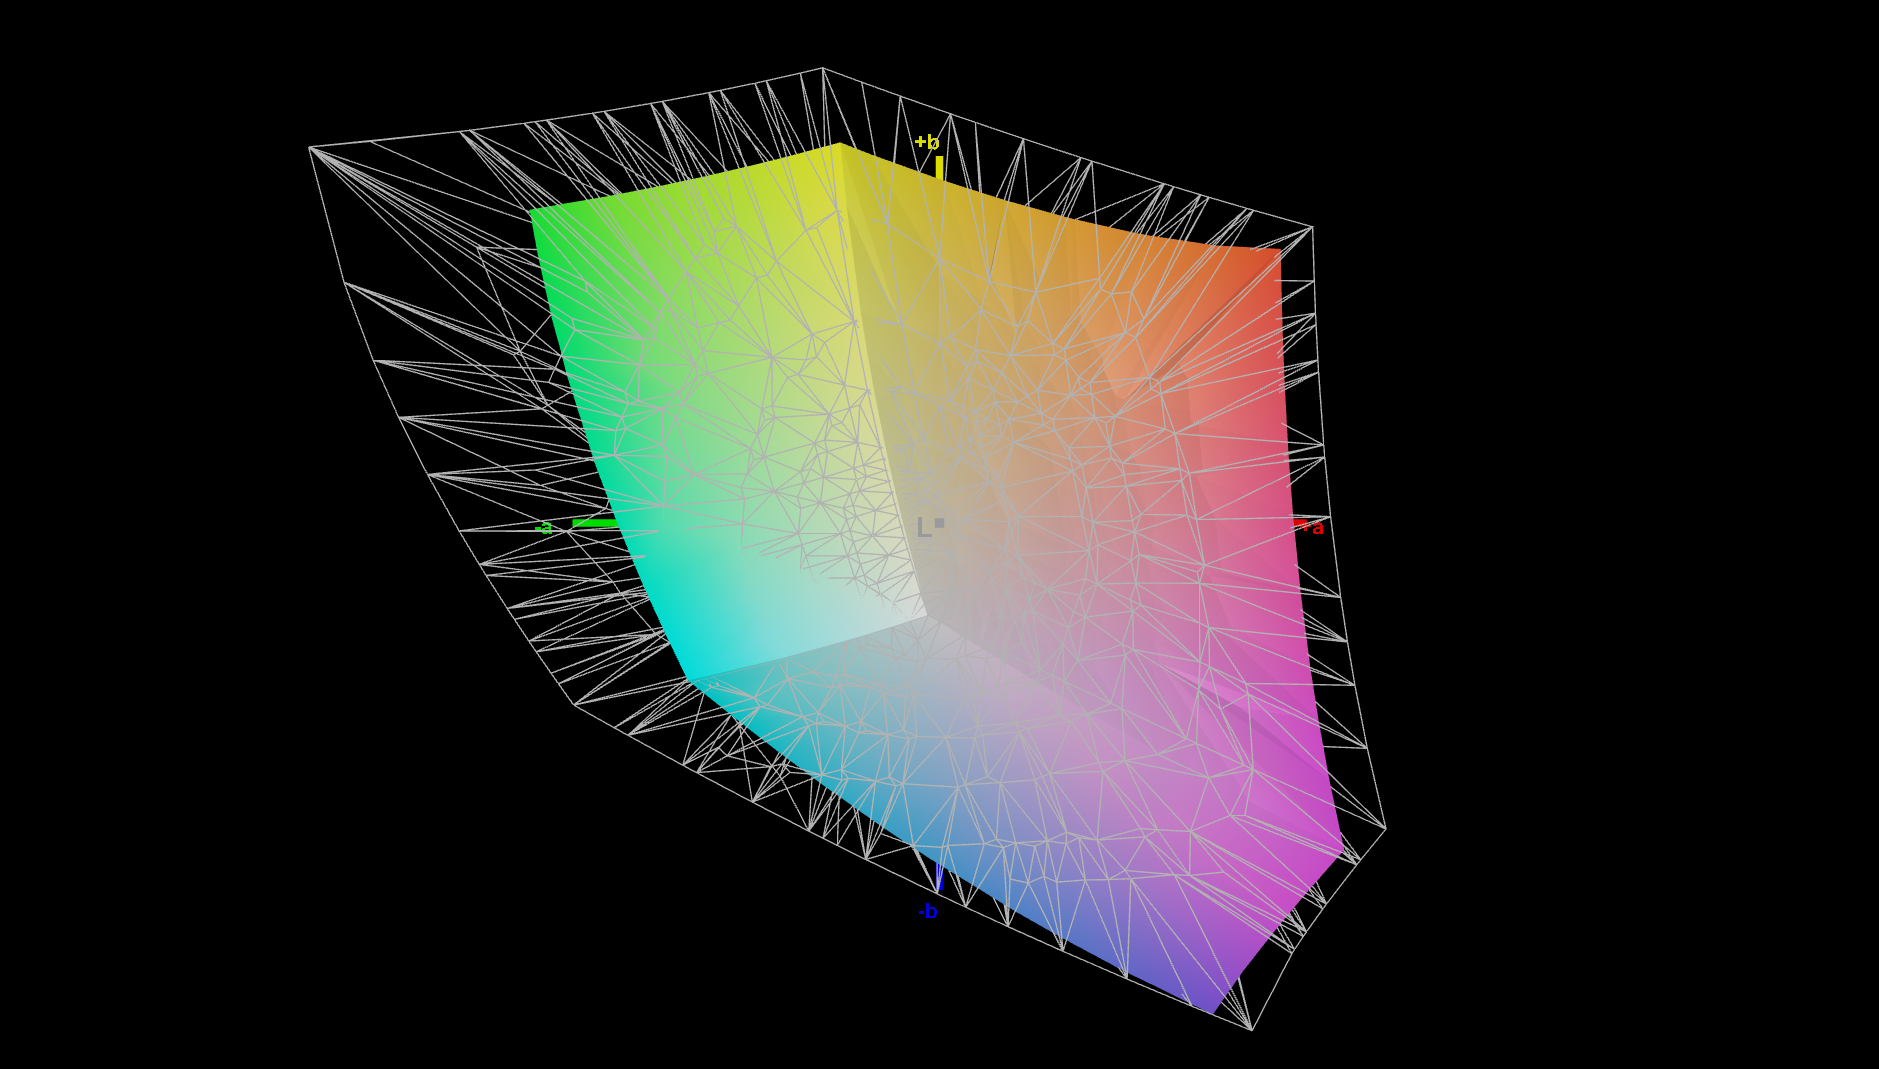
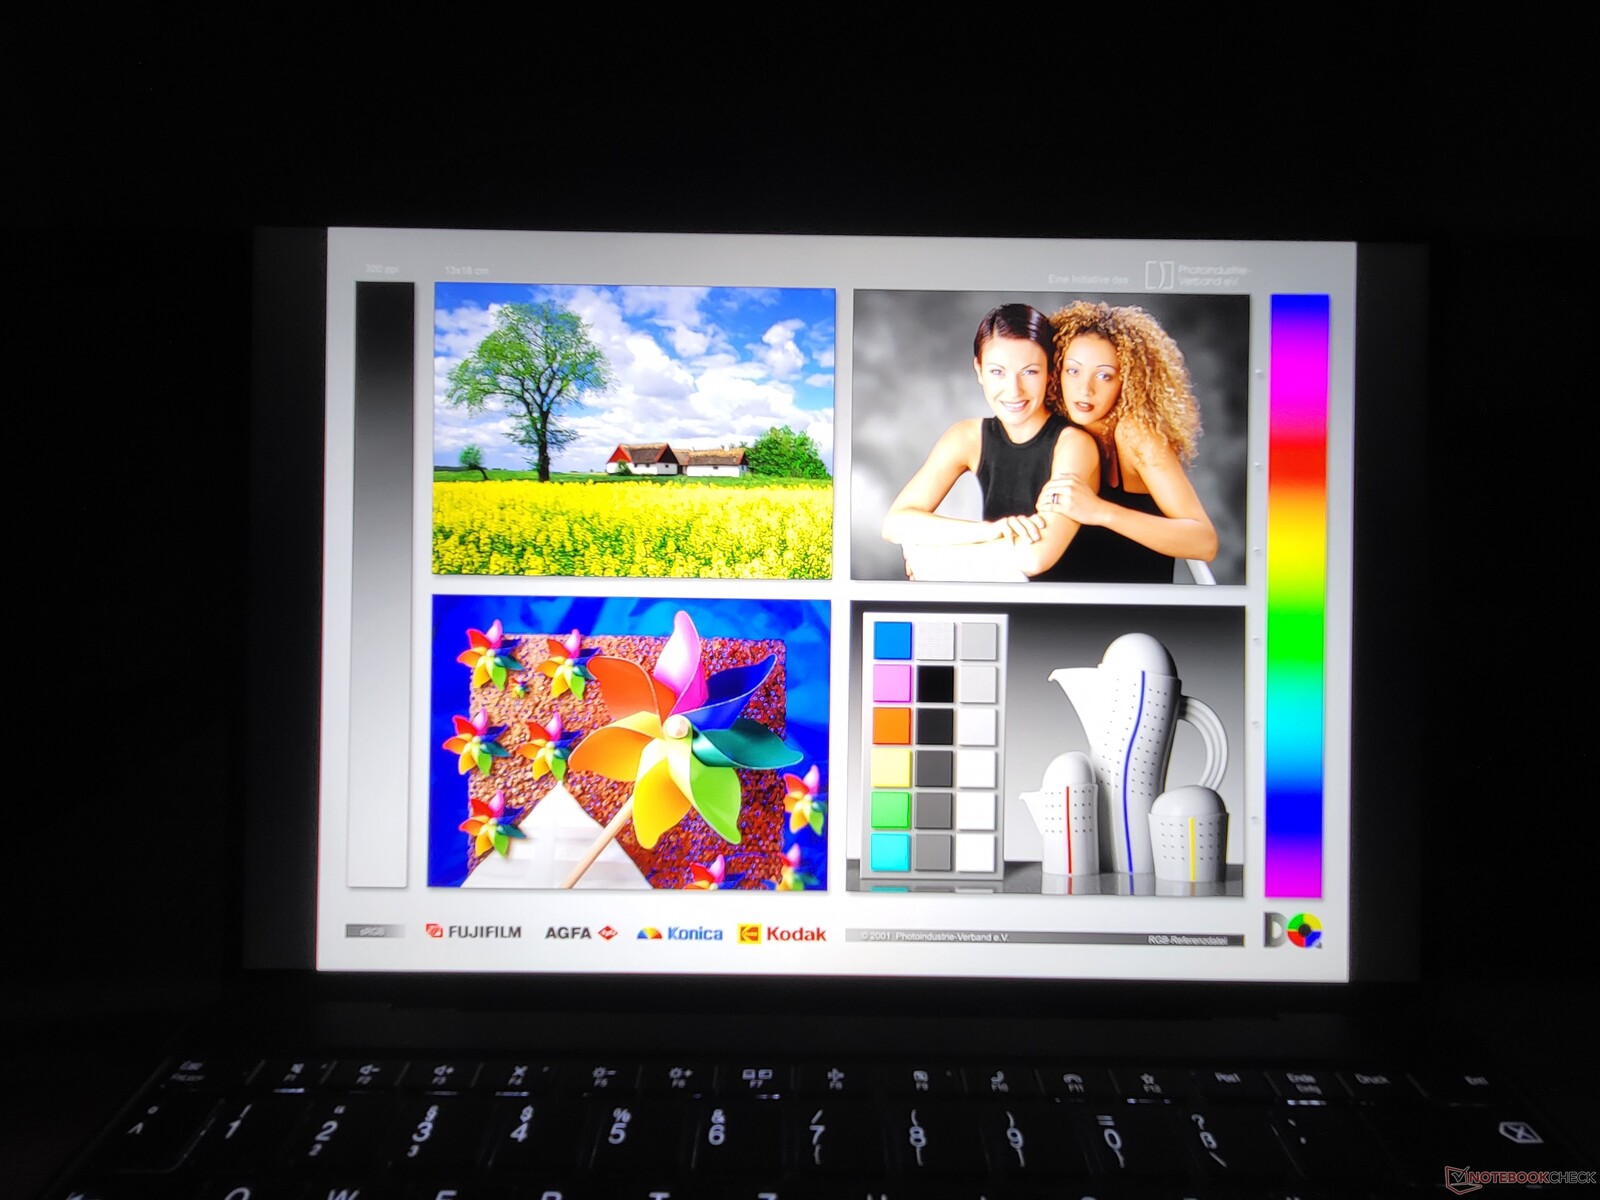
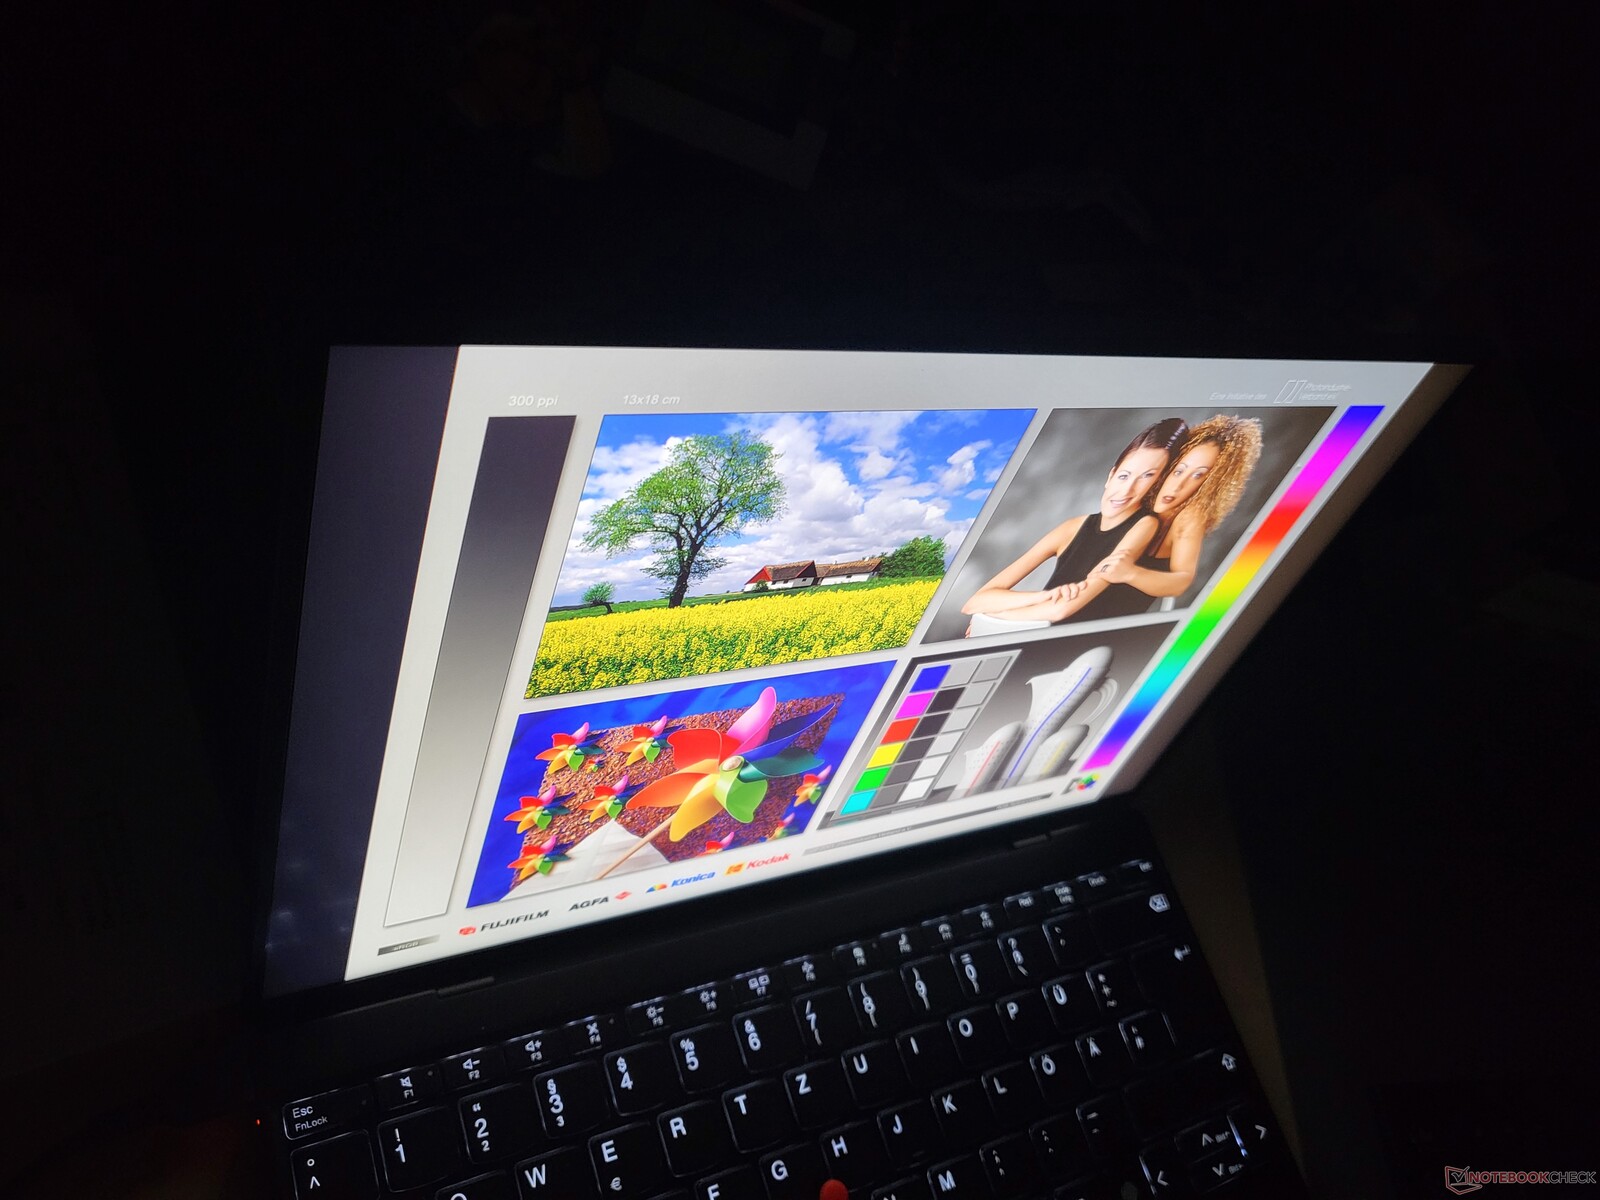
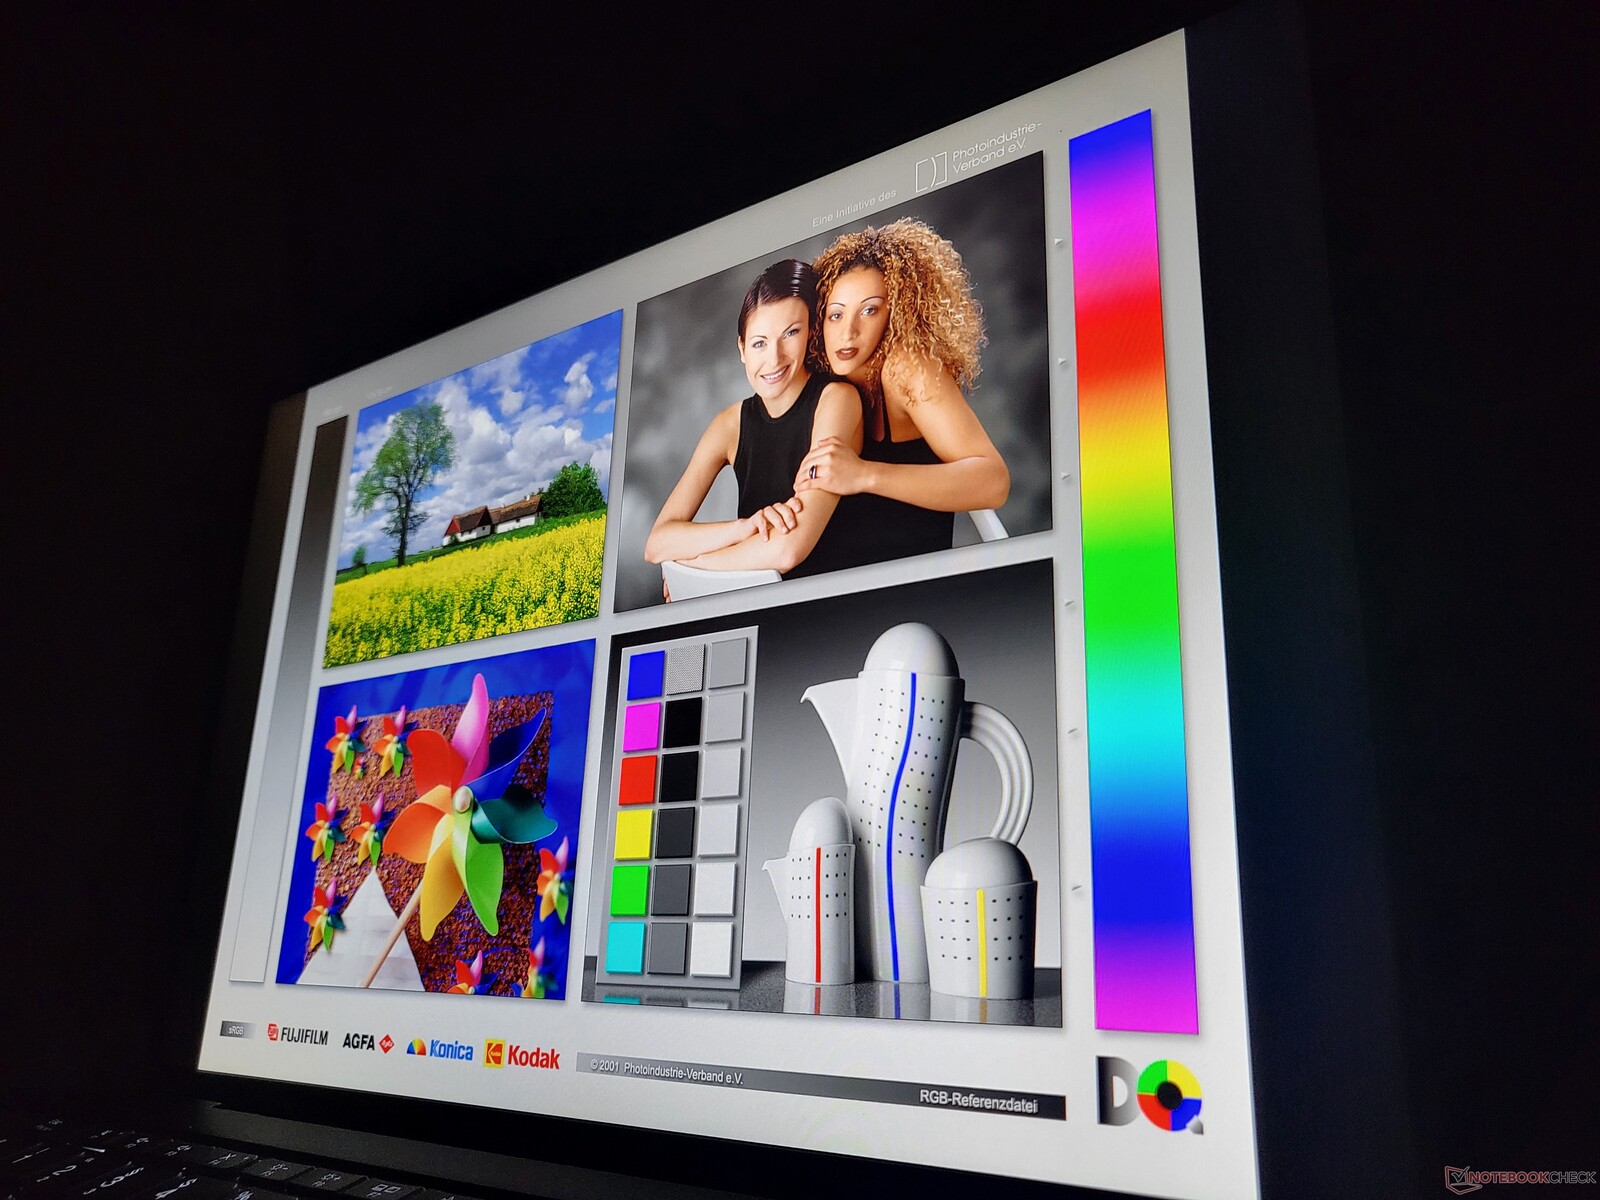
显示屏。联想笔记本电脑采用哑光全高清液晶屏
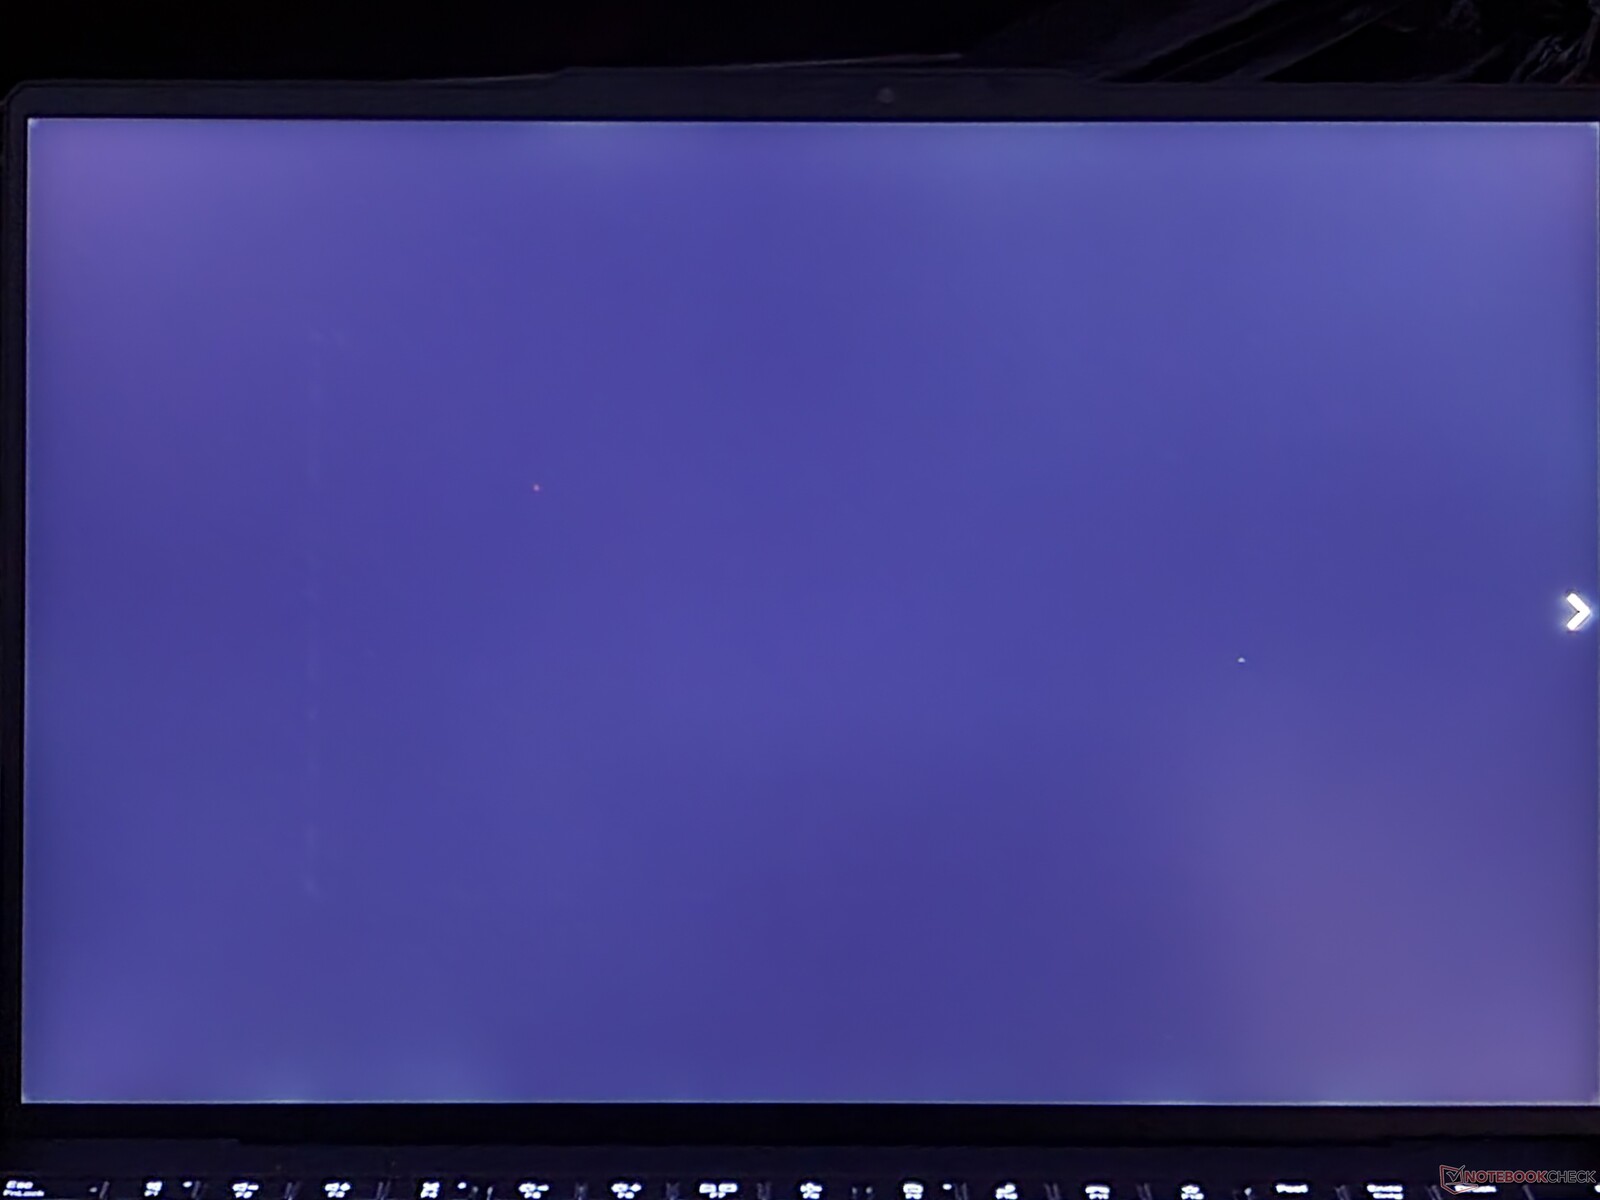
联想为ThinkPad Z13 G1总共提供了三种16:10格式的13.3英寸显示屏选择。
- WUXGA (1,920x1,200), IPS, 400 cd/m², 100% sRGB, 哑光, 低功率
- WUXGA (1,920x1,200), IPS, 400 cd/m², 100% sRGB, 有光泽的防反射涂层, 低功耗, 触摸
- 2.8K (2,880x1,800), OLED, 400 cd/m², 100% DCI-P3, 带防反射涂层的光面, 触摸
我们测得的峰值为418 cd/m²,但平均为378 cd/m²,比预定的400 cd/m²要少一点。这个数值使ThinkPad Z13低于其竞争对手,后者往往在450至500 cd/m²之间。
| |||||||||||||||||||||||||
Brightness Distribution: 81 %
Center on Battery: 418 cd/m²
Contrast: 1267:1 (Black: 0.33 cd/m²)
ΔE ColorChecker Calman: 1.7 | ∀{0.5-29.43 Ø4.71}
calibrated: 1.1
ΔE Greyscale Calman: 2.3 | ∀{0.09-98 Ø4.96}
69.7% AdobeRGB 1998 (Argyll 3D)
96.5% sRGB (Argyll 3D)
67.7% Display P3 (Argyll 3D)
Gamma: 2.14
CCT: 6499 K
| Lenovo ThinkPad Z13 21D2CTO1WW NV133WUM-N63, IPS LED, 1920x1200, 13.3" | Dell XPS 13 Plus 9320 i5-1240p Sharp SHP1548 LQ134N1, IPS, 1920x1200, 13.4" | Lenovo ThinkPad X1 Carbon G10 21CC001RGE B140UAN02.1, IPS LED, 1920x1200, 14" | Apple MacBook Air M2 Entry IPS, 2560x1664, 13.6" | Lenovo ThinkPad X1 Nano-20UN002UGE MND007ZA1-2, IPS, 2160x1350, 13" | Dell XPS 13 Plus 9320 4K LQ134R1, IPS, 3840x2400, 13.4" | |
|---|---|---|---|---|---|---|
| Display | 2% | 7% | 25% | 4% | 9% | |
| Display P3 Coverage (%) | 67.7 | 69 2% | 74.6 10% | 98.4 45% | 70.4 4% | 76.5 13% |
| sRGB Coverage (%) | 96.5 | 99 3% | 98.6 2% | 99.9 4% | 99.9 4% | 100 4% |
| AdobeRGB 1998 Coverage (%) | 69.7 | 71 2% | 76.5 10% | 87.6 26% | 72 3% | 76 9% |
| Response Times | 9% | 2% | 13% | -9% | 13% | |
| Response Time Grey 50% / Grey 80% * (ms) | 49 ? | 45 ? 8% | 45.5 ? 7% | 32.9 ? 33% | 46.8 ? 4% | 38.9 ? 21% |
| Response Time Black / White * (ms) | 23 ? | 21 ? 9% | 24 ? -4% | 24.9 ? -8% | 28 ? -22% | 21.9 ? 5% |
| PWM Frequency (Hz) | 53050 ? | |||||
| Screen | -50% | -27% | 16% | 14% | -9% | |
| Brightness middle (cd/m²) | 418 | 498 19% | 372 -11% | 526 26% | 460 10% | 494 18% |
| Brightness (cd/m²) | 379 | 460 21% | 362 -4% | 486 28% | 434 15% | 474 25% |
| Brightness Distribution (%) | 81 | 85 5% | 94 16% | 87 7% | 92 14% | 89 10% |
| Black Level * (cd/m²) | 0.33 | 0.53 -61% | 0.18 45% | 0.38 -15% | 0.27 18% | 0.28 15% |
| Contrast (:1) | 1267 | 940 -26% | 2067 63% | 1384 9% | 1704 34% | 1764 39% |
| Colorchecker dE 2000 * | 1.7 | 3.65 -115% | 3.4 -100% | 1.3 24% | 1.1 35% | 3.1 -82% |
| Colorchecker dE 2000 max. * | 3.3 | 7.11 -115% | 6.7 -103% | 2.7 18% | 4.5 -36% | 4.2 -27% |
| Colorchecker dE 2000 calibrated * | 1.1 | 2.16 -96% | 1.8 -64% | 0.7 36% | 1 9% | 1.5 -36% |
| Greyscale dE 2000 * | 2.3 | 4.25 -85% | 4.3 -87% | 2 13% | 1.6 30% | 3.2 -39% |
| Gamma | 2.14 103% | 2.45 90% | 2.13 103% | 2.25 98% | 2.2 100% | 2.41 91% |
| CCT | 6499 100% | 6690 97% | 6158 106% | 6858 95% | 6475 100% | 6189 105% |
| Color Space (Percent of AdobeRGB 1998) (%) | 65.7 | |||||
| Color Space (Percent of sRGB) (%) | 99.9 | |||||
| Total Average (Program / Settings) | -13% /
-31% | -6% /
-16% | 18% /
18% | 3% /
9% | 4% /
-2% |
* ... smaller is better
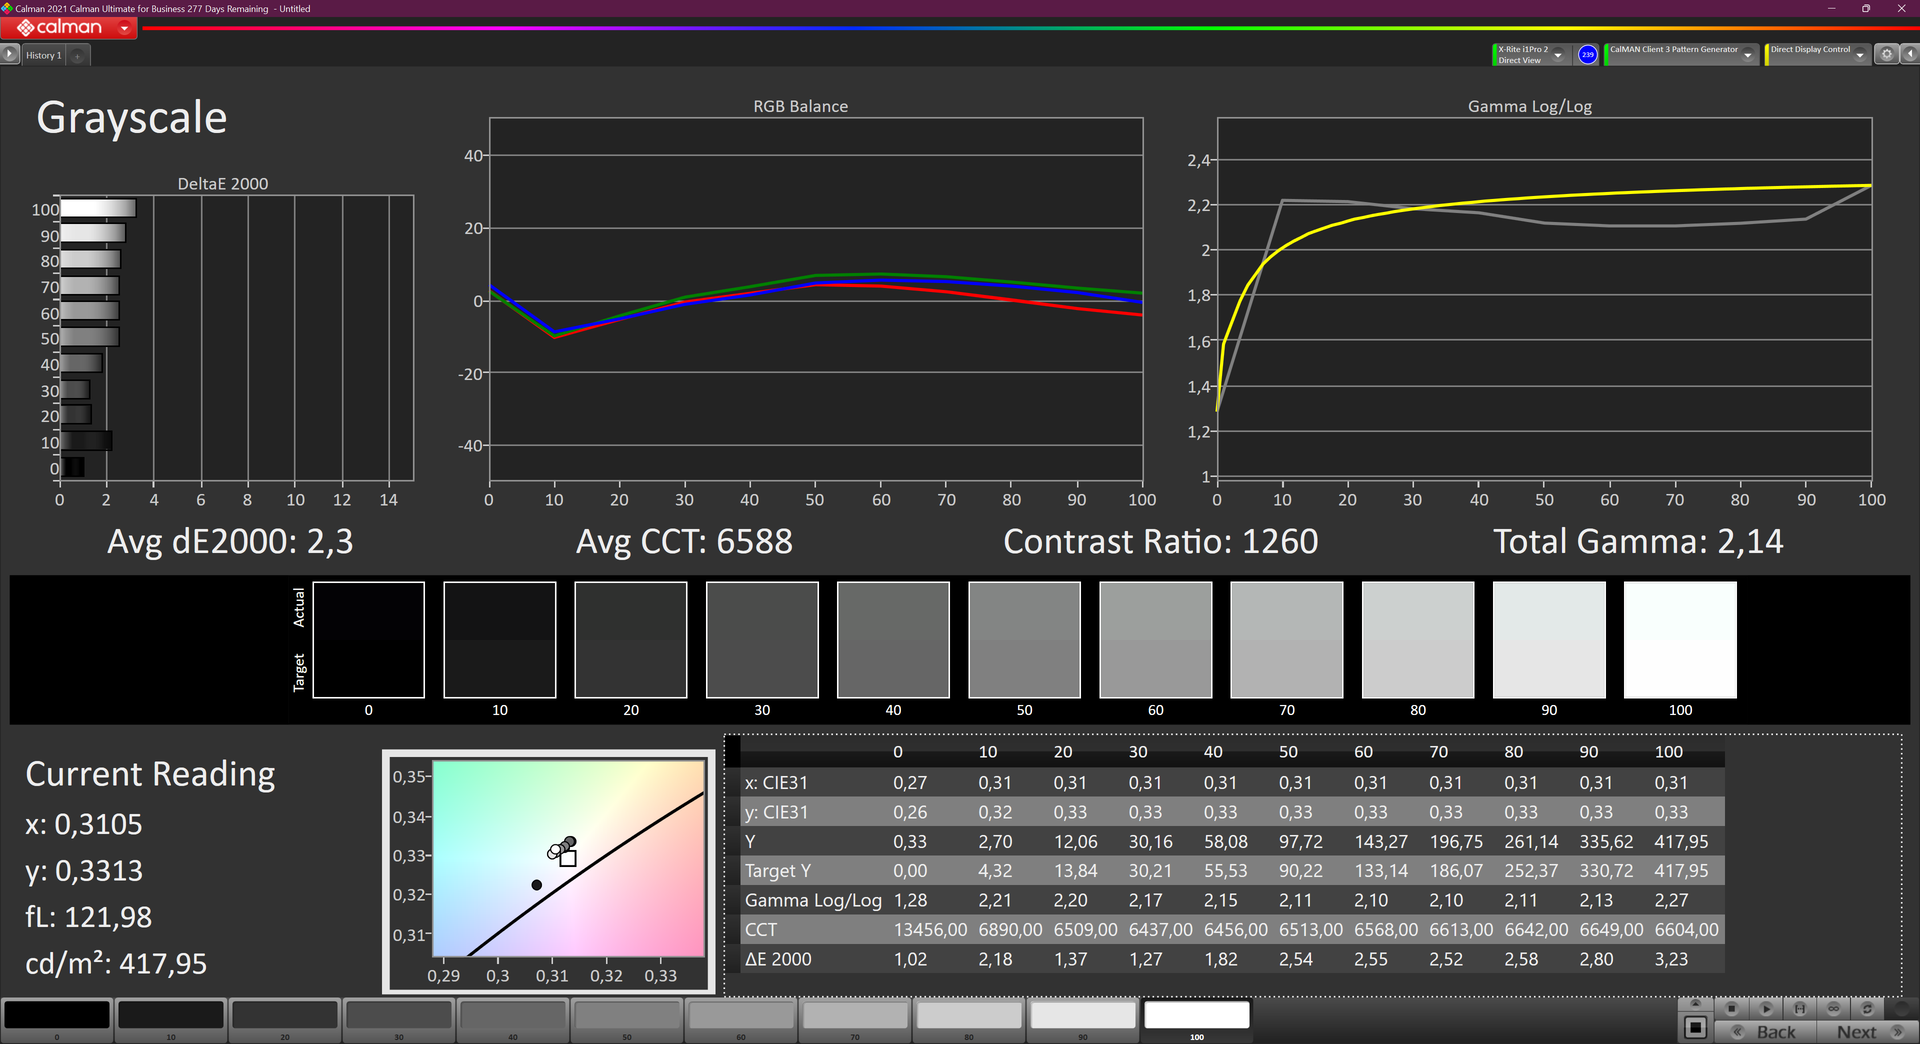
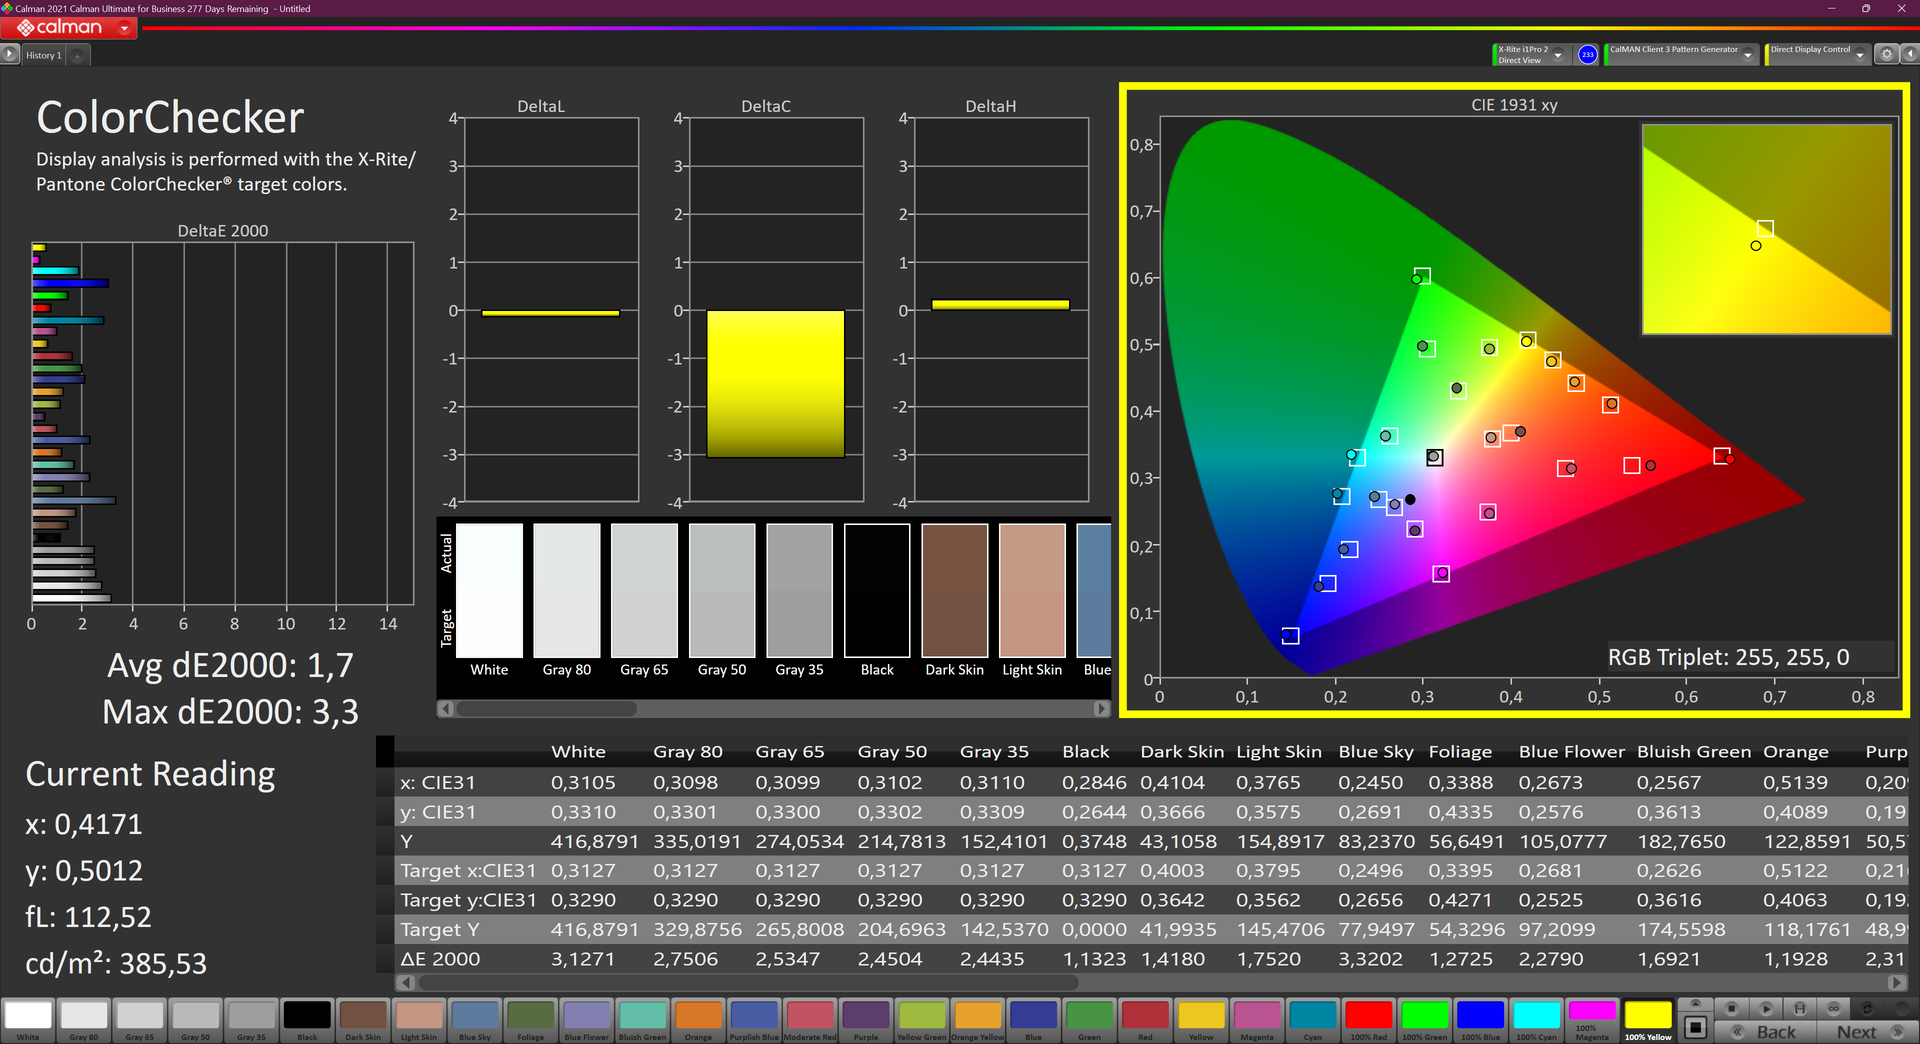
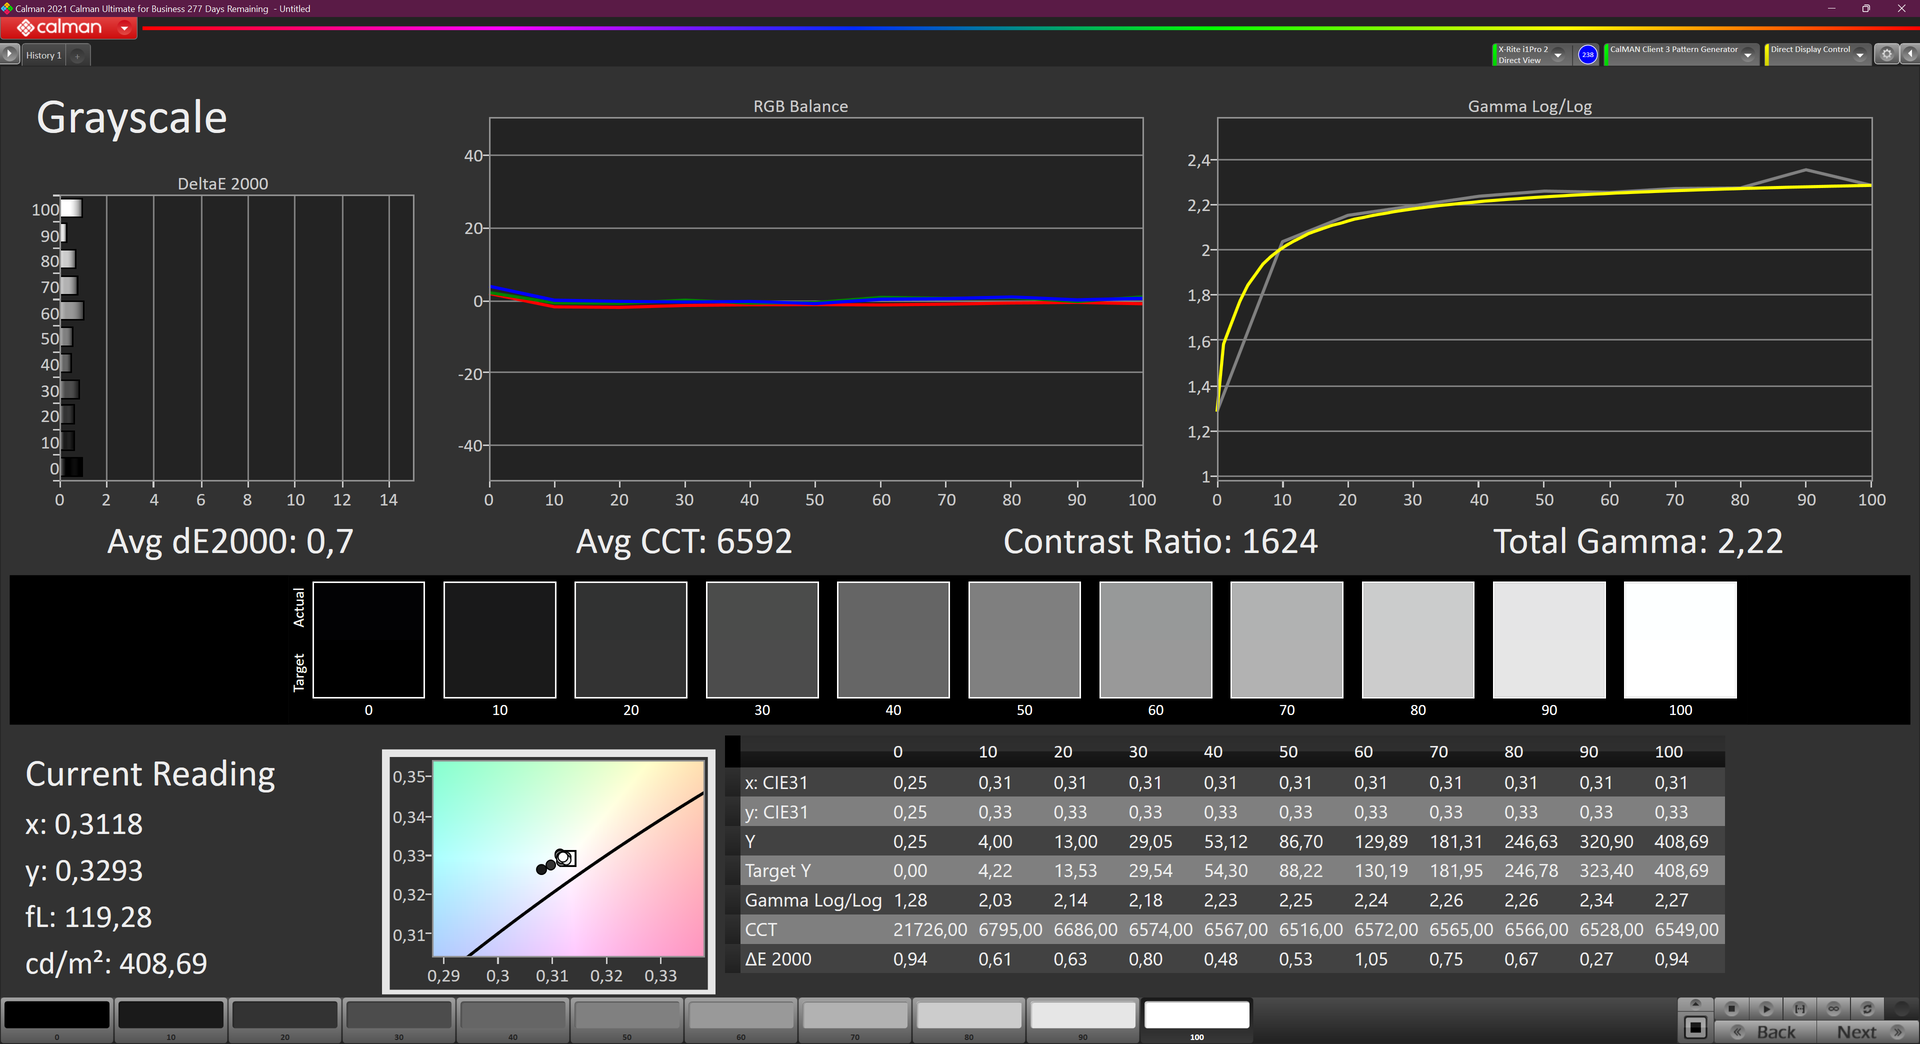
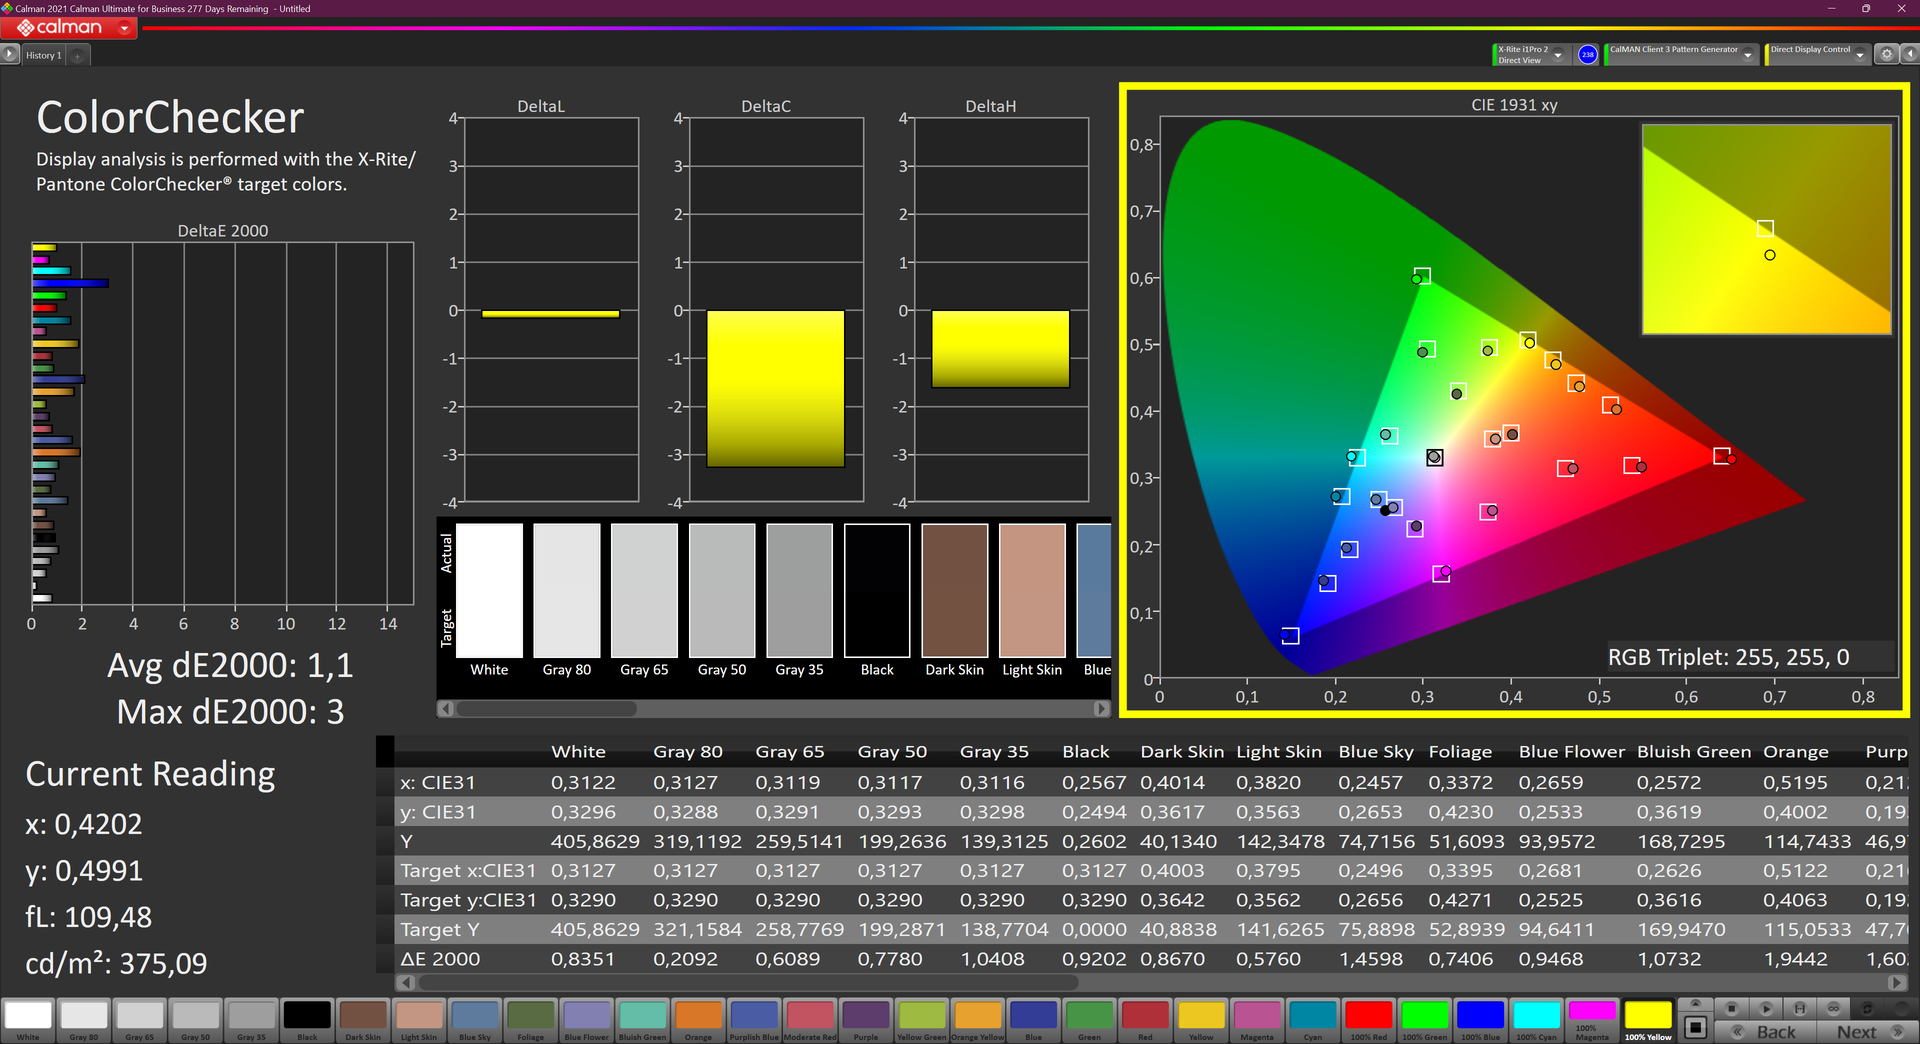
开箱后,与理想值的偏差并不大,这一点从Delta E Colorchecker的值1.7中可以看出。我们用CalMan和i1Pro 2色度计对显示器进行了测试,我们还将其与i1Profiler一起用于校准。结果,Delta E值降低到1.1 - 像往常一样,相应的色彩配置文件可以免费下载。
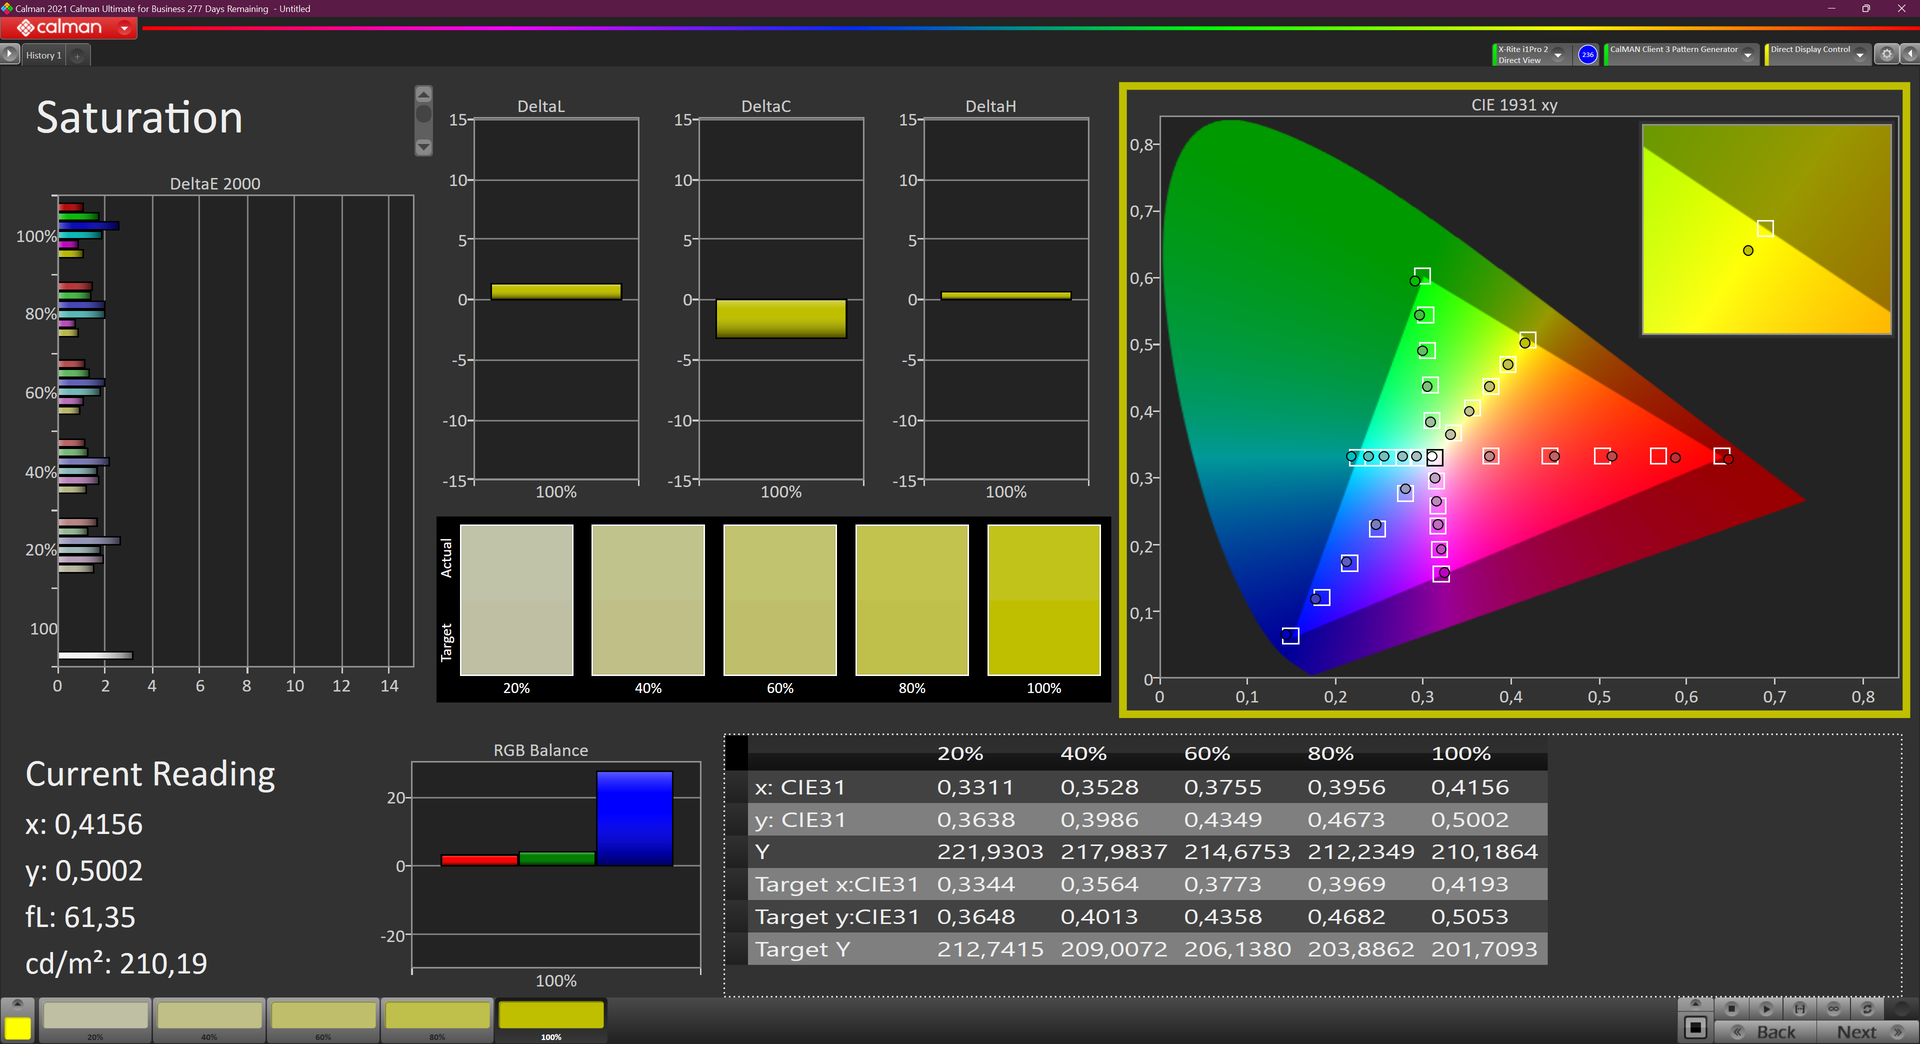
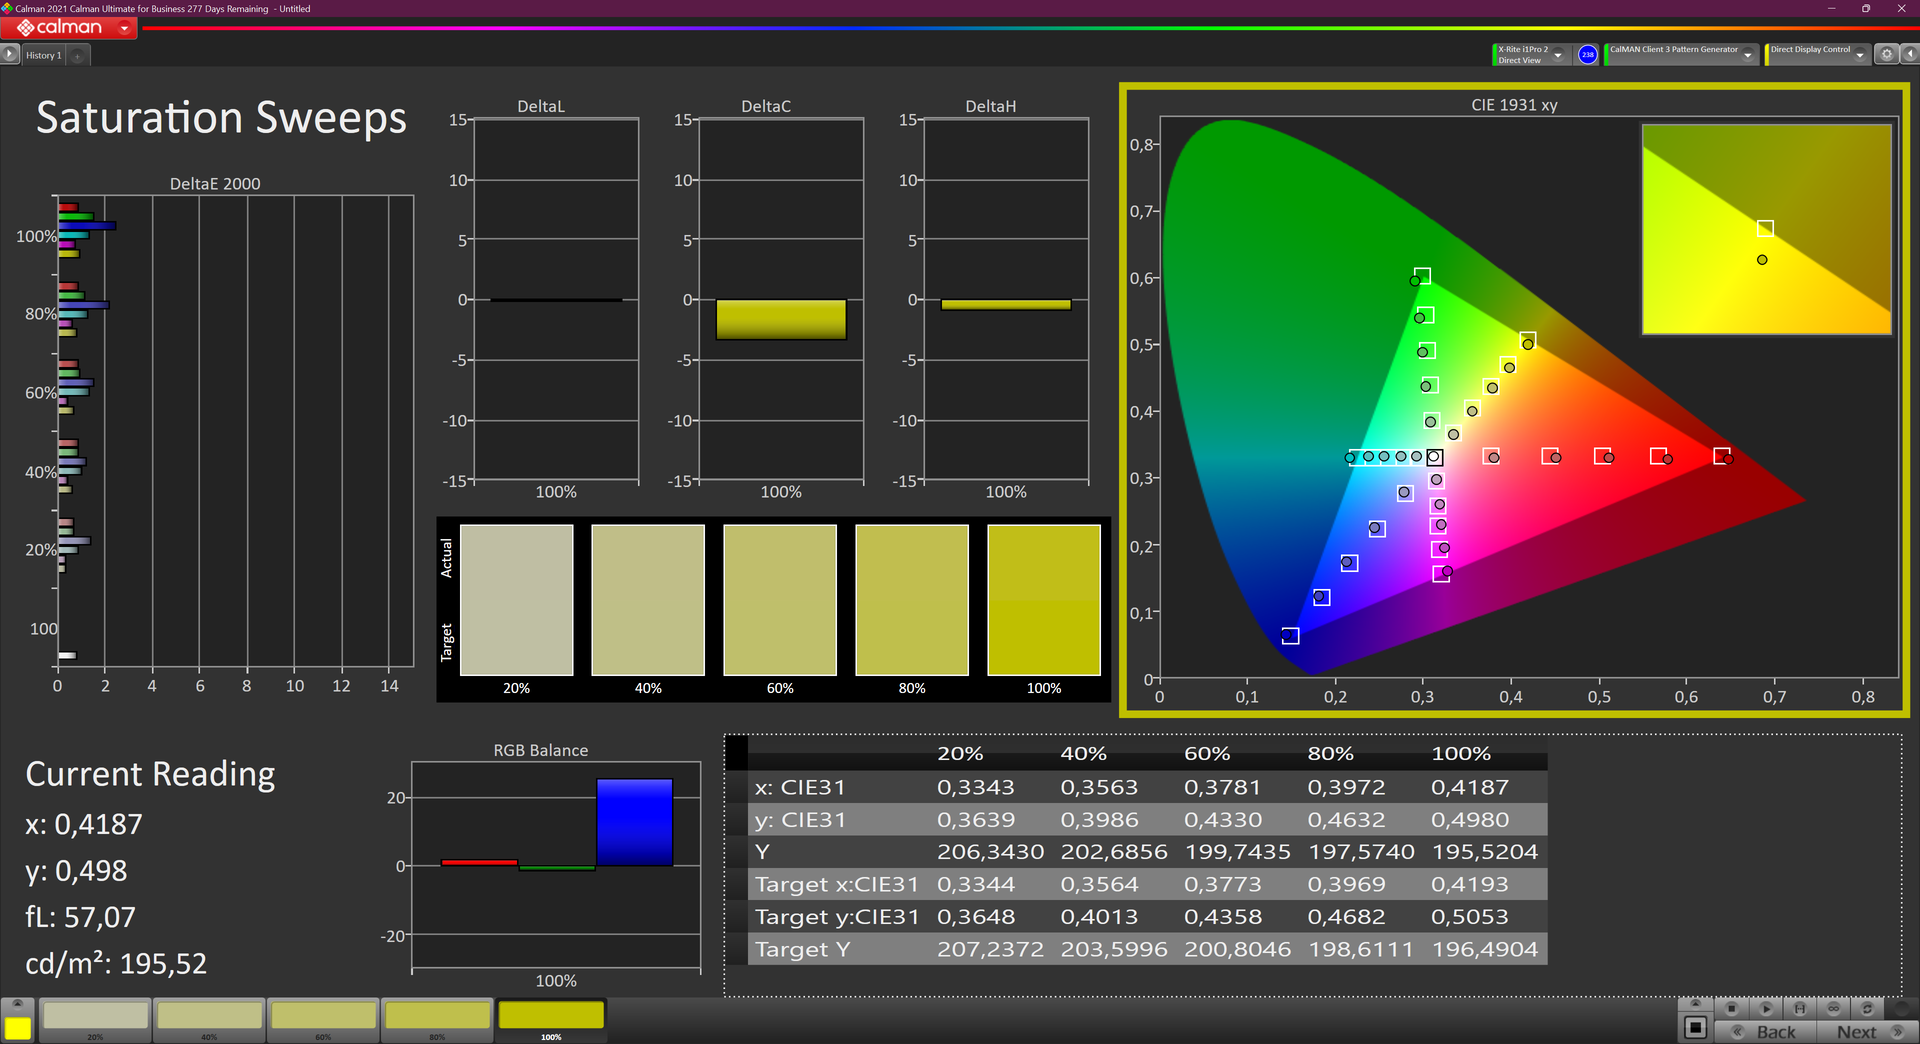
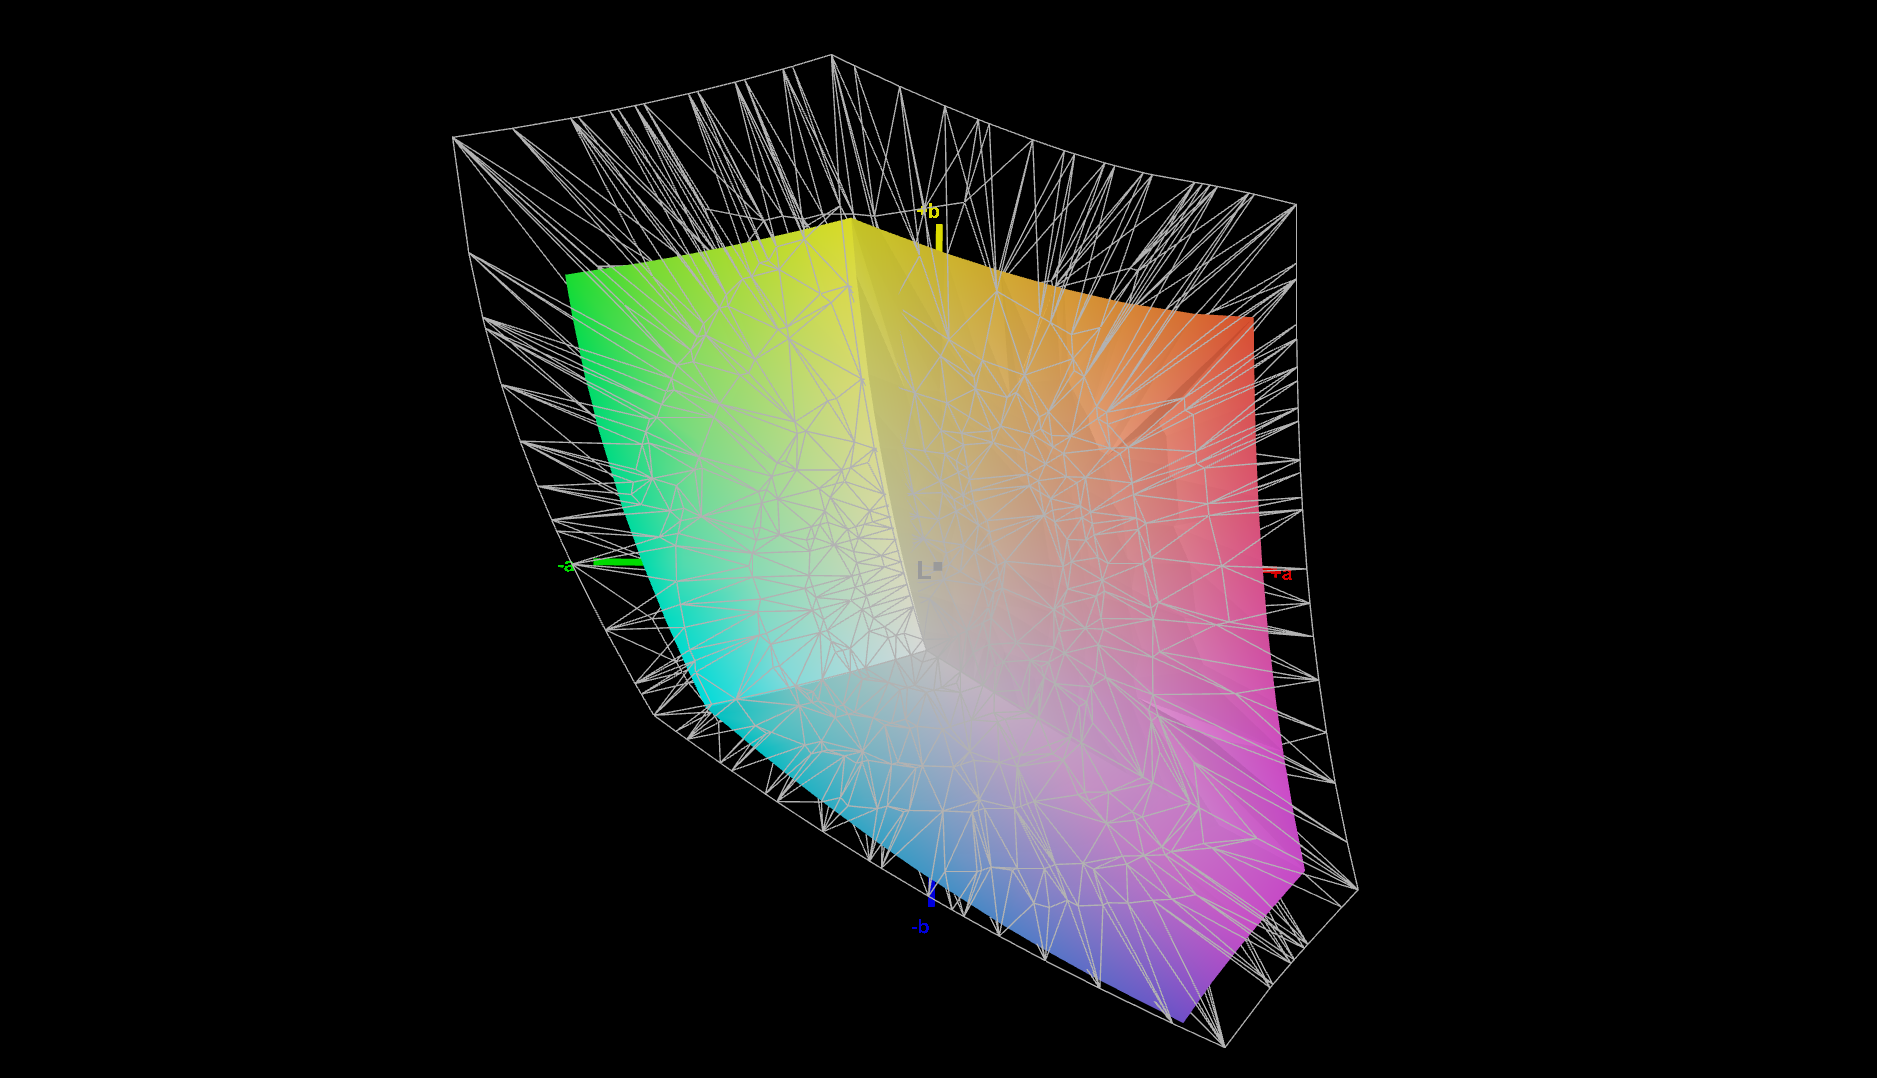
色彩空间值还可以,但在P3和AdobeRGB色彩空间方面,仍有很大的改进余地。但至少小的sRGB空间几乎完全覆盖了96.5%,这样Z13就可以用于简单的图像编辑。
非触摸式全高清显示屏的哑光表面显然有利于ThinkPad Z13的户外使用。然而,更高的显示屏亮度将进一步提高户外适用性。
Display Response Times
| ↔ Response Time Black to White | ||
|---|---|---|
| 23 ms ... rise ↗ and fall ↘ combined | ↗ 11 ms rise | 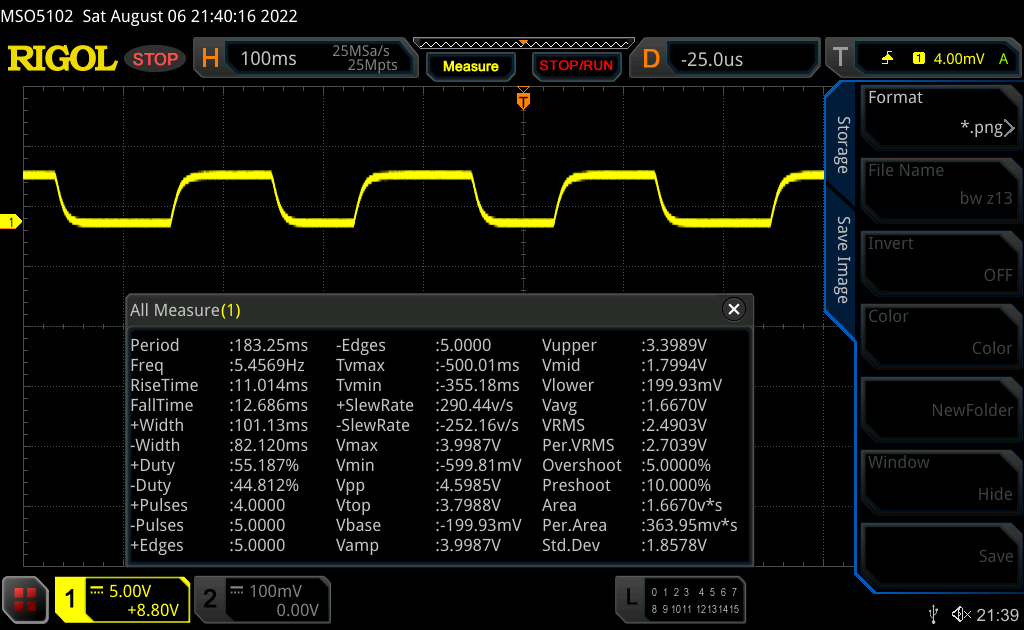 |
| ↘ 12 ms fall | ||
| The screen shows good response rates in our tests, but may be too slow for competitive gamers. In comparison, all tested devices range from 0.1 (minimum) to 240 (maximum) ms. » 52 % of all devices are better. This means that the measured response time is worse than the average of all tested devices (19.8 ms). | ||
| ↔ Response Time 50% Grey to 80% Grey | ||
| 49 ms ... rise ↗ and fall ↘ combined | ↗ 22 ms rise | 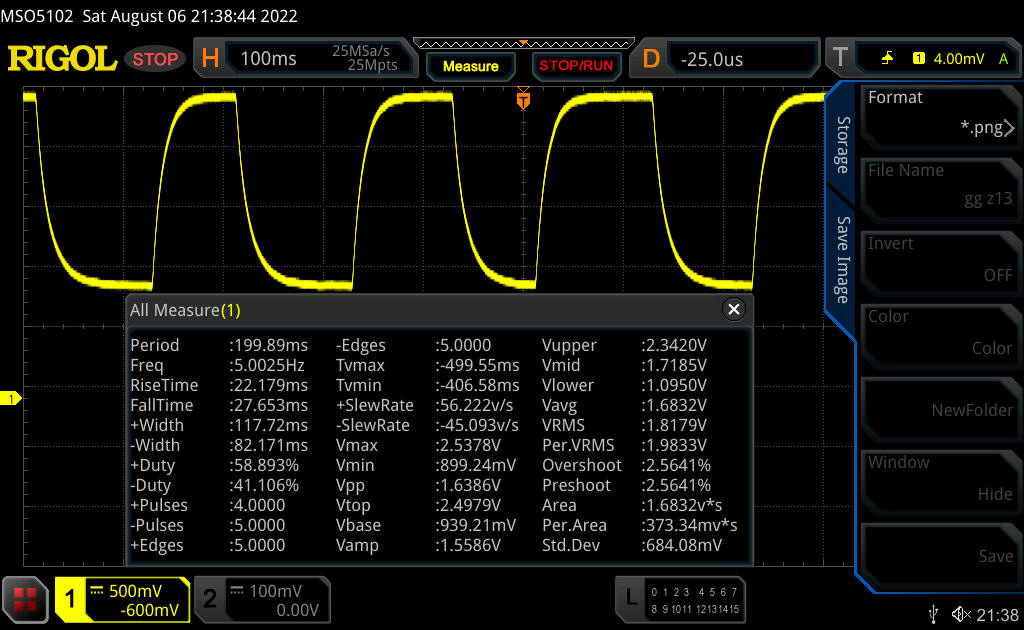 |
| ↘ 27 ms fall | ||
| The screen shows slow response rates in our tests and will be unsatisfactory for gamers. In comparison, all tested devices range from 0.165 (minimum) to 636 (maximum) ms. » 85 % of all devices are better. This means that the measured response time is worse than the average of all tested devices (31 ms). | ||
Screen Flickering / PWM (Pulse-Width Modulation)
| Screen flickering / PWM not detected | 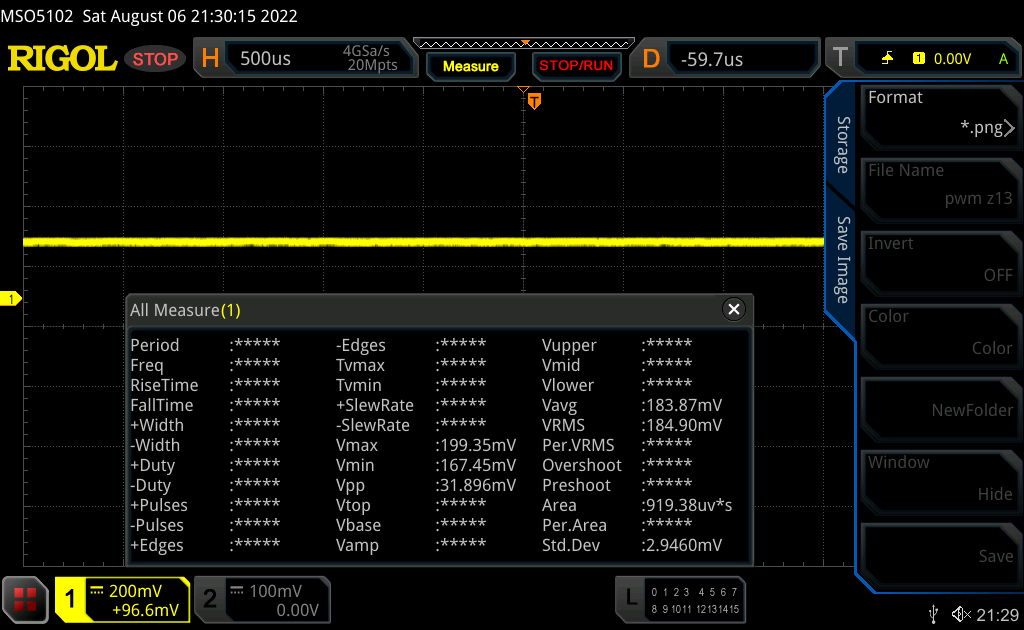 | ||
In comparison: 52 % of all tested devices do not use PWM to dim the display. If PWM was detected, an average of 7754 (minimum: 5 - maximum: 343500) Hz was measured. | |||
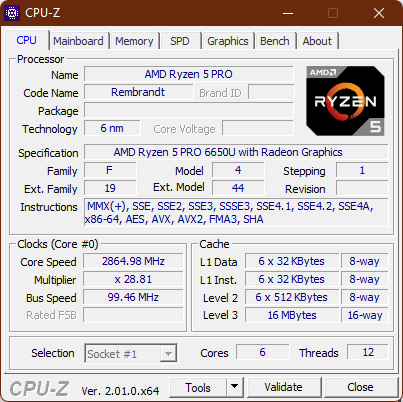
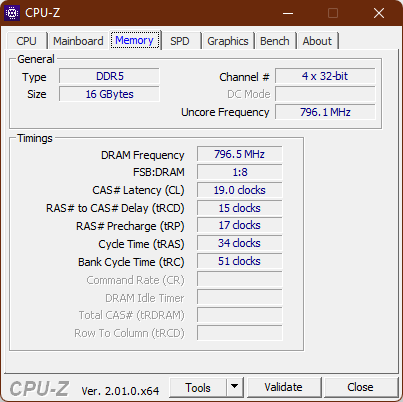
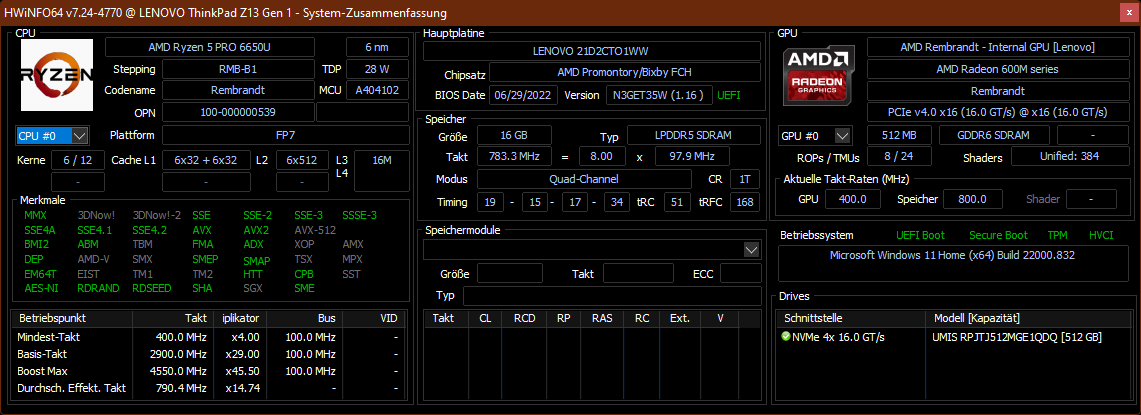
性能。AMD Ryzen 6000U在效率方面击败英特尔
联想ThinkPad Z13有三种不同的CPU可用,都属于Ryzen Pro系列。属于AMD Ryzen 5 Pro 6650U,以及AMD Ryzen 7 Pro 6850U以及AMD Ryzen 7 Pro 6860Z,这是AMD专门为Z13开发的一个特殊型号。没有专用的GPU,所以买家只能选择AMD Radeon 660M(在Ryzen 5中)和Radeon 680M(在Ryzen 7中)。内存是焊接的,而且是快速的LPDDR5-6400类型,Z13有16或32GB的内存。M.2 2242固态硬盘的最大容量为一兆字节。
测试条件
和联想ThinkPads的一贯做法一样,我们使用Windows电源管理功能来选择性能模式。我们的性能测试都是使用最高性能模式进行的,我们通过FN+T组合键禁用了联想的 "自动 "模式。结果,短期负载的功率上限约为55瓦,而长期负载的功率上限仍为22.5瓦左右。
处理器
淘宝网AMD Ryzen 5 Pro 6650U是属于当前Ryzen 6000一代的中端处理器。作为一个U型处理器,其六个核心的典型消耗为15瓦,最大时钟速率为4.5千兆赫(基础时钟速率:2.9千兆赫)。我们的CPU基准测试文章可以参考我们的CPU基准测试文章,与其他处理器进行更广泛的比较。
联想ThinkPad Z13在CPU基准测试中得分很高。它的CPU性能优于许多英特尔竞争对手,也优于Apple MacBook Air M2,尽管这只是Z13的入门版本。虽然在持续的负载下,性能有点下降,但它仍然比大得多的Z13的CPU性能好。联想ThinkPad X1 Carbon G10在任何时候都更好。
即使在电池供电的情况下,CPU的性能也是完全可用的。
Cinebench R15 Multi endurance test
Cinebench R23: Multi Core | Single Core
Cinebench R20: CPU (Multi Core) | CPU (Single Core)
Cinebench R15: CPU Multi 64Bit | CPU Single 64Bit
Blender: v2.79 BMW27 CPU
7-Zip 18.03: 7z b 4 | 7z b 4 -mmt1
Geekbench 5.5: Multi-Core | Single-Core
HWBOT x265 Benchmark v2.2: 4k Preset
LibreOffice : 20 Documents To PDF
R Benchmark 2.5: Overall mean
| CPU Performance rating | |
| Average of class Subnotebook | |
| Dell XPS 13 Plus 9320 4K | |
| Asus Zenbook S 13 OLED | |
| Average AMD Ryzen 5 PRO 6650U | |
| Lenovo ThinkPad Z13 21D2CTO1WW | |
| Apple MacBook Air M2 Entry -5! | |
| Lenovo ThinkPad X1 Carbon G10 21CC001RGE | |
| Lenovo ThinkPad X1 Nano-20UN002UGE -1! | |
| Cinebench R23 / Multi Core | |
| Average of class Subnotebook (1555 - 21812, n=59, last 2 years) | |
| Asus Zenbook S 13 OLED | |
| Dell XPS 13 Plus 9320 4K | |
| Lenovo ThinkPad Z13 21D2CTO1WW | |
| Average AMD Ryzen 5 PRO 6650U (7805 - 9534, n=4) | |
| Apple MacBook Air M2 Entry | |
| Lenovo ThinkPad X1 Carbon G10 21CC001RGE | |
| Lenovo ThinkPad X1 Nano-20UN002UGE | |
| Cinebench R23 / Single Core | |
| Average of class Subnotebook (358 - 2213, n=60, last 2 years) | |
| Dell XPS 13 Plus 9320 4K | |
| Apple MacBook Air M2 Entry | |
| Lenovo ThinkPad X1 Carbon G10 21CC001RGE | |
| Asus Zenbook S 13 OLED | |
| Average AMD Ryzen 5 PRO 6650U (1439 - 1476, n=4) | |
| Lenovo ThinkPad Z13 21D2CTO1WW | |
| Cinebench R20 / CPU (Multi Core) | |
| Average of class Subnotebook (579 - 8541, n=56, last 2 years) | |
| Asus Zenbook S 13 OLED | |
| Dell XPS 13 Plus 9320 4K | |
| Lenovo ThinkPad Z13 21D2CTO1WW | |
| Average AMD Ryzen 5 PRO 6650U (3057 - 3684, n=4) | |
| Lenovo ThinkPad X1 Carbon G10 21CC001RGE | |
| Apple MacBook Air M2 Entry | |
| Lenovo ThinkPad X1 Nano-20UN002UGE | |
| Cinebench R20 / CPU (Single Core) | |
| Average of class Subnotebook (128 - 832, n=56, last 2 years) | |
| Dell XPS 13 Plus 9320 4K | |
| Average AMD Ryzen 5 PRO 6650U (548 - 578, n=4) | |
| Lenovo ThinkPad Z13 21D2CTO1WW | |
| Asus Zenbook S 13 OLED | |
| Lenovo ThinkPad X1 Nano-20UN002UGE | |
| Lenovo ThinkPad X1 Carbon G10 21CC001RGE | |
| Apple MacBook Air M2 Entry | |
| Cinebench R15 / CPU Multi 64Bit | |
| Average of class Subnotebook (327 - 3345, n=56, last 2 years) | |
| Asus Zenbook S 13 OLED | |
| Dell XPS 13 Plus 9320 4K | |
| Dell XPS 13 Plus 9320 4K | |
| Lenovo ThinkPad Z13 21D2CTO1WW | |
| Lenovo ThinkPad X1 Carbon G10 21CC001RGE | |
| Average AMD Ryzen 5 PRO 6650U (1299 - 1555, n=4) | |
| Apple MacBook Air M2 Entry | |
| Lenovo ThinkPad X1 Nano-20UN002UGE | |
| Cinebench R15 / CPU Single 64Bit | |
| Average of class Subnotebook (72.4 - 322, n=56, last 2 years) | |
| Dell XPS 13 Plus 9320 4K | |
| Asus Zenbook S 13 OLED | |
| Lenovo ThinkPad Z13 21D2CTO1WW | |
| Average AMD Ryzen 5 PRO 6650U (230 - 234, n=4) | |
| Apple MacBook Air M2 Entry | |
| Lenovo ThinkPad X1 Nano-20UN002UGE | |
| Lenovo ThinkPad X1 Carbon G10 21CC001RGE | |
| Blender / v2.79 BMW27 CPU | |
| Apple MacBook Air M2 Entry | |
| Lenovo ThinkPad X1 Nano-20UN002UGE | |
| Lenovo ThinkPad X1 Carbon G10 21CC001RGE | |
| Lenovo ThinkPad Z13 21D2CTO1WW | |
| Average AMD Ryzen 5 PRO 6650U (328 - 548, n=5) | |
| Average of class Subnotebook (159 - 2271, n=57, last 2 years) | |
| Dell XPS 13 Plus 9320 4K | |
| Asus Zenbook S 13 OLED | |
| 7-Zip 18.03 / 7z b 4 | |
| Asus Zenbook S 13 OLED | |
| Average of class Subnotebook (11668 - 77867, n=56, last 2 years) | |
| Dell XPS 13 Plus 9320 4K | |
| Average AMD Ryzen 5 PRO 6650U (32613 - 41530, n=4) | |
| Lenovo ThinkPad Z13 21D2CTO1WW | |
| Lenovo ThinkPad X1 Carbon G10 21CC001RGE | |
| Lenovo ThinkPad X1 Nano-20UN002UGE | |
| 7-Zip 18.03 / 7z b 4 -mmt1 | |
| Average of class Subnotebook (2643 - 6699, n=58, last 2 years) | |
| Asus Zenbook S 13 OLED | |
| Dell XPS 13 Plus 9320 4K | |
| Average AMD Ryzen 5 PRO 6650U (5175 - 5427, n=4) | |
| Lenovo ThinkPad Z13 21D2CTO1WW | |
| Lenovo ThinkPad X1 Nano-20UN002UGE | |
| Lenovo ThinkPad X1 Carbon G10 21CC001RGE | |
| Geekbench 5.5 / Multi-Core | |
| Average of class Subnotebook (2557 - 17218, n=48, last 2 years) | |
| Dell XPS 13 Plus 9320 4K | |
| Apple MacBook Air M2 Entry | |
| Lenovo ThinkPad X1 Carbon G10 21CC001RGE | |
| Asus Zenbook S 13 OLED | |
| Lenovo ThinkPad Z13 21D2CTO1WW | |
| Average AMD Ryzen 5 PRO 6650U (6171 - 7227, n=4) | |
| Lenovo ThinkPad X1 Nano-20UN002UGE | |
| Geekbench 5.5 / Single-Core | |
| Average of class Subnotebook (726 - 2224, n=48, last 2 years) | |
| Apple MacBook Air M2 Entry | |
| Dell XPS 13 Plus 9320 4K | |
| Lenovo ThinkPad X1 Carbon G10 21CC001RGE | |
| Asus Zenbook S 13 OLED | |
| Lenovo ThinkPad Z13 21D2CTO1WW | |
| Average AMD Ryzen 5 PRO 6650U (1433 - 1487, n=4) | |
| Lenovo ThinkPad X1 Nano-20UN002UGE | |
| HWBOT x265 Benchmark v2.2 / 4k Preset | |
| Average of class Subnotebook (0.97 - 25.1, n=56, last 2 years) | |
| Asus Zenbook S 13 OLED | |
| Dell XPS 13 Plus 9320 4K | |
| Average AMD Ryzen 5 PRO 6650U (8.71 - 11.8, n=4) | |
| Lenovo ThinkPad Z13 21D2CTO1WW | |
| Lenovo ThinkPad X1 Carbon G10 21CC001RGE | |
| Lenovo ThinkPad X1 Nano-20UN002UGE | |
| LibreOffice / 20 Documents To PDF | |
| Average AMD Ryzen 5 PRO 6650U (50.3 - 63.2, n=4) | |
| Lenovo ThinkPad Z13 21D2CTO1WW | |
| Average of class Subnotebook (39.9 - 220, n=55, last 2 years) | |
| Asus Zenbook S 13 OLED | |
| Lenovo ThinkPad X1 Carbon G10 21CC001RGE | |
| Lenovo ThinkPad X1 Nano-20UN002UGE | |
| Dell XPS 13 Plus 9320 4K | |
| R Benchmark 2.5 / Overall mean | |
| Lenovo ThinkPad X1 Nano-20UN002UGE | |
| Lenovo ThinkPad X1 Carbon G10 21CC001RGE | |
| Lenovo ThinkPad Z13 21D2CTO1WW | |
| Average AMD Ryzen 5 PRO 6650U (0.521 - 0.59, n=4) | |
| Asus Zenbook S 13 OLED | |
| Average of class Subnotebook (0.4024 - 1.456, n=57, last 2 years) | |
| Dell XPS 13 Plus 9320 4K | |
* ... smaller is better
AIDA64: FP32 Ray-Trace | FPU Julia | CPU SHA3 | CPU Queen | FPU SinJulia | FPU Mandel | CPU AES | CPU ZLib | FP64 Ray-Trace | CPU PhotoWorxx
| Performance rating | |
| Average of class Subnotebook | |
| Average AMD Ryzen 5 PRO 6650U | |
| Lenovo ThinkPad Z13 21D2CTO1WW | |
| Dell XPS 13 Plus 9320 4K | |
| Lenovo ThinkPad X1 Nano-20UN002UGE | |
| Lenovo ThinkPad X1 Carbon G10 21CC001RGE | |
| AIDA64 / FP32 Ray-Trace | |
| Average of class Subnotebook (1135 - 32888, n=57, last 2 years) | |
| Average AMD Ryzen 5 PRO 6650U (8854 - 10630, n=4) | |
| Lenovo ThinkPad Z13 21D2CTO1WW | |
| Lenovo ThinkPad X1 Nano-20UN002UGE | |
| Dell XPS 13 Plus 9320 4K | |
| Lenovo ThinkPad X1 Carbon G10 21CC001RGE | |
| AIDA64 / FPU Julia | |
| Average of class Subnotebook (5218 - 123315, n=57, last 2 years) | |
| Average AMD Ryzen 5 PRO 6650U (56214 - 68106, n=4) | |
| Lenovo ThinkPad Z13 21D2CTO1WW | |
| Lenovo ThinkPad X1 Nano-20UN002UGE | |
| Dell XPS 13 Plus 9320 4K | |
| Lenovo ThinkPad X1 Carbon G10 21CC001RGE | |
| AIDA64 / CPU SHA3 | |
| Average of class Subnotebook (444 - 5287, n=57, last 2 years) | |
| Lenovo ThinkPad Z13 21D2CTO1WW | |
| Average AMD Ryzen 5 PRO 6650U (1881 - 2326, n=4) | |
| Lenovo ThinkPad X1 Nano-20UN002UGE | |
| Dell XPS 13 Plus 9320 4K | |
| Lenovo ThinkPad X1 Carbon G10 21CC001RGE | |
| AIDA64 / CPU Queen | |
| Lenovo ThinkPad Z13 21D2CTO1WW | |
| Dell XPS 13 Plus 9320 4K | |
| Average AMD Ryzen 5 PRO 6650U (69023 - 78797, n=4) | |
| Lenovo ThinkPad X1 Carbon G10 21CC001RGE | |
| Average of class Subnotebook (10579 - 95002, n=48, last 2 years) | |
| Lenovo ThinkPad X1 Nano-20UN002UGE | |
| AIDA64 / FPU SinJulia | |
| Average AMD Ryzen 5 PRO 6650U (8320 - 9488, n=4) | |
| Lenovo ThinkPad Z13 21D2CTO1WW | |
| Average of class Subnotebook (744 - 18418, n=57, last 2 years) | |
| Dell XPS 13 Plus 9320 4K | |
| Lenovo ThinkPad X1 Carbon G10 21CC001RGE | |
| Lenovo ThinkPad X1 Nano-20UN002UGE | |
| AIDA64 / FPU Mandel | |
| Average AMD Ryzen 5 PRO 6650U (30969 - 37461, n=4) | |
| Lenovo ThinkPad Z13 21D2CTO1WW | |
| Average of class Subnotebook (3341 - 65433, n=57, last 2 years) | |
| Lenovo ThinkPad X1 Nano-20UN002UGE | |
| Dell XPS 13 Plus 9320 4K | |
| Lenovo ThinkPad X1 Carbon G10 21CC001RGE | |
| AIDA64 / CPU AES | |
| Lenovo ThinkPad X1 Nano-20UN002UGE | |
| Average AMD Ryzen 5 PRO 6650U (37259 - 93914, n=4) | |
| Average of class Subnotebook (638 - 96917, n=57, last 2 years) | |
| Lenovo ThinkPad Z13 21D2CTO1WW | |
| Dell XPS 13 Plus 9320 4K | |
| Lenovo ThinkPad X1 Carbon G10 21CC001RGE | |
| AIDA64 / CPU ZLib | |
| Average of class Subnotebook (164.9 - 1379, n=57, last 2 years) | |
| Dell XPS 13 Plus 9320 4K | |
| Average AMD Ryzen 5 PRO 6650U (504 - 602, n=4) | |
| Lenovo ThinkPad Z13 21D2CTO1WW | |
| Lenovo ThinkPad X1 Carbon G10 21CC001RGE | |
| Lenovo ThinkPad X1 Nano-20UN002UGE | |
| AIDA64 / FP64 Ray-Trace | |
| Average of class Subnotebook (610 - 17495, n=57, last 2 years) | |
| Average AMD Ryzen 5 PRO 6650U (4620 - 5468, n=4) | |
| Lenovo ThinkPad Z13 21D2CTO1WW | |
| Lenovo ThinkPad X1 Nano-20UN002UGE | |
| Dell XPS 13 Plus 9320 4K | |
| Lenovo ThinkPad X1 Carbon G10 21CC001RGE | |
| AIDA64 / CPU PhotoWorxx | |
| Average of class Subnotebook (6569 - 85600, n=57, last 2 years) | |
| Dell XPS 13 Plus 9320 4K | |
| Lenovo ThinkPad X1 Nano-20UN002UGE | |
| Lenovo ThinkPad X1 Carbon G10 21CC001RGE | |
| Lenovo ThinkPad Z13 21D2CTO1WW | |
| Average AMD Ryzen 5 PRO 6650U (19643 - 26137, n=4) | |
系统性能
说到联想ThinkPad Z13的系统性能,我们几乎找不到任何可以抱怨的地方。它在日常使用和基准测试中表现良好。只有在复制数据时,它偶尔会多花点时间。
CrossMark: Overall | Productivity | Creativity | Responsiveness
| PCMark 10 / Score | |
| Average of class Subnotebook (4920 - 9939, n=45, last 2 years) | |
| Average AMD Ryzen 5 PRO 6650U, AMD Radeon 660M (5513 - 5958, n=4) | |
| Dell XPS 13 Plus 9320 4K | |
| Lenovo ThinkPad Z13 21D2CTO1WW | |
| Lenovo ThinkPad X1 Carbon G10 21CC001RGE | |
| Lenovo ThinkPad X1 Nano-20UN002UGE | |
| PCMark 10 / Essentials | |
| Average of class Subnotebook (8552 - 11646, n=45, last 2 years) | |
| Dell XPS 13 Plus 9320 4K | |
| Lenovo ThinkPad X1 Carbon G10 21CC001RGE | |
| Average AMD Ryzen 5 PRO 6650U, AMD Radeon 660M (9578 - 9982, n=4) | |
| Lenovo ThinkPad Z13 21D2CTO1WW | |
| Lenovo ThinkPad X1 Nano-20UN002UGE | |
| PCMark 10 / Productivity | |
| Average of class Subnotebook (5435 - 16606, n=45, last 2 years) | |
| Average AMD Ryzen 5 PRO 6650U, AMD Radeon 660M (7848 - 9094, n=4) | |
| Lenovo ThinkPad Z13 21D2CTO1WW | |
| Dell XPS 13 Plus 9320 4K | |
| Lenovo ThinkPad X1 Carbon G10 21CC001RGE | |
| Lenovo ThinkPad X1 Nano-20UN002UGE | |
| PCMark 10 / Digital Content Creation | |
| Average of class Subnotebook (5722 - 13779, n=45, last 2 years) | |
| Dell XPS 13 Plus 9320 4K | |
| Average AMD Ryzen 5 PRO 6650U, AMD Radeon 660M (5837 - 6447, n=4) | |
| Lenovo ThinkPad Z13 21D2CTO1WW | |
| Lenovo ThinkPad X1 Carbon G10 21CC001RGE | |
| Lenovo ThinkPad X1 Nano-20UN002UGE | |
| CrossMark / Overall | |
| Dell XPS 13 Plus 9320 4K | |
| Average of class Subnotebook (365 - 2356, n=59, last 2 years) | |
| Lenovo ThinkPad X1 Carbon G10 21CC001RGE | |
| Apple MacBook Air M2 Entry | |
| Lenovo ThinkPad Z13 21D2CTO1WW | |
| Average AMD Ryzen 5 PRO 6650U, AMD Radeon 660M (1338 - 1432, n=3) | |
| CrossMark / Productivity | |
| Average of class Subnotebook (364 - 2277, n=59, last 2 years) | |
| Dell XPS 13 Plus 9320 4K | |
| Lenovo ThinkPad X1 Carbon G10 21CC001RGE | |
| Lenovo ThinkPad Z13 21D2CTO1WW | |
| Average AMD Ryzen 5 PRO 6650U, AMD Radeon 660M (1366 - 1440, n=3) | |
| Apple MacBook Air M2 Entry | |
| CrossMark / Creativity | |
| Average of class Subnotebook (372 - 2743, n=59, last 2 years) | |
| Dell XPS 13 Plus 9320 4K | |
| Apple MacBook Air M2 Entry | |
| Lenovo ThinkPad X1 Carbon G10 21CC001RGE | |
| Lenovo ThinkPad Z13 21D2CTO1WW | |
| Average AMD Ryzen 5 PRO 6650U, AMD Radeon 660M (1397 - 1517, n=3) | |
| CrossMark / Responsiveness | |
| Dell XPS 13 Plus 9320 4K | |
| Lenovo ThinkPad X1 Carbon G10 21CC001RGE | |
| Average of class Subnotebook (312 - 1854, n=59, last 2 years) | |
| Lenovo ThinkPad Z13 21D2CTO1WW | |
| Average AMD Ryzen 5 PRO 6650U, AMD Radeon 660M (1106 - 1229, n=3) | |
| Apple MacBook Air M2 Entry | |
| PCMark 10 Score | 5513 points | |
Help | ||
| AIDA64 / Memory Copy | |
| Average of class Subnotebook (14554 - 131023, n=57, last 2 years) | |
| Dell XPS 13 Plus 9320 4K | |
| Lenovo ThinkPad X1 Carbon G10 21CC001RGE | |
| Lenovo ThinkPad Z13 21D2CTO1WW | |
| Lenovo ThinkPad X1 Nano-20UN002UGE | |
| Average AMD Ryzen 5 PRO 6650U (31014 - 48558, n=4) | |
| AIDA64 / Memory Read | |
| Average of class Subnotebook (15948 - 127174, n=57, last 2 years) | |
| Lenovo ThinkPad X1 Carbon G10 21CC001RGE | |
| Dell XPS 13 Plus 9320 4K | |
| Lenovo ThinkPad X1 Nano-20UN002UGE | |
| Lenovo ThinkPad Z13 21D2CTO1WW | |
| Average AMD Ryzen 5 PRO 6650U (34690 - 39833, n=4) | |
| AIDA64 / Memory Write | |
| Average of class Subnotebook (15709 - 135141, n=57, last 2 years) | |
| Dell XPS 13 Plus 9320 4K | |
| Lenovo ThinkPad X1 Carbon G10 21CC001RGE | |
| Lenovo ThinkPad Z13 21D2CTO1WW | |
| Lenovo ThinkPad X1 Nano-20UN002UGE | |
| Average AMD Ryzen 5 PRO 6650U (34563 - 51117, n=4) | |
| AIDA64 / Memory Latency | |
| Lenovo ThinkPad Z13 21D2CTO1WW | |
| Average AMD Ryzen 5 PRO 6650U (91.6 - 126.5, n=4) | |
| Lenovo ThinkPad X1 Nano-20UN002UGE | |
| Average of class Subnotebook (6.1 - 159.9, n=55, last 2 years) | |
| Lenovo ThinkPad X1 Carbon G10 21CC001RGE | |
| Lenovo ThinkPad X1 Carbon G10 21CC001RGE | |
* ... smaller is better
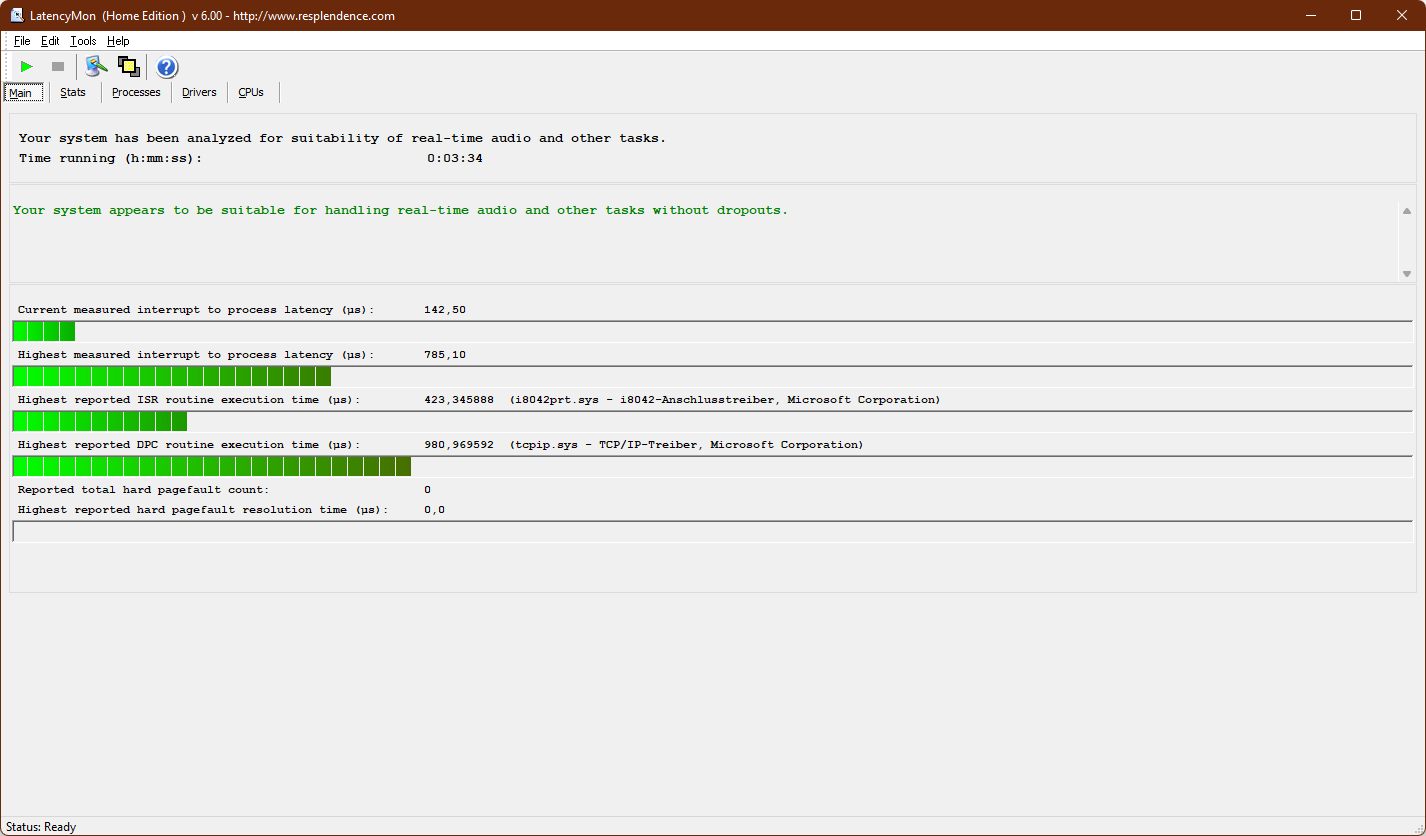
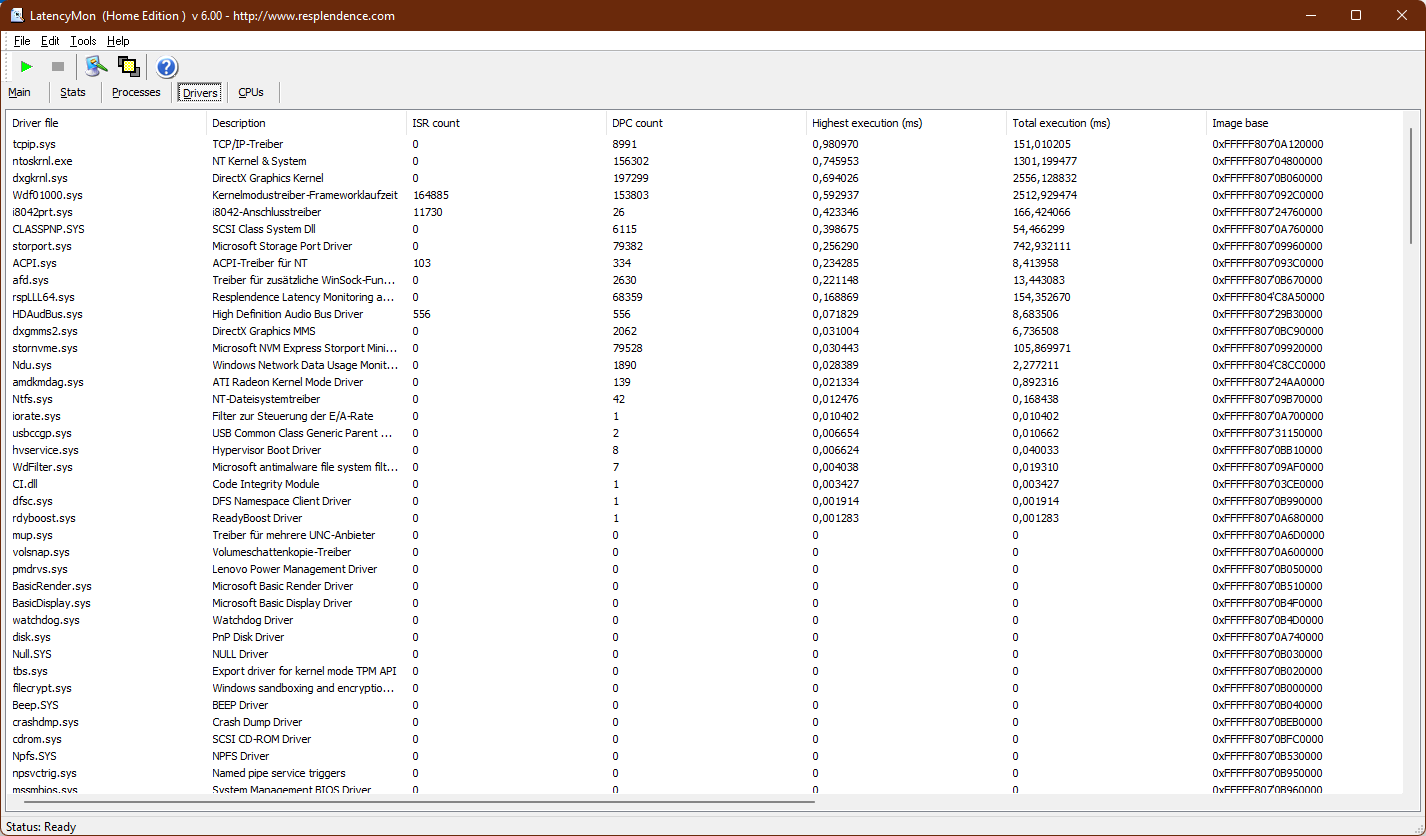
DPC延迟
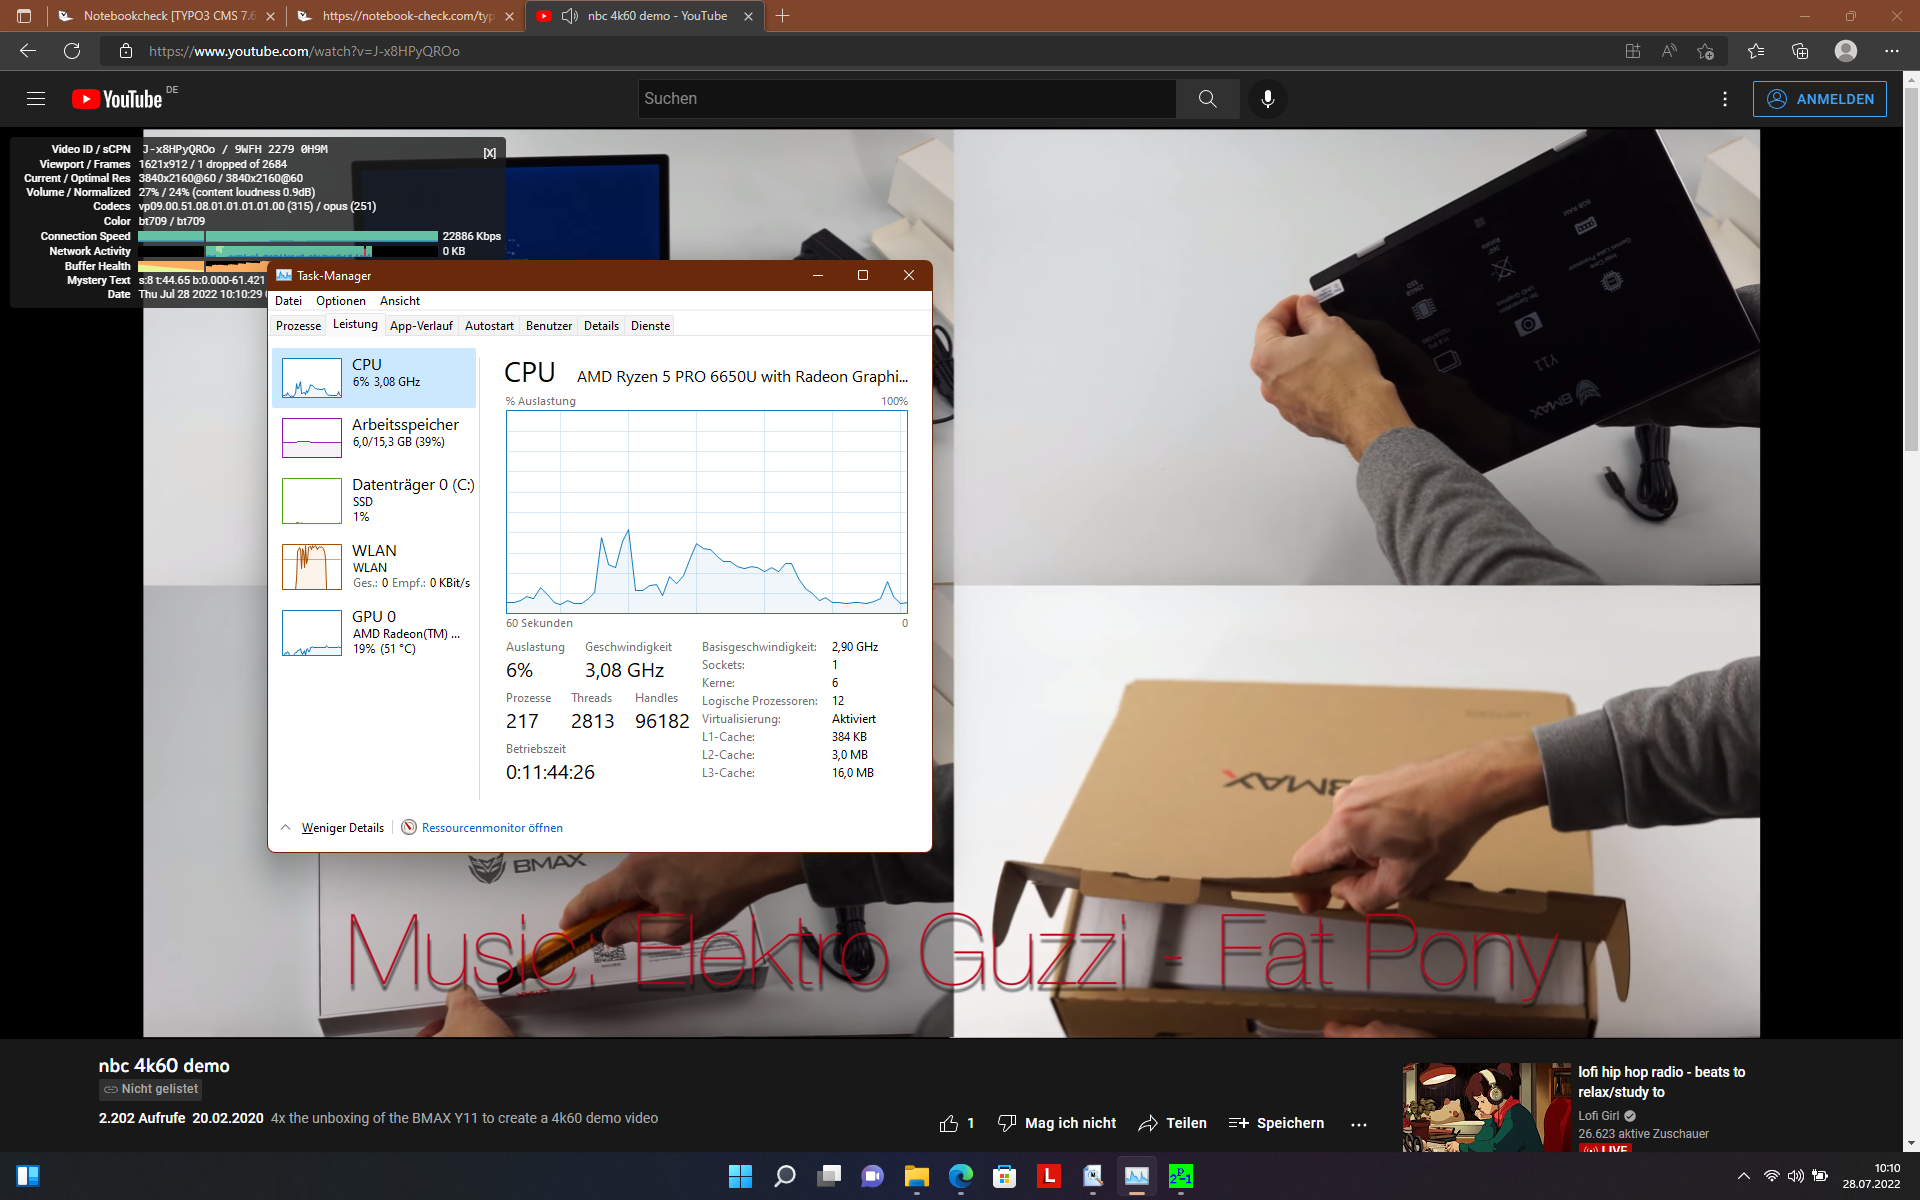
联想ThinkPad Z13没有任何延迟问题,在我们的YouTube测试中ThinkPad只掉了一帧。
| DPC Latencies / LatencyMon - interrupt to process latency (max), Web, Youtube, Prime95 | |
| Lenovo ThinkPad X1 Carbon G10 21CC001RGE | |
| Lenovo ThinkPad X1 Nano-20UN002UGE | |
| Lenovo ThinkPad Z13 21D2CTO1WW | |
| Dell XPS 13 Plus 9320 4K | |
* ... smaller is better
储存
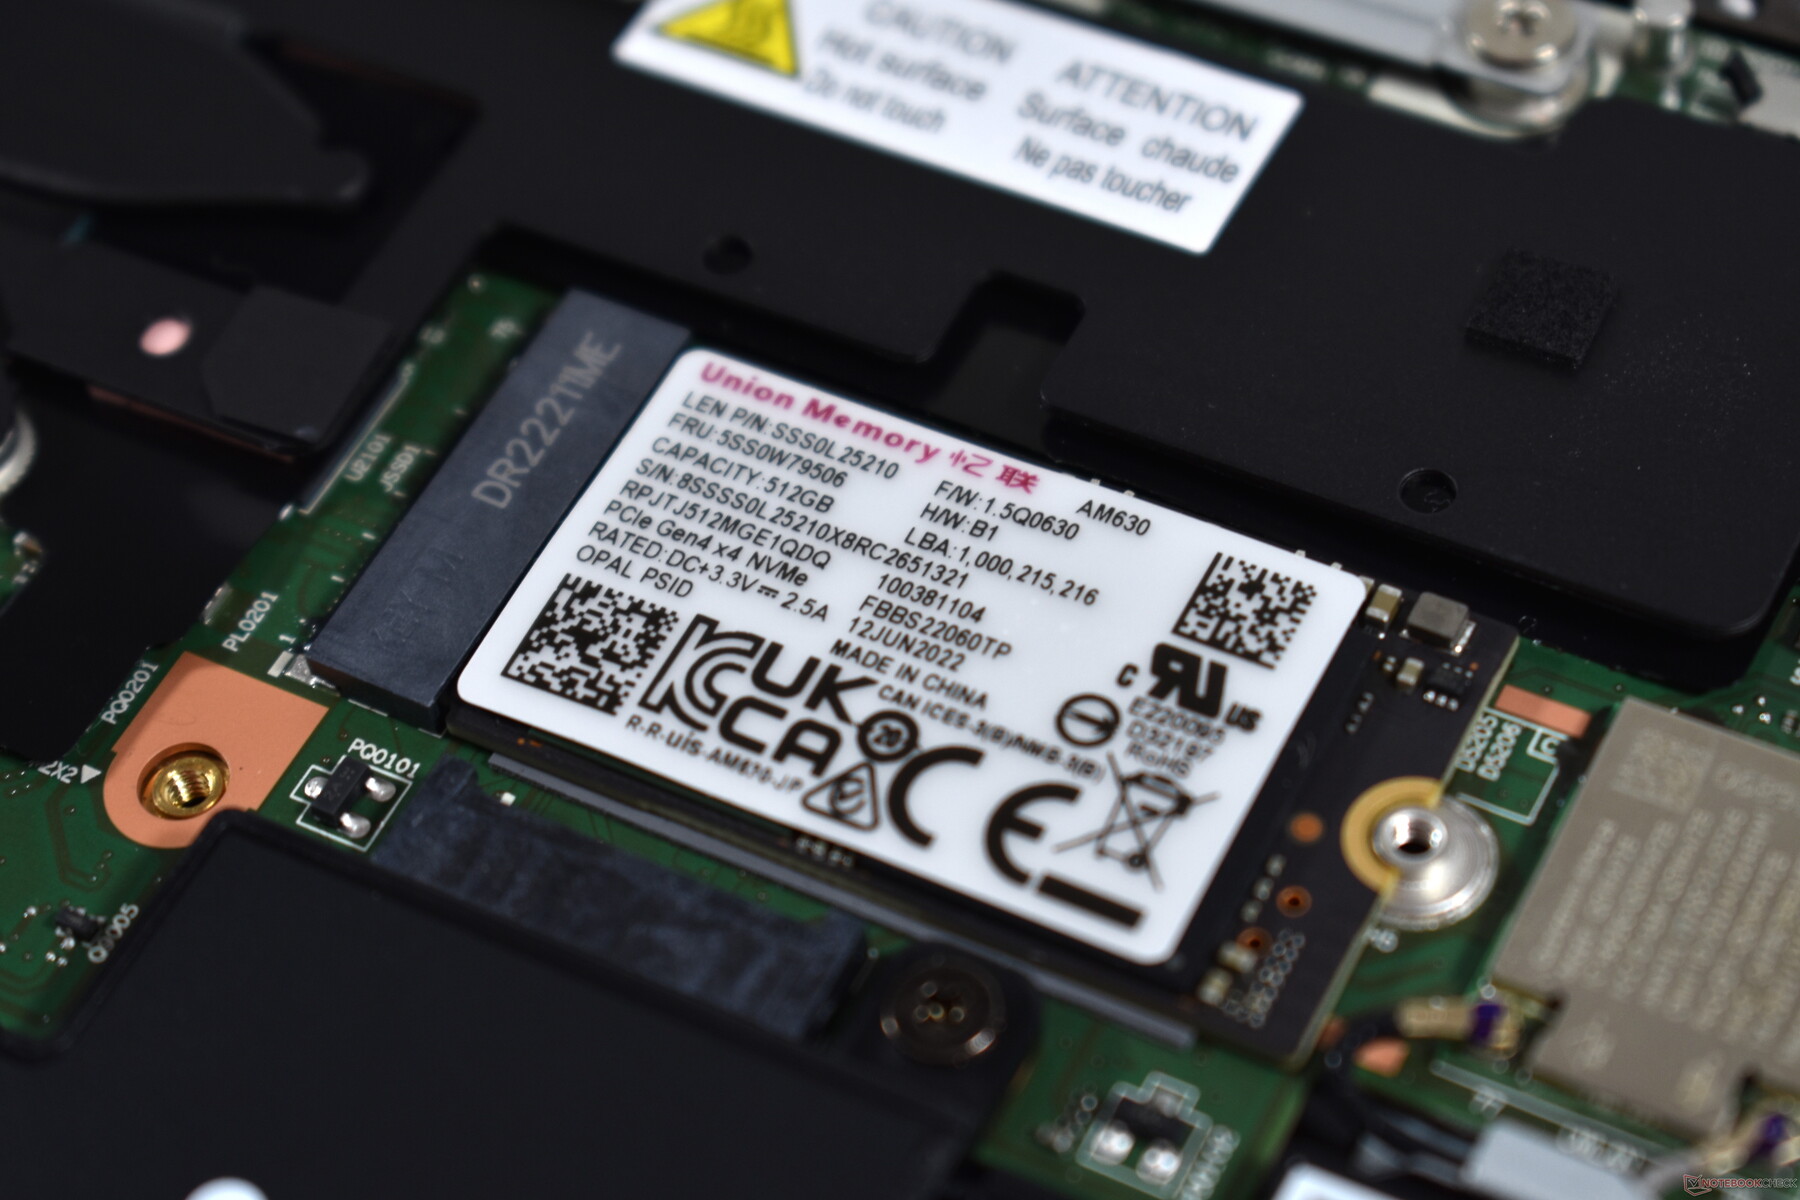
这款小型M.2 2242固态硬盘来自Union Memory,它的容量为512GB。它的性能令人失望,尽管它是一款NVMe PCIe 4.0 SSD。在复制大数据量时,这款固态硬盘的速度明显较慢,但除此之外,在日常使用中,你不会注意到太多的问题。

* ... smaller is better
Continuous load read: DiskSpd Read Loop, Queue Depth 8
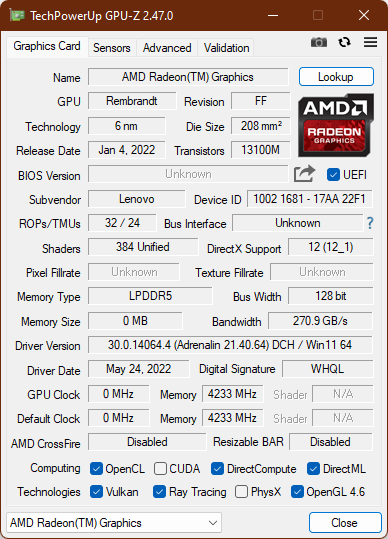
图形卡
的AMD Radeon 660M是联想为ThinkPad Z13提供的两个GPU中较弱的一个。作为一个集成图形芯片,它依赖于主内存;它没有自己的内存--因此,Z13的内存以四通道配置工作是肯定的。
在3DMark测试中,GPU性能高于英特尔的竞争对手,但AMD Radeon 680M要快30%左右。ThinkPad Z13在游戏测试中的表现稍显疲软。Radeon 680M在这里显然更好,而一些英特尔型号也领先于Radeon 660M。我们还注意到,在我们的TheWitcher 3循环测试中,GPU的性能在持续负载下会略微节流。
GPU的性能完全可以靠电池供电。
| 3DMark 06 Standard Score | 27171 points | |
| 3DMark Vantage P Result | 23590 points | |
| 3DMark 11 Performance | 6940 points | |
| 3DMark Ice Storm Standard Score | 133252 points | |
| 3DMark Cloud Gate Standard Score | 19921 points | |
| 3DMark Fire Strike Score | 4119 points | |
| 3DMark Time Spy Score | 1776 points | |
Help | ||
The Witcher 3 FPS diagram
| low | med. | high | ultra | |
|---|---|---|---|---|
| GTA V (2015) | 128.8 | 99.7 | 31.2 | 14.1 |
| The Witcher 3 (2015) | 82.2 | 45.9 | 19.7 | 12.6 |
| Dota 2 Reborn (2015) | 101 | 74.4 | 47.1 | 41.3 |
| Final Fantasy XV Benchmark (2018) | 43.8 | 20.7 | 15 | |
| X-Plane 11.11 (2018) | 34.8 | 25 | 23 | |
| Strange Brigade (2018) | 117.7 | 38.6 | 32.7 | 25.5 |
| F1 2021 (2021) | 103.8 | 47.3 | 36 | 14.1 |
| Elex 2 (2022) | 33.5 | 25.8 | 22.8 | |
| Ghostwire Tokyo (2022) | 16.1 |
排放。具有良好冷却系统的ThinkPad Z13
噪声排放
在空闲使用和低负载情况下,联想ThinkPad Z13的两个小风扇几乎一直保持沉默。当它们运行时,通常是在32.35 dB(a),几乎听不到。最大噪音水平为39.53 dB(a),略高于其他ThinkPad,但大大低于戴尔XPS 13 Plus的风扇音量。 戴尔XPS 13 Plus.
在我们对ThinkPad Z13的评测样本中,线圈啸叫并不是一个问题。
Noise level
| Idle |
| 23.71 / 23.71 / 23.71 dB(A) |
| Load |
| 32.35 / 39.53 dB(A) |
 | ||
30 dB silent 40 dB(A) audible 50 dB(A) loud |
||
min: | ||
| Lenovo ThinkPad Z13 21D2CTO1WW Radeon 660M, R5 PRO 6650U, Lenovo UMIS AM630 RPJTJ512MGE1QDQ | Dell XPS 13 Plus 9320 4K Iris Xe G7 96EUs, i7-1260P, Samsung PM9A1 MZVL21T0HCLR | Lenovo ThinkPad X1 Carbon G10 21CC001RGE Iris Xe G7 80EUs, i5-1250P, Samsung PM9A1 MZVL2512HCJQ | Lenovo ThinkPad X1 Nano-20UN002UGE Iris Xe G7 96EUs, i7-1160G7, WDC PC SN530 SDBPNPZ-512G | Lenovo ThinkPad X13 G2 AMD 20XH001KGE Vega 7, R5 PRO 5650U, Samsung SSD PM981a MZVLB512HBJQ | |
|---|---|---|---|---|---|
| Noise | -11% | 5% | -6% | 3% | |
| off / environment * (dB) | 23.71 | 24.4 -3% | 22.81 4% | 24.9 -5% | 24.17 -2% |
| Idle Minimum * (dB) | 23.71 | 24.4 -3% | 22.81 4% | 24.9 -5% | 24.17 -2% |
| Idle Average * (dB) | 23.71 | 24.4 -3% | 22.81 4% | 26.3 -11% | 24.17 -2% |
| Idle Maximum * (dB) | 23.71 | 25.5 -8% | 22.81 4% | 31.8 -34% | 24.17 -2% |
| Load Average * (dB) | 32.35 | 40.4 -25% | 31.59 2% | 34.3 -6% | 29.92 8% |
| Witcher 3 ultra * (dB) | 38.8 | 45.5 -17% | 35.59 8% | 34.3 12% | |
| Load Maximum * (dB) | 39.53 | 45.5 -15% | 35.47 10% | 37.5 5% | 31.52 20% |
* ... smaller is better
温度
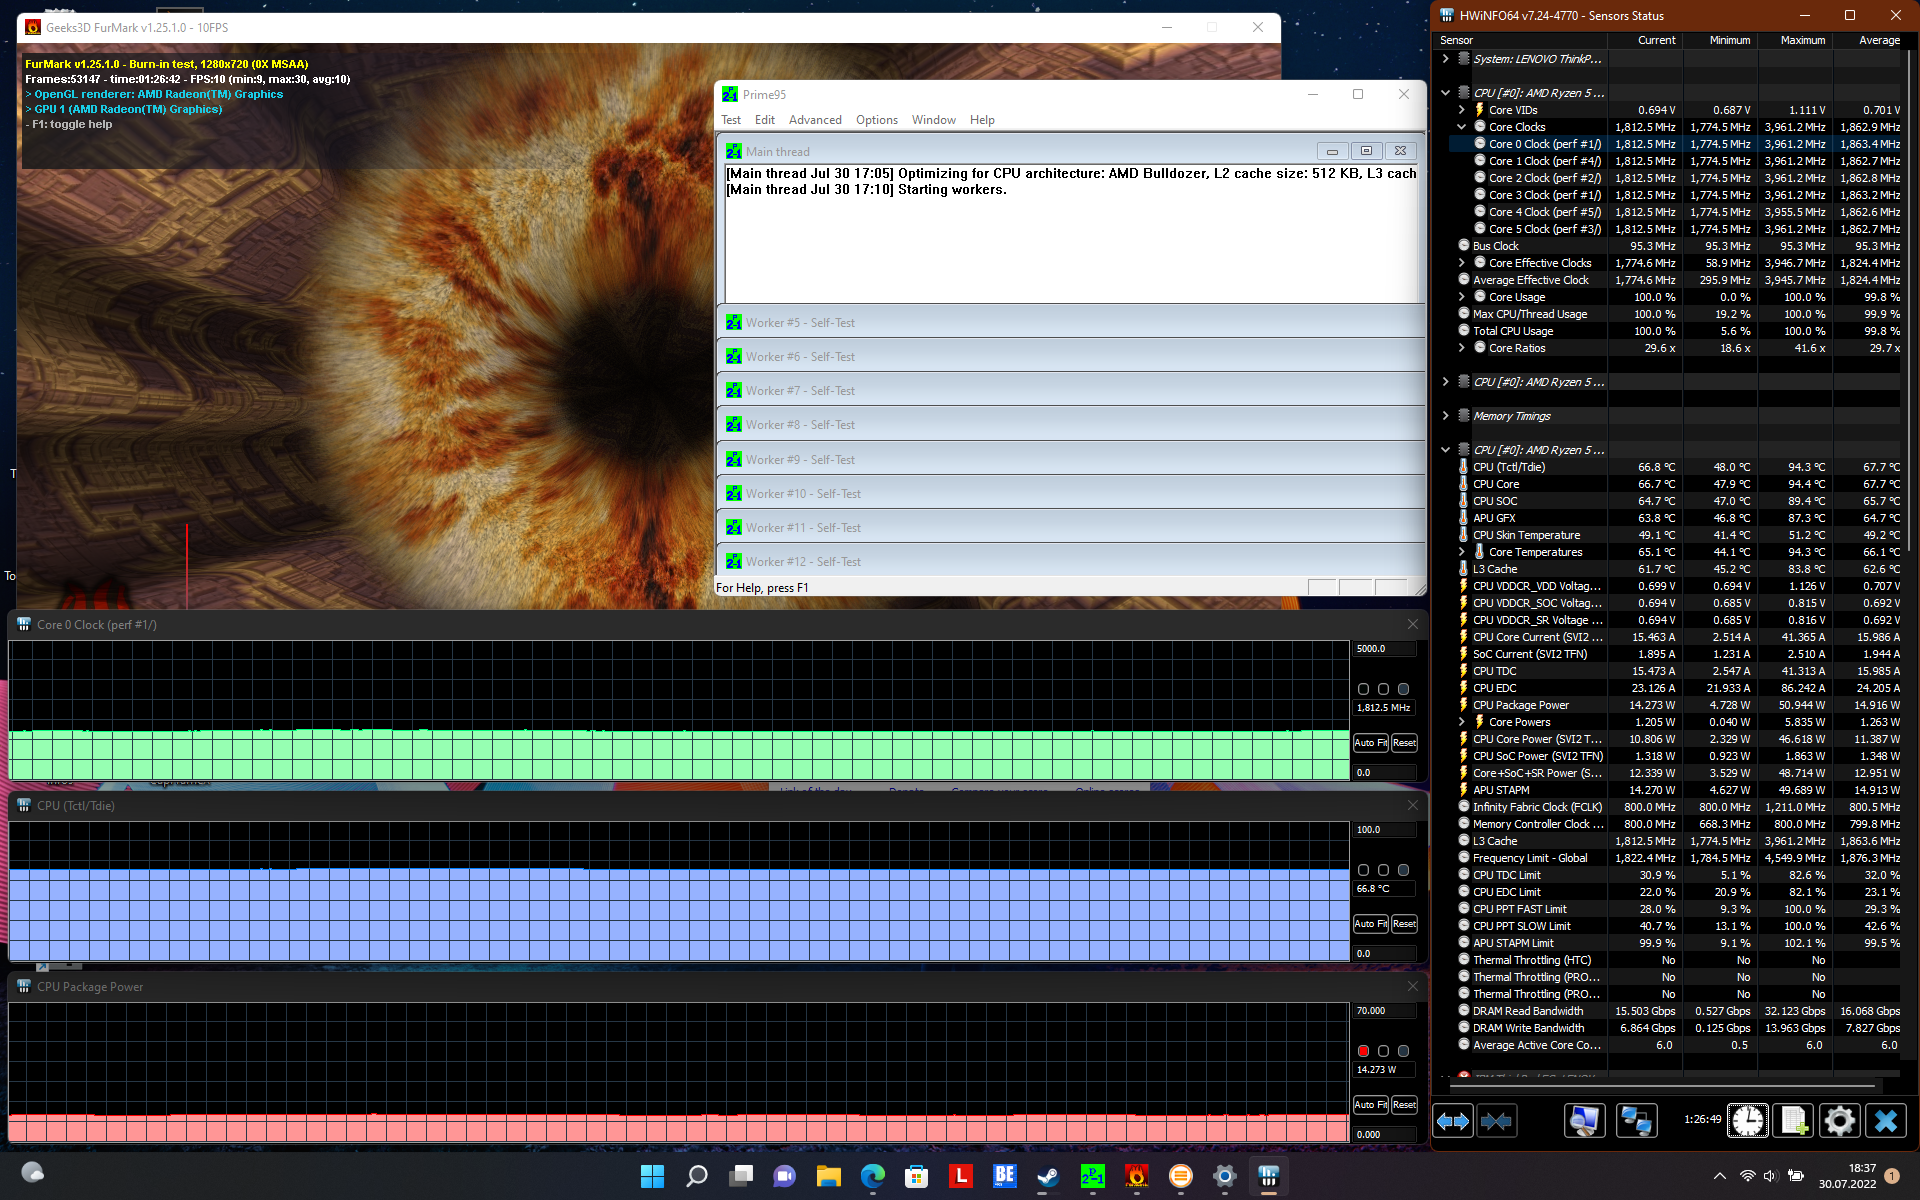
说到联想ThinkPad Z13的顶部,实际上只有键盘上方的区域和键盘间距在压力测试和我们的TheWitcher 3测试中发热。相比之下,掌托仍然相对凉爽--手出汗不应该是个问题。在压力测试中,ThinkPad的底部明显发热,温度为44.3°C(约112°F),当长时间放在腿上时,会变得很不舒服。
经过一个多小时的压力测试,该处理器的消耗量约为14瓦特。联想ThinkPad Z13必须在CPU再次获得其全部性能之前冷却下来,因为在压力测试之后直接运行3DMark 11时,得分略低。
(±) The maximum temperature on the upper side is 44.9 °C / 113 F, compared to the average of 35.9 °C / 97 F, ranging from 21.4 to 59 °C for the class Subnotebook.
(±) The bottom heats up to a maximum of 44.3 °C / 112 F, compared to the average of 39.2 °C / 103 F
(+) In idle usage, the average temperature for the upper side is 29.2 °C / 85 F, compared to the device average of 30.8 °C / 87 F.
(±) Playing The Witcher 3, the average temperature for the upper side is 37.5 °C / 100 F, compared to the device average of 30.8 °C / 87 F.
(+) The palmrests and touchpad are reaching skin temperature as a maximum (32.5 °C / 90.5 F) and are therefore not hot.
(-) The average temperature of the palmrest area of similar devices was 28.2 °C / 82.8 F (-4.3 °C / -7.7 F).
| Lenovo ThinkPad Z13 21D2CTO1WW AMD Ryzen 5 PRO 6650U, AMD Radeon 660M | Dell XPS 13 Plus 9320 4K Intel Core i7-1260P, Intel Iris Xe Graphics G7 96EUs | Lenovo ThinkPad X1 Carbon G10 21CC001RGE Intel Core i5-1250P, Intel Iris Xe Graphics G7 80EUs | Apple MacBook Air M2 Entry Apple M2, Apple M2 8-Core GPU | Lenovo ThinkPad X1 Nano-20UN002UGE Intel Core i7-1160G7, Intel Iris Xe Graphics G7 96EUs | |
|---|---|---|---|---|---|
| Heat | 4% | -1% | 13% | 11% | |
| Maximum Upper Side * (°C) | 44.9 | 41.1 8% | 45 -0% | 44.5 1% | 42.2 6% |
| Maximum Bottom * (°C) | 44.3 | 48.8 -10% | 44 1% | 44.4 -0% | 47.5 -7% |
| Idle Upper Side * (°C) | 31.4 | 28 11% | 31.2 1% | 23.9 24% | 24.3 23% |
| Idle Bottom * (°C) | 31.5 | 29.3 7% | 33.2 -5% | 23.6 25% | 25.3 20% |
* ... smaller is better
发言人
联想将Z13的立体声扬声器放在底部--除非笔记本放在桌面上,否则这不是一个理想的位置。除此之外,它们是相对较好的笔记本电脑扬声器,也能提供一些低音。然而,与直接竞争对手相比,Z13在这个类别中并没有完全跟上。
Lenovo ThinkPad Z13 21D2CTO1WW audio analysis
(±) | speaker loudness is average but good (74.33 dB)
Bass 100 - 315 Hz
(±) | reduced bass - on average 11.9% lower than median
(-) | bass is not linear (16.1% delta to prev. frequency)
Mids 400 - 2000 Hz
(±) | higher mids - on average 5.4% higher than median
(±) | linearity of mids is average (9.7% delta to prev. frequency)
Highs 2 - 16 kHz
(+) | balanced highs - only 1.1% away from median
(+) | highs are linear (4.1% delta to prev. frequency)
Overall 100 - 16.000 Hz
(±) | linearity of overall sound is average (15.2% difference to median)
Compared to same class
» 34% of all tested devices in this class were better, 5% similar, 61% worse
» The best had a delta of 5%, average was 18%, worst was 53%
Compared to all devices tested
» 22% of all tested devices were better, 4% similar, 74% worse
» The best had a delta of 4%, average was 23%, worst was 134%
Dell XPS 13 Plus 9320 4K audio analysis
(±) | speaker loudness is average but good (79 dB)
Bass 100 - 315 Hz
(±) | reduced bass - on average 7.3% lower than median
(±) | linearity of bass is average (9.4% delta to prev. frequency)
Mids 400 - 2000 Hz
(+) | balanced mids - only 3.7% away from median
(+) | mids are linear (5.7% delta to prev. frequency)
Highs 2 - 16 kHz
(+) | balanced highs - only 3.4% away from median
(+) | highs are linear (4.3% delta to prev. frequency)
Overall 100 - 16.000 Hz
(+) | overall sound is linear (10.7% difference to median)
Compared to same class
» 9% of all tested devices in this class were better, 3% similar, 88% worse
» The best had a delta of 5%, average was 18%, worst was 53%
Compared to all devices tested
» 6% of all tested devices were better, 2% similar, 93% worse
» The best had a delta of 4%, average was 23%, worst was 134%
Apple MacBook Air M2 Entry audio analysis
(+) | speakers can play relatively loud (82.7 dB)
Bass 100 - 315 Hz
(±) | reduced bass - on average 12.2% lower than median
(±) | linearity of bass is average (12.6% delta to prev. frequency)
Mids 400 - 2000 Hz
(+) | balanced mids - only 1.1% away from median
(+) | mids are linear (3.1% delta to prev. frequency)
Highs 2 - 16 kHz
(+) | balanced highs - only 2.4% away from median
(+) | highs are linear (1.9% delta to prev. frequency)
Overall 100 - 16.000 Hz
(+) | overall sound is linear (9.5% difference to median)
Compared to same class
» 5% of all tested devices in this class were better, 2% similar, 93% worse
» The best had a delta of 5%, average was 18%, worst was 53%
Compared to all devices tested
» 4% of all tested devices were better, 1% similar, 95% worse
» The best had a delta of 4%, average was 23%, worst was 134%
Lenovo ThinkPad X1 Nano-20UN002UGE audio analysis
(+) | speakers can play relatively loud (86.4 dB)
Bass 100 - 315 Hz
(±) | reduced bass - on average 14.6% lower than median
(±) | linearity of bass is average (9.3% delta to prev. frequency)
Mids 400 - 2000 Hz
(+) | balanced mids - only 3.8% away from median
(+) | mids are linear (6.4% delta to prev. frequency)
Highs 2 - 16 kHz
(+) | balanced highs - only 2.2% away from median
(+) | highs are linear (3.5% delta to prev. frequency)
Overall 100 - 16.000 Hz
(+) | overall sound is linear (11.9% difference to median)
Compared to same class
» 13% of all tested devices in this class were better, 5% similar, 82% worse
» The best had a delta of 5%, average was 18%, worst was 53%
Compared to all devices tested
» 9% of all tested devices were better, 2% similar, 89% worse
» The best had a delta of 4%, average was 23%, worst was 134%
能源管理。这款联想ThinkPad的电池寿命长,令人印象深刻
能源消耗
AMD和联想似乎对ThinkPad Z13进行了非常好的优化。2.4瓦的最低消耗量仅被Apple MacBook Air M2压低。其他空闲率也很有说服力--在全显示亮度、最大性能模式和启用所有无线设备的情况下,Z13的空闲消耗仅超过5.1瓦--低于所有对比设备。
65瓦的电源适配器有足够的容量,最大消耗约为63瓦。
| Off / Standby | |
| Idle | |
| Load |
|
Key:
min: | |
| Lenovo ThinkPad Z13 21D2CTO1WW R5 PRO 6650U, Radeon 660M, Lenovo UMIS AM630 RPJTJ512MGE1QDQ, IPS LED, 1920x1200, 13.3" | Dell XPS 13 Plus 9320 4K i7-1260P, Iris Xe G7 96EUs, Samsung PM9A1 MZVL21T0HCLR, IPS, 3840x2400, 13.4" | Lenovo ThinkPad X1 Carbon G10 21CC001RGE i5-1250P, Iris Xe G7 80EUs, Samsung PM9A1 MZVL2512HCJQ, IPS LED, 1920x1200, 14" | Apple MacBook Air M2 Entry M2, M2 8-Core GPU, Apple SSD AP0256Z, IPS, 2560x1664, 13.6" | Lenovo ThinkPad X1 Nano-20UN002UGE i7-1160G7, Iris Xe G7 96EUs, WDC PC SN530 SDBPNPZ-512G, IPS, 2160x1350, 13" | Average AMD Radeon 660M | Average of class Subnotebook | |
|---|---|---|---|---|---|---|---|
| Power Consumption | -91% | -6% | -10% | -14% | -42% | -27% | |
| Idle Minimum * (Watt) | 2.4 | 7 -192% | 2.9 -21% | 1.87 22% | 3.3 -38% | 4.68 ? -95% | 3.73 ? -55% |
| Idle Average * (Watt) | 4.6 | 11 -139% | 4.9 -7% | 9.2 -100% | 5.7 -24% | 7.08 ? -54% | 6.51 ? -42% |
| Idle Maximum * (Watt) | 5.1 | 11.4 -124% | 6 -18% | 9.3 -82% | 9.1 -78% | 9.12 ? -79% | 7.88 ? -55% |
| Load Average * (Watt) | 53.1 | 59.7 -12% | 29.3 45% | 28.5 46% | 29.6 44% | 44.2 ? 17% | 42.3 ? 20% |
| Witcher 3 ultra * (Watt) | 27.6 | 49.4 -79% | 36.6 -33% | 27.4 1% | 27.7 -0% | ||
| Load Maximum * (Watt) | 63.7 | 63 1% | 63.3 1% | 31 51% | 55.1 14% | 62.4 ? 2% | 64.8 ? -2% |
* ... smaller is better
Energy consumption during The Witcher 3 / stress test
Energy consumption with an external monitor
电池寿命
联想ThinkPad Z13 G1的内部电池容量为51.5瓦特小时。在对比的笔记本电脑中,只有X1 Nano的电池比较小。尽管如此,联想笔记本电脑实现了出色的电池运行时间,在这一领域轻松击败了英特尔代表。与Apple MacBook Air(该类别的最佳产品)相比,它很有竞争力,当然是在较低的显示分辨率下。然而,在我们的Wi-Fi测试中超过14小时(150cd/m²)绝对是一个非常好的结果。
| Lenovo ThinkPad Z13 21D2CTO1WW R5 PRO 6650U, Radeon 660M, 51.5 Wh | Dell XPS 13 Plus 9320 4K i7-1260P, Iris Xe G7 96EUs, 55 Wh | Lenovo ThinkPad X1 Carbon G10 21CC001RGE i5-1250P, Iris Xe G7 80EUs, 57 Wh | Apple MacBook Air M2 Entry M2, M2 8-Core GPU, 52.6 Wh | Lenovo ThinkPad X1 Nano-20UN002UGE i7-1160G7, Iris Xe G7 96EUs, 48.2 Wh | Average of class Subnotebook | |
|---|---|---|---|---|---|---|
| Battery runtime | -39% | -12% | 11% | -18% | -1% | |
| H.264 (h) | 16.3 | 11 -33% | 10.9 -33% | 16.5 1% | 15.4 -6% | 15.3 ? -6% |
| WiFi v1.3 (h) | 14.4 | 6.9 -52% | 10.2 -29% | 15.2 6% | 9.9 -31% | 14 ? -3% |
| Load (h) | 1.9 | 1.3 -32% | 2.4 26% | 2.4 26% | 1.6 -16% | 1.998 ? 5% |
Pros
Cons
评语。联想几乎用ThinkPad Z13钉住了它
联想和AMD之间的密切合作,首款采用Ryzen CPU的高端ThinkPad。联想ThinkPad Z13是ThinkPad品牌历史上的一个重要里程碑--因为这段历史到目前为止主要由英特尔主导。高品质组件和AMD的结合取得了成功。
ThinkPad Z13向竞争对手如戴尔XPS 13 Plus或Apple MacBook Air正面攻击。ThinkPad Z13在面对强大的竞争对手时很好地完成了这项艰巨的任务,因为它只有几个弱点,而有很多优点。一个由金属和玻璃制成的非常紧凑和高质量的外壳与非常好的输入设备相结合,特别是可能说服从其他笔记本电脑品牌转换过来的用户。集成的TrackPoint按钮也比2014年的第一次尝试效果更好。AMD CPU提供了高性能,但在温度或风扇噪音方面没有对效率做出大的妥协。相反,电池寿命很好,只是刚刚超过了 Apple MacBook Air.
只有几个缺点是必须接受的,以换取这个强大的整体包装。这包括相当慢的固态硬盘以及中等的显示亮度,它落后于竞争对手。Z13确实提供了WWAN,但在没有WWAN的情况下,它没有预先配置。此外,与X1系列不同,联想并没有提供面向未来的5G。端口配置对于这种紧凑的超极本来说是典型的,但至少一个全尺寸的HDMI端口肯定是一个很大的优势,特别是在商业领域。两个小的批评点。屏幕不能打开到180度,这与几乎所有其他的ThinkPads相反,而且缺少上/下页键。
优质的质量加上AMD--这就是联想ThinkPad Z13的结果。
总而言之,联想ThinkPad Z13肯定是今年迄今为止最有趣的13英寸笔记本电脑之一,这反映在其高分上。相比之下 戴尔XPS 13 Plus,它提供了更高效的CPU,并放弃了触摸条等奇怪的实验。而相比之下 Apple MacBook Air相比,它提供了更多的CPU功率,而没有牺牲电池寿命等方面。这款 ThinkPad X1 Carbon G10提供了更好的功能,但它的体积更大,而且耐用性更差。
价格和可用性
在撰写本文时,你可以在制造商的网上商店找到联想ThinkPad Z13的几种配置。我们的评测配置目前的价格约为1465美元(采用第一个较便宜的型号,并通过 "打造你的电脑 "选项添加更多存储空间)。
Lenovo ThinkPad Z13 21D2CTO1WW
- 08/07/2022 v7 (old)
Benjamin Herzig
Price comparison

