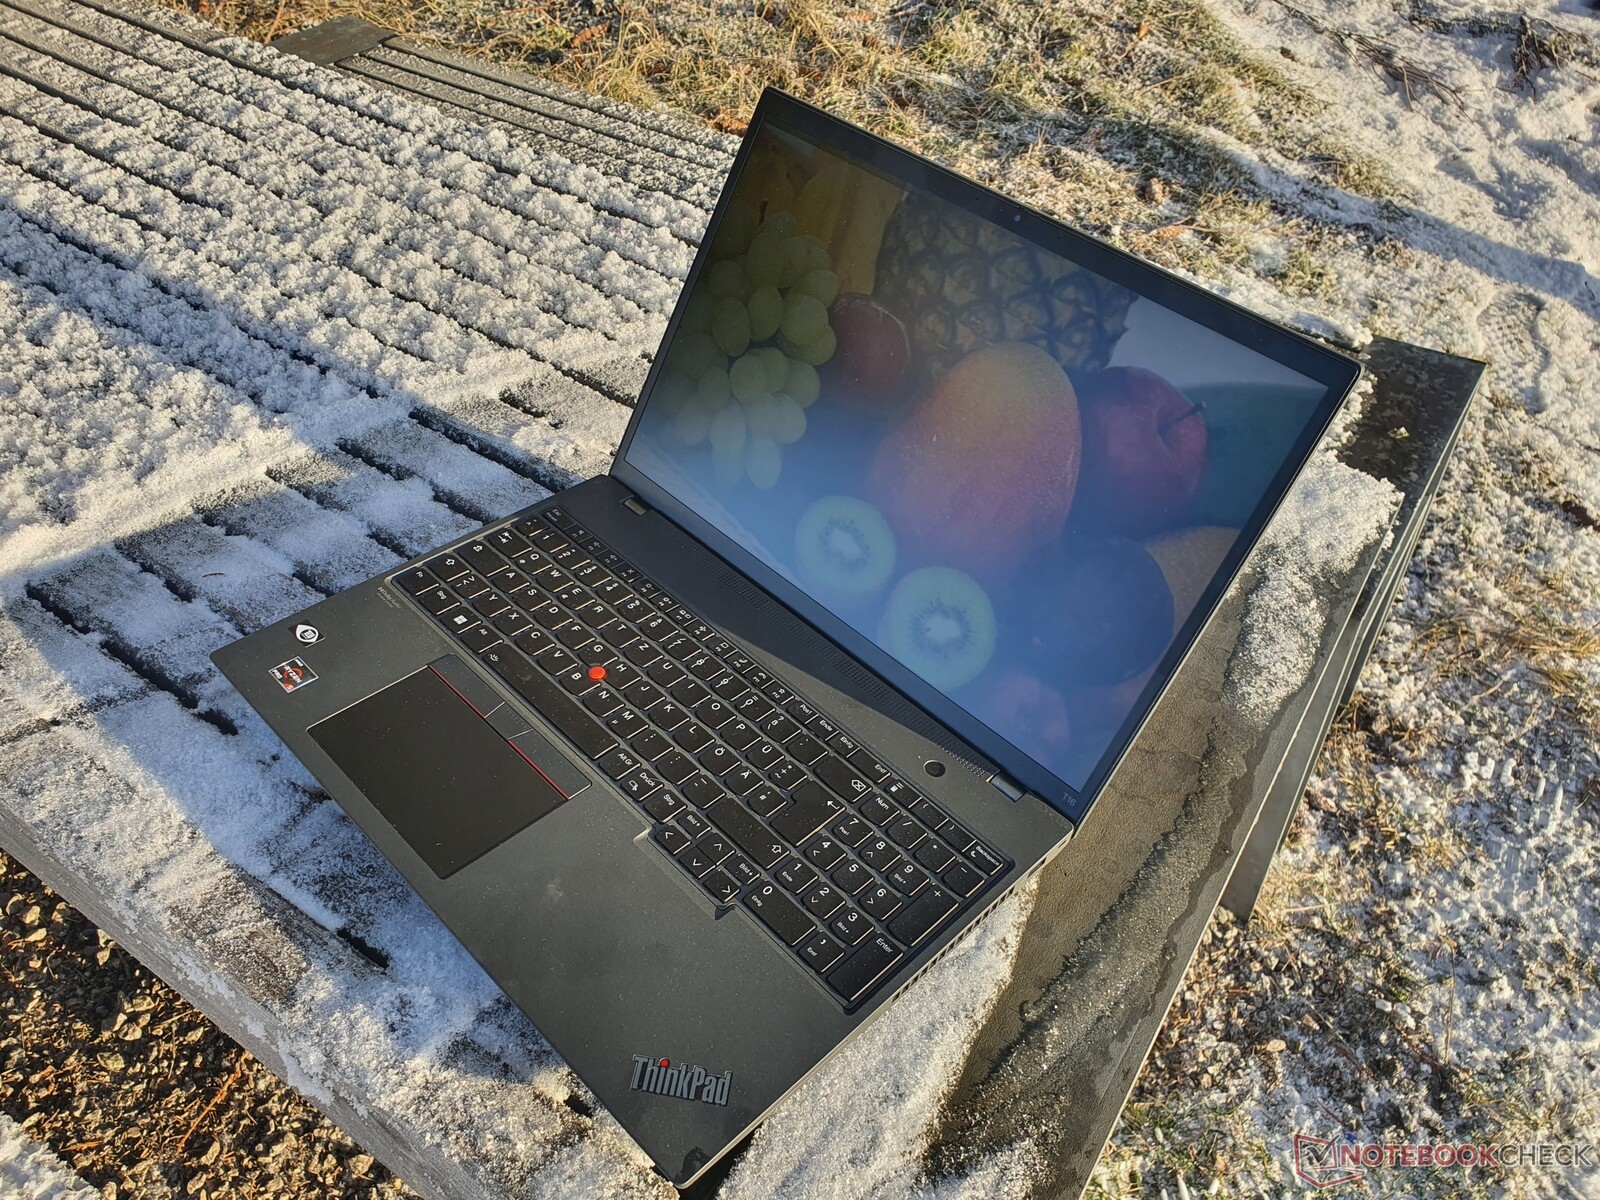
联想ThinkPad T16 G1 AMD笔记本电脑评测。高效且比英特尔更快
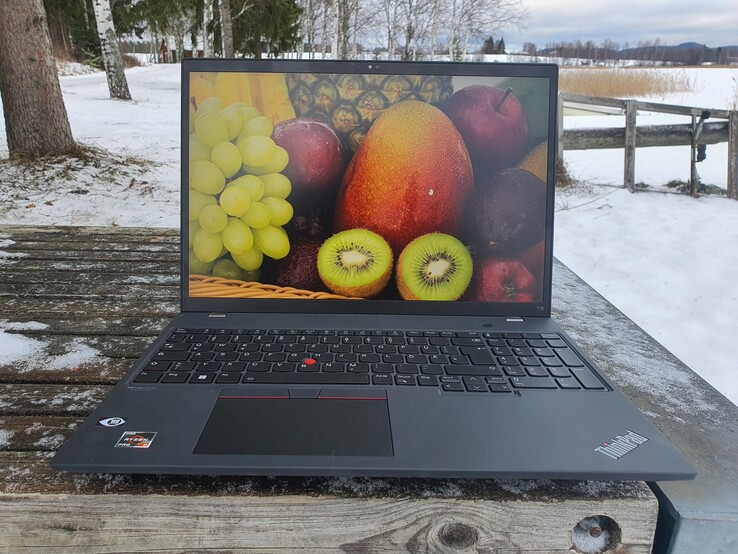
在这篇评论中,我们看一下联想ThinkPad T16的AMD版本,之前我们已经测试过了 测试了英特尔版本并在其中看到了许多积极的方面。然而,我们仍然对其性能感到失望,导致我们希望从目前最大的T系列ThinkPad的Ryzen CPU中获得更多。我们还想看看,长期使用的T16 G1在配备AMD处理器后是否会更有效率。
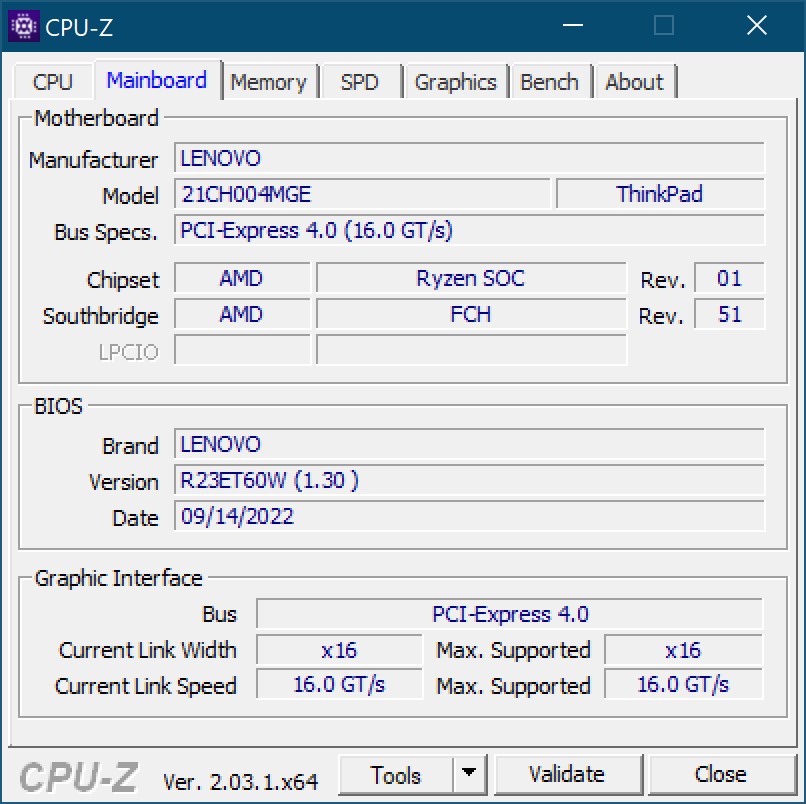
我们测试了配备较小的52.5瓦时电池、高分辨率WQXGA显示屏和AMD六核的模型版本 Ryzen 5 PRO 6650U.此外,还有16GB的LPDDR5-RAM,完全焊接在AMD ThinkPads T16和 T14,以及一个512GB的PCIe 4.0固态硬盘。集成的 Radeon 660M处理图形操作。
竞争对手特别包括惠普 EliteBook 865 G9,但与其他16英寸的ThinkPads相比,如 ThinkPad Z16甚至是 ThinkPad X1 Extreme我们还包括另外一个T16机型的测试结果,该机型配备了 Ryzen 7 PRO 6850U和其他相同的设备。
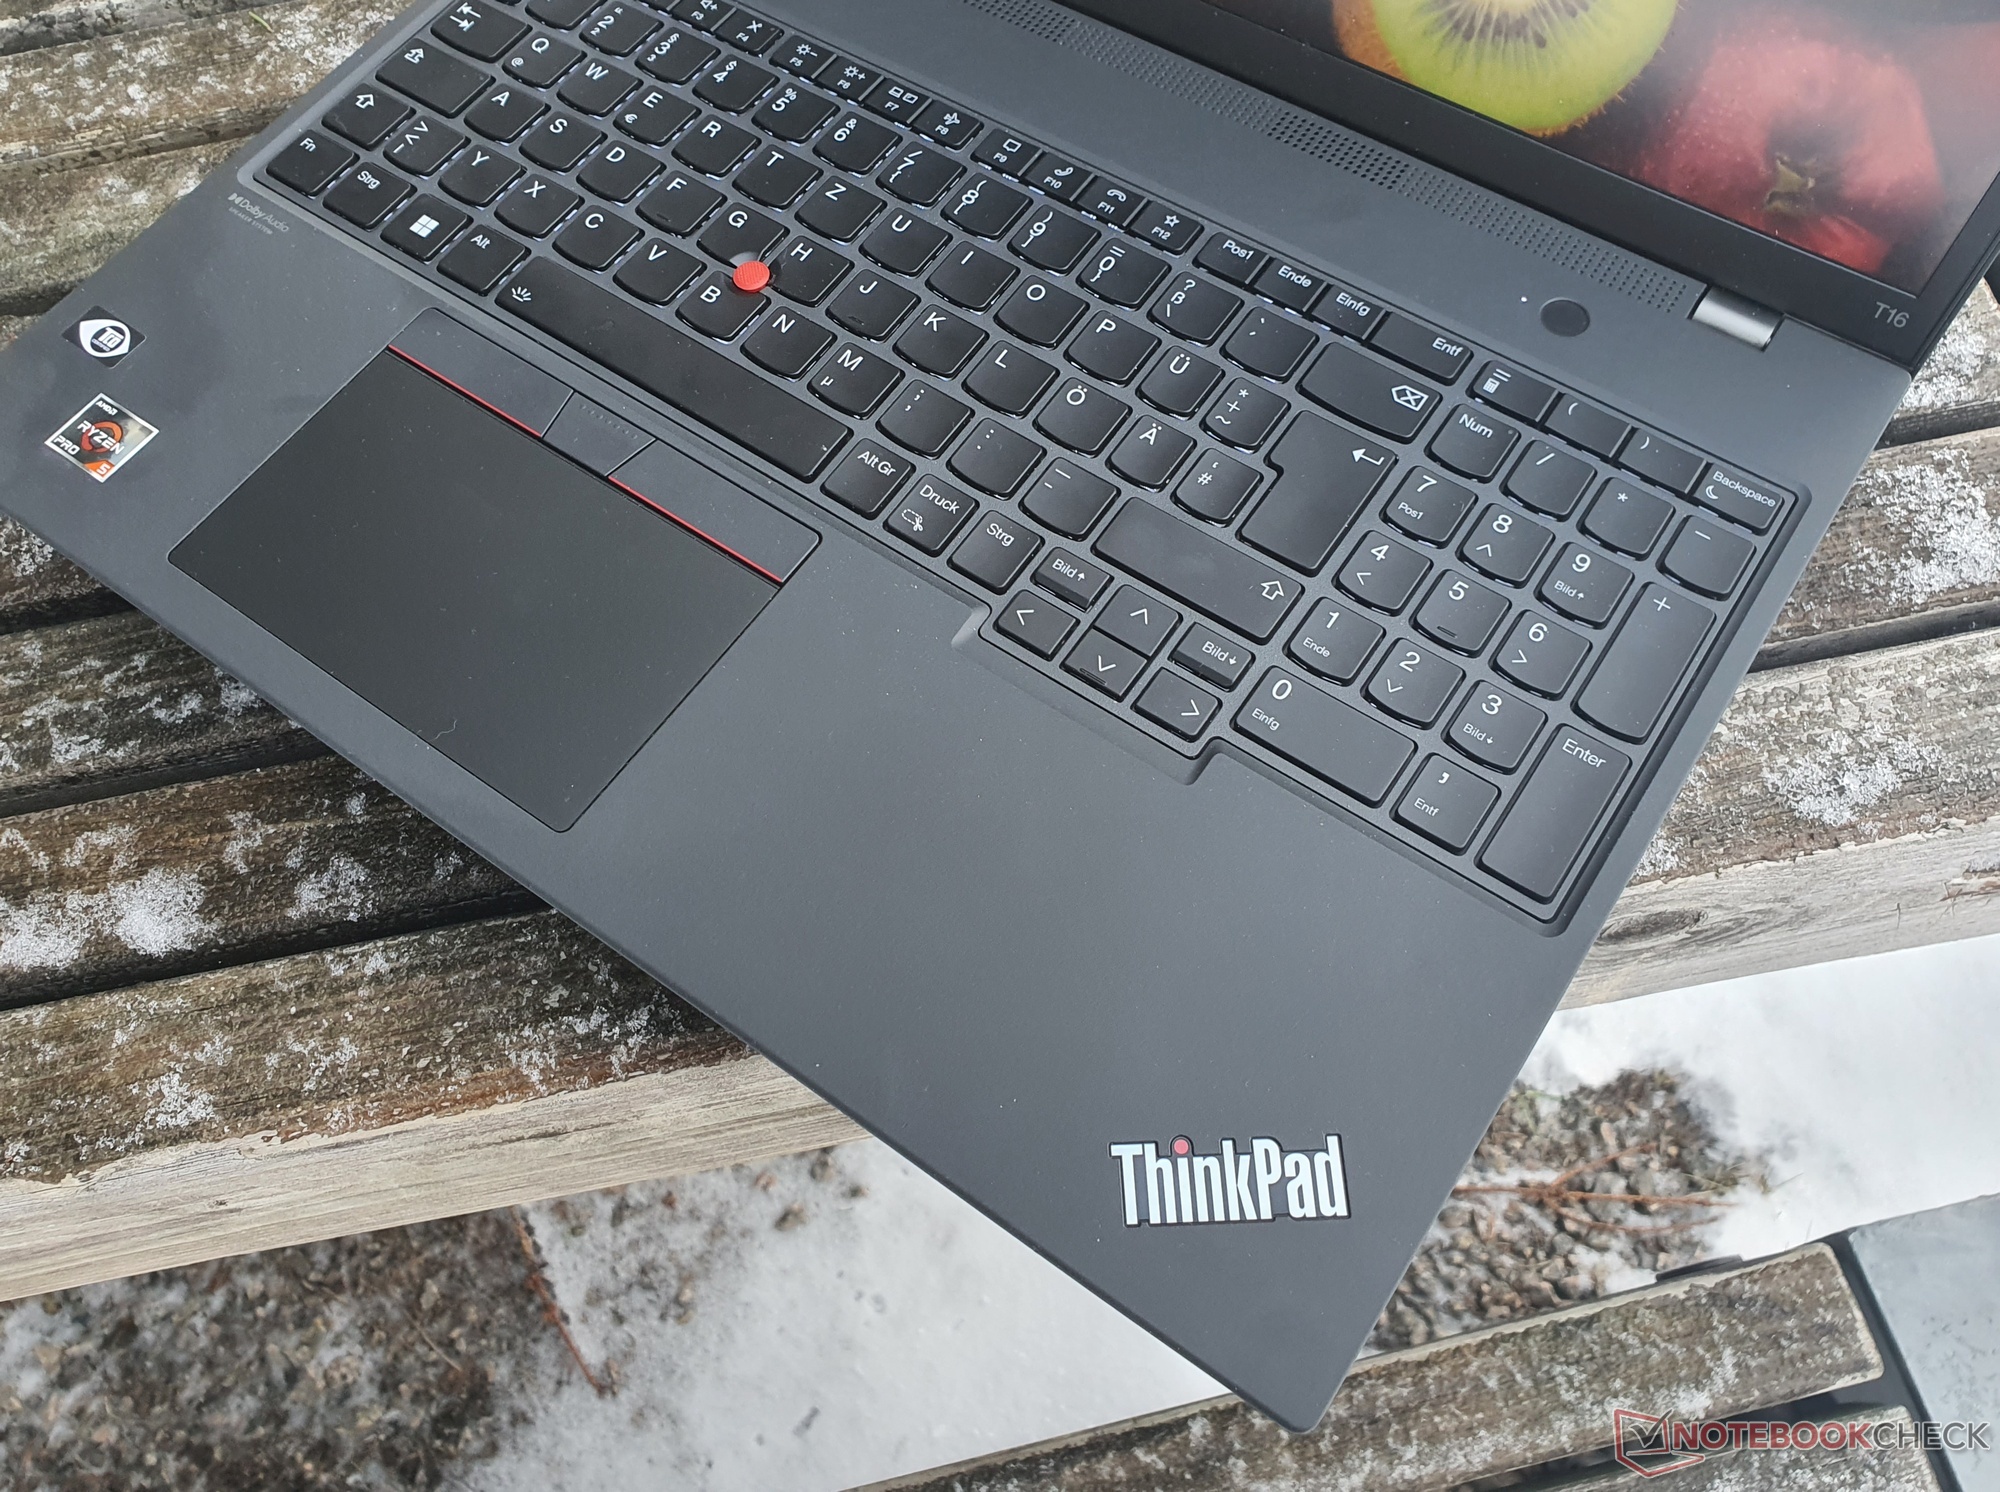
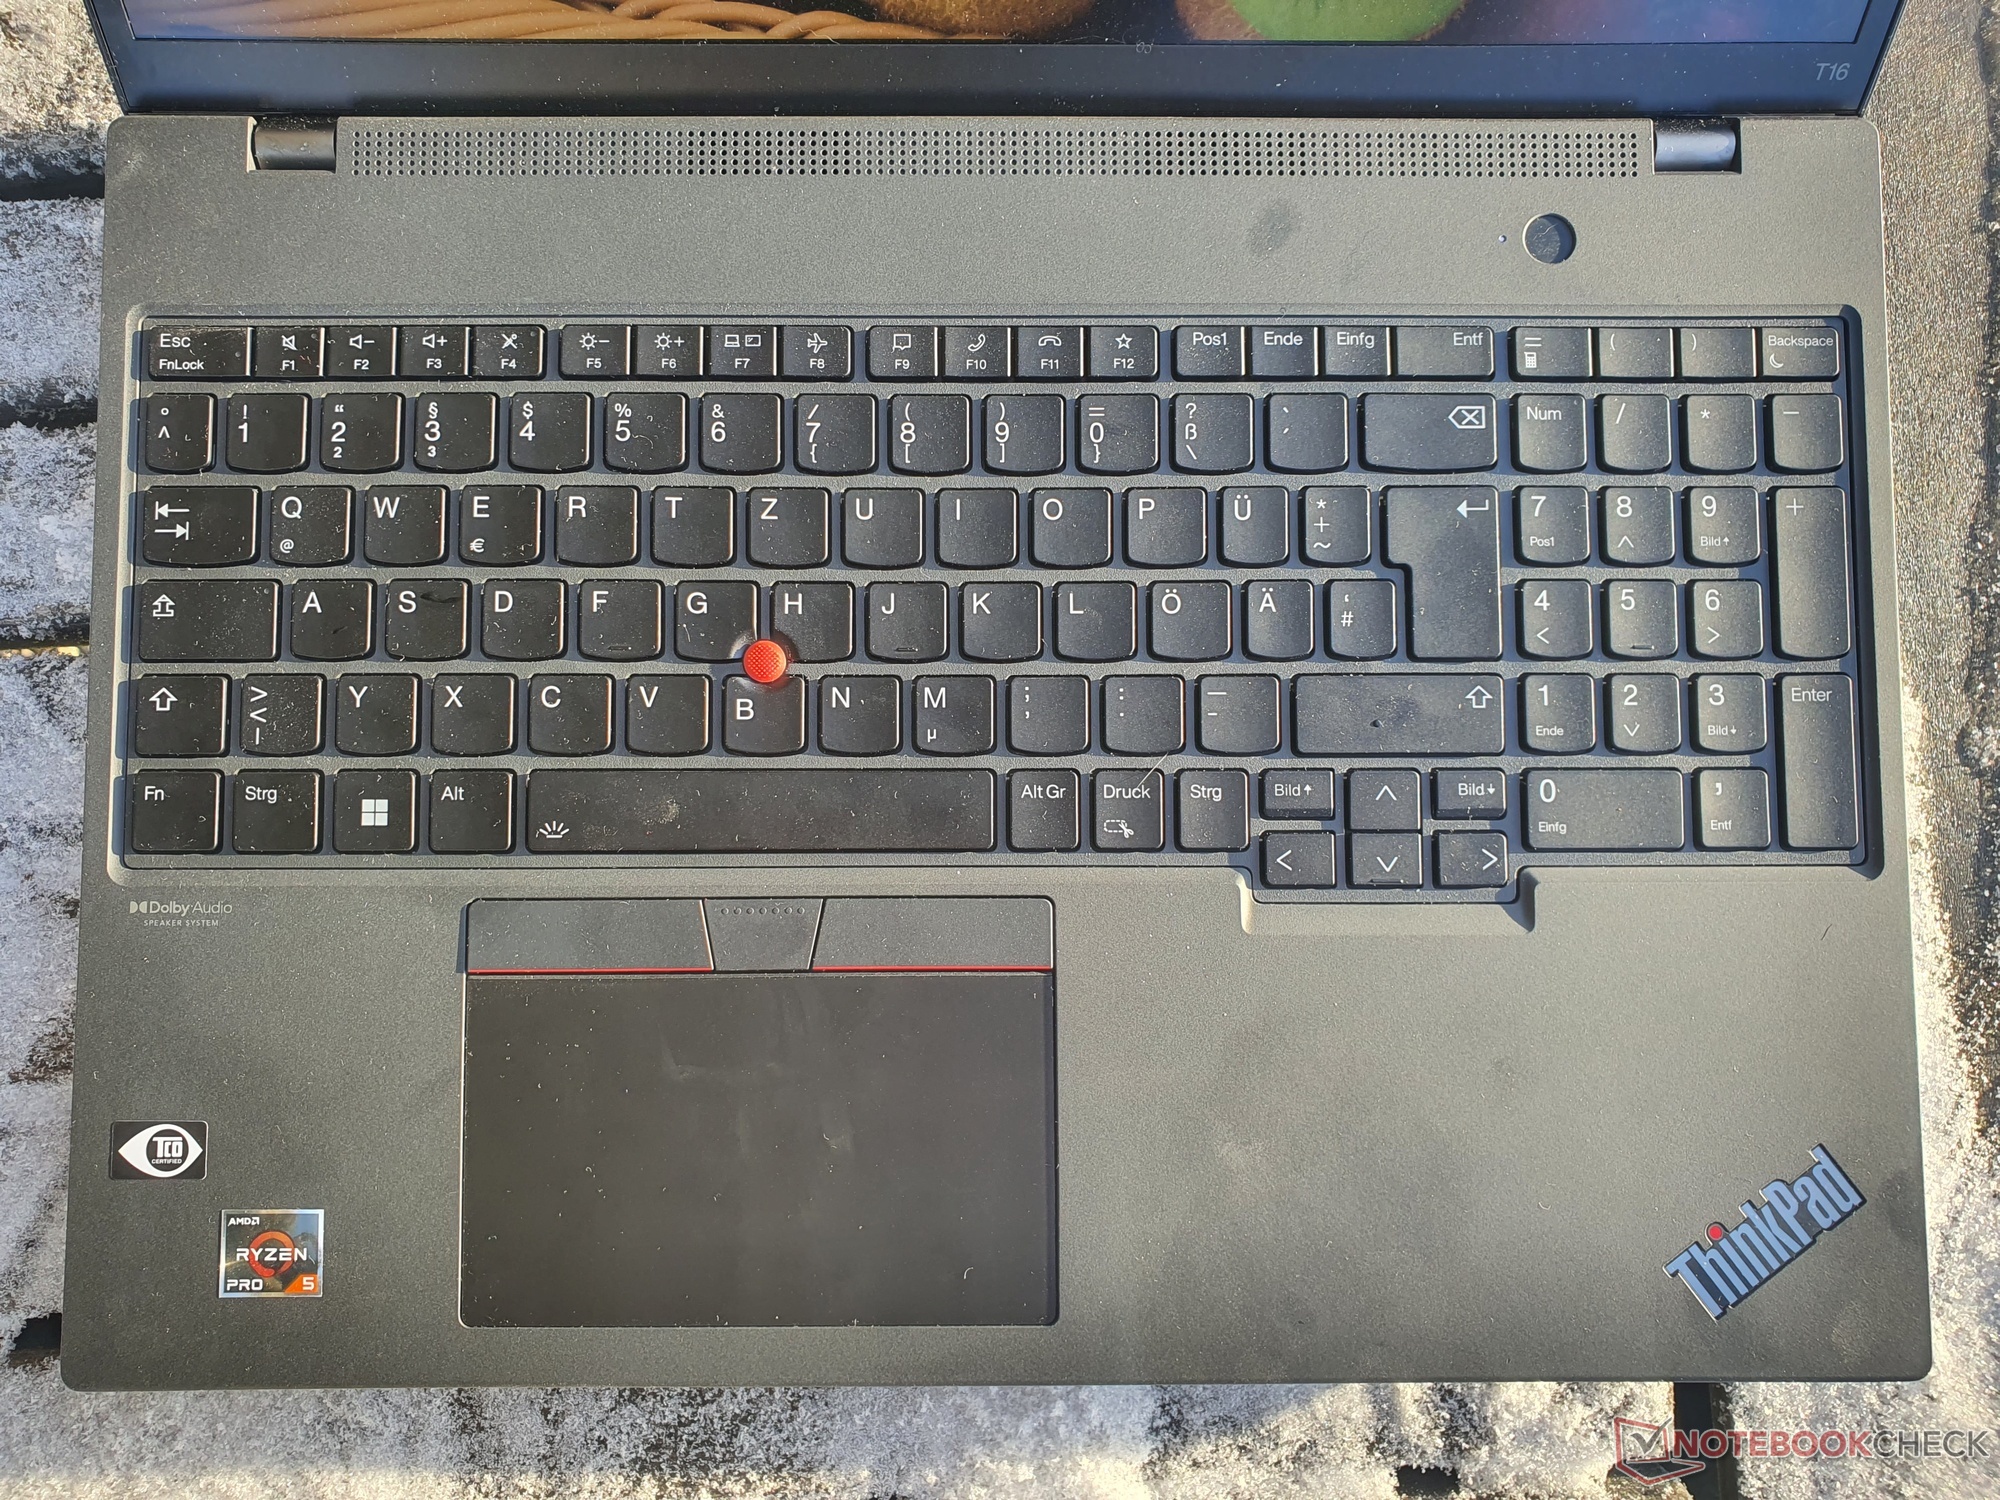
由于机箱、连接设备和输入设备基本相同,你可以在我们的 关于ThinkPad T16 G1 Intel的评论.
其他联想ThinkPad评论。
ThinkPad P16 G1
ThinkPad T14s G3 AMD
ThinkPad T14s G3 英特尔
ThinkPad X1 Carbon G10
ThinkPad X13 G3 英特尔
思考板X13sG1
ThinkPad Z13 G1 OLED
潜在的竞争对手比较
Rating | Date | Model | Weight | Height | Size | Resolution | Price |
|---|---|---|---|---|---|---|---|
| 90.2 % v7 (old) | 02 / 2023 | Lenovo ThinkPad T16 G1 21CH004MGE R5 PRO 6650U, Radeon 660M | 1.8 kg | 20.5 mm | 16.00" | 2560x1600 | |
| 89.3 % v7 (old) | 09 / 2022 | Lenovo ThinkPad T16 G1 21BWS00200 i5-1240P, Iris Xe G7 80EUs | 1.9 kg | 20.5 mm | 16.00" | 1920x1200 | |
| 87.2 % v7 (old) | 12 / 2022 | HP EliteBook 865 G9 R7 PRO 6850U, Radeon 680M | 1.9 kg | 19 mm | 16.00" | 1920x1200 | |
| 87.3 % v7 (old) | 10 / 2022 | Lenovo ThinkPad Z16 G1 21D5S00T00 R7 PRO 6850H, Radeon RX 6500M | 1.9 kg | 15.8 mm | 16.00" | 1920x1200 | |
| 88.7 % v7 (old) | 12 / 2022 | Lenovo ThinkPad X1 Extreme G5-21DE003RGE i7-12700H, GeForce RTX 3060 Laptop GPU | 2.1 kg | 17.9 mm | 16.00" | 3840x2400 | |
| 86.2 % v7 (old) | 06 / 2022 | Lenovo ThinkPad P15v G2 21A9000XGE i7-11800H, T1200 Laptop GPU | 2.3 kg | 22.7 mm | 15.60" | 1920x1080 | |
| 87.4 % v7 (old) | 01 / 2023 | HP ZBook Power 15 G9 6B8C4EA i7-12700H, RTX A2000 Laptop GPU | 2 kg | 22.8 mm | 15.60" | 3840x2160 |

连接
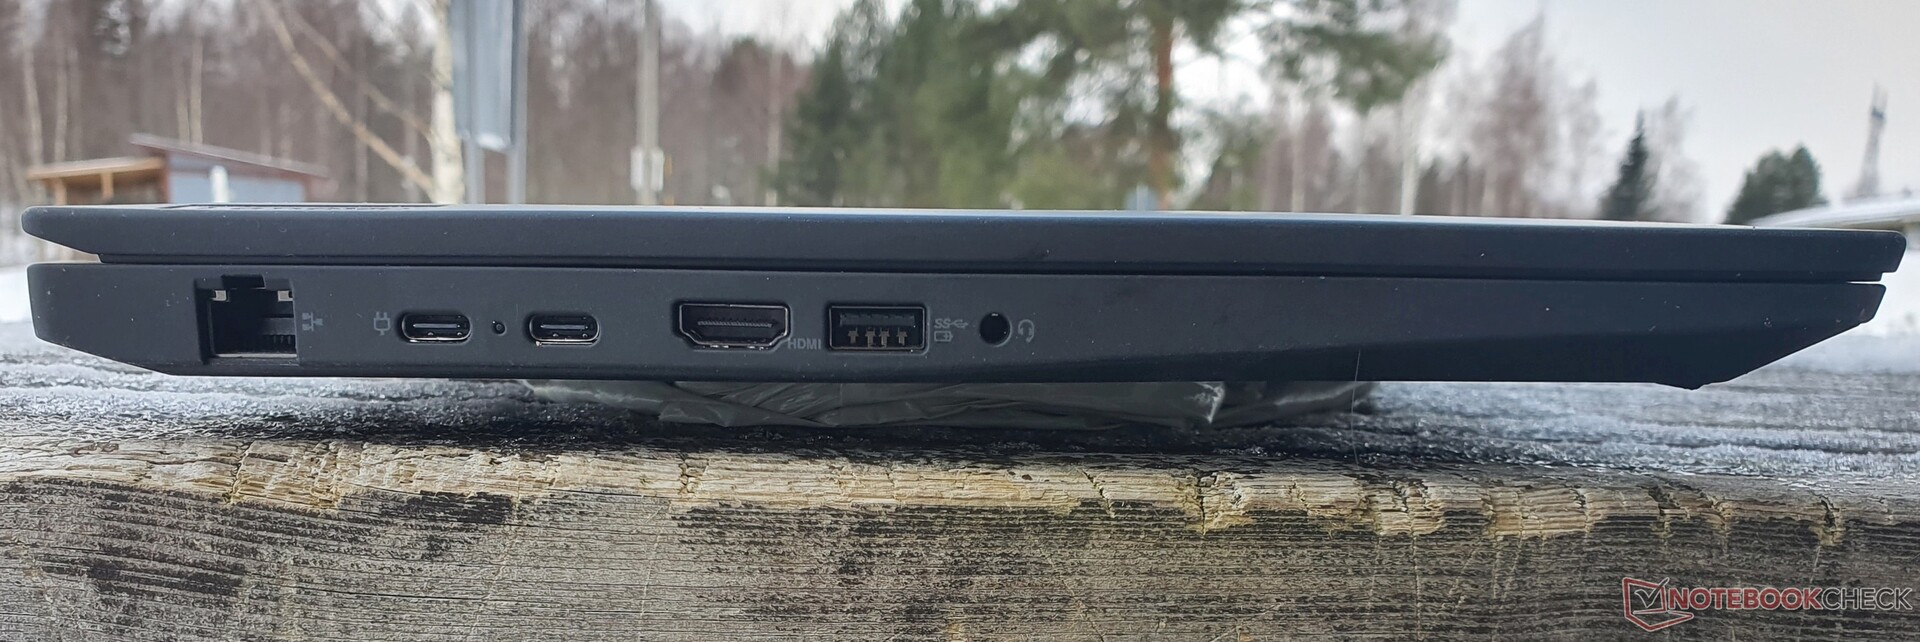
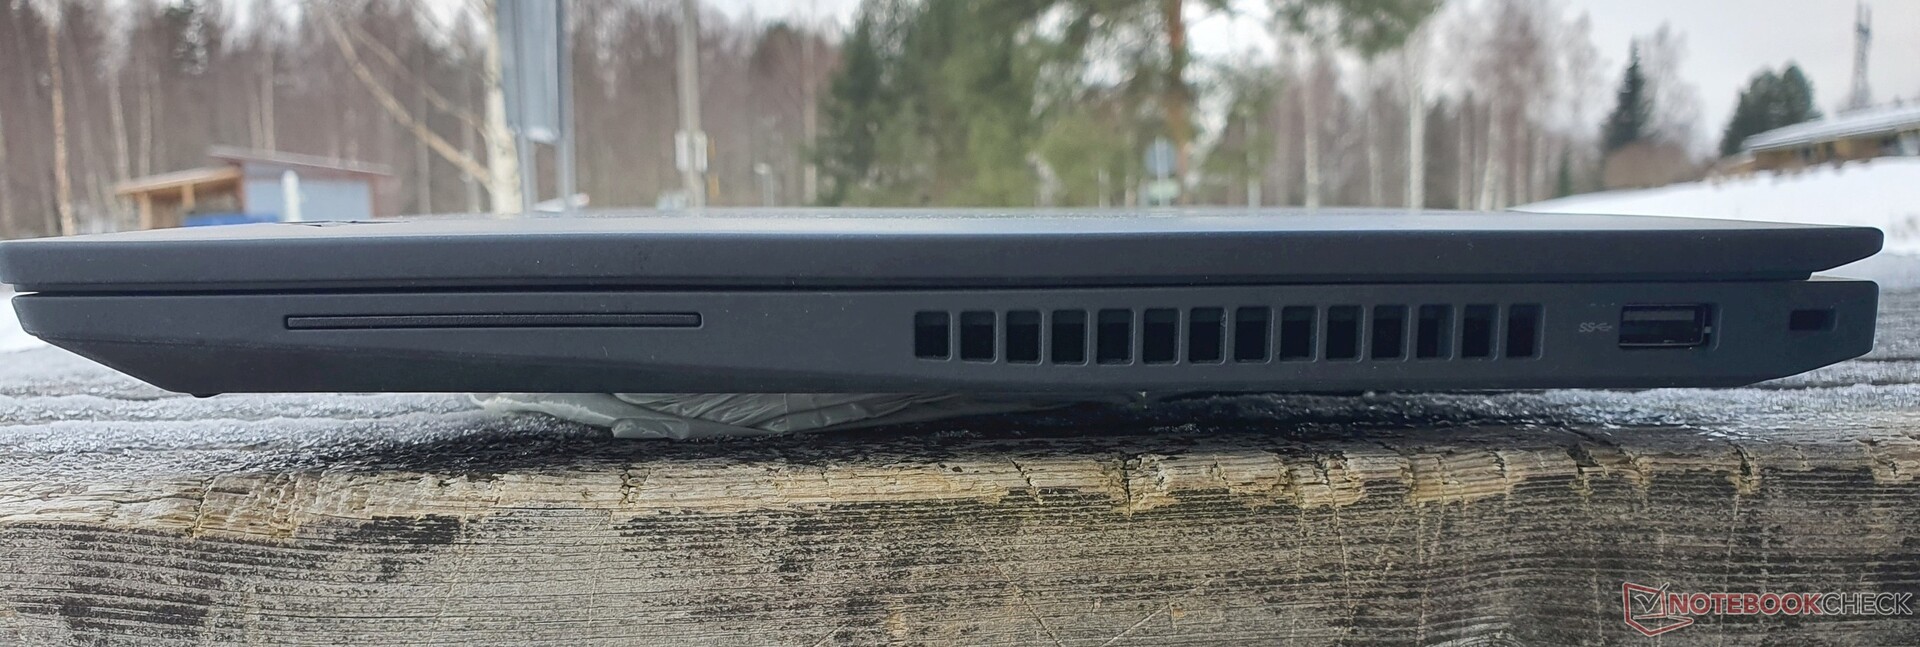
这些连接基本上与 英特尔型号惟一的区别是缺少Thunderbolt 4和USB 4。
沟通
像在 ThinkPad T14 AMD和 ThinkPad Z16,这里也使用了高通公司的WCN685x Wi-Fi 6E模块,包括蓝牙5.2,导致传输速度非常快。在我们的比较领域,所有设备在这方面的速度都差不多。尽管我们的测试装置没有WWAN模块,但它仍然包括必要的天线。
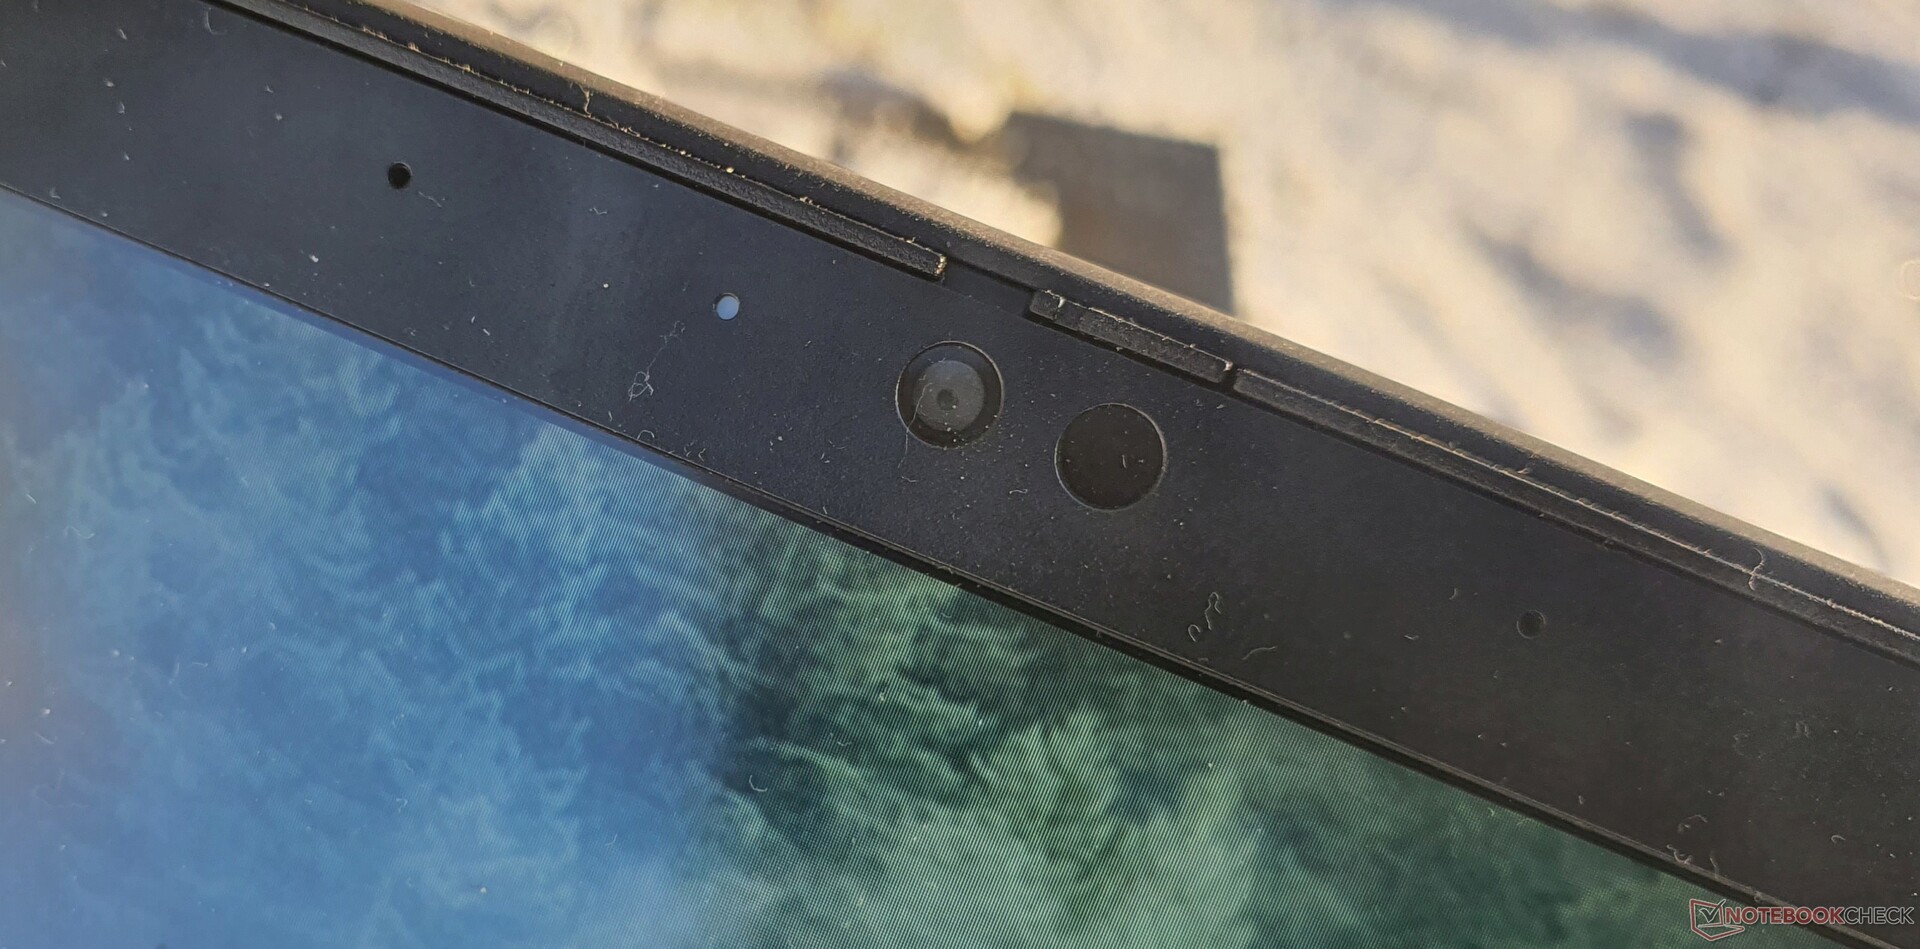
网络摄像头
1.080p的网络摄像头同 思考板T16英特尔.


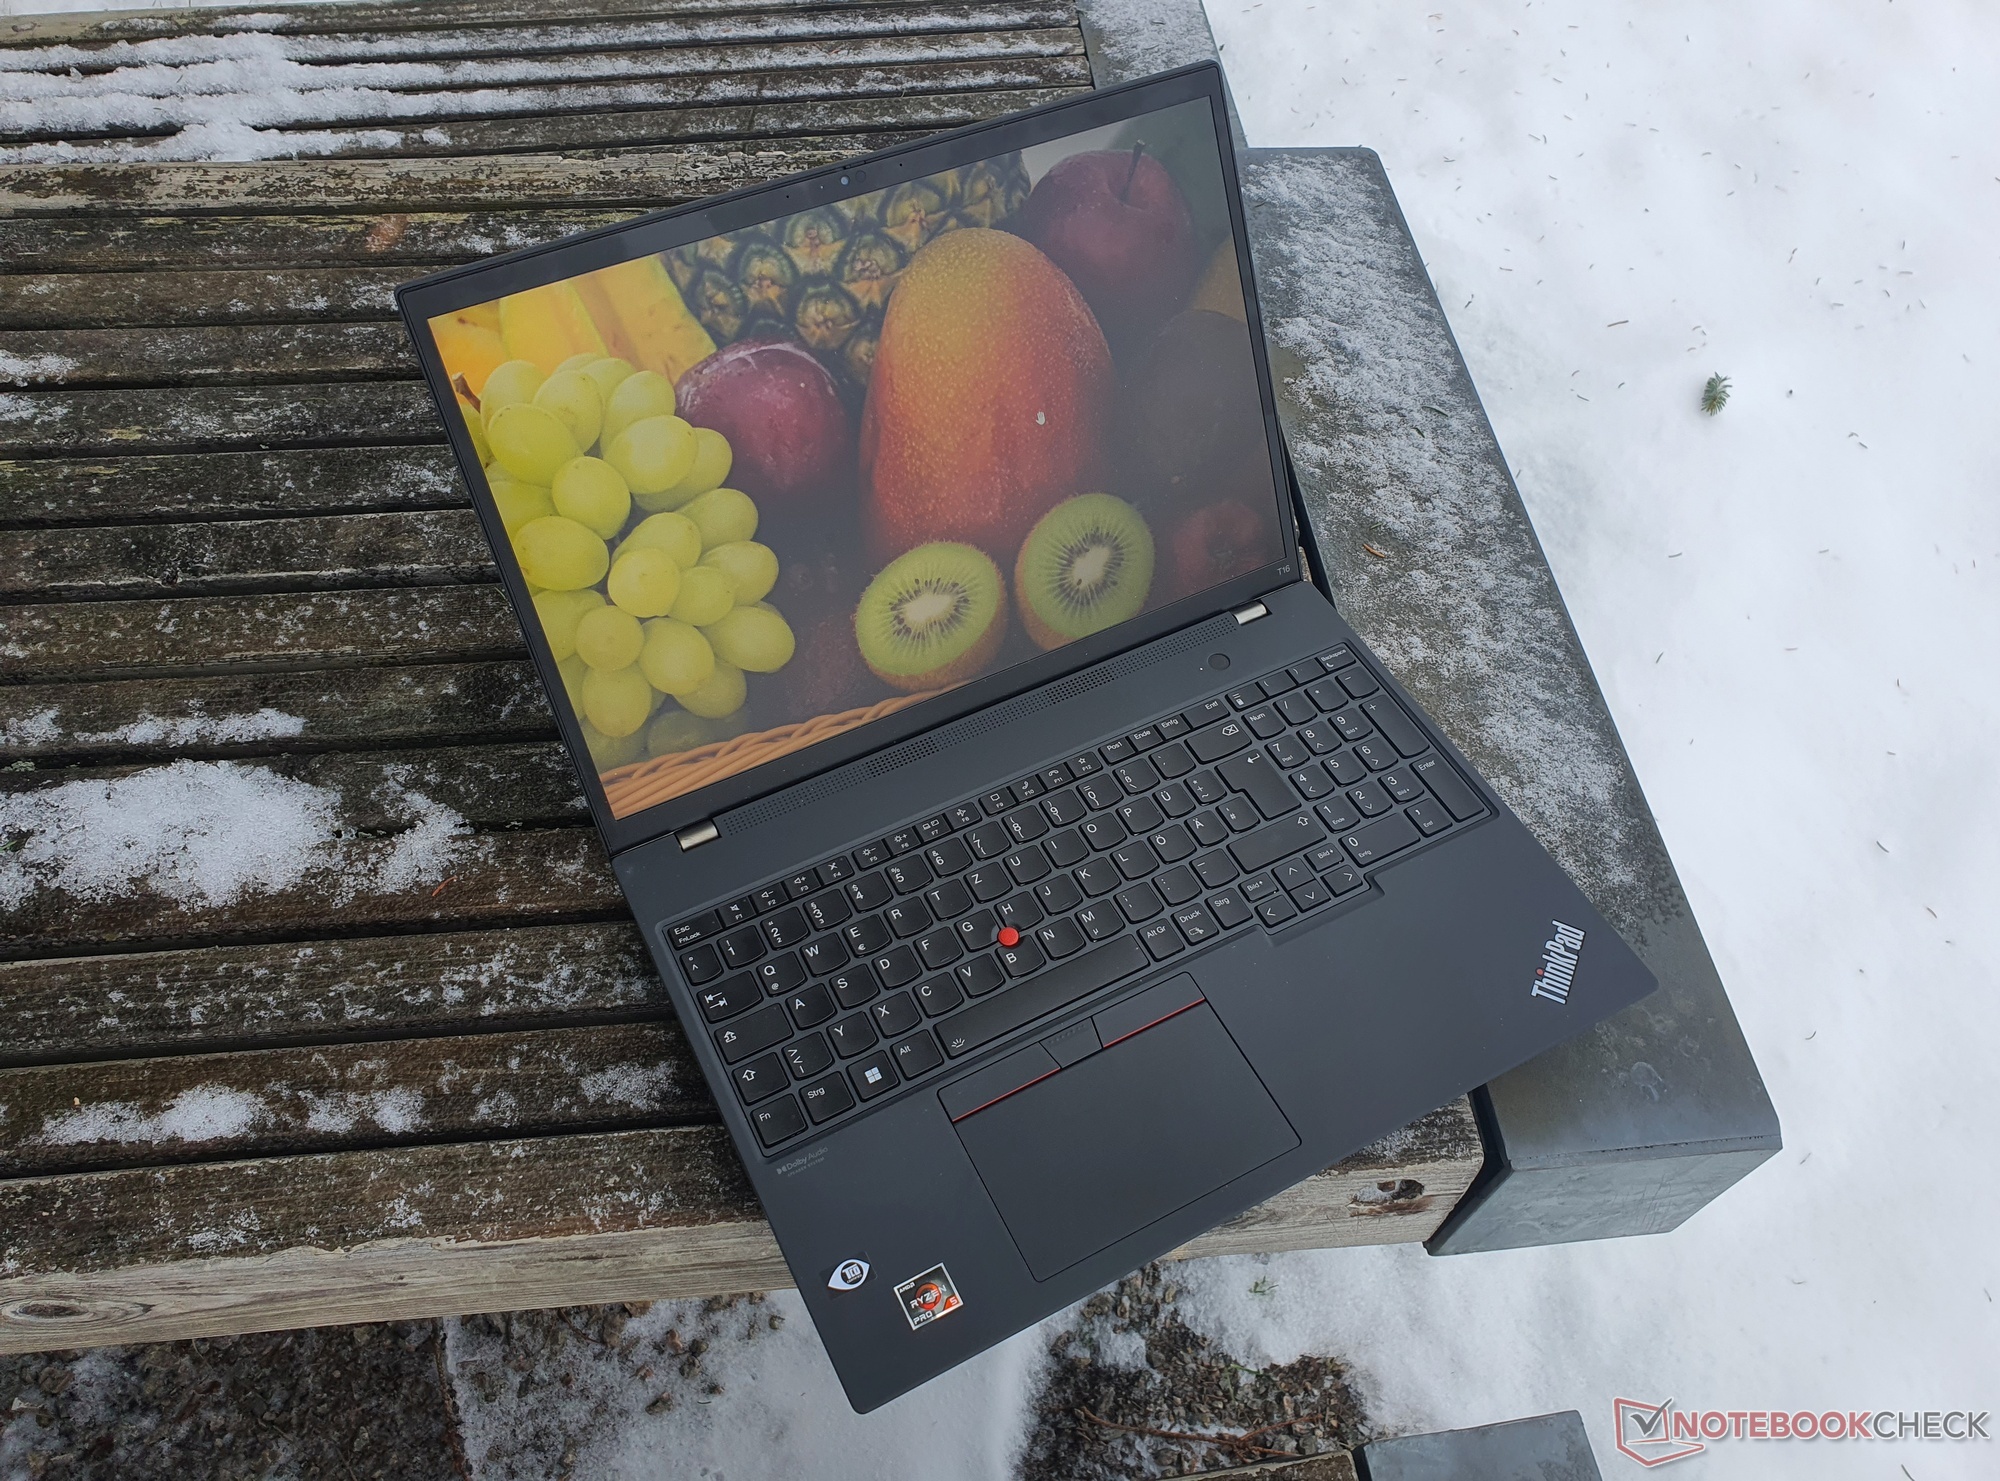
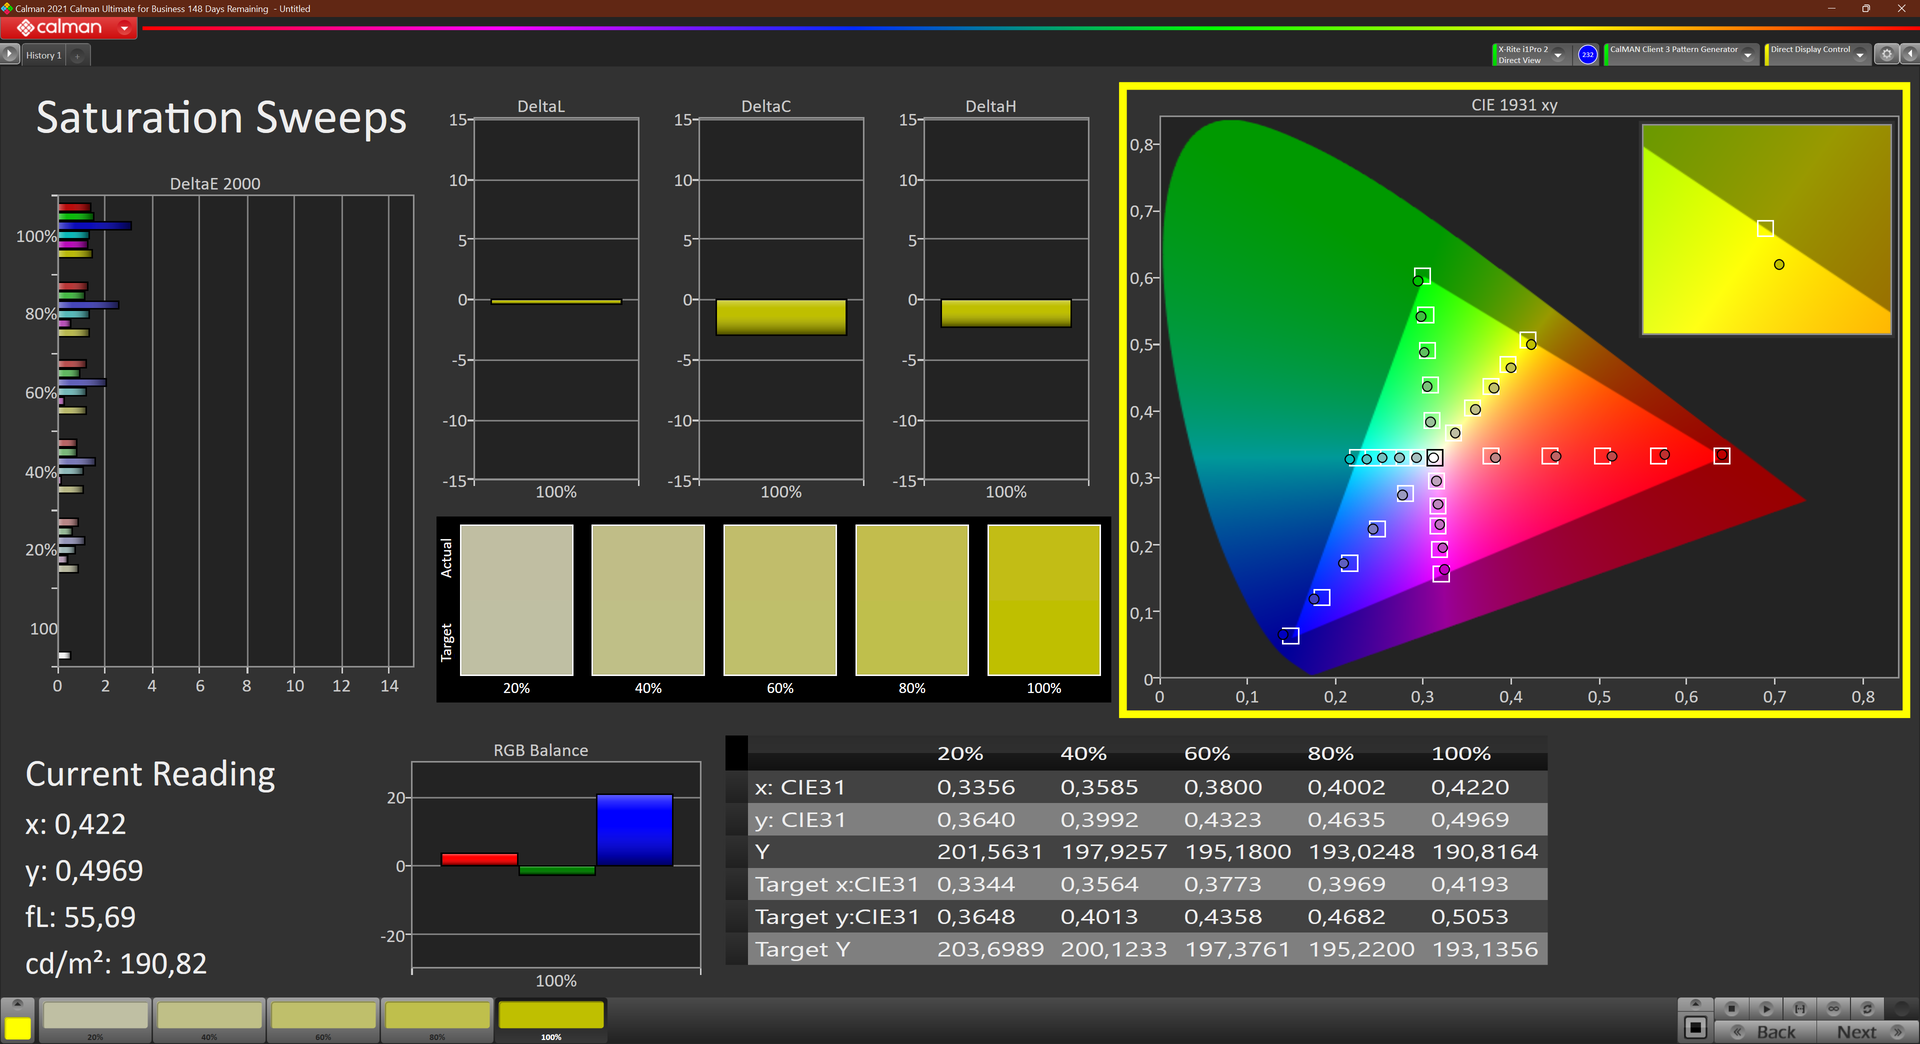
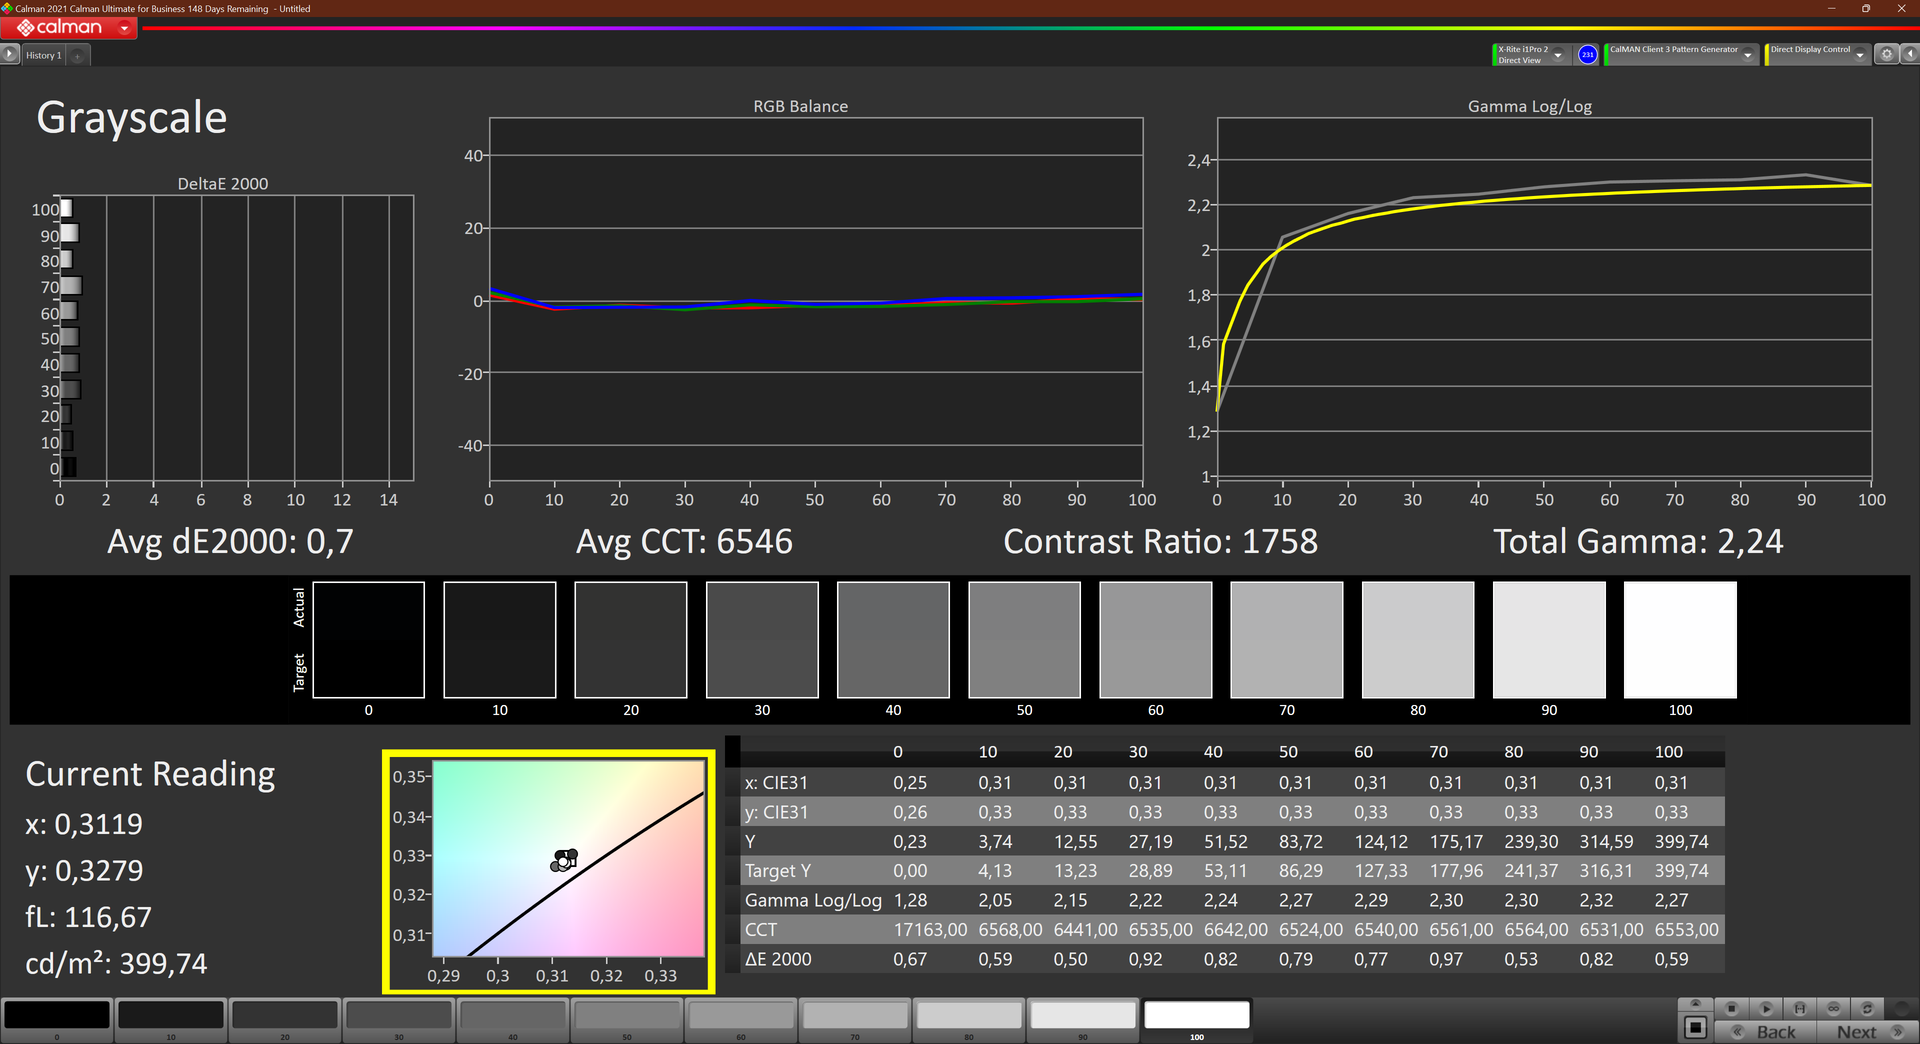
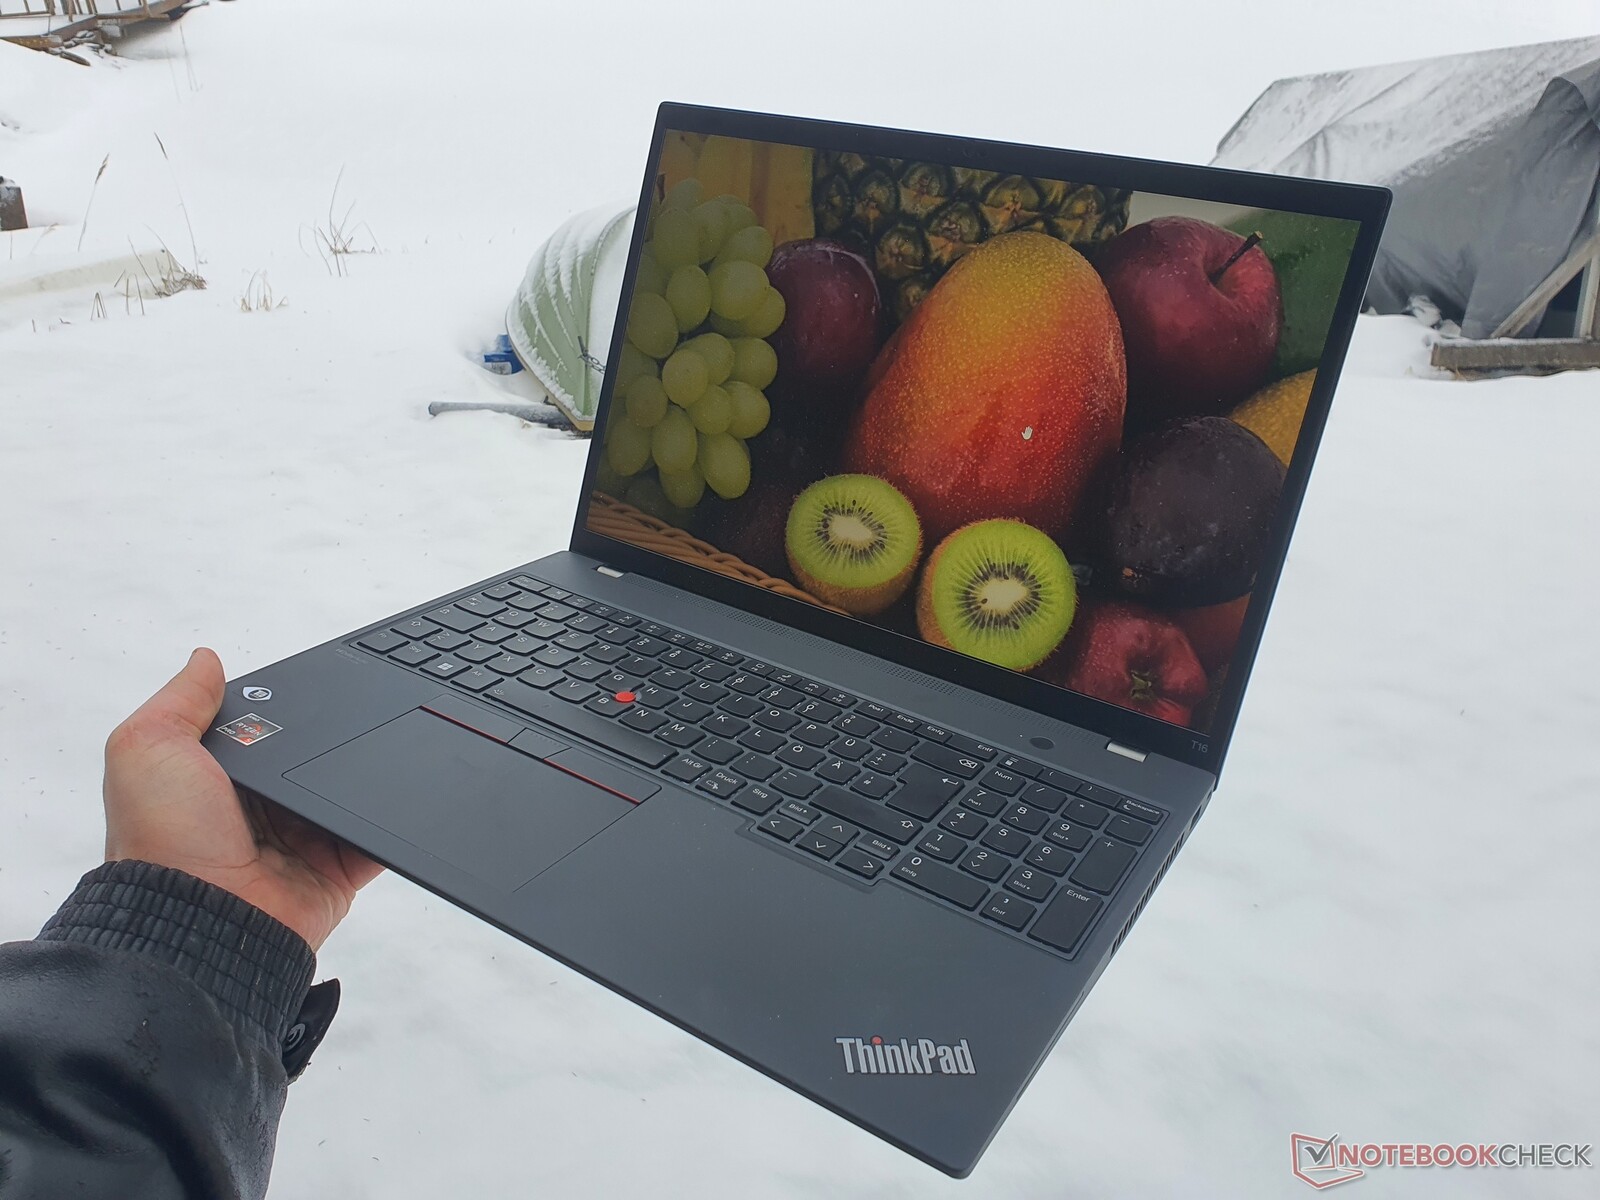
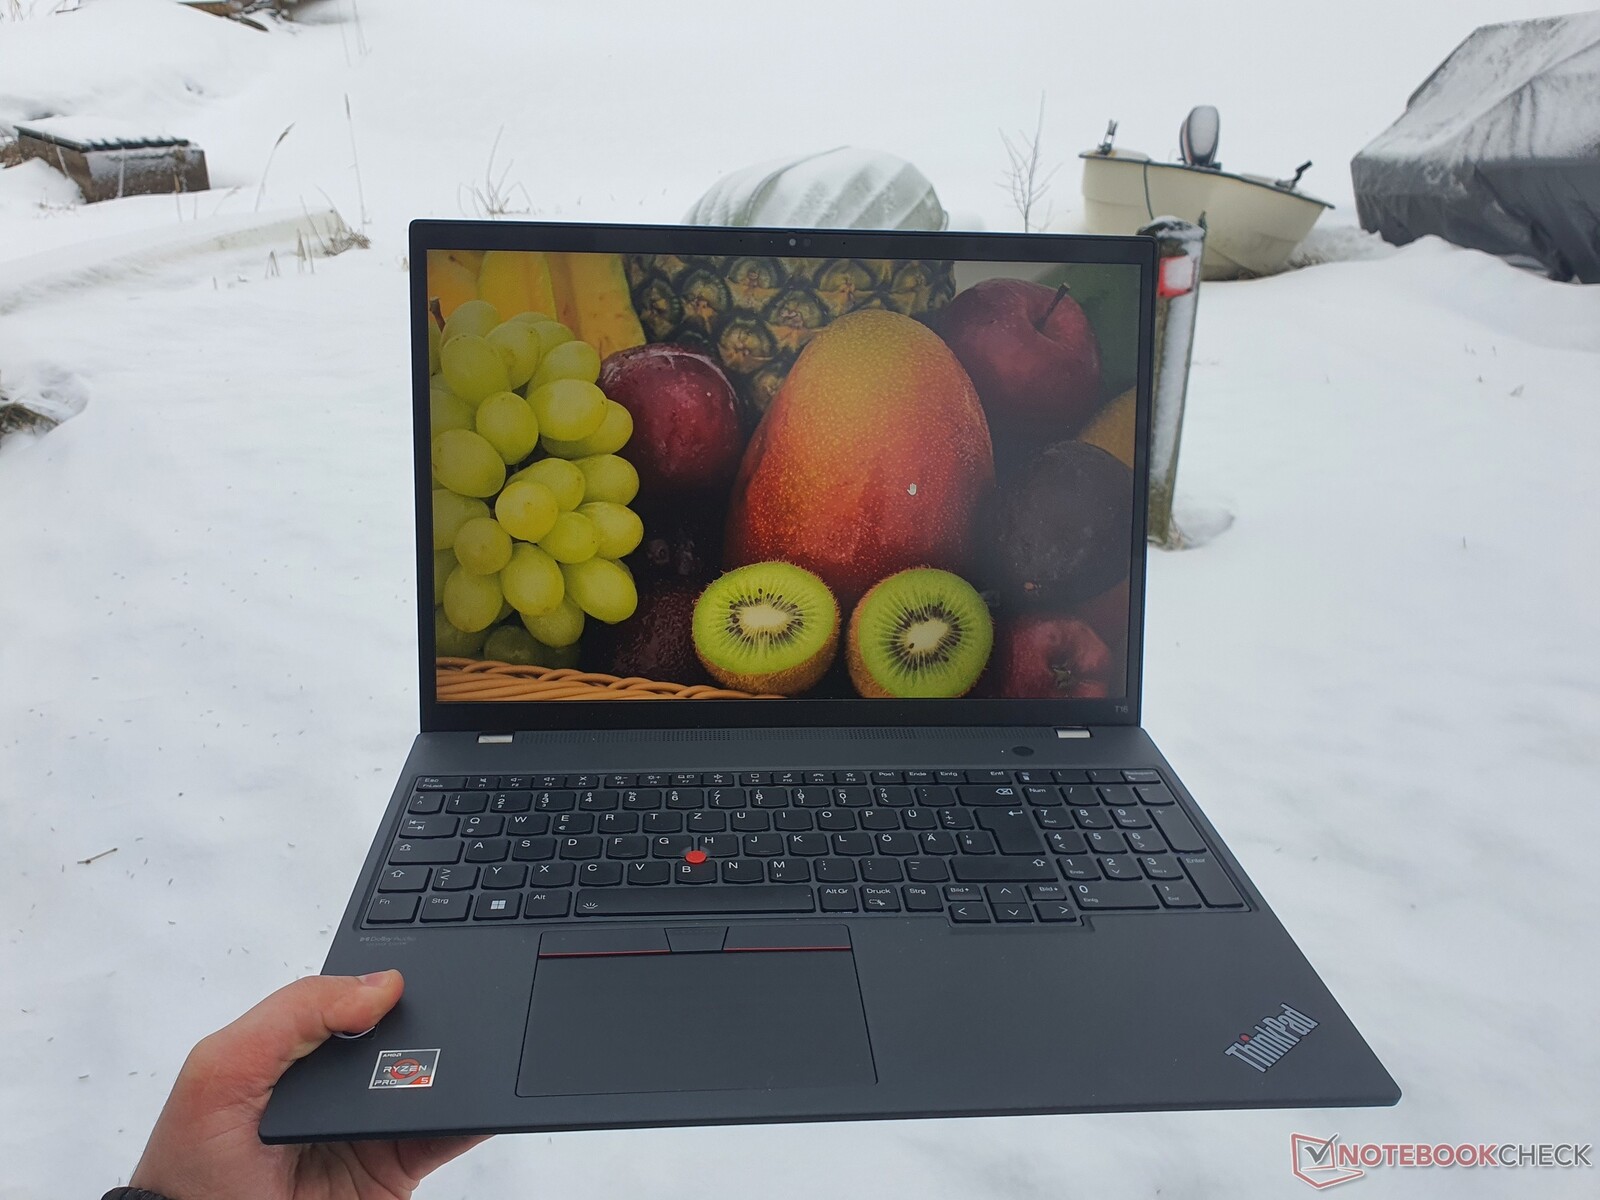
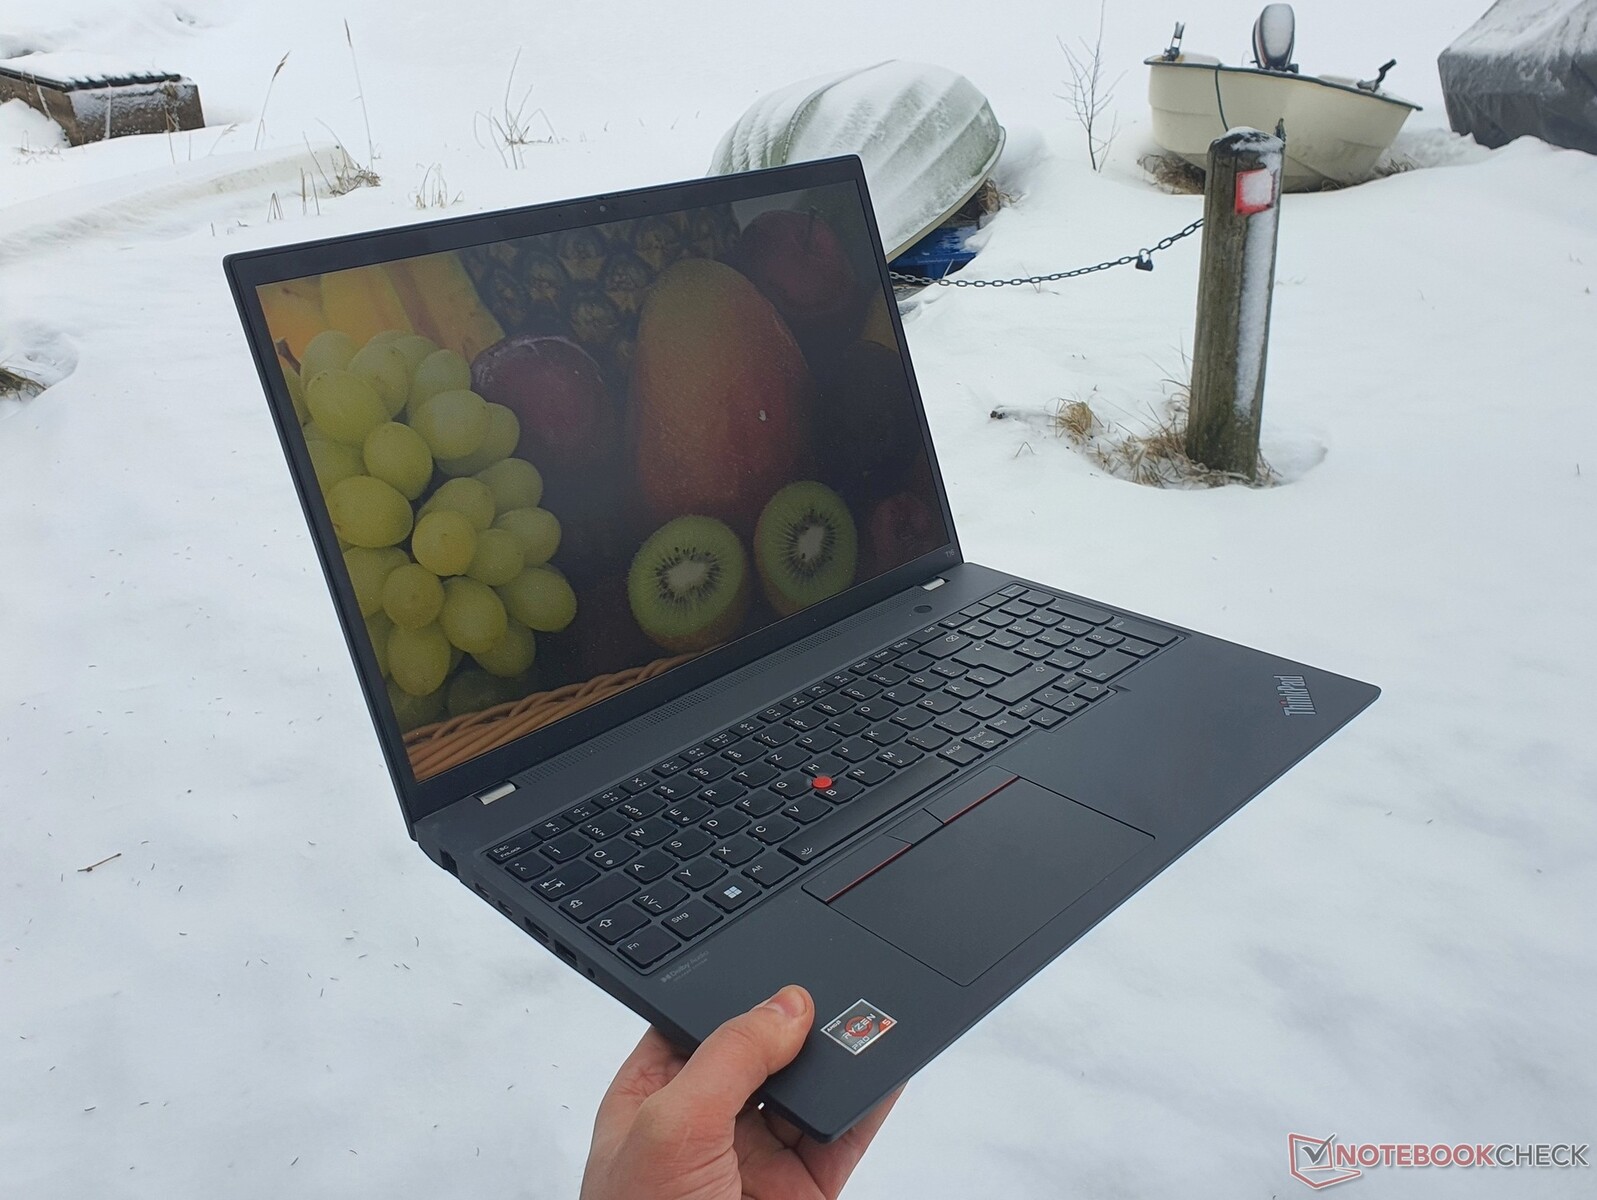
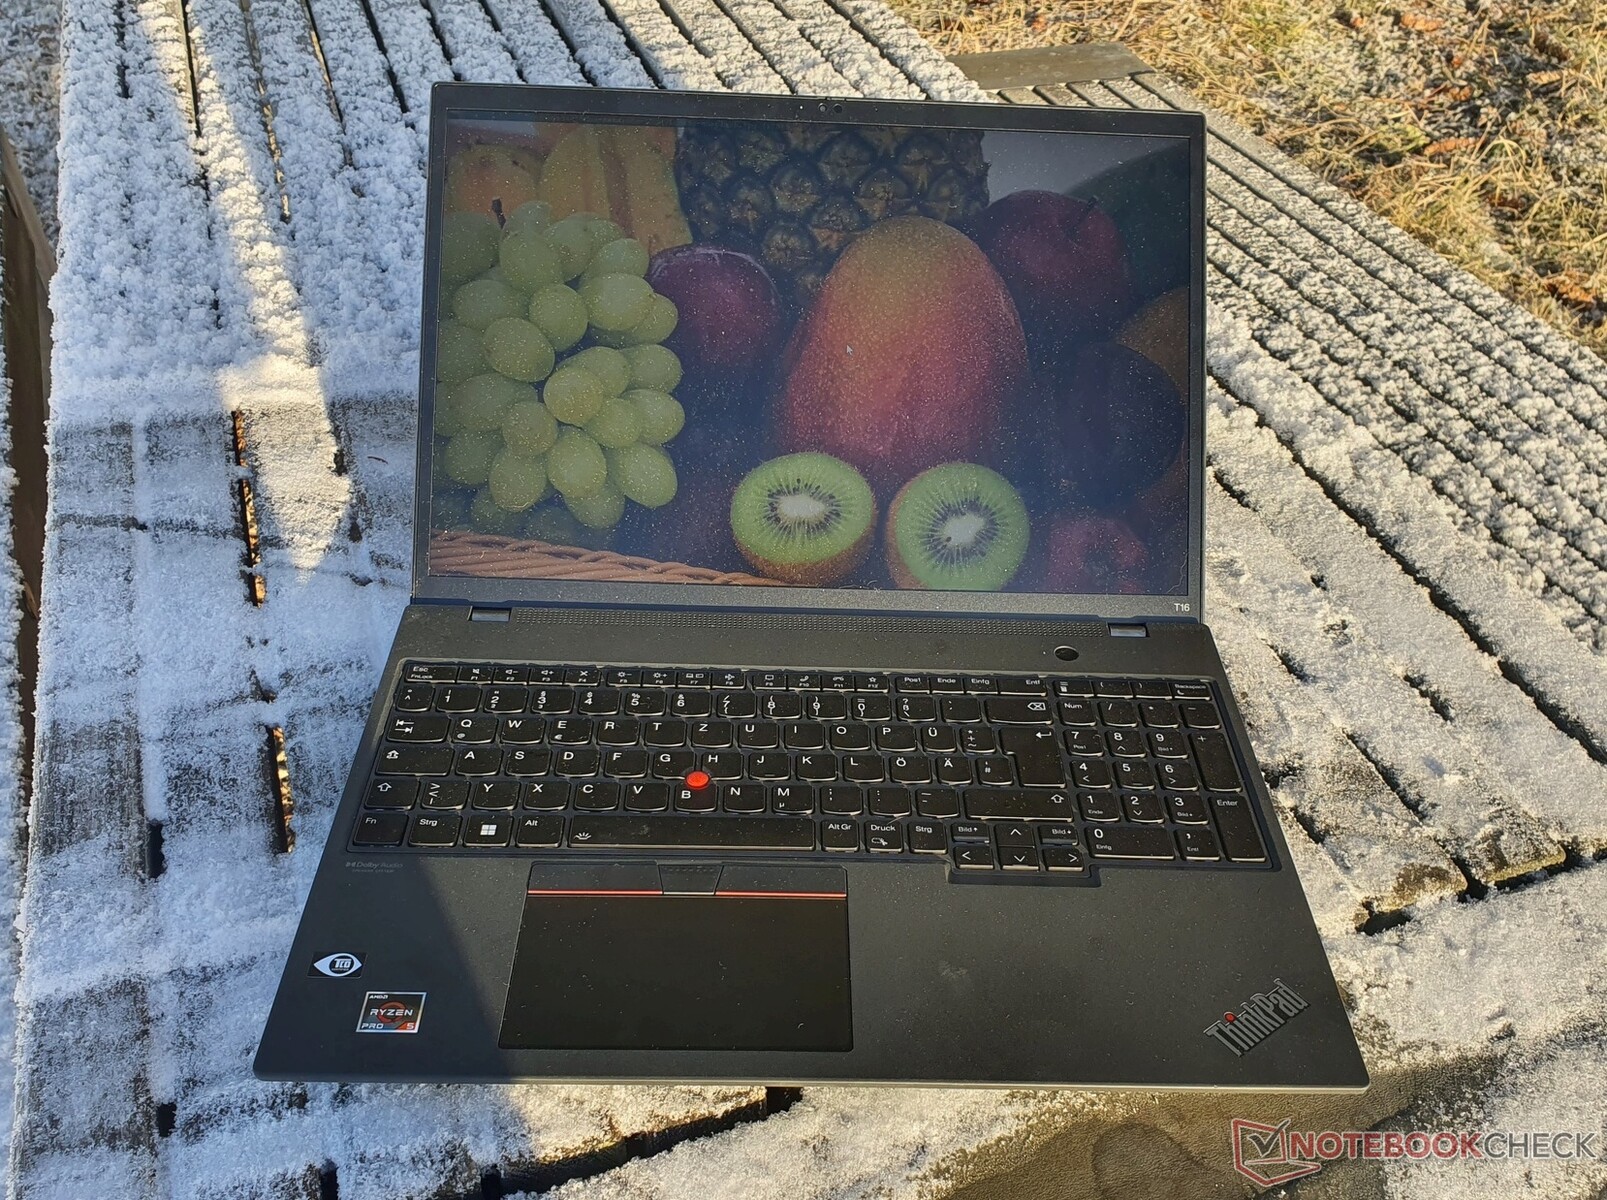
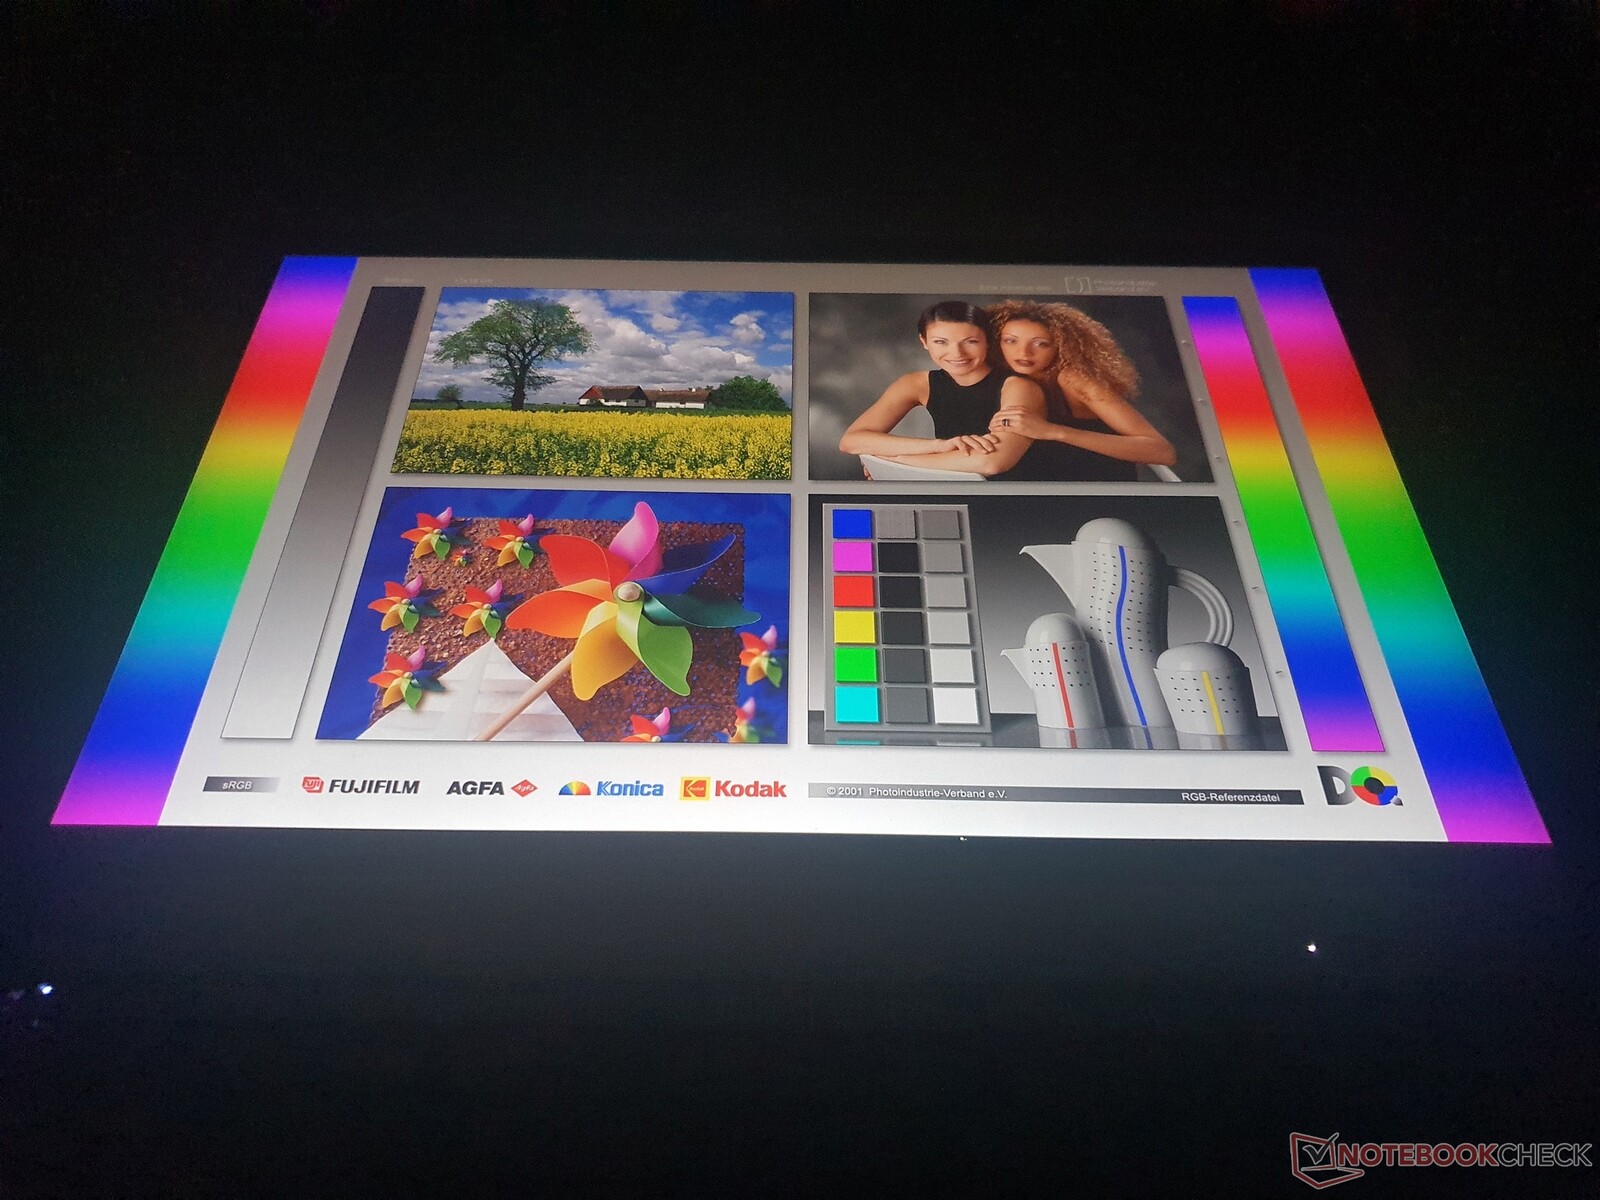
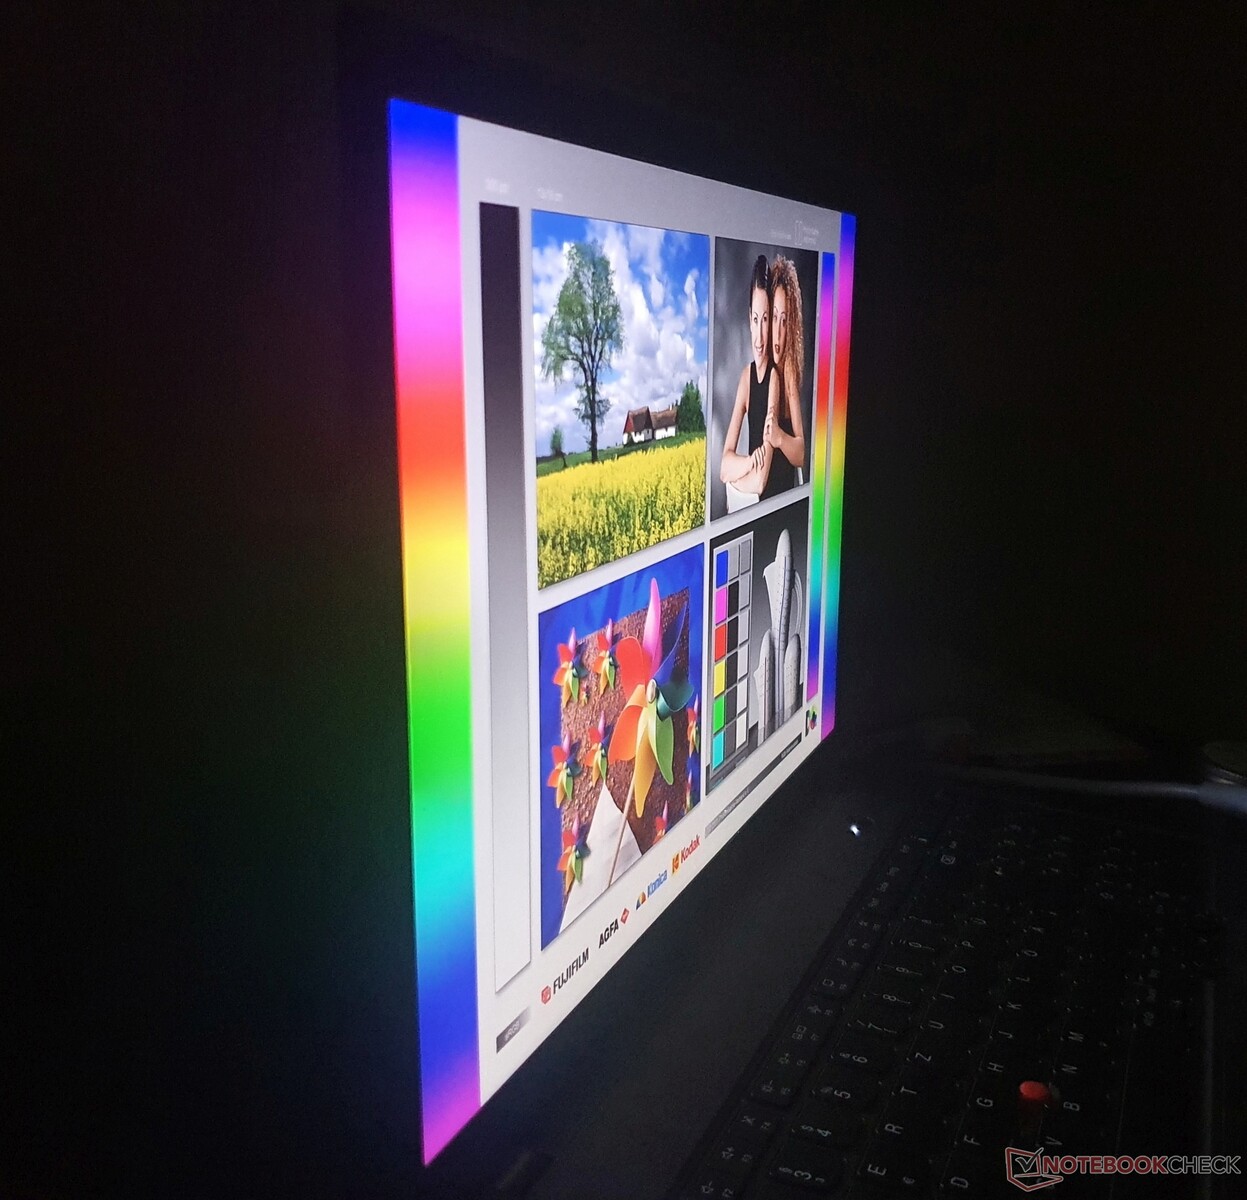
显示屏。ThinkPad T16的对比度丰富,亮度高,分辨率高。
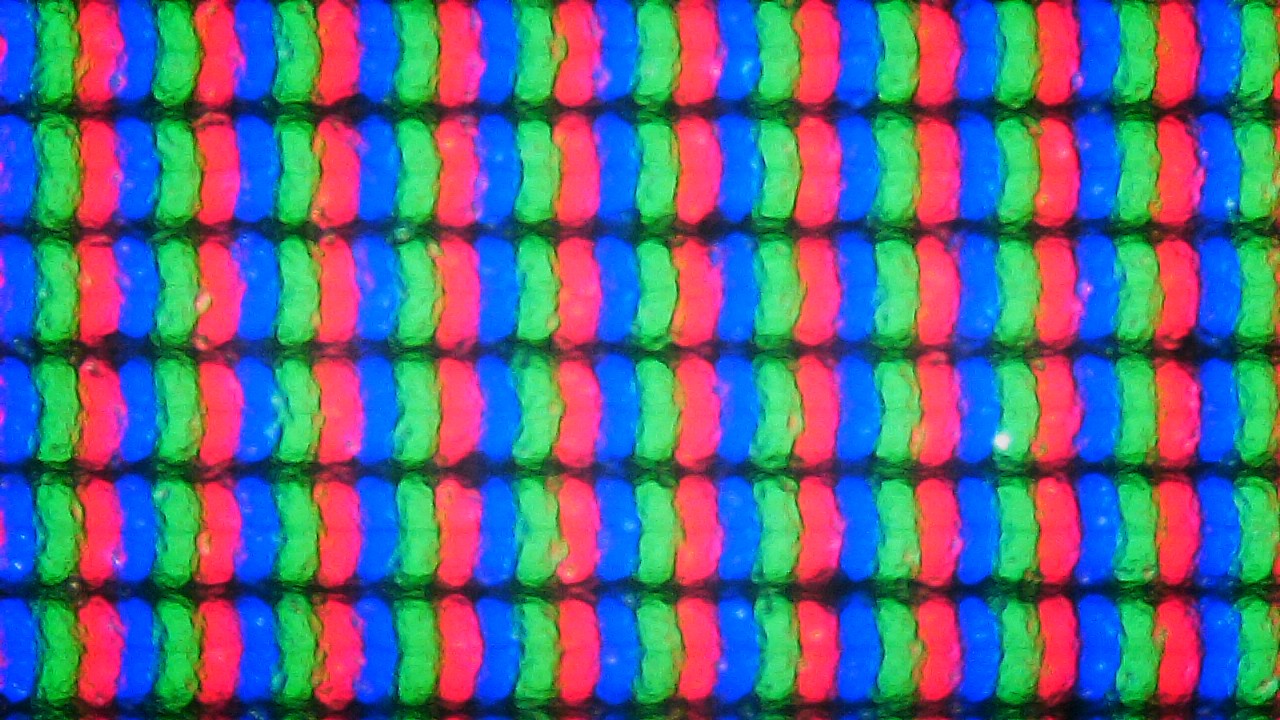

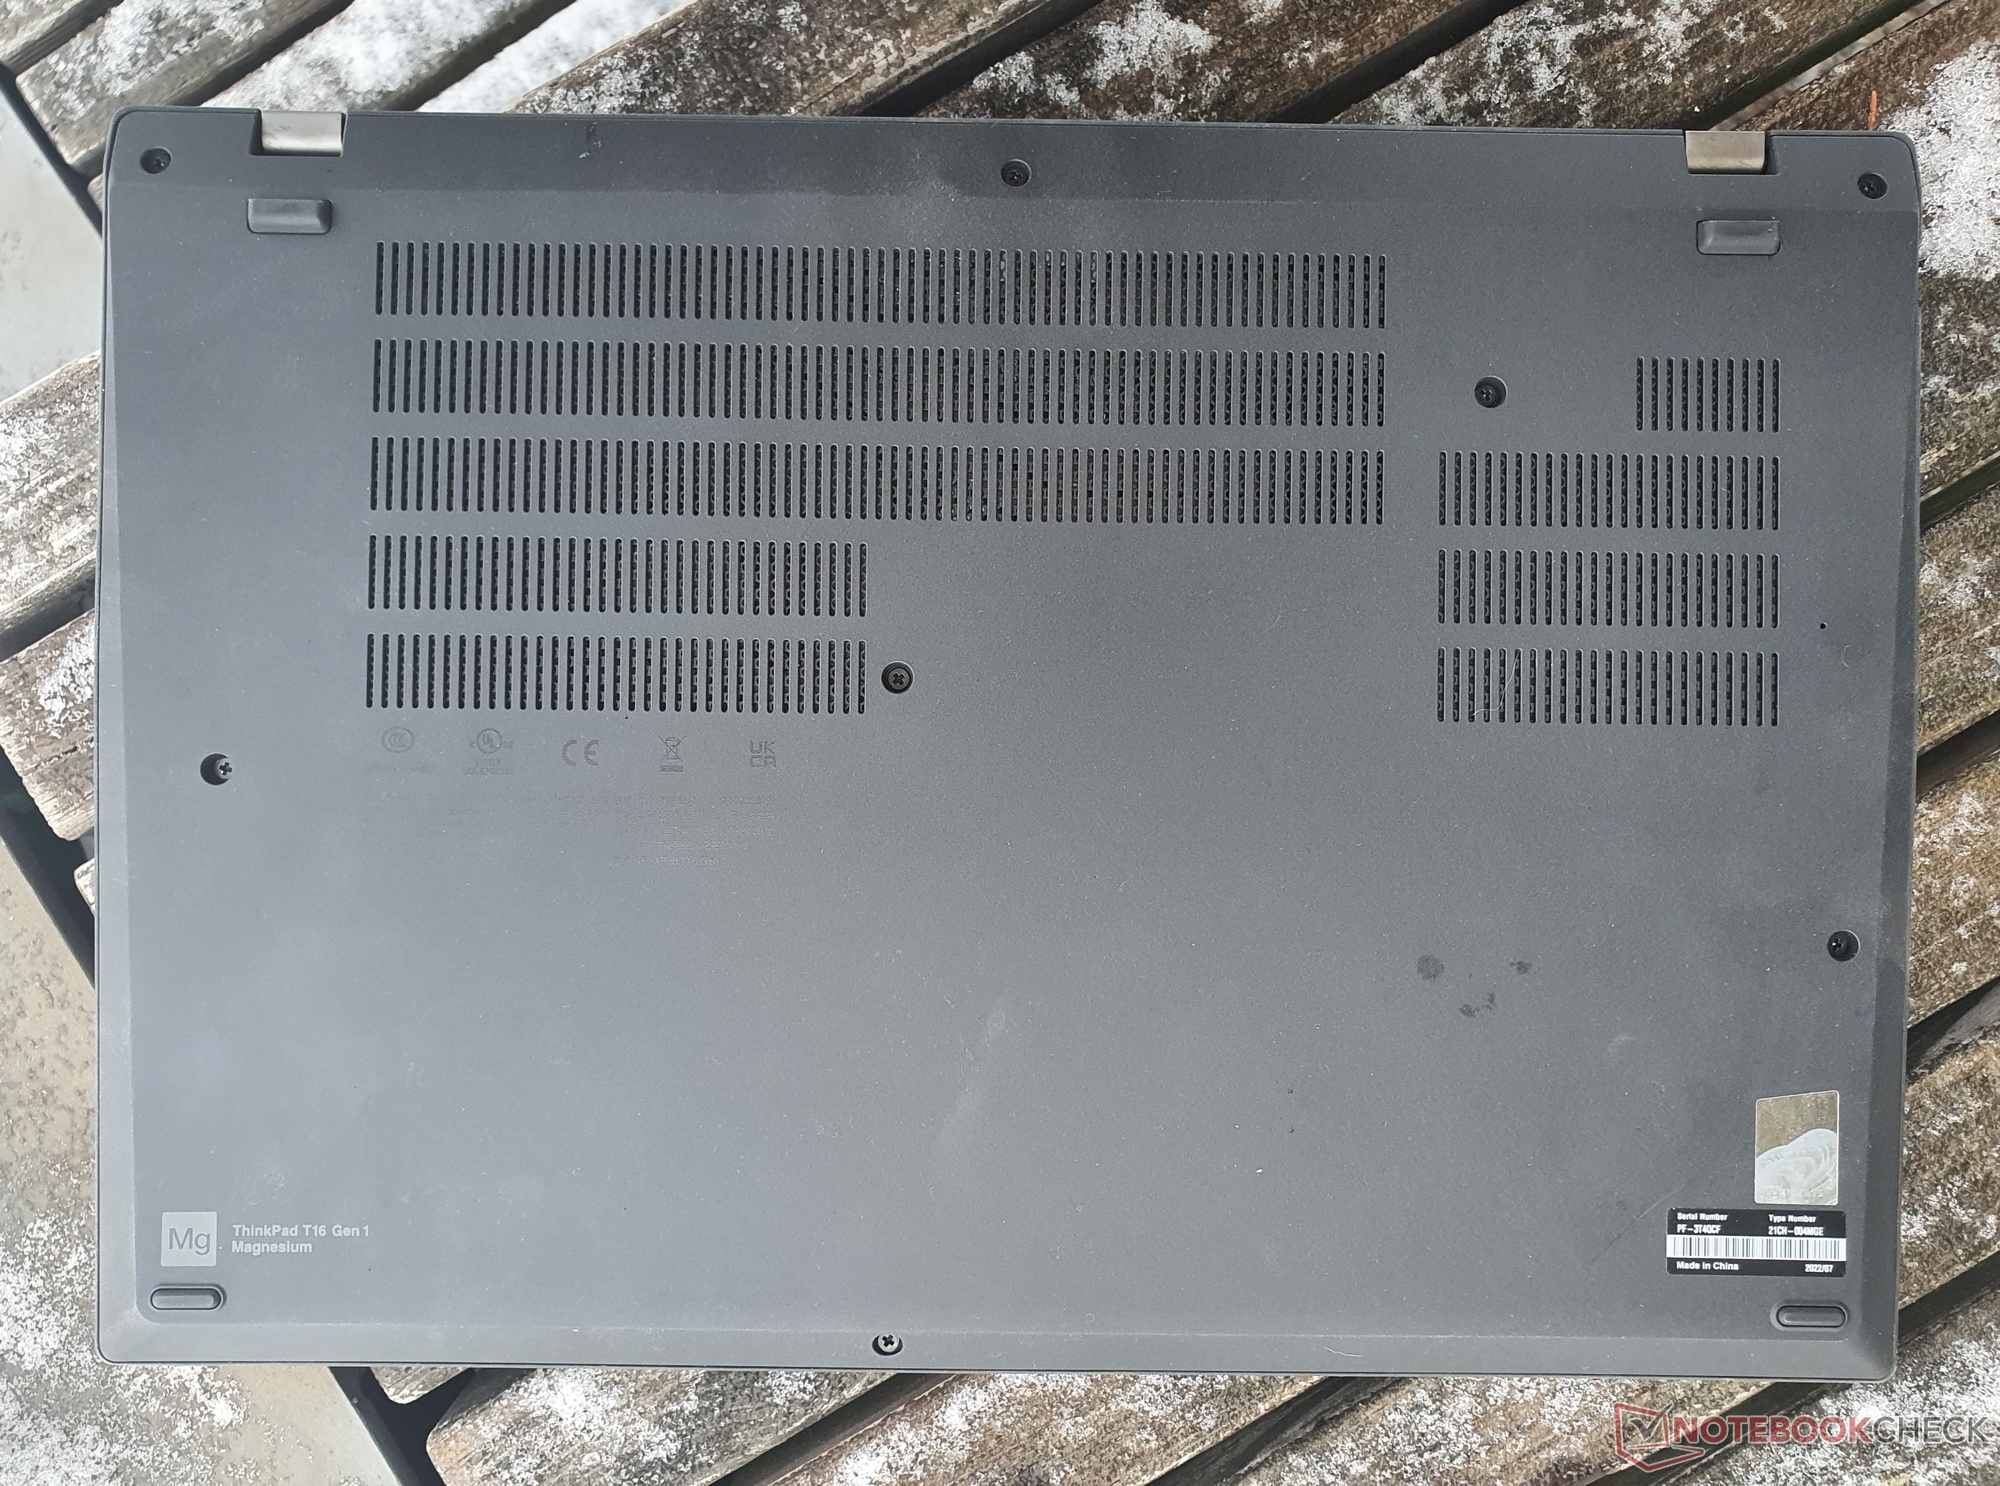
联想为我们的ThinkPad T16 AMD测试单元配备了一块来自CSOT的16英寸无光泽IPS面板,分辨率为2,560 x 1,600像素,格式为16:10。
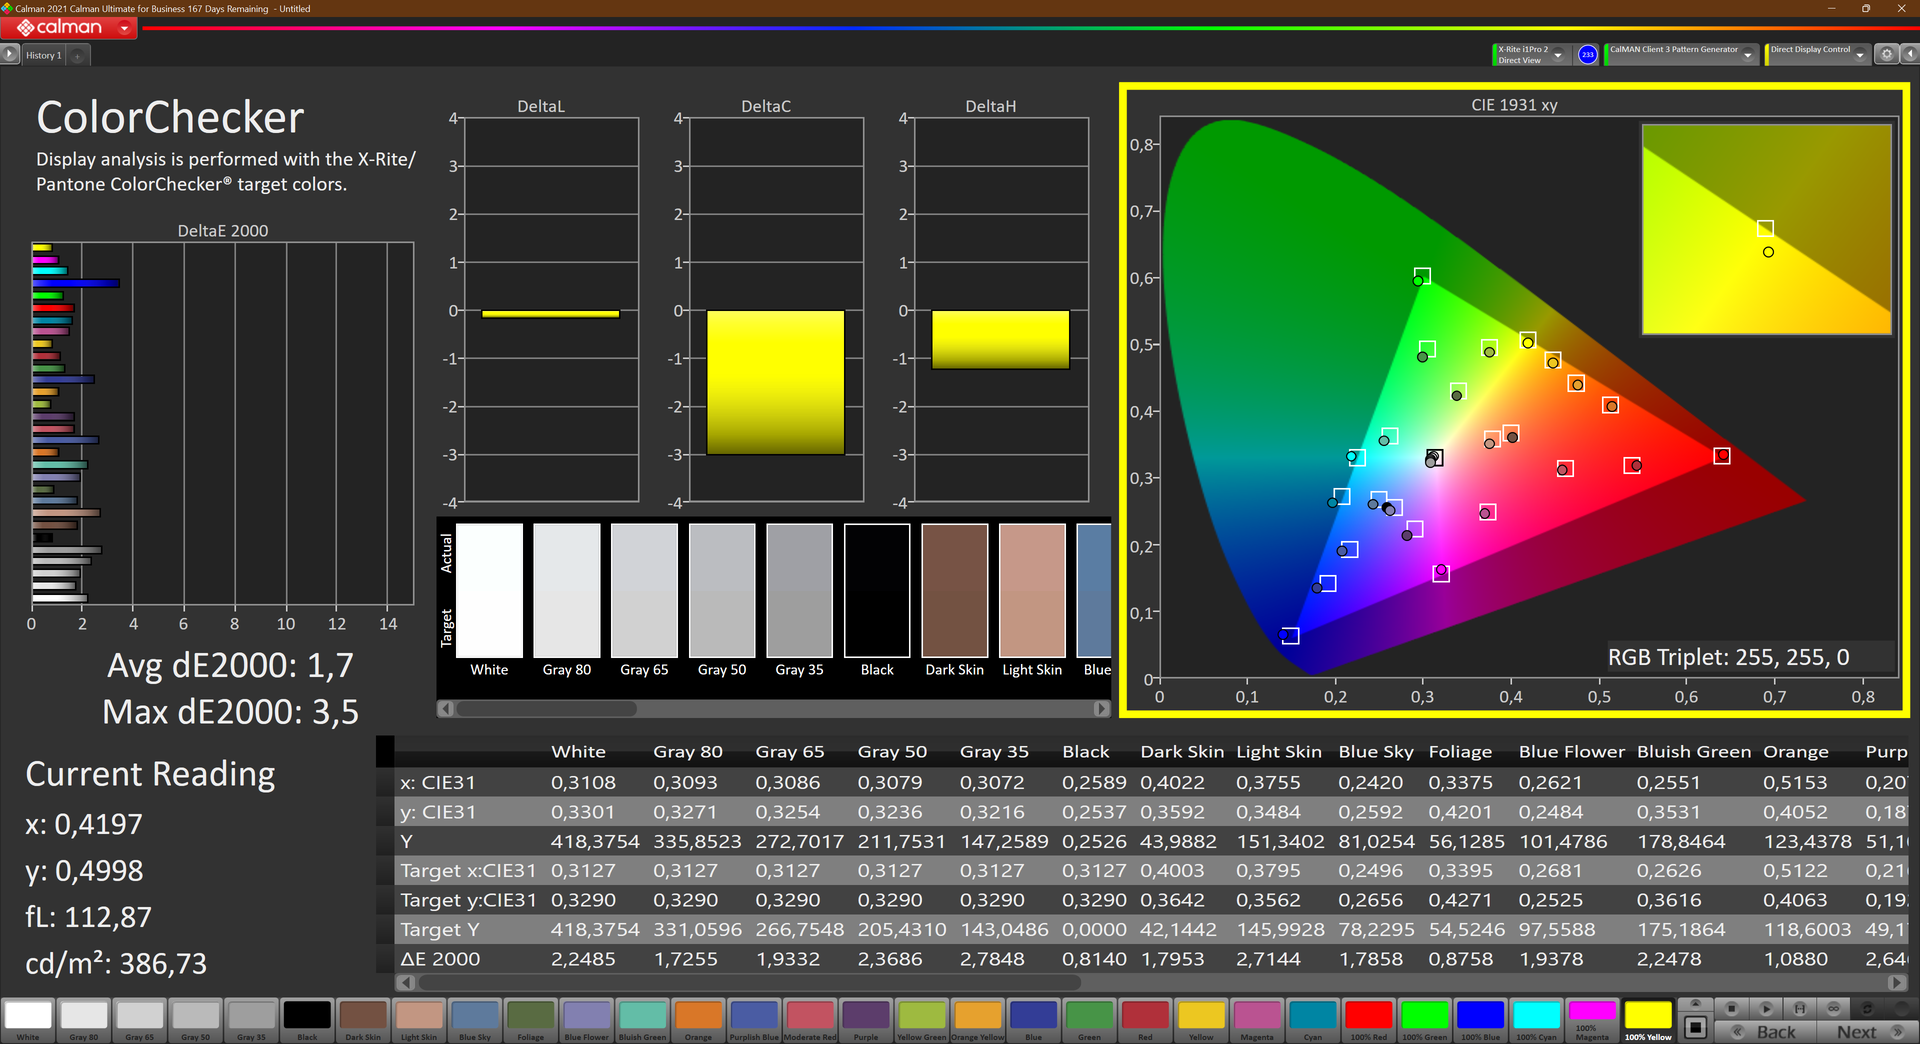
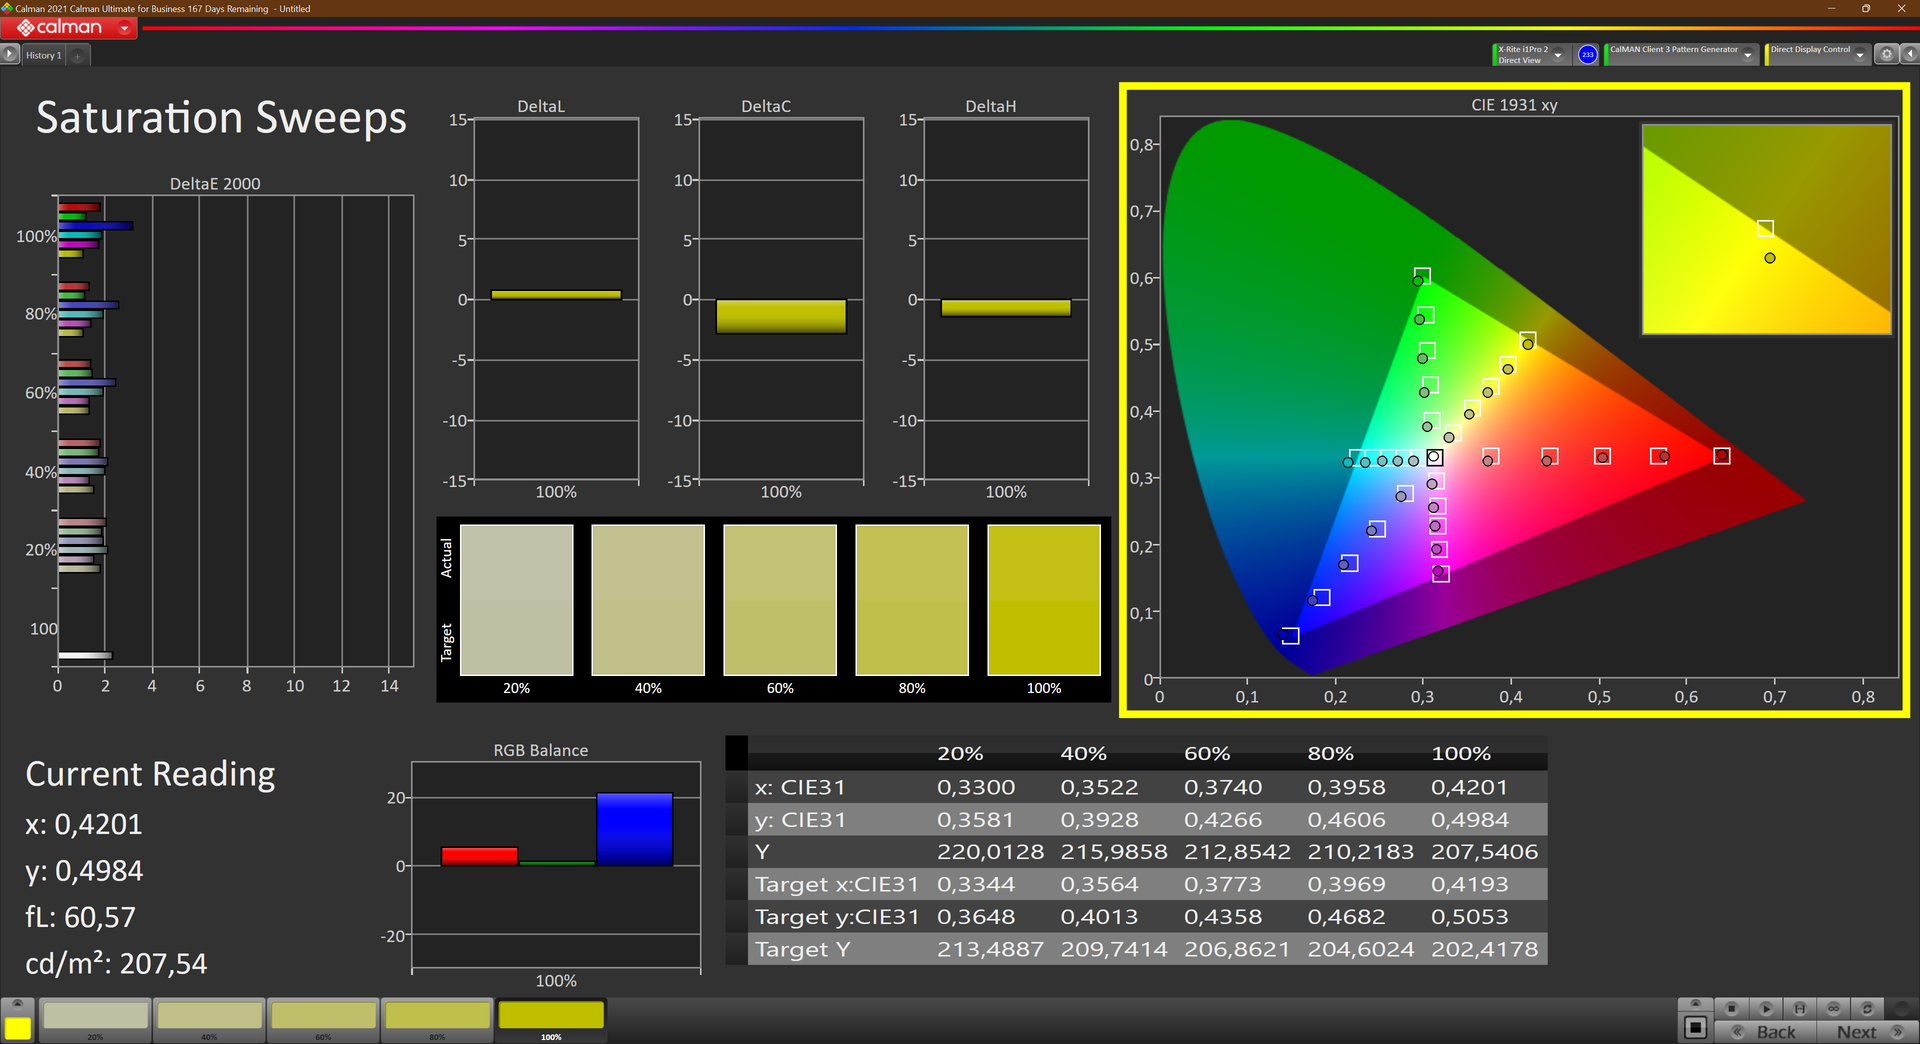
与ThinkPad T16 Intel 的WUXGA面板相比,这块显示屏不是所谓的 "低功耗LCD"。这两块面板的测量值相当相似,主要留下了WQXGA面板更好的校准,以突出交付状态,但我们也注意到色彩空间覆盖率略低。
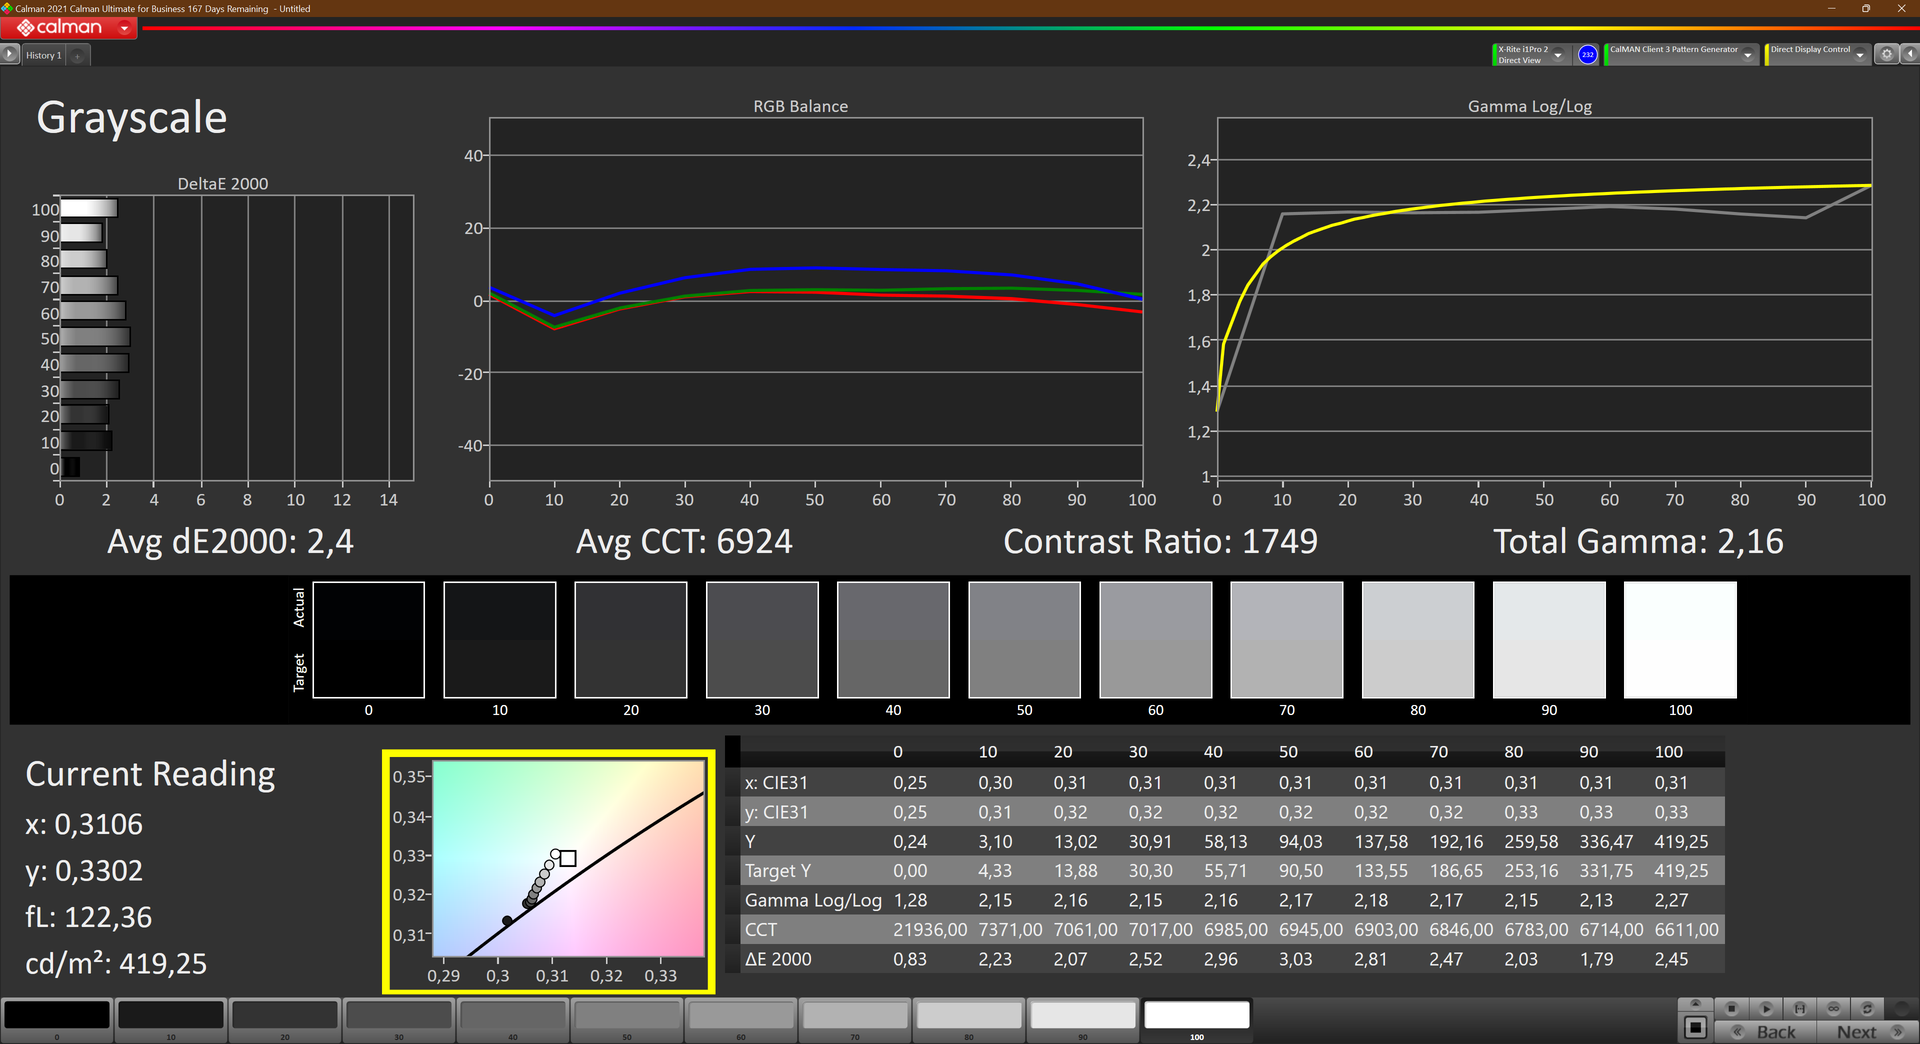
亮度也相同,为388 cd/m²,但我们测量的对比度更高,为1738:1,黑值略低,为0.24 cd/m²。这使得黑色显得非常饱和,而图像质量总体看起来非常好,与FHD+低功耗面板的主观差异似乎不是很明显。
| |||||||||||||||||||||||||
Brightness Distribution: 81 %
Center on Battery: 417 cd/m²
Contrast: 1738:1 (Black: 0.24 cd/m²)
ΔE ColorChecker Calman: 1.7 | ∀{0.5-29.43 Ø4.71}
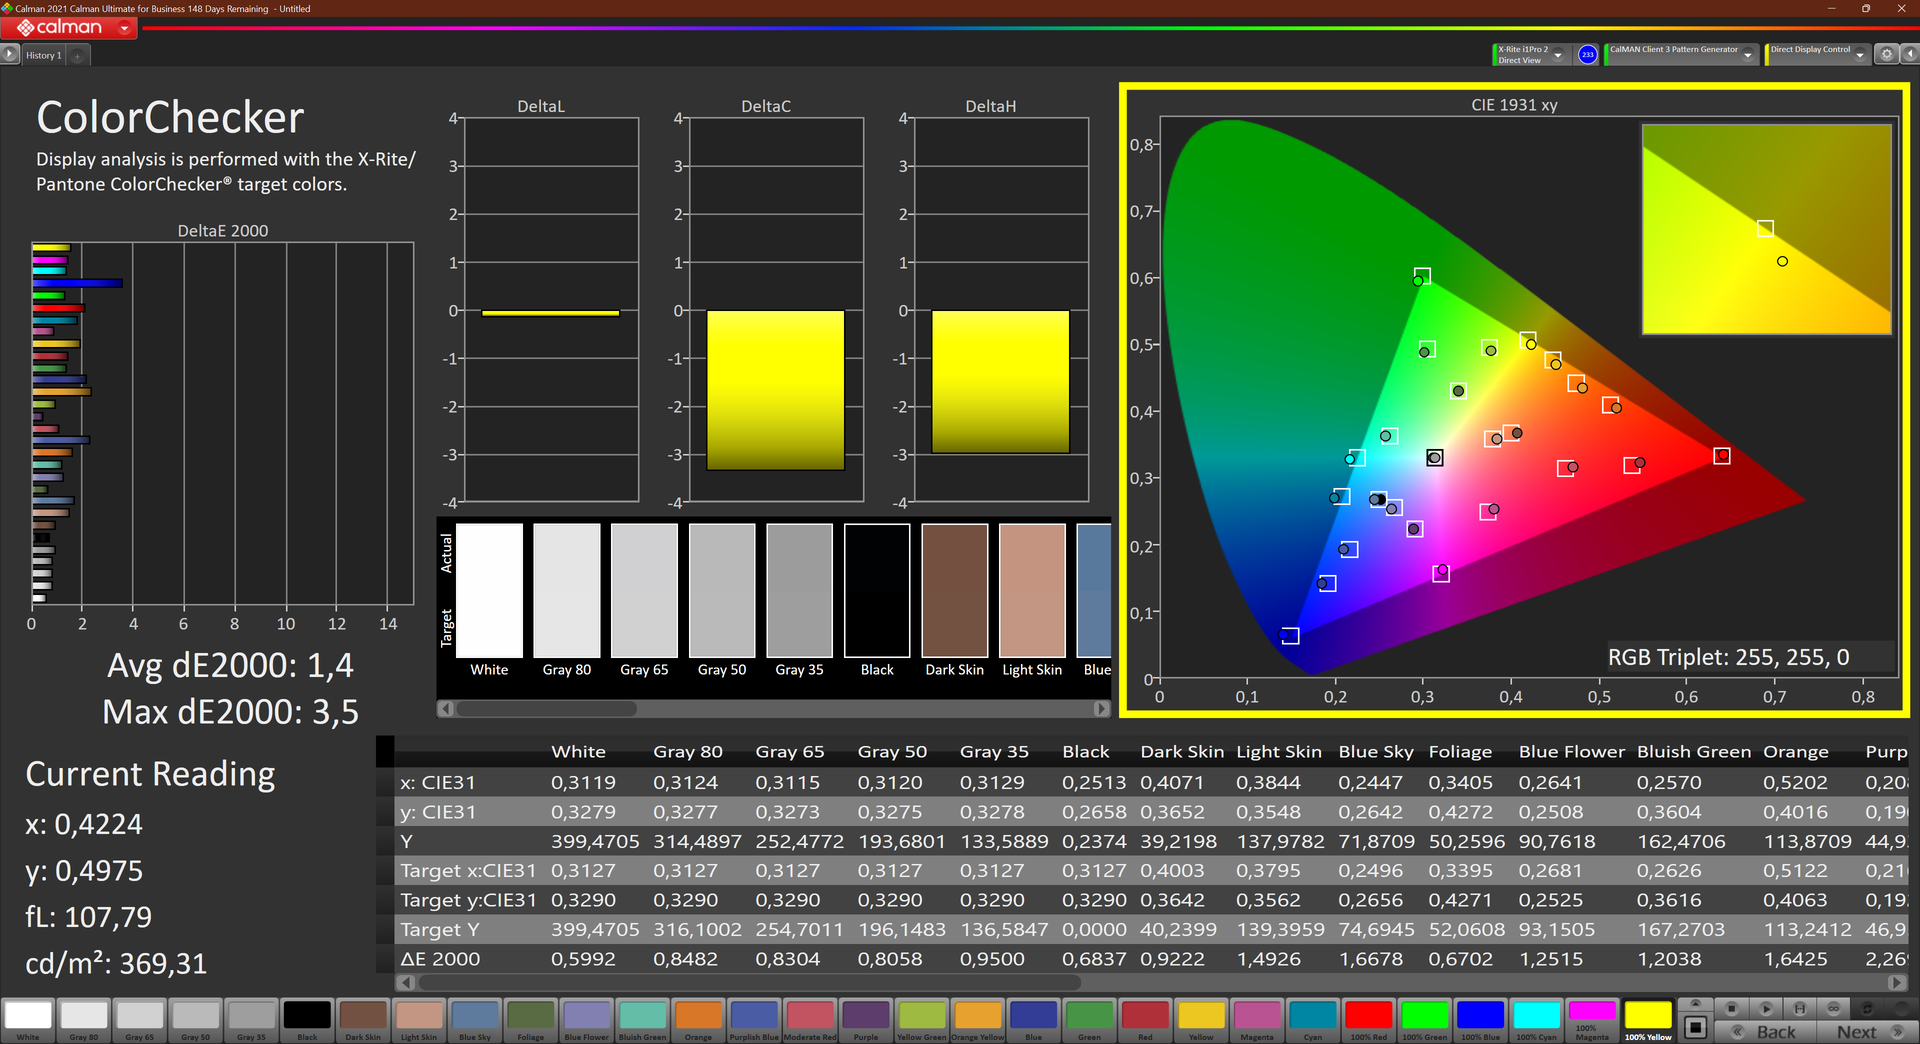
calibrated: 1.4
ΔE Greyscale Calman: 2.4 | ∀{0.09-98 Ø4.96}
69.1% AdobeRGB 1998 (Argyll 3D)
95.7% sRGB (Argyll 3D)
66.7% Display P3 (Argyll 3D)
Gamma: 2.16
CCT: 6924 K
| Lenovo ThinkPad T16 G1 21CH004MGE MNG007DA1-C, IPS-LED, 2560x1600, 16" | Lenovo ThinkPad T16 G1 21BWS00200 B160UAN01.K, IPS, 1920x1200, 16" | HP EliteBook 865 G9 X160NV42, IPS, 1920x1200, 16" | Lenovo ThinkPad Z16 G1 21D5S00T00 NE160WUM-N62 , IPS LED, 1920x1200, 16" | Lenovo ThinkPad X1 Extreme G5-21DE003RGE LP160UQ1-SPB1, IPS, 3840x2400, 16" | Lenovo ThinkPad P15v G2 21A9000XGE N156HCA-EAC, IPS LED, 1920x1080, 15.6" | HP ZBook Power 15 G9 6B8C4EA LGD073F, IPS, 3840x2160, 15.6" | |
|---|---|---|---|---|---|---|---|
| Display | 13% | 6% | 4% | 24% | -33% | 2% | |
| Display P3 Coverage (%) | 66.7 | 80.1 20% | 71.4 7% | 70 5% | 84.6 27% | 43.7 -34% | 69.1 4% |
| sRGB Coverage (%) | 95.7 | 100 4% | 99.3 4% | 99.7 4% | 99.2 4% | 65.1 -32% | 97.7 2% |
| AdobeRGB 1998 Coverage (%) | 69.1 | 80.5 16% | 73.2 6% | 72.1 4% | 97.7 41% | 45.3 -34% | 69.6 1% |
| Response Times | 13% | -18% | -29% | -23% | -49% | -47% | |
| Response Time Grey 50% / Grey 80% * (ms) | 32.1 ? | 27 ? 16% | 35.5 ? -11% | 40 ? -25% | 46 ? -43% | 48 ? -50% | 45.8 ? -43% |
| Response Time Black / White * (ms) | 18.9 ? | 17 ? 10% | 23.5 ? -24% | 25 ? -32% | 19.2 ? -2% | 28 ? -48% | 28.6 ? -51% |
| PWM Frequency (Hz) | 56.7 | ||||||
| Screen | -51% | 7% | 5% | -7% | -132% | -21% | |
| Brightness middle (cd/m²) | 417 | 404 -3% | 865 107% | 487 17% | 476 14% | 305 -27% | 392 -6% |
| Brightness (cd/m²) | 388 | 391 1% | 771 99% | 446 15% | 470 21% | 281 -28% | 388 0% |
| Brightness Distribution (%) | 81 | 80 -1% | 72 -11% | 83 2% | 90 11% | 88 9% | 88 9% |
| Black Level * (cd/m²) | 0.24 | 0.29 -21% | 0.3 -25% | 0.31 -29% | 0.35 -46% | 0.32 -33% | 0.15 37% |
| Contrast (:1) | 1738 | 1393 -20% | 2883 66% | 1571 -10% | 1360 -22% | 953 -45% | 2613 50% |
| Colorchecker dE 2000 * | 1.7 | 3.9 -129% | 2.4 -41% | 1.8 -6% | 1.9 -12% | 5.9 -247% | 3.2 -88% |
| Colorchecker dE 2000 max. * | 3.5 | 8.5 -143% | 5.8 -66% | 3.3 6% | 4.7 -34% | 20.1 -474% | 7 -100% |
| Colorchecker dE 2000 calibrated * | 1.4 | 1.7 -21% | 1.5 -7% | 0.8 43% | 1.3 7% | 4.5 -221% | 1.2 14% |
| Greyscale dE 2000 * | 2.4 | 5.4 -125% | 3.8 -58% | 2.3 4% | 2.4 -0% | 5.3 -121% | 4.9 -104% |
| Gamma | 2.16 102% | 2.21 100% | 2.36 93% | 2.16 102% | 2.24 98% | 2.1 105% | 2.13 103% |
| CCT | 6924 94% | 6242 104% | 6922 94% | 6867 95% | 6377 102% | 6307 103% | 5982 109% |
| Total Average (Program / Settings) | -8% /
-28% | -2% /
3% | -7% /
-0% | -2% /
-2% | -71% /
-99% | -22% /
-20% |
* ... smaller is better
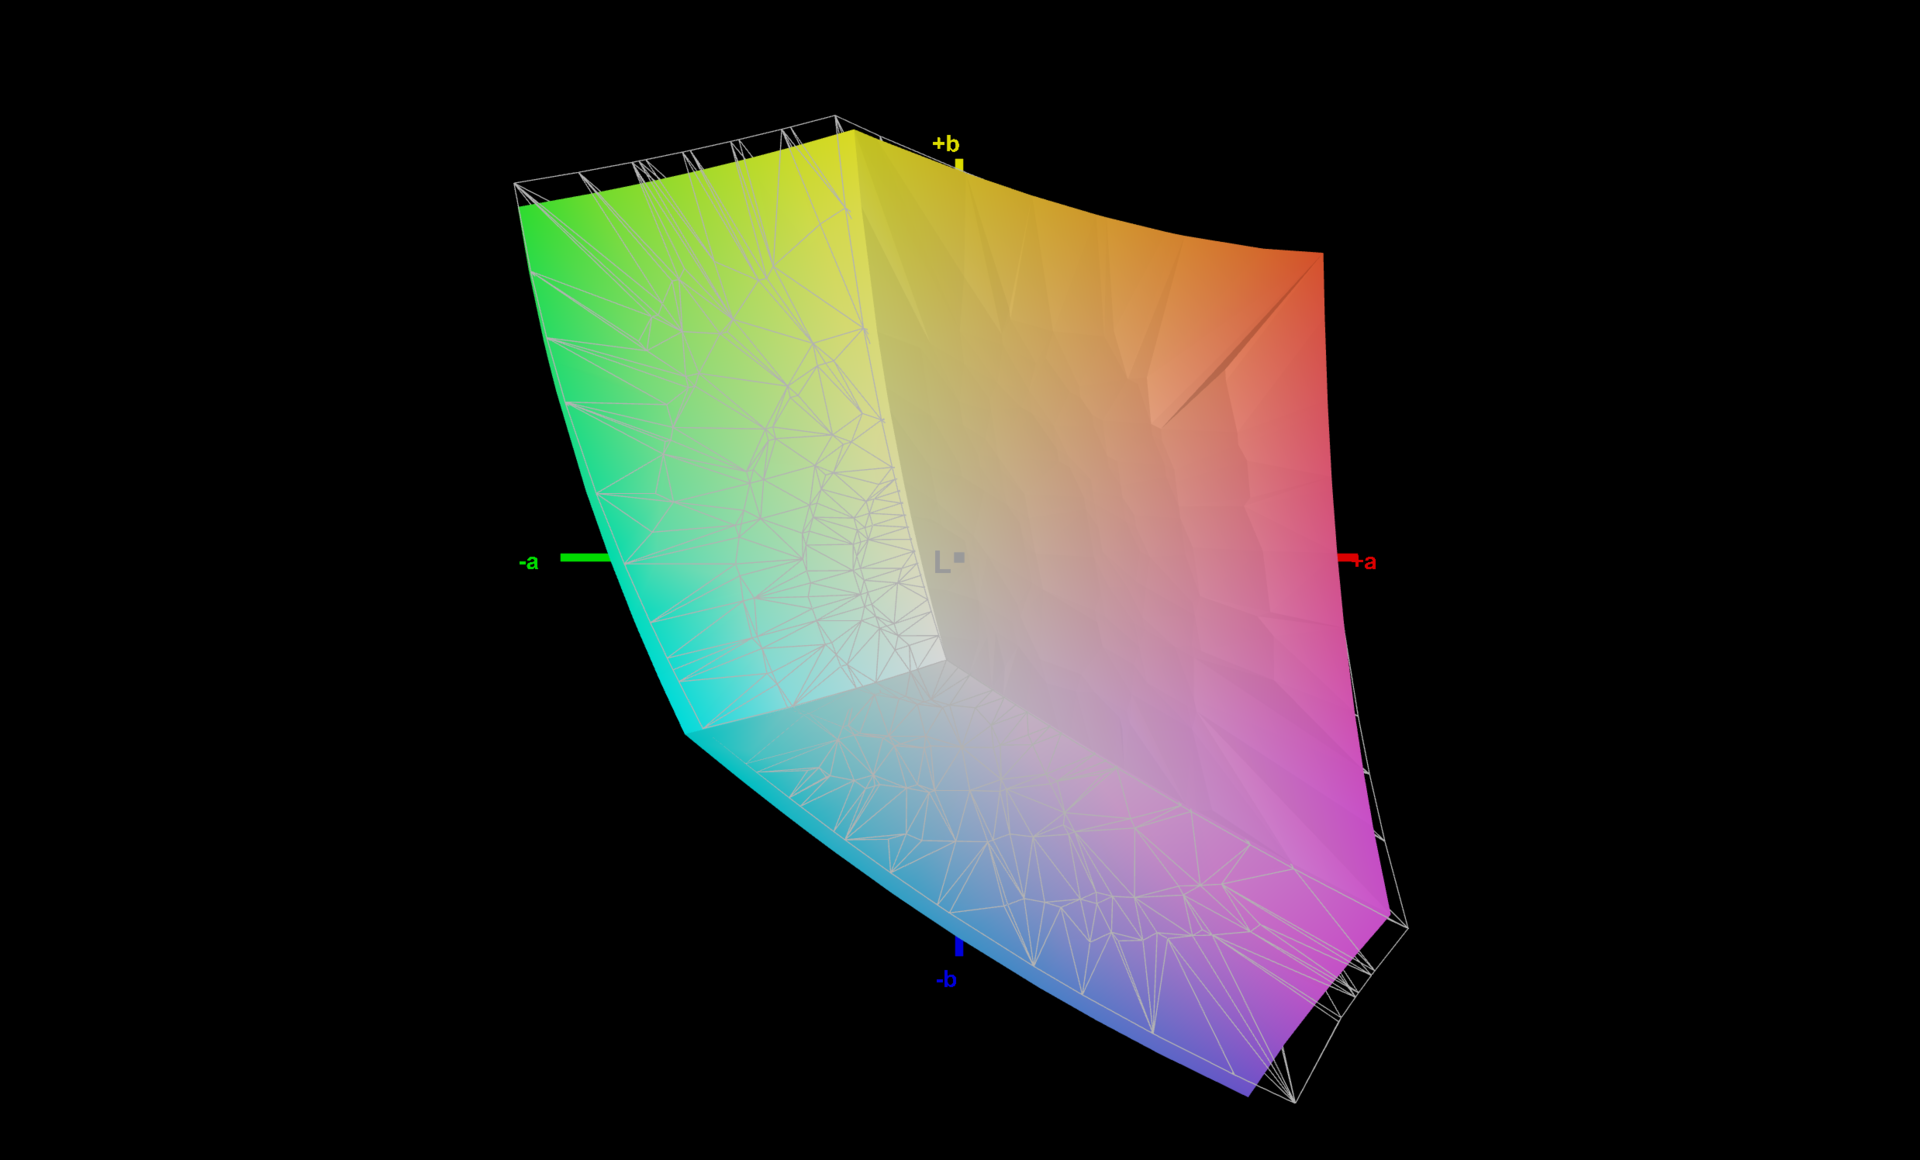
sRGB色彩空间被充分覆盖,达到95.7%,这应该允许在数字领域进行专业的图像处理。 然而,即使在我们校准之后,蓝色仍然偏离目标,DeltaE 2000值为3.5,尽管我们能够补救蓝色色调。像往常一样,你可以从上面的链接中下载我们校准后的颜色配置文件,在亮度分布图的右边。
Display Response Times
| ↔ Response Time Black to White | ||
|---|---|---|
| 18.9 ms ... rise ↗ and fall ↘ combined | ↗ 9.4 ms rise | 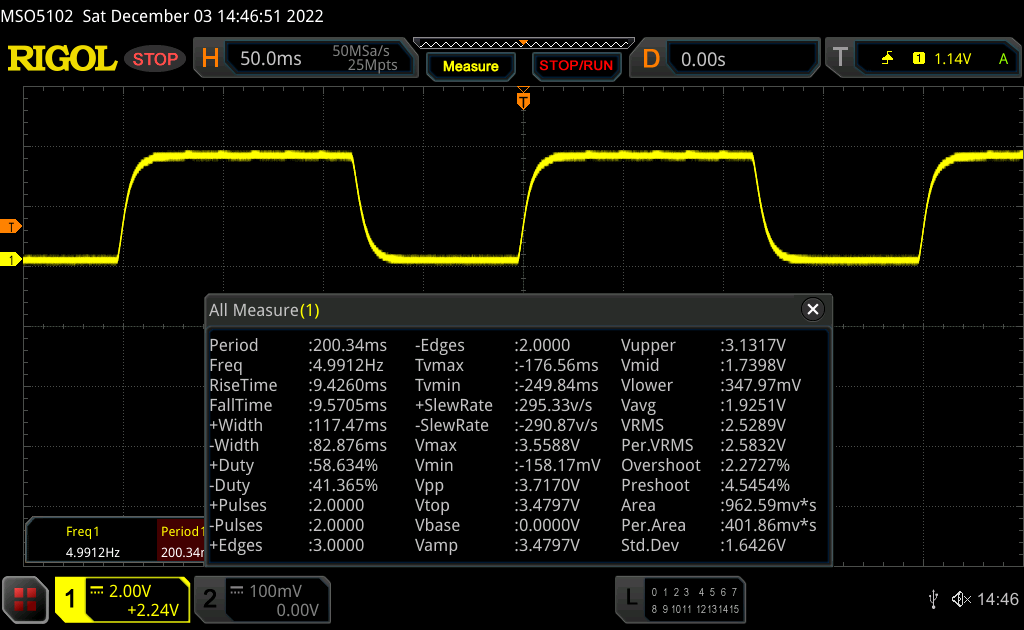 |
| ↘ 9.5 ms fall | ||
| The screen shows good response rates in our tests, but may be too slow for competitive gamers. In comparison, all tested devices range from 0.1 (minimum) to 240 (maximum) ms. » 42 % of all devices are better. This means that the measured response time is similar to the average of all tested devices (19.8 ms). | ||
| ↔ Response Time 50% Grey to 80% Grey | ||
| 32.1 ms ... rise ↗ and fall ↘ combined | ↗ 15.6 ms rise | 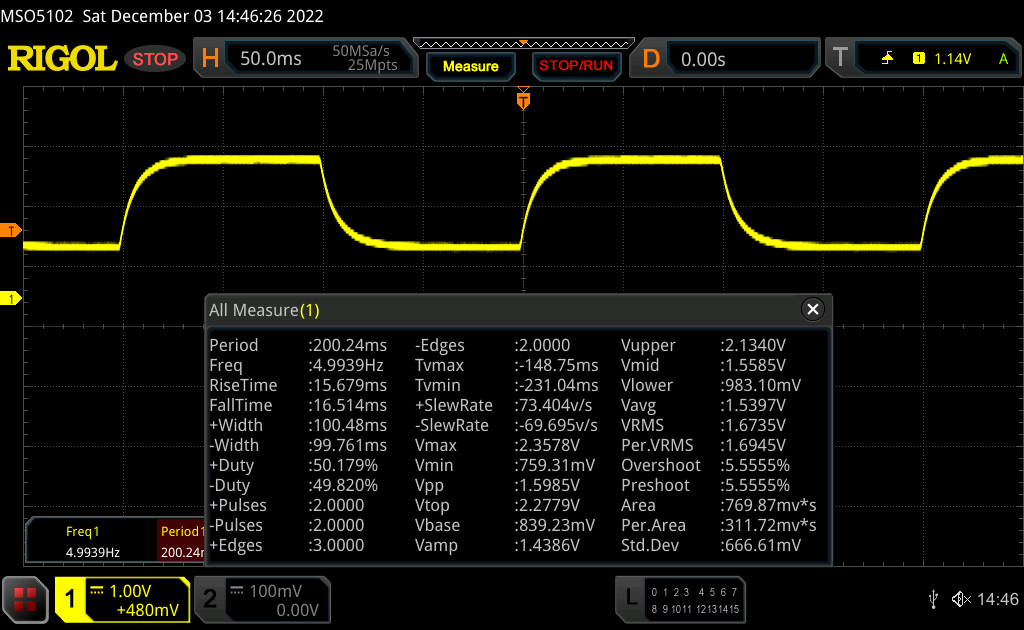 |
| ↘ 16.5 ms fall | ||
| The screen shows slow response rates in our tests and will be unsatisfactory for gamers. In comparison, all tested devices range from 0.165 (minimum) to 636 (maximum) ms. » 44 % of all devices are better. This means that the measured response time is similar to the average of all tested devices (31 ms). | ||
Screen Flickering / PWM (Pulse-Width Modulation)
| Screen flickering / PWM not detected |  | ||
In comparison: 52 % of all tested devices do not use PWM to dim the display. If PWM was detected, an average of 7757 (minimum: 5 - maximum: 343500) Hz was measured. | |||
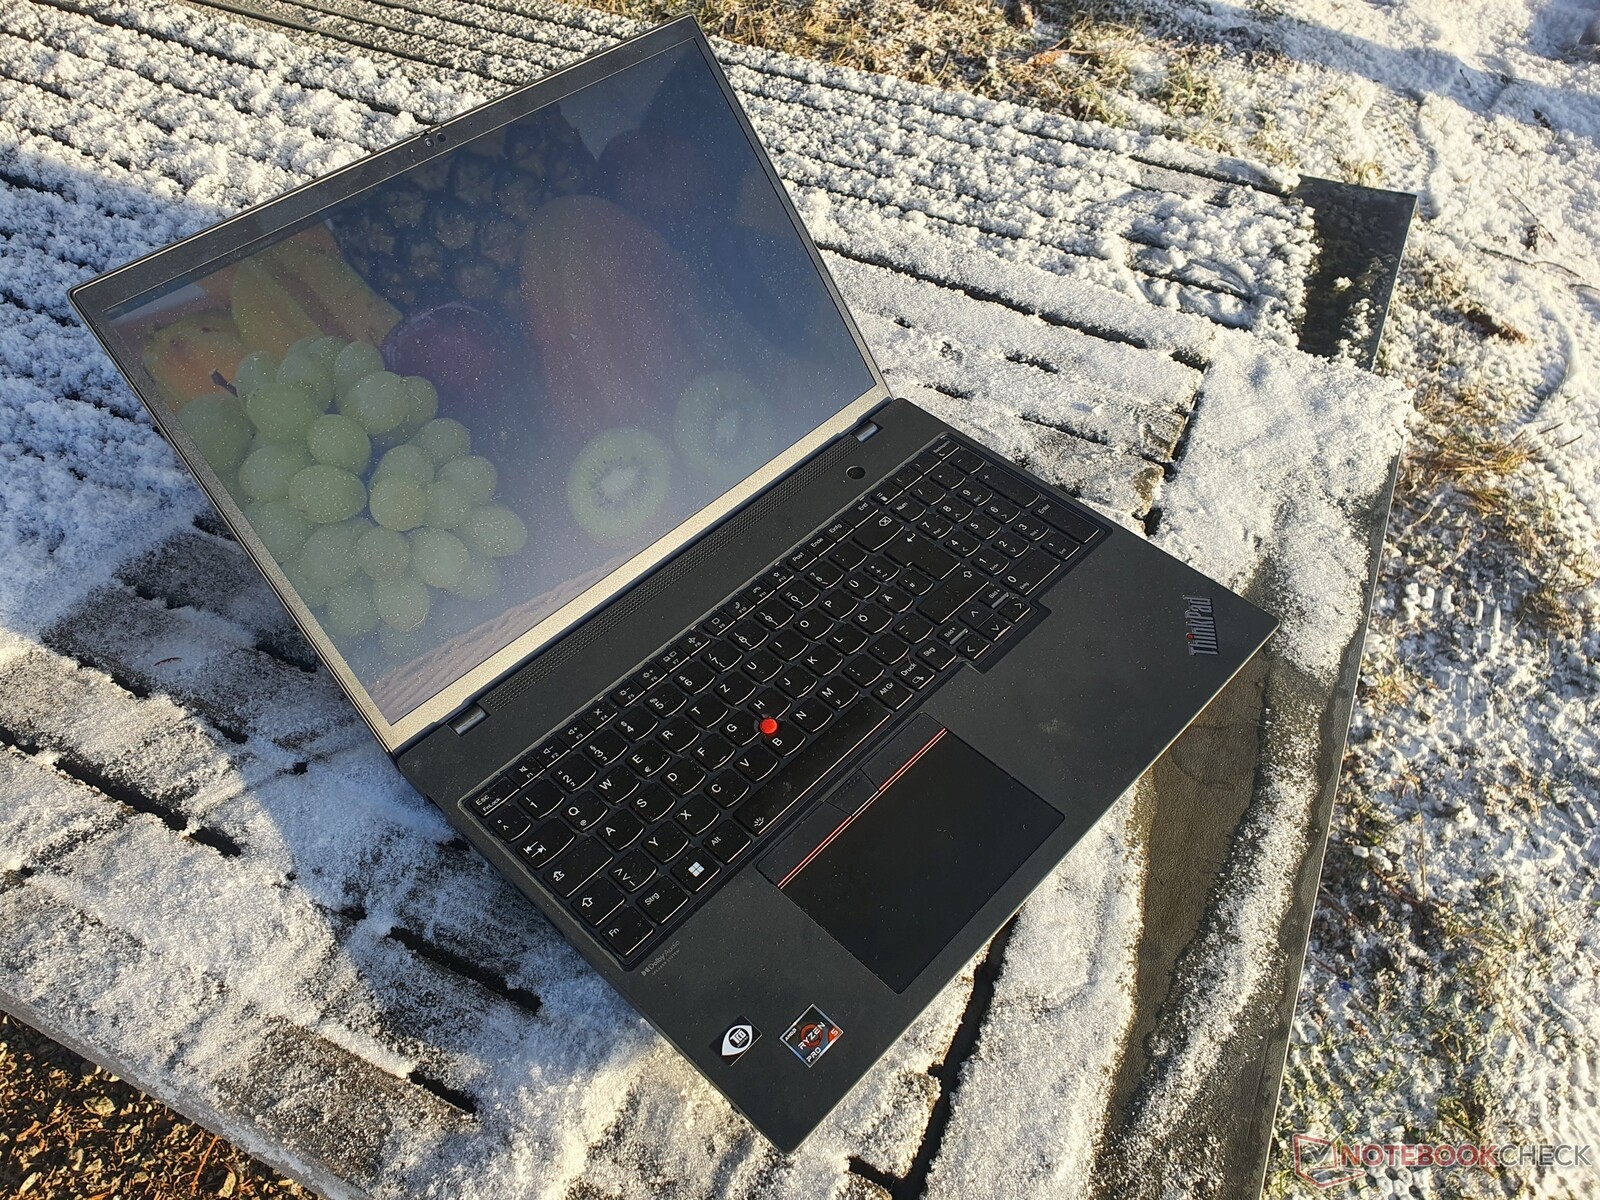
由于~390cd/m²的相当高的亮度,只要避免阳光直射,哑光显示屏的内容在户外仍可轻松阅读。
性能。AMD六核已经比T16英特尔更快
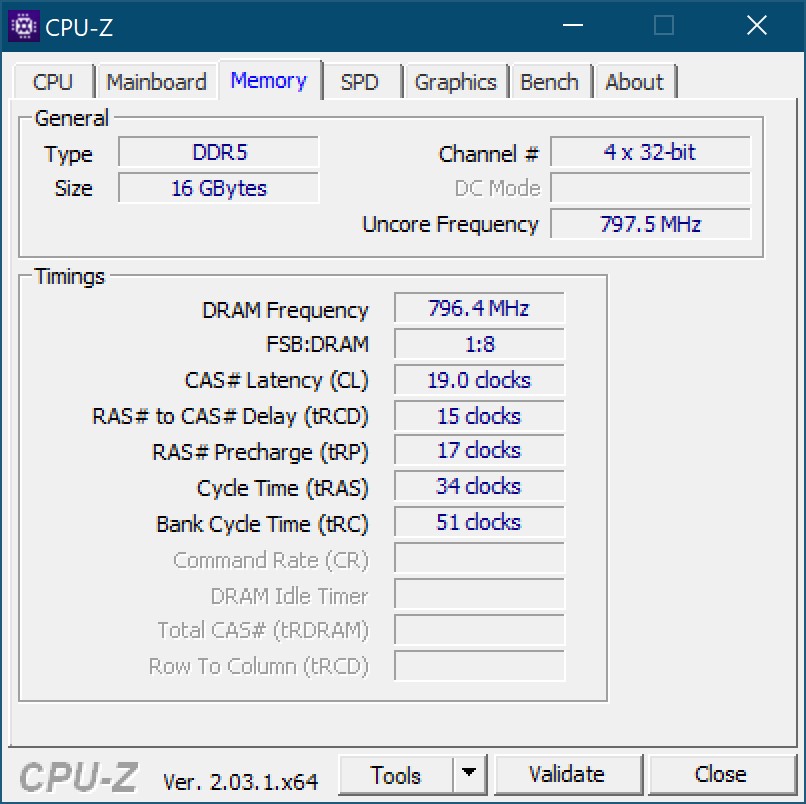
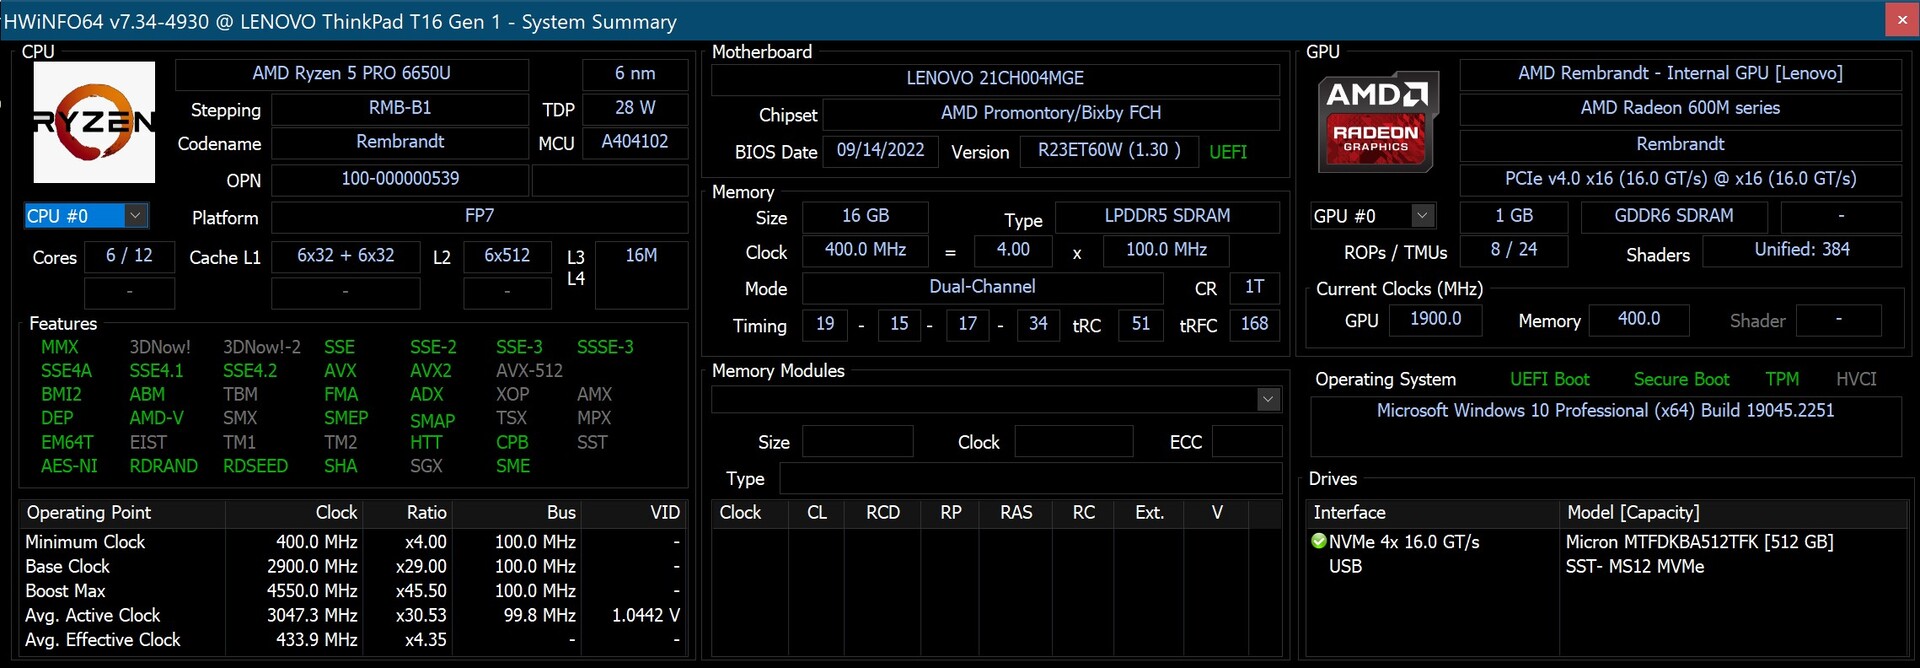
我们的ThinkPad T16 AMD测试单元配备了16GB焊接的LPDDR5-6400内存,而英特尔型号提供了一个DDR4-3200模块的内存插槽。AMD版本的最大可用容量为32GB,而英特尔版本则为48GB。
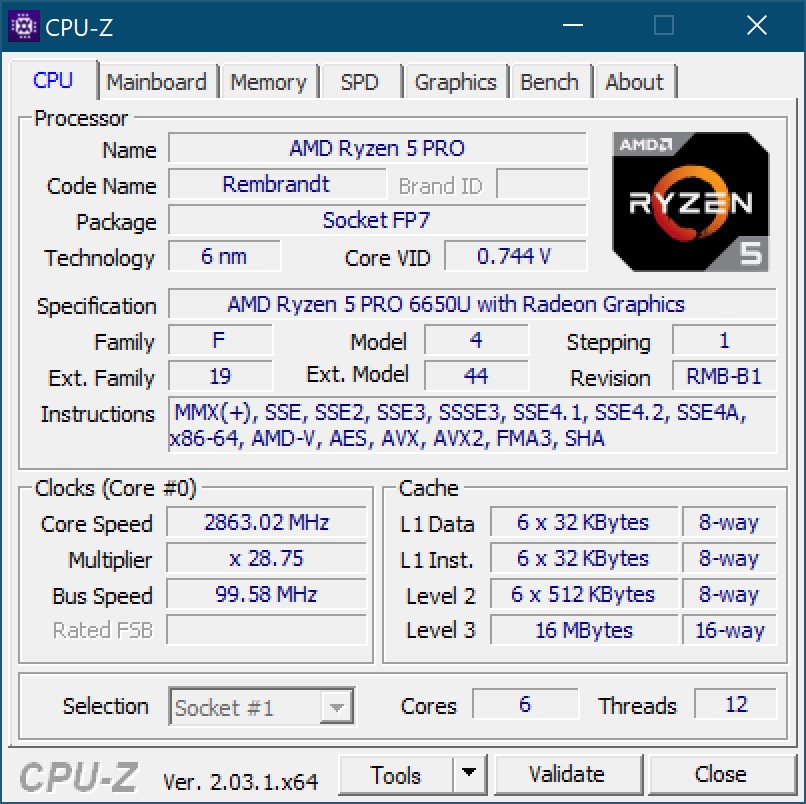
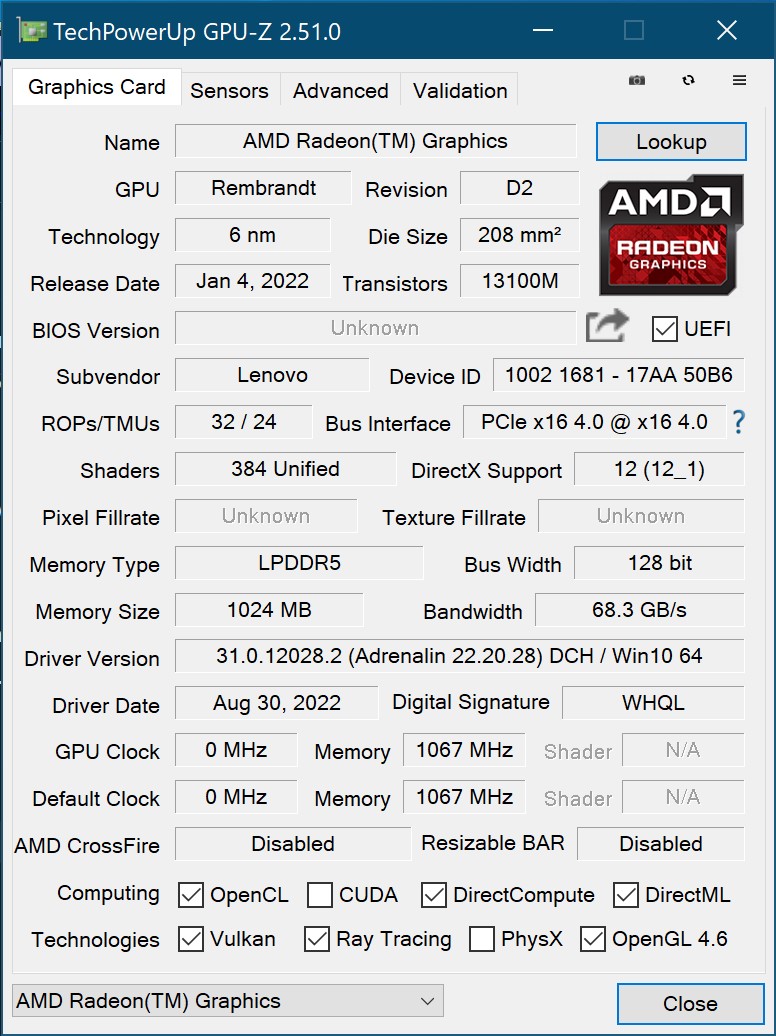
该设备的核心是AMD Ryzen 5 PRO 6650U它有六个核心,我们还有一个带有八核心的T16 Ryzen 7 PRO 6850U可用于几个基准测试。有了512-GB的PCIe 4.0固态硬盘和单纯的集成图形解决方案(Radeon 660M或 Radeon 680M),目标用途显然是在办公室领域。

测试条件
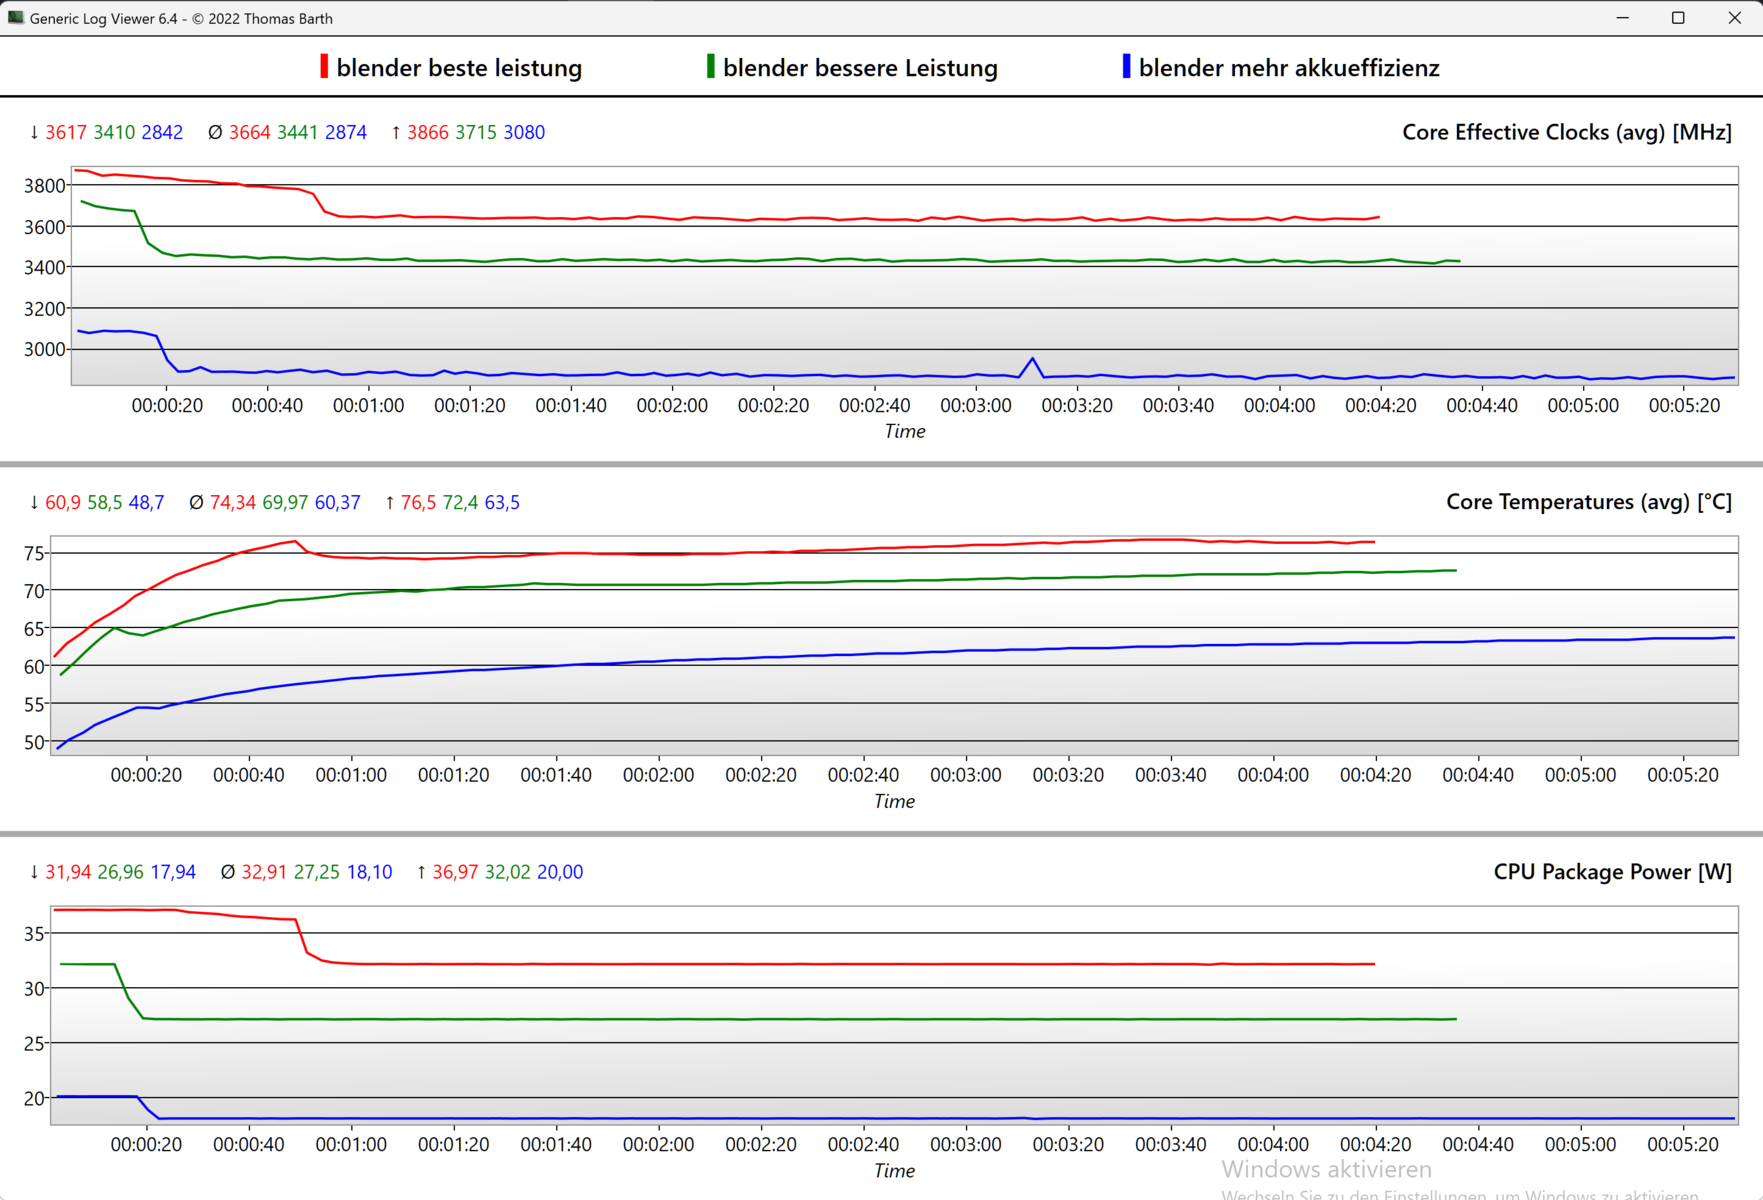
联想没有为其ThinkPads提供自己的性能模式控制,但它们被整合在Windows的电源设置中。这允许你在三个配置文件中选择不同的功率限制,用于短时间的Turbo(PL2)和长时间的Boost(PL1)。
- 最佳功率效率:20 W (PL2) / 18 W (PL1)
- 平衡:32 W (PL2) / 27 W (PL1)
- 最佳性能。37 W (PL2) / 32 W (PL1)
我们在激活 "最佳性能 "模式下进行了所有的性能测试。Wi-Fi和视频电池寿命是使用 "平衡 "模式确定的。
处理器
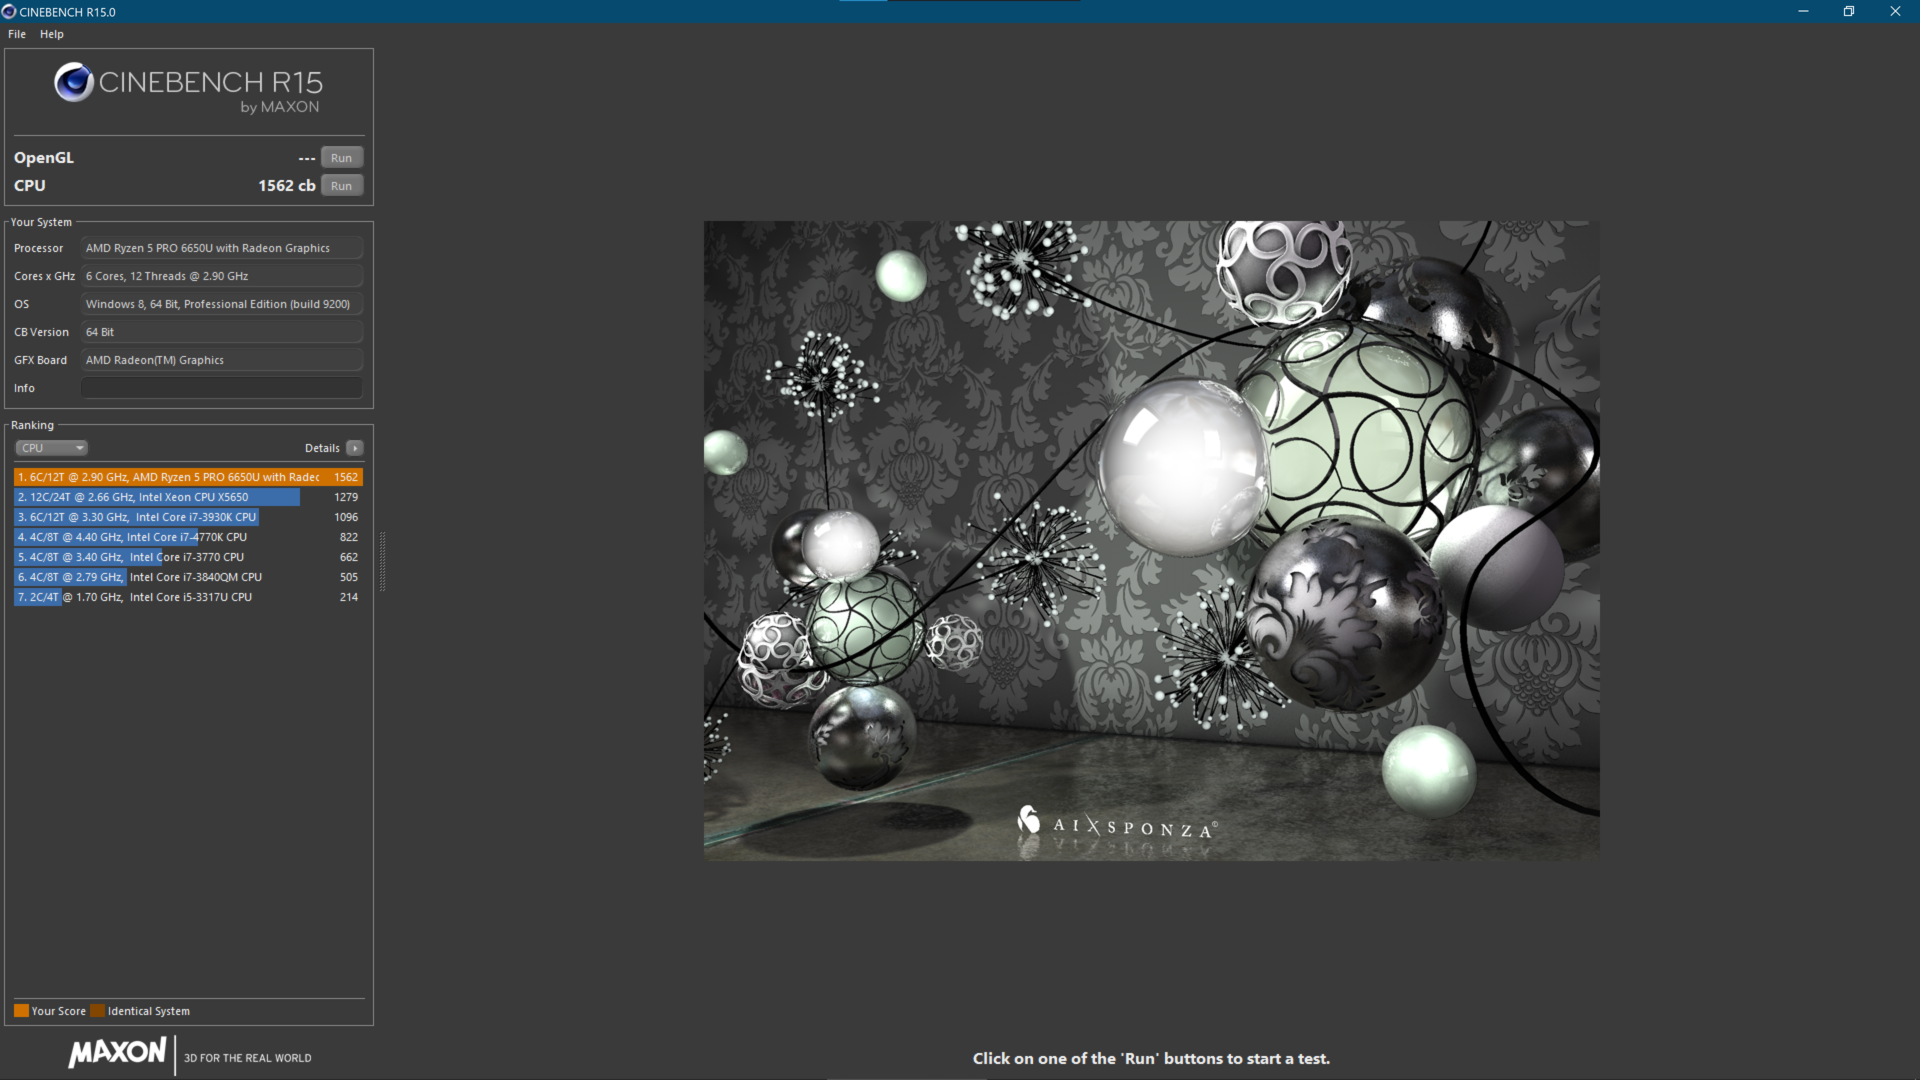
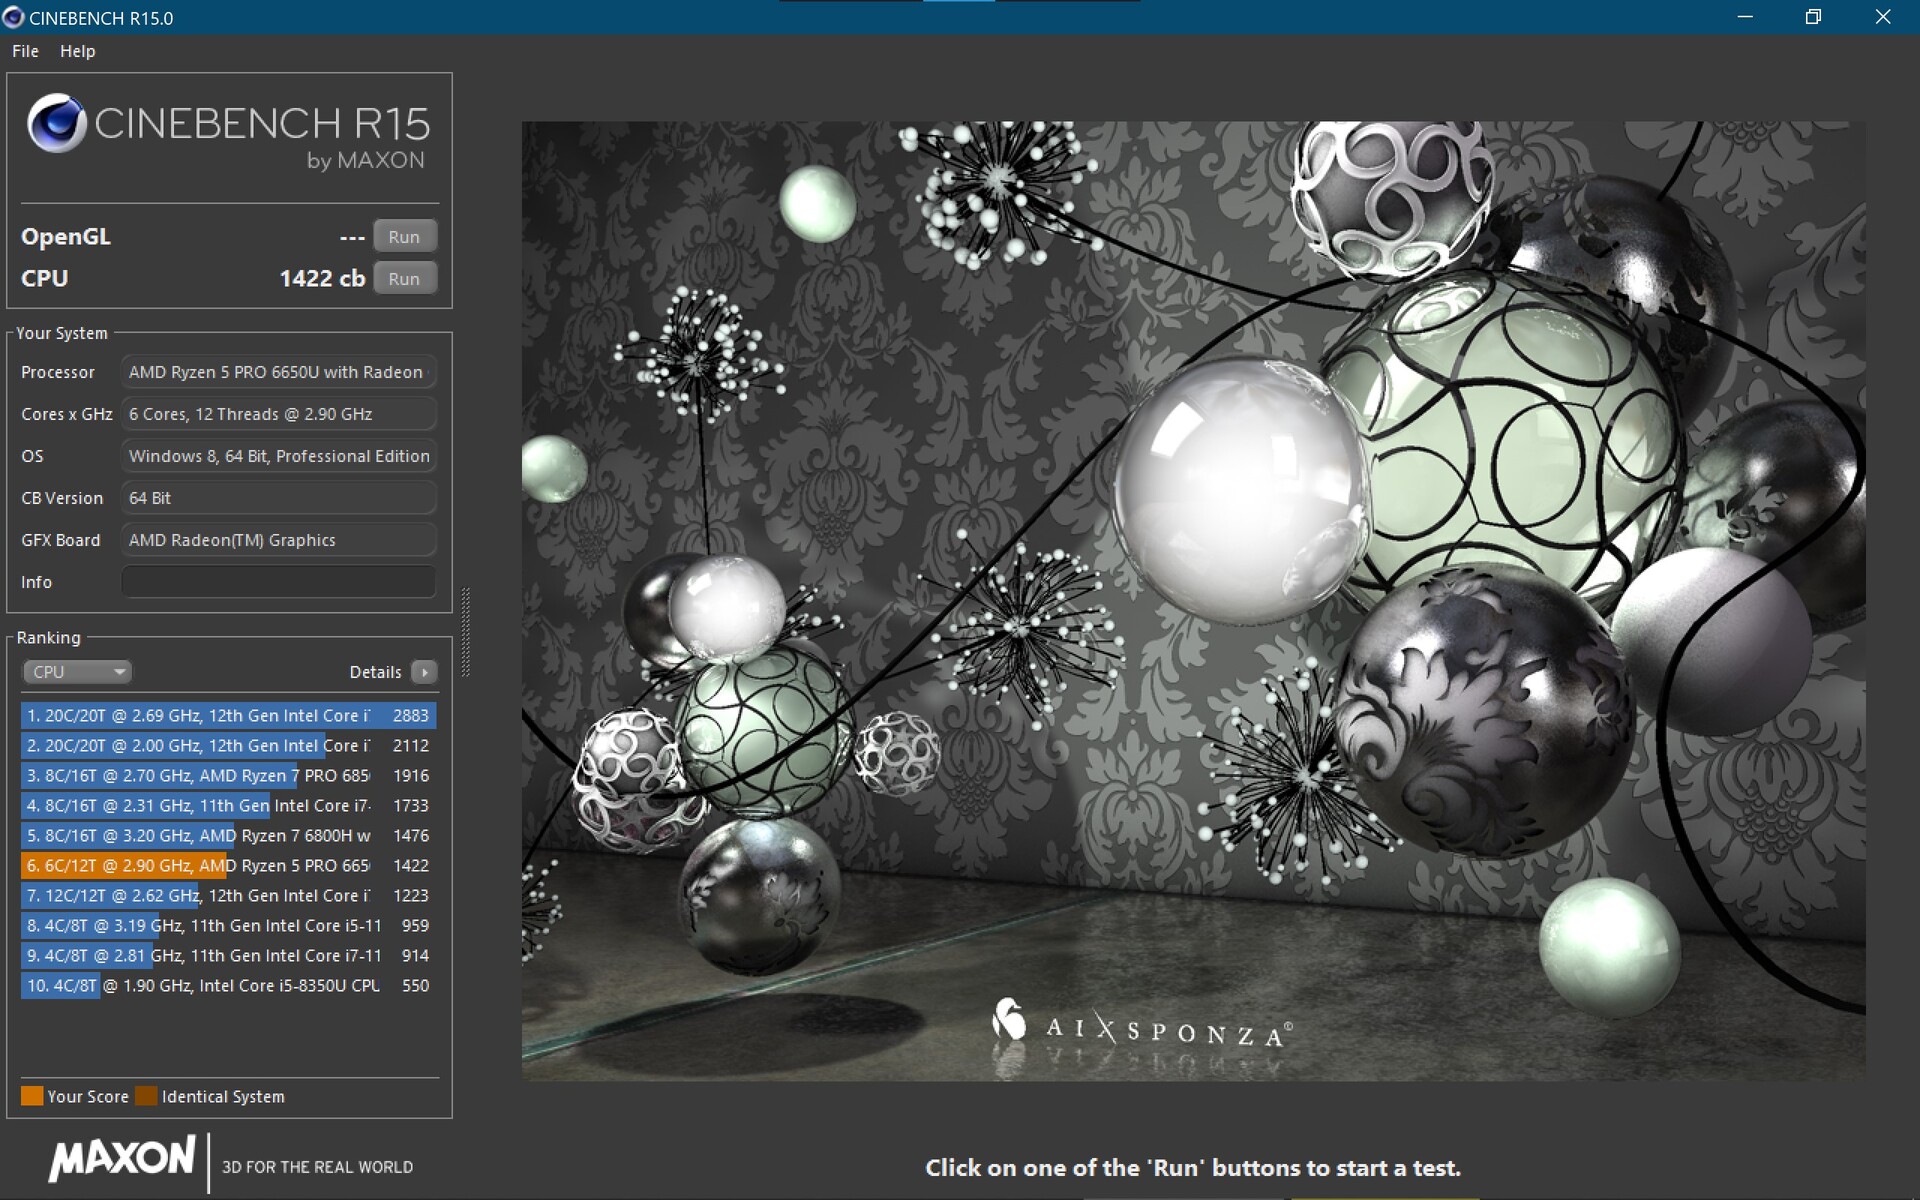
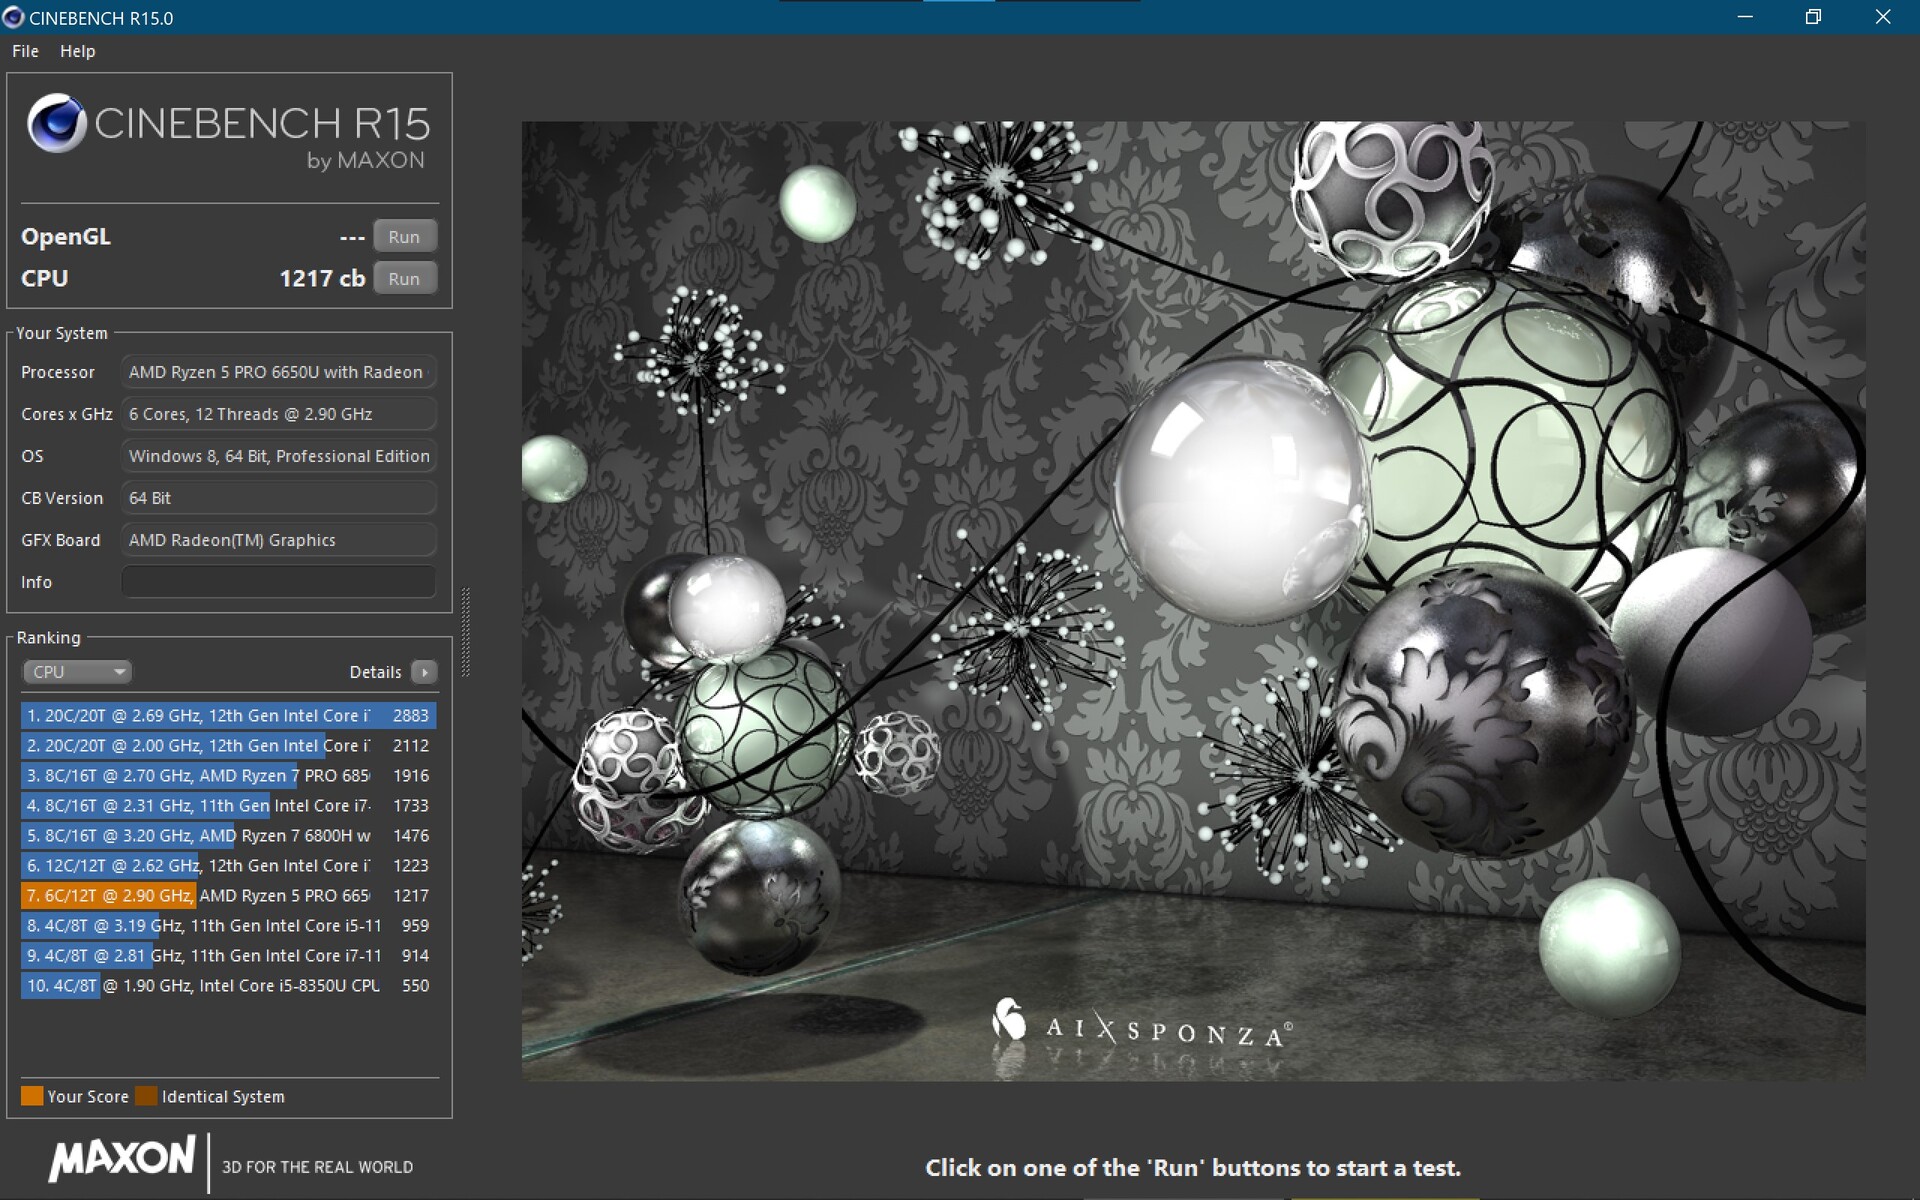
AMD 锐龙5 Pro 6650U是一个六核处理器。在ThinkPad T16 G1中,它能够在所有核心中保持3.8 GHz的最高时钟速度约45秒,之后才平缓下来,仅勉强低于3.65 GHz。
这导致性能值明显高于英特尔型号联想将其限制在20瓦的低水平。在我们的Cinebench R15循环中,我们测量的结果比相应的Intel 酷睿i5-1240P至少在第一次运行时,它是领先的。
我们的第二个T16测试单元采用 Ryzen 7 Pro 6850U在这个基准测试中带来了大约20%的额外性能。另一方面, EliteBook 865 G9与配备R5 6650U的较弱的T16处于同一水平。英特尔的 酷睿i7-12700H中的ThinkPad X1 Extreme G5在多核基准测试中的运行速度几乎比 Ryzen 5 Pro 6650U,而在单核测试中,它的表现仍然高出23%左右。
在电池运行中,性能没有下降。然而,在采用更强大的八核处理器的T16中,我们观察到性能下降了20%。

Cinebench R15 Multi Constant Load Test
Cinebench R23: Multi Core | Single Core
Cinebench R20: CPU (Multi Core) | CPU (Single Core)
Cinebench R15: CPU Multi 64Bit | CPU Single 64Bit
Blender: v2.79 BMW27 CPU
7-Zip 18.03: 7z b 4 | 7z b 4 -mmt1
Geekbench 5.5: Multi-Core | Single-Core
HWBOT x265 Benchmark v2.2: 4k Preset
LibreOffice : 20 Documents To PDF
R Benchmark 2.5: Overall mean
| CPU Performance rating | |
| Lenovo ThinkPad X1 Extreme G5-21DE003RGE | |
| HP ZBook Power 15 G9 6B8C4EA | |
| Lenovo ThinkPad Z16 G1 21D5S00T00 | |
| Average of class Office | |
| Lenovo ThinkPad T16 G1 21CHCTO1WW | |
| HP EliteBook 865 G9 | |
| Lenovo ThinkPad T16 G1 21CH004MGE | |
| Lenovo ThinkPad T16 G1 21BWS00200 | |
| Average AMD Ryzen 5 PRO 6650U | |
| Cinebench R23 / Multi Core | |
| Lenovo ThinkPad X1 Extreme G5-21DE003RGE | |
| HP ZBook Power 15 G9 6B8C4EA | |
| Lenovo ThinkPad Z16 G1 21D5S00T00 | |
| Average of class Office (1673 - 22808, n=76, last 2 years) | |
| Lenovo ThinkPad T16 G1 21CHCTO1WW | |
| HP EliteBook 865 G9 | |
| Lenovo ThinkPad T16 G1 21CH004MGE | |
| Average AMD Ryzen 5 PRO 6650U (7805 - 9534, n=4) | |
| Lenovo ThinkPad T16 G1 21BWS00200 | |
| Cinebench R23 / Single Core | |
| Lenovo ThinkPad X1 Extreme G5-21DE003RGE | |
| HP ZBook Power 15 G9 6B8C4EA | |
| Average of class Office (708 - 2130, n=76, last 2 years) | |
| Lenovo ThinkPad T16 G1 21BWS00200 | |
| Lenovo ThinkPad T16 G1 21CHCTO1WW | |
| Lenovo ThinkPad Z16 G1 21D5S00T00 | |
| Lenovo ThinkPad T16 G1 21CH004MGE | |
| Average AMD Ryzen 5 PRO 6650U (1439 - 1476, n=4) | |
| HP EliteBook 865 G9 | |
| Cinebench R20 / CPU (Multi Core) | |
| Lenovo ThinkPad X1 Extreme G5-21DE003RGE | |
| HP ZBook Power 15 G9 6B8C4EA | |
| Lenovo ThinkPad Z16 G1 21D5S00T00 | |
| Average of class Office (648 - 8840, n=75, last 2 years) | |
| Lenovo ThinkPad T16 G1 21CHCTO1WW | |
| HP EliteBook 865 G9 | |
| Lenovo ThinkPad T16 G1 21CH004MGE | |
| Average AMD Ryzen 5 PRO 6650U (3057 - 3684, n=4) | |
| Lenovo ThinkPad T16 G1 21BWS00200 | |
| Cinebench R20 / CPU (Single Core) | |
| Lenovo ThinkPad X1 Extreme G5-21DE003RGE | |
| HP ZBook Power 15 G9 6B8C4EA | |
| Average of class Office (345 - 816, n=75, last 2 years) | |
| Lenovo ThinkPad T16 G1 21CHCTO1WW | |
| HP EliteBook 865 G9 | |
| Lenovo ThinkPad Z16 G1 21D5S00T00 | |
| Lenovo ThinkPad T16 G1 21BWS00200 | |
| Lenovo ThinkPad T16 G1 21CH004MGE | |
| Average AMD Ryzen 5 PRO 6650U (548 - 578, n=4) | |
| Cinebench R15 / CPU Multi 64Bit | |
| Lenovo ThinkPad X1 Extreme G5-21DE003RGE | |
| Lenovo ThinkPad Z16 G1 21D5S00T00 | |
| HP ZBook Power 15 G9 6B8C4EA | |
| Lenovo ThinkPad T16 G1 21CHCTO1WW | |
| Average of class Office (250 - 3380, n=77, last 2 years) | |
| Lenovo ThinkPad T16 G1 21BWS00200 | |
| Lenovo ThinkPad T16 G1 21BWS00200 | |
| HP EliteBook 865 G9 | |
| Lenovo ThinkPad T16 G1 21CH004MGE | |
| Average AMD Ryzen 5 PRO 6650U (1299 - 1555, n=4) | |
| Cinebench R15 / CPU Single 64Bit | |
| Lenovo ThinkPad X1 Extreme G5-21DE003RGE | |
| HP ZBook Power 15 G9 6B8C4EA | |
| Average of class Office (99.5 - 316, n=77, last 2 years) | |
| Lenovo ThinkPad Z16 G1 21D5S00T00 | |
| Lenovo ThinkPad T16 G1 21CHCTO1WW | |
| Lenovo ThinkPad T16 G1 21CH004MGE | |
| HP EliteBook 865 G9 | |
| Average AMD Ryzen 5 PRO 6650U (230 - 234, n=4) | |
| Lenovo ThinkPad T16 G1 21BWS00200 | |
| Blender / v2.79 BMW27 CPU | |
| Lenovo ThinkPad T16 G1 21BWS00200 | |
| Average AMD Ryzen 5 PRO 6650U (328 - 548, n=5) | |
| Average of class Office (158 - 1940, n=76, last 2 years) | |
| Lenovo ThinkPad T16 G1 21CH004MGE | |
| HP EliteBook 865 G9 | |
| Lenovo ThinkPad T16 G1 21CHCTO1WW | |
| Lenovo ThinkPad Z16 G1 21D5S00T00 | |
| HP ZBook Power 15 G9 6B8C4EA | |
| Lenovo ThinkPad X1 Extreme G5-21DE003RGE | |
| 7-Zip 18.03 / 7z b 4 | |
| Lenovo ThinkPad X1 Extreme G5-21DE003RGE | |
| HP ZBook Power 15 G9 6B8C4EA | |
| Lenovo ThinkPad Z16 G1 21D5S00T00 | |
| Lenovo ThinkPad T16 G1 21CHCTO1WW | |
| HP EliteBook 865 G9 | |
| Average of class Office (7098 - 76886, n=77, last 2 years) | |
| Lenovo ThinkPad T16 G1 21CH004MGE | |
| Average AMD Ryzen 5 PRO 6650U (32613 - 41530, n=4) | |
| Lenovo ThinkPad T16 G1 21BWS00200 | |
| 7-Zip 18.03 / 7z b 4 -mmt1 | |
| Lenovo ThinkPad X1 Extreme G5-21DE003RGE | |
| HP ZBook Power 15 G9 6B8C4EA | |
| HP EliteBook 865 G9 | |
| Average of class Office (3387 - 6469, n=77, last 2 years) | |
| Lenovo ThinkPad Z16 G1 21D5S00T00 | |
| Lenovo ThinkPad T16 G1 21CHCTO1WW | |
| Lenovo ThinkPad T16 G1 21CH004MGE | |
| Average AMD Ryzen 5 PRO 6650U (5175 - 5427, n=4) | |
| Lenovo ThinkPad T16 G1 21BWS00200 | |
| Geekbench 5.5 / Multi-Core | |
| Lenovo ThinkPad X1 Extreme G5-21DE003RGE | |
| HP ZBook Power 15 G9 6B8C4EA | |
| Average of class Office (1483 - 16999, n=73, last 2 years) | |
| Lenovo ThinkPad Z16 G1 21D5S00T00 | |
| Lenovo ThinkPad T16 G1 21CHCTO1WW | |
| Lenovo ThinkPad T16 G1 21CH004MGE | |
| Lenovo ThinkPad T16 G1 21BWS00200 | |
| HP EliteBook 865 G9 | |
| Average AMD Ryzen 5 PRO 6650U (6171 - 7227, n=4) | |
| Geekbench 5.5 / Single-Core | |
| Lenovo ThinkPad X1 Extreme G5-21DE003RGE | |
| Average of class Office (811 - 2175, n=73, last 2 years) | |
| HP ZBook Power 15 G9 6B8C4EA | |
| Lenovo ThinkPad T16 G1 21BWS00200 | |
| Lenovo ThinkPad T16 G1 21CH004MGE | |
| Lenovo ThinkPad Z16 G1 21D5S00T00 | |
| Lenovo ThinkPad T16 G1 21CHCTO1WW | |
| Average AMD Ryzen 5 PRO 6650U (1433 - 1487, n=4) | |
| HP EliteBook 865 G9 | |
| HWBOT x265 Benchmark v2.2 / 4k Preset | |
| Lenovo ThinkPad X1 Extreme G5-21DE003RGE | |
| HP ZBook Power 15 G9 6B8C4EA | |
| Lenovo ThinkPad Z16 G1 21D5S00T00 | |
| Lenovo ThinkPad T16 G1 21CHCTO1WW | |
| Average of class Office (2.21 - 26, n=76, last 2 years) | |
| Lenovo ThinkPad T16 G1 21CH004MGE | |
| HP EliteBook 865 G9 | |
| Average AMD Ryzen 5 PRO 6650U (8.71 - 11.8, n=4) | |
| Lenovo ThinkPad T16 G1 21BWS00200 | |
| LibreOffice / 20 Documents To PDF | |
| Average AMD Ryzen 5 PRO 6650U (50.3 - 63.2, n=4) | |
| Average of class Office (39.9 - 102.3, n=76, last 2 years) | |
| HP EliteBook 865 G9 | |
| Lenovo ThinkPad Z16 G1 21D5S00T00 | |
| Lenovo ThinkPad T16 G1 21CH004MGE | |
| Lenovo ThinkPad T16 G1 21BWS00200 | |
| Lenovo ThinkPad T16 G1 21CHCTO1WW | |
| HP ZBook Power 15 G9 6B8C4EA | |
| Lenovo ThinkPad X1 Extreme G5-21DE003RGE | |
| R Benchmark 2.5 / Overall mean | |
| Average AMD Ryzen 5 PRO 6650U (0.521 - 0.59, n=4) | |
| Lenovo ThinkPad T16 G1 21CHCTO1WW | |
| Lenovo ThinkPad T16 G1 21CH004MGE | |
| Lenovo ThinkPad T16 G1 21BWS00200 | |
| Average of class Office (0.393 - 0.888, n=76, last 2 years) | |
| HP EliteBook 865 G9 | |
| Lenovo ThinkPad Z16 G1 21D5S00T00 | |
| HP ZBook Power 15 G9 6B8C4EA | |
| Lenovo ThinkPad X1 Extreme G5-21DE003RGE | |
* ... smaller is better
AIDA64: FP32 Ray-Trace | FPU Julia | CPU SHA3 | CPU Queen | FPU SinJulia | FPU Mandel | CPU AES | CPU ZLib | FP64 Ray-Trace | CPU PhotoWorxx
| Performance rating | |
| Lenovo ThinkPad X1 Extreme G5-21DE003RGE | |
| Lenovo ThinkPad Z16 G1 21D5S00T00 | |
| HP ZBook Power 15 G9 6B8C4EA | |
| Lenovo ThinkPad T16 G1 21CHCTO1WW | |
| Average of class Office | |
| Lenovo ThinkPad T16 G1 21CH004MGE | |
| HP EliteBook 865 G9 | |
| Lenovo ThinkPad P15v G2 21A9000XGE | |
| Average AMD Ryzen 5 PRO 6650U | |
| Lenovo ThinkPad T16 G1 21BWS00200 | |
| AIDA64 / FP32 Ray-Trace | |
| Lenovo ThinkPad X1 Extreme G5-21DE003RGE | |
| Lenovo ThinkPad Z16 G1 21D5S00T00 | |
| Average of class Office (2083 - 31245, n=83, last 2 years) | |
| HP ZBook Power 15 G9 6B8C4EA | |
| Lenovo ThinkPad T16 G1 21CHCTO1WW | |
| Lenovo ThinkPad P15v G2 21A9000XGE | |
| HP EliteBook 865 G9 | |
| Lenovo ThinkPad T16 G1 21CH004MGE | |
| Average AMD Ryzen 5 PRO 6650U (8854 - 10630, n=4) | |
| Lenovo ThinkPad T16 G1 21BWS00200 | |
| AIDA64 / FPU Julia | |
| Lenovo ThinkPad Z16 G1 21D5S00T00 | |
| Lenovo ThinkPad X1 Extreme G5-21DE003RGE | |
| Lenovo ThinkPad T16 G1 21CHCTO1WW | |
| HP EliteBook 865 G9 | |
| Lenovo ThinkPad T16 G1 21CH004MGE | |
| HP ZBook Power 15 G9 6B8C4EA | |
| Average of class Office (8191 - 125394, n=83, last 2 years) | |
| Average AMD Ryzen 5 PRO 6650U (56214 - 68106, n=4) | |
| Lenovo ThinkPad P15v G2 21A9000XGE | |
| Lenovo ThinkPad T16 G1 21BWS00200 | |
| AIDA64 / CPU SHA3 | |
| Lenovo ThinkPad X1 Extreme G5-21DE003RGE | |
| Lenovo ThinkPad P15v G2 21A9000XGE | |
| HP ZBook Power 15 G9 6B8C4EA | |
| Lenovo ThinkPad Z16 G1 21D5S00T00 | |
| Average of class Office (433 - 5755, n=83, last 2 years) | |
| Lenovo ThinkPad T16 G1 21CHCTO1WW | |
| HP EliteBook 865 G9 | |
| Lenovo ThinkPad T16 G1 21CH004MGE | |
| Average AMD Ryzen 5 PRO 6650U (1881 - 2326, n=4) | |
| Lenovo ThinkPad T16 G1 21BWS00200 | |
| AIDA64 / CPU Queen | |
| Lenovo ThinkPad Z16 G1 21D5S00T00 | |
| Lenovo ThinkPad X1 Extreme G5-21DE003RGE | |
| HP ZBook Power 15 G9 6B8C4EA | |
| Lenovo ThinkPad P15v G2 21A9000XGE | |
| Lenovo ThinkPad T16 G1 21CHCTO1WW | |
| HP EliteBook 865 G9 | |
| Lenovo ThinkPad T16 G1 21CH004MGE | |
| Lenovo ThinkPad T16 G1 21BWS00200 | |
| Average AMD Ryzen 5 PRO 6650U (69023 - 78797, n=4) | |
| Average of class Office (22784 - 115197, n=67, last 2 years) | |
| AIDA64 / FPU SinJulia | |
| Lenovo ThinkPad Z16 G1 21D5S00T00 | |
| Lenovo ThinkPad T16 G1 21CHCTO1WW | |
| HP EliteBook 865 G9 | |
| Lenovo ThinkPad X1 Extreme G5-21DE003RGE | |
| Lenovo ThinkPad T16 G1 21CH004MGE | |
| Average AMD Ryzen 5 PRO 6650U (8320 - 9488, n=4) | |
| Lenovo ThinkPad P15v G2 21A9000XGE | |
| HP ZBook Power 15 G9 6B8C4EA | |
| Average of class Office (1378 - 18321, n=83, last 2 years) | |
| Lenovo ThinkPad T16 G1 21BWS00200 | |
| AIDA64 / FPU Mandel | |
| Lenovo ThinkPad Z16 G1 21D5S00T00 | |
| Lenovo ThinkPad T16 G1 21CHCTO1WW | |
| HP EliteBook 865 G9 | |
| Lenovo ThinkPad X1 Extreme G5-21DE003RGE | |
| Lenovo ThinkPad T16 G1 21CH004MGE | |
| Average AMD Ryzen 5 PRO 6650U (30969 - 37461, n=4) | |
| Average of class Office (4601 - 66922, n=83, last 2 years) | |
| HP ZBook Power 15 G9 6B8C4EA | |
| Lenovo ThinkPad P15v G2 21A9000XGE | |
| Lenovo ThinkPad T16 G1 21BWS00200 | |
| AIDA64 / CPU AES | |
| Lenovo ThinkPad T16 G1 21CH004MGE | |
| Lenovo ThinkPad X1 Extreme G5-21DE003RGE | |
| Lenovo ThinkPad P15v G2 21A9000XGE | |
| HP ZBook Power 15 G9 6B8C4EA | |
| Lenovo ThinkPad Z16 G1 21D5S00T00 | |
| Average AMD Ryzen 5 PRO 6650U (37259 - 93914, n=4) | |
| Average of class Office (4854 - 155900, n=83, last 2 years) | |
| HP EliteBook 865 G9 | |
| Lenovo ThinkPad T16 G1 21CHCTO1WW | |
| Lenovo ThinkPad T16 G1 21BWS00200 | |
| AIDA64 / CPU ZLib | |
| Lenovo ThinkPad X1 Extreme G5-21DE003RGE | |
| HP ZBook Power 15 G9 6B8C4EA | |
| Lenovo ThinkPad Z16 G1 21D5S00T00 | |
| Average of class Office (114.6 - 1366, n=83, last 2 years) | |
| Lenovo ThinkPad T16 G1 21CHCTO1WW | |
| Lenovo ThinkPad P15v G2 21A9000XGE | |
| HP EliteBook 865 G9 | |
| Lenovo ThinkPad T16 G1 21BWS00200 | |
| Lenovo ThinkPad T16 G1 21CH004MGE | |
| Average AMD Ryzen 5 PRO 6650U (504 - 602, n=4) | |
| AIDA64 / FP64 Ray-Trace | |
| Lenovo ThinkPad X1 Extreme G5-21DE003RGE | |
| Lenovo ThinkPad Z16 G1 21D5S00T00 | |
| Average of class Office (1109 - 17834, n=83, last 2 years) | |
| HP ZBook Power 15 G9 6B8C4EA | |
| Lenovo ThinkPad P15v G2 21A9000XGE | |
| Lenovo ThinkPad T16 G1 21CHCTO1WW | |
| HP EliteBook 865 G9 | |
| Lenovo ThinkPad T16 G1 21CH004MGE | |
| Average AMD Ryzen 5 PRO 6650U (4620 - 5468, n=4) | |
| Lenovo ThinkPad T16 G1 21BWS00200 | |
| AIDA64 / CPU PhotoWorxx | |
| HP ZBook Power 15 G9 6B8C4EA | |
| Average of class Office (11090 - 65229, n=83, last 2 years) | |
| Lenovo ThinkPad Z16 G1 21D5S00T00 | |
| Lenovo ThinkPad T16 G1 21CH004MGE | |
| Lenovo ThinkPad T16 G1 21CHCTO1WW | |
| Average AMD Ryzen 5 PRO 6650U (19643 - 26137, n=4) | |
| Lenovo ThinkPad X1 Extreme G5-21DE003RGE | |
| HP EliteBook 865 G9 | |
| Lenovo ThinkPad T16 G1 21BWS00200 | |
| Lenovo ThinkPad P15v G2 21A9000XGE | |
系统性能
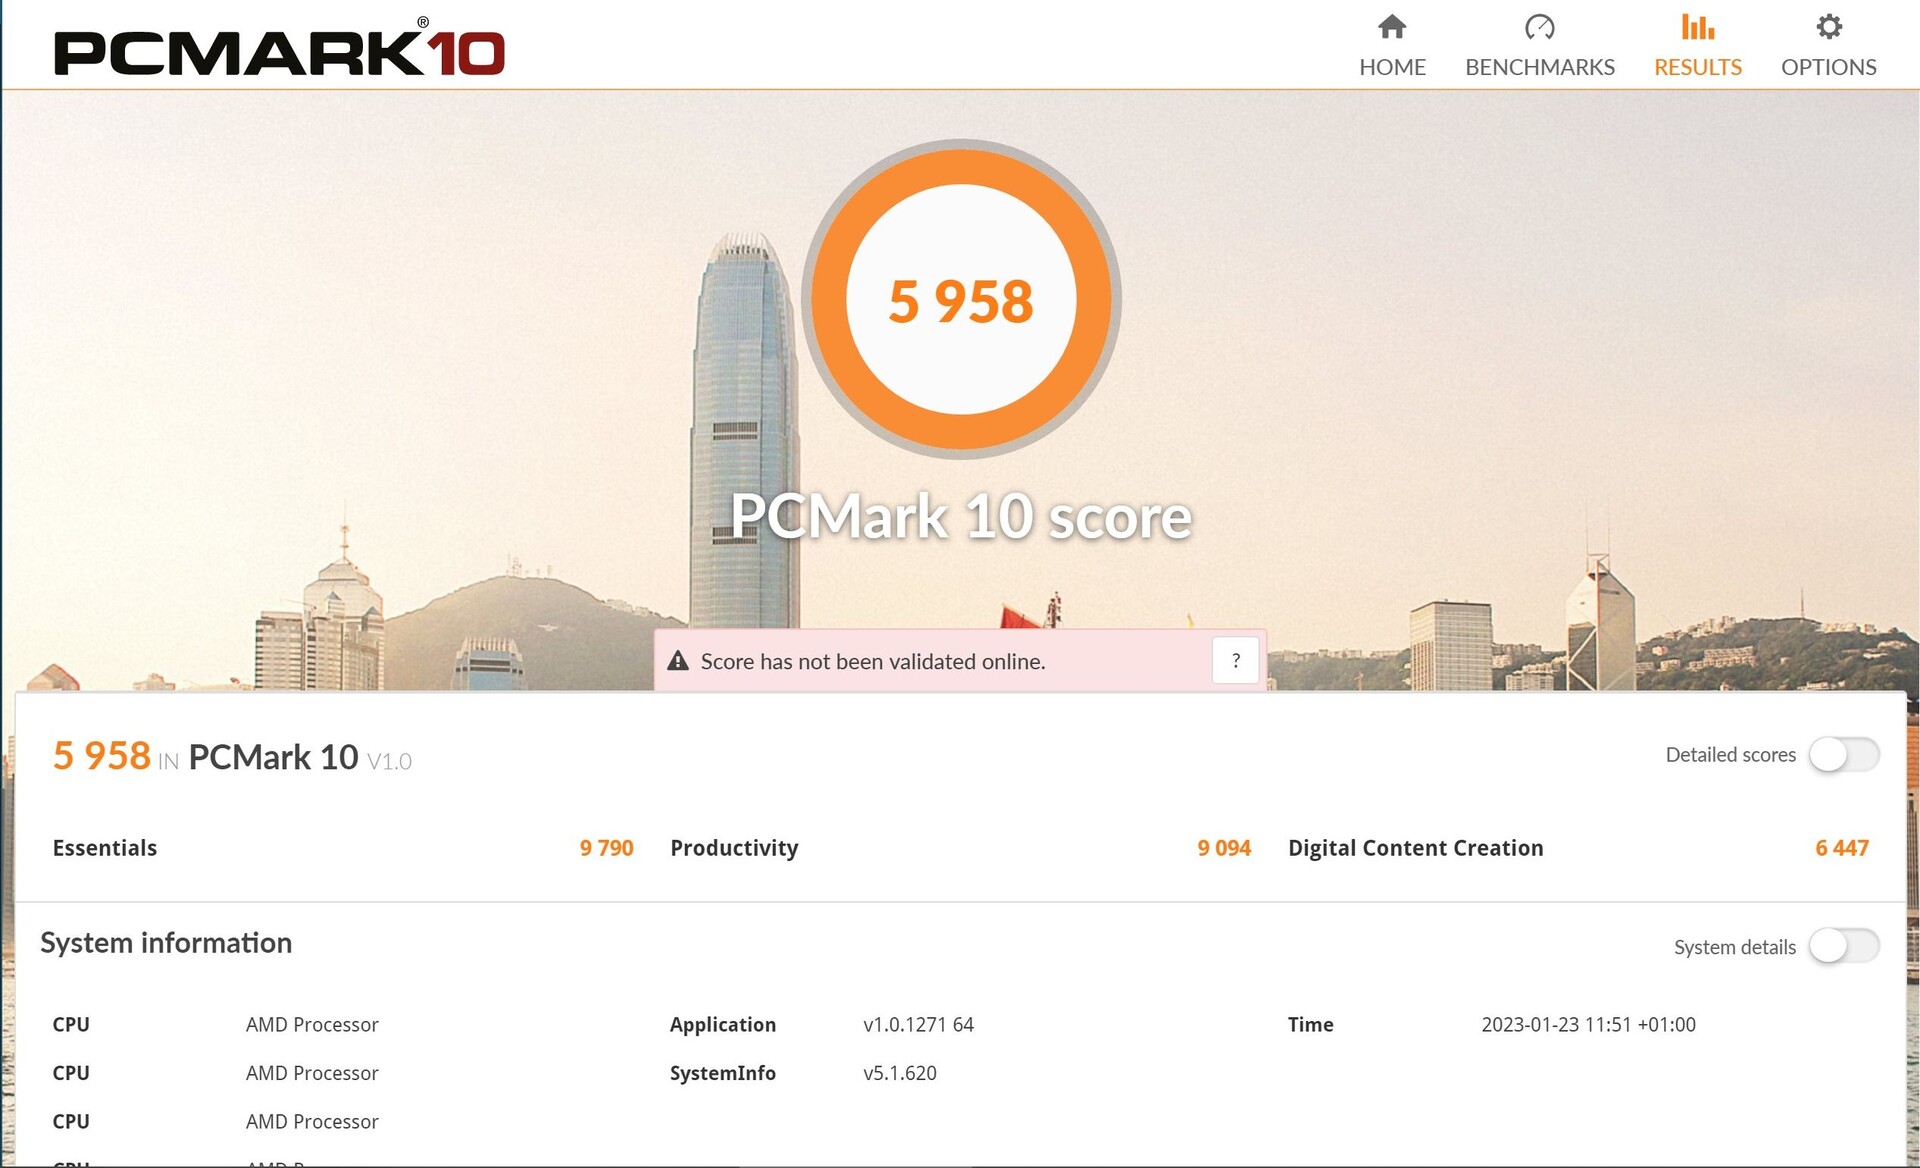
对于ThinkPad T16 AMD来说,使用多个标签进行流畅的网页浏览和同时播放4K YouTube视频是绝对没有问题的。 然而,由于其更强大的涡轮增压功能,ThinkPad T16英特尔处理器的性能也得到了提升。T16英特尔在Mozilla Kraken或Octane v2等浏览器基准测试中仍然保持轻微优势。另一方面,在PCMark和Crossmark基准测试中,英特尔版本因其单通道内存配置而受到严重限制。
CrossMark: Overall | Productivity | Creativity | Responsiveness
Mozilla Kraken 1.1: Total
Speedometer 2.0: Result 2.0
Octane V2: Total Score
Jetstream 2: 2.0 Total
WebXPRT 3: Overall
WebXPRT 4: Overall
| PCMark 10 / Score | |
| Lenovo ThinkPad X1 Extreme G5-21DE003RGE | |
| Average of class Office (2601 - 9298, n=68, last 2 years) | |
| Lenovo ThinkPad Z16 G1 21D5S00T00 | |
| HP ZBook Power 15 G9 6B8C4EA | |
| Lenovo ThinkPad T16 G1 21CHCTO1WW | |
| Lenovo ThinkPad T16 G1 21CH004MGE | |
| Lenovo ThinkPad P15v G2 21A9000XGE | |
| HP EliteBook 865 G9 | |
| Average AMD Ryzen 5 PRO 6650U, AMD Radeon 660M (5513 - 5958, n=4) | |
| Lenovo ThinkPad T16 G1 21BWS00200 | |
| PCMark 10 / Essentials | |
| Lenovo ThinkPad X1 Extreme G5-21DE003RGE | |
| Lenovo ThinkPad T16 G1 21CHCTO1WW | |
| Lenovo ThinkPad Z16 G1 21D5S00T00 | |
| Average of class Office (3245 - 11594, n=68, last 2 years) | |
| HP ZBook Power 15 G9 6B8C4EA | |
| Lenovo ThinkPad T16 G1 21CH004MGE | |
| Lenovo ThinkPad P15v G2 21A9000XGE | |
| Average AMD Ryzen 5 PRO 6650U, AMD Radeon 660M (9578 - 9982, n=4) | |
| Lenovo ThinkPad T16 G1 21BWS00200 | |
| HP EliteBook 865 G9 | |
| PCMark 10 / Productivity | |
| Average of class Office (5336 - 17243, n=68, last 2 years) | |
| Lenovo ThinkPad X1 Extreme G5-21DE003RGE | |
| Lenovo ThinkPad T16 G1 21CH004MGE | |
| Lenovo ThinkPad T16 G1 21CHCTO1WW | |
| HP EliteBook 865 G9 | |
| Average AMD Ryzen 5 PRO 6650U, AMD Radeon 660M (7848 - 9094, n=4) | |
| Lenovo ThinkPad Z16 G1 21D5S00T00 | |
| Lenovo ThinkPad P15v G2 21A9000XGE | |
| HP ZBook Power 15 G9 6B8C4EA | |
| Lenovo ThinkPad T16 G1 21BWS00200 | |
| PCMark 10 / Digital Content Creation | |
| Lenovo ThinkPad X1 Extreme G5-21DE003RGE | |
| Lenovo ThinkPad Z16 G1 21D5S00T00 | |
| HP ZBook Power 15 G9 6B8C4EA | |
| Average of class Office (2049 - 13541, n=68, last 2 years) | |
| HP EliteBook 865 G9 | |
| Lenovo ThinkPad P15v G2 21A9000XGE | |
| Lenovo ThinkPad T16 G1 21CHCTO1WW | |
| Lenovo ThinkPad T16 G1 21CH004MGE | |
| Average AMD Ryzen 5 PRO 6650U, AMD Radeon 660M (5837 - 6447, n=4) | |
| Lenovo ThinkPad T16 G1 21BWS00200 | |
| CrossMark / Overall | |
| Lenovo ThinkPad X1 Extreme G5-21DE003RGE | |
| HP ZBook Power 15 G9 6B8C4EA | |
| Average of class Office (381 - 2010, n=75, last 2 years) | |
| Lenovo ThinkPad Z16 G1 21D5S00T00 | |
| Lenovo ThinkPad T16 G1 21CH004MGE | |
| Average AMD Ryzen 5 PRO 6650U, AMD Radeon 660M (1338 - 1432, n=3) | |
| Lenovo ThinkPad T16 G1 21BWS00200 | |
| Lenovo ThinkPad P15v G2 21A9000XGE | |
| Lenovo ThinkPad T16 G1 21CHCTO1WW | |
| HP EliteBook 865 G9 | |
| CrossMark / Productivity | |
| Lenovo ThinkPad X1 Extreme G5-21DE003RGE | |
| HP ZBook Power 15 G9 6B8C4EA | |
| Lenovo ThinkPad Z16 G1 21D5S00T00 | |
| Average of class Office (464 - 1880, n=75, last 2 years) | |
| Lenovo ThinkPad T16 G1 21CH004MGE | |
| Average AMD Ryzen 5 PRO 6650U, AMD Radeon 660M (1366 - 1440, n=3) | |
| Lenovo ThinkPad T16 G1 21BWS00200 | |
| Lenovo ThinkPad P15v G2 21A9000XGE | |
| HP EliteBook 865 G9 | |
| Lenovo ThinkPad T16 G1 21CHCTO1WW | |
| CrossMark / Creativity | |
| HP ZBook Power 15 G9 6B8C4EA | |
| Lenovo ThinkPad X1 Extreme G5-21DE003RGE | |
| Average of class Office (319 - 2361, n=75, last 2 years) | |
| Lenovo ThinkPad Z16 G1 21D5S00T00 | |
| Lenovo ThinkPad T16 G1 21CH004MGE | |
| Average AMD Ryzen 5 PRO 6650U, AMD Radeon 660M (1397 - 1517, n=3) | |
| Lenovo ThinkPad T16 G1 21CHCTO1WW | |
| Lenovo ThinkPad P15v G2 21A9000XGE | |
| Lenovo ThinkPad T16 G1 21BWS00200 | |
| HP EliteBook 865 G9 | |
| CrossMark / Responsiveness | |
| Lenovo ThinkPad X1 Extreme G5-21DE003RGE | |
| HP ZBook Power 15 G9 6B8C4EA | |
| Lenovo ThinkPad T16 G1 21BWS00200 | |
| Average of class Office (360 - 1820, n=75, last 2 years) | |
| Lenovo ThinkPad Z16 G1 21D5S00T00 | |
| Lenovo ThinkPad T16 G1 21CH004MGE | |
| Average AMD Ryzen 5 PRO 6650U, AMD Radeon 660M (1106 - 1229, n=3) | |
| Lenovo ThinkPad P15v G2 21A9000XGE | |
| HP EliteBook 865 G9 | |
| Lenovo ThinkPad T16 G1 21CHCTO1WW | |
| Mozilla Kraken 1.1 / Total | |
| Lenovo ThinkPad T16 G1 21CHCTO1WW | |
| Average AMD Ryzen 5 PRO 6650U, AMD Radeon 660M (615 - 707, n=4) | |
| Lenovo ThinkPad P15v G2 21A9000XGE | |
| Lenovo ThinkPad T16 G1 21CH004MGE | |
| HP EliteBook 865 G9 | |
| Lenovo ThinkPad T16 G1 21BWS00200 | |
| Lenovo ThinkPad Z16 G1 21D5S00T00 | |
| Average of class Office (391 - 1297, n=78, last 2 years) | |
| HP ZBook Power 15 G9 6B8C4EA | |
| Lenovo ThinkPad X1 Extreme G5-21DE003RGE | |
| Speedometer 2.0 / Result 2.0 | |
| Average of class Office (173 - 640, n=18, last 2 years) | |
| HP ZBook Power 15 G9 6B8C4EA | |
| Lenovo ThinkPad X1 Extreme G5-21DE003RGE | |
| Lenovo ThinkPad T16 G1 21BWS00200 | |
| HP EliteBook 865 G9 | |
| Lenovo ThinkPad T16 G1 21CH004MGE | |
| Average AMD Ryzen 5 PRO 6650U, AMD Radeon 660M (n=1) | |
| Octane V2 / Total Score | |
| Average of class Office (49011 - 126830, n=20, last 2 years) | |
| Lenovo ThinkPad X1 Extreme G5-21DE003RGE | |
| HP ZBook Power 15 G9 6B8C4EA | |
| Lenovo ThinkPad T16 G1 21BWS00200 | |
| Lenovo ThinkPad T16 G1 21CH004MGE | |
| Average AMD Ryzen 5 PRO 6650U, AMD Radeon 660M (n=1) | |
| HP EliteBook 865 G9 | |
| Jetstream 2 / 2.0 Total | |
| Average of class Office (126.6 - 483, n=21, last 2 years) | |
| HP ZBook Power 15 G9 6B8C4EA | |
| Lenovo ThinkPad T16 G1 21BWS00200 | |
| Lenovo ThinkPad X1 Extreme G5-21DE003RGE | |
| Average AMD Ryzen 5 PRO 6650U, AMD Radeon 660M (n=1) | |
| Lenovo ThinkPad T16 G1 21CH004MGE | |
| HP EliteBook 865 G9 | |
| WebXPRT 3 / Overall | |
| HP ZBook Power 15 G9 6B8C4EA | |
| Average of class Office (129.9 - 444, n=77, last 2 years) | |
| Lenovo ThinkPad X1 Extreme G5-21DE003RGE | |
| HP EliteBook 865 G9 | |
| Lenovo ThinkPad T16 G1 21BWS00200 | |
| Lenovo ThinkPad P15v G2 21A9000XGE | |
| Lenovo ThinkPad Z16 G1 21D5S00T00 | |
| Lenovo ThinkPad T16 G1 21CH004MGE | |
| Average AMD Ryzen 5 PRO 6650U, AMD Radeon 660M (225 - 242, n=4) | |
| Lenovo ThinkPad T16 G1 21CHCTO1WW | |
| WebXPRT 4 / Overall | |
| HP ZBook Power 15 G9 6B8C4EA | |
| Average of class Office (104.2 - 313, n=77, last 2 years) | |
| Lenovo ThinkPad X1 Extreme G5-21DE003RGE | |
| Lenovo ThinkPad T16 G1 21BWS00200 | |
| HP EliteBook 865 G9 | |
| Lenovo ThinkPad T16 G1 21CH004MGE | |
| Lenovo ThinkPad Z16 G1 21D5S00T00 | |
| Average AMD Ryzen 5 PRO 6650U, AMD Radeon 660M (176.4 - 206, n=4) | |
| Lenovo ThinkPad T16 G1 21CHCTO1WW | |
* ... smaller is better
| PCMark 10 Score | 5958 points | |
Help | ||
| AIDA64 / Memory Copy | |
| Average of class Office (20075 - 110930, n=80, last 2 years) | |
| HP ZBook Power 15 G9 6B8C4EA | |
| Lenovo ThinkPad Z16 G1 21D5S00T00 | |
| Lenovo ThinkPad T16 G1 21CHCTO1WW | |
| Lenovo ThinkPad T16 G1 21CH004MGE | |
| Average AMD Ryzen 5 PRO 6650U (31014 - 48558, n=4) | |
| Lenovo ThinkPad X1 Extreme G5-21DE003RGE | |
| HP EliteBook 865 G9 | |
| Lenovo ThinkPad P15v G2 21A9000XGE | |
| Lenovo ThinkPad T16 G1 21BWS00200 | |
| AIDA64 / Memory Read | |
| HP ZBook Power 15 G9 6B8C4EA | |
| Average of class Office (10084 - 128030, n=81, last 2 years) | |
| Lenovo ThinkPad Z16 G1 21D5S00T00 | |
| Lenovo ThinkPad T16 G1 21CHCTO1WW | |
| Lenovo ThinkPad T16 G1 21CH004MGE | |
| Average AMD Ryzen 5 PRO 6650U (34690 - 39833, n=4) | |
| Lenovo ThinkPad X1 Extreme G5-21DE003RGE | |
| HP EliteBook 865 G9 | |
| Lenovo ThinkPad P15v G2 21A9000XGE | |
| Lenovo ThinkPad T16 G1 21BWS00200 | |
| AIDA64 / Memory Write | |
| Average of class Office (20073 - 119858, n=81, last 2 years) | |
| HP ZBook Power 15 G9 6B8C4EA | |
| Lenovo ThinkPad Z16 G1 21D5S00T00 | |
| Lenovo ThinkPad T16 G1 21CH004MGE | |
| Lenovo ThinkPad T16 G1 21CHCTO1WW | |
| Average AMD Ryzen 5 PRO 6650U (34563 - 51117, n=4) | |
| HP EliteBook 865 G9 | |
| Lenovo ThinkPad X1 Extreme G5-21DE003RGE | |
| Lenovo ThinkPad T16 G1 21BWS00200 | |
| Lenovo ThinkPad P15v G2 21A9000XGE | |
| AIDA64 / Memory Latency | |
| Lenovo ThinkPad T16 G1 21CHCTO1WW | |
| Lenovo ThinkPad Z16 G1 21D5S00T00 | |
| Lenovo ThinkPad T16 G1 21CH004MGE | |
| Average AMD Ryzen 5 PRO 6650U (91.6 - 126.5, n=4) | |
| Average of class Office (7.6 - 162.9, n=76, last 2 years) | |
| Lenovo ThinkPad P15v G2 21A9000XGE | |
| Lenovo ThinkPad T16 G1 21BWS00200 | |
| HP EliteBook 865 G9 | |
| HP ZBook Power 15 G9 6B8C4EA | |
| Lenovo ThinkPad X1 Extreme G5-21DE003RGE | |
* ... smaller is better
DPC延迟
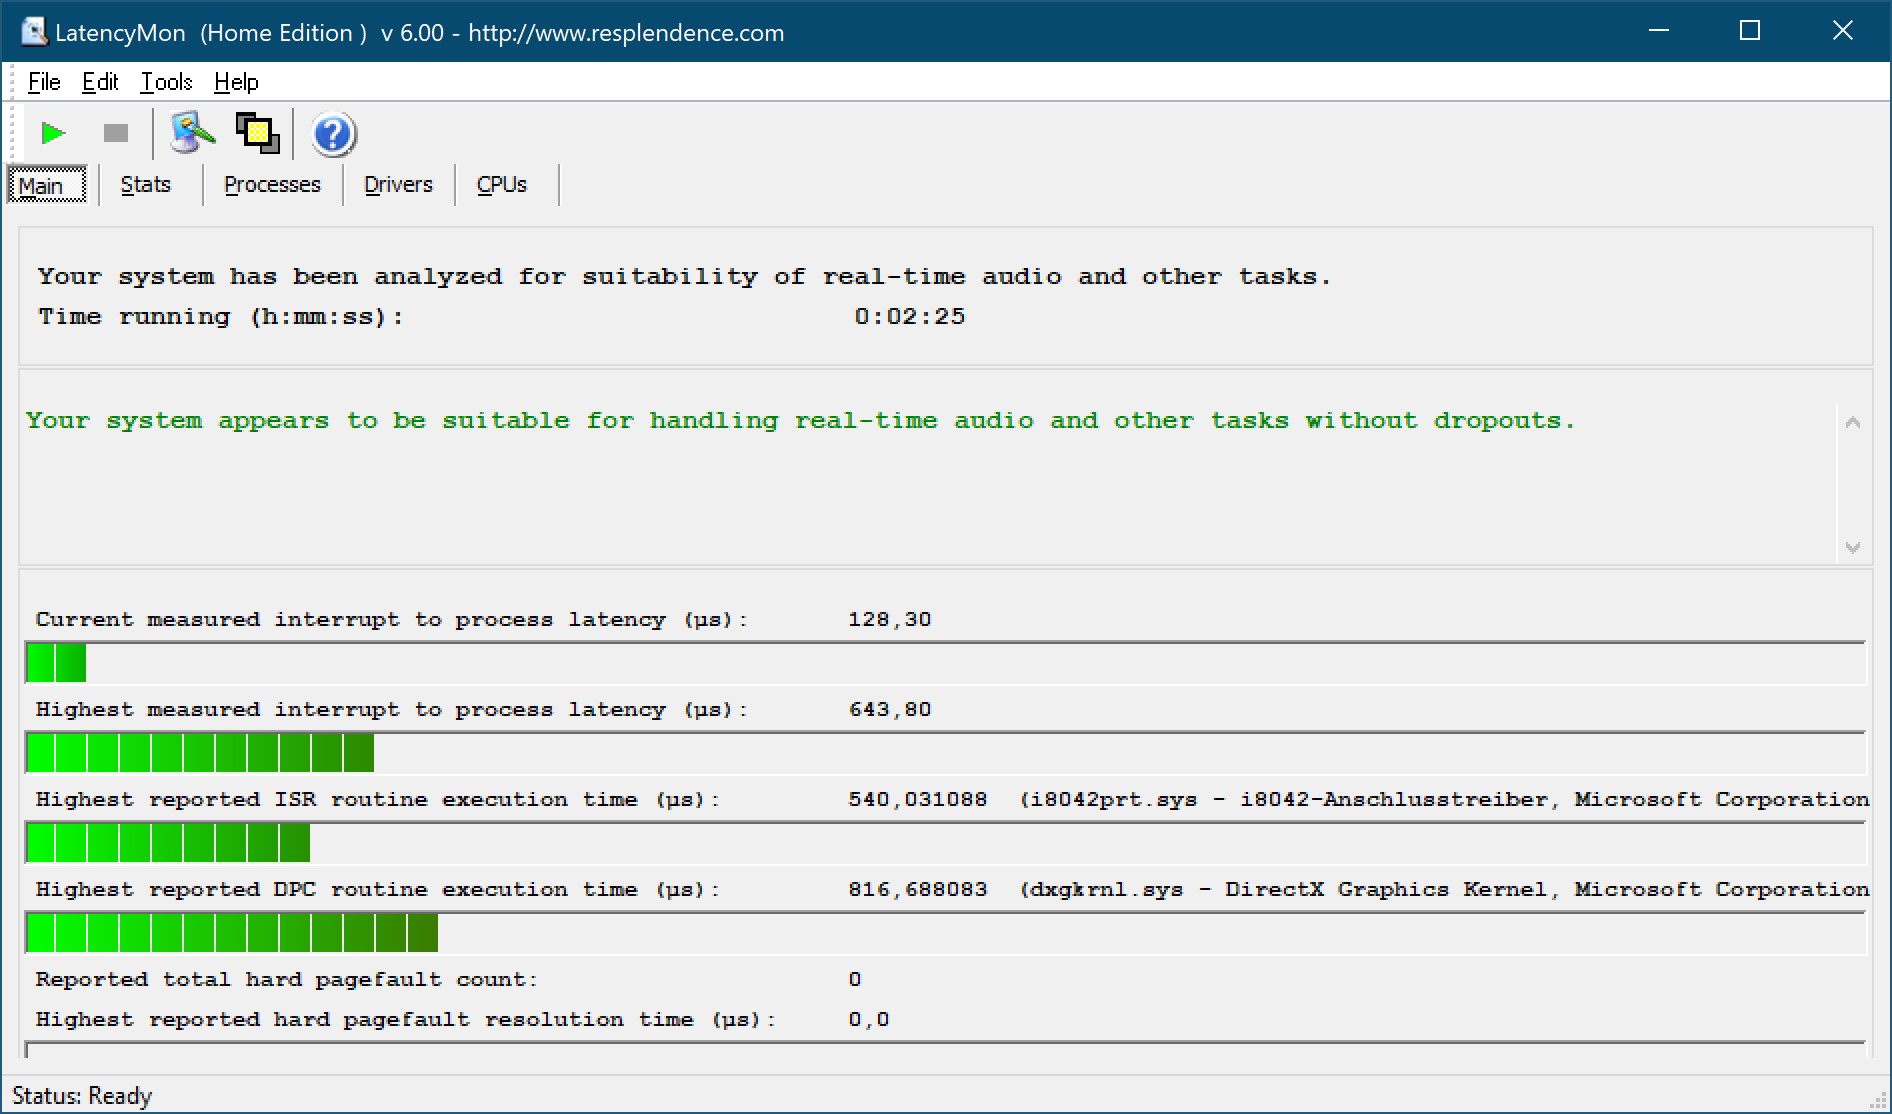
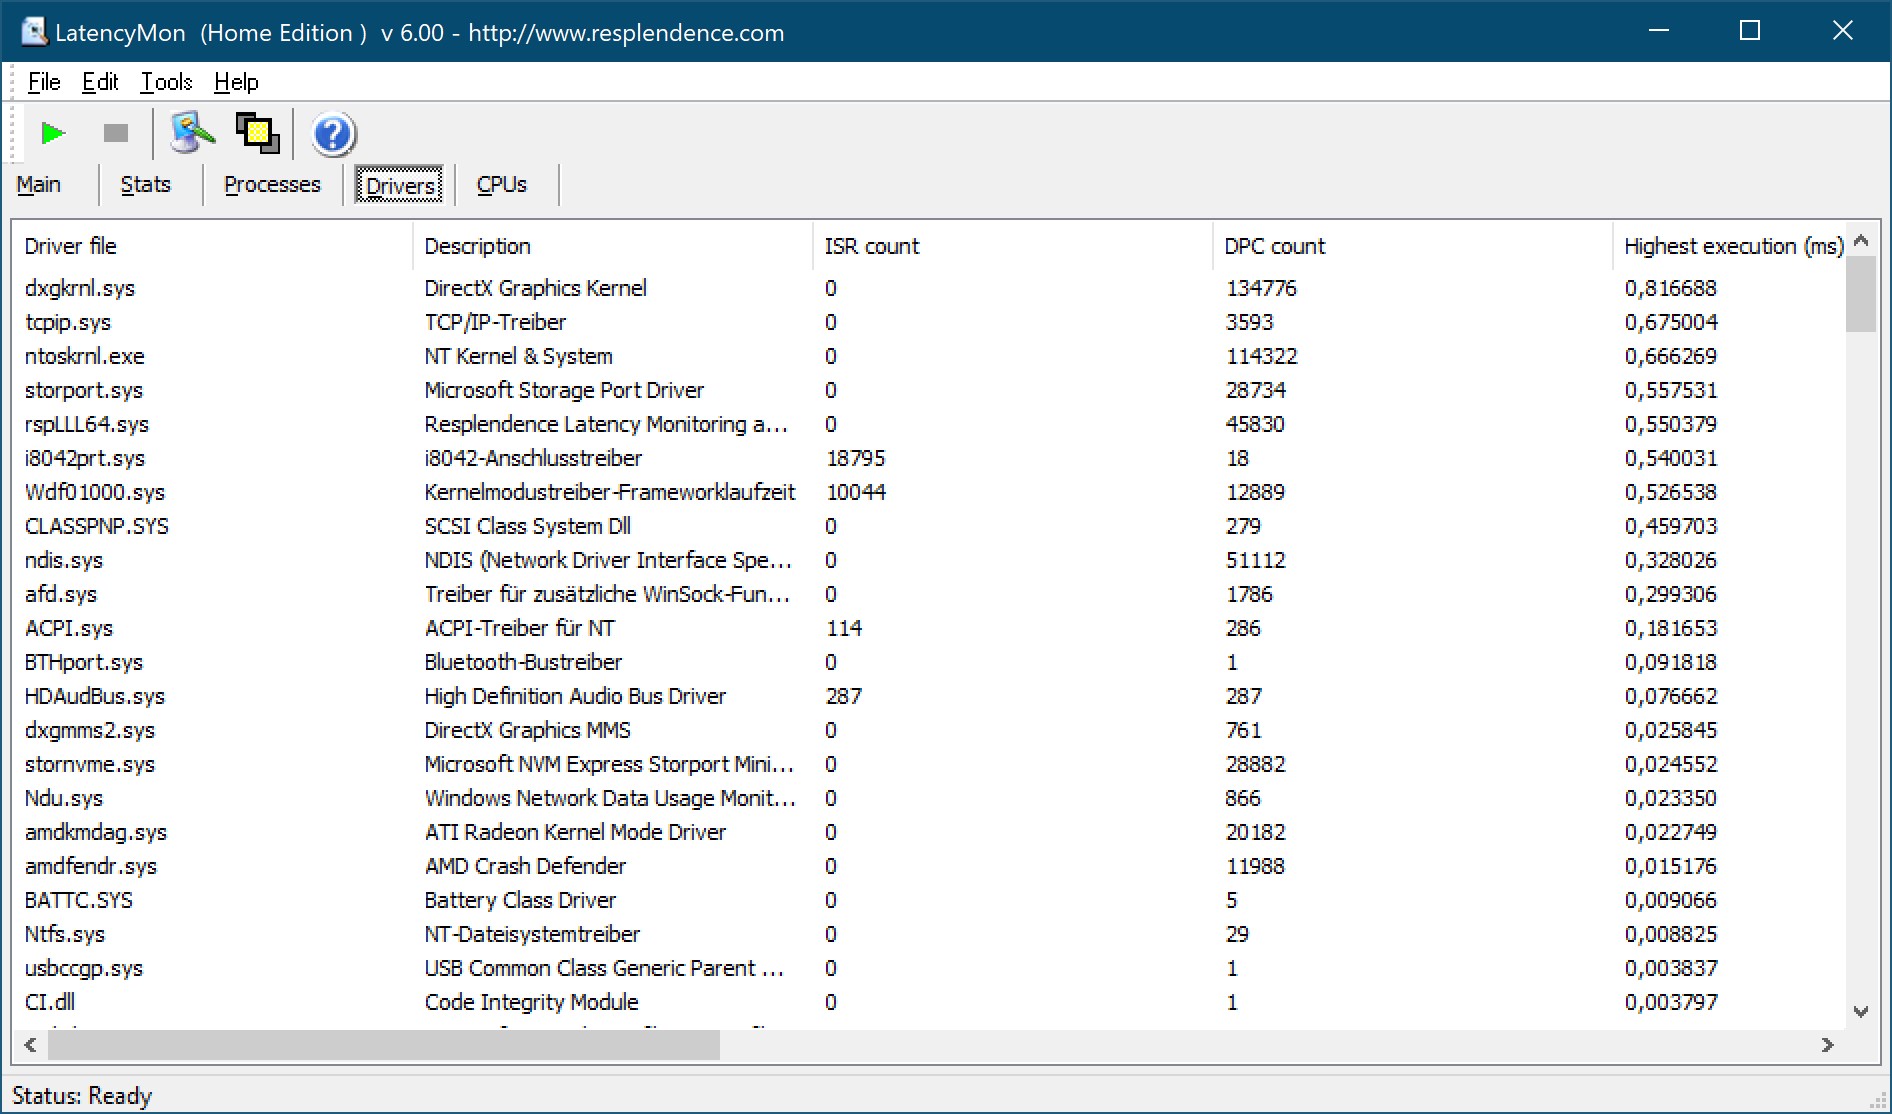

| DPC Latencies / LatencyMon - interrupt to process latency (max), Web, Youtube, Prime95 | |
| Lenovo ThinkPad T16 G1 21BWS00200 | |
| Lenovo ThinkPad X1 Extreme G5-21DE003RGE | |
| HP ZBook Power 15 G9 6B8C4EA | |
| Lenovo ThinkPad T16 G1 21CH004MGE | |
| Lenovo ThinkPad Z16 G1 21D5S00T00 | |
| HP EliteBook 865 G9 | |
* ... smaller is better
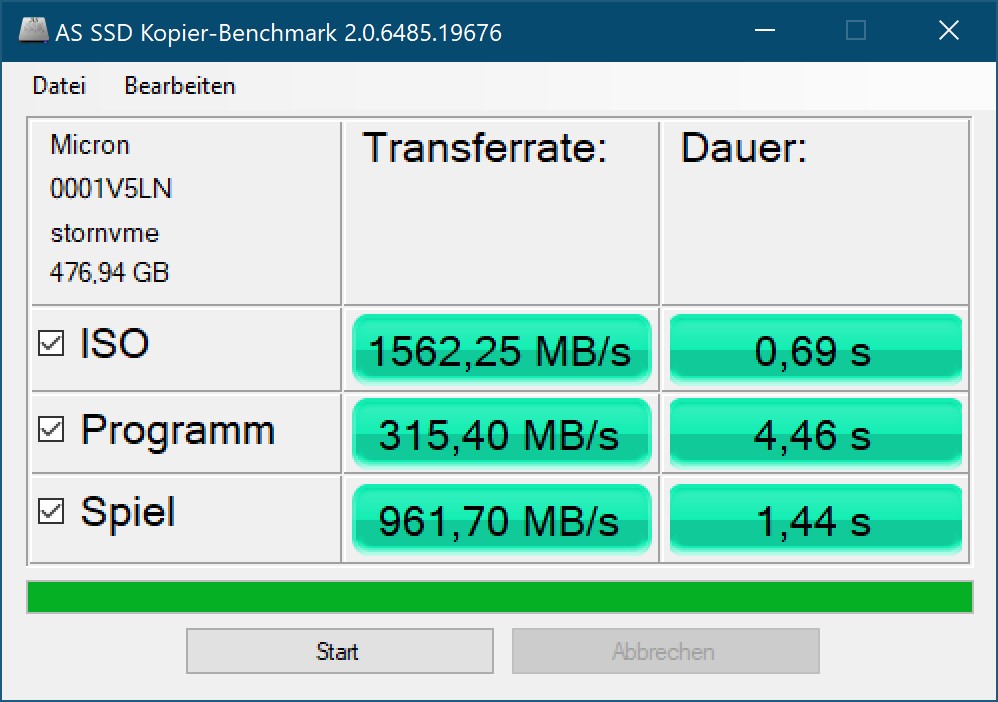
存储解决方案
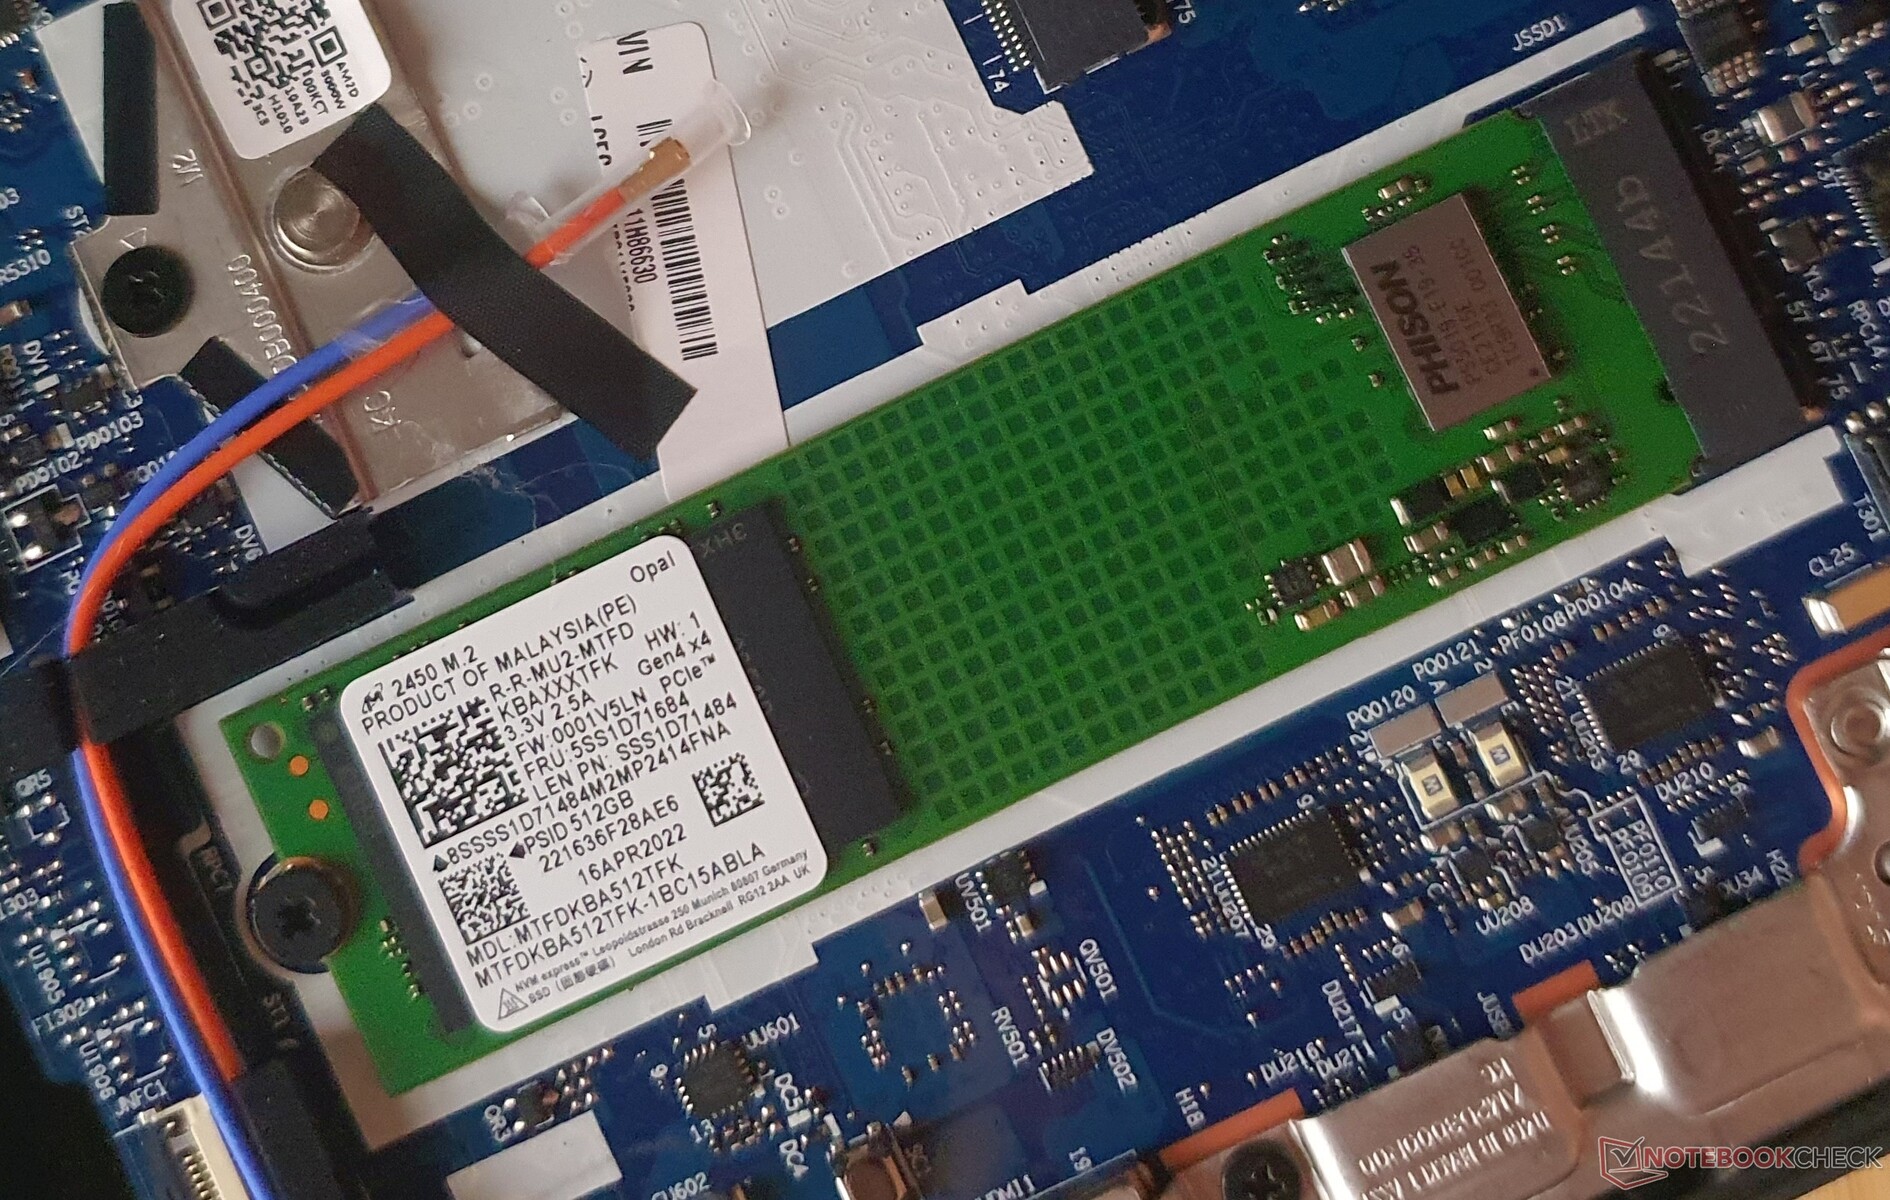
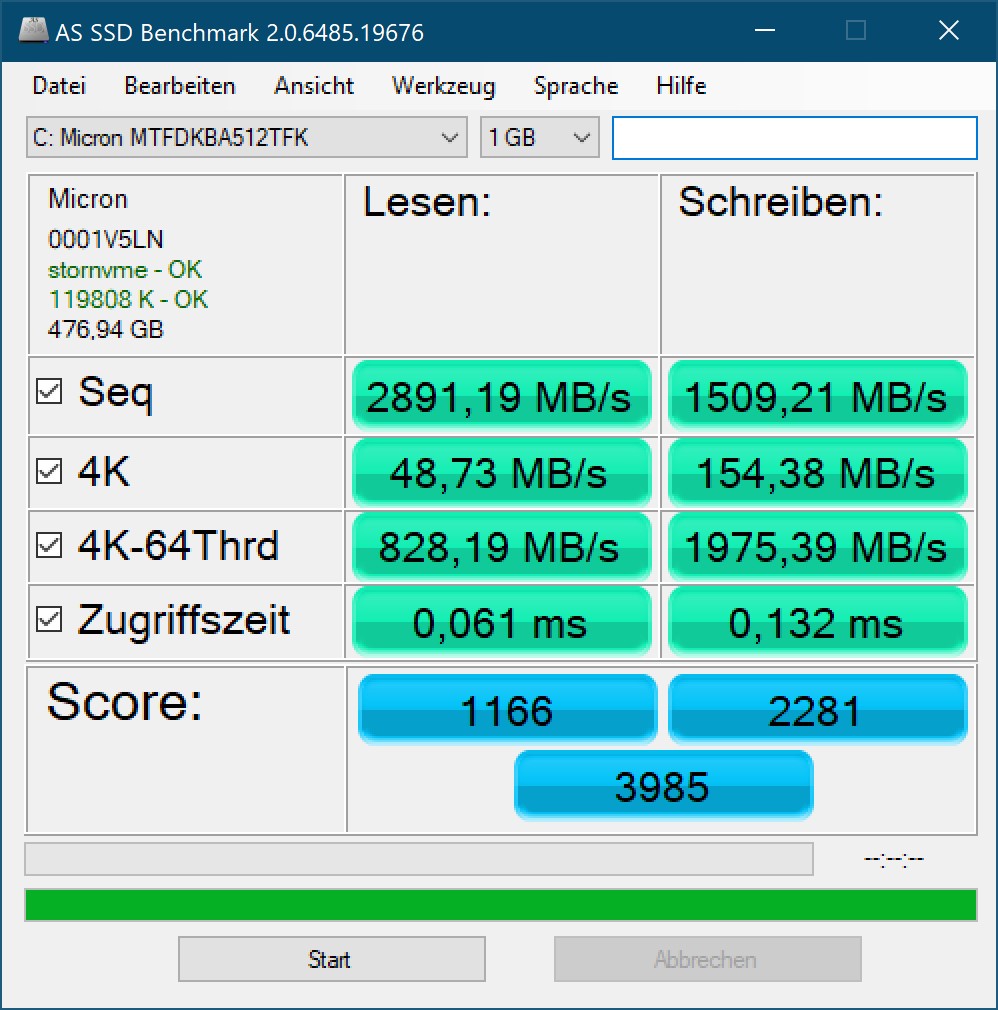
| Lenovo ThinkPad T16 G1 21CH004MGE Micron 2450 512GB MTFDKBA512TFK | Lenovo ThinkPad T16 G1 21BWS00200 Samsung PM9A1 MZVL2512HCJQ | Lenovo ThinkPad T16 G1 21CHCTO1WW Micron 2450 512GB MTFDKBA512TFK | HP EliteBook 865 G9 Samsung PM991 MZVLQ512HBLU | Lenovo ThinkPad Z16 G1 21D5S00T00 Samsung PM9A1 MZVL21T0HCLR | Lenovo ThinkPad X1 Extreme G5-21DE003RGE Micron 3400 1TB MTFDKBA1T0TFH | Lenovo ThinkPad P15v G2 21A9000XGE Toshiba XG6 KXG6AZNV512G | HP ZBook Power 15 G9 6B8C4EA Samsung PM9A1 MZVL21T0HCLR | |
|---|---|---|---|---|---|---|---|---|
| AS SSD | 16% | 20% | 2% | 32% | 38% | -8% | 50% | |
| Seq Read (MB/s) | 2891 | 3225 12% | 3107 7% | 2485 -14% | 4572.06 58% | 4766 65% | 2684 -7% | 5081 76% |
| Seq Write (MB/s) | 1509 | 1567 4% | 2965 96% | 1119 -26% | 2339.86 55% | 2159 43% | 1352 -10% | 1785 18% |
| 4K Read (MB/s) | 48.73 | 69.7 43% | 70 44% | 43.99 -10% | 63.1 29% | 44.61 -8% | 43.68 -10% | 76.86 58% |
| 4K Write (MB/s) | 154.38 | 170.9 11% | 166 8% | 117.89 -24% | 138.07 -11% | 141.69 -8% | 105.56 -32% | 197.01 28% |
| 4K-64 Read (MB/s) | 828 | 720 -13% | 1339 62% | 760.82 -8% | 863.66 4% | 877.37 6% | 976.92 18% | 912.6 10% |
| 4K-64 Write (MB/s) | 1975 | 2682 36% | 2101 6% | 1041.52 -47% | 2682.07 36% | 2594.6 31% | 1452.09 -26% | 3010.2 52% |
| Access Time Read * (ms) | 0.061 | 0.059 3% | 0.024 61% | 0.049 20% | 0.045 26% | 0.03 51% | 0.124 -103% | 0.02 67% |
| Access Time Write * (ms) | 0.132 | 0.024 82% | 0.171 -30% | 0.033 75% | 0.028 79% | 0.025 81% | 0.038 71% | 0.02 85% |
| Score Read (Points) | 1166 | 1112 -5% | 1719 47% | 1053 -10% | 1384 19% | 1399 20% | 1289 11% | 1498 28% |
| Score Write (Points) | 2281 | 3010 32% | 2563 12% | 1271 -44% | 3054 34% | 2952 29% | 1693 -26% | 3386 48% |
| Score Total (Points) | 3985 | 4630 16% | 5170 30% | 2805 -30% | 5050 27% | 4942 24% | 3582 -10% | 5506 38% |
| Copy ISO MB/s (MB/s) | 1562 | 1639 5% | 651 -58% | 1450.27 -7% | 2156.8 38% | 3591.64 130% | 1760.5 13% | 3596.51 130% |
| Copy Program MB/s (MB/s) | 315 | 326.8 4% | 408 30% | 681.41 116% | 426.1 35% | 422.46 34% | 355 13% | 418.84 33% |
| Copy Game MB/s (MB/s) | 962 | 942.7 -2% | 596 -38% | 1251.03 30% | 1157.07 20% | 1239.49 29% | 849 -12% | 1249.83 30% |
| DiskSpd | 22% | 57% | -24% | 32% | 21% | -13% | 37% | |
| seq read (MB/s) | 2012 | 3645 81% | 2309 15% | 1772 -12% | 3695 84% | 3210 60% | 2260 12% | 3945 96% |
| seq write (MB/s) | 2458 | 2809 14% | 3301 34% | 1535 -38% | 3294 34% | 2889 18% | 1837 -25% | 3039 24% |
| seq q8 t1 read (MB/s) | 3507 | 6524 86% | 3589 2% | 2741 -22% | 6628 89% | 6553 87% | 3290 -6% | 6481 85% |
| seq q8 t1 write (MB/s) | 3339 | 4812 44% | 3351 0% | 1606 -52% | 4957 48% | 4703 41% | 2902 -13% | 4914 47% |
| 4k q1 t1 read (MB/s) | 52.1 | 68.2 31% | 58.5 12% | 44.5 -15% | 65.4 26% | 48.7 -7% | 44.3 -15% | 78 50% |
| 4k q1 t1 write (MB/s) | 169.6 | 134.8 -21% | 66.6 -61% | 118 -30% | 134.8 -21% | 148.8 -12% | 113.3 -33% | 162.3 -4% |
| 4k q32 t16 read (MB/s) | 1066 | 683 -36% | 1445 36% | 814 -24% | 898 -16% | 883 -17% | 890 -17% | 866 -19% |
| 4k q32 t16 write (MB/s) | 365 | 293 -20% | 1877 414% | 361 -1% | 399 9% | 370 1% | 332 -9% | 426 17% |
| Total Average (Program / Settings) | 19% /
19% | 39% /
33% | -11% /
-8% | 32% /
32% | 30% /
32% | -11% /
-10% | 44% /
45% |
* ... smaller is better
* ... smaller is better
Disk Throttling: DiskSpd Read Loop, Queue Depth 8
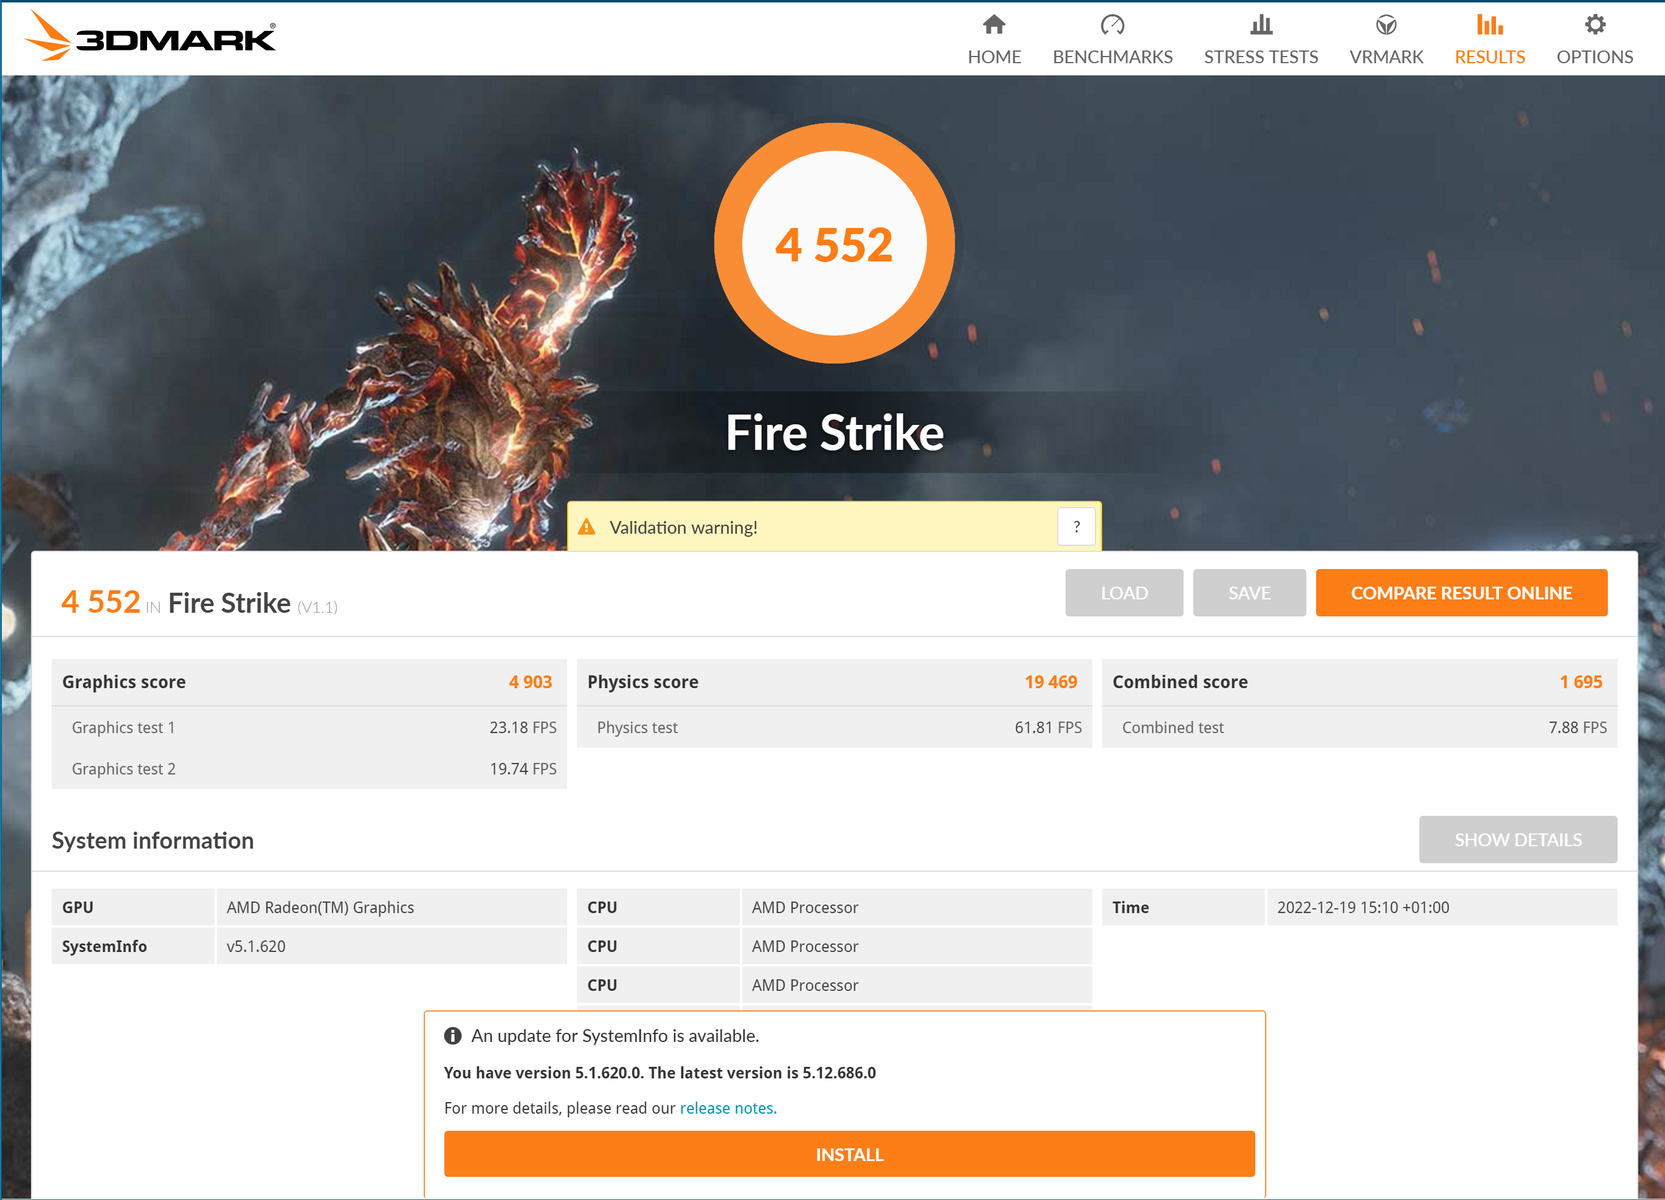
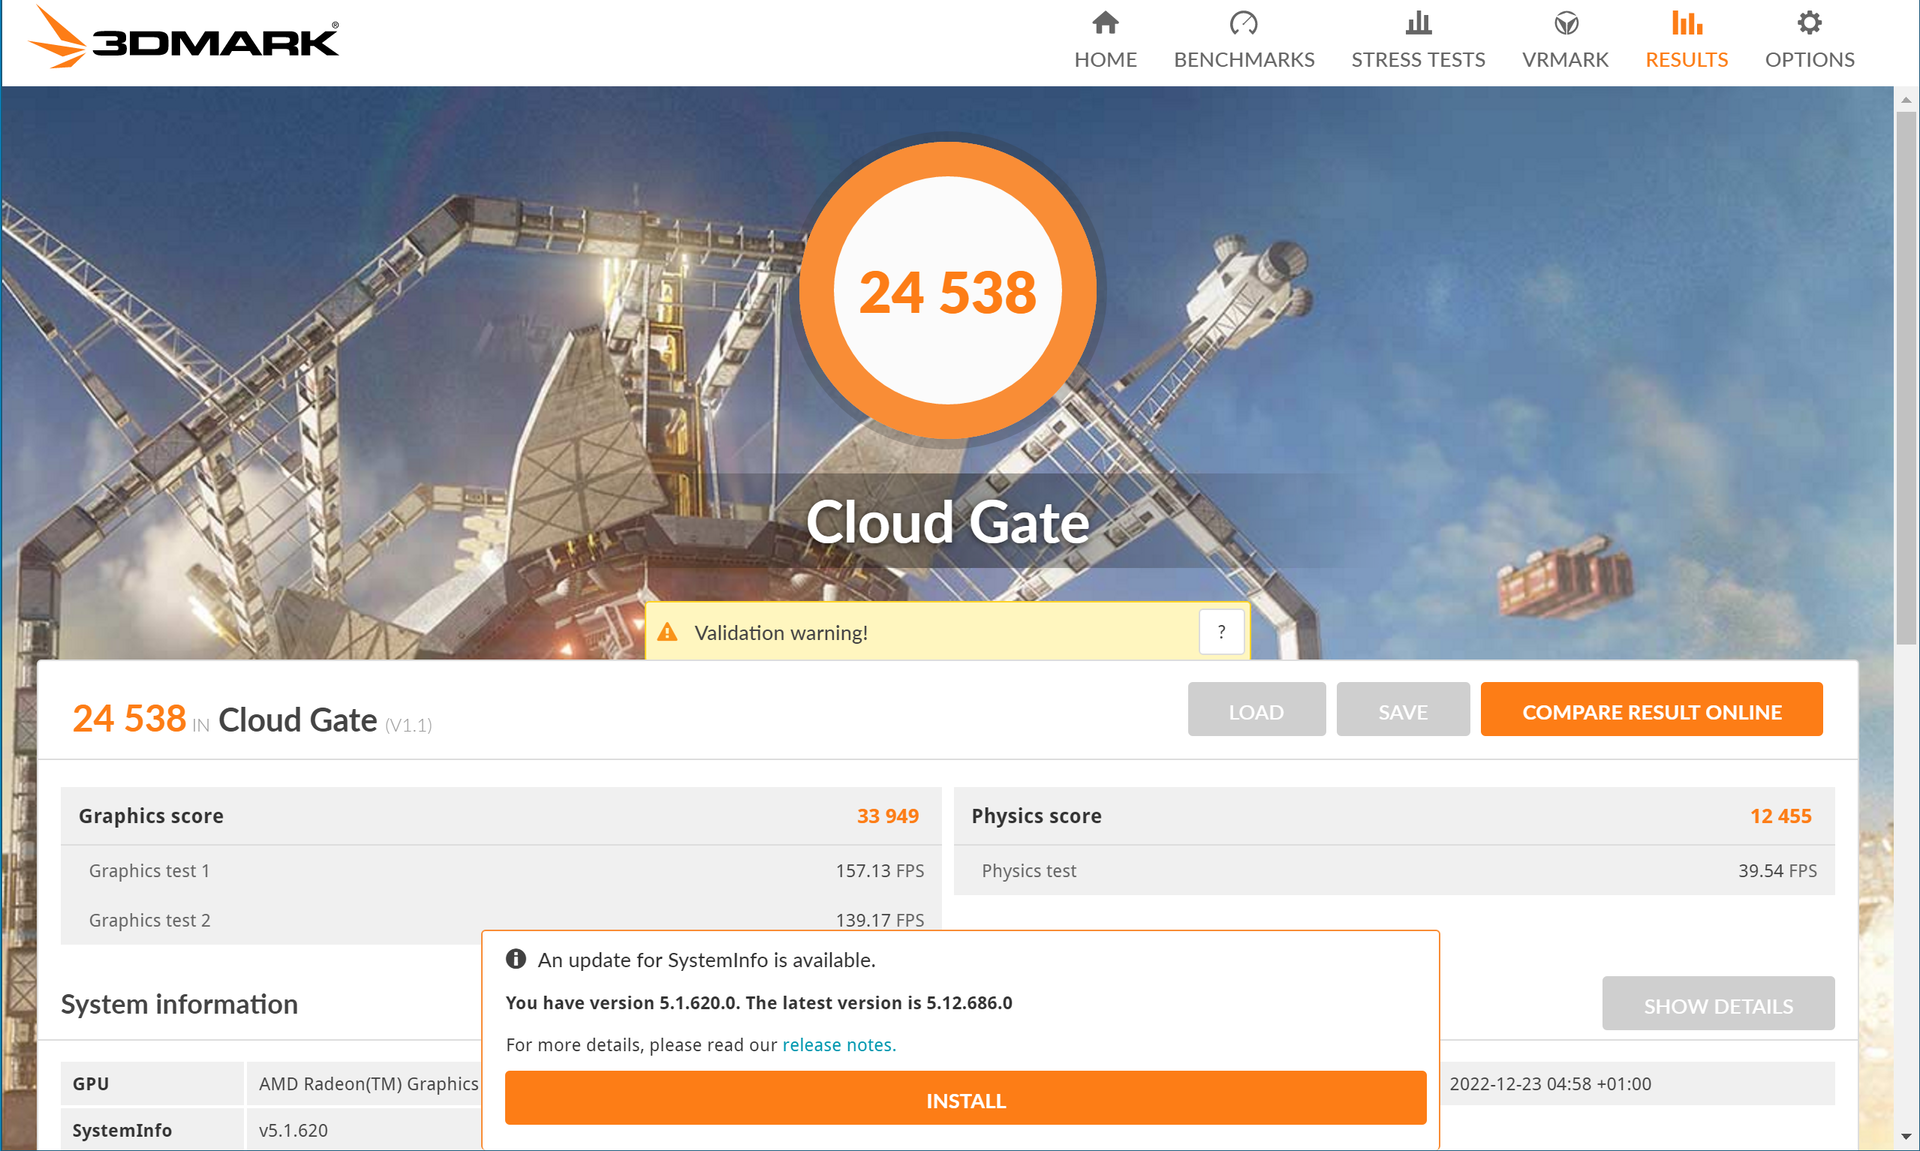
图形卡

AMD Radeon 660M这里使用的Ryzen 5 PRO是ThinkPad T16 AMD的两个单独可用的集成图形解决方案中较弱的一个。虽然老游戏可以在中高细节设置下玩,但新游戏最多只能在低设置下勉强玩,因为T16不是为游戏设计的。
在游戏过程中,一个英特尔Xe7 (96EUs)仍然落后约20%,而 Radeon 680M计算速度快了约45%。在电池运行中,可获得全部图形性能。
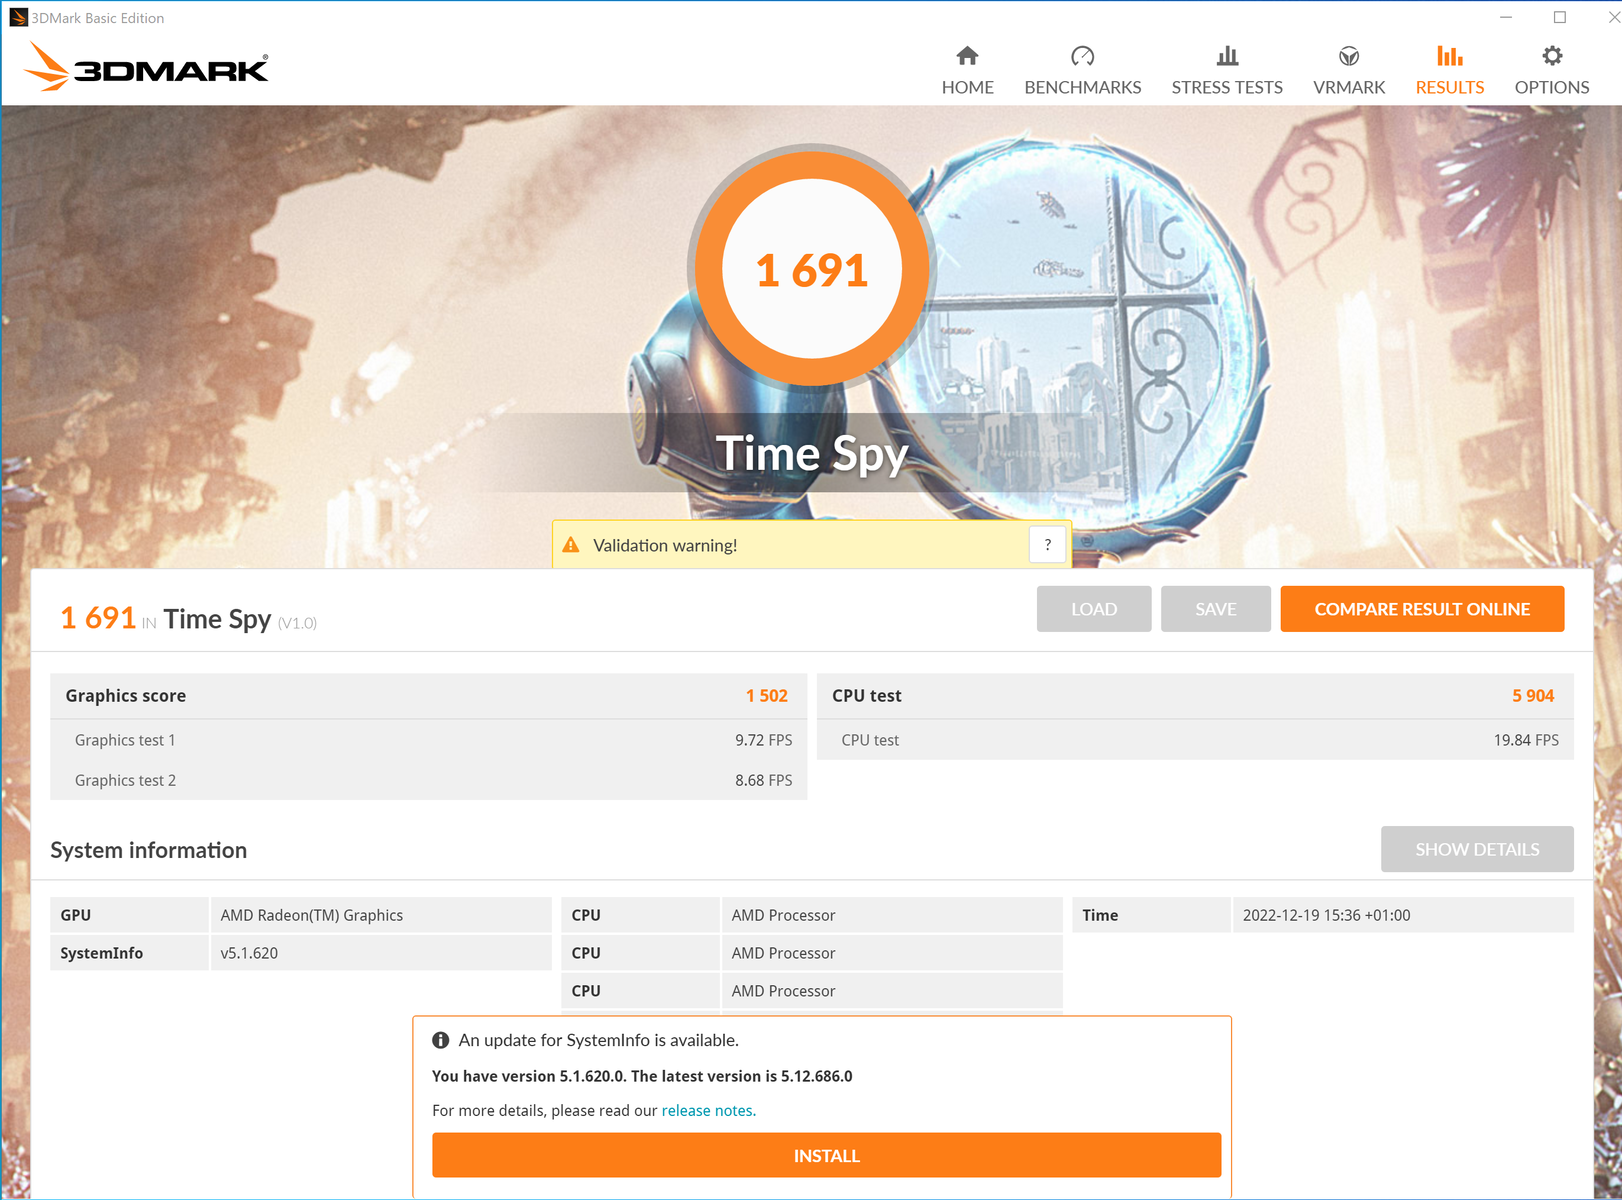

| 3DMark 11 Performance | 7403 points | |
| 3DMark Cloud Gate Standard Score | 24538 points | |
| 3DMark Fire Strike Score | 4552 points | |
| 3DMark Time Spy Score | 1691 points | |
Help | ||
| Blender | |
| v3.3 Classroom HIP/AMD | |
| Lenovo ThinkPad T16 G1 21CH004MGE | |
| HP EliteBook 865 G9 | |
| Average AMD Radeon 660M (438 - 755, n=8) | |
| Lenovo ThinkPad T16 G1 21CHCTO1WW | |
| Average of class Office (296 - 507, n=5, last 2 years) | |
| Lenovo ThinkPad T14 G3-21CF004NGE | |
| Lenovo ThinkPad Z16 G1 21D5S00T00 | |
| v3.3 Classroom OPTIX/RTX | |
| Average of class Office (29 - 242, n=2, last 2 years) | |
| HP ZBook Power 15 G9 6B8C4EA | |
| v3.3 Classroom CPU | |
| Lenovo ThinkPad T16 G1 21BWS00200 | |
| Lenovo ThinkPad T16 Gen 1 Core i7-1270P | |
| Average AMD Radeon 660M (323 - 968, n=13) | |
| Average of class Office (245 - 3219, n=75, last 2 years) | |
| Lenovo ThinkPad T16 G1 21CH004MGE | |
| Lenovo ThinkPad Z16 G1 21D5S00T00 | |
| Lenovo ThinkPad T14 G3-21CF004NGE | |
| HP EliteBook 865 G9 | |
| Lenovo ThinkPad T16 G1 21CHCTO1WW | |
| HP ZBook Power 15 G9 6B8C4EA | |
* ... smaller is better
The Witcher 3 FPS Chart
| low | med. | high | ultra | |
|---|---|---|---|---|
| GTA V (2015) | 132.5 | 120 | 40.7 | 18 |
| The Witcher 3 (2015) | 90.5 | 52.5 | 27.1 | 17.9 |
| Dota 2 Reborn (2015) | 109.3 | 99.3 | 61 | 52.9 |
| Final Fantasy XV Benchmark (2018) | 51.6 | 24.3 | 17.4 | |
| X-Plane 11.11 (2018) | 49.1 | 33.7 | 29.3 | |
| Far Cry 5 (2018) | 61 | 31 | 26 | 25 |
| Strange Brigade (2018) | 120.7 | 44.5 | 35.3 | 29.7 |
| Shadow of the Tomb Raider (2018) | 77 | 29 | 27 | 23 |
| God of War (2022) | 23.9 | 18.9 | 16.1 | 10.8 |
排放。大多数时候,ThinkPad T16 AMD保持沉默
噪声水平
在空闲操作和执行简单任务时,如网上冲浪、启动应用程序和办公室工作,风扇大多保持关闭或几乎听不到。只有在持续或综合负载(游戏)的情况下,风扇才会在数分钟后转速上升。尽管这时它不再安静,最大为39dB(A),但它产生的声音频率很舒服。
另一方面,我们的第二台ThinkPad T16 AMD测试设备有一个非常高频率的风扇,T16/T14和P16s/P14s的其他用户也提到了这一点https://thinkpad-forum.de/threads/p14s-gen-3-amd-hochfrequenter-l%C3%BCfter-fiepton-t%C3%B6tet-hirnzellen-allg-problem-l%C3%BCftertausch-denkbar.235051/.
Noise level
| Idle |
| 23.1 / 23.1 / 23.1 dB(A) |
| Load |
| 25.4 / 39.1 dB(A) |
 | ||
30 dB silent 40 dB(A) audible 50 dB(A) loud |
||
min: | ||
| Lenovo ThinkPad T16 G1 21CH004MGE Radeon 660M, R5 PRO 6650U, Micron 2450 512GB MTFDKBA512TFK | Lenovo ThinkPad T16 G1 21BWS00200 Iris Xe G7 80EUs, i5-1240P, Samsung PM9A1 MZVL2512HCJQ | HP EliteBook 865 G9 Radeon 680M, R7 PRO 6850U, Samsung PM991 MZVLQ512HBLU | Lenovo ThinkPad Z16 G1 21D5S00T00 Radeon RX 6500M, R7 PRO 6850H, Samsung PM9A1 MZVL21T0HCLR | Lenovo ThinkPad T14 G3-21CF004NGE Radeon 680M, R7 PRO 6850U, Kioxia BG5 KBG5AZNV512G | Lenovo ThinkPad P15v G2 21A9000XGE T1200 Laptop GPU, i7-11800H, Toshiba XG6 KXG6AZNV512G | HP ZBook Power 15 G9 6B8C4EA RTX A2000 Laptop GPU, i7-12700H, Samsung PM9A1 MZVL21T0HCLR | |
|---|---|---|---|---|---|---|---|
| Noise | 3% | 3% | -9% | -7% | -15% | -18% | |
| off / environment * (dB) | 23.1 | 23.3 -1% | 23 -0% | 23.7 -3% | 24.2 -5% | 25.21 -9% | 23.8 -3% |
| Idle Minimum * (dB) | 23.1 | 23.3 -1% | 23 -0% | 23.7 -3% | 24.2 -5% | 25.21 -9% | 23.8 -3% |
| Idle Average * (dB) | 23.1 | 23.3 -1% | 23 -0% | 23.7 -3% | 24.2 -5% | 25.21 -9% | 23.8 -3% |
| Idle Maximum * (dB) | 23.1 | 23.3 -1% | 23 -0% | 23.7 -3% | 25.8 -12% | 25.21 -9% | 23.8 -3% |
| Load Average * (dB) | 25.4 | 25.1 1% | 29.1 -15% | 25.9 -2% | 32.2 -27% | 39.09 -54% | 42.9 -69% |
| Witcher 3 ultra * (dB) | 35.93 | 32.1 11% | 29.1 19% | 46.9 -31% | 34.1 5% | 36.6 -2% | 44.5 -24% |
| Load Maximum * (dB) | 39.1 | 34 13% | 32.9 16% | 46.9 -20% | 38.8 1% | 43.53 -11% | 47.9 -23% |
* ... smaller is better
温度
在任何时候,联想ThinkPad T16 G1 AMD的温度都保持得特别低。在最高负载期间,我们在机箱底部的一个区域测量到最高41.5°C(106.7°F)。在负载情况下,机箱顶部的温度为34.6 °C (94.3 °F),仍然明显低于英特尔型号的温度。 英特尔模型45 °C (113 °F)。
(+) The maximum temperature on the upper side is 34.6 °C / 94 F, compared to the average of 34.3 °C / 94 F, ranging from 21.2 to 62.5 °C for the class Office.
(±) The bottom heats up to a maximum of 41.5 °C / 107 F, compared to the average of 36.8 °C / 98 F
(+) In idle usage, the average temperature for the upper side is 21.9 °C / 71 F, compared to the device average of 29.5 °C / 85 F.
(+) Playing The Witcher 3, the average temperature for the upper side is 29.6 °C / 85 F, compared to the device average of 29.5 °C / 85 F.
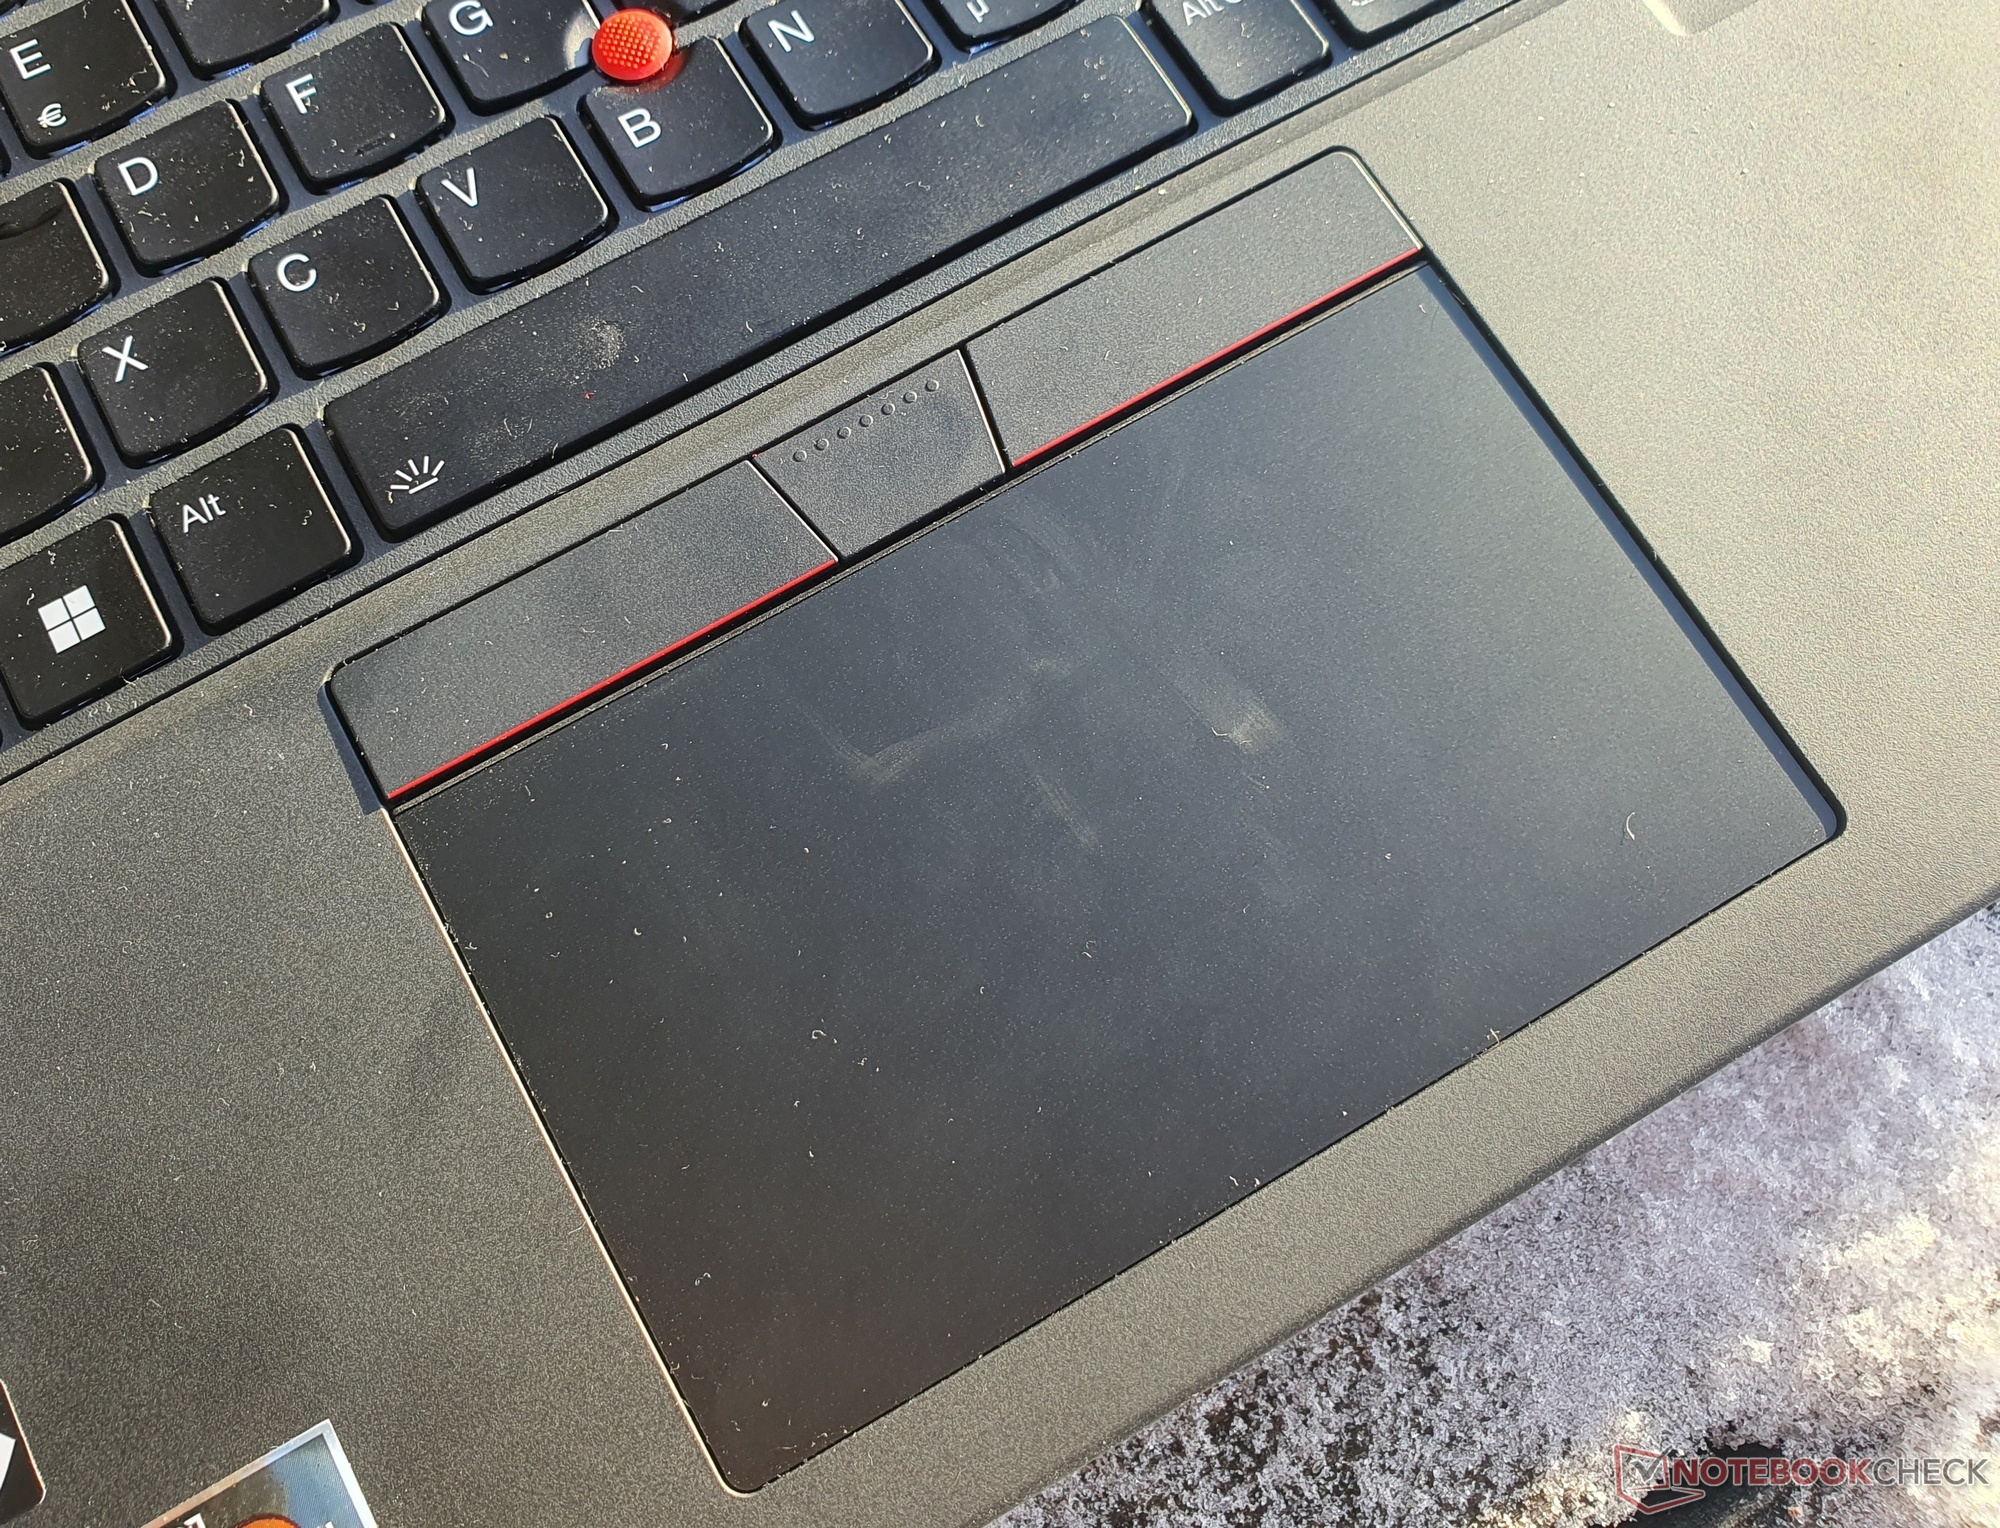
(+) The palmrests and touchpad are cooler than skin temperature with a maximum of 29 °C / 84.2 F and are therefore cool to the touch.
(±) The average temperature of the palmrest area of similar devices was 27.5 °C / 81.5 F (-1.5 °C / -2.7 F).
| Lenovo ThinkPad T16 G1 21CH004MGE AMD Ryzen 5 PRO 6650U, AMD Radeon 660M | Lenovo ThinkPad T16 G1 21BWS00200 Intel Core i5-1240P, Intel Iris Xe Graphics G7 80EUs | HP EliteBook 865 G9 AMD Ryzen 7 PRO 6850U, AMD Radeon 680M | Lenovo ThinkPad Z16 G1 21D5S00T00 AMD Ryzen 7 PRO 6850H, AMD Radeon RX 6500M | Lenovo ThinkPad T14 G3-21CF004NGE AMD Ryzen 7 PRO 6850U, AMD Radeon 680M | Lenovo ThinkPad P15v G2 21A9000XGE Intel Core i7-11800H, NVIDIA T1200 Laptop GPU | HP ZBook Power 15 G9 6B8C4EA Intel Core i7-12700H, NVIDIA RTX A2000 Laptop GPU | |
|---|---|---|---|---|---|---|---|
| Heat | -29% | -8% | -34% | -19% | -29% | -9% | |
| Maximum Upper Side * (°C) | 34.6 | 45 -30% | 39.4 -14% | 56.8 -64% | 48.2 -39% | 53.8 -55% | 40.3 -16% |
| Maximum Bottom * (°C) | 41.5 | 42.8 -3% | 47.6 -15% | 53.3 -28% | 52.8 -27% | 52.1 -26% | 48.3 -16% |
| Idle Upper Side * (°C) | 22.6 | 33 -46% | 23.6 -4% | 28.2 -25% | 24.4 -8% | 27.6 -22% | 23.7 -5% |
| Idle Bottom * (°C) | 24.5 | 33.6 -37% | 24.1 2% | 29.4 -20% | 24.5 -0% | 27.7 -13% | 23.8 3% |
* ... smaller is better
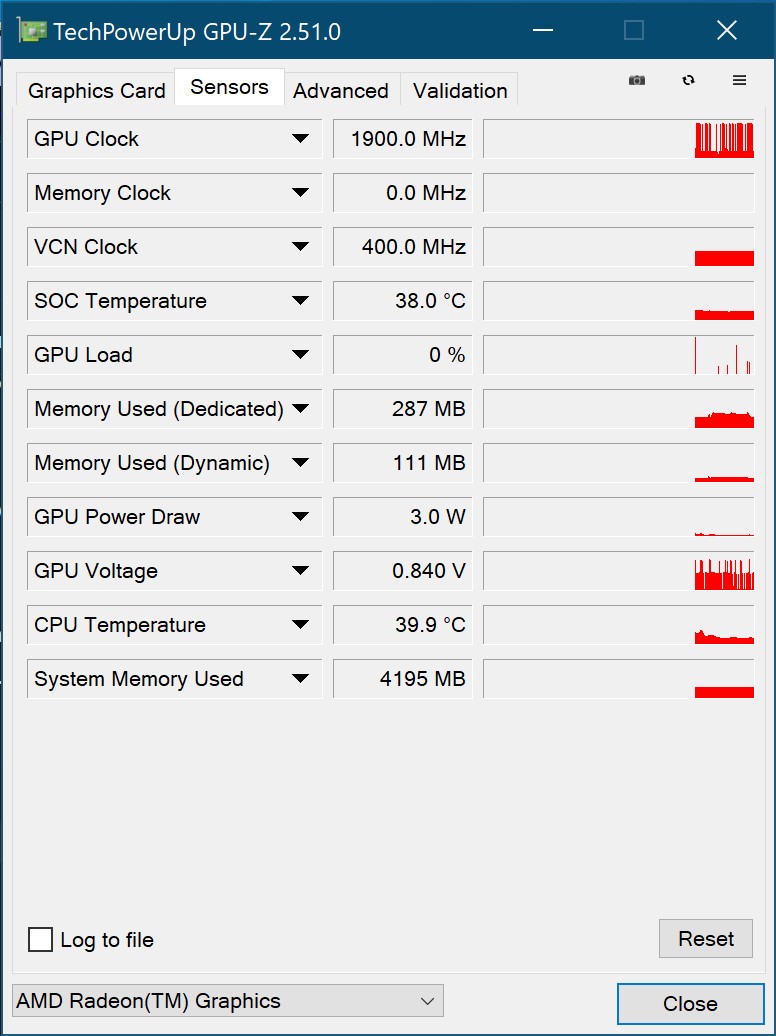
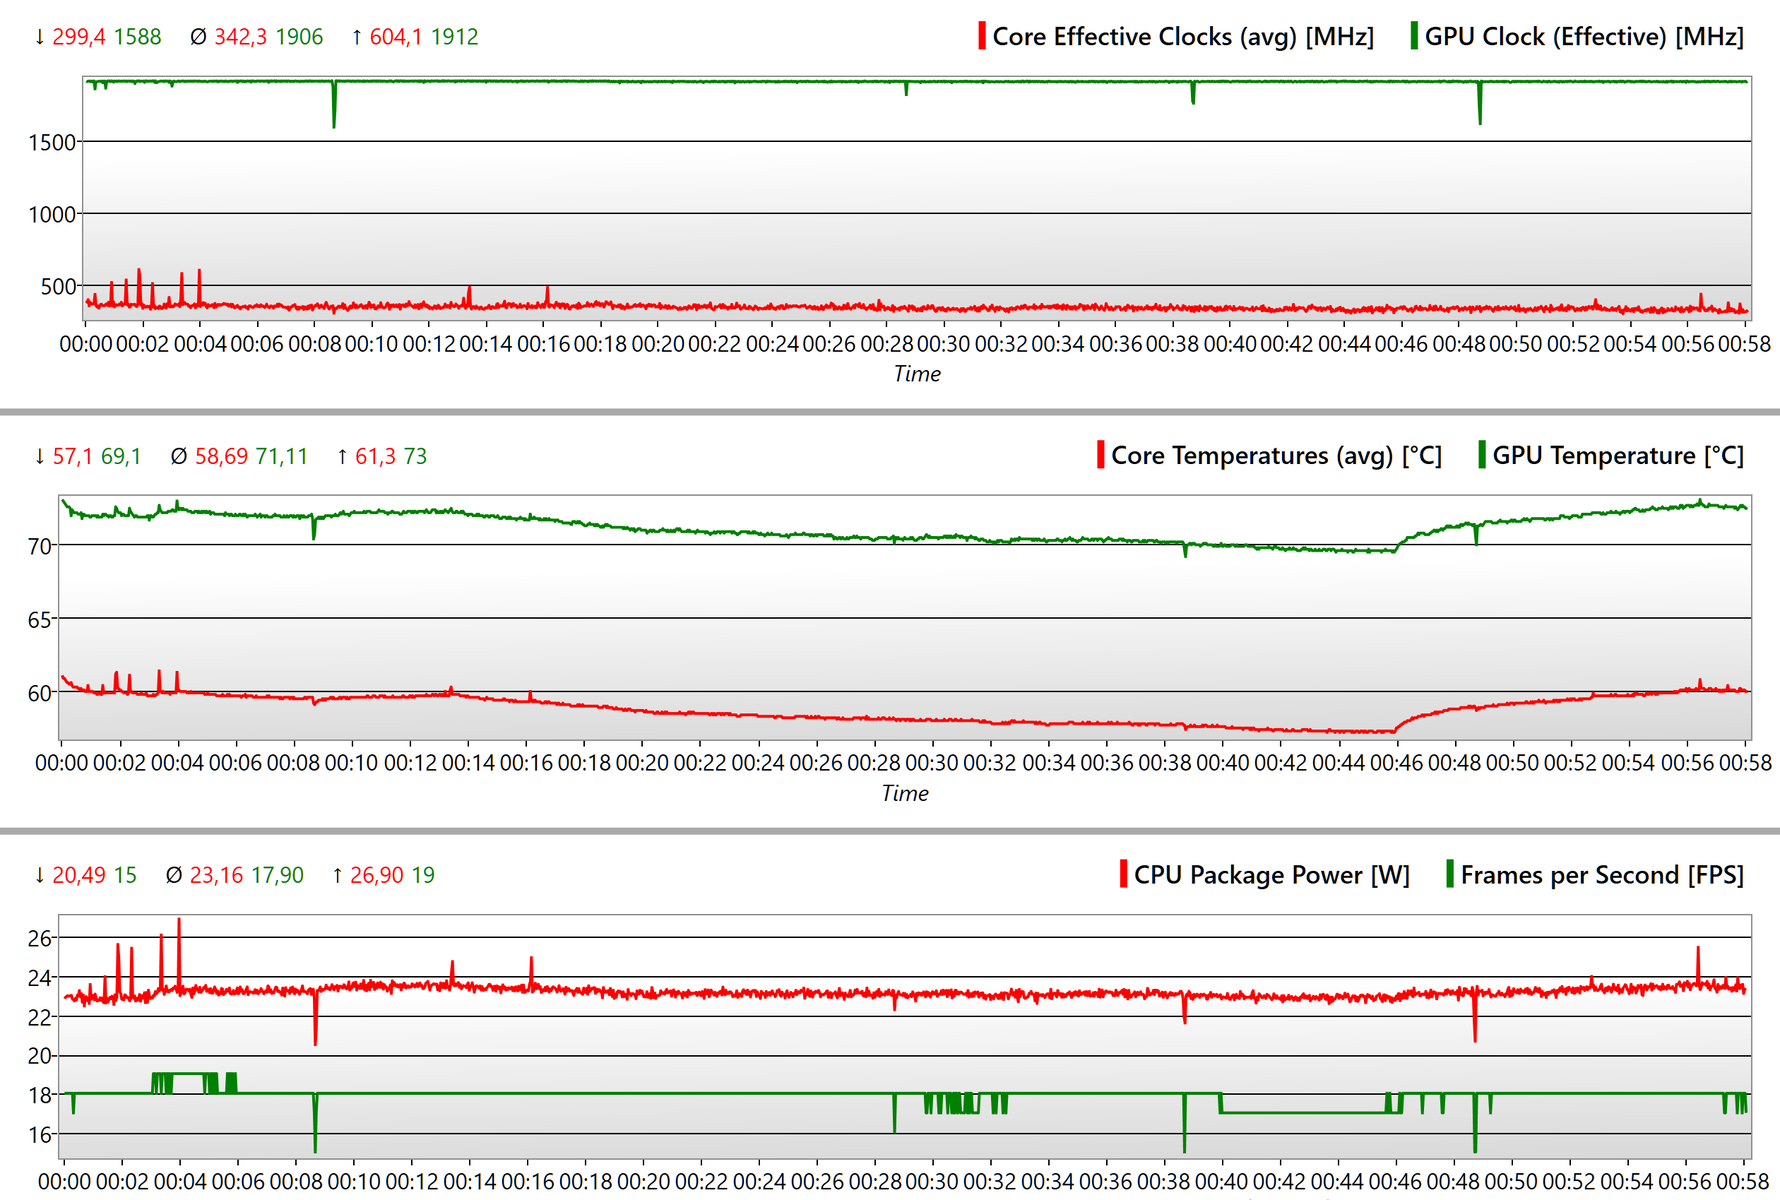
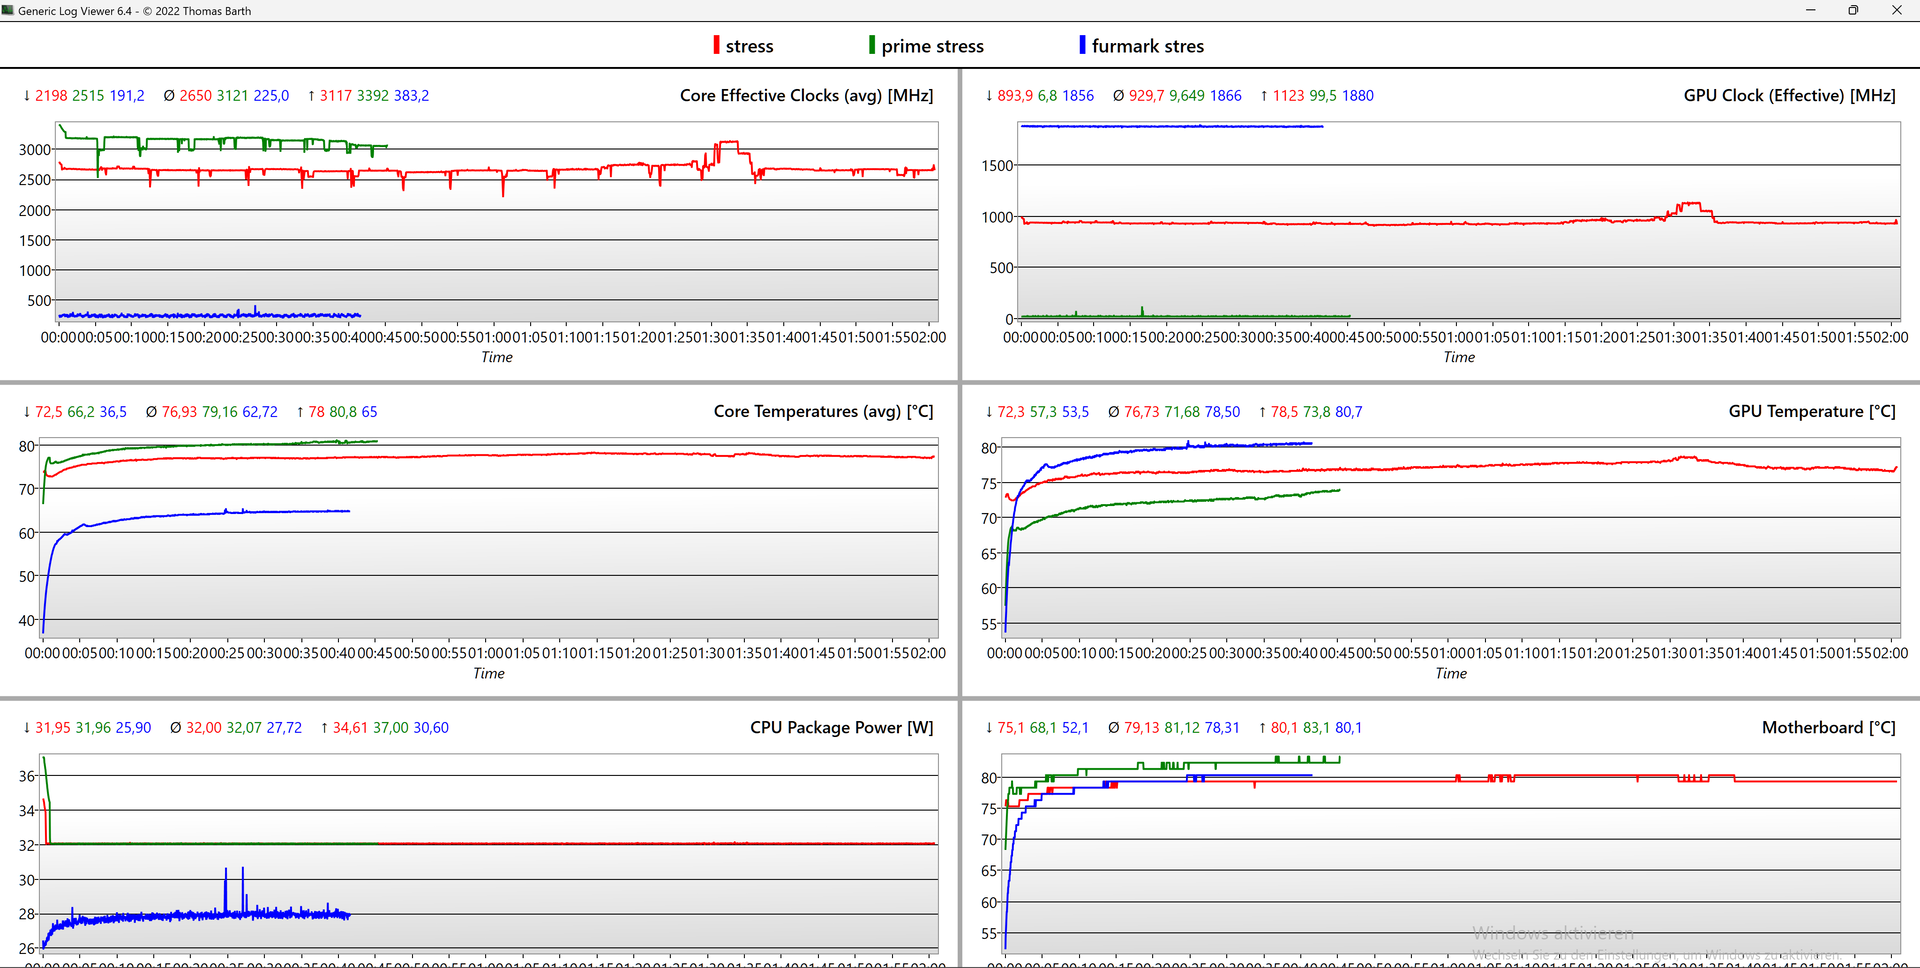
压力测试
在综合负载(Prime95 + FurMark)下的2.65 GHz,CPU速度略微低于2.9 GHz的基本时钟速度,核心温度仅达到77 °C(171 °F)。当时,iGPU只以其最大速度的一半左右运行,温度达到79℃(174°F)。
在纯粹的CPU压力下,基本时钟速度超过了200MHz,在纯粹的GPU压力下,Radeon iGPU以~1,900MHz的全速运行。
| CPU时钟(GHz) | GPU时钟(MHz) | CPU平均温度(℃) | GPU平均温度(℃) | |
| 系统空闲 | 0.15 | 18 | 35 | 35 |
| Prime95 + FurMark压力 | 2.65 | 930 | 77 | 77 |
| Prime95应力 | 3.12 | 10 | 79 | 72 |
| FurMark-Stress | 0.23 | 1.866 | 63 | 79 |
| TheWitcher 3 Stress | 0.34 | 1.906 | 59 | 71 |
发言人
16英寸ThinkPad的朝上的立体声扬声器总体来说很一般。它们缺乏低音,而且高频太高。你也不能指望有高音量。
Lenovo ThinkPad T16 G1 21CH004MGE audio analysis
(-) | not very loud speakers (71.8 dB)
Bass 100 - 315 Hz
(-) | nearly no bass - on average 18.5% lower than median
(±) | linearity of bass is average (12.3% delta to prev. frequency)
Mids 400 - 2000 Hz
(+) | balanced mids - only 4.5% away from median
(±) | linearity of mids is average (7.8% delta to prev. frequency)
Highs 2 - 16 kHz
(±) | higher highs - on average 5.3% higher than median
(±) | linearity of highs is average (7.5% delta to prev. frequency)
Overall 100 - 16.000 Hz
(±) | linearity of overall sound is average (22.5% difference to median)
Compared to same class
» 60% of all tested devices in this class were better, 8% similar, 32% worse
» The best had a delta of 7%, average was 21%, worst was 53%
Compared to all devices tested
» 66% of all tested devices were better, 6% similar, 28% worse
» The best had a delta of 4%, average was 23%, worst was 134%
HP EliteBook 865 G9 audio analysis
(+) | speakers can play relatively loud (82.5 dB)
Bass 100 - 315 Hz
(-) | nearly no bass - on average 19.6% lower than median
(±) | linearity of bass is average (10.9% delta to prev. frequency)
Mids 400 - 2000 Hz
(+) | balanced mids - only 1.2% away from median
(+) | mids are linear (2.2% delta to prev. frequency)
Highs 2 - 16 kHz
(+) | balanced highs - only 3.5% away from median
(+) | highs are linear (4% delta to prev. frequency)
Overall 100 - 16.000 Hz
(+) | overall sound is linear (13.8% difference to median)
Compared to same class
» 9% of all tested devices in this class were better, 4% similar, 87% worse
» The best had a delta of 7%, average was 21%, worst was 53%
Compared to all devices tested
» 15% of all tested devices were better, 4% similar, 81% worse
» The best had a delta of 4%, average was 23%, worst was 134%
电源管理。T16尽管电池小,但电池寿命长
消耗功率
在空闲运行和负载下,ThinkPad T16 AMD的功耗仍然低于 英特尔型号和ThinkPad T14 G3 AMD相同主板的功耗。
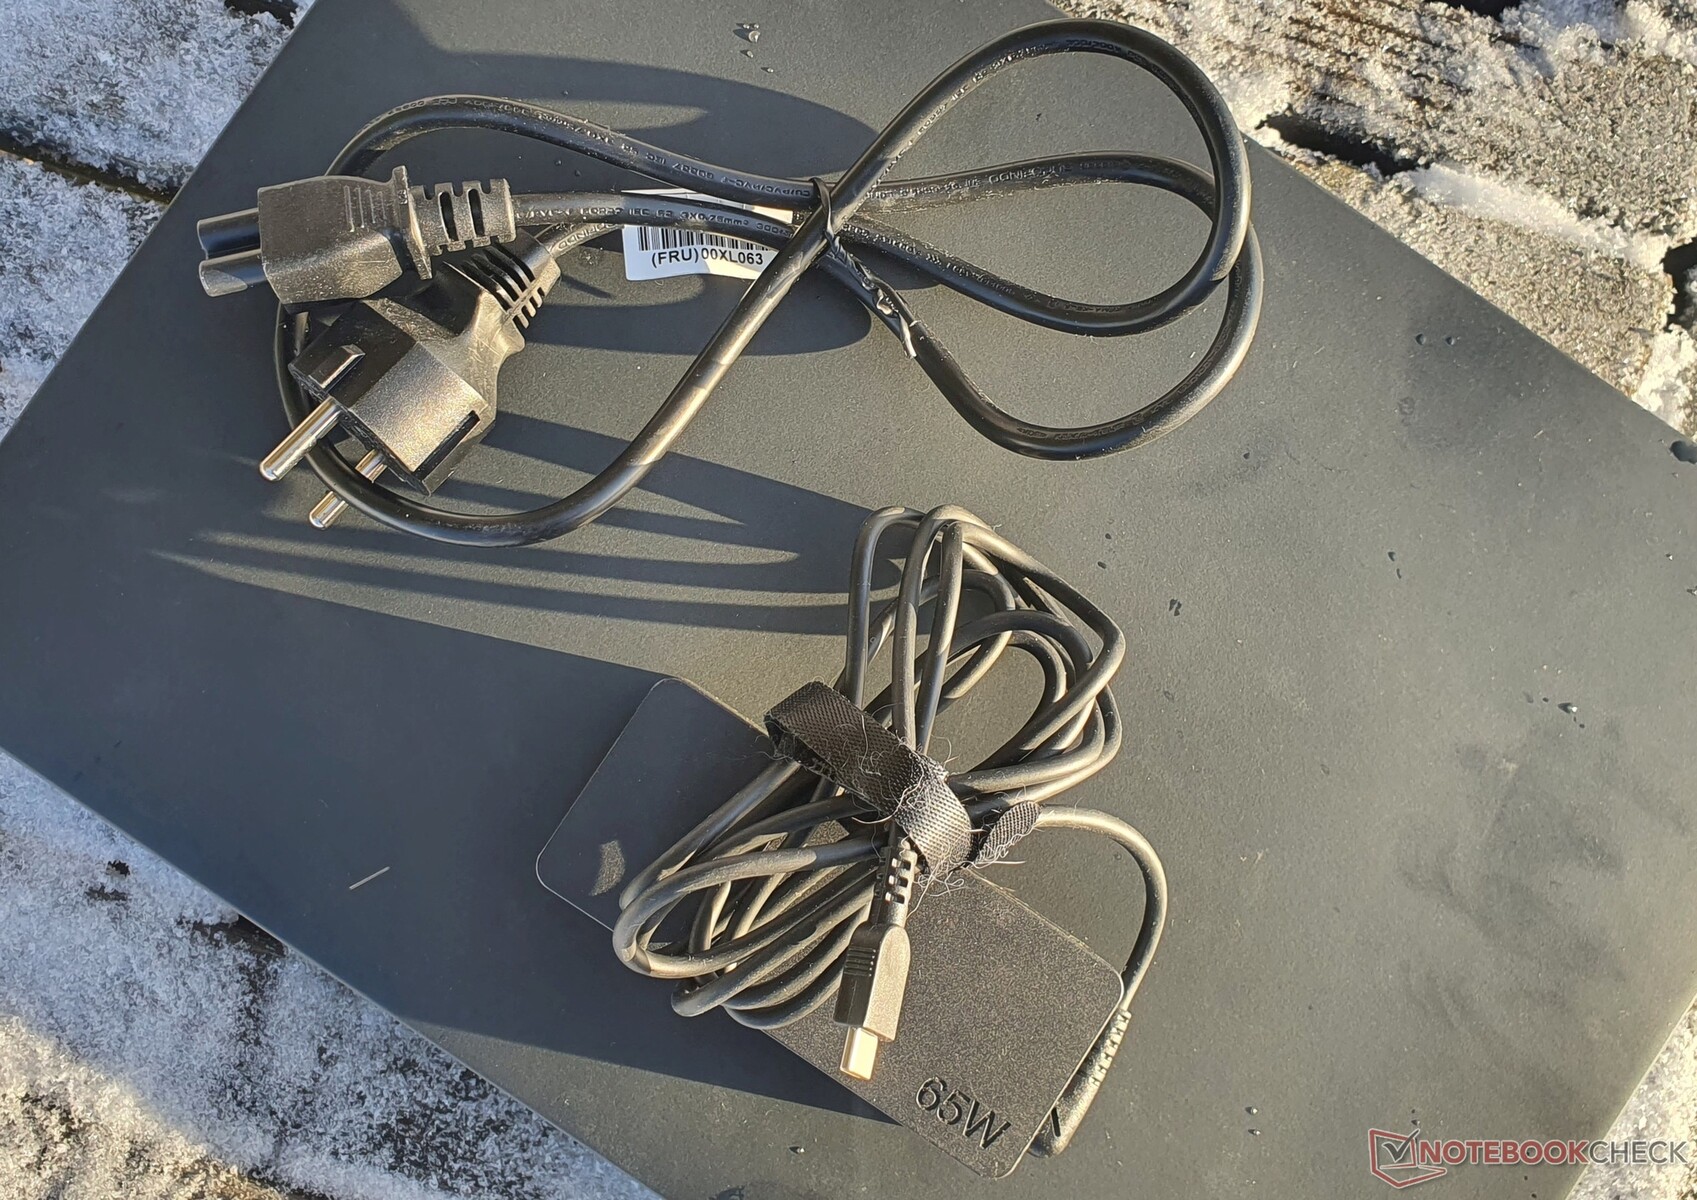
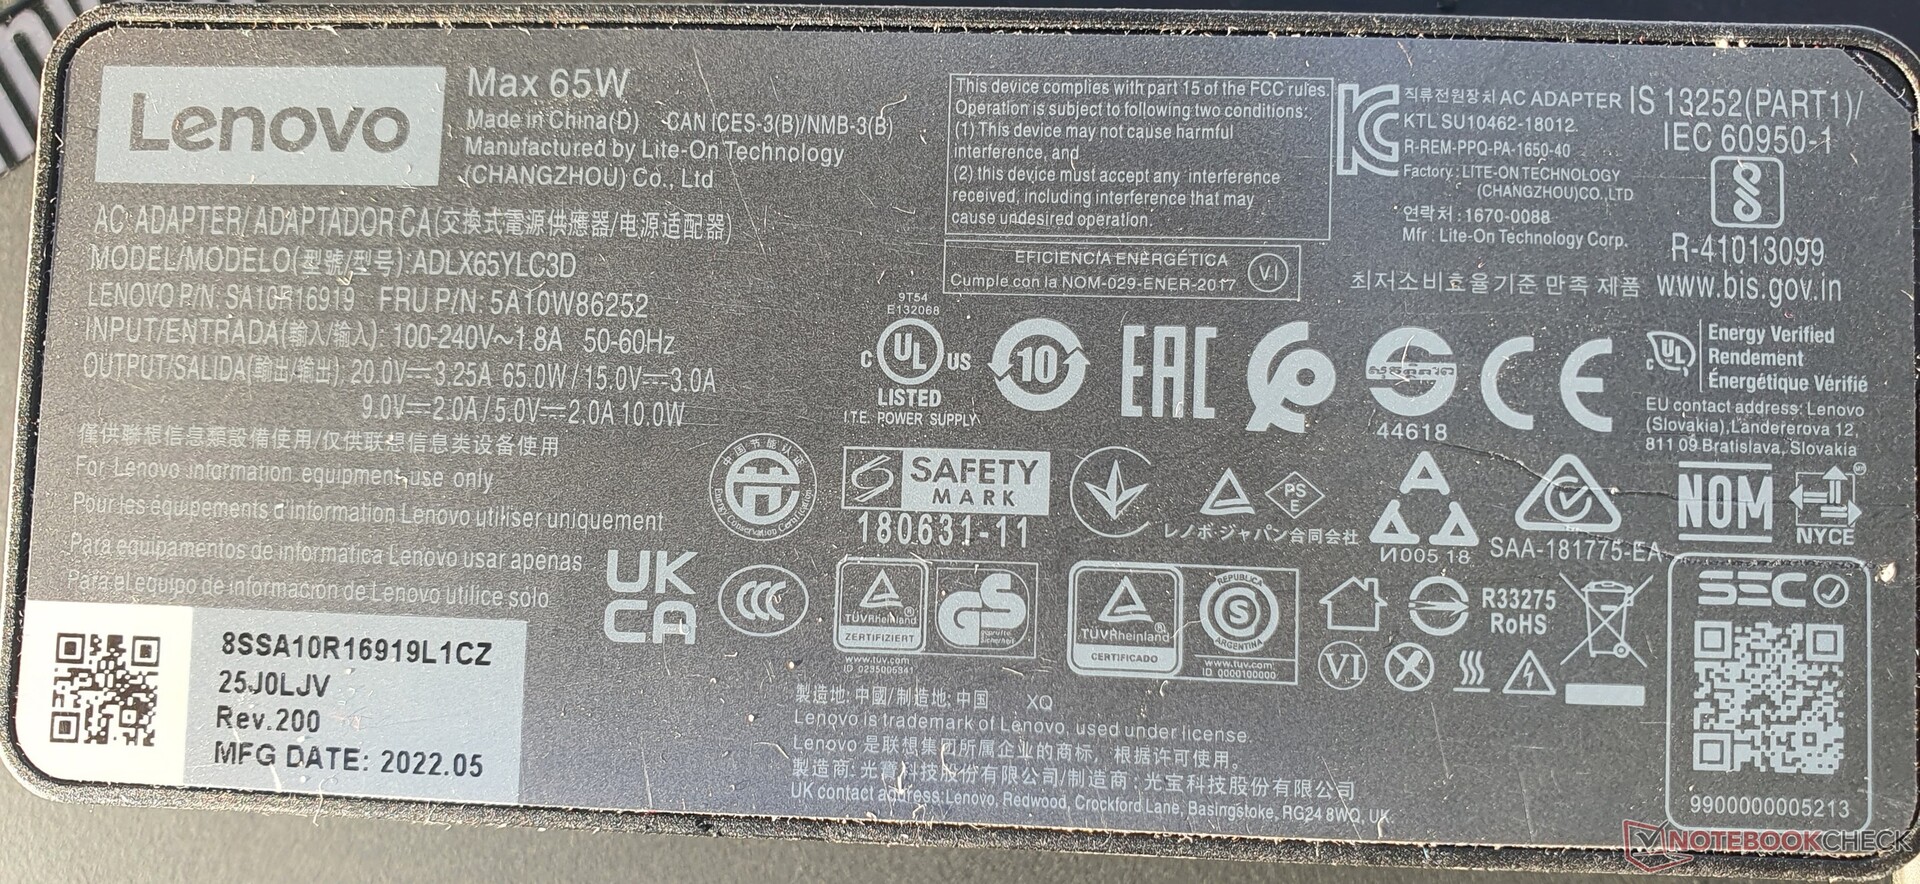
这方面的原因可以从没有低功耗特性的高分辨率显示器和更高的CPU性能限制中找到。由于AMD CPU的短时涡轮增压结果明显较低,该设备的最大消耗量只有59瓦,这意味着65瓦的充电器已经足够。
| Off / Standby | |
| Idle | |
| Load |
|
Key:
min: | |
| Lenovo ThinkPad T16 G1 21CH004MGE R5 PRO 6650U, Radeon 660M, Micron 2450 512GB MTFDKBA512TFK, IPS-LED, 2560x1600, 16" | Lenovo ThinkPad T16 G1 21BWS00200 i5-1240P, Iris Xe G7 80EUs, Samsung PM9A1 MZVL2512HCJQ, IPS, 1920x1200, 16" | Lenovo ThinkPad T14 G3-21CF004NGE R7 PRO 6850U, Radeon 680M, Kioxia BG5 KBG5AZNV512G, IPS, 1920x1200, 14" | HP EliteBook 865 G9 R7 PRO 6850U, Radeon 680M, Samsung PM991 MZVLQ512HBLU, IPS, 1920x1200, 16" | Lenovo ThinkPad Z16 G1 21D5S00T00 R7 PRO 6850H, Radeon RX 6500M, Samsung PM9A1 MZVL21T0HCLR, IPS LED, 1920x1200, 16" | Lenovo ThinkPad P15v G2 21A9000XGE i7-11800H, T1200 Laptop GPU, Toshiba XG6 KXG6AZNV512G, IPS LED, 1920x1080, 15.6" | HP ZBook Power 15 G9 6B8C4EA i7-12700H, RTX A2000 Laptop GPU, Samsung PM9A1 MZVL21T0HCLR, IPS, 3840x2160, 15.6" | Average AMD Radeon 660M | Average of class Office | |
|---|---|---|---|---|---|---|---|---|---|
| Power Consumption | 9% | 19% | -35% | -64% | -77% | -59% | -8% | -5% | |
| Idle Minimum * (Watt) | 3.2 | 2.9 9% | 2.4 25% | 5.3 -66% | 5.3 -66% | 5.96 -86% | 3.9 -22% | 4.68 ? -46% | 4.26 ? -33% |
| Idle Average * (Watt) | 8.1 | 6 26% | 5.3 35% | 12.8 -58% | 8.6 -6% | 8.37 -3% | 7.2 11% | 7.08 ? 13% | 7.31 ? 10% |
| Idle Maximum * (Watt) | 8.6 | 6.9 20% | 5.6 35% | 14.1 -64% | 9.5 -10% | 9.05 -5% | 8.5 1% | 9.12 ? -6% | 8.55 ? 1% |
| Load Average * (Watt) | 45.4 | 27.3 40% | 39.7 13% | 48.5 -7% | 65.2 -44% | 91.82 -102% | 87.2 -92% | 44.2 ? 3% | 43.8 ? 4% |
| Witcher 3 ultra * (Watt) | 40 | 42.6 -7% | 42.8 -7% | 48.7 -22% | 93.6 -134% | 102 -155% | 86.8 -117% | ||
| Load Maximum * (Watt) | 59.6 | 81.53 -37% | 50.6 15% | 56.6 5% | 133.81 -125% | 126.38 -112% | 139 -133% | 62.4 ? -5% | 64.5 ? -8% |
* ... smaller is better
Power Consumption The Witcher 3 / Stress Test
Power Consumption With External Monitor
电池寿命
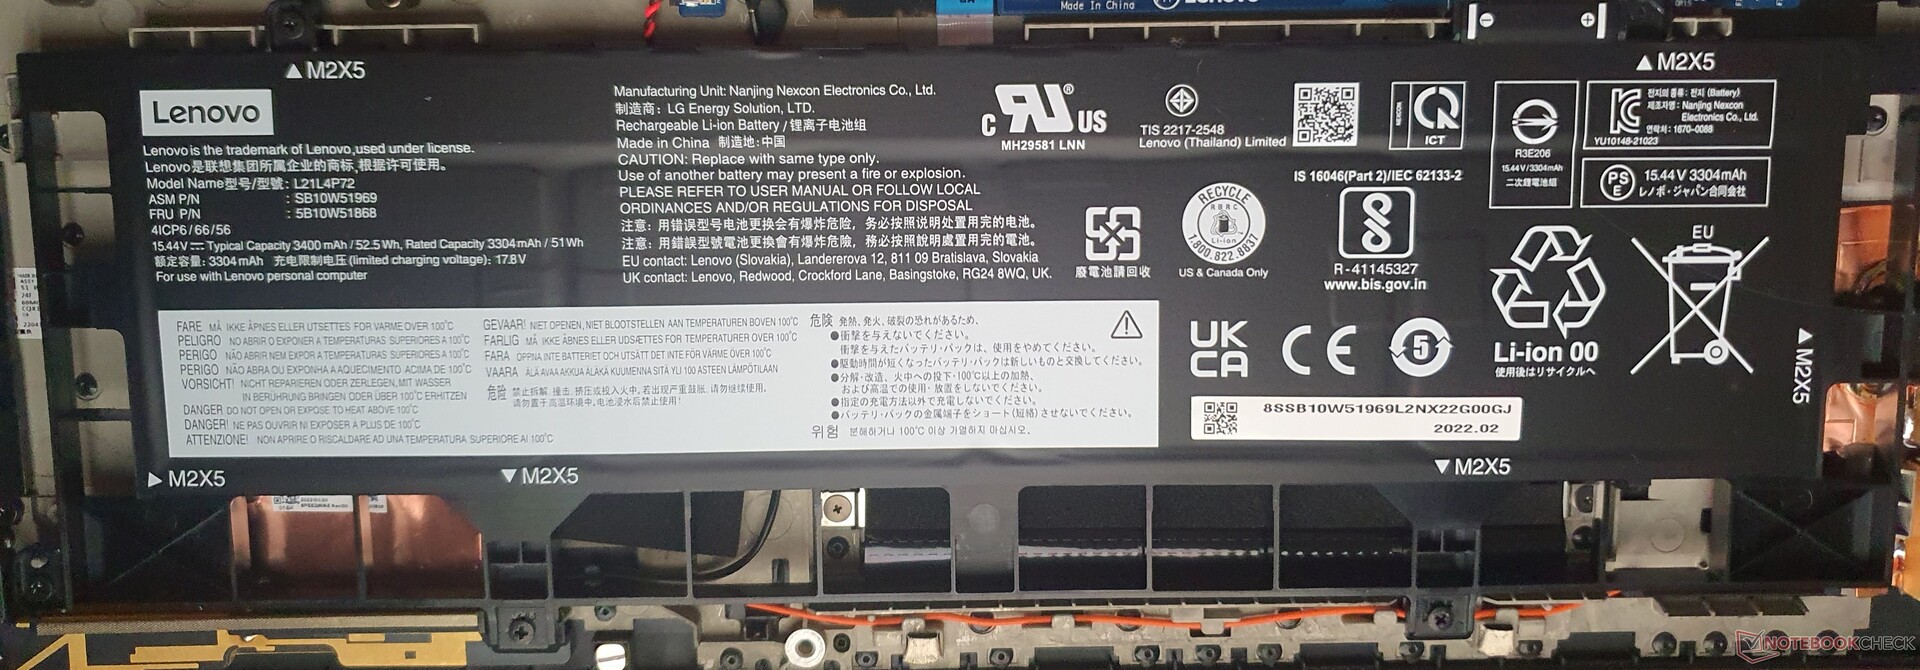
即使在我们的测试装置中使用了明显较小的52.5瓦时电池,你也可以在网上冲浪10:35小时。笔记本电脑 英特尔型号配备86瓦时电池和省电显示器的型号可以达到14小时。因此,为了获得较长的电池寿命,你应该获得较大的电池和低功率显示屏。
从以下情况来看ThinkPad T14 G3 AMD采用相同的主板和低功耗显示器,你可以计算出T16 AMD的电池寿命可达20小时。然而,由于缺乏实际测量,我们无法确认这一点。
| Lenovo ThinkPad T16 G1 21CH004MGE R5 PRO 6650U, Radeon 660M, 52.5 Wh | Lenovo ThinkPad T16 G1 21BWS00200 i5-1240P, Iris Xe G7 80EUs, 86 Wh | Lenovo ThinkPad T14 G3-21CF004NGE R7 PRO 6850U, Radeon 680M, 52.5 Wh | HP EliteBook 865 G9 R7 PRO 6850U, Radeon 680M, 76 Wh | Lenovo ThinkPad Z16 G1 21D5S00T00 R7 PRO 6850H, Radeon RX 6500M, 72 Wh | Lenovo ThinkPad P15v G2 21A9000XGE i7-11800H, T1200 Laptop GPU, 68 Wh | HP ZBook Power 15 G9 6B8C4EA i7-12700H, RTX A2000 Laptop GPU, 83 Wh | Lenovo ThinkPad X1 Extreme G5-21DE003RGE i7-12700H, GeForce RTX 3060 Laptop GPU, 90 Wh | |
|---|---|---|---|---|---|---|---|---|
| Battery runtime | 82% | 30% | 59% | 31% | -25% | -6% | -5% | |
| H.264 (h) | 10.9 | 10.4 -5% | 16.4 50% | 18.5 70% | 11.9 9% | 8 -27% | 7.3 -33% | |
| WiFi v1.3 (h) | 10.6 | 14.1 33% | 12.9 22% | 15 42% | 9.9 -7% | 7.5 -29% | 10 -6% | 6.7 -37% |
| Load (h) | 1.1 | 3.5 218% | 1.3 18% | 1.8 64% | 2.1 91% | 0.9 -18% | 1.7 55% |
Pros
Cons
结论:ThinkPad T16 AMD强大、冷静、安静

有了AMD APU,联想ThinkPad T16变得更加出色。你不仅可以得到一个非常强大的CPU,而且功率限制比T16的英特尔处理器更高。 T16英特尔但集成的Radeon GPU也比英特尔的iGPU更有说服力。有了这一点,这款商务笔记本电脑也为苛刻的、CPU重的任务做好了准备。
我们建议选择较大的电池和低功耗显示器,以获得最大的电池寿命。然而,那些正在寻找真正的入门级工作站的人应该选择 ThinkPad P15v或惠普 Zbook Power 15 G9.另一方面, ThinkPad X1 Extreme G5和 思考板Z16代表了纤细和强大之间的良好折衷。
除了良好的设备,坚固的ThinkPad T16 AMD还得益于非常安静和凉爽,拥有良好的输入设备,以及色彩鲜艳的16英寸显示屏。
惠普 EliteBook 865 G9与1499欧元的T16 AMD相比,它的特别优势是可扩展的内存和USB4,代表了一个真正的选择。
2022年的T系列的质量控制似乎也不是最佳的。我们的第二个测试单元不仅有一个非常高频率的风扇,它还在掌托区域产生明显的吱吱声,而且左边的TrackPoint键经常不被触发。此外,即使在一周后,强大的化学气味也仍然存在,而且铰链已经变得稍微松动。另一方面,我们更广泛地测试的机型并没有出现用户经常提到的这些问题。
价格和可用性
联想销售各种配置的ThinkPad T16 AMD,起价为969.50美元,亚马逊也提供几个版本,起价990美元。
Lenovo ThinkPad T16 G1 21CH004MGE
- 01/31/2023 v7 (old)
Marvin Gollor
Transparency
The selection of devices to be reviewed is made by our editorial team. The test sample was provided to the author as a loan by the manufacturer or retailer for the purpose of this review. The lender had no influence on this review, nor did the manufacturer receive a copy of this review before publication. There was no obligation to publish this review. As an independent media company, Notebookcheck is not subjected to the authority of manufacturers, retailers or publishers.
This is how Notebookcheck is testing
Every year, Notebookcheck independently reviews hundreds of laptops and smartphones using standardized procedures to ensure that all results are comparable. We have continuously developed our test methods for around 20 years and set industry standards in the process. In our test labs, high-quality measuring equipment is utilized by experienced technicians and editors. These tests involve a multi-stage validation process. Our complex rating system is based on hundreds of well-founded measurements and benchmarks, which maintains objectivity. Further information on our test methods can be found here.
Price comparison

