

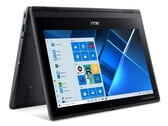
宏碁TravelMate Spin B3评测。坚固的二合一笔记本电脑,带笔输入
宏碁的二合一设备提供安静的操作,良好的电池寿命,以及NVMe固态硬盘。触摸屏可以用手指或附带的输入笔操作。Windows 10 Pro作为操作系统,并可更新到Windows 11。价格约为330欧元(约合375美元)。
Intel Pentium Silver N5030, UHD Graphics 605, 11.6", 1.5 kg英特尔奔腾Silver N5030是一款四核SoC,主要用于廉价笔记本电脑,已于2019年底发布。它运行在1.1-3.1 GHz(单核突发),基于Gemini Lake平台。 5030是较旧的Pentium 5000的更新,并提供了高出400 MHz的Boost频率。与Apollo Lake的前代产品相似,该芯片采用FinFET 14 nm工艺制造,但处理器内核略有改进,L2缓存量增加了一倍,封装更小,新一代显示器输出(第10代)和部分集成WiFi芯片。除了四个CPU内核之外,该芯片还包括具有DirectX 12功能的GPU以及DDR4 / LPDDR4内存控制器(双通道,最高2400 MHz)。 SoC是不可替换的,因为它直接焊接到主板上。
架构
处理器架构仍然称为Goldmont Plus。与Apollo Lake中较旧的Goldmont内核相比,它们具有增加的2级缓存(至4 MB)。这意味着同频性能应该要好一些,但不能比Kaby Lake Y这样的Core CPU更好。
性能
奔腾Silver N5030的CPU性能得益于400 MHz的提升频率,明显比旧的Silver N5000快。与昂贵的Core Y处理器相比,尤其是在基于Gemini Lake的SoC中,单线程性能要低得多。仍然对于基本任务(如办公),具有中等多任务处理能力的网络浏览器,处理器性能应该很好。
GPU性能
UHD Graphics 605(Gemini Lake)基于Intel的Gen9架构,该架构支持DirectX 12,还用于Kaby Lake / Skylake / Apollo Lake图形适配器(例如HD Graphics 520)。配备18个EU和最高750 MHz的频率,性能应与较旧的HD Graphics 5300和HD Graphics 505(Apollo Lake)大致相当。
该芯片还包括一个高级视频引擎,该视频引擎具有对VP9和H.265素材(8位色深)回放的硬件支持。
能耗
与前代产品相似,英特尔指定的TDP为6瓦(SDP 4.8瓦–方案设计功率)。因此,理论上可以对芯片进行被动冷却,但也可以使用带有风扇的SKU。
| Codename | Gemini Lake Refresh | ||||||||||||||||||||||||
| Series | Intel Gemini Lake | ||||||||||||||||||||||||
Series: Gemini Lake Gemini Lake Refresh
| |||||||||||||||||||||||||
| Clock Rate | 1100 - 3100 MHz | ||||||||||||||||||||||||
| Level 2 Cache | 4 MB | ||||||||||||||||||||||||
| Number of Cores / Threads | 4 / 4 | ||||||||||||||||||||||||
| Power Consumption (TDP = Thermal Design Power) | 6 Watt | ||||||||||||||||||||||||
| Manufacturing Technology | 14 nm | ||||||||||||||||||||||||
| Max. Temperature | 105 °C | ||||||||||||||||||||||||
| Socket | BGA1090 | ||||||||||||||||||||||||
| Features | DDR4-2400/LPDDR4-2400 RAM, PCIe 2, MMX, SSE, SSE2, SSE3, SSSE3, SSE4.1, SSE4.2, VMX, SMEP, SMAP, MPX, EIST, TM1, TM2, Turbo, AES-NI, RDRAND, RDSEED, SHA, SGX | ||||||||||||||||||||||||
| GPU | Intel UHD Graphics 605 (200 - 750 MHz) | ||||||||||||||||||||||||
| 64 Bit | 64 Bit support | ||||||||||||||||||||||||
| Architecture | x86 | ||||||||||||||||||||||||
| Announcement Date | 11/04/2019 | ||||||||||||||||||||||||
| Product Link (external) | ark.intel.com | ||||||||||||||||||||||||
Asus VivoBook 15 X515MA-AH09-CA: Intel UHD Graphics 605, 15.60", 1.8 kg
External Review » Asus VivoBook 15 X515MA-AH09-CA
Lenovo IdeaPad 1 11IGL05, Pentium N5030: Intel UHD Graphics 605, 11.60", 1.2 kg
External Review » Lenovo IdeaPad 1 11IGL05, Pentium N5030
Asus L510MA-DH21: Intel UHD Graphics 605, 15.60", 1.6 kg
External Review » Asus L510MA-DH21
HP Chromebook x360 14a-ca0260nd: Intel UHD Graphics 605, 14.00", 1.5 kg
External Review » HP Chromebook x360 14a-ca0260nd
Acer TravelMate Spin B3 TMB311RN-31-P5KK: Intel UHD Graphics 605, 11.60", 1.5 kg
External Review » Acer TravelMate Spin B3 TMB311RN-31-P5KK
Acer Chromebook 15 CB315-3HT-P297: Intel UHD Graphics 605, 15.60", 1.9 kg
External Review » Acer Chromebook 15 CB315-3HT-P297
Dell Latitude 11 3190 2-in-1, Pentium N5030: Intel UHD Graphics 605, 11.60", 1.5 kg
External Review » Dell Latitude 11 3190 2-in-1, Pentium N5030
Acer Chromebook 314 C933T-P8SM: Intel UHD Graphics 605, 14.00", 1.5 kg
External Review » Acer Chromebook 314 C933T-P8SM
Lenovo IdeaPad Duet 3i: Intel UHD Graphics 605, 10.30", 0.6 kg
External Review » Lenovo IdeaPad Duet 3i
Lenovo IdeaPad Duet 3 10IGL5-82AT0054SP: Intel UHD Graphics 605, 10.30", 0.9 kg
External Review » Lenovo IdeaPad Duet 3 10IGL5-82AT0054SP
Acer Swift 1 SF114-33-P8Z8: Intel UHD Graphics 605, 14.00", 1.3 kg
External Review » Acer Swift 1 SF114-33-P8Z8
Acer Chromebook 314 C933L-P8WA,LTE: Intel UHD Graphics 605, 14.00", 1.5 kg
External Review » Acer Chromebook 314 C933L-P8WA,LTE
» Notebookcheck多媒体笔记本电脑Top 10排名
» Notebookcheck游戏笔记本电脑Top 10排名
» Notebookcheck低价办公/商务笔记本电脑Top 10排名
» Notebookcheck高端办公/商务笔记本电脑Top 10排名
» Notebookcheck工作站笔记本电脑Top 10排名
» Notebookcheck亚笔记本电脑Top 10排名
» Notebookcheck超级本产品Top 10排名
» Notebookcheck变形本产品Top 10排名
» Notebookcheck平板电脑Top 10排名
» Notebookcheck智能手机Top 10排名
» Notebookcheck评测过最出色的笔记本电脑屏幕
» Notebookcheck售价500欧元以下笔记本电脑Top 10排名
» Notebookcheck售价300欧元以下笔记本电脑Top 10排名