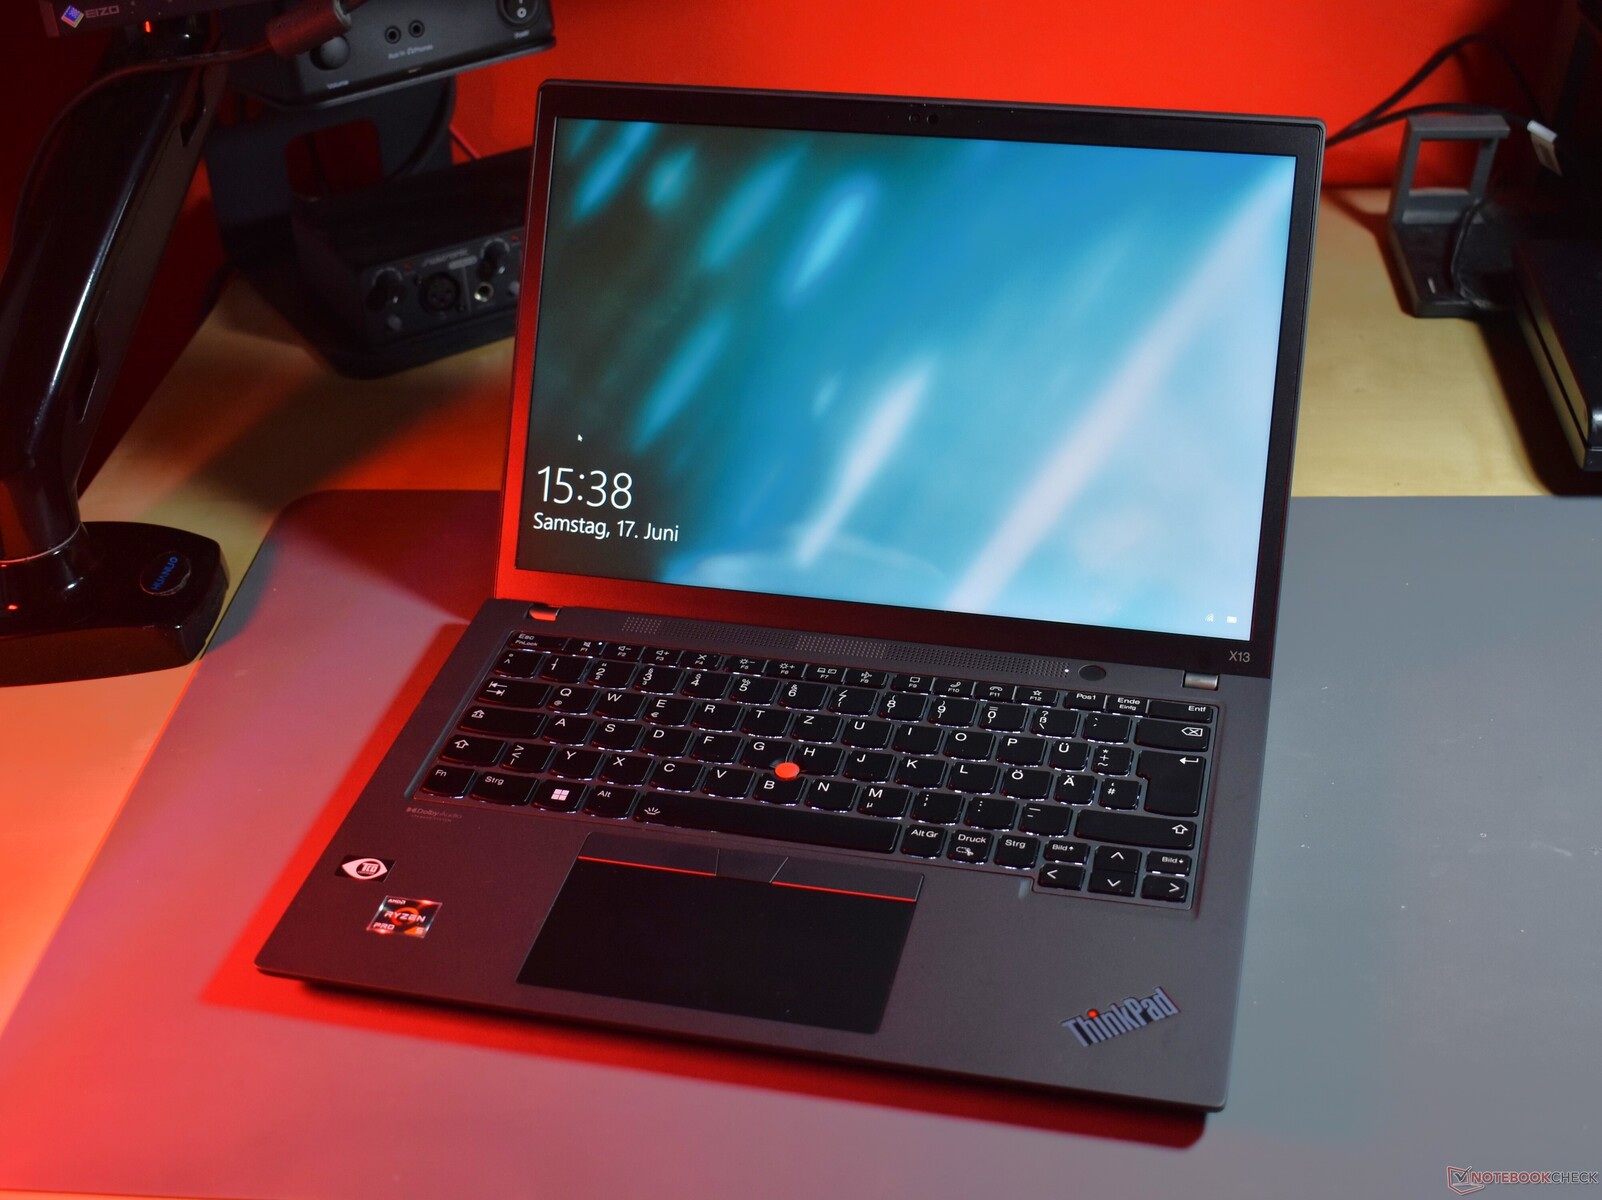
联想ThinkPad X13 G3 AMD笔记本电脑评论:已经非常好的ThinkPad在Ryzen 6000的帮助下变得更好了

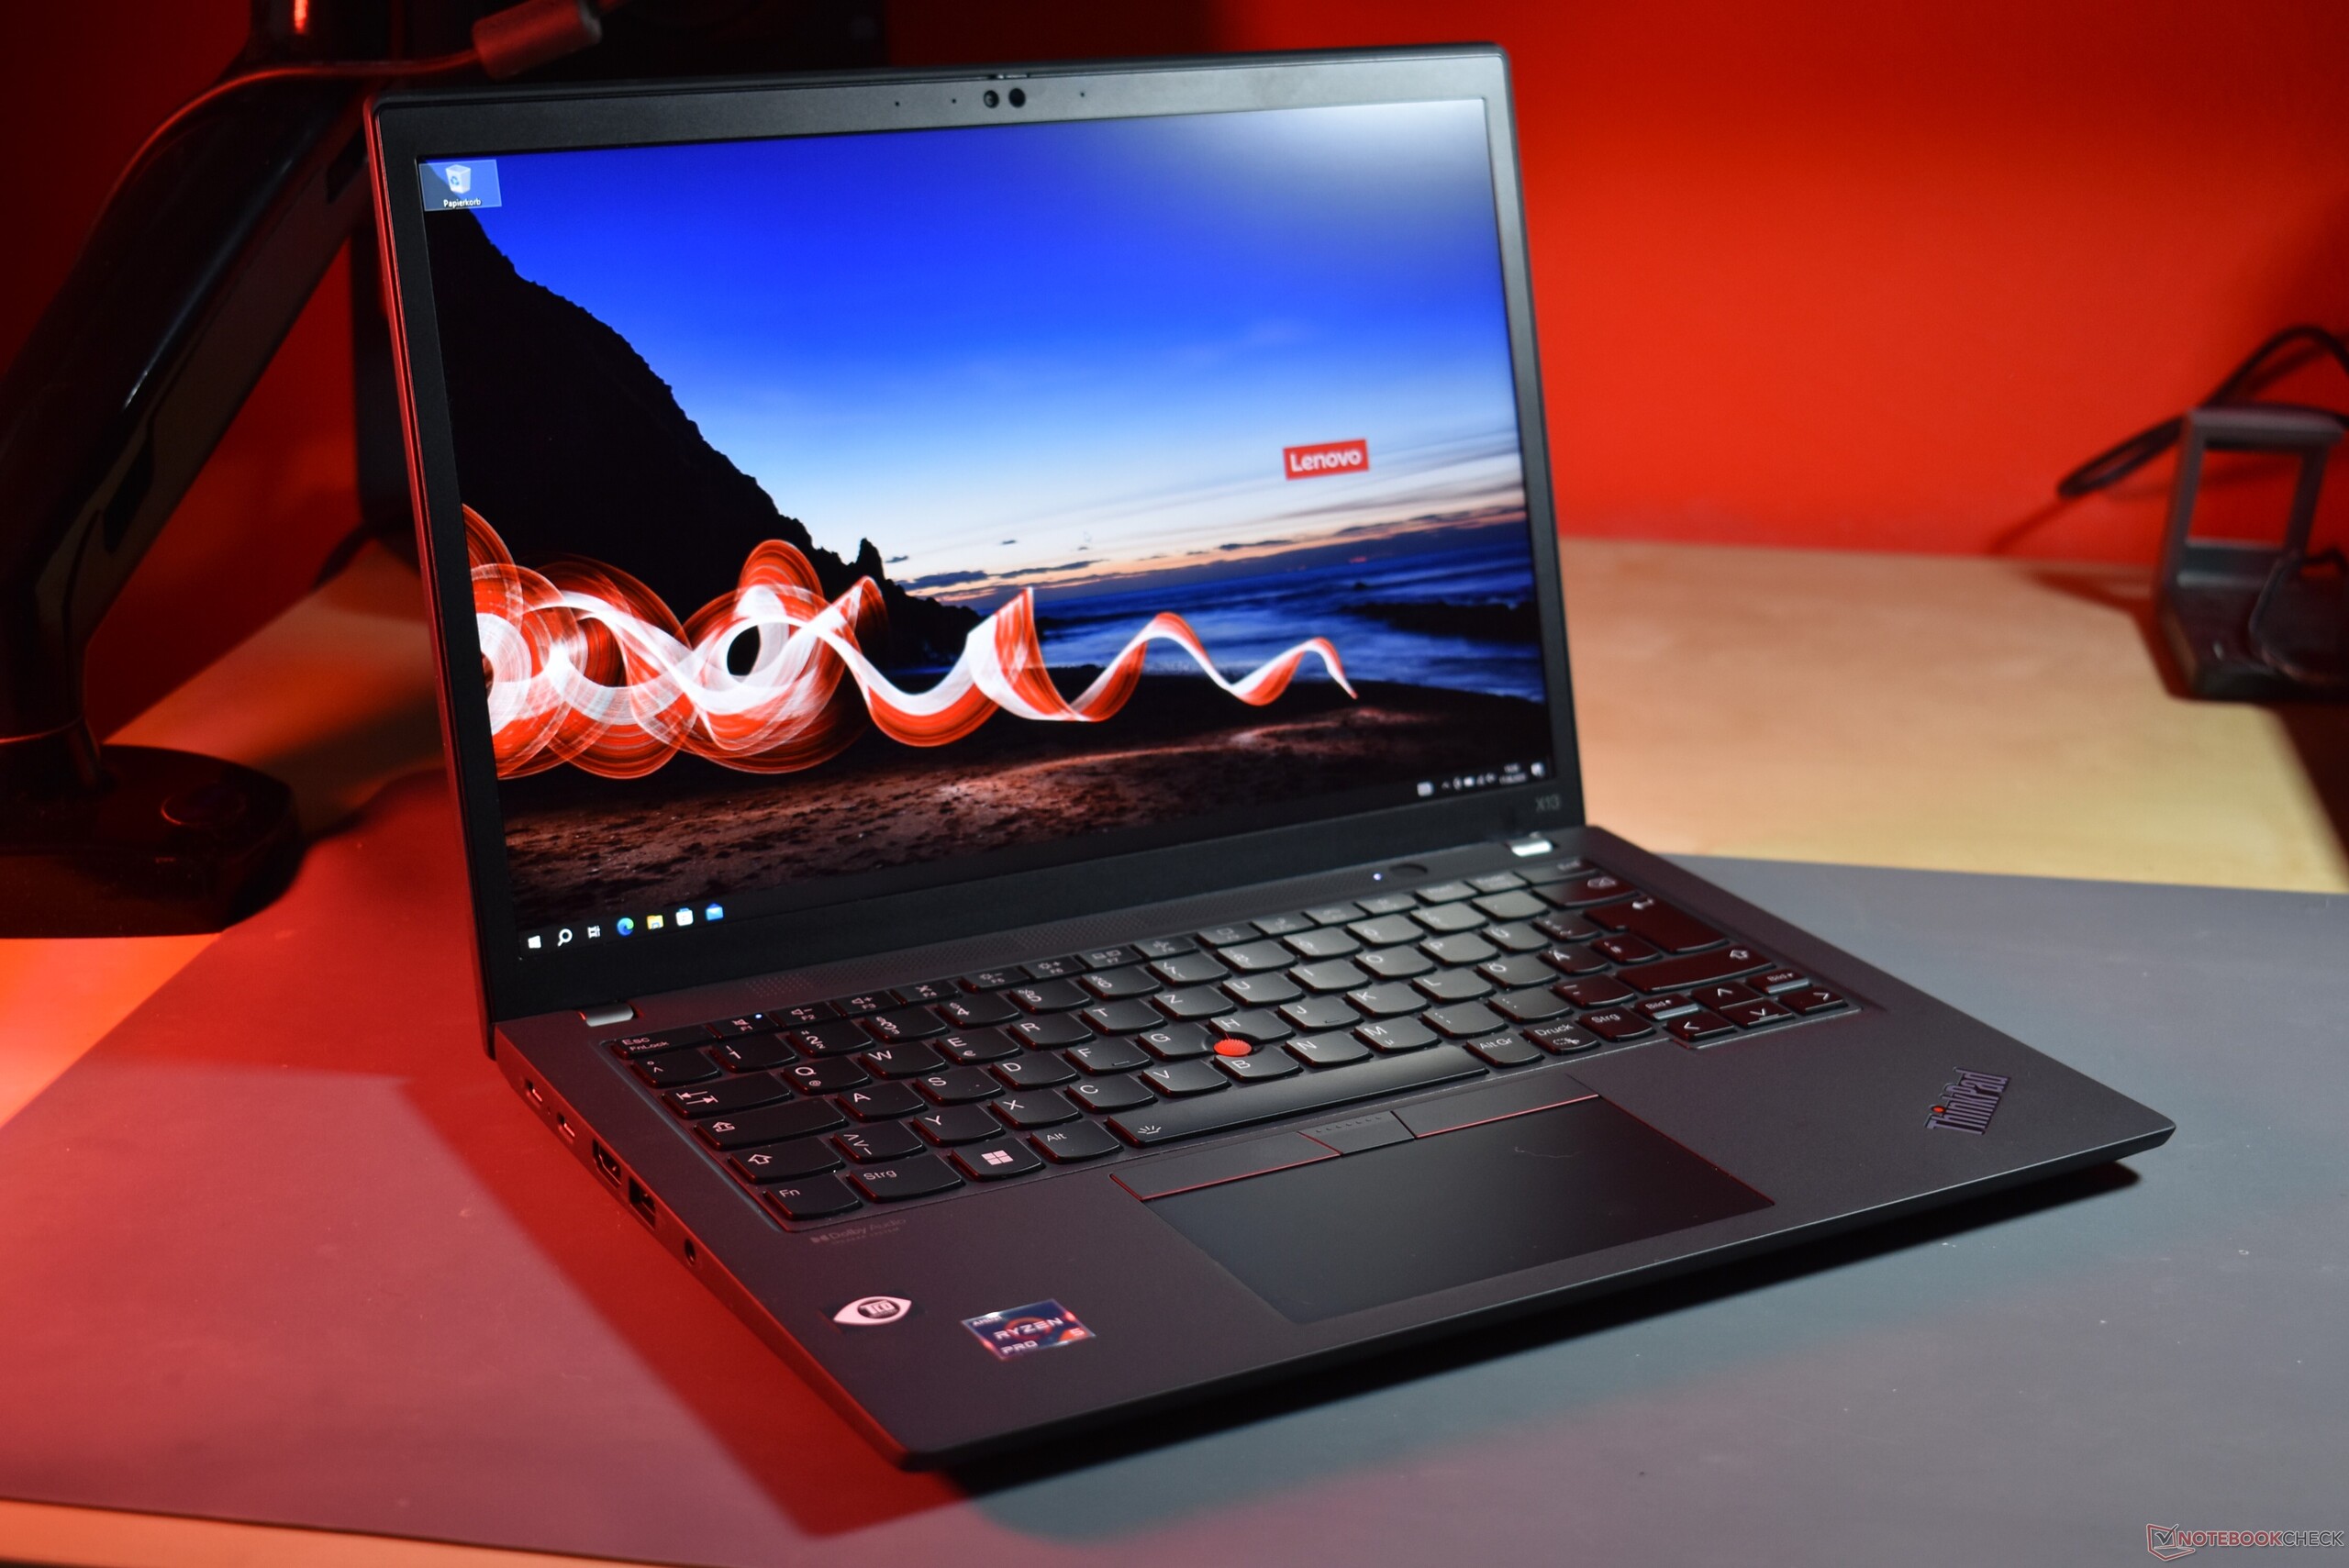
在2023年对2022年的ThinkPad进行评测--听起来很矛盾,但也能说得通。今天的评测设备,联想ThinkPad X13第三代AMD可能是 "昨天的技术",但这并不意味着它不好。这款紧凑型商务笔记本电脑的继任者,即 联想ThinkPad X13第四代,目前还没有AMD版本。足够的理由让我们最后看一眼旧版的变体--也许它值得在即将到来的打折销售中购买。
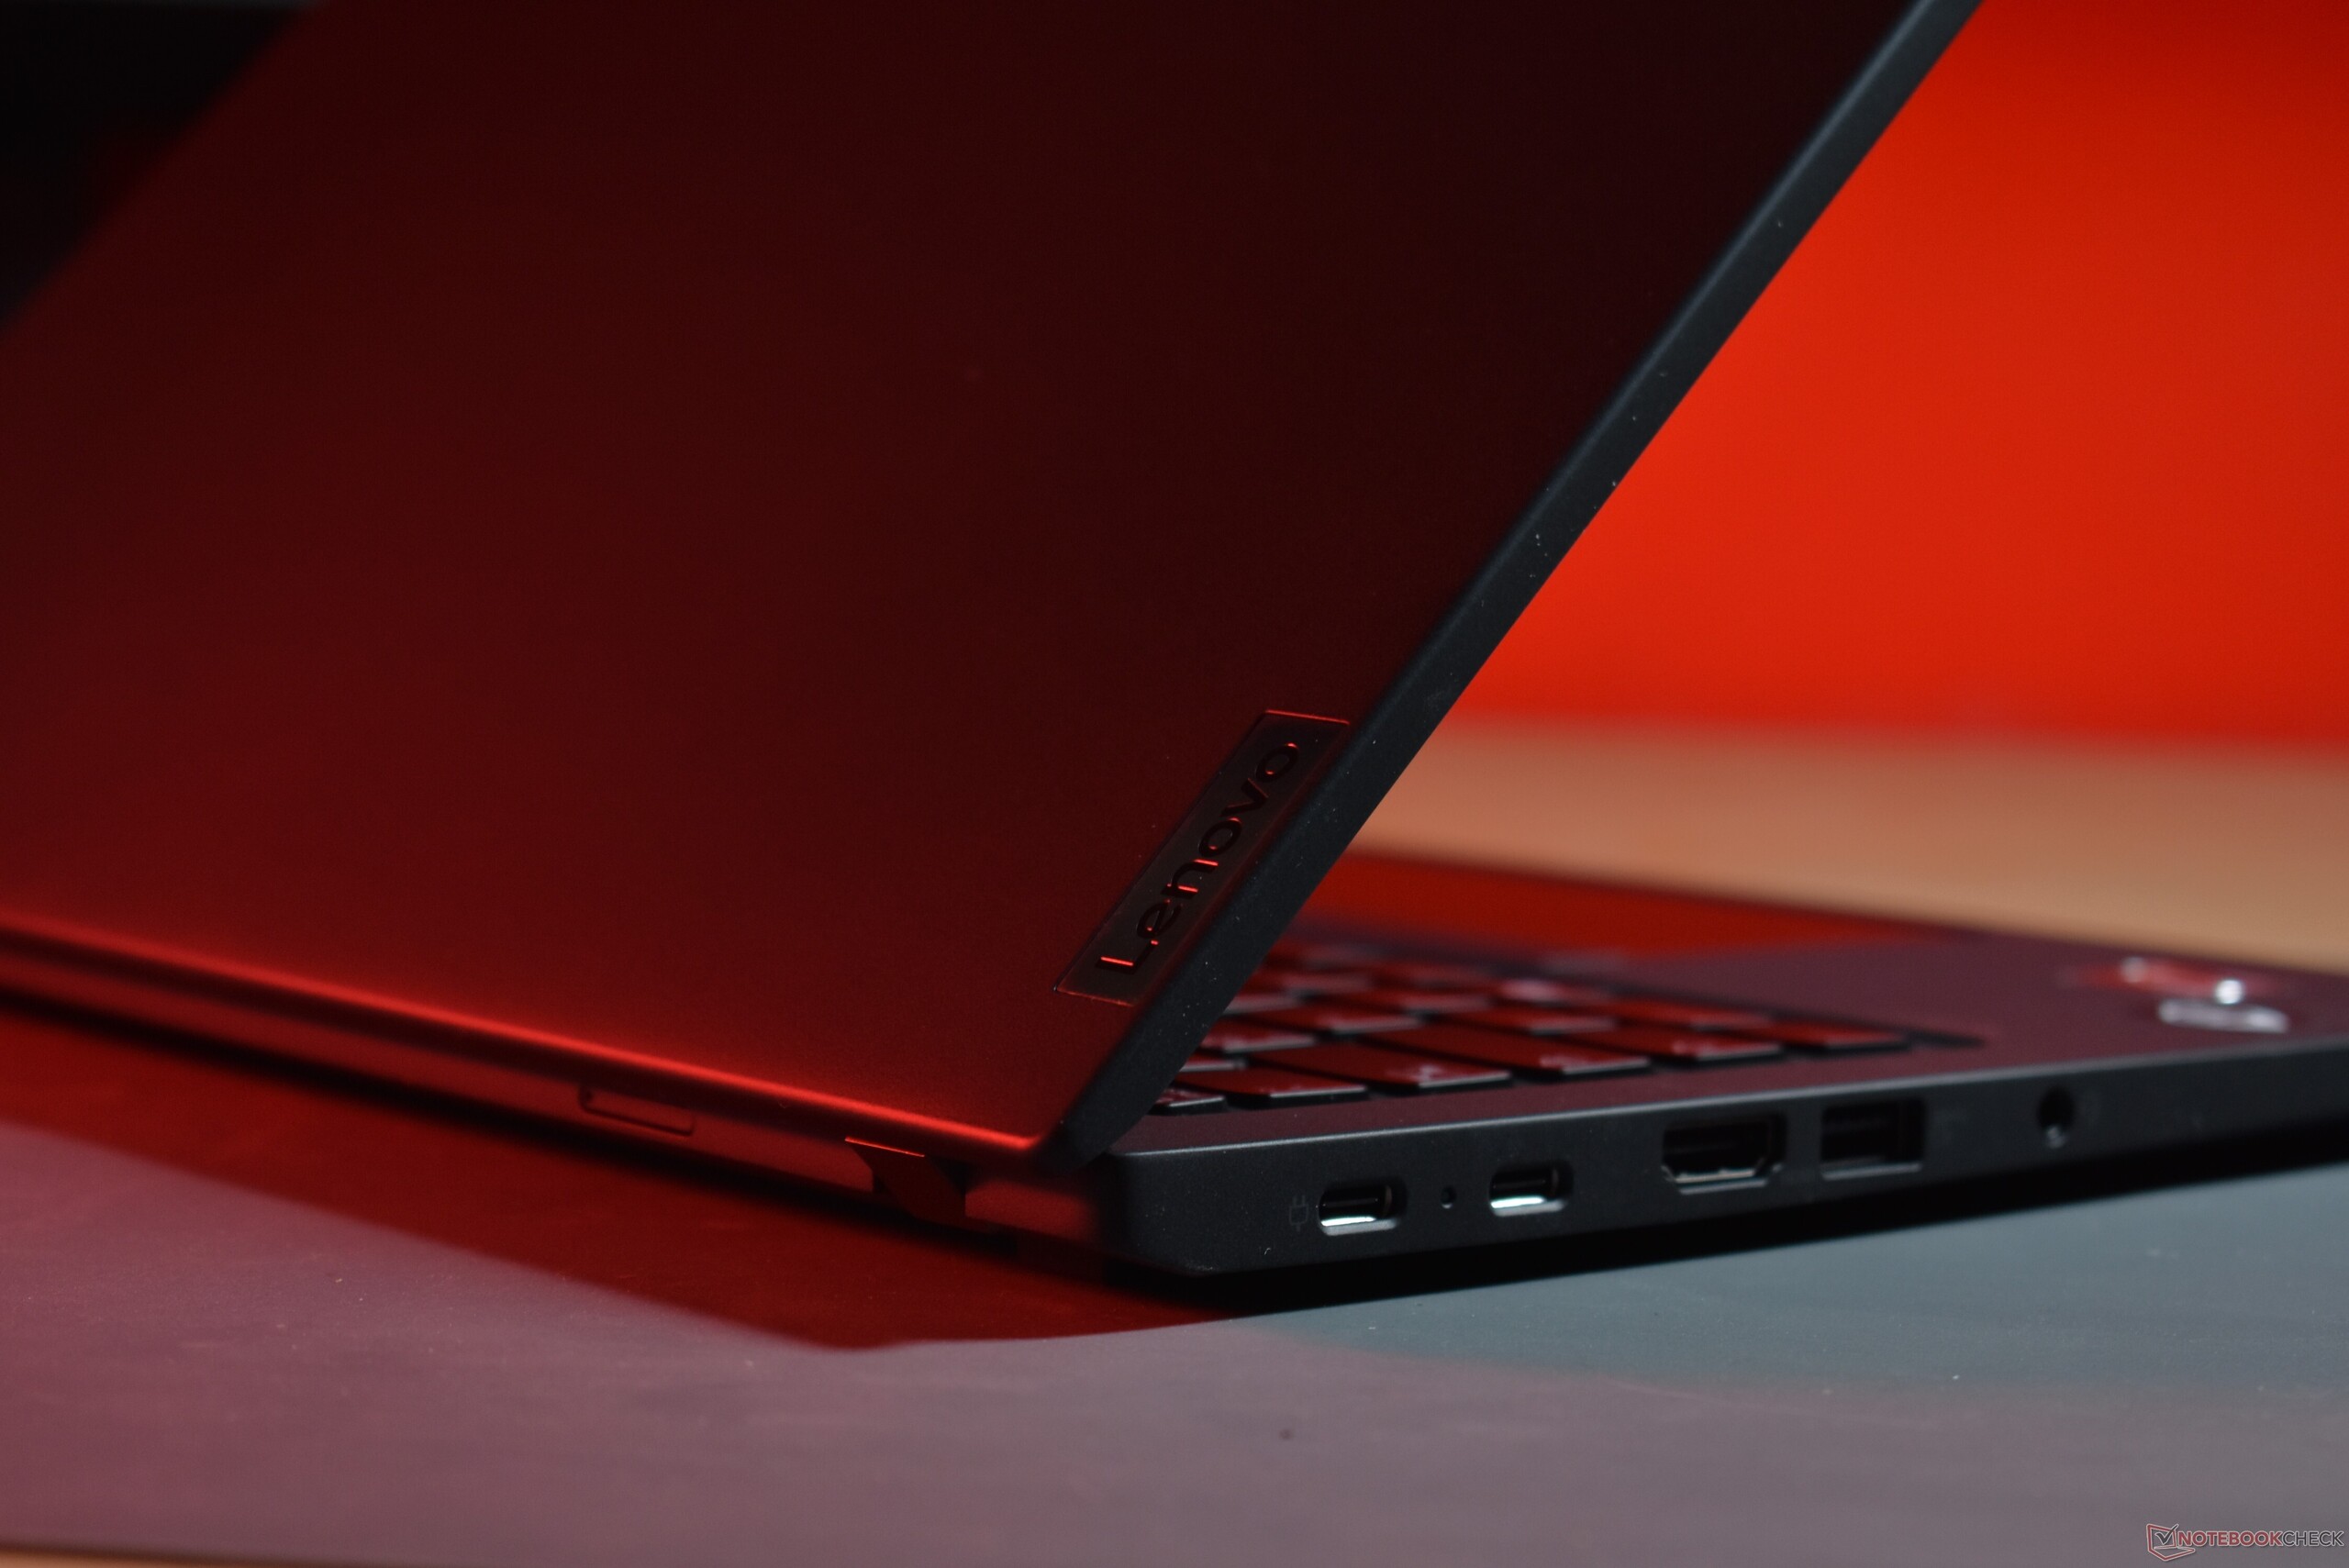
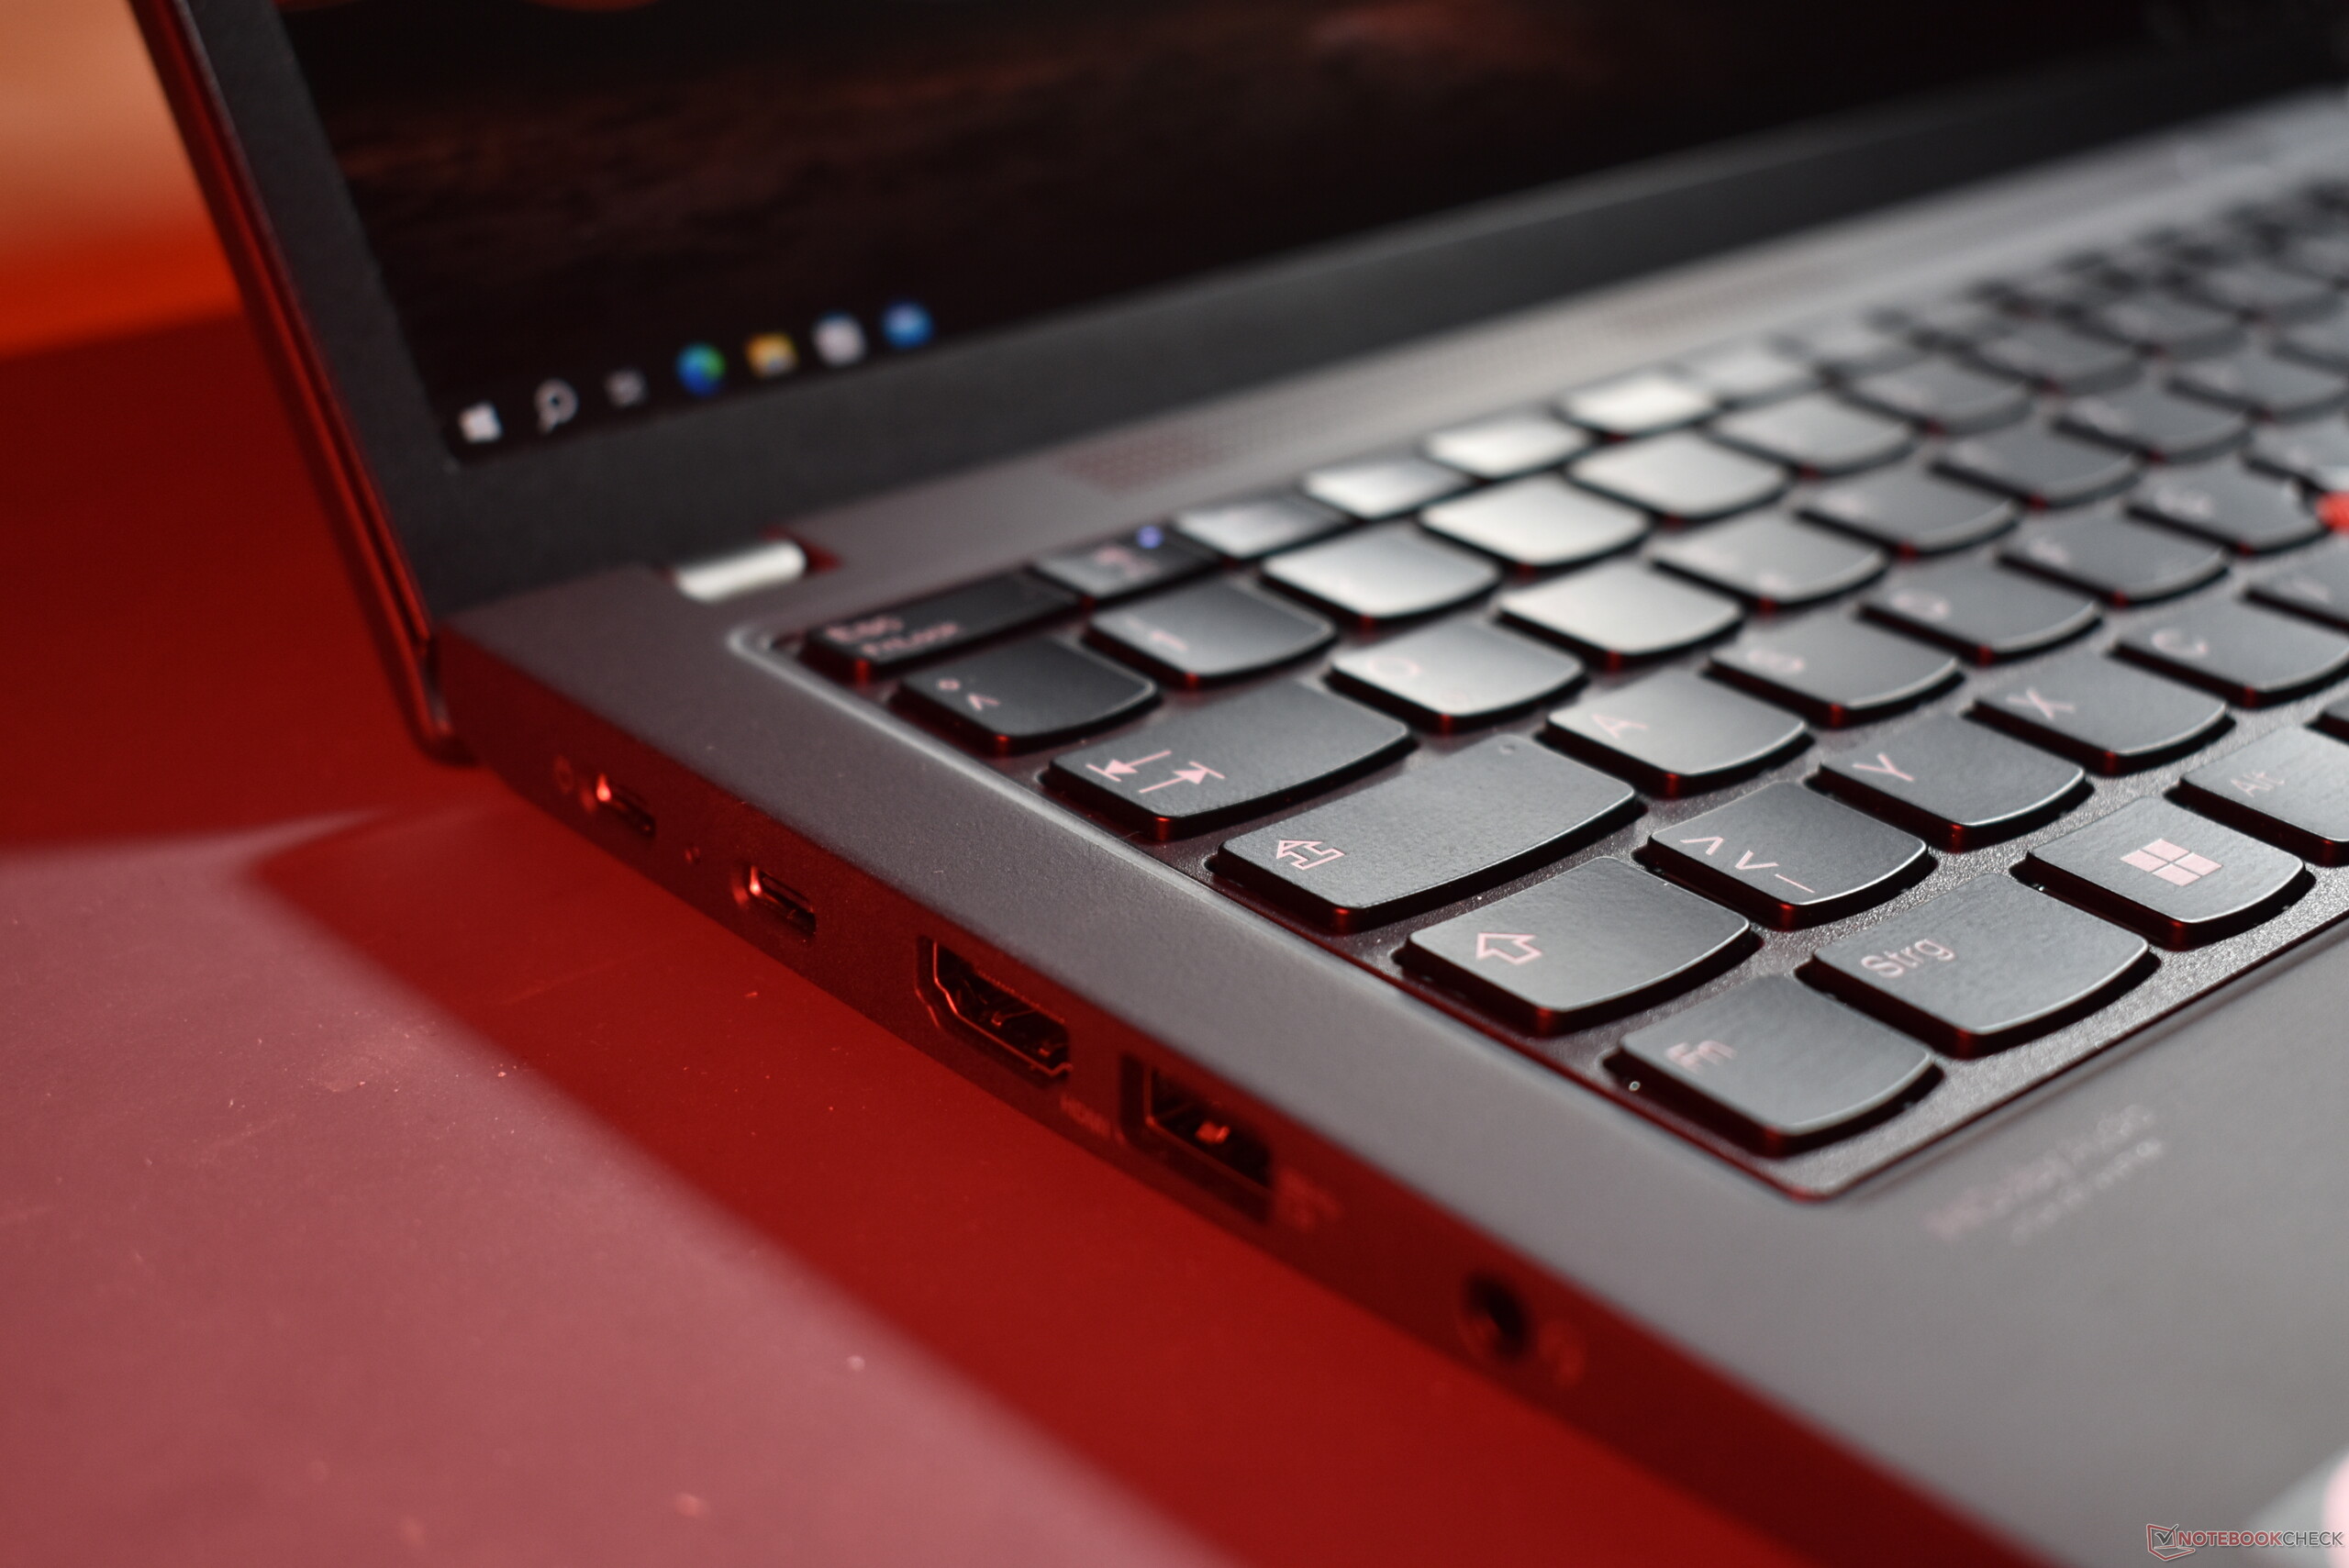
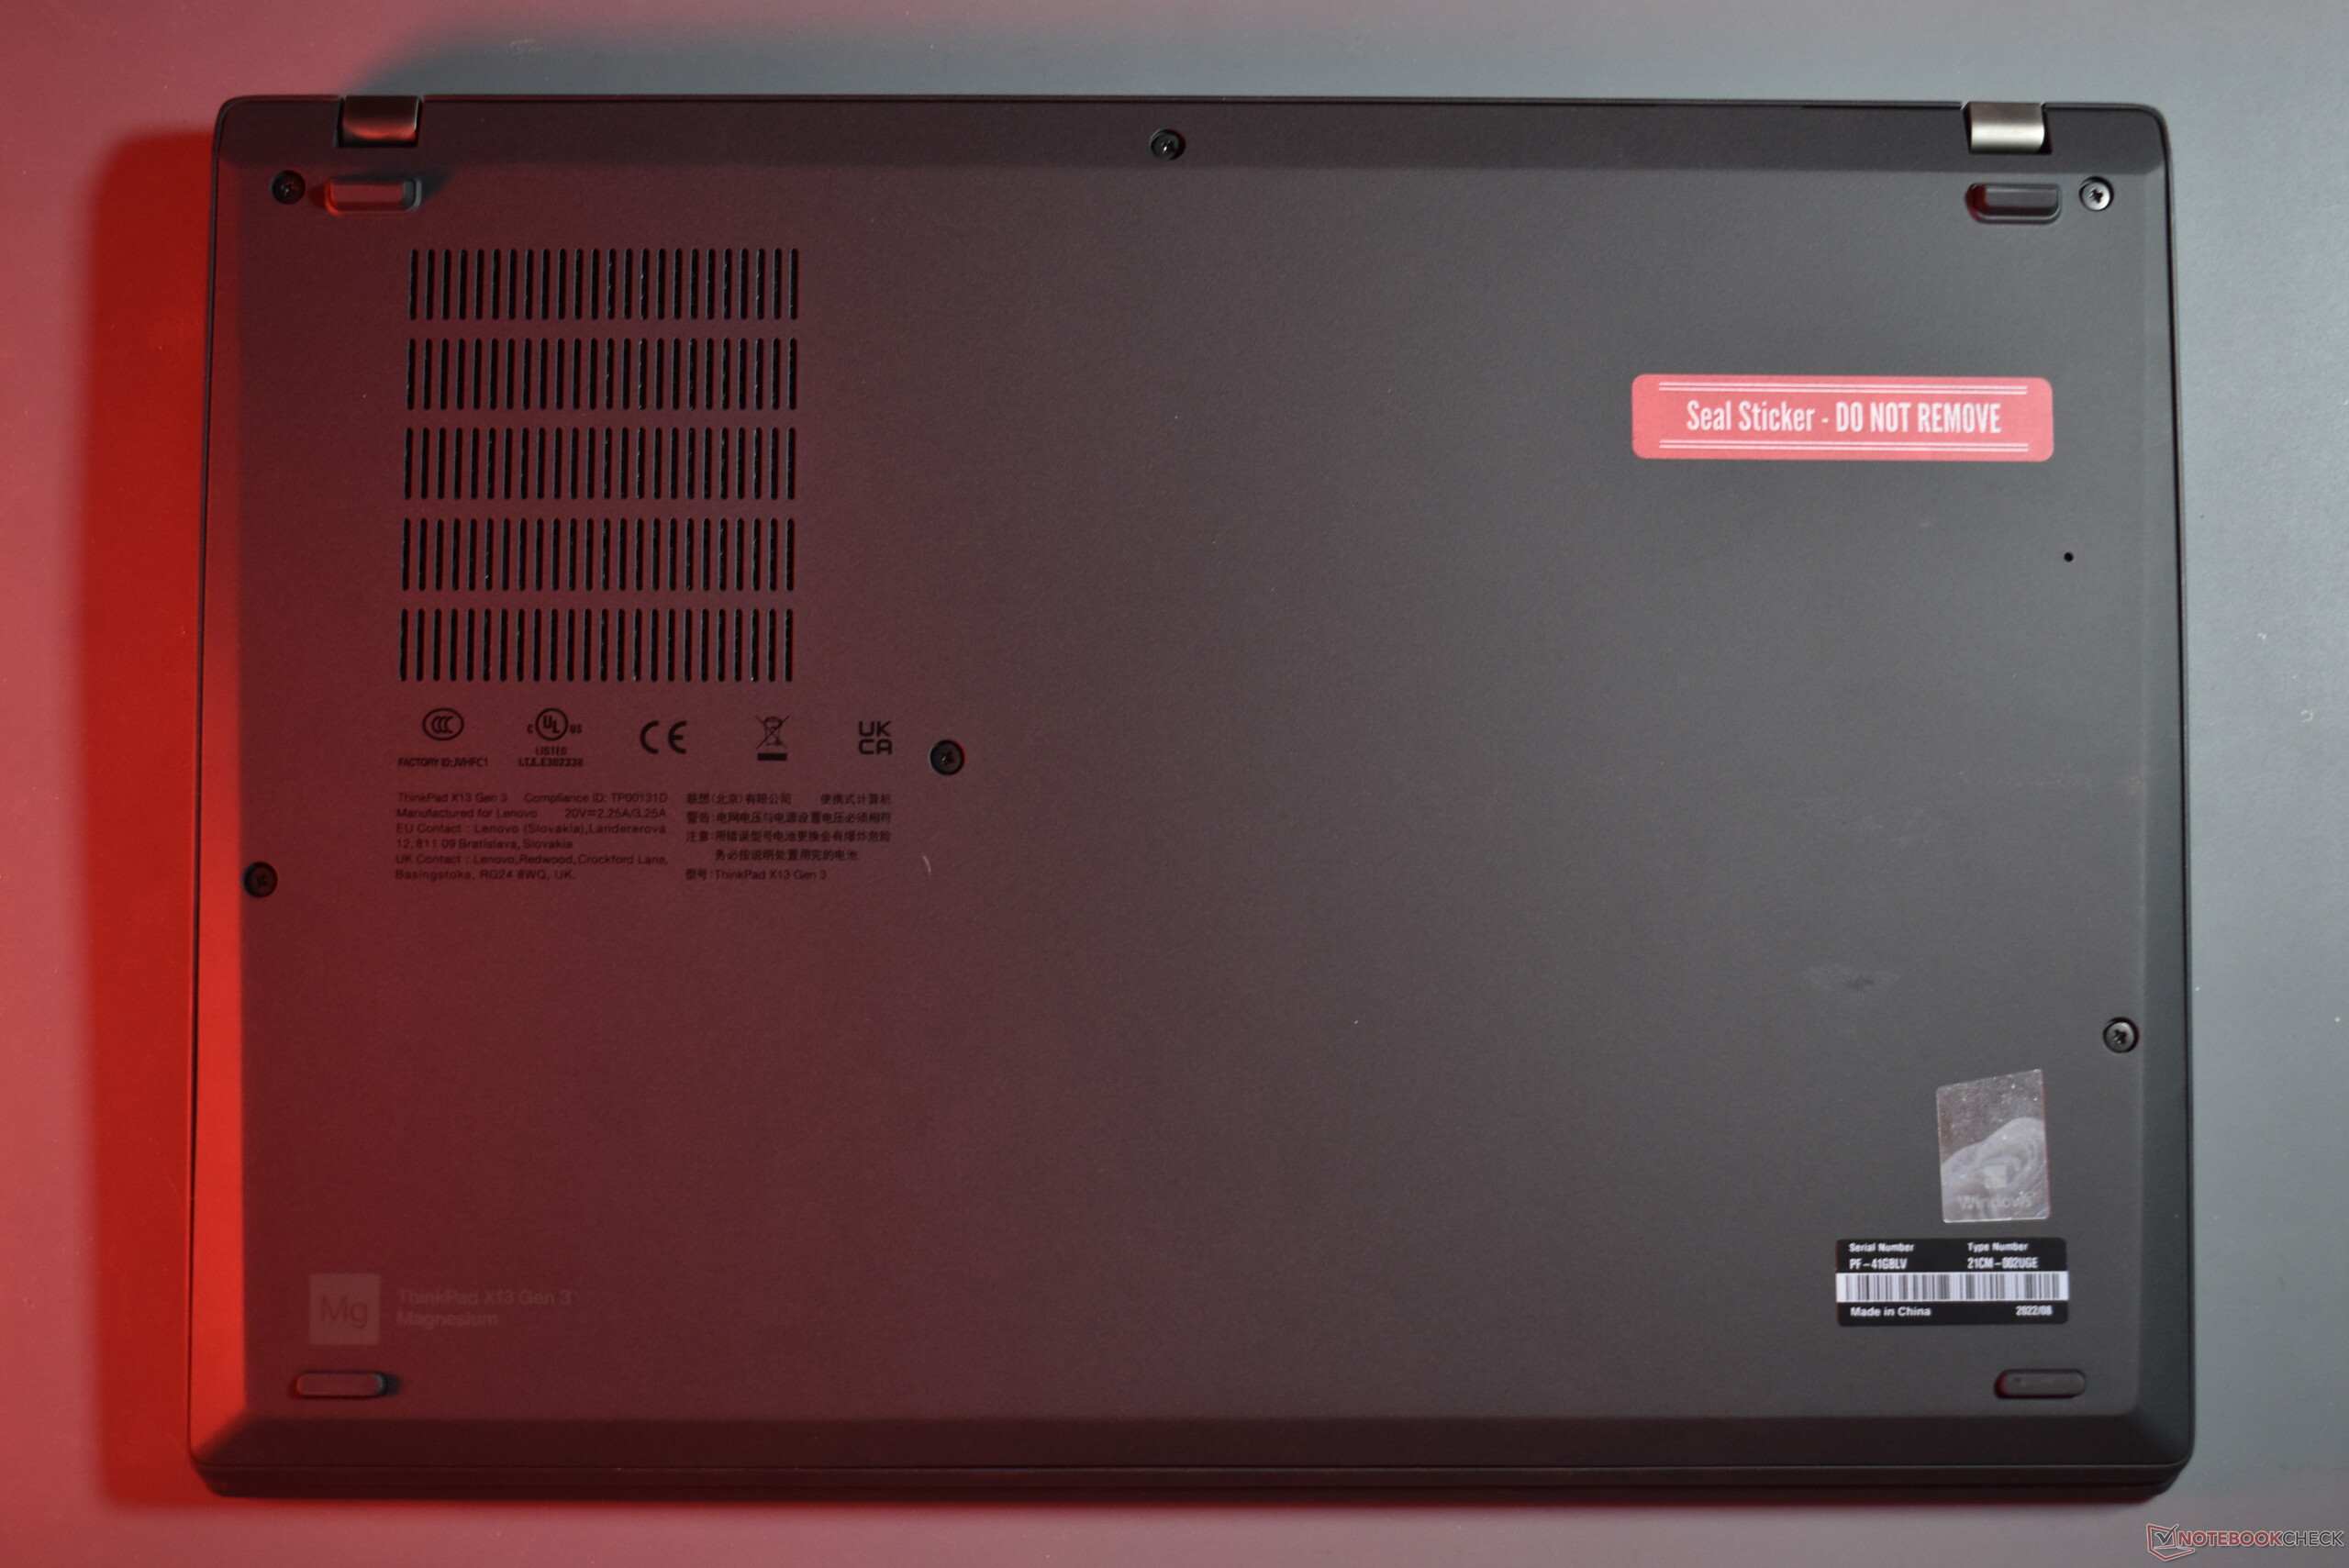
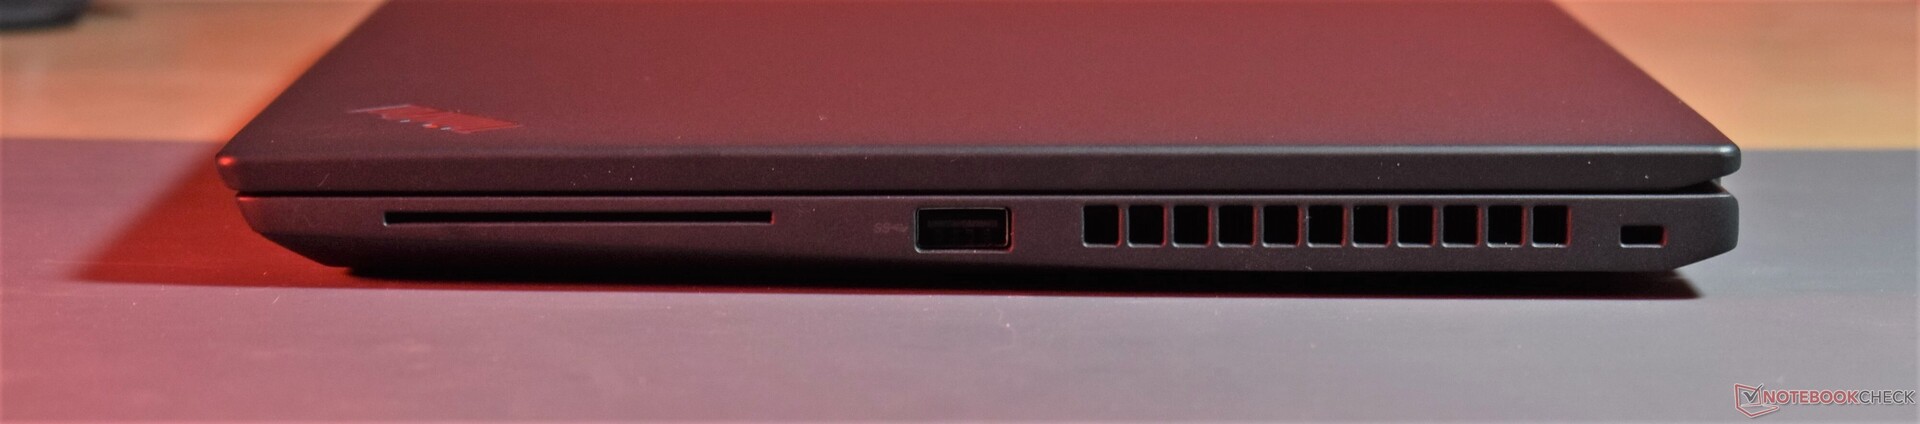
由于这是一个现有设计的更新,我们不会在设计、输入设备和连接的另一个描述上浪费时间。关于这些主题的详细信息可以在对 ThinkPad X13第二代.
潜在的竞争对手比较
Rating | Date | Model | Weight | Height | Size | Resolution | Price |
|---|---|---|---|---|---|---|---|
| 90.6 % v7 (old) | 06 / 2023 | Lenovo ThinkPad X13 G3 21CM002UGE R5 PRO 6650U, Radeon 660M | 1.3 kg | 18.1 mm | 13.30" | 1920x1200 | |
| 90.6 % v7 (old) | 11 / 2021 | Lenovo ThinkPad X13 G2 AMD 20XH001KGE R5 PRO 5650U, Vega 7 | 1.4 kg | 18.19 mm | 13.30" | 1920x1200 | |
| 89.2 % v7 (old) | 01 / 2023 | HP EliteBook 835 G9 R7 PRO 6850U, Radeon 680M | 1.3 kg | 19.2 mm | 13.30" | 1920x1200 | |
| 89 % v7 (old) | 07 / 2022 | Dell Latitude 13 7330 i7-1265U, Iris Xe G7 96EUs | 1 kg | 16.96 mm | 13.30" | 1920x1080 | |
| 89.4 % v7 (old) | 11 / 2022 | Lenovo ThinkPad X13 G3 21BN0046GE i5-1235U, Iris Xe G7 80EUs | 1.3 kg | 18.9 mm | 13.30" | 1920x1200 |
尺寸和重量的比较
沟通
值得注意的是,联想ThinkPad X13 G3 AMD或其高通WiFi解决方案的上传传输率较弱。另一方面,下载率则非常好。
| Networking | |
| Lenovo ThinkPad X13 G3 21CM002UGE | |
| iperf3 transmit AXE11000 | |
| iperf3 receive AXE11000 | |
| iperf3 transmit AXE11000 6GHz | |
| iperf3 receive AXE11000 6GHz | |
| HP EliteBook 835 G9 | |
| iperf3 transmit AXE11000 | |
| iperf3 receive AXE11000 | |
| Dell Latitude 13 7330 | |
| iperf3 transmit AXE11000 6GHz | |
| iperf3 receive AXE11000 6GHz | |
| Lenovo ThinkPad X13 G3 21BN0046GE | |
| iperf3 transmit AXE11000 | |
| iperf3 receive AXE11000 | |
| Average Qualcomm WCN685x | |
| iperf3 transmit AXE11000 | |
| iperf3 receive AXE11000 | |
| iperf3 transmit AXE11000 6GHz | |
| iperf3 receive AXE11000 6GHz | |
网络摄像头
与之相比 联想ThinkPad X13第二代,1080p网络摄像头的质量没有变化。


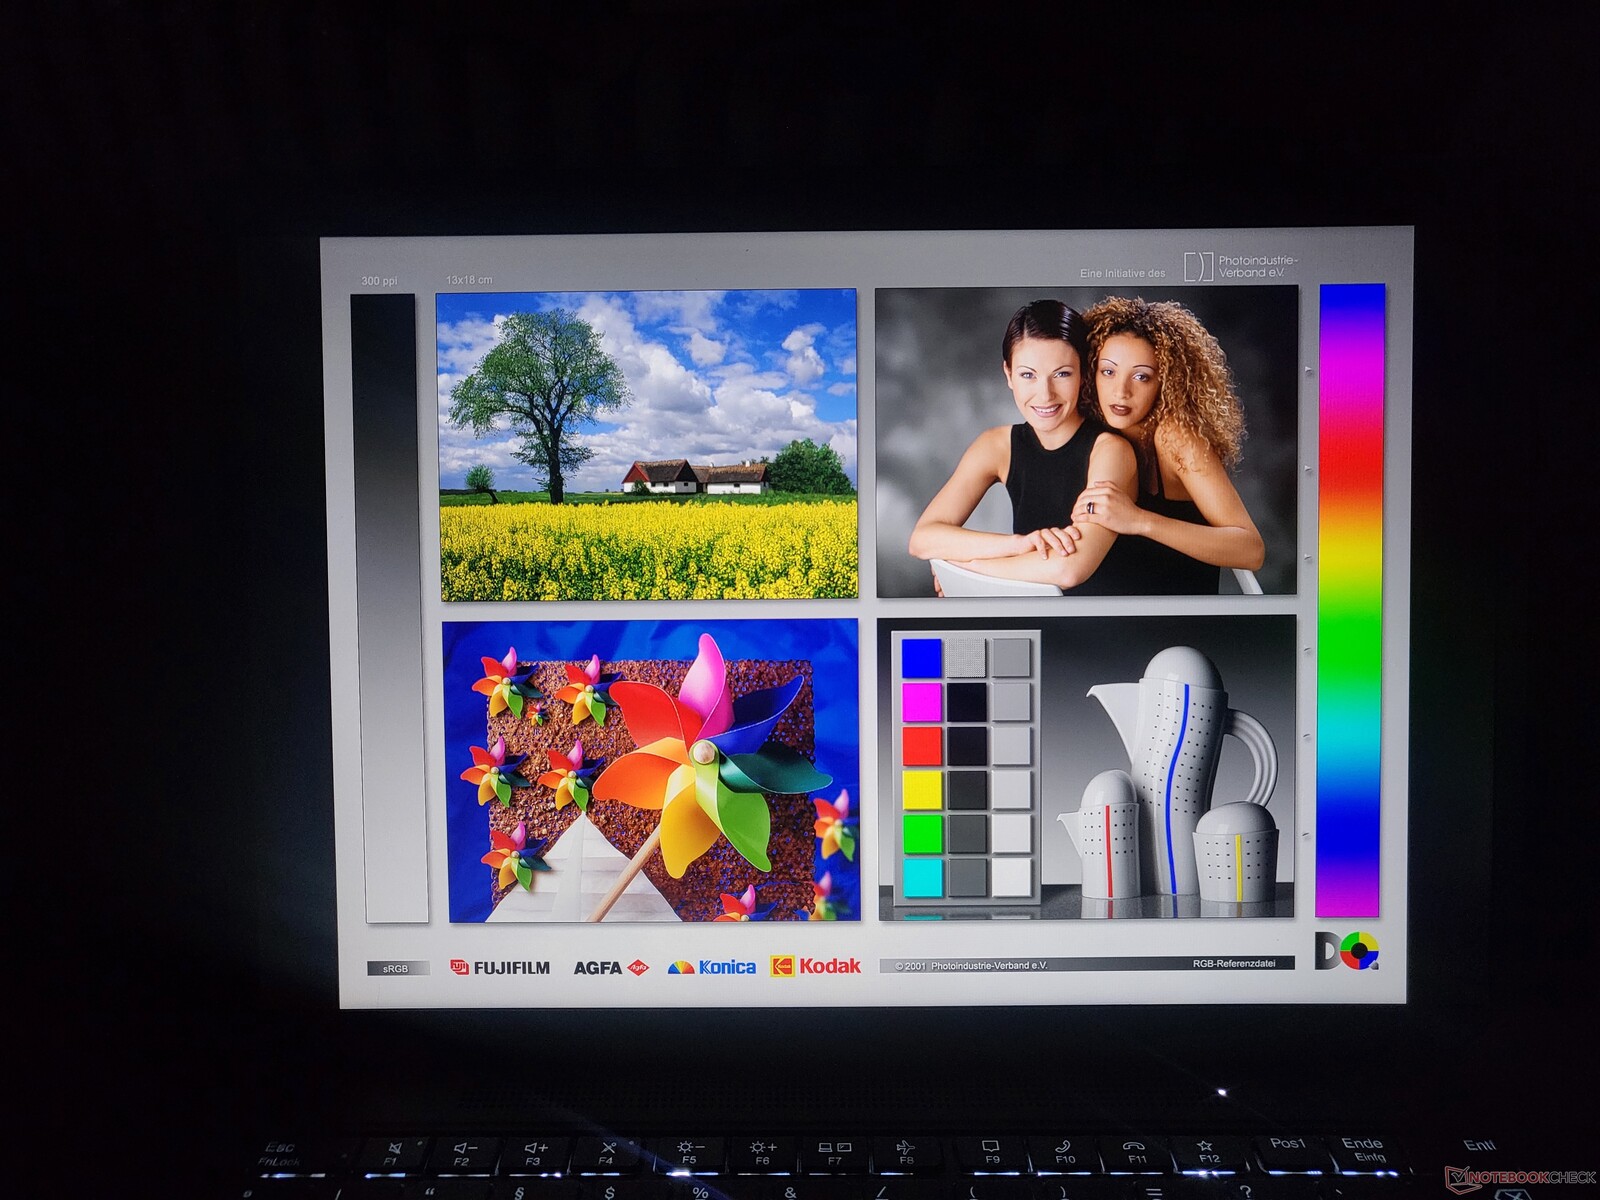
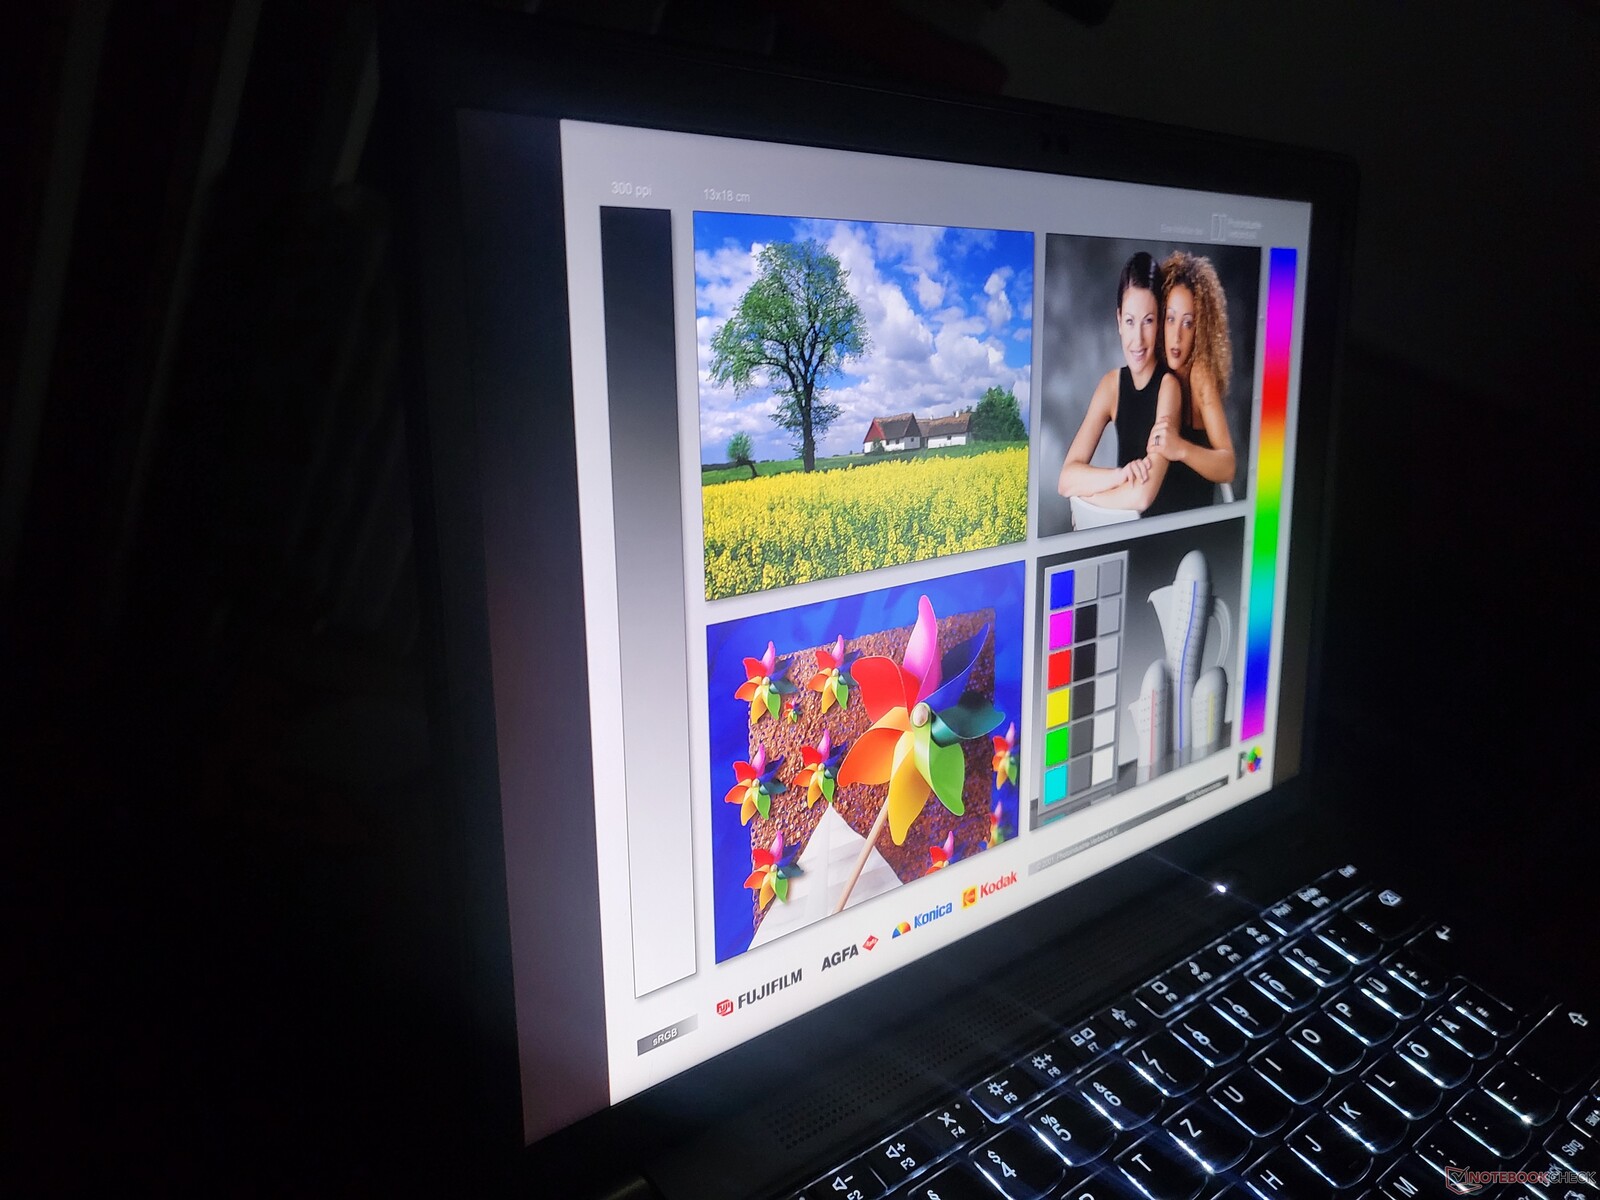
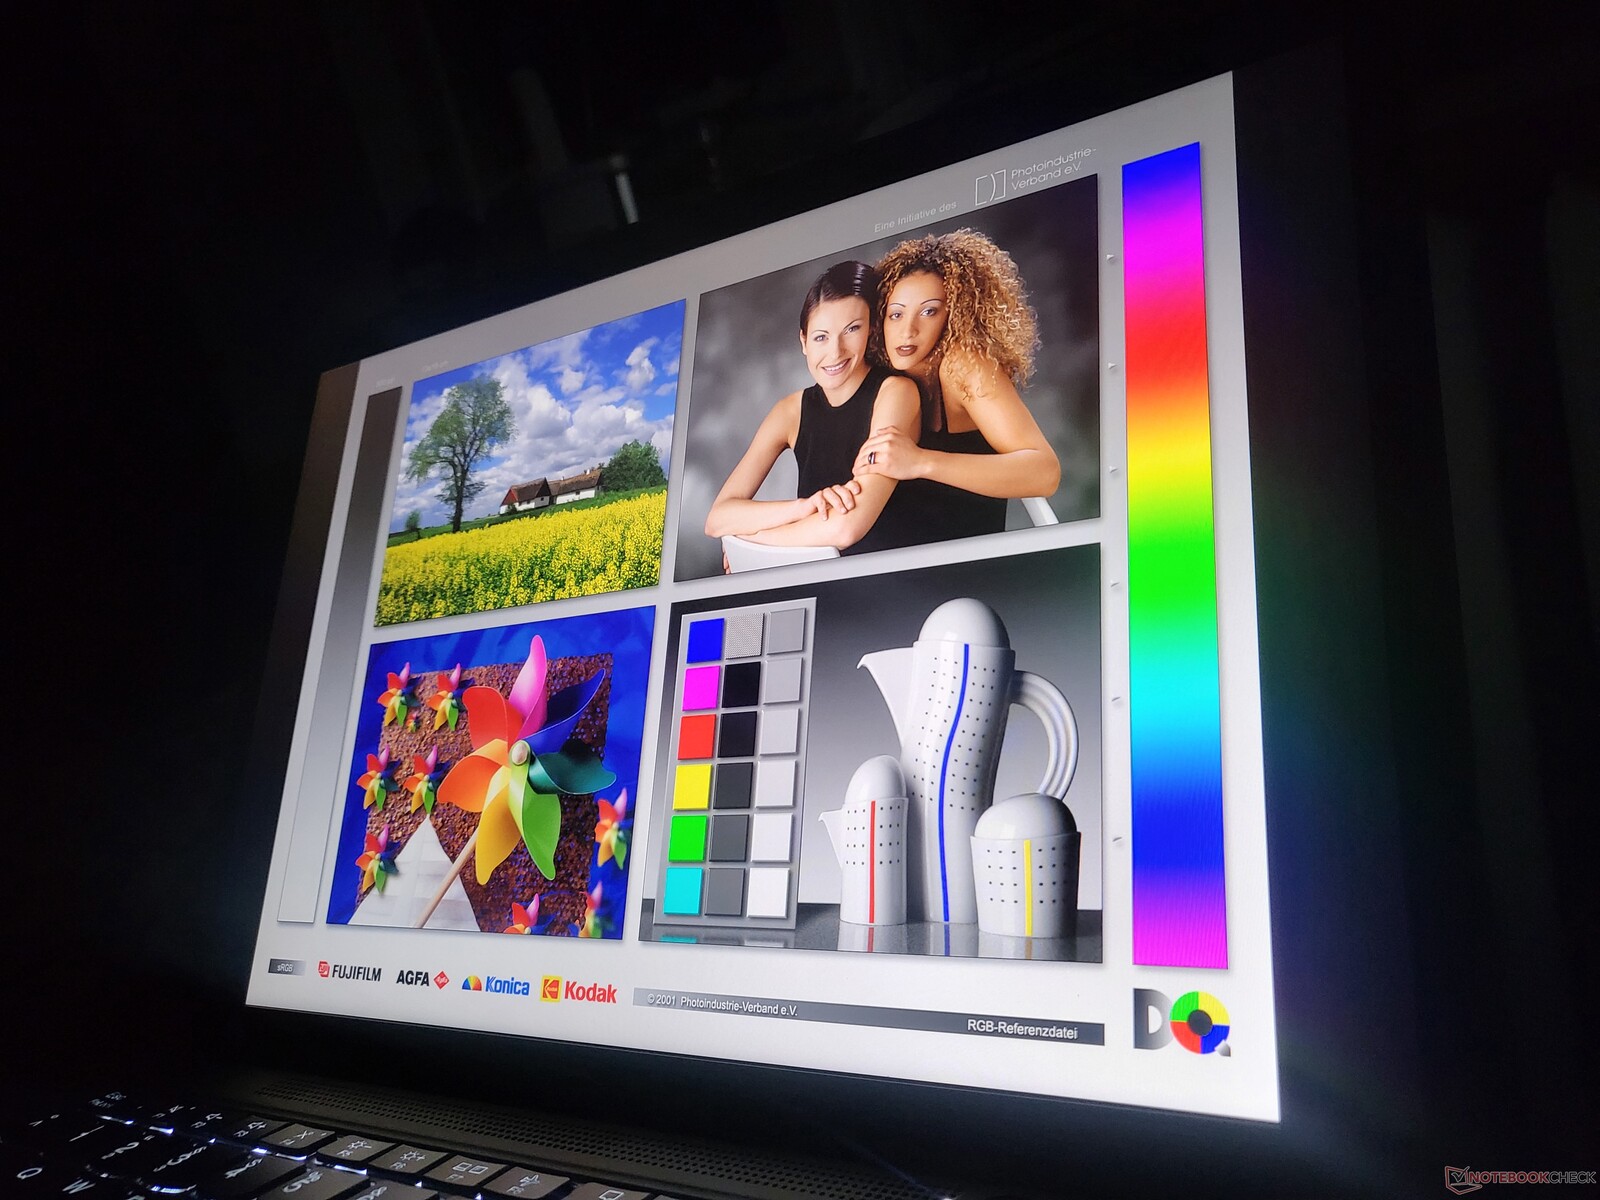
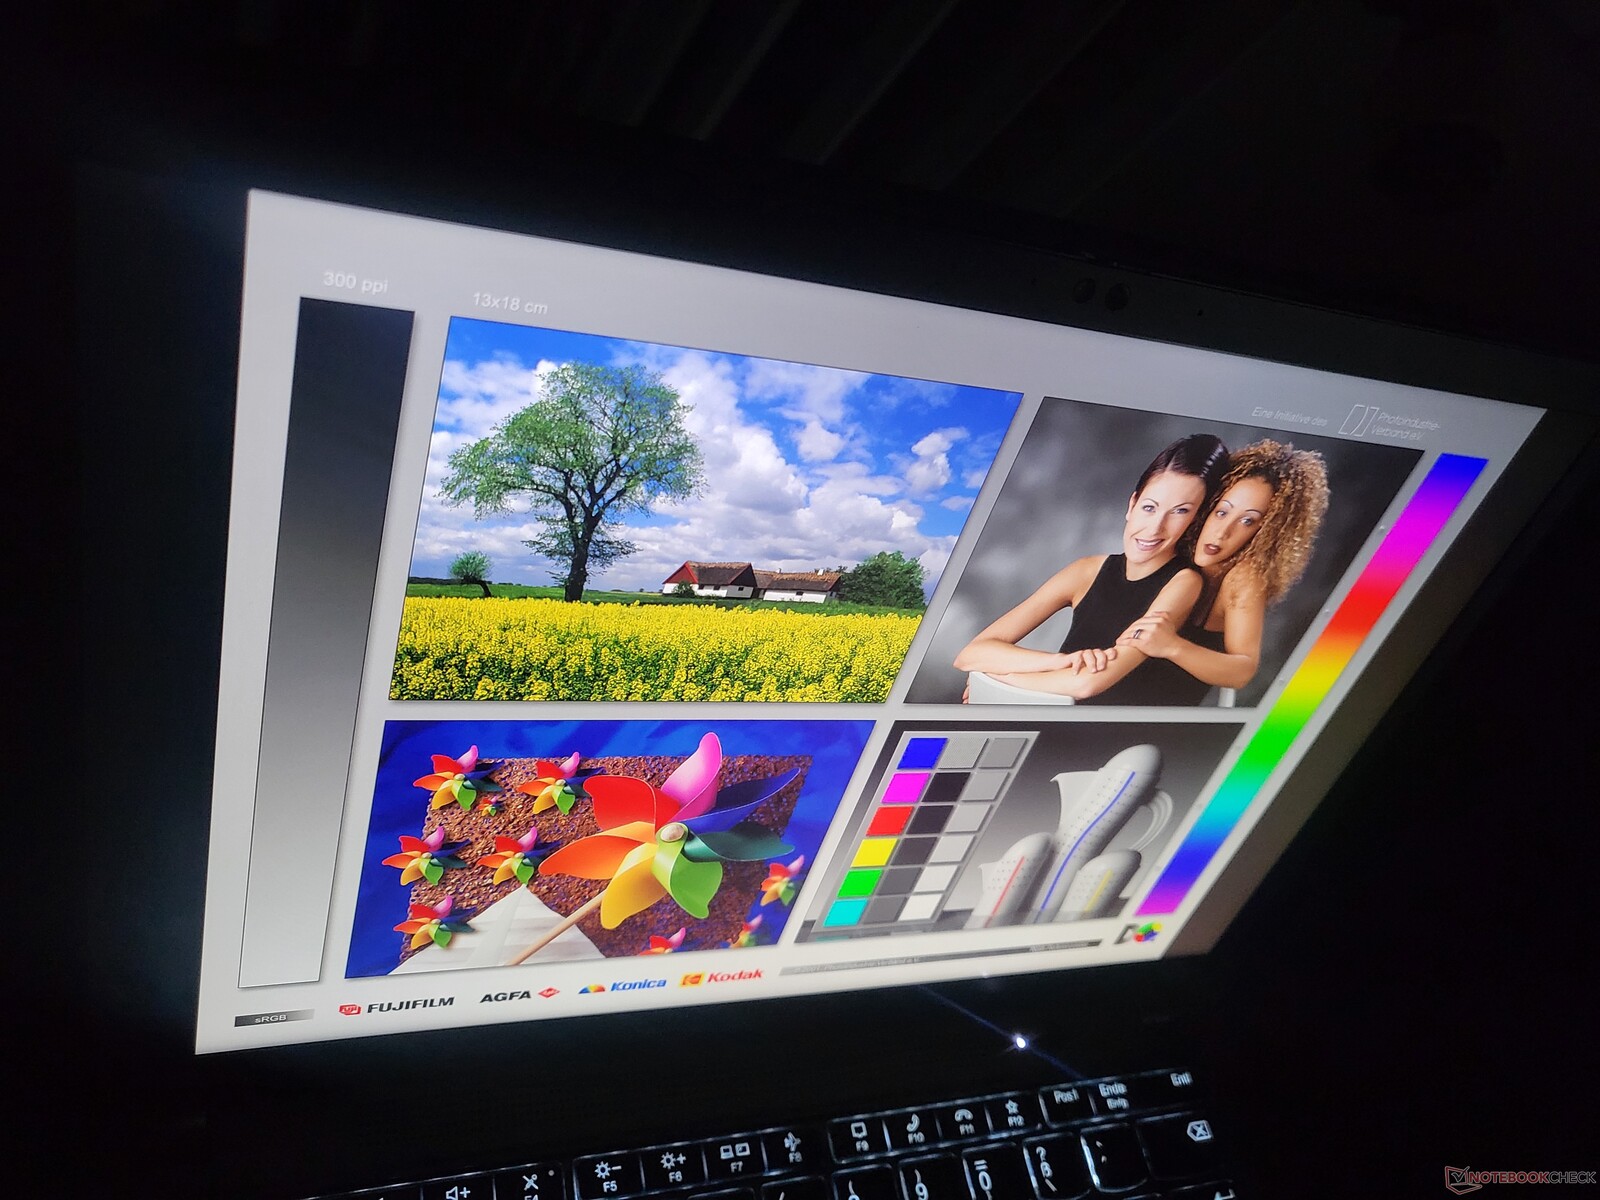
显示:联想笔记本电脑的屏幕亮度可以更好一些
与2022年的型号相比,13.3英寸屏幕的选择仍然没有改变。所有可用的屏幕都有一个哑光表面,16:10的长宽比和60赫兹的刷新率:
- 1,920 x 1,200 (WUXGA), 300 cd/m², 72 % NTSC
- 1,920 x 1,200 (WUXGA), 300 cd/m², 72 % NTSC, On-Cell Touch
- 1,920 x 1,200 (WUXGA), 500 cd/m², 72 % NTSC, PrivacyGuard
- 2,560 x 1,600 (WQXGA), 400 cd/m², 100 % sRGB, 低功耗, Dolby Vision
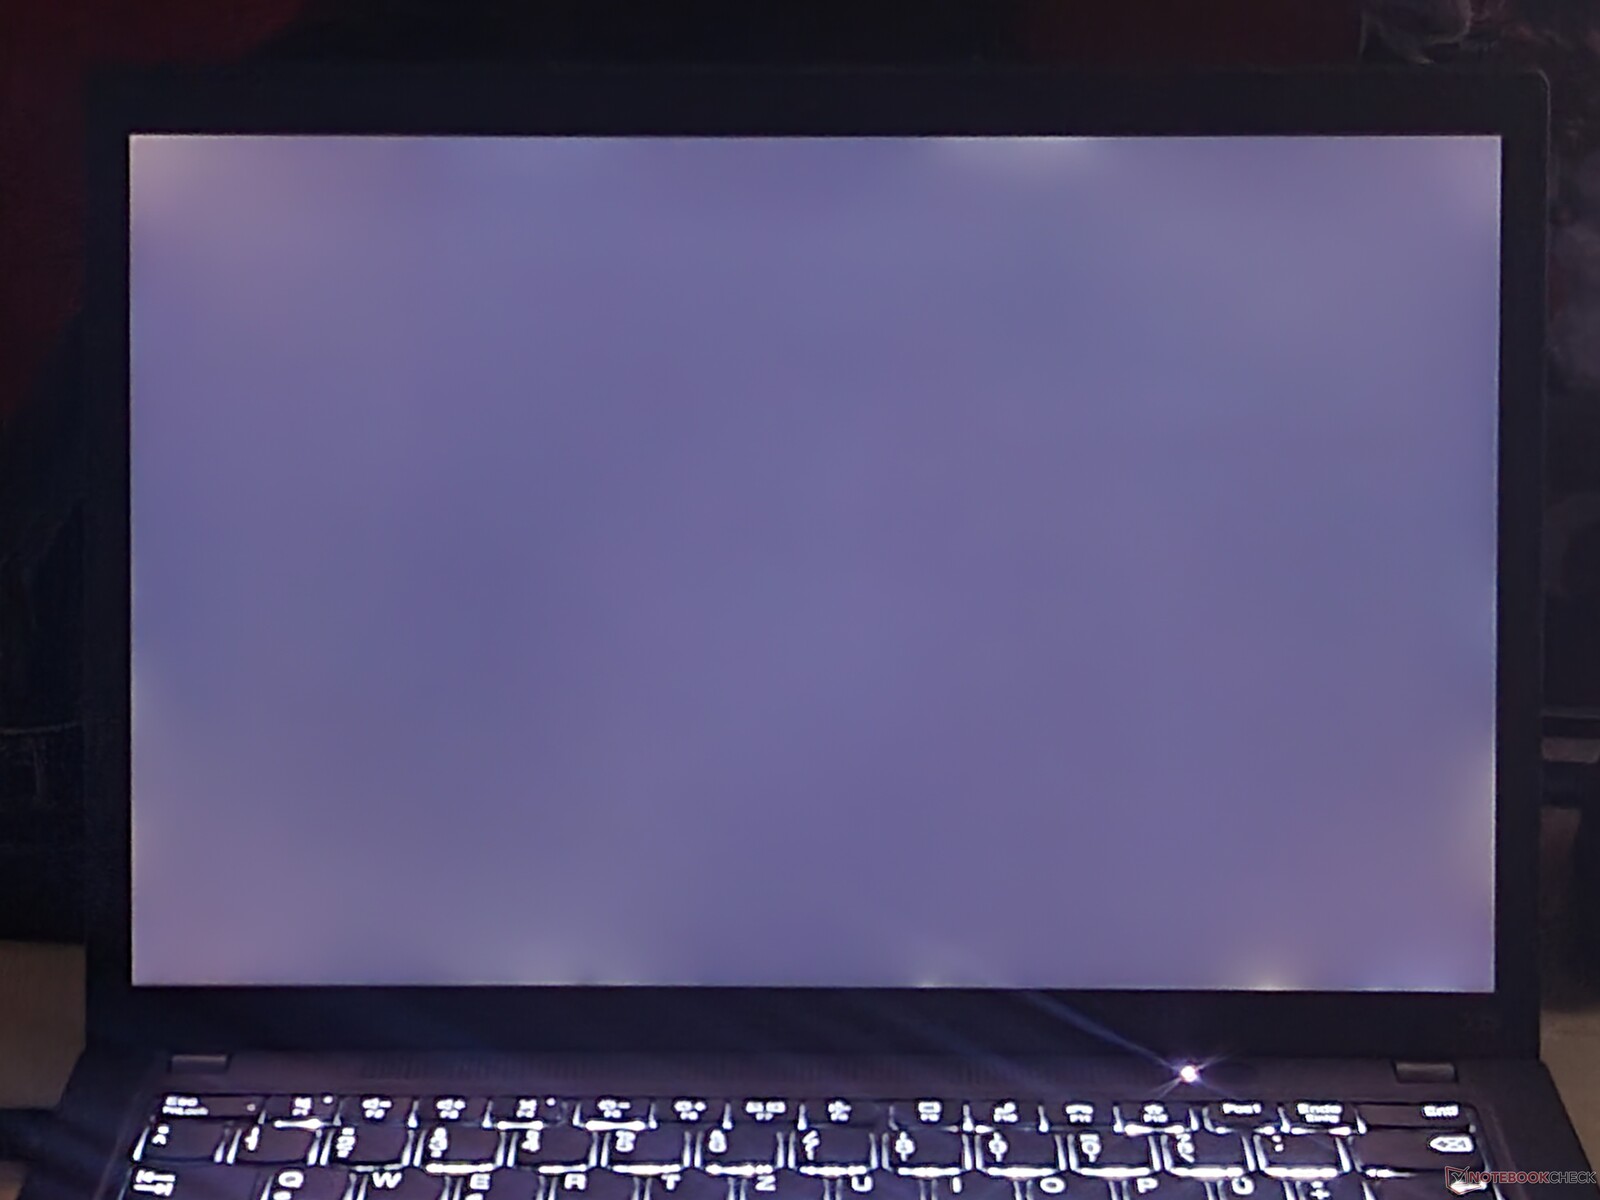
测得的平均亮度为321 cd/m²,略高于宣传的300 cd/m²的阈值。值得注意的是:以戴尔和惠普为代表的竞争对手提供了更明亮的屏幕。平均830cd/m²的屏幕,如 HP EliteBook 835 G9提供的基本面板并不是真正需要的,但如果联想能给予X13更明亮的屏幕就好了--而不强迫用户升级到WQXGA或PrivacyGuard面板。400 cd/m²加X像戴尔Latitude 7330提供的亮度将是合理的。
| |||||||||||||||||||||||||
Brightness Distribution: 85 %
Center on Battery: 348 cd/m²
Contrast: 1024:1 (Black: 0.34 cd/m²)
ΔE ColorChecker Calman: 1.3 | ∀{0.5-29.43 Ø4.71}
calibrated: 1
ΔE Greyscale Calman: 0.9 | ∀{0.09-98 Ø4.96}
70.3% AdobeRGB 1998 (Argyll 3D)
98.4% sRGB (Argyll 3D)
69% Display P3 (Argyll 3D)
Gamma: 2.16
CCT: 6431 K
| Lenovo ThinkPad X13 G3 21CM002UGE M133NW4J R3, IPS LED, 1920x1200, 13.3" | Lenovo ThinkPad X13 G2 AMD 20XH001KGE NV133WUM-N61, IPS LED, 1920x1200, 13.3" | HP EliteBook 835 G9 InfoVision X133NV4M R0, IPS, 1920x1200, 13.3" | Dell Latitude 13 7330 LG Philips 133WF9, IPS, 1920x1080, 13.3" | Lenovo ThinkPad X13 G3 21BN0046GE NV133WUM-N61, IPS Grade, 1920x1200, 13.3" | |
|---|---|---|---|---|---|
| Display | 1% | 2% | -4% | 1% | |
| Display P3 Coverage (%) | 69 | 70.1 2% | 70.7 2% | 66.1 -4% | 70.4 2% |
| sRGB Coverage (%) | 98.4 | 99.4 1% | 100 2% | 93.5 -5% | 99.8 1% |
| AdobeRGB 1998 Coverage (%) | 70.3 | 71.3 1% | 72.1 3% | 68.2 -3% | 71 1% |
| Response Times | 23% | 17% | -8% | 48% | |
| Response Time Grey 50% / Grey 80% * (ms) | 44.2 ? | 34 ? 23% | 37.7 ? 15% | 48.4 ? -10% | 22.9 ? 48% |
| Response Time Black / White * (ms) | 28.1 ? | 22 ? 22% | 22.7 ? 19% | 29.6 ? -5% | 14.8 ? 47% |
| PWM Frequency (Hz) | |||||
| Screen | -14% | 21% | -16% | -25% | |
| Brightness middle (cd/m²) | 348 | 309 -11% | 928 167% | 460.1 32% | 290 -17% |
| Brightness (cd/m²) | 321 | 297 -7% | 828 158% | 445 39% | 288 -10% |
| Brightness Distribution (%) | 85 | 81 -5% | 65 -24% | 89 5% | 88 4% |
| Black Level * (cd/m²) | 0.34 | 0.26 24% | 0.35 -3% | 0.31 9% | 0.21 38% |
| Contrast (:1) | 1024 | 1188 16% | 2651 159% | 1484 45% | 1381 35% |
| Colorchecker dE 2000 * | 1.3 | 1.6 -23% | 1.76 -35% | 2.42 -86% | 1.9 -46% |
| Colorchecker dE 2000 max. * | 2.5 | 3 -20% | 3.94 -58% | 3.97 -59% | 4 -60% |
| Colorchecker dE 2000 calibrated * | 1 | 0.8 20% | 1.09 -9% | 0.77 23% | 0.8 20% |
| Greyscale dE 2000 * | 0.9 | 2 -122% | 2.4 -167% | 2.3 -156% | 2.6 -189% |
| Gamma | 2.16 102% | 2.24 98% | 2.324 95% | 2.23 99% | 2.23 99% |
| CCT | 6431 101% | 6315 103% | 6689 97% | 6262 104% | 6195 105% |
| Total Average (Program / Settings) | 3% /
-6% | 13% /
16% | -9% /
-13% | 8% /
-9% |
* ... smaller is better
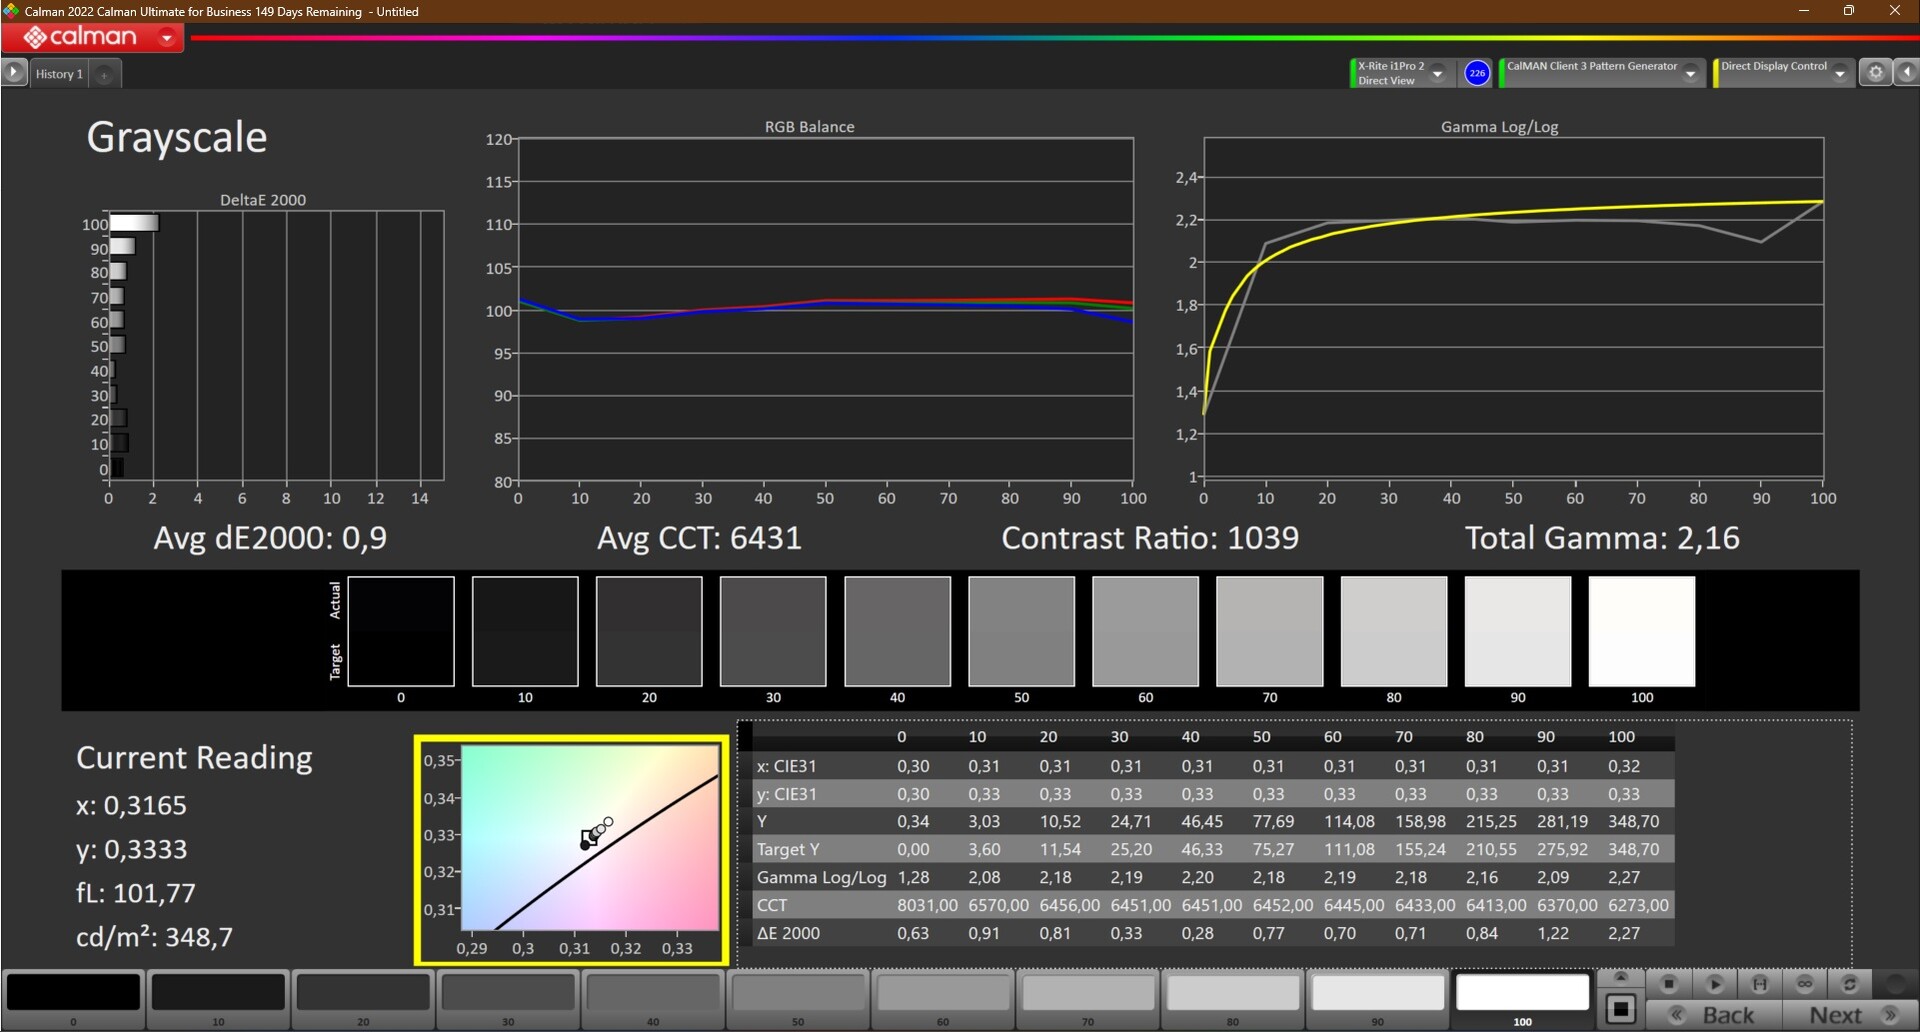

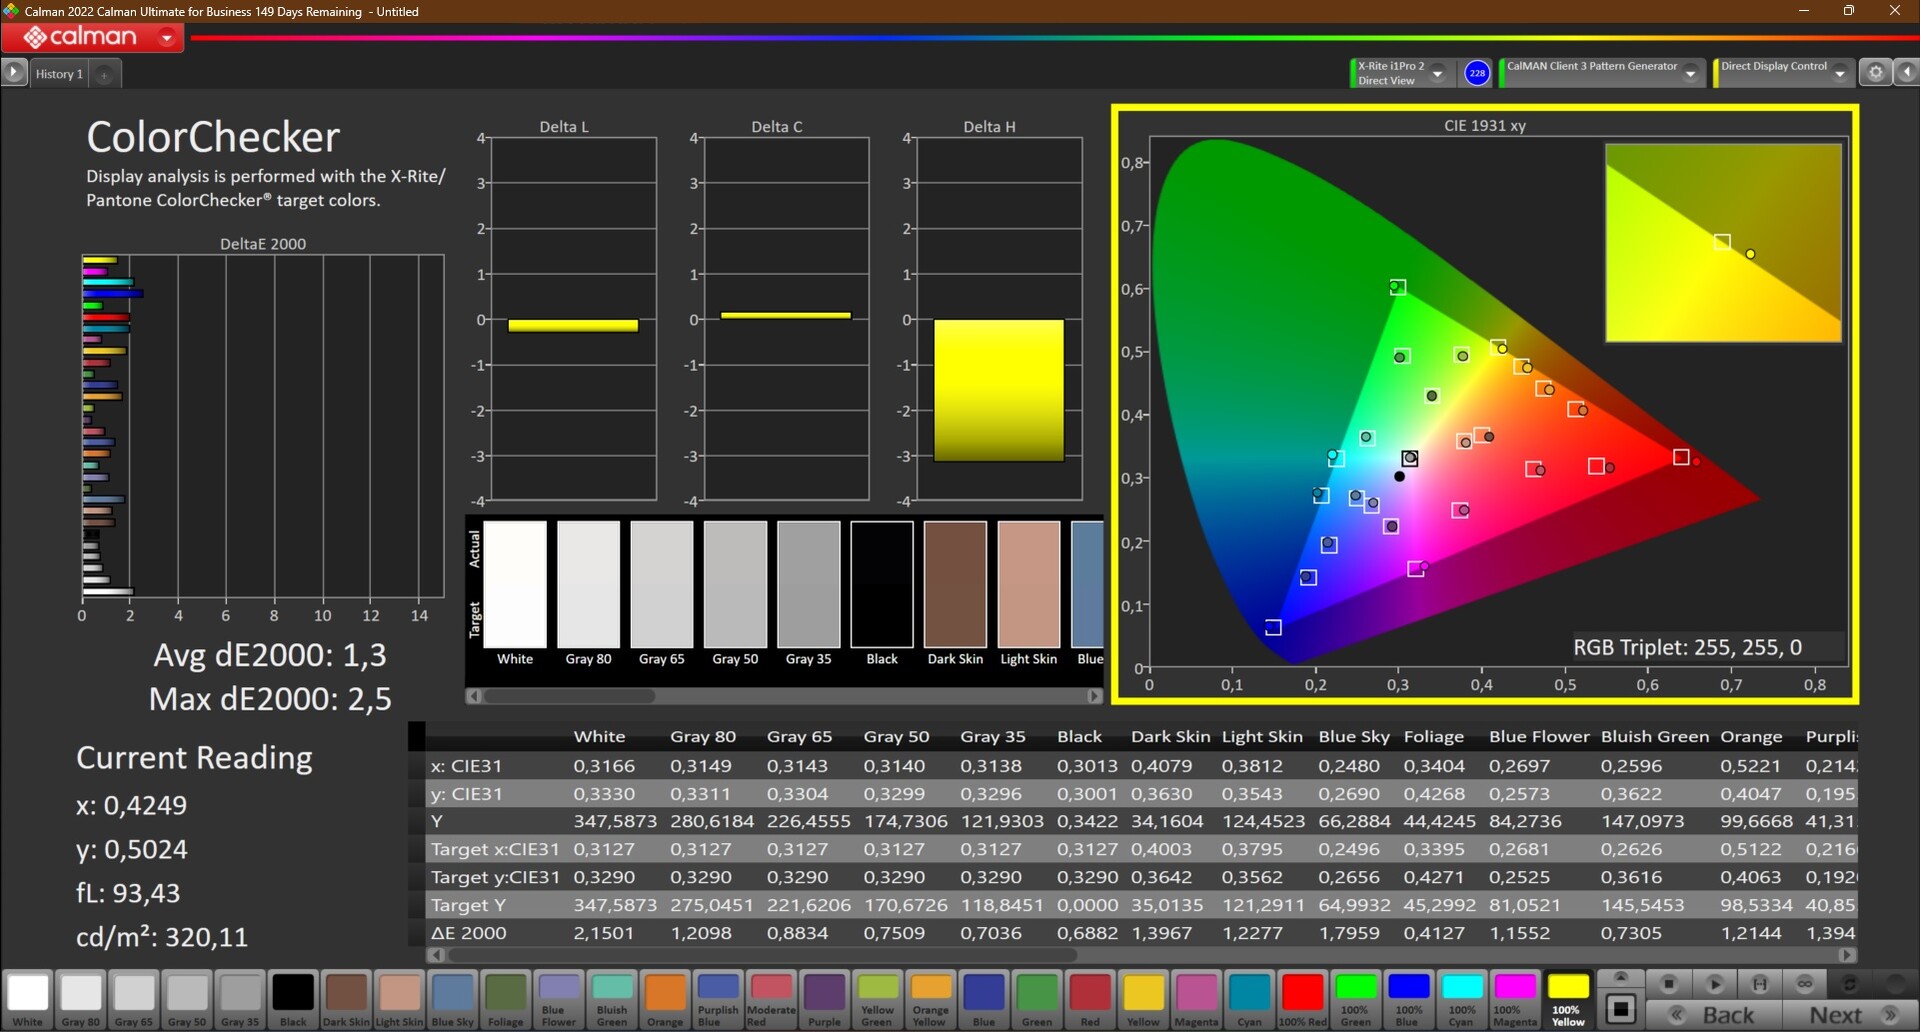
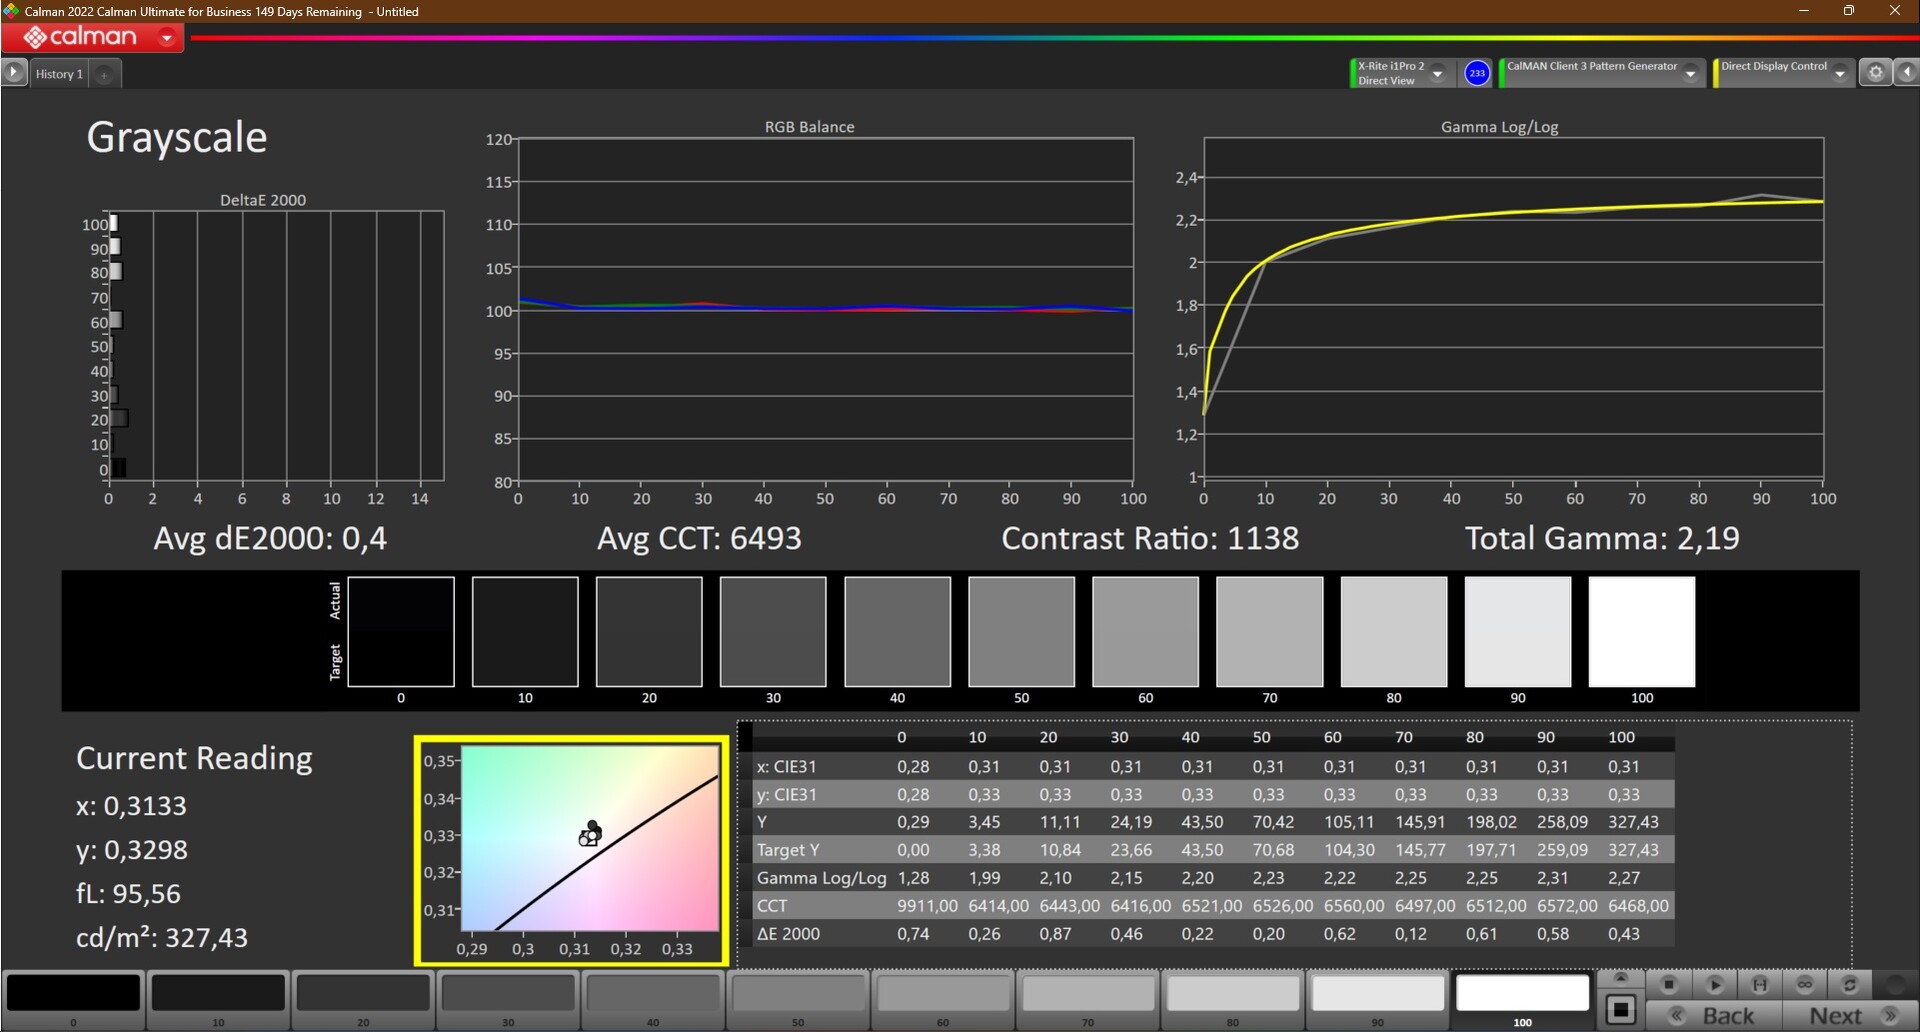
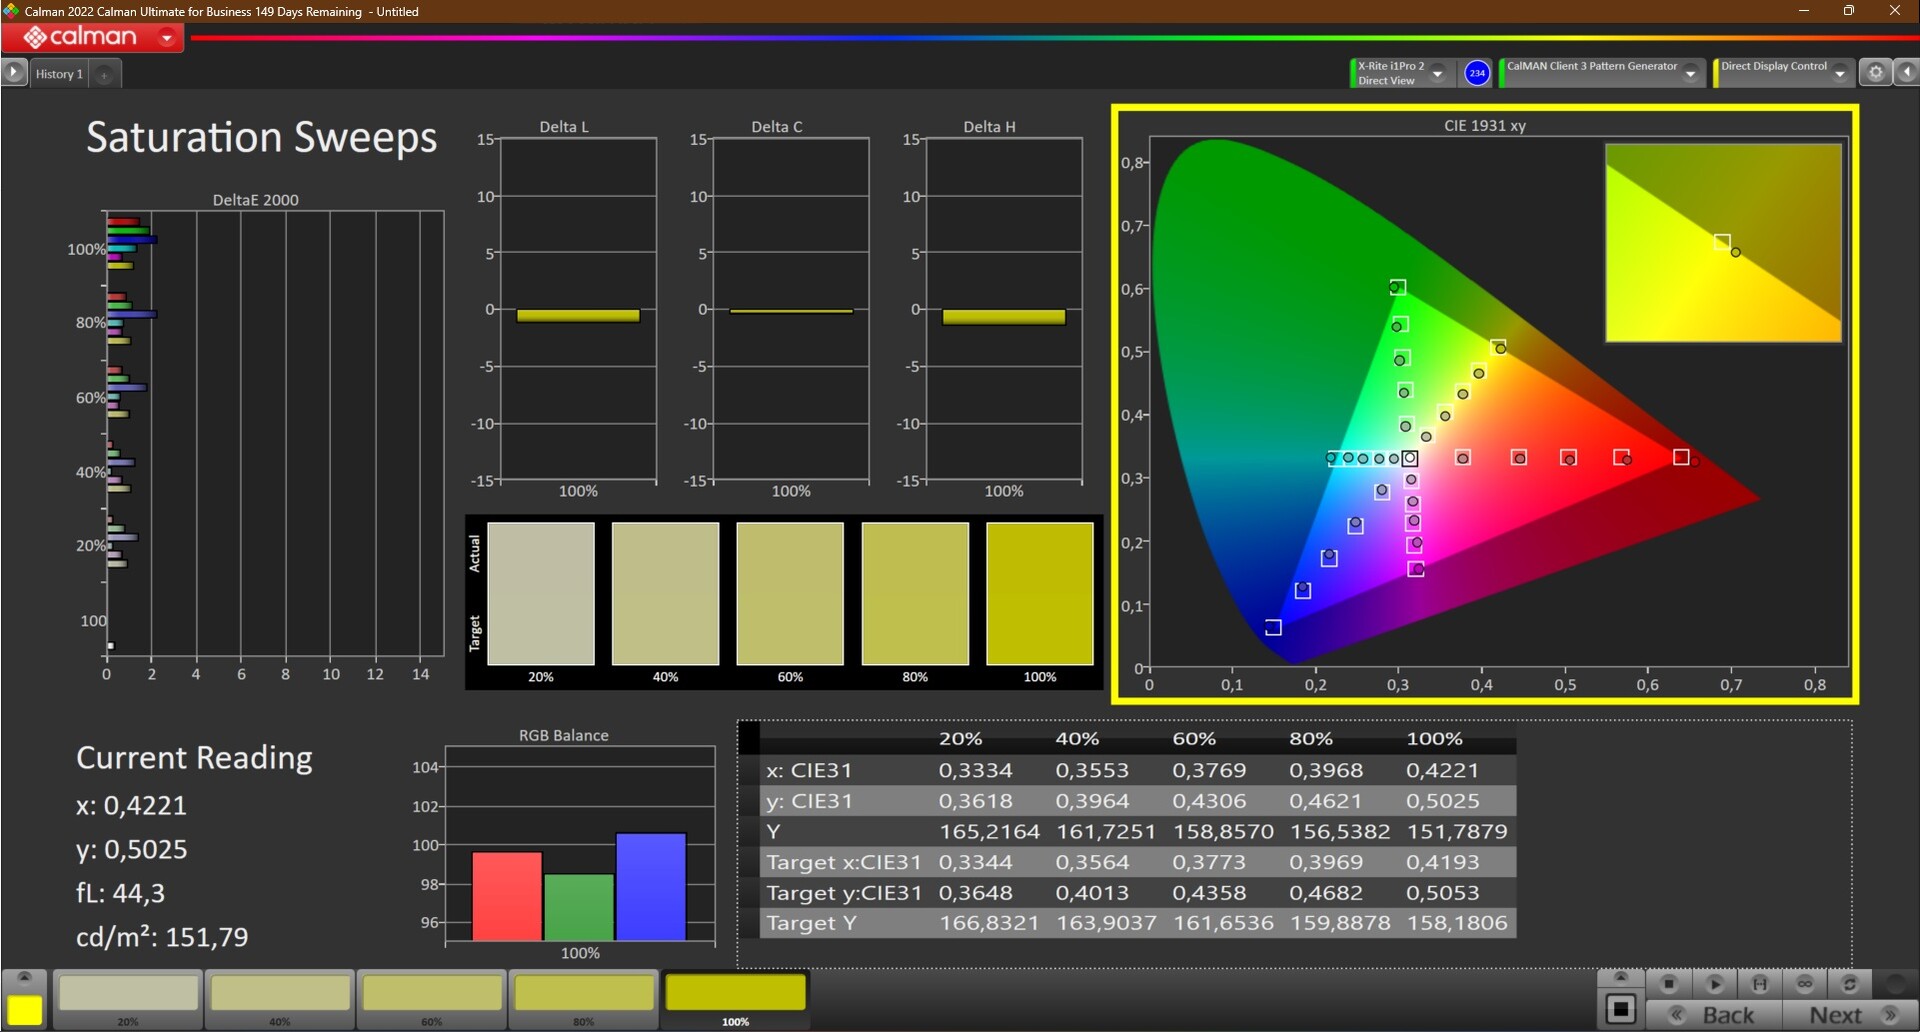
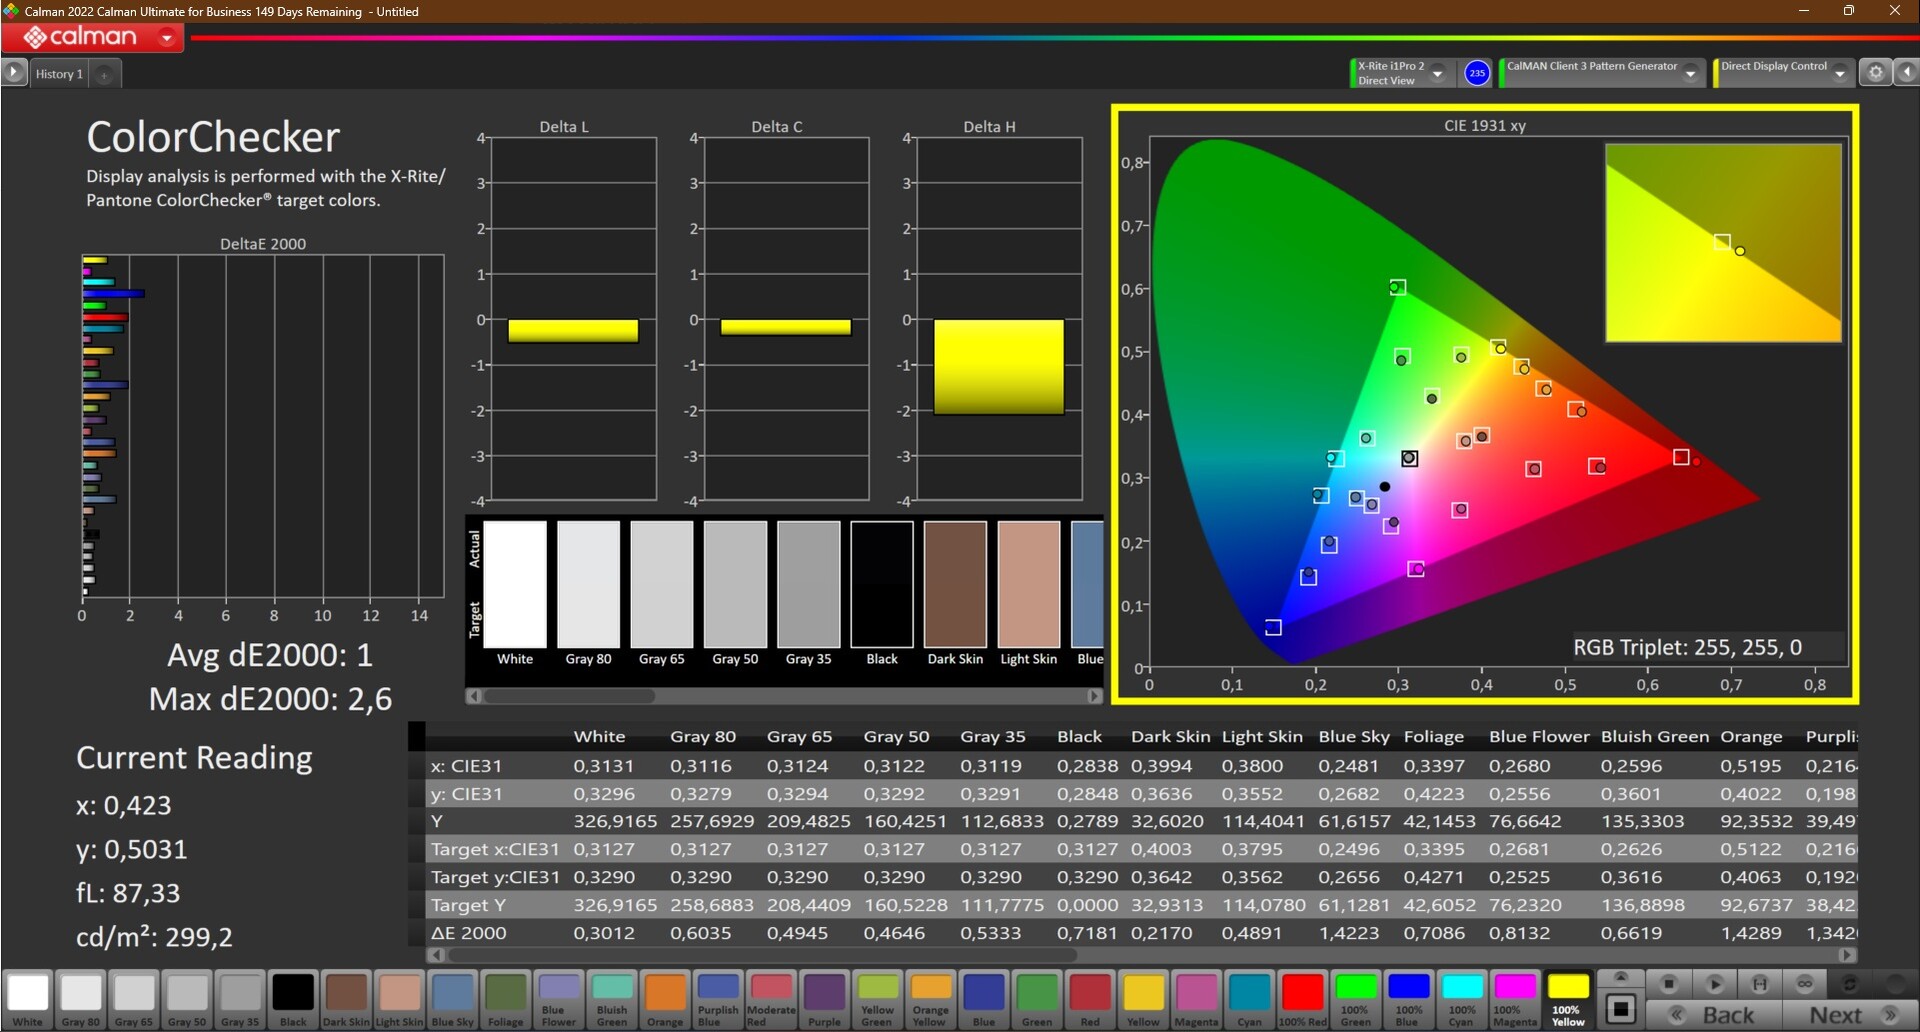
该面板在出厂时就已经很好地调整了颜色。用CalMan和X-Rite i1Pro 2色度计测量的低平均deltaE只有1.3,这就是证明。在用X-Rite i1Profiler进行校准后,屏幕的颜色变得稍微准确一些(1.0而不是1.3)。我们为此而创建的色彩配置文件可供免费下载,一如既往。
在色域覆盖方面,联想ThinkPad X13 G3 AMD的面板几乎完全覆盖sRGB色域。它可以用于基本的照片编辑任务。
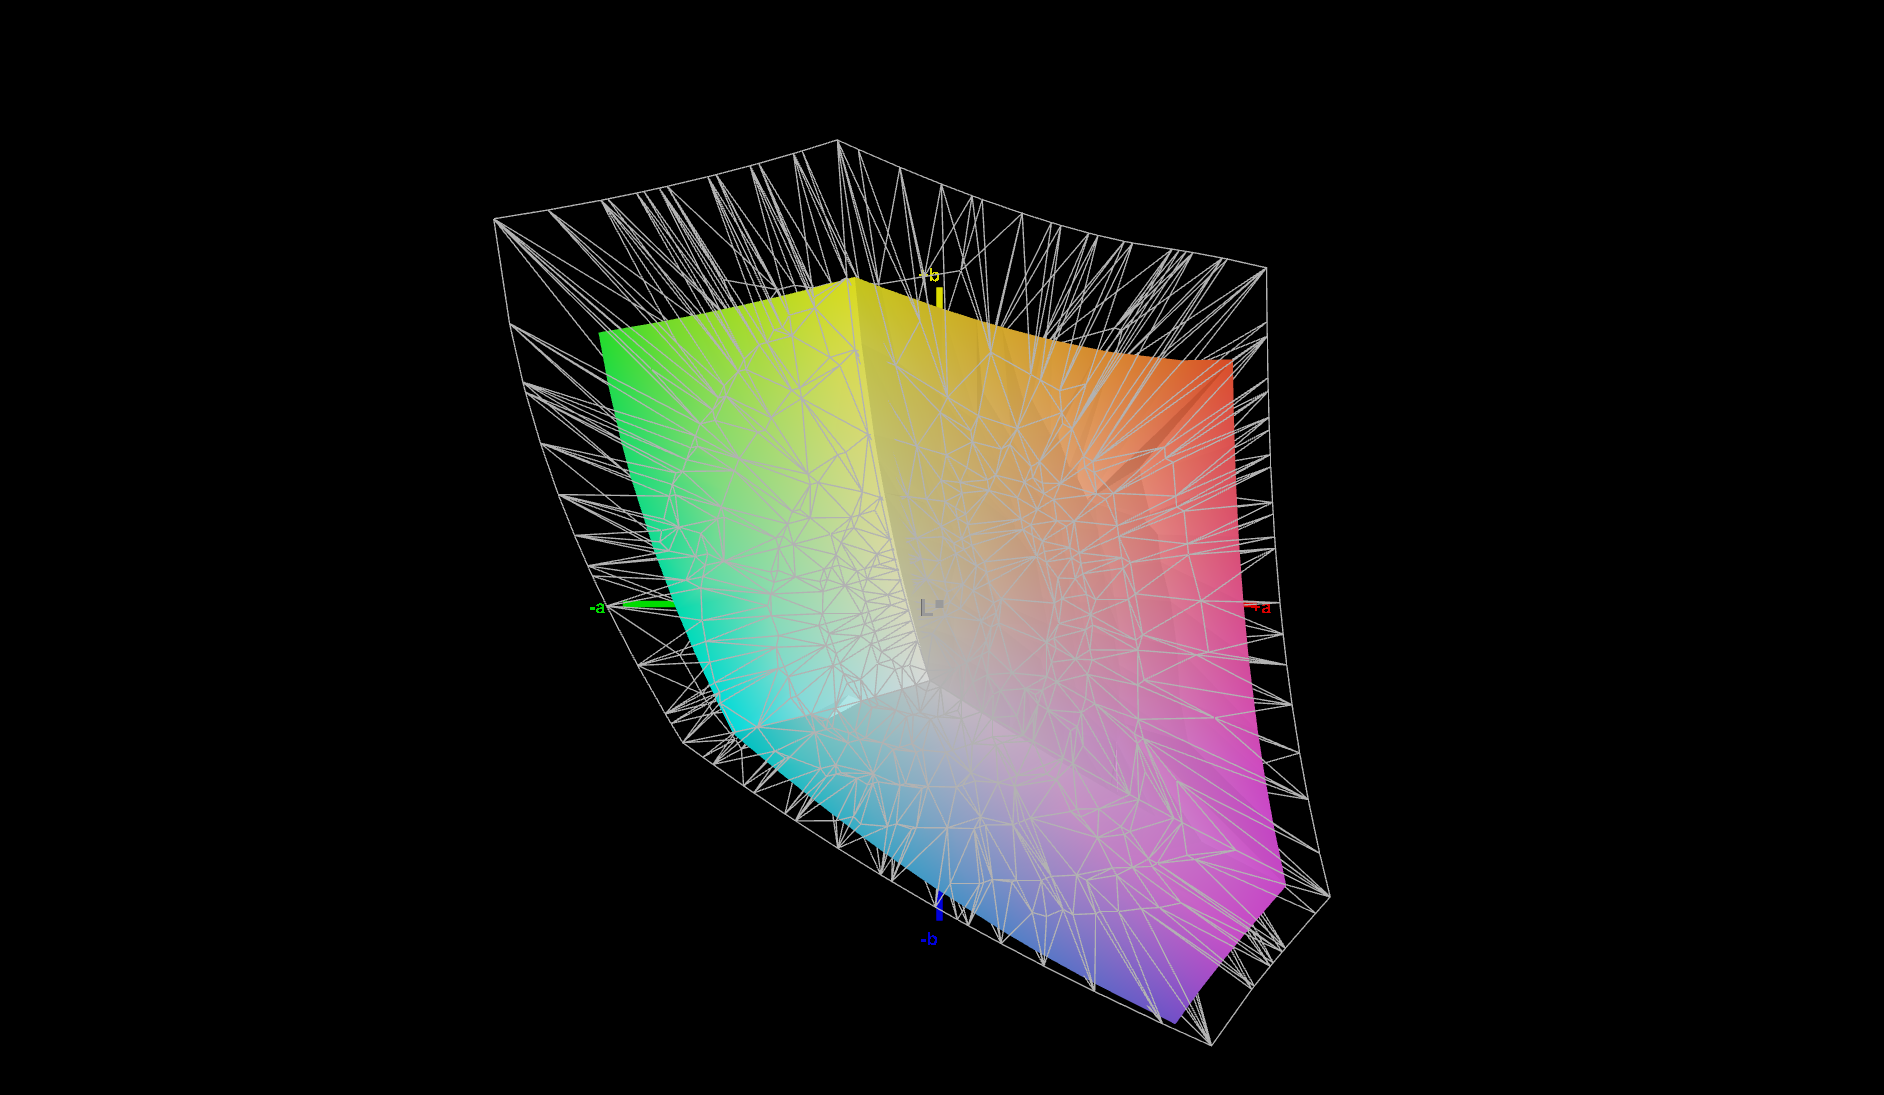
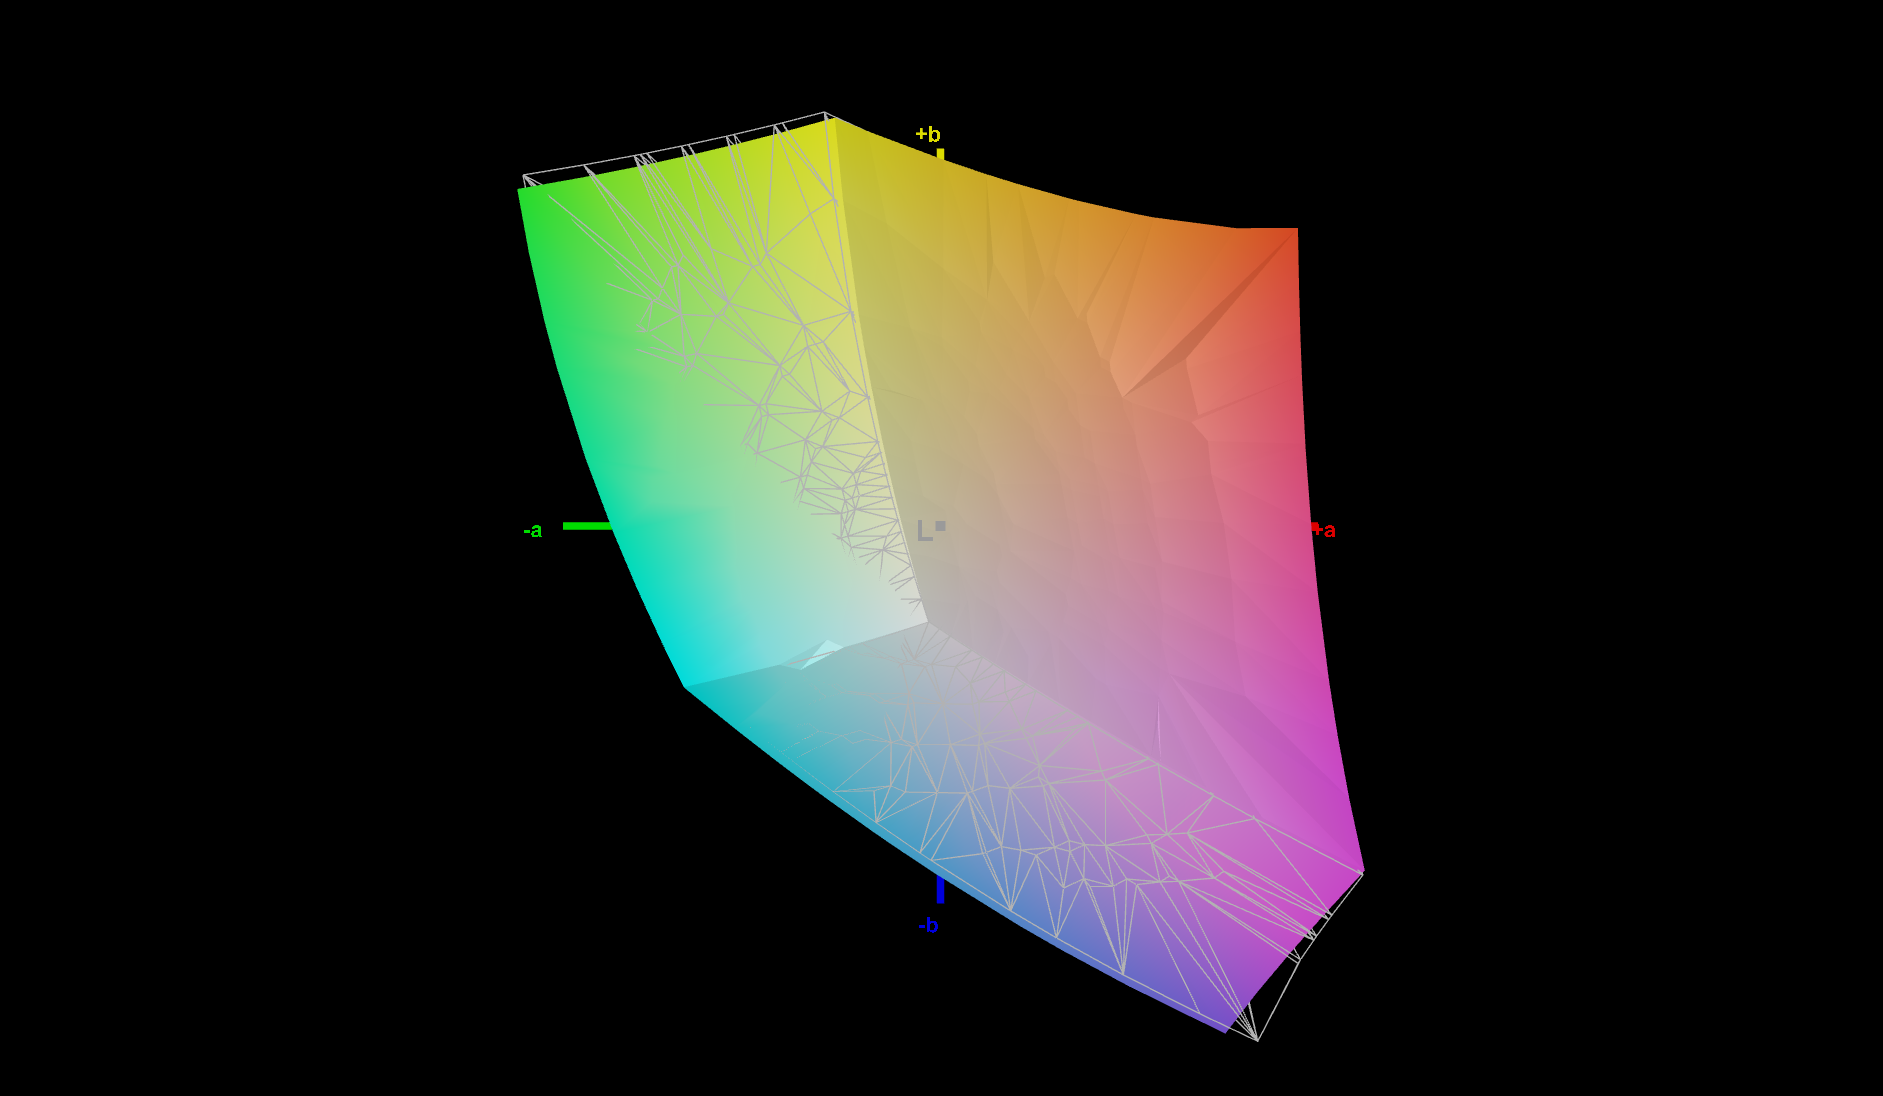
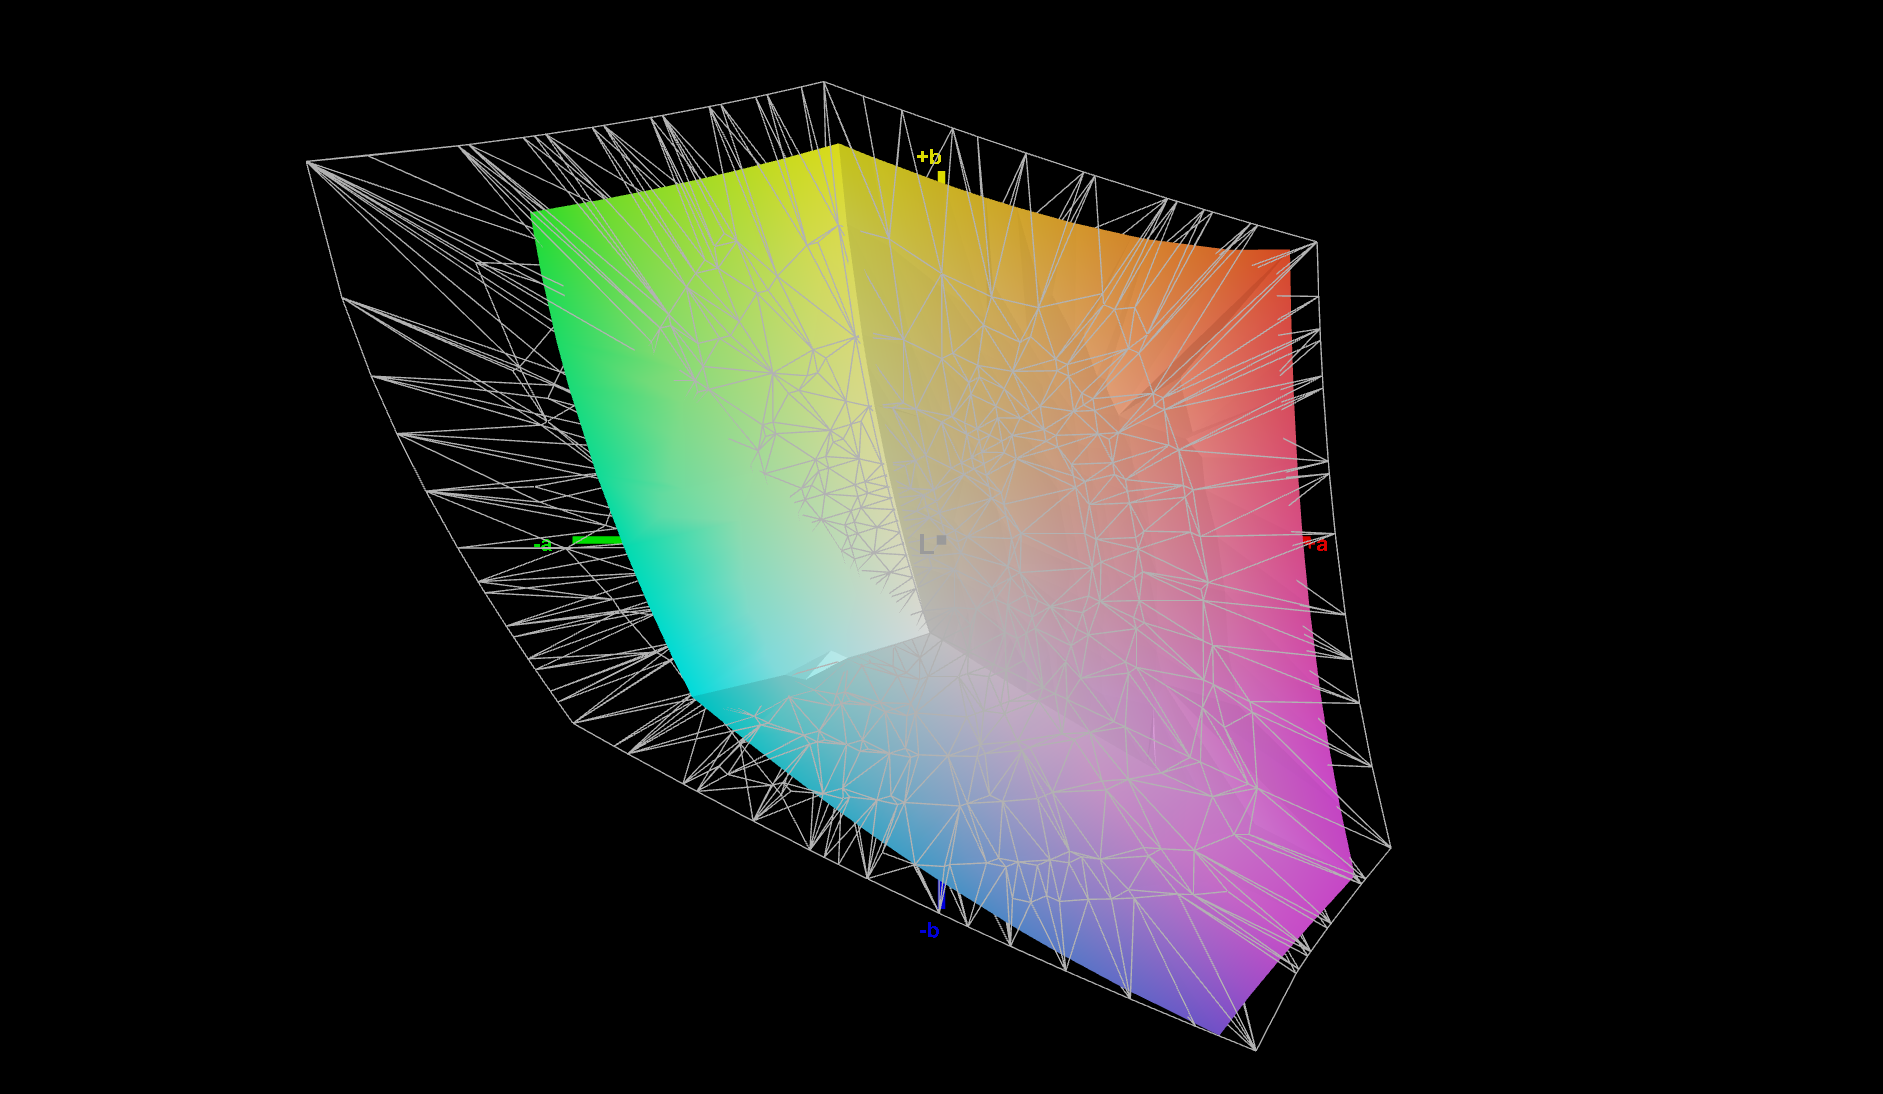
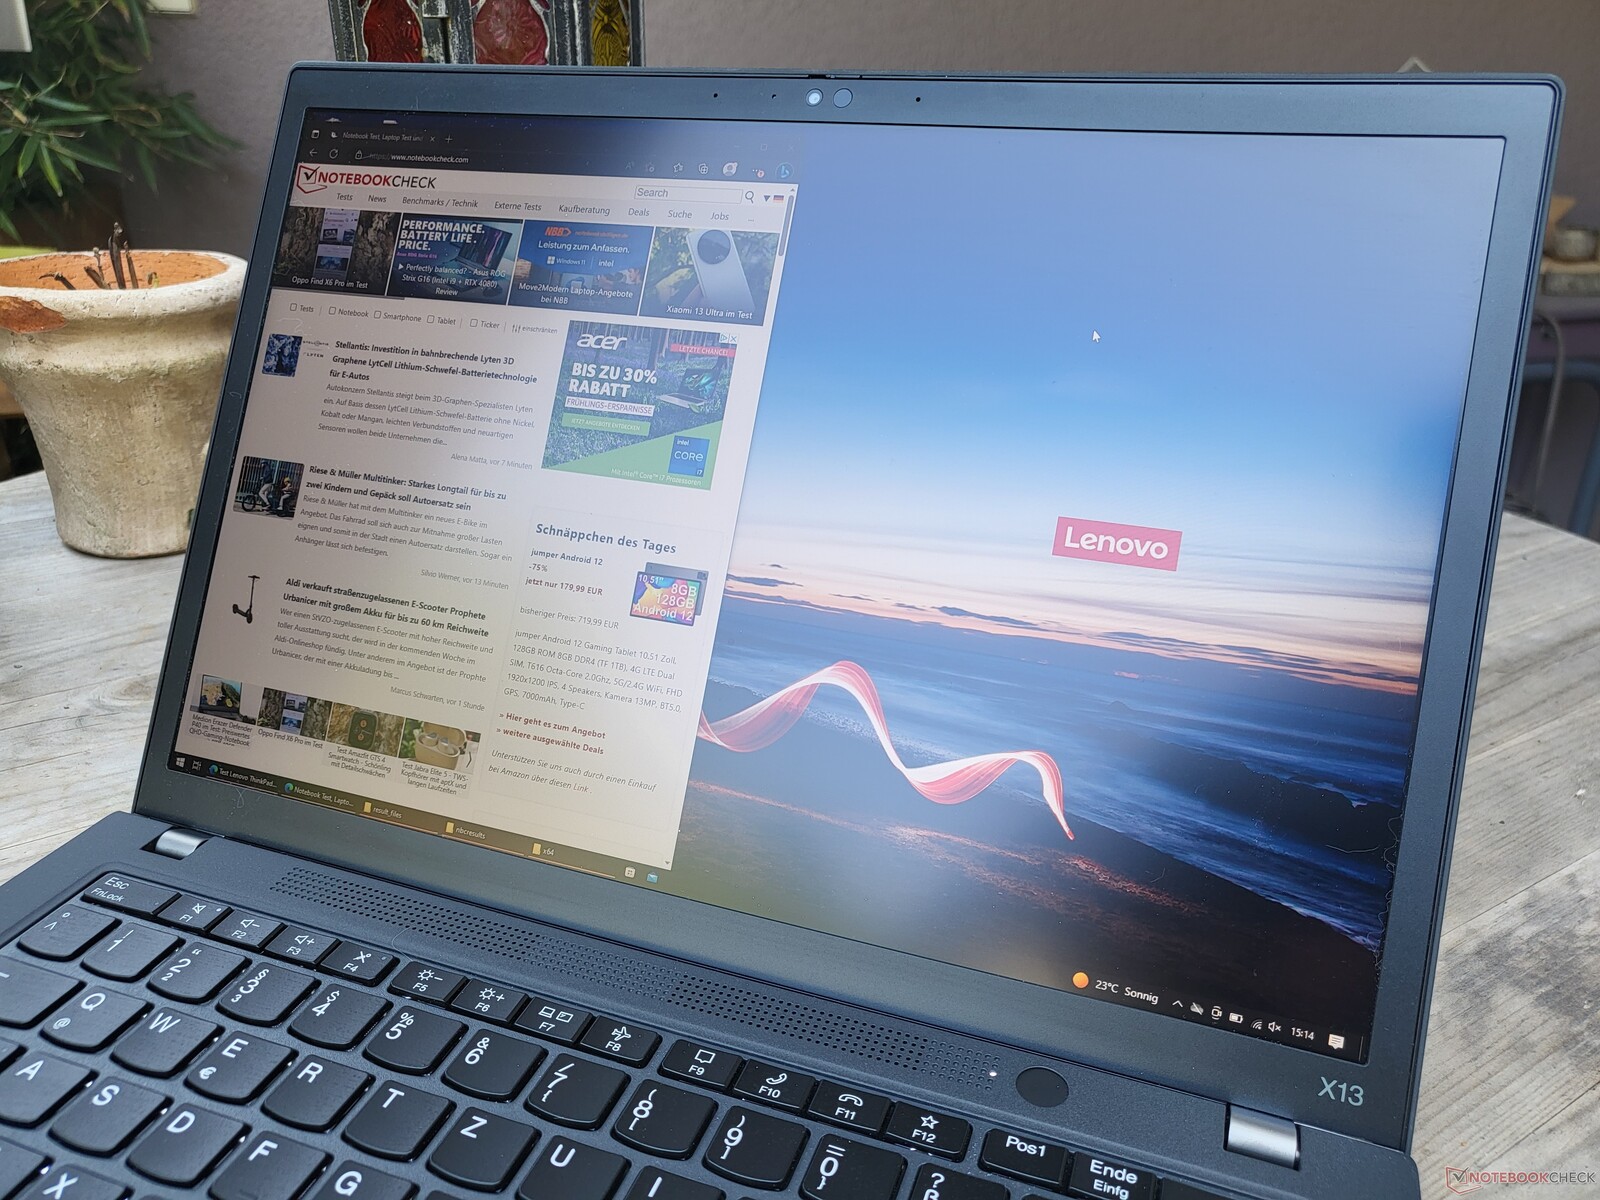
在户外,ThinkPad X13 Gen 3是可用的,这要归功于哑光的屏幕表面。和以前一样:我们希望有一个更明亮的屏幕,特别是对于这种移动设备级别的笔记本电脑。
Display Response Times
| ↔ Response Time Black to White | ||
|---|---|---|
| 28.1 ms ... rise ↗ and fall ↘ combined | ↗ 14.2 ms rise | 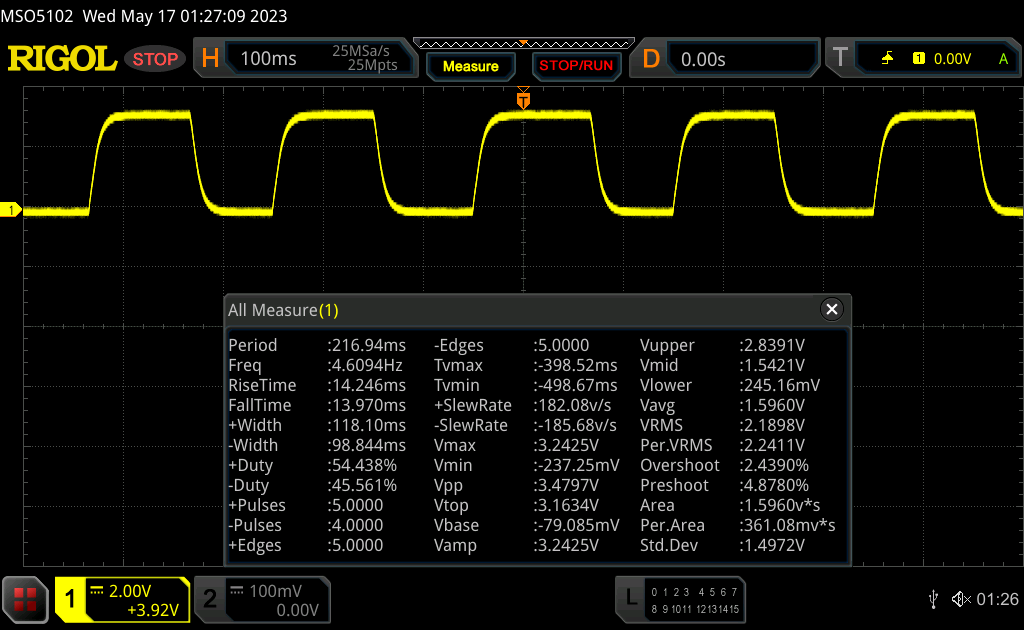 |
| ↘ 13.9 ms fall | ||
| The screen shows relatively slow response rates in our tests and may be too slow for gamers. In comparison, all tested devices range from 0.1 (minimum) to 240 (maximum) ms. » 75 % of all devices are better. This means that the measured response time is worse than the average of all tested devices (19.8 ms). | ||
| ↔ Response Time 50% Grey to 80% Grey | ||
| 44.2 ms ... rise ↗ and fall ↘ combined | ↗ 20.7 ms rise | 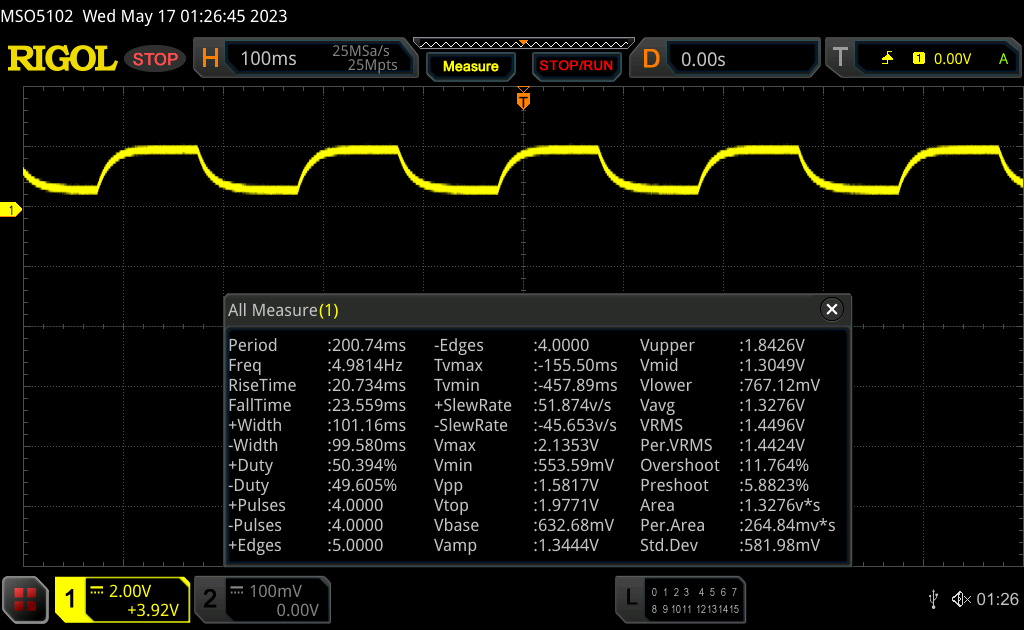 |
| ↘ 23.5 ms fall | ||
| The screen shows slow response rates in our tests and will be unsatisfactory for gamers. In comparison, all tested devices range from 0.165 (minimum) to 636 (maximum) ms. » 76 % of all devices are better. This means that the measured response time is worse than the average of all tested devices (31 ms). | ||
Screen Flickering / PWM (Pulse-Width Modulation)
| Screen flickering / PWM not detected | 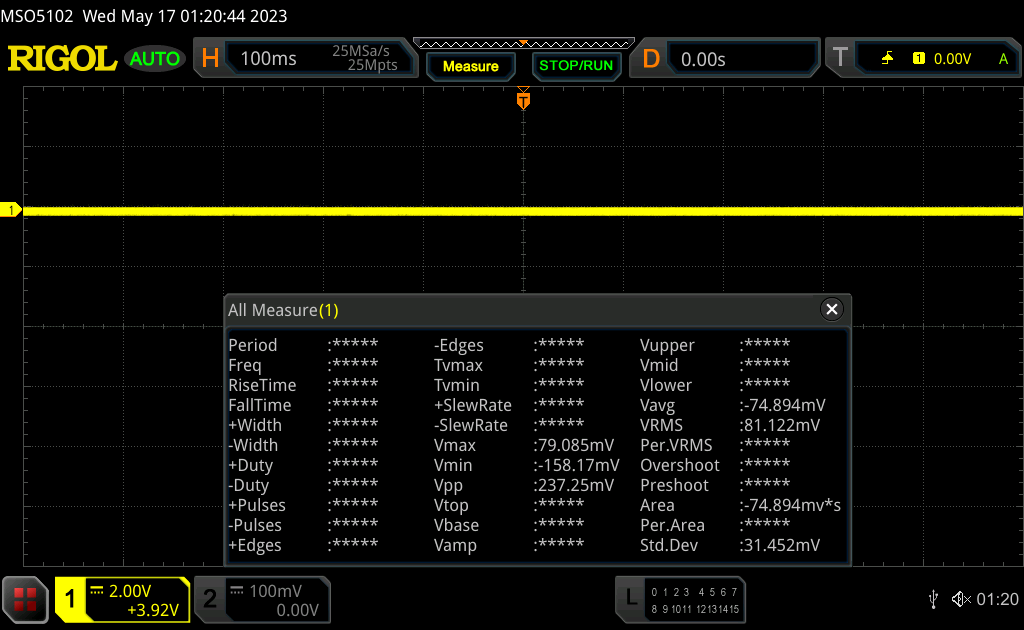 | ||
In comparison: 52 % of all tested devices do not use PWM to dim the display. If PWM was detected, an average of 7757 (minimum: 5 - maximum: 343500) Hz was measured. | |||
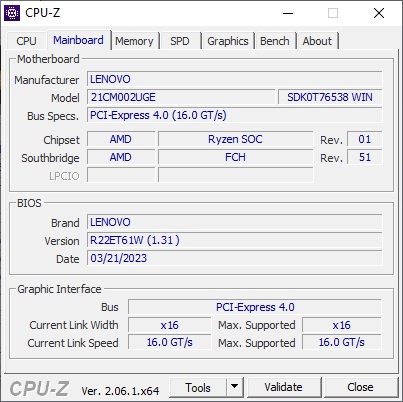
性能:AMD Ryzen 5提供良好的性能
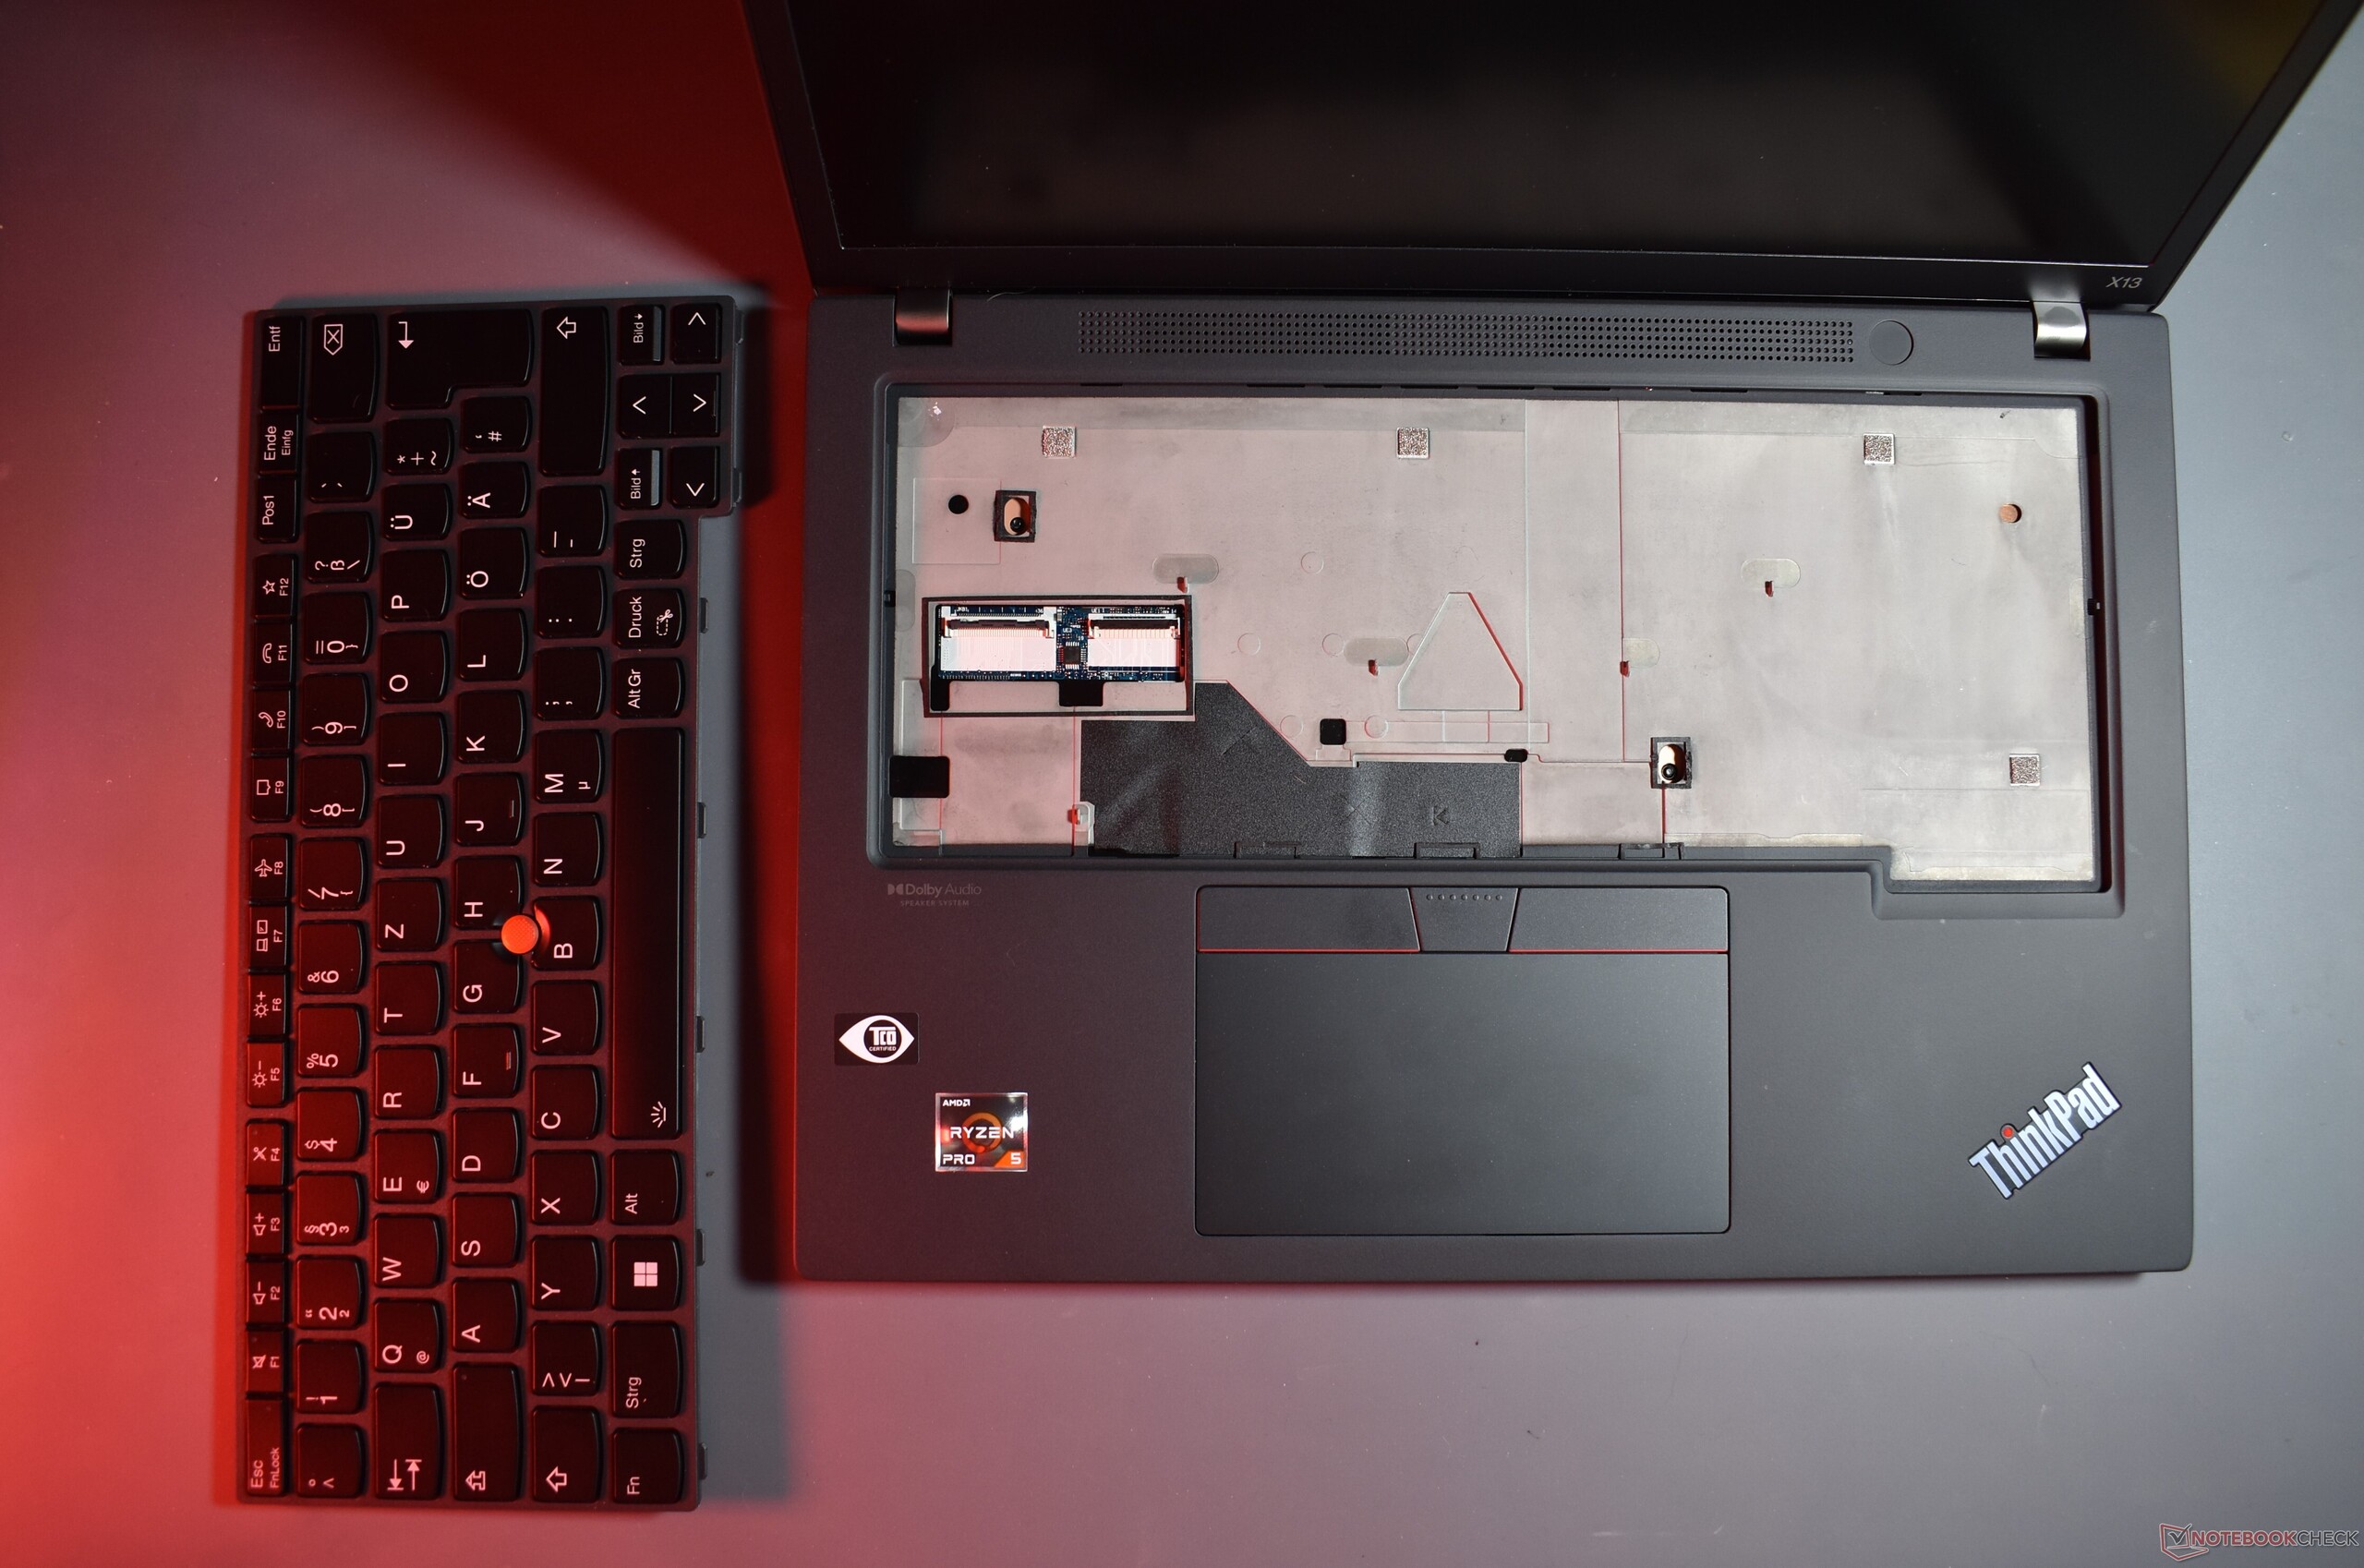
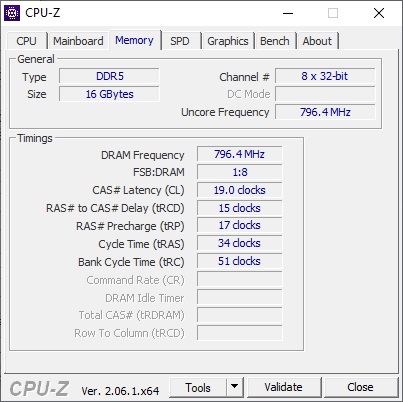
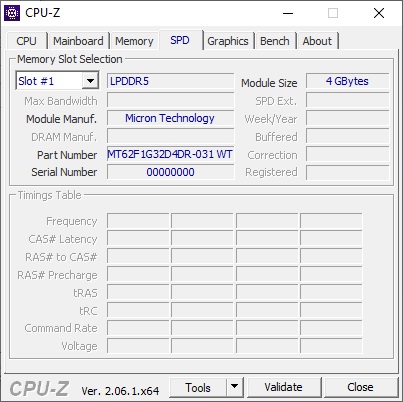
联想在销售ThinkPad X13第三代AMD时,有两种不同的AMD CPU,可供选择的是 AMD Ryzen 5 Pro 6650U和 Ryzen 7 Pro 6850U.根据所选择的CPU,无论是 Radeon 660M或 Radeon 680M作为GPU解决方案。内存总是焊接的,有8、16或32GB LPDDR5-6400内存的变体。没有焊接的是M.2 2280固态硬盘,联想提供最大2TB的固态硬盘存储。
测试条件
和联想ThinkPads的惯例一样,没有专有的OEM软件来管理电源配置文件。相反,利用Windows能源配置文件来管理功率限制(PL1=持续负载下的性能,PL2=短期提升性能)。
- 更多的电池效率:PL1 12 W / PL2 12 W
- 更好的性能:PL1 17 W / PL2 25 W
- 最佳性能:PL1 22,5 W / PL2 30 W
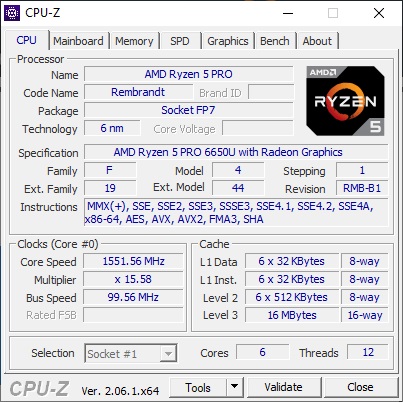
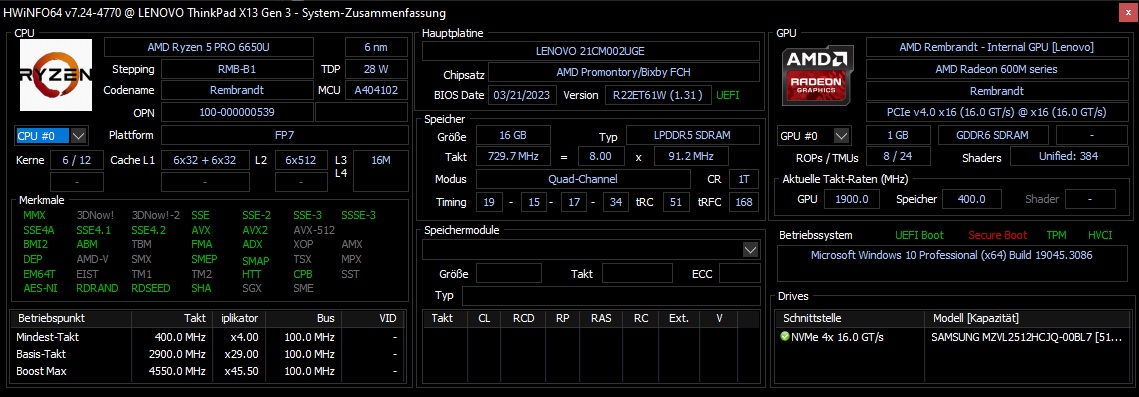
处理器
淘宝网AMD Ryzen 5 Pro 6650U是Rembrandt一代的U型处理器,旨在为紧凑型商务笔记本电脑服务。作为一个 "专业 "CPU,该芯片直接与英特尔的vPro处理器竞争。典型的TDP额定值为15W,该CPU有六个核心和十二个线程。与其他CPU进行全面的基准比较,可以使用我们的 CPU比较工具.
ThinkPad X13第三代AMD的性能比上一代略好。基于英特尔的型号 ThinkPad X13 G3 Intel和戴尔Latitude 7330提供了更好的单核性能和部分更好的提升性能,但在持续的多核测试中,它们就显得很苍白。同时, 惠普EliteBook 835 G9提供了巨大的动力飞跃,但该机型配备的是八核芯片AMD Ryzen 7 Pro 6850U,这也是X13第三代AMD的产品。
在电池模式下,CPU性能不会被扼杀。
Cinebench R15 Multi sustained load
Cinebench R23: Multi Core | Single Core
Cinebench R20: CPU (Multi Core) | CPU (Single Core)
Cinebench R15: CPU Multi 64Bit | CPU Single 64Bit
Blender: v2.79 BMW27 CPU
7-Zip 18.03: 7z b 4 | 7z b 4 -mmt1
Geekbench 5.5: Multi-Core | Single-Core
HWBOT x265 Benchmark v2.2: 4k Preset
LibreOffice : 20 Documents To PDF
R Benchmark 2.5: Overall mean
| CPU Performance rating | |
| Average of class Subnotebook | |
| HP EliteBook 835 G9 | |
| Dell Latitude 13 7330 | |
| Average AMD Ryzen 5 PRO 6650U | |
| Lenovo ThinkPad X13 G3 21BN0046GE | |
| Lenovo ThinkPad X13 G3 21CM002UGE | |
| Lenovo ThinkPad X13 G2 AMD 20XH001KGE | |
| Cinebench R23 / Multi Core | |
| Average of class Subnotebook (1555 - 21812, n=60, last 2 years) | |
| HP EliteBook 835 G9 | |
| Average AMD Ryzen 5 PRO 6650U (7805 - 9534, n=4) | |
| Dell Latitude 13 7330 | |
| Lenovo ThinkPad X13 G3 21CM002UGE | |
| Lenovo ThinkPad X13 G2 AMD 20XH001KGE | |
| Lenovo ThinkPad X13 G3 21BN0046GE | |
| Cinebench R23 / Single Core | |
| Average of class Subnotebook (358 - 2213, n=61, last 2 years) | |
| Dell Latitude 13 7330 | |
| Lenovo ThinkPad X13 G3 21BN0046GE | |
| HP EliteBook 835 G9 | |
| Average AMD Ryzen 5 PRO 6650U (1439 - 1476, n=4) | |
| Lenovo ThinkPad X13 G3 21CM002UGE | |
| Lenovo ThinkPad X13 G2 AMD 20XH001KGE | |
| Cinebench R20 / CPU (Multi Core) | |
| Average of class Subnotebook (579 - 8541, n=57, last 2 years) | |
| HP EliteBook 835 G9 | |
| Lenovo ThinkPad X13 G3 21BN0046GE | |
| Average AMD Ryzen 5 PRO 6650U (3057 - 3684, n=4) | |
| Dell Latitude 13 7330 | |
| Lenovo ThinkPad X13 G3 21CM002UGE | |
| Lenovo ThinkPad X13 G2 AMD 20XH001KGE | |
| Cinebench R20 / CPU (Single Core) | |
| Average of class Subnotebook (128 - 832, n=57, last 2 years) | |
| Dell Latitude 13 7330 | |
| Lenovo ThinkPad X13 G3 21BN0046GE | |
| HP EliteBook 835 G9 | |
| Average AMD Ryzen 5 PRO 6650U (548 - 578, n=4) | |
| Lenovo ThinkPad X13 G3 21CM002UGE | |
| Lenovo ThinkPad X13 G2 AMD 20XH001KGE | |
| Cinebench R15 / CPU Multi 64Bit | |
| Average of class Subnotebook (327 - 3345, n=57, last 2 years) | |
| HP EliteBook 835 G9 | |
| Average AMD Ryzen 5 PRO 6650U (1299 - 1555, n=4) | |
| Dell Latitude 13 7330 | |
| Lenovo ThinkPad X13 G3 21CM002UGE | |
| Lenovo ThinkPad X13 G2 AMD 20XH001KGE | |
| Lenovo ThinkPad X13 G3 21BN0046GE | |
| Cinebench R15 / CPU Single 64Bit | |
| Average of class Subnotebook (72.4 - 322, n=57, last 2 years) | |
| Dell Latitude 13 7330 | |
| Average AMD Ryzen 5 PRO 6650U (230 - 234, n=4) | |
| Lenovo ThinkPad X13 G3 21CM002UGE | |
| HP EliteBook 835 G9 | |
| Lenovo ThinkPad X13 G2 AMD 20XH001KGE | |
| Lenovo ThinkPad X13 G3 21BN0046GE | |
| Blender / v2.79 BMW27 CPU | |
| Lenovo ThinkPad X13 G3 21CM002UGE | |
| Lenovo ThinkPad X13 G3 21CM002UGE | |
| Lenovo ThinkPad X13 G3 21BN0046GE | |
| Lenovo ThinkPad X13 G2 AMD 20XH001KGE | |
| Average AMD Ryzen 5 PRO 6650U (328 - 548, n=5) | |
| Dell Latitude 13 7330 | |
| Average of class Subnotebook (159 - 2271, n=58, last 2 years) | |
| HP EliteBook 835 G9 | |
| 7-Zip 18.03 / 7z b 4 | |
| HP EliteBook 835 G9 | |
| Average of class Subnotebook (11668 - 77867, n=57, last 2 years) | |
| Lenovo ThinkPad X13 G3 21BN0046GE | |
| Lenovo ThinkPad X13 G3 21CM002UGE | |
| Average AMD Ryzen 5 PRO 6650U (32613 - 41530, n=4) | |
| Lenovo ThinkPad X13 G2 AMD 20XH001KGE | |
| Dell Latitude 13 7330 | |
| 7-Zip 18.03 / 7z b 4 -mmt1 | |
| Dell Latitude 13 7330 | |
| Average of class Subnotebook (2643 - 6699, n=59, last 2 years) | |
| HP EliteBook 835 G9 | |
| Average AMD Ryzen 5 PRO 6650U (5175 - 5427, n=4) | |
| Lenovo ThinkPad X13 G3 21BN0046GE | |
| Lenovo ThinkPad X13 G3 21CM002UGE | |
| Lenovo ThinkPad X13 G2 AMD 20XH001KGE | |
| Geekbench 5.5 / Multi-Core | |
| Average of class Subnotebook (2557 - 17218, n=48, last 2 years) | |
| Lenovo ThinkPad X13 G3 21BN0046GE | |
| HP EliteBook 835 G9 | |
| Dell Latitude 13 7330 | |
| Average AMD Ryzen 5 PRO 6650U (6171 - 7227, n=4) | |
| Lenovo ThinkPad X13 G3 21CM002UGE | |
| Lenovo ThinkPad X13 G2 AMD 20XH001KGE | |
| Geekbench 5.5 / Single-Core | |
| Average of class Subnotebook (726 - 2224, n=48, last 2 years) | |
| Dell Latitude 13 7330 | |
| HP EliteBook 835 G9 | |
| Lenovo ThinkPad X13 G3 21BN0046GE | |
| Average AMD Ryzen 5 PRO 6650U (1433 - 1487, n=4) | |
| Lenovo ThinkPad X13 G3 21CM002UGE | |
| Lenovo ThinkPad X13 G2 AMD 20XH001KGE | |
| HWBOT x265 Benchmark v2.2 / 4k Preset | |
| Average of class Subnotebook (0.97 - 25.1, n=57, last 2 years) | |
| HP EliteBook 835 G9 | |
| Average AMD Ryzen 5 PRO 6650U (8.71 - 11.8, n=4) | |
| Lenovo ThinkPad X13 G3 21CM002UGE | |
| Dell Latitude 13 7330 | |
| Lenovo ThinkPad X13 G2 AMD 20XH001KGE | |
| Lenovo ThinkPad X13 G3 21BN0046GE | |
| LibreOffice / 20 Documents To PDF | |
| Lenovo ThinkPad X13 G3 21CM002UGE | |
| Average AMD Ryzen 5 PRO 6650U (50.3 - 63.2, n=4) | |
| HP EliteBook 835 G9 | |
| Average of class Subnotebook (39.9 - 220, n=56, last 2 years) | |
| Lenovo ThinkPad X13 G2 AMD 20XH001KGE | |
| Dell Latitude 13 7330 | |
| Lenovo ThinkPad X13 G3 21BN0046GE | |
| R Benchmark 2.5 / Overall mean | |
| Lenovo ThinkPad X13 G3 21CM002UGE | |
| Lenovo ThinkPad X13 G2 AMD 20XH001KGE | |
| Average AMD Ryzen 5 PRO 6650U (0.521 - 0.59, n=4) | |
| Average of class Subnotebook (0.4024 - 1.456, n=58, last 2 years) | |
| Lenovo ThinkPad X13 G3 21BN0046GE | |
| HP EliteBook 835 G9 | |
| Dell Latitude 13 7330 | |
* ... smaller is better
AIDA64: FP32 Ray-Trace | FPU Julia | CPU SHA3 | CPU Queen | FPU SinJulia | FPU Mandel | CPU AES | CPU ZLib | FP64 Ray-Trace | CPU PhotoWorxx
| Performance rating | |
| Average of class Subnotebook | |
| HP EliteBook 835 G9 | |
| Average AMD Ryzen 5 PRO 6650U | |
| Lenovo ThinkPad X13 G2 AMD 20XH001KGE | |
| Lenovo ThinkPad X13 G3 21CM002UGE | |
| Lenovo ThinkPad X13 G3 21BN0046GE | |
| Dell Latitude 13 7330 | |
| AIDA64 / FP32 Ray-Trace | |
| Average of class Subnotebook (1135 - 32888, n=58, last 2 years) | |
| HP EliteBook 835 G9 | |
| Average AMD Ryzen 5 PRO 6650U (8854 - 10630, n=4) | |
| Lenovo ThinkPad X13 G3 21CM002UGE | |
| Lenovo ThinkPad X13 G2 AMD 20XH001KGE | |
| Lenovo ThinkPad X13 G3 21BN0046GE | |
| Dell Latitude 13 7330 | |
| AIDA64 / FPU Julia | |
| HP EliteBook 835 G9 | |
| Average of class Subnotebook (5218 - 123315, n=58, last 2 years) | |
| Average AMD Ryzen 5 PRO 6650U (56214 - 68106, n=4) | |
| Lenovo ThinkPad X13 G3 21CM002UGE | |
| Lenovo ThinkPad X13 G2 AMD 20XH001KGE | |
| Lenovo ThinkPad X13 G3 21BN0046GE | |
| Dell Latitude 13 7330 | |
| AIDA64 / CPU SHA3 | |
| Average of class Subnotebook (444 - 5287, n=58, last 2 years) | |
| HP EliteBook 835 G9 | |
| Average AMD Ryzen 5 PRO 6650U (1881 - 2326, n=4) | |
| Lenovo ThinkPad X13 G3 21BN0046GE | |
| Dell Latitude 13 7330 | |
| Lenovo ThinkPad X13 G3 21CM002UGE | |
| Lenovo ThinkPad X13 G2 AMD 20XH001KGE | |
| AIDA64 / CPU Queen | |
| HP EliteBook 835 G9 | |
| Average AMD Ryzen 5 PRO 6650U (69023 - 78797, n=4) | |
| Lenovo ThinkPad X13 G3 21CM002UGE | |
| Lenovo ThinkPad X13 G2 AMD 20XH001KGE | |
| Dell Latitude 13 7330 | |
| Lenovo ThinkPad X13 G3 21BN0046GE | |
| Average of class Subnotebook (10579 - 95002, n=49, last 2 years) | |
| AIDA64 / FPU SinJulia | |
| HP EliteBook 835 G9 | |
| Average AMD Ryzen 5 PRO 6650U (8320 - 9488, n=4) | |
| Lenovo ThinkPad X13 G3 21CM002UGE | |
| Lenovo ThinkPad X13 G2 AMD 20XH001KGE | |
| Average of class Subnotebook (744 - 18418, n=58, last 2 years) | |
| Lenovo ThinkPad X13 G3 21BN0046GE | |
| Dell Latitude 13 7330 | |
| AIDA64 / FPU Mandel | |
| HP EliteBook 835 G9 | |
| Average AMD Ryzen 5 PRO 6650U (30969 - 37461, n=4) | |
| Average of class Subnotebook (3341 - 65433, n=58, last 2 years) | |
| Lenovo ThinkPad X13 G3 21CM002UGE | |
| Lenovo ThinkPad X13 G2 AMD 20XH001KGE | |
| Lenovo ThinkPad X13 G3 21BN0046GE | |
| Dell Latitude 13 7330 | |
| AIDA64 / CPU AES | |
| Lenovo ThinkPad X13 G2 AMD 20XH001KGE | |
| Average AMD Ryzen 5 PRO 6650U (37259 - 93914, n=4) | |
| Average of class Subnotebook (638 - 96917, n=58, last 2 years) | |
| HP EliteBook 835 G9 | |
| Lenovo ThinkPad X13 G3 21BN0046GE | |
| Dell Latitude 13 7330 | |
| Lenovo ThinkPad X13 G3 21CM002UGE | |
| AIDA64 / CPU ZLib | |
| Average of class Subnotebook (164.9 - 1379, n=58, last 2 years) | |
| HP EliteBook 835 G9 | |
| Lenovo ThinkPad X13 G3 21BN0046GE | |
| Dell Latitude 13 7330 | |
| Average AMD Ryzen 5 PRO 6650U (504 - 602, n=4) | |
| Lenovo ThinkPad X13 G3 21CM002UGE | |
| Lenovo ThinkPad X13 G2 AMD 20XH001KGE | |
| AIDA64 / FP64 Ray-Trace | |
| Average of class Subnotebook (610 - 17495, n=58, last 2 years) | |
| HP EliteBook 835 G9 | |
| Average AMD Ryzen 5 PRO 6650U (4620 - 5468, n=4) | |
| Lenovo ThinkPad X13 G3 21CM002UGE | |
| Lenovo ThinkPad X13 G2 AMD 20XH001KGE | |
| Lenovo ThinkPad X13 G3 21BN0046GE | |
| Dell Latitude 13 7330 | |
| AIDA64 / CPU PhotoWorxx | |
| Average of class Subnotebook (6569 - 85600, n=58, last 2 years) | |
| Lenovo ThinkPad X13 G3 21BN0046GE | |
| HP EliteBook 835 G9 | |
| Lenovo ThinkPad X13 G3 21CM002UGE | |
| Average AMD Ryzen 5 PRO 6650U (19643 - 26137, n=4) | |
| Dell Latitude 13 7330 | |
| Lenovo ThinkPad X13 G2 AMD 20XH001KGE | |
系统性能
说到系统性能,AMD的型号比他们的英特尔变种要好。在日常使用中,其性能是完全良好的。
CrossMark: Overall | Productivity | Creativity | Responsiveness
| PCMark 10 / Score | |
| Average of class Subnotebook (4920 - 9939, n=45, last 2 years) | |
| HP EliteBook 835 G9 | |
| Lenovo ThinkPad X13 G2 AMD 20XH001KGE | |
| Average AMD Ryzen 5 PRO 6650U, AMD Radeon 660M (5513 - 5958, n=4) | |
| Lenovo ThinkPad X13 G3 21CM002UGE | |
| Dell Latitude 13 7330 | |
| Lenovo ThinkPad X13 G3 21BN0046GE | |
| PCMark 10 / Essentials | |
| Dell Latitude 13 7330 | |
| Average of class Subnotebook (8552 - 11646, n=45, last 2 years) | |
| Lenovo ThinkPad X13 G2 AMD 20XH001KGE | |
| HP EliteBook 835 G9 | |
| Lenovo ThinkPad X13 G3 21CM002UGE | |
| Average AMD Ryzen 5 PRO 6650U, AMD Radeon 660M (9578 - 9982, n=4) | |
| Lenovo ThinkPad X13 G3 21BN0046GE | |
| PCMark 10 / Productivity | |
| Average of class Subnotebook (5435 - 16606, n=45, last 2 years) | |
| Lenovo ThinkPad X13 G2 AMD 20XH001KGE | |
| HP EliteBook 835 G9 | |
| Average AMD Ryzen 5 PRO 6650U, AMD Radeon 660M (7848 - 9094, n=4) | |
| Lenovo ThinkPad X13 G3 21CM002UGE | |
| Dell Latitude 13 7330 | |
| Lenovo ThinkPad X13 G3 21BN0046GE | |
| PCMark 10 / Digital Content Creation | |
| Average of class Subnotebook (5722 - 13779, n=45, last 2 years) | |
| HP EliteBook 835 G9 | |
| Average AMD Ryzen 5 PRO 6650U, AMD Radeon 660M (5837 - 6447, n=4) | |
| Lenovo ThinkPad X13 G3 21CM002UGE | |
| Lenovo ThinkPad X13 G2 AMD 20XH001KGE | |
| Dell Latitude 13 7330 | |
| Lenovo ThinkPad X13 G3 21BN0046GE | |
| CrossMark / Overall | |
| Average of class Subnotebook (365 - 2356, n=60, last 2 years) | |
| Dell Latitude 13 7330 | |
| HP EliteBook 835 G9 | |
| Average AMD Ryzen 5 PRO 6650U, AMD Radeon 660M (1338 - 1432, n=3) | |
| Lenovo ThinkPad X13 G3 21BN0046GE | |
| Lenovo ThinkPad X13 G3 21CM002UGE | |
| CrossMark / Productivity | |
| Average of class Subnotebook (364 - 2277, n=60, last 2 years) | |
| Dell Latitude 13 7330 | |
| HP EliteBook 835 G9 | |
| Average AMD Ryzen 5 PRO 6650U, AMD Radeon 660M (1366 - 1440, n=3) | |
| Lenovo ThinkPad X13 G3 21CM002UGE | |
| Lenovo ThinkPad X13 G3 21BN0046GE | |
| CrossMark / Creativity | |
| Average of class Subnotebook (372 - 2743, n=60, last 2 years) | |
| Dell Latitude 13 7330 | |
| Lenovo ThinkPad X13 G3 21BN0046GE | |
| Average AMD Ryzen 5 PRO 6650U, AMD Radeon 660M (1397 - 1517, n=3) | |
| HP EliteBook 835 G9 | |
| Lenovo ThinkPad X13 G3 21CM002UGE | |
| CrossMark / Responsiveness | |
| Average of class Subnotebook (312 - 1854, n=60, last 2 years) | |
| Lenovo ThinkPad X13 G3 21BN0046GE | |
| Dell Latitude 13 7330 | |
| HP EliteBook 835 G9 | |
| Average AMD Ryzen 5 PRO 6650U, AMD Radeon 660M (1106 - 1229, n=3) | |
| Lenovo ThinkPad X13 G3 21CM002UGE | |
| PCMark 10 Score | 5685 points | |
Help | ||
| AIDA64 / Memory Copy | |
| Average of class Subnotebook (14554 - 131023, n=58, last 2 years) | |
| Lenovo ThinkPad X13 G3 21BN0046GE | |
| Lenovo ThinkPad X13 G3 21CM002UGE | |
| HP EliteBook 835 G9 | |
| Average AMD Ryzen 5 PRO 6650U (31014 - 48558, n=4) | |
| Dell Latitude 13 7330 | |
| Lenovo ThinkPad X13 G2 AMD 20XH001KGE | |
| AIDA64 / Memory Read | |
| Average of class Subnotebook (15948 - 127174, n=58, last 2 years) | |
| Lenovo ThinkPad X13 G3 21BN0046GE | |
| HP EliteBook 835 G9 | |
| Dell Latitude 13 7330 | |
| Lenovo ThinkPad X13 G3 21CM002UGE | |
| Average AMD Ryzen 5 PRO 6650U (34690 - 39833, n=4) | |
| Lenovo ThinkPad X13 G2 AMD 20XH001KGE | |
| AIDA64 / Memory Write | |
| Average of class Subnotebook (15709 - 135141, n=58, last 2 years) | |
| Lenovo ThinkPad X13 G3 21BN0046GE | |
| Lenovo ThinkPad X13 G3 21CM002UGE | |
| HP EliteBook 835 G9 | |
| Average AMD Ryzen 5 PRO 6650U (34563 - 51117, n=4) | |
| Dell Latitude 13 7330 | |
| Lenovo ThinkPad X13 G2 AMD 20XH001KGE | |
| AIDA64 / Memory Latency | |
| Lenovo ThinkPad X13 G3 21CM002UGE | |
| Average AMD Ryzen 5 PRO 6650U (91.6 - 126.5, n=4) | |
| Lenovo ThinkPad X13 G2 AMD 20XH001KGE | |
| HP EliteBook 835 G9 | |
| Average of class Subnotebook (6.1 - 159.9, n=56, last 2 years) | |
| Lenovo ThinkPad X13 G3 21BN0046GE | |
| Dell Latitude 13 7330 | |
* ... smaller is better
DPC延时
在测试的配置中,联想ThinkPad X13第三代AMD在DPC延迟问题上没有问题。
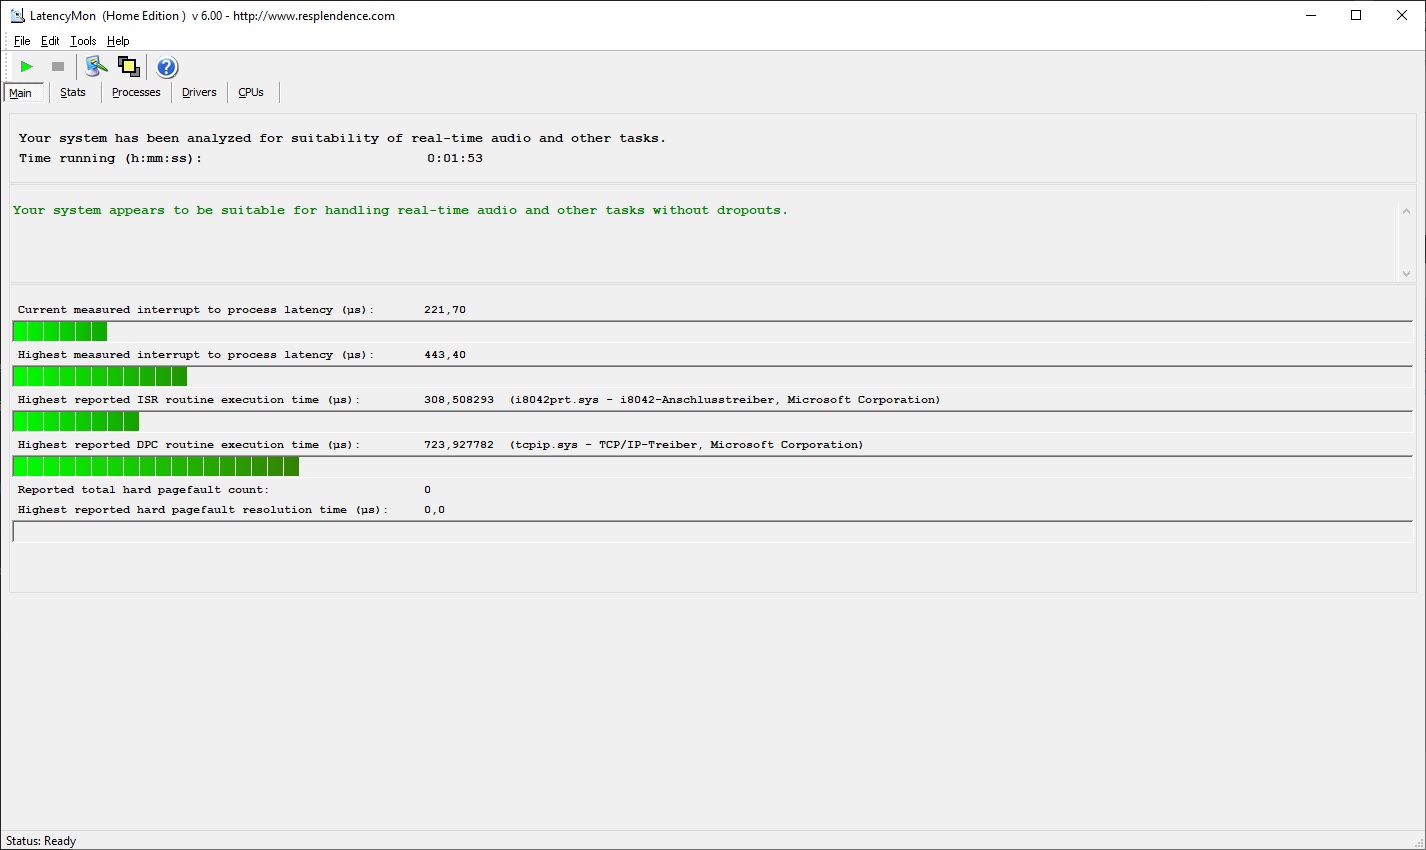
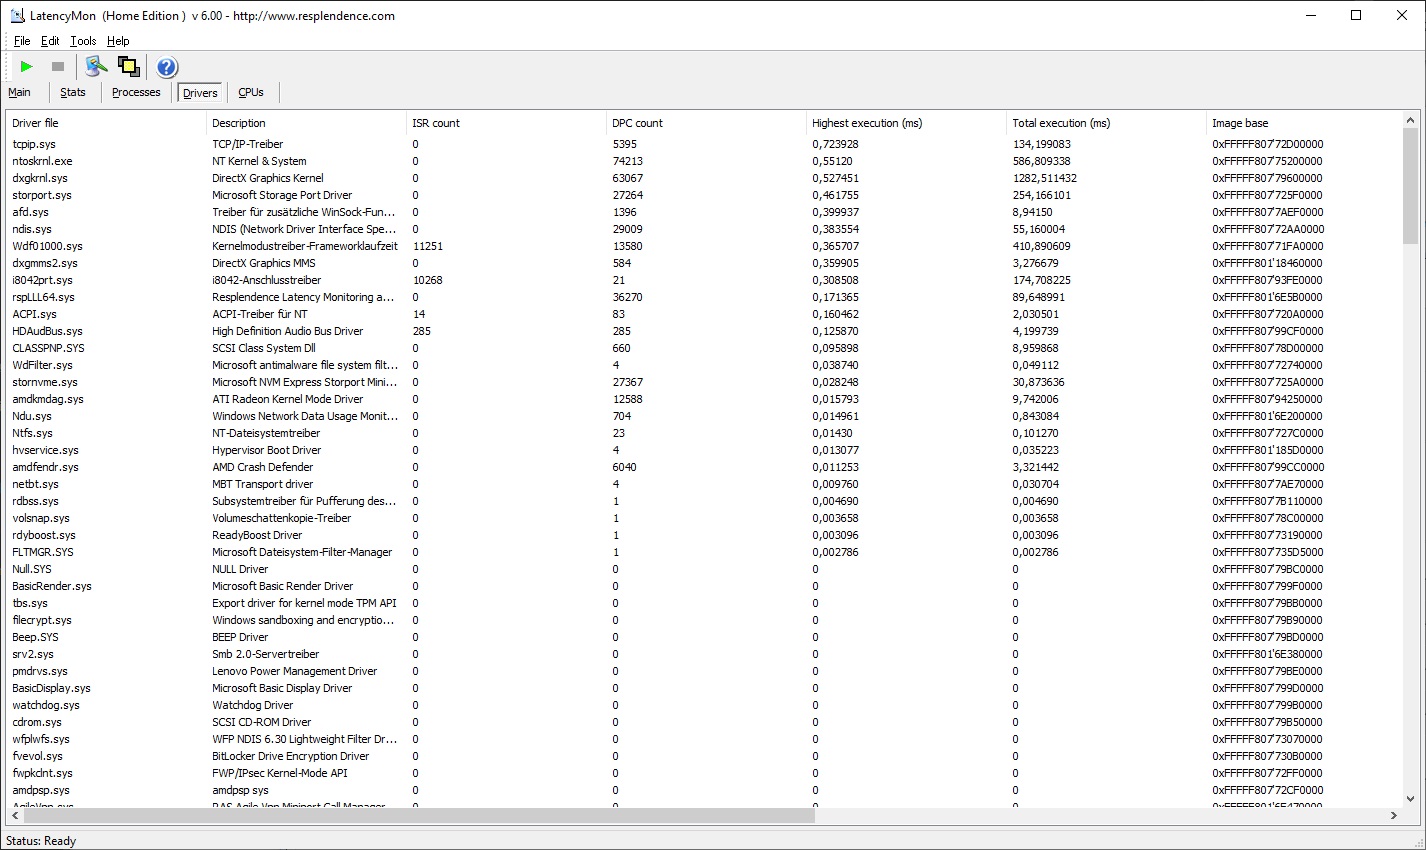
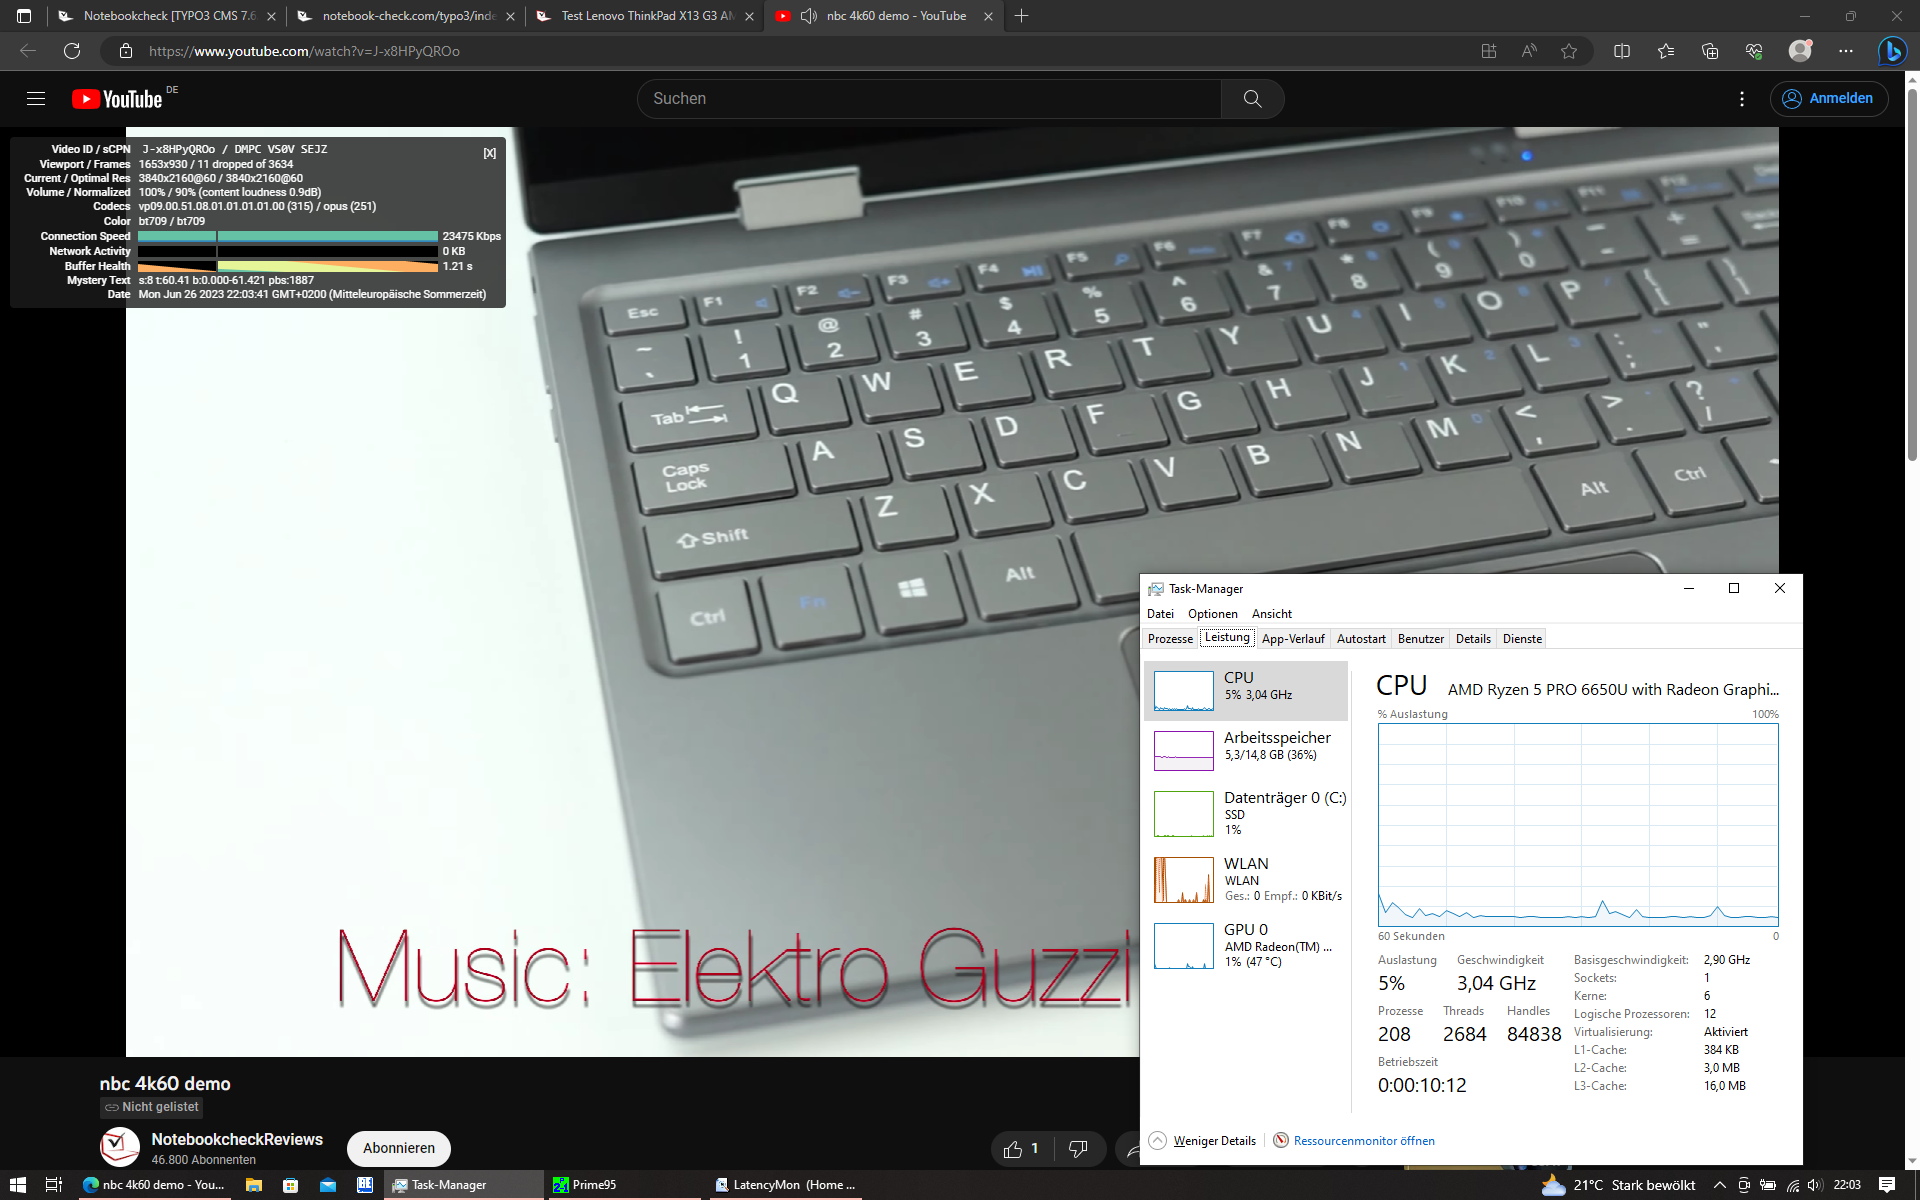
| DPC Latencies / LatencyMon - interrupt to process latency (max), Web, Youtube, Prime95 | |
| Lenovo ThinkPad X13 G2 AMD 20XH001KGE | |
| Lenovo ThinkPad X13 G3 21BN0046GE | |
| HP EliteBook 835 G9 | |
| Dell Latitude 13 7330 | |
| Lenovo ThinkPad X13 G3 21CM002UGE | |
* ... smaller is better
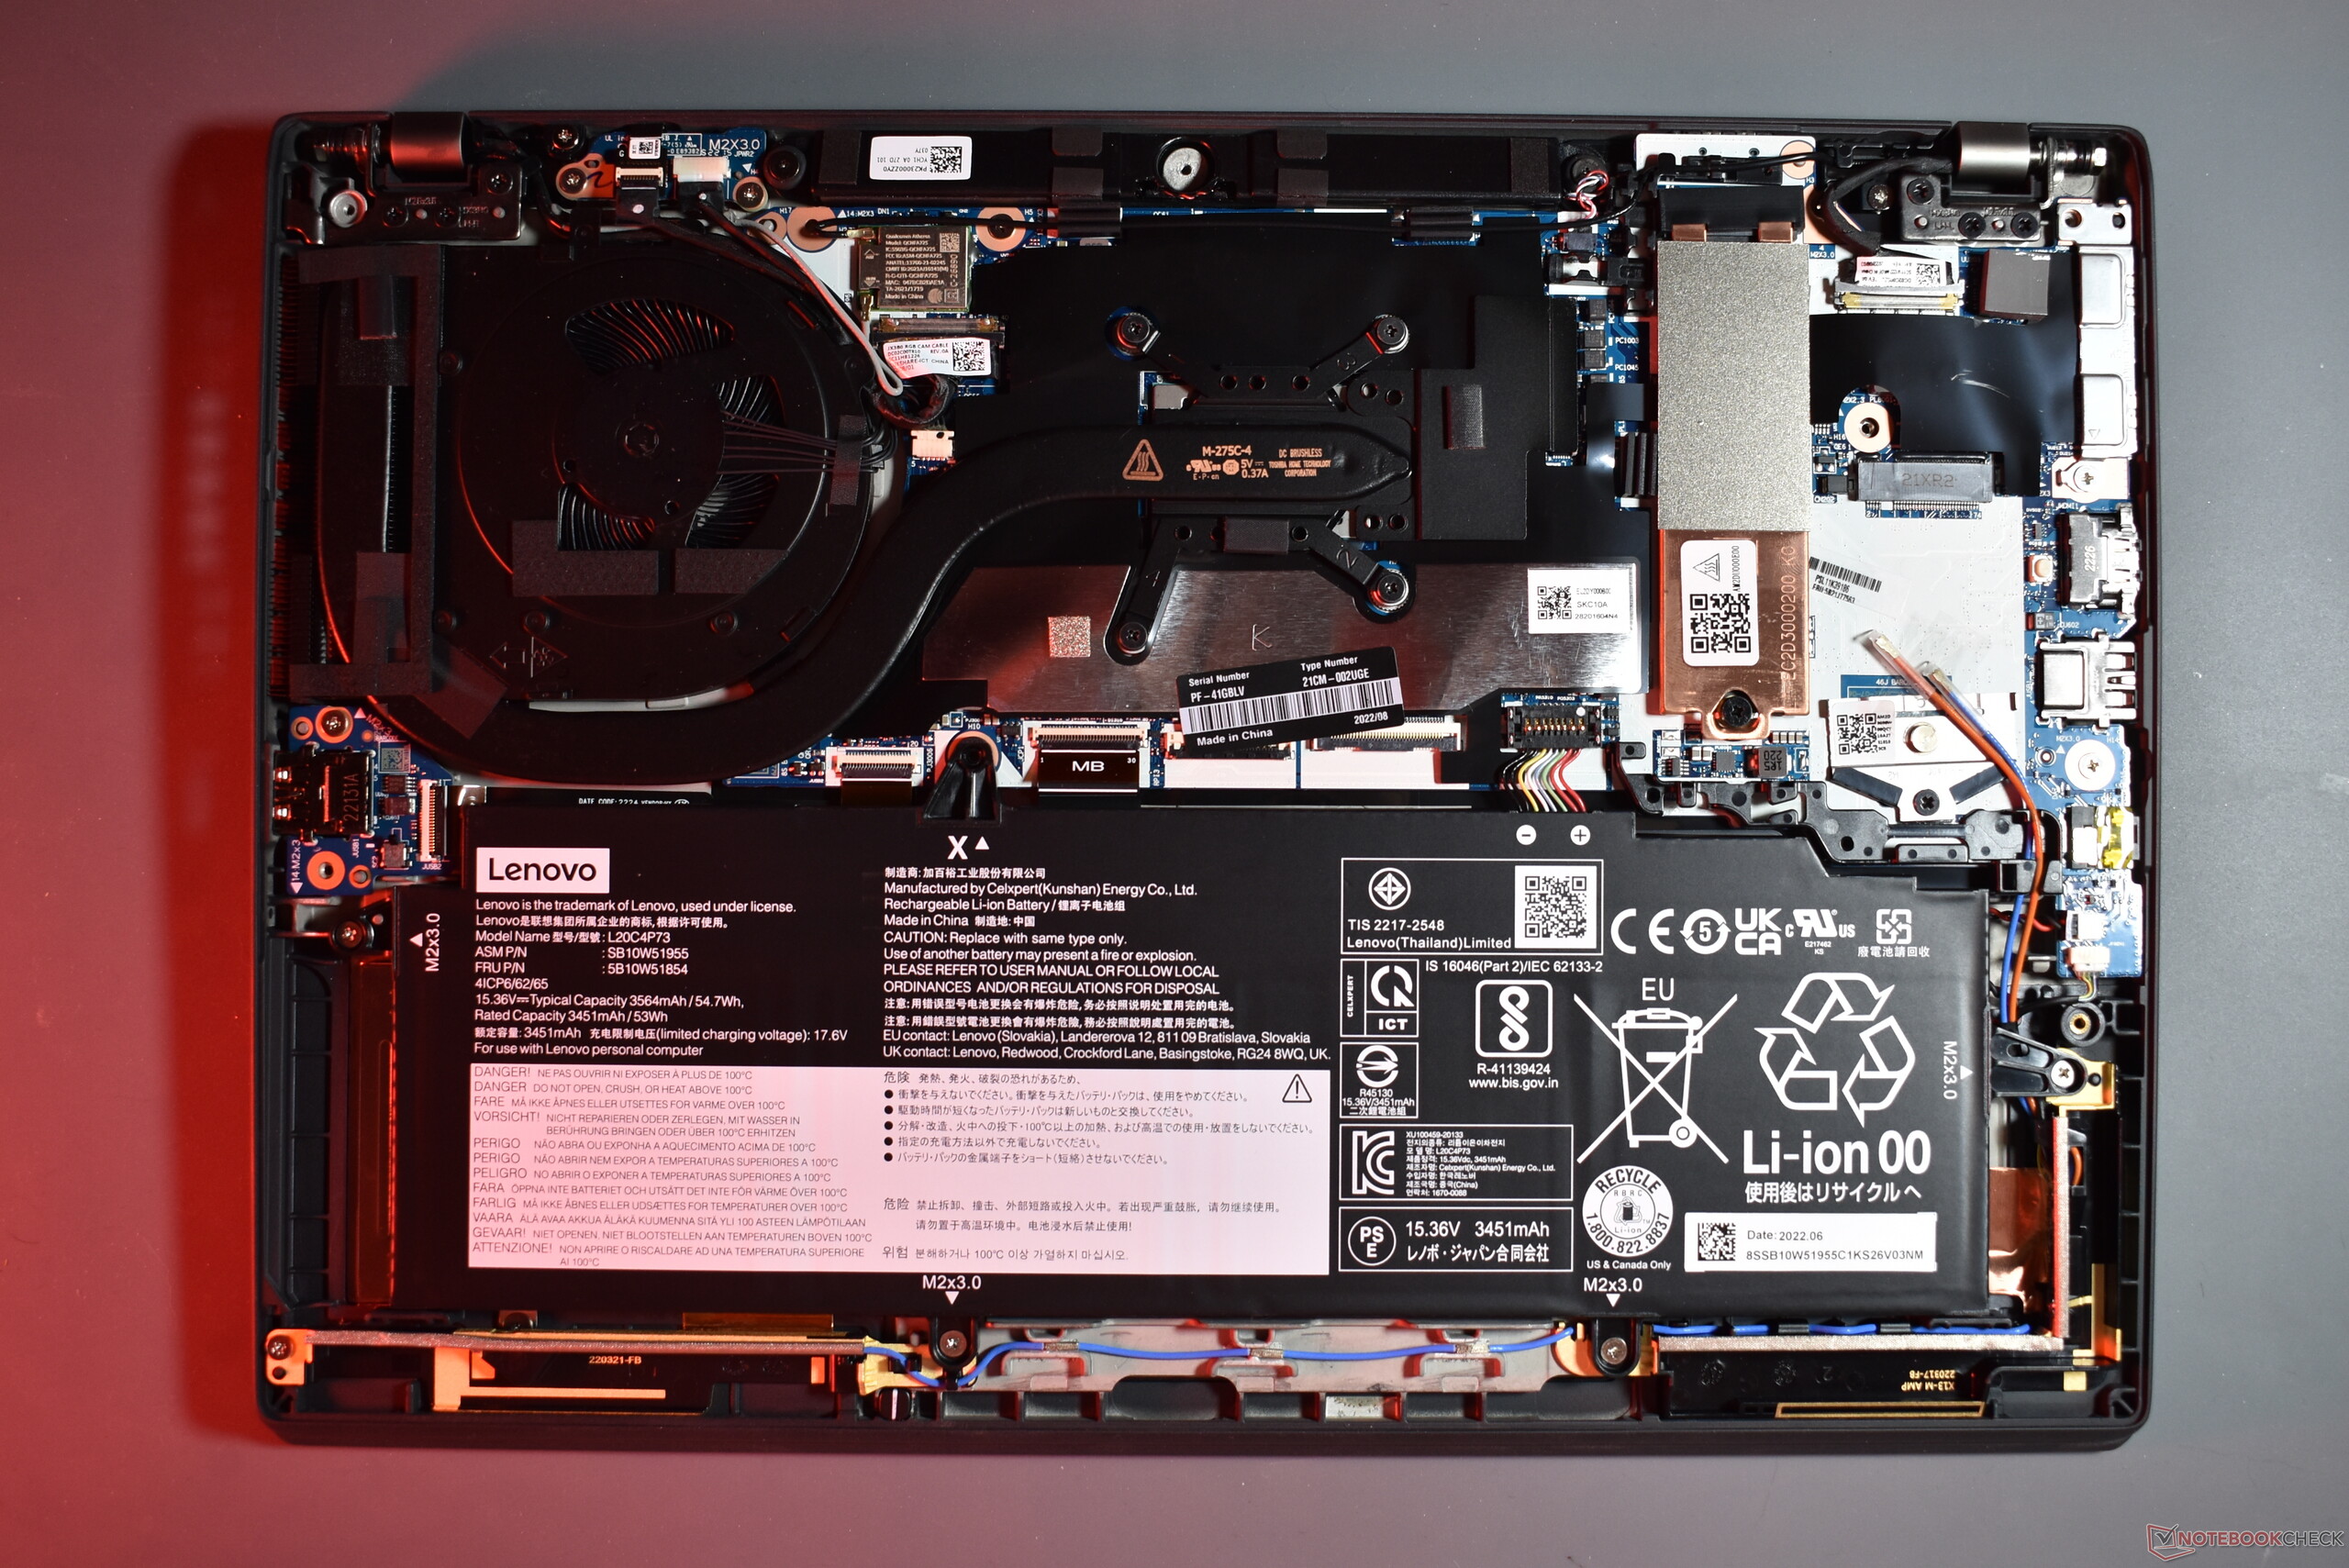
储存
联想ThinkPad X13 G3 AMD的M.2 2280 SSD来自三星。PM9A1的容量为512GB,通过NVMe PCIe 4.0标准连接。这款固态硬盘可能更快,但与对比设备中的固态硬盘相比,它在X13 G3中的运行速度仍然更快。

* ... smaller is better
Sustained load read: DiskSpd Read Loop, Queue Depth 8
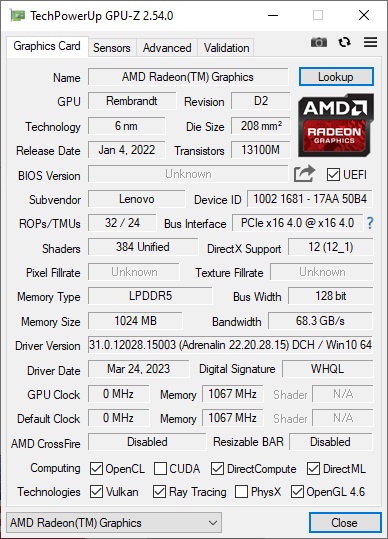
图形卡
的AMD Radeon 660M是Ryzen 5级的标准图形解决方案。作为一个集成GPU,Radeon 660M没有自己的内存,它必须依赖主系统内存。合理的结论是:GPU的性能取决于内存的速度,以及内存是以单通道还是双通道模式运行。
在ThinkPad X13 G3 AMD中,iGPU可以依赖快速的LPDDR5-6400内存,它以双通道模式运行。这些都是相当理想的条件,ThinkPad X13第三代远远领先于带有i5的英特尔型号和它自己的前辈。同样, HP EliteBook 835 G9拥有更强大的Radeon 680M的HP EliteBook 835 G9领先于ThinkPad。
这款商务笔记本不是为游戏而生的,不过最近的游戏还是可以玩的--在低端。
与CPU一样,GPU在电池模式下提供100%的性能。
| 3DMark 11 Performance | 7067 points | |
| 3DMark Cloud Gate Standard Score | 21798 points | |
| 3DMark Fire Strike Score | 4472 points | |
| 3DMark Time Spy Score | 1729 points | |
Help | ||
* ... smaller is better
| The Witcher 3 - 1920x1080 Ultra Graphics & Postprocessing (HBAO+) | |
| Average of class Subnotebook (13.9 - 34.6, n=13, last 2 years) | |
| HP EliteBook 835 G9 | |
| Lenovo ThinkPad X13 G3 21CM002UGE | |
| Dell Latitude 13 7330 | |
| Lenovo ThinkPad X13 G3 21BN0046GE | |
| GTA V - 1920x1080 Highest AA:4xMSAA + FX AF:16x | |
| Average of class Subnotebook (10.7 - 43.7, n=56, last 2 years) | |
| HP EliteBook 835 G9 | |
| Lenovo ThinkPad X13 G3 21CM002UGE | |
| Lenovo ThinkPad X13 G2 AMD 20XH001KGE | |
| Lenovo ThinkPad X13 G3 21BN0046GE | |
| Dell Latitude 13 7330 | |
| Final Fantasy XV Benchmark - 1920x1080 High Quality | |
| Average of class Subnotebook (11.6 - 54.5, n=54, last 2 years) | |
| HP EliteBook 835 G9 | |
| Lenovo ThinkPad X13 G3 21BN0046GE | |
| Lenovo ThinkPad X13 G3 21CM002UGE | |
| Dell Latitude 13 7330 | |
| Strange Brigade - 1920x1080 ultra AA:ultra AF:16 | |
| Average of class Subnotebook (19 - 101.3, n=50, last 2 years) | |
| HP EliteBook 835 G9 | |
| Lenovo ThinkPad X13 G3 21CM002UGE | |
| Lenovo ThinkPad X13 G2 AMD 20XH001KGE | |
| Dell Latitude 13 7330 | |
| Lenovo ThinkPad X13 G3 21BN0046GE | |
| Dota 2 Reborn - 1920x1080 ultra (3/3) best looking | |
| Average of class Subnotebook (13 - 97, n=61, last 2 years) | |
| HP EliteBook 835 G9 | |
| Lenovo ThinkPad X13 G2 AMD 20XH001KGE | |
| Dell Latitude 13 7330 | |
| Lenovo ThinkPad X13 G3 21BN0046GE | |
| Lenovo ThinkPad X13 G3 21CM002UGE | |
Witcher 3 FPS graph
| low | med. | high | ultra | |
|---|---|---|---|---|
| GTA V (2015) | 118.8 | 103.2 | 36.4 | 14.2 |
| The Witcher 3 (2015) | 86.7 | 27.6 | 17.9 | |
| Dota 2 Reborn (2015) | 93.7 | 72.2 | 37.4 | 32.8 |
| Final Fantasy XV Benchmark (2018) | 45.5 | 21.9 | 16 | |
| X-Plane 11.11 (2018) | 36 | 24.2 | 22.1 | |
| Strange Brigade (2018) | 99.5 | 40 | 31.5 | 26.7 |
| F1 22 (2022) | 42.4 | 37 | 26.2 | 5.13 |
排放:ThinkPad X13很酷,很安静
噪声
联想ThinkPad X13 G3 AMD是一款相当安静的笔记本电脑。在几乎每一种情况下,它都比竞争对手的噪音要小。但应该注意的是,其直接的前辈 X13 Gen 2 AMD的噪音更小。
我们在使用ThinkPad时确实检测到了微弱的嘶嘶声,但只有在把耳朵直接放在键盘上时才会注意到。不过敏感的耳朵可能还是会受到困扰。
Noise level
| Idle |
| 23.1 / 23.1 / 23.1 dB(A) |
| Load |
| 27 / 35.5 dB(A) |
 | ||
30 dB silent 40 dB(A) audible 50 dB(A) loud |
||
min: | ||
| Lenovo ThinkPad X13 G3 21CM002UGE Radeon 660M, R5 PRO 6650U, Samsung PM9A1 MZVL2512HCJQ | Lenovo ThinkPad X13 G2 AMD 20XH001KGE Vega 7, R5 PRO 5650U, Samsung SSD PM981a MZVLB512HBJQ | HP EliteBook 835 G9 Radeon 680M, R7 PRO 6850U, Kioxia BG5 KBG50ZNV512G | Dell Latitude 13 7330 Iris Xe G7 96EUs, i7-1265U, Toshiba KBG40ZNS512G NVMe | Lenovo ThinkPad X13 G3 21BN0046GE Iris Xe G7 80EUs, i5-1235U, SK Hynix HFS512 GDE9X081N | |
|---|---|---|---|---|---|
| Noise | -3% | -13% | -9% | -4% | |
| off / environment * (dB) | 23.1 | 24.17 -5% | 26 -13% | 23.4 -1% | 24.6 -6% |
| Idle Minimum * (dB) | 23.1 | 24.17 -5% | 26 -13% | 23.4 -1% | 24.6 -6% |
| Idle Average * (dB) | 23.1 | 24.17 -5% | 27 -17% | 23.4 -1% | 24.6 -6% |
| Idle Maximum * (dB) | 23.1 | 24.17 -5% | 28 -21% | 23.4 -1% | 25.9 -12% |
| Load Average * (dB) | 27 | 29.92 -11% | 35 -30% | 37.8 -40% | 30.7 -14% |
| Witcher 3 ultra * (dB) | 38.7 | 37 4% | 39.2 -1% | 34.6 11% | |
| Load Maximum * (dB) | 35.5 | 31.52 11% | 37 -4% | 43 -21% | 34.6 3% |
* ... smaller is better
热量
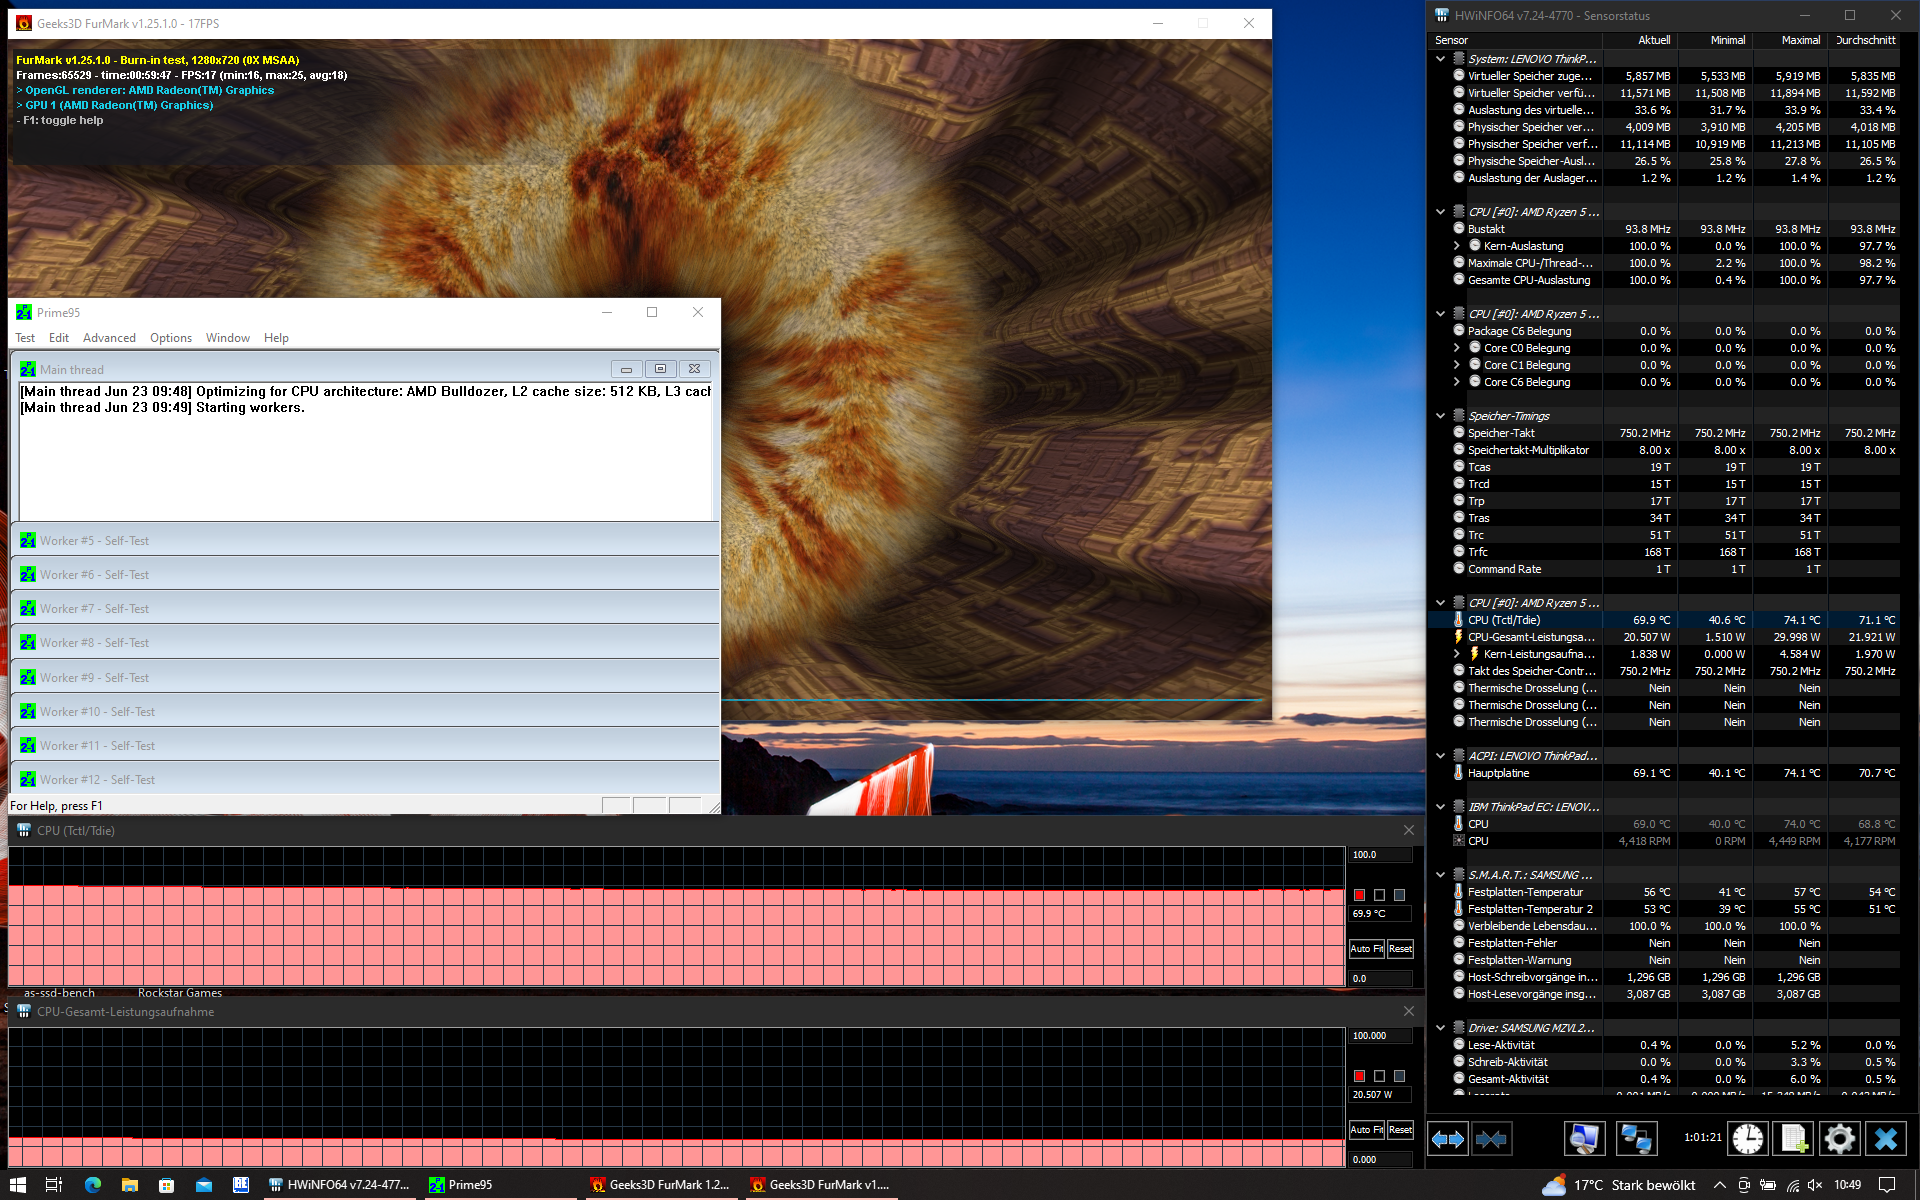
联想ThinkPad X13第3代不会变得很热。即使在满负荷的情况下,机箱温度也几乎没有突破40摄氏度/100华氏度的大关。
在压力测试中,处理器可以维持20瓦的功耗。我们无法检测到节流。
(+) The maximum temperature on the upper side is 38.1 °C / 101 F, compared to the average of 35.9 °C / 97 F, ranging from 21.4 to 59 °C for the class Subnotebook.
(±) The bottom heats up to a maximum of 40.1 °C / 104 F, compared to the average of 39.2 °C / 103 F
(+) In idle usage, the average temperature for the upper side is 30.9 °C / 88 F, compared to the device average of 30.8 °C / 87 F.
(±) Playing The Witcher 3, the average temperature for the upper side is 34.3 °C / 94 F, compared to the device average of 30.8 °C / 87 F.
(+) The palmrests and touchpad are cooler than skin temperature with a maximum of 31.6 °C / 88.9 F and are therefore cool to the touch.
(-) The average temperature of the palmrest area of similar devices was 28.2 °C / 82.8 F (-3.4 °C / -6.1 F).
| Lenovo ThinkPad X13 G3 21CM002UGE AMD Ryzen 5 PRO 6650U, AMD Radeon 660M | Lenovo ThinkPad X13 G2 AMD 20XH001KGE AMD Ryzen 5 PRO 5650U, AMD Radeon RX Vega 7 | HP EliteBook 835 G9 AMD Ryzen 7 PRO 6850U, AMD Radeon 680M | Dell Latitude 13 7330 Intel Core i7-1265U, Intel Iris Xe Graphics G7 96EUs | Lenovo ThinkPad X13 G3 21BN0046GE Intel Core i5-1235U, Intel Iris Xe Graphics G7 80EUs | |
|---|---|---|---|---|---|
| Heat | 9% | 4% | 12% | -4% | |
| Maximum Upper Side * (°C) | 38.1 | 43.7 -15% | 46 -21% | 38.6 -1% | 45.3 -19% |
| Maximum Bottom * (°C) | 40.1 | 38 5% | 49 -22% | 42 -5% | 41.8 -4% |
| Idle Upper Side * (°C) | 33.6 | 25.8 23% | 24 29% | 23.8 29% | 31.6 6% |
| Idle Bottom * (°C) | 33.4 | 26.2 22% | 24 28% | 24.6 26% | 32.6 2% |
* ... smaller is better
发言人
面向用户的扬声器发出的声音质量中等,没有基础--只有在声波频谱的较高部分,声音是平衡的。扬声器的HP EliteBook 835 G9并没有好到哪里去,但至少是稍大一些。
Lenovo ThinkPad X13 G3 21CM002UGE audio analysis
(±) | speaker loudness is average but good (76.1 dB)
Bass 100 - 315 Hz
(-) | nearly no bass - on average 24% lower than median
(±) | linearity of bass is average (14.2% delta to prev. frequency)
Mids 400 - 2000 Hz
(+) | balanced mids - only 2.9% away from median
(+) | mids are linear (2.8% delta to prev. frequency)
Highs 2 - 16 kHz
(+) | balanced highs - only 2.7% away from median
(+) | highs are linear (3.9% delta to prev. frequency)
Overall 100 - 16.000 Hz
(±) | linearity of overall sound is average (19.3% difference to median)
Compared to same class
» 60% of all tested devices in this class were better, 7% similar, 34% worse
» The best had a delta of 5%, average was 18%, worst was 53%
Compared to all devices tested
» 47% of all tested devices were better, 8% similar, 46% worse
» The best had a delta of 4%, average was 23%, worst was 134%
HP EliteBook 835 G9 audio analysis
(±) | speaker loudness is average but good (79 dB)
Bass 100 - 315 Hz
(-) | nearly no bass - on average 17.8% lower than median
(±) | linearity of bass is average (11.2% delta to prev. frequency)
Mids 400 - 2000 Hz
(+) | balanced mids - only 1.7% away from median
(+) | mids are linear (3.2% delta to prev. frequency)
Highs 2 - 16 kHz
(+) | balanced highs - only 3.2% away from median
(±) | linearity of highs is average (8% delta to prev. frequency)
Overall 100 - 16.000 Hz
(+) | overall sound is linear (14.7% difference to median)
Compared to same class
» 31% of all tested devices in this class were better, 5% similar, 64% worse
» The best had a delta of 5%, average was 18%, worst was 53%
Compared to all devices tested
» 19% of all tested devices were better, 4% similar, 77% worse
» The best had a delta of 4%, average was 23%, worst was 134%
能源管理:高效的联想ThinkPad
消耗功率
联想笔记本电脑可以吹嘘自己的功耗相当低,所有评测设备的平均运行效率都比较低。特别是在空转时,差异很重要。在这个领域,惠普EliteBook 835 G9明显更差。
49.1瓦的最大消耗量完全在65瓦充电器的能力范围内。
| Off / Standby | |
| Idle | |
| Load |
|
Key:
min: | |
| Lenovo ThinkPad X13 G3 21CM002UGE R5 PRO 6650U, Radeon 660M, Samsung PM9A1 MZVL2512HCJQ, IPS LED, 1920x1200, 13.3" | Lenovo ThinkPad X13 G2 AMD 20XH001KGE R5 PRO 5650U, Vega 7, Samsung SSD PM981a MZVLB512HBJQ, IPS LED, 1920x1200, 13.3" | HP EliteBook 835 G9 R7 PRO 6850U, Radeon 680M, Kioxia BG5 KBG50ZNV512G, IPS, 1920x1200, 13.3" | Dell Latitude 13 7330 i7-1265U, Iris Xe G7 96EUs, Toshiba KBG40ZNS512G NVMe, IPS, 1920x1080, 13.3" | Lenovo ThinkPad X13 G3 21BN0046GE i5-1235U, Iris Xe G7 80EUs, SK Hynix HFS512 GDE9X081N, IPS Grade, 1920x1200, 13.3" | Average AMD Radeon 660M | Average of class Subnotebook | |
|---|---|---|---|---|---|---|---|
| Power Consumption | -7% | -33% | -10% | -7% | -38% | -26% | |
| Idle Minimum * (Watt) | 3.2 | 3.82 -19% | 5 -56% | 2.8 13% | 2.7 16% | 4.68 ? -46% | 3.76 ? -17% |
| Idle Average * (Watt) | 5.2 | 5.74 -10% | 6 -15% | 4.8 8% | 5.2 -0% | 7.08 ? -36% | 6.54 ? -26% |
| Idle Maximum * (Watt) | 6.1 | 7.65 -25% | 11 -80% | 7.3 -20% | 6.2 -2% | 9.12 ? -50% | 7.89 ? -29% |
| Load Average * (Watt) | 33.6 | 35.79 -7% | 45 -34% | 48.1 -43% | 38.4 -14% | 44.2 ? -32% | 42 ? -25% |
| Witcher 3 ultra * (Watt) | 39.3 | 35.6 9% | 45.2 -15% | 35.4 10% | 41.9 -7% | ||
| Load Maximum * (Watt) | 49.1 | 45.04 8% | 48 2% | 63.6 -30% | 66.7 -36% | 62.4 ? -27% | 64.8 ? -32% |
* ... smaller is better
Power consumption Witcher 3 / stress test
Energieaufnahme mit externem Monitor
电池寿命
内部电池的容量仍然是54.7Wh,虽然也有一个41Wh的变种。我们测试的模型取得了很好的电池运行时间:在WiFi测试中的12小时30分钟(150cd/m²的屏幕亮度)已经很厉害了,但在同一测试中,在最大屏幕亮度下的10小时40分钟,相对来说更出色。ThinkPad X13 G3 AMD是一款能够持续整个工作日的设备。
| Lenovo ThinkPad X13 G3 21CM002UGE R5 PRO 6650U, Radeon 660M, 54.7 Wh | Lenovo ThinkPad X13 G2 AMD 20XH001KGE R5 PRO 5650U, Vega 7, 54.7 Wh | HP EliteBook 835 G9 R7 PRO 6850U, Radeon 680M, 51 Wh | Dell Latitude 13 7330 i7-1265U, Iris Xe G7 96EUs, 41 Wh | Lenovo ThinkPad X13 G3 21BN0046GE i5-1235U, Iris Xe G7 80EUs, 54.7 Wh | Average of class Subnotebook | |
|---|---|---|---|---|---|---|
| Battery runtime | -17% | -27% | -21% | 8% | 22% | |
| WiFi v1.3 (h) | 12.5 | 9.3 -26% | 9.1 -27% | 8.3 -34% | 10.2 -18% | 14 ? 12% |
| Load (h) | 1.5 | 1.4 -7% | 1.1 -27% | 1.4 -7% | 2 33% | 1.969 ? 31% |
Pros
Cons
结论:ThinkPad X13 AMD仍然是一款非常好的次笔记本
随着联想ThinkPad X13第三代AMD,制造商在已经非常好的笔记本电脑的基础上,。联想ThinkPad X13第二代.新机型拥有使旧机型优秀的所有方面,但增加了USB4和Rembrandt。从逻辑上讲,新机型也达到了非常好的评价,这并不是什么大奇迹。
除了现有的优势,如坚固而轻巧的机箱、合意的输入设备和良好的连接选项,新机型的电池寿命也有所提高。ThinkPad X13第三代实现了良好的性能,而且运行起来仍然凉爽安静,与英特尔的竞争对手相比,这并不是什么好事。
当然,仍有改进的余地。屏幕亮度可以更好,特别是在考虑到竞争对手的情况下。我们还希望看到一个更高分辨率的网络摄像头,以及可升级的内存。另外,WiFi的上传速率也相当低。
紧凑、性能好、电池寿命长、凉爽、安静--联想ThinkPad X13第三代AMD结合了许多积极属性。
这主要是高层的批评。如果你正在寻找一个快速、超移动的工作设备,并能持续一整天,ThinkPad X13 G3 AMD绝对应该是一个竞争者。同样的情况也适用于 HP EliteBook 835 G9 - 的买家戴尔Latitude 7330购房者必须与英特尔的CPU竞争,它能提供更好的单核性能,但其他方面的运行效率较低。笔记本联想ThinkPad X13第四代配有AMD凤凰处理器的联想ThinkPad X13第四代已经上市,但还没有上市--购买前代产品绝对不是一个糟糕的选择。
价格和可用性
亚马逊提供联想ThinkPad X13 G3 AMD,售价1200美元。
Lenovo ThinkPad X13 G3 21CM002UGE
- 06/27/2023 v7 (old)
Benjamin Herzig
Transparency
The selection of devices to be reviewed is made by our editorial team. The test sample was provided to the author as a loan by the manufacturer or retailer for the purpose of this review. The lender had no influence on this review, nor did the manufacturer receive a copy of this review before publication. There was no obligation to publish this review. As an independent media company, Notebookcheck is not subjected to the authority of manufacturers, retailers or publishers.
This is how Notebookcheck is testing
Every year, Notebookcheck independently reviews hundreds of laptops and smartphones using standardized procedures to ensure that all results are comparable. We have continuously developed our test methods for around 20 years and set industry standards in the process. In our test labs, high-quality measuring equipment is utilized by experienced technicians and editors. These tests involve a multi-stage validation process. Our complex rating system is based on hundreds of well-founded measurements and benchmarks, which maintains objectivity. Further information on our test methods can be found here.
Price comparison

