判决
QHD+ 不仅提供了比 FHD+ 更高分辨率的画面,还减少了重影现象,显示屏亮度也略有提升,整体视觉体验更好。色彩覆盖率和对比度变化不大,但对于 IPS 面板来说,后者仍然相当不错,超过 1500:1。
当然,与 FHD+ 配置相比,电池续航时间减少了几个小时。不过,它的实际 WLAN 浏览时间还是相当长的,刚刚超过 17 个小时,可以说是对上述视觉优势的微小权衡。
遗憾的是,鉴于戴尔 Pro 13 Premium 是戴尔产品系列中的 "Premium "机型,OLED 选项甚至高刷新率选项在这里都没有提供。OLED 将提供更出色的 HDR 支持,而更高的刷新率将进一步改善用户体验。
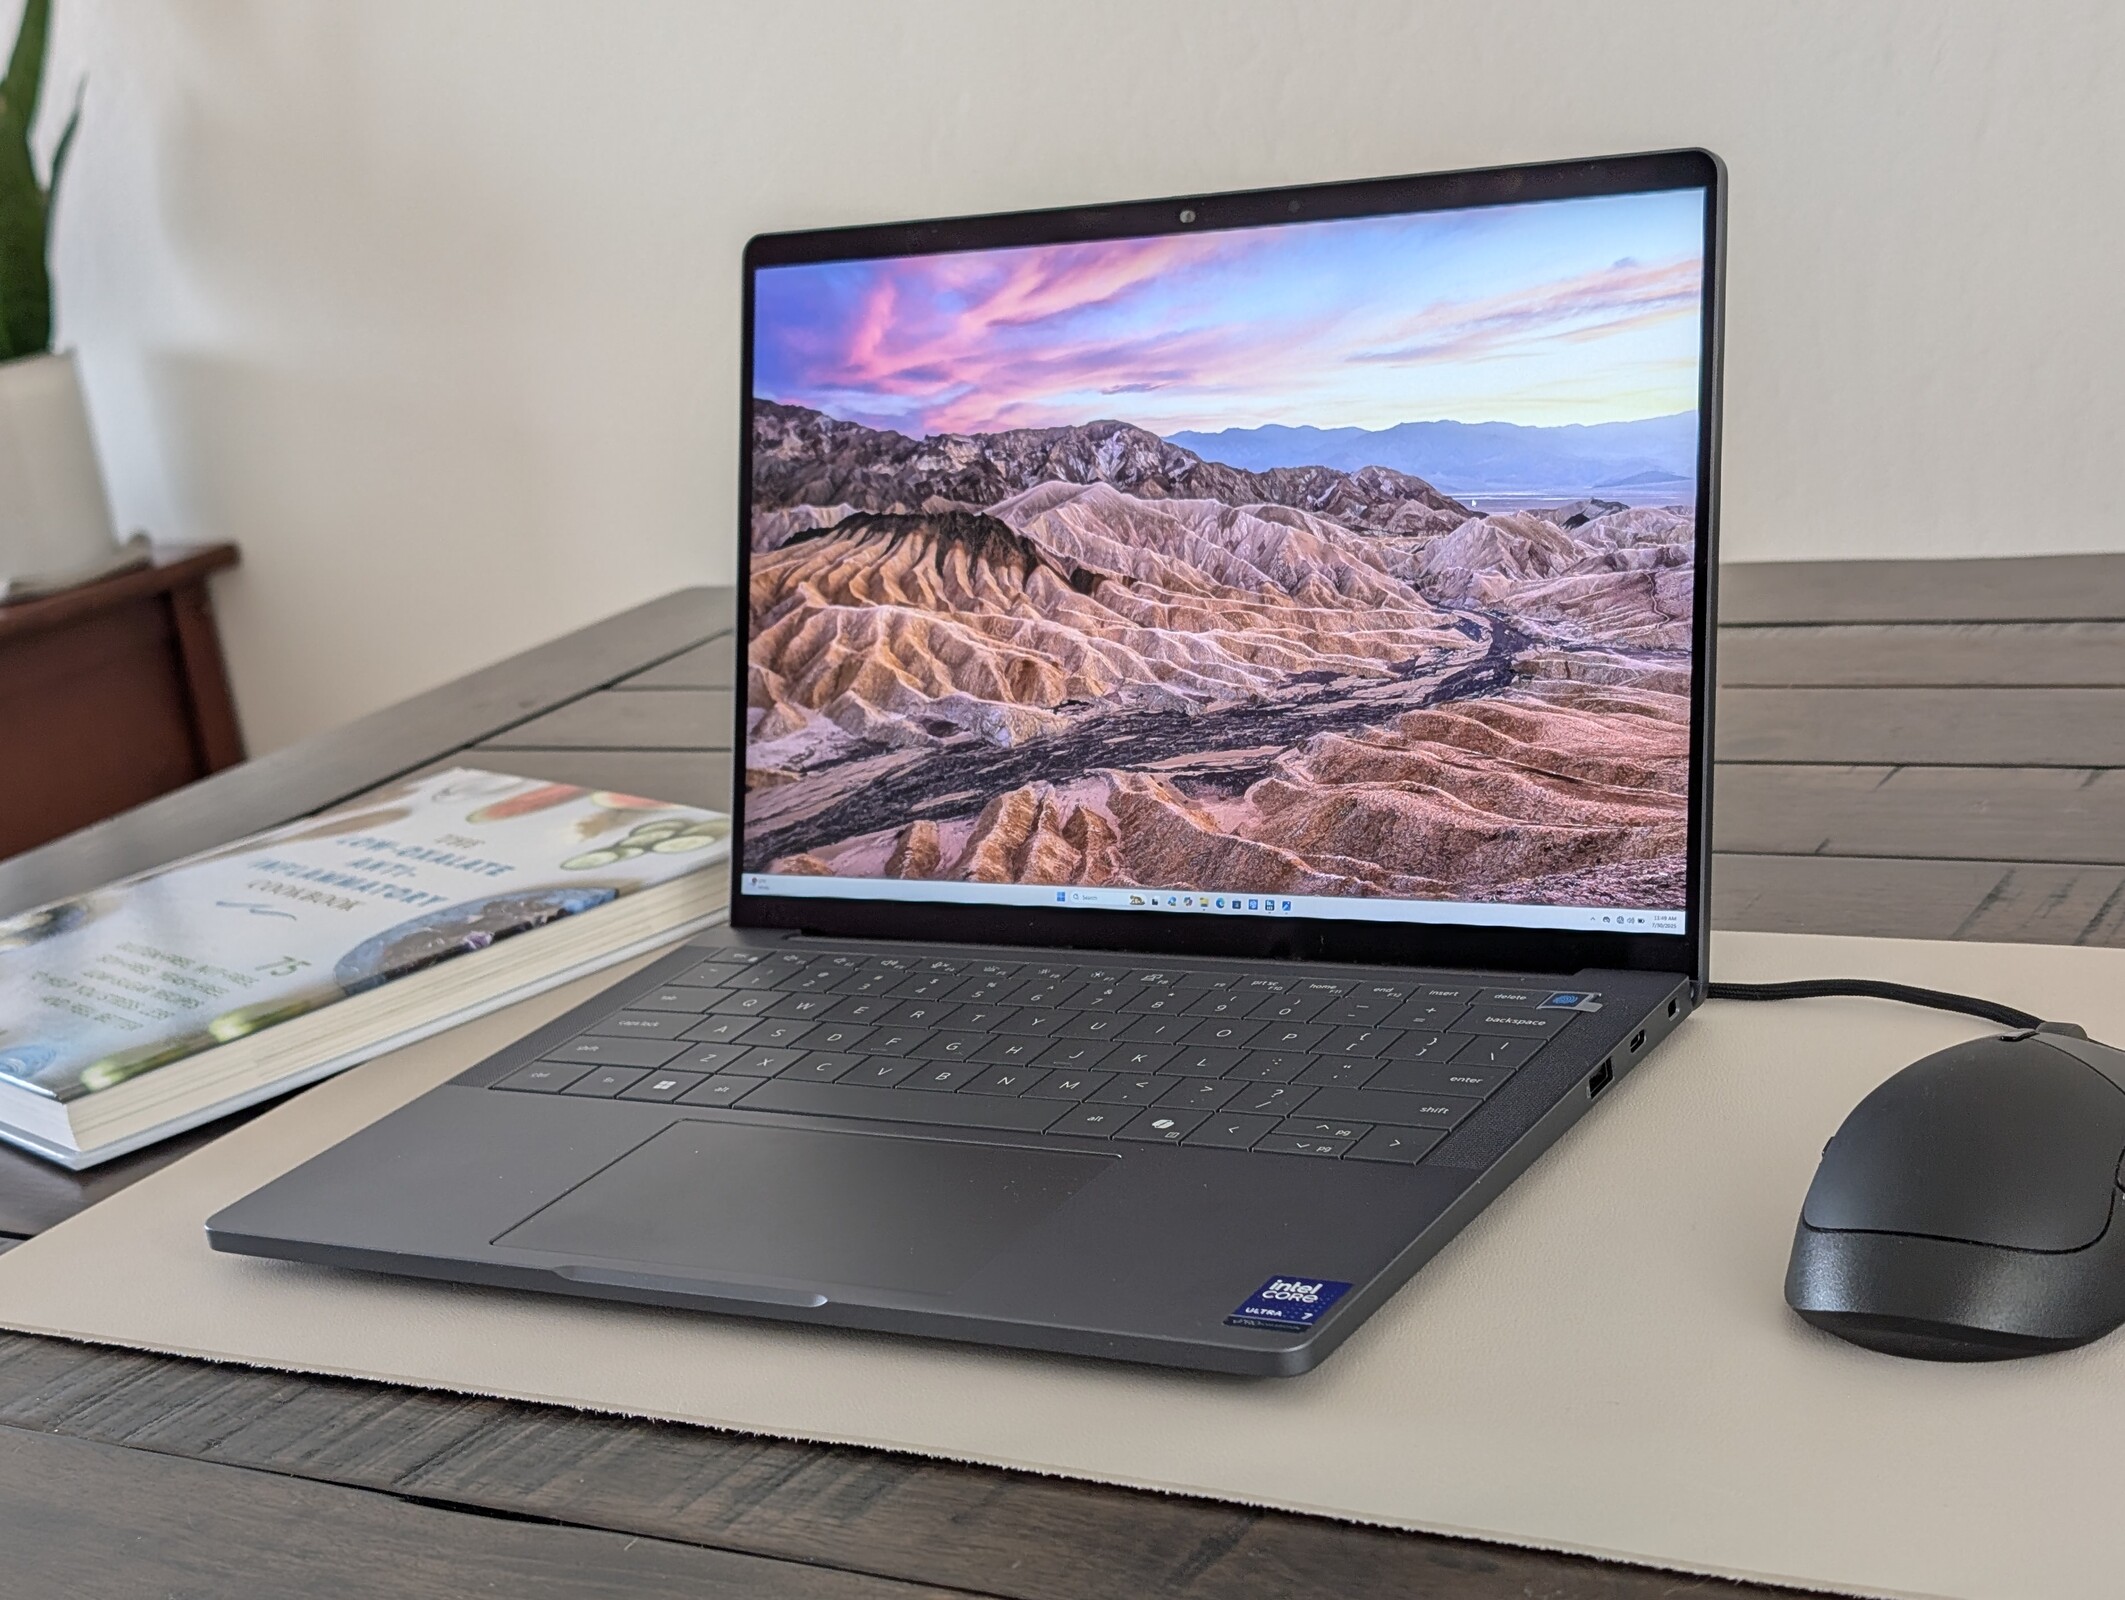
2025 戴尔 Pro 13 Premium 继承了去年的Latitude 7000 或 9000 系列。该机型目前有 FHD+ (1200p) 和 QHD+ (1600p) 两种显示屏可供选择。读者可以查看我们的 FHD+ 配置的完整评测了解更多基准测试和信息。本评测页面重点介绍 QHD+ 配置,该配置与我们的 FHD+ 测试机采用相同的 Core Ultra 7 268V 处理器。
更多戴尔评测:
规格
显示屏
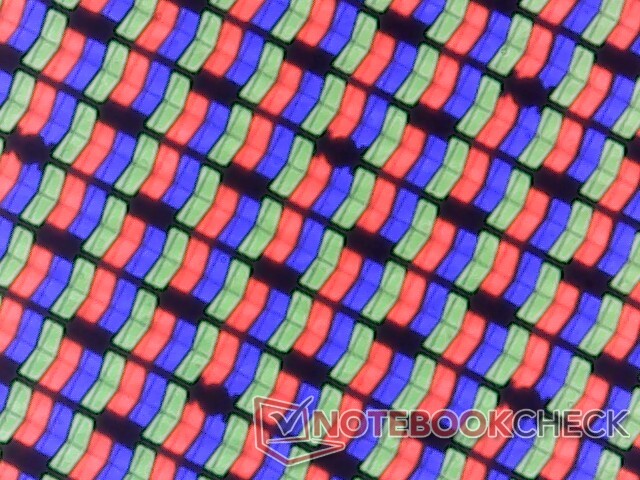
FHD+ 非触摸配置采用的是友达光电的面板,而我们的 QHD+ 触摸配置采用的是京东方的面板。如下表所示,这种更高分辨率的面板响应时间稍快,背光稍亮,但色彩还原度和对比度几乎相同。
请注意,FHD+ 和 QHD+ 两种选择都只有 IPS,没有 OLED 选择。因此,与 OLED 电脑相比,HDR 和 P3 色域支持较弱,如 微星 Prestige 13 AI Plus Evo或 微软 Surface Pro.
| |||||||||||||||||||||||||
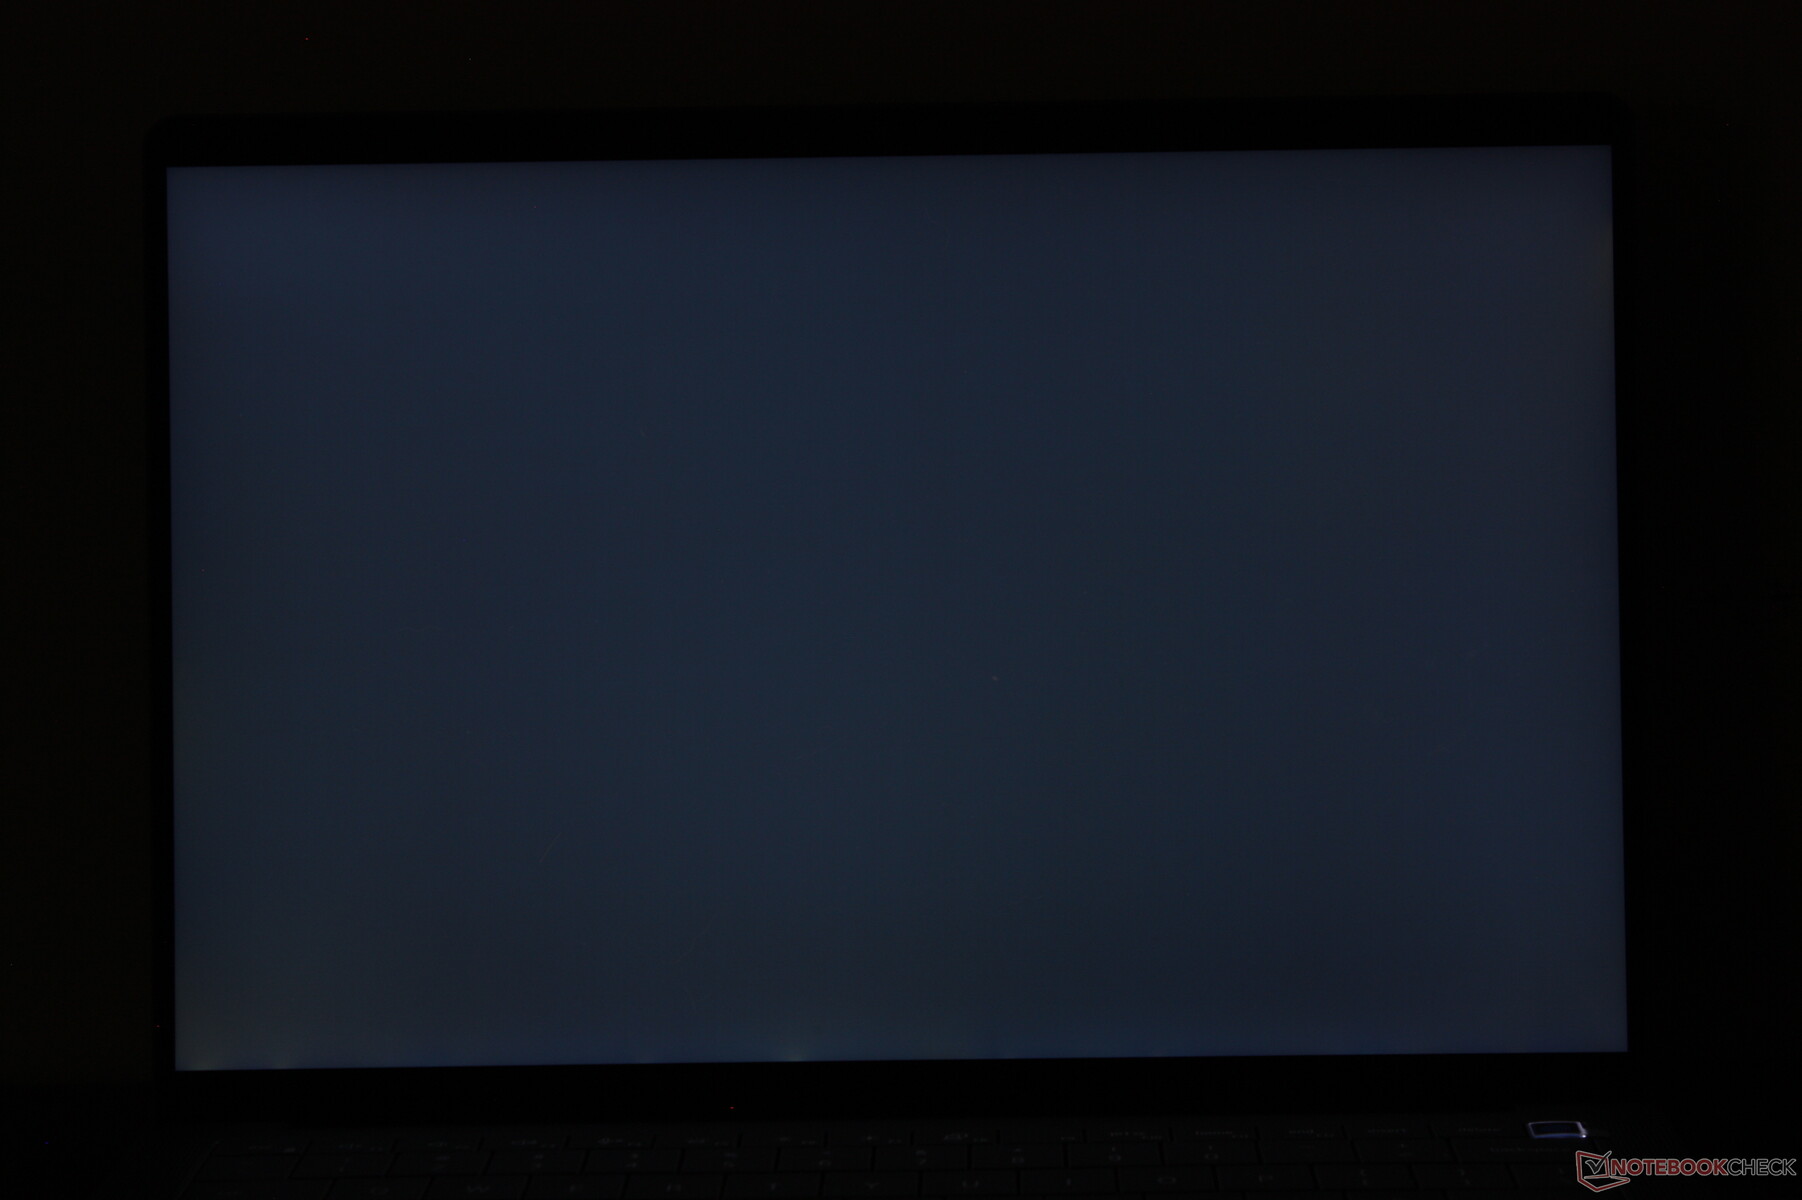
Brightness Distribution: 88 %
Center on Battery: 527.9 cd/m²
Contrast: 1703:1 (Black: 0.31 cd/m²)
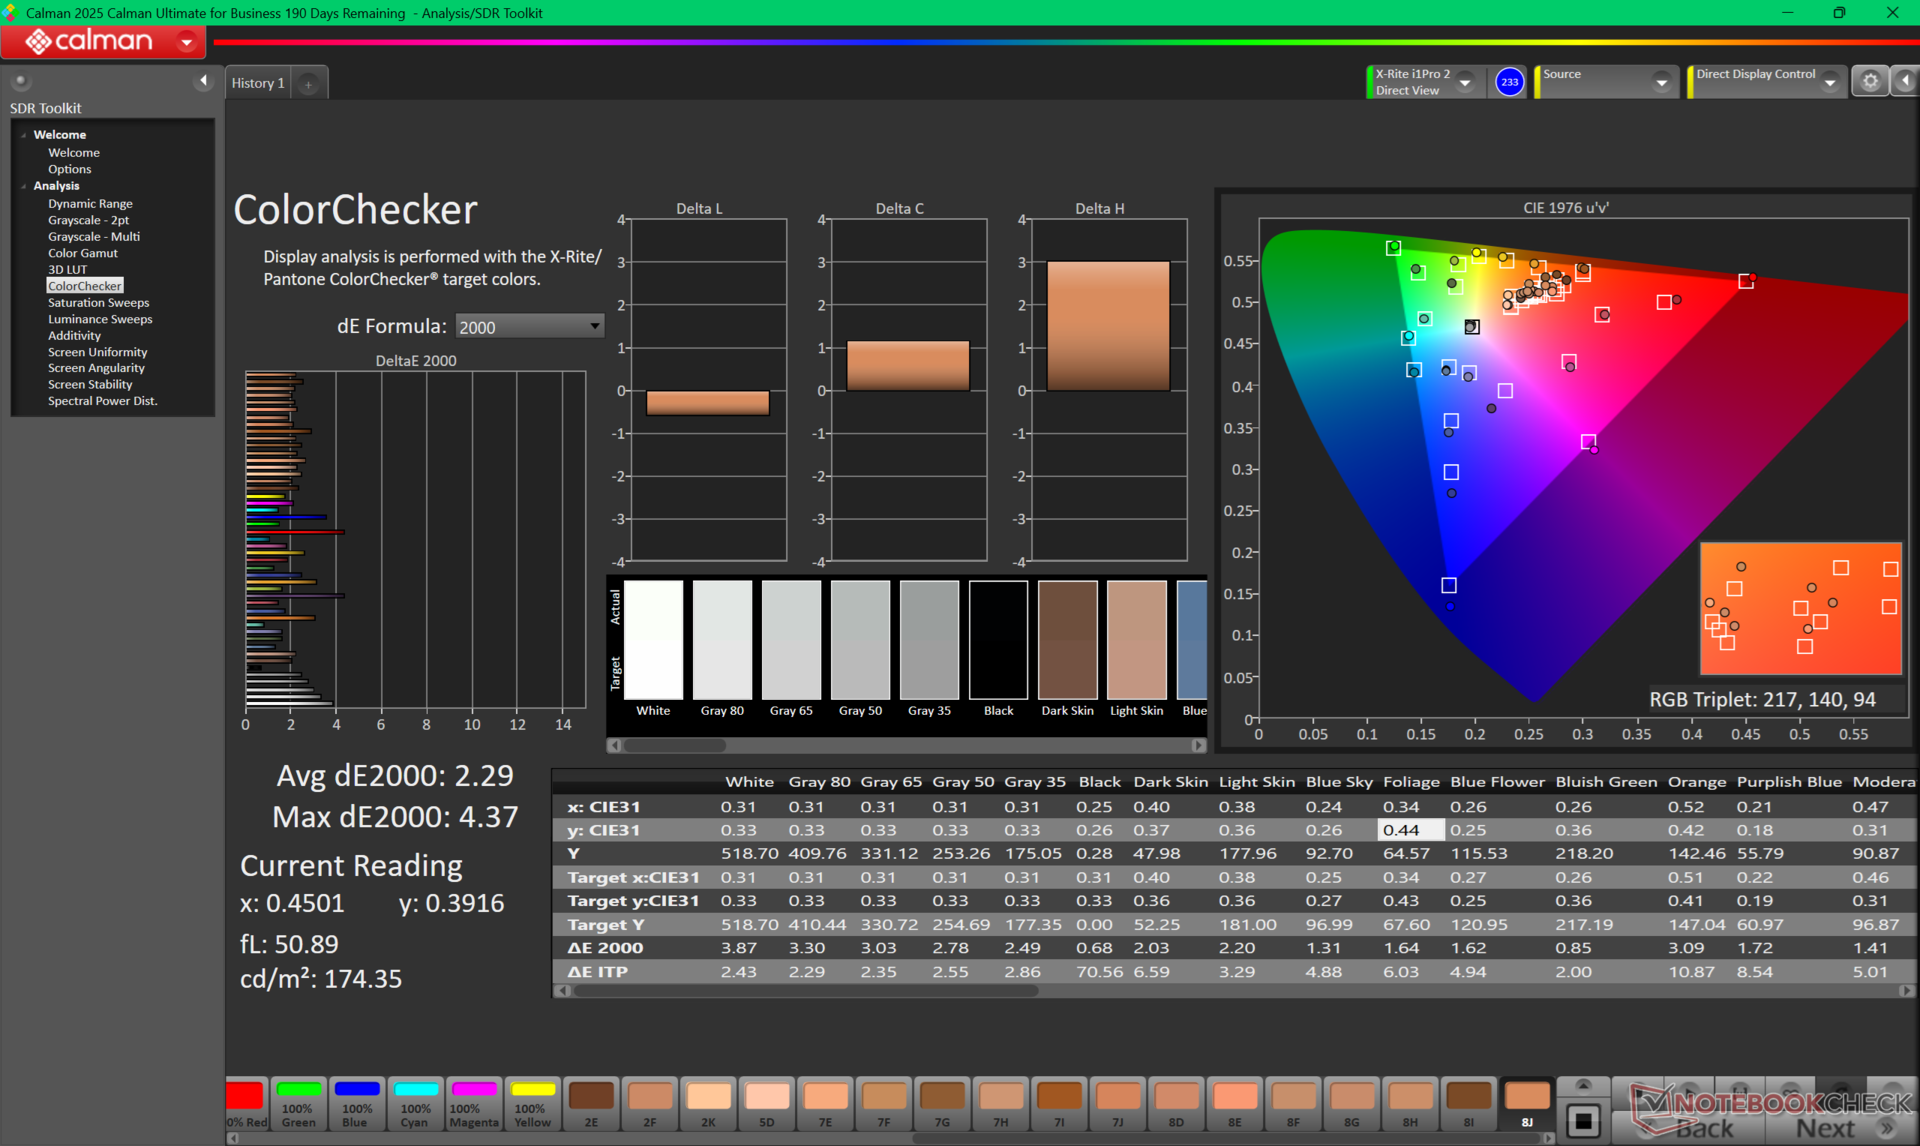
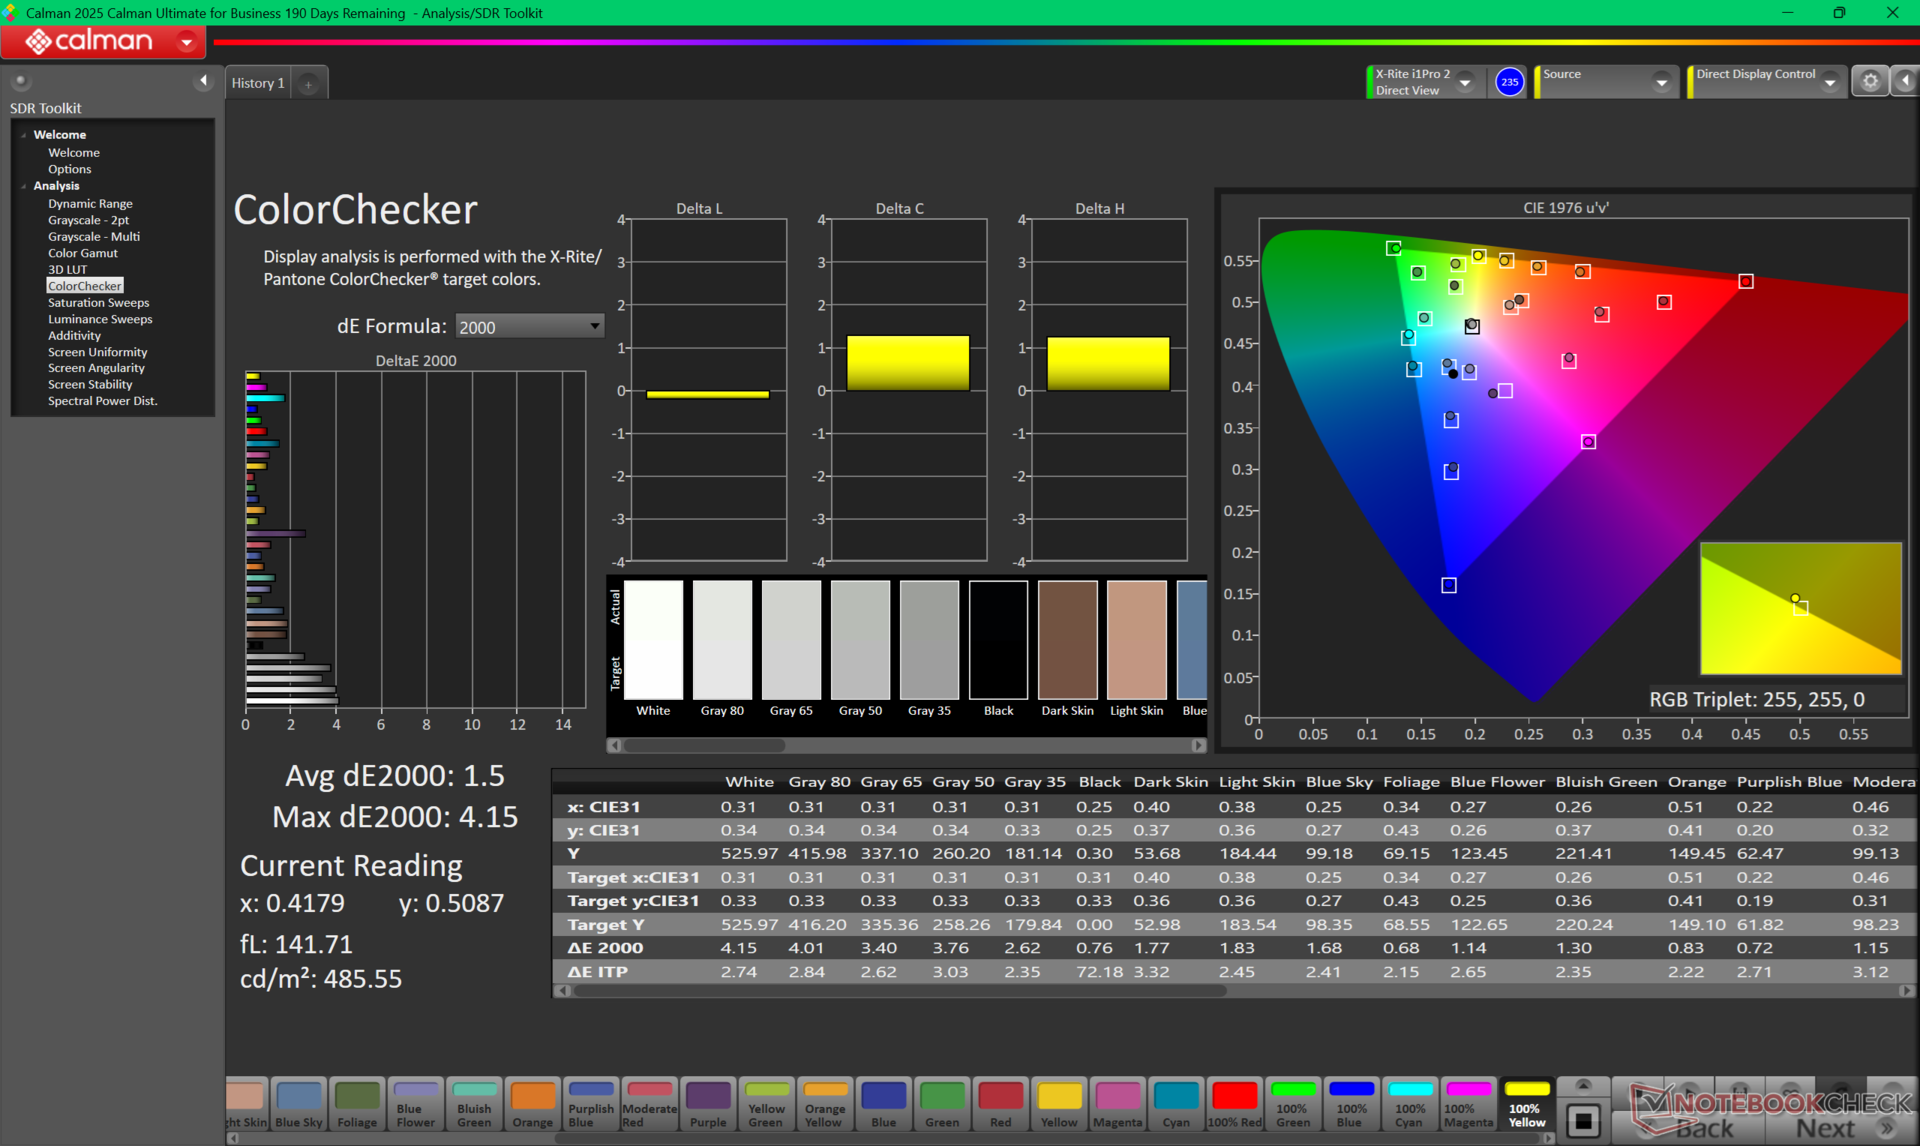
ΔE ColorChecker Calman: 2.29 | ∀{0.5-29.43 Ø4.71}
calibrated: 1.5
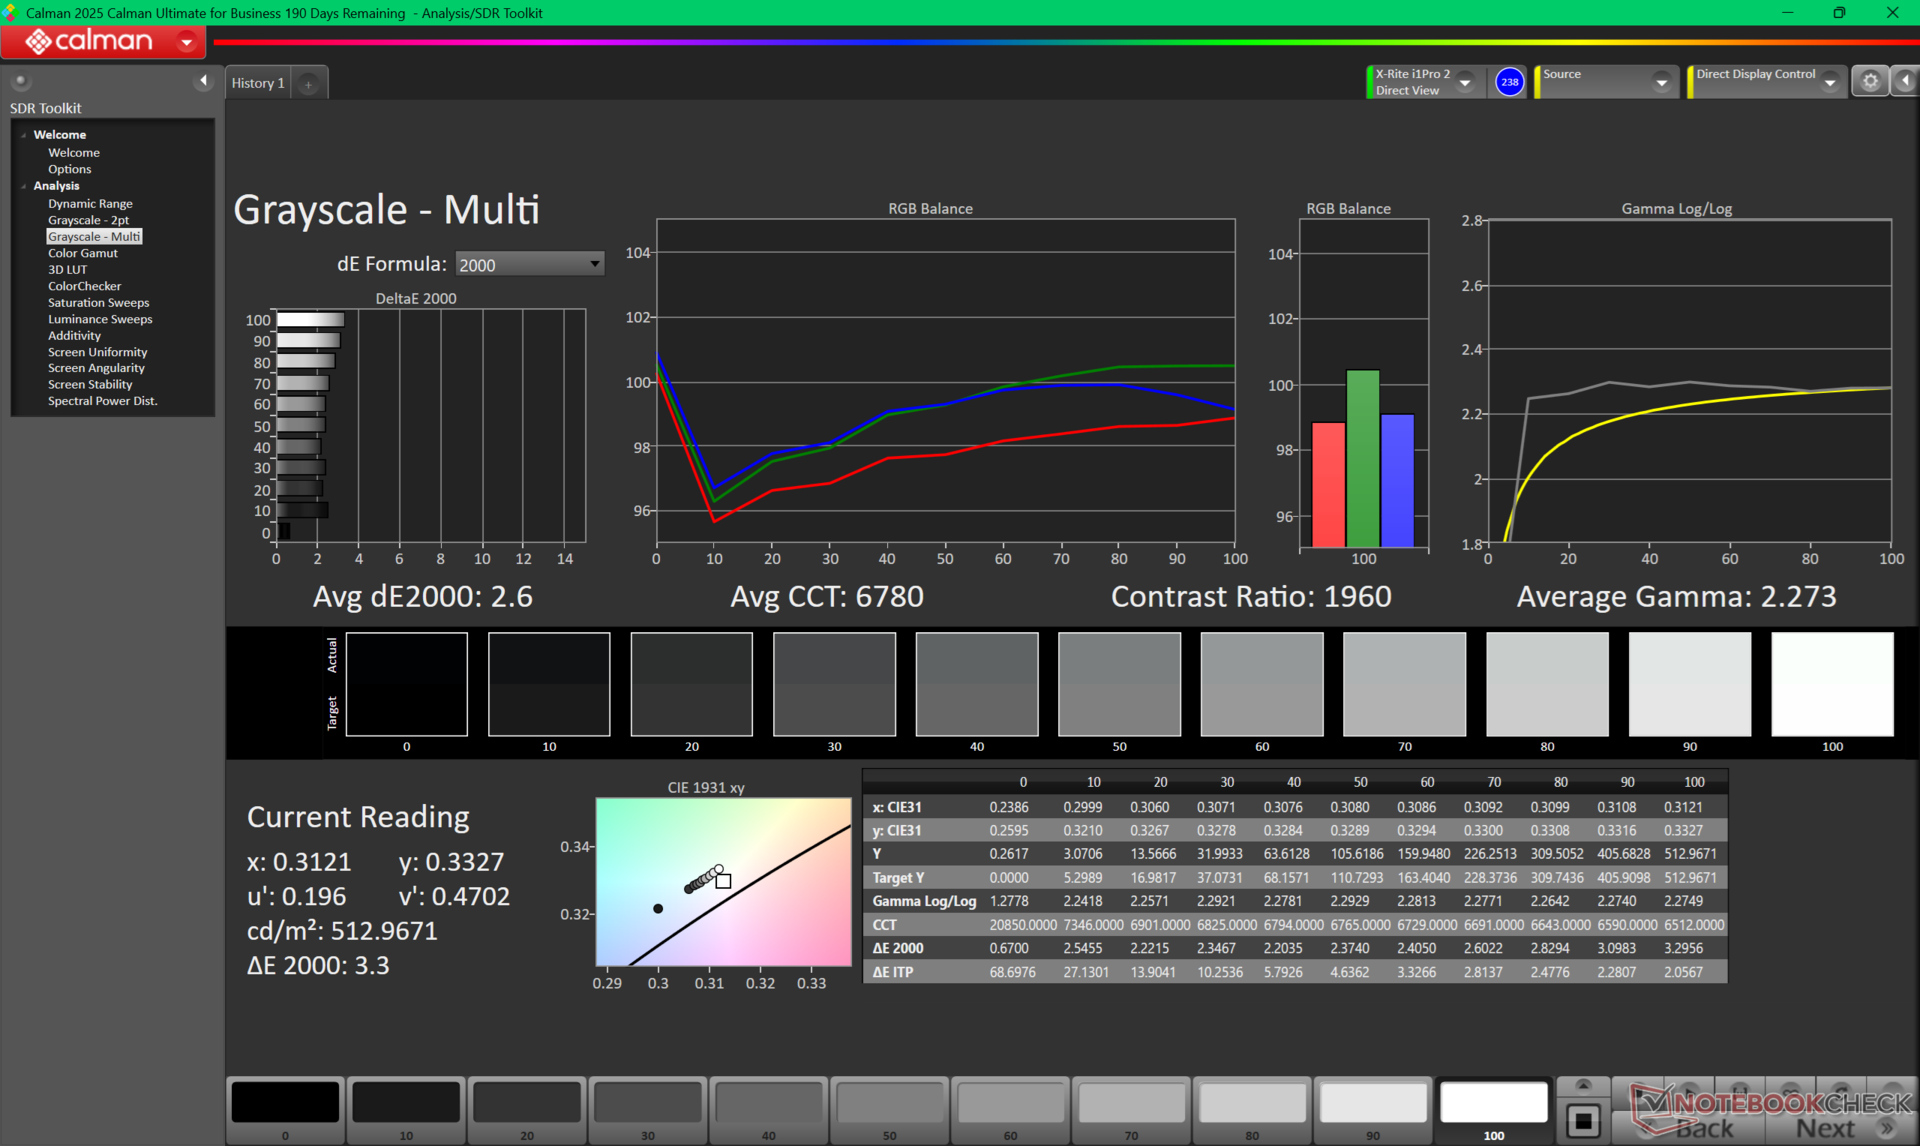
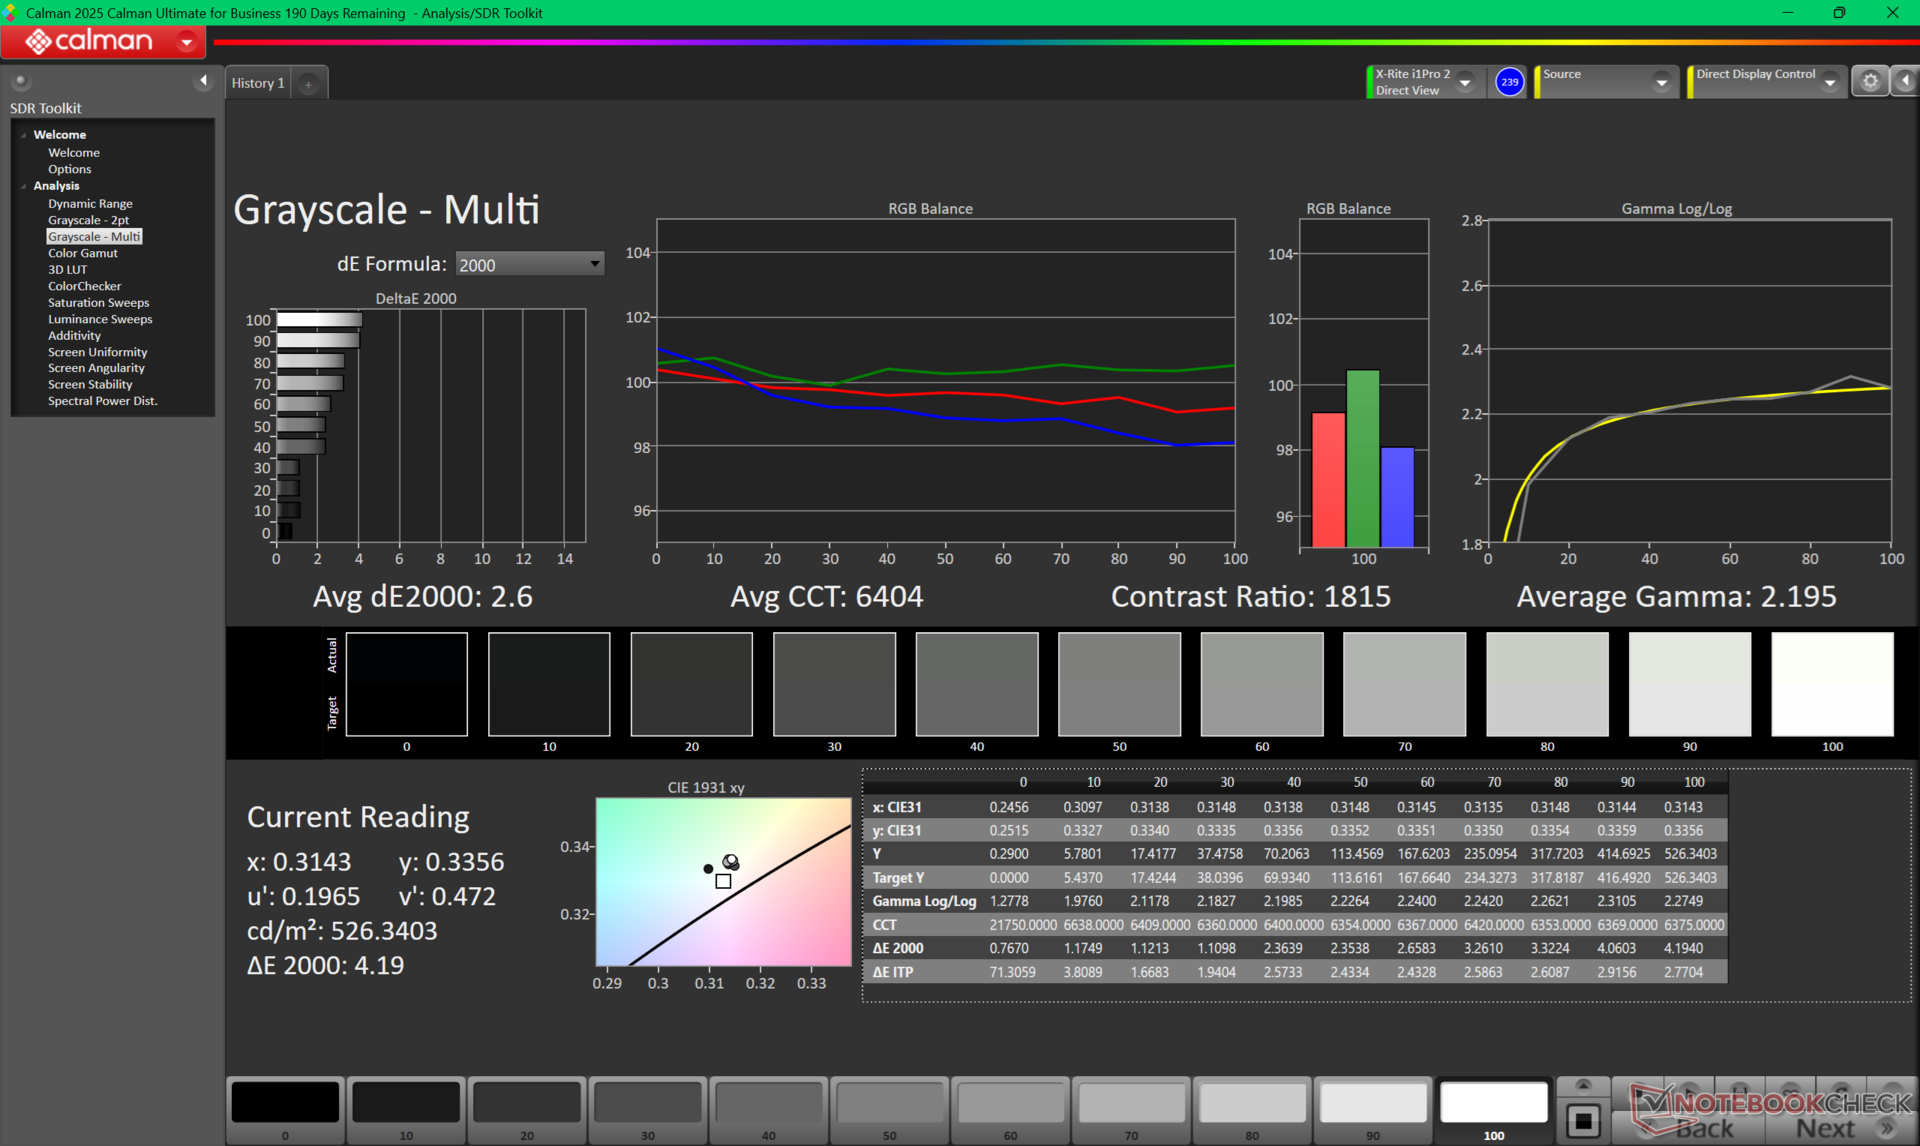
ΔE Greyscale Calman: 2.6 | ∀{0.09-98 Ø4.96}
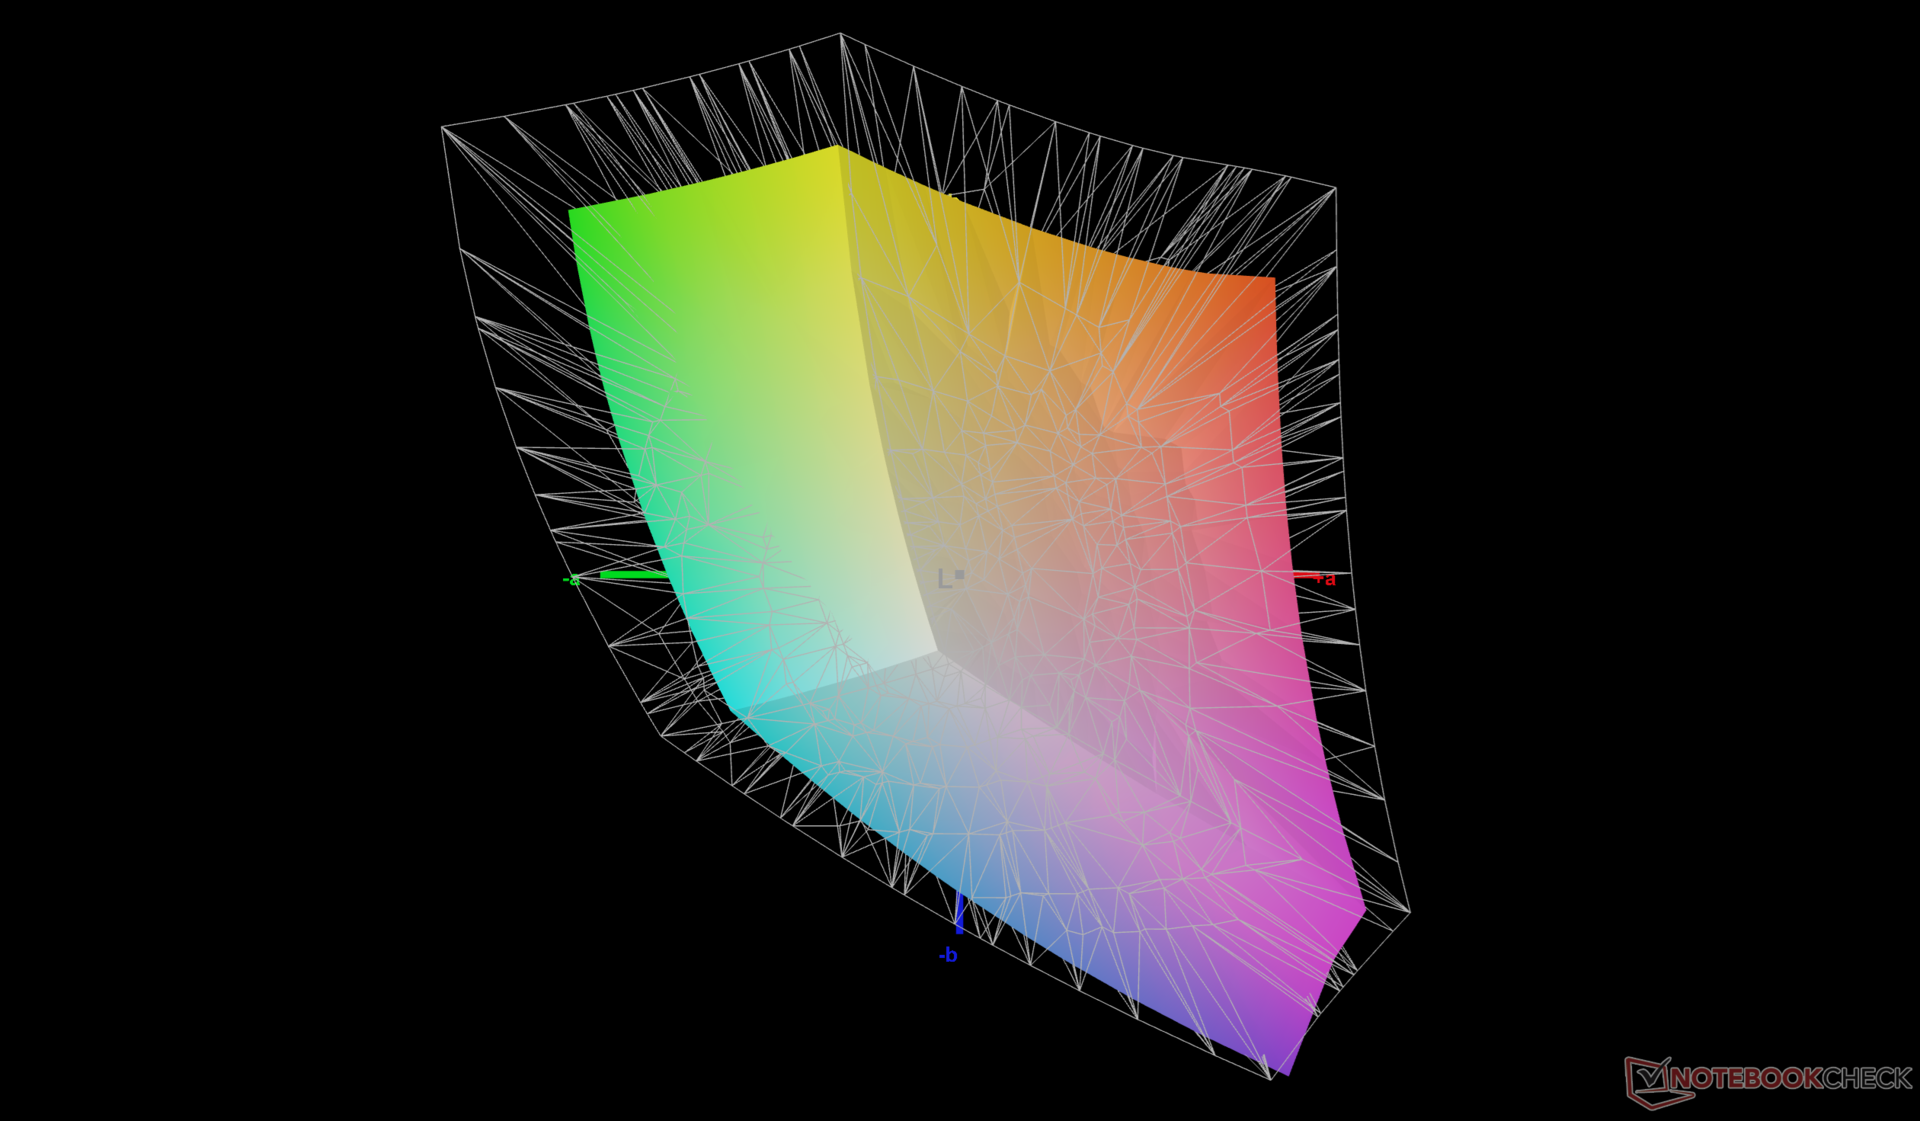
69.5% AdobeRGB 1998 (Argyll 3D)
97% sRGB (Argyll 3D)
69.3% Display P3 (Argyll 3D)
Gamma: 2.27
CCT: 6780 K
| Dell Pro 13 Premium 1600p BOE NS13QDM, IPS, 2560x1600, 13.3", 60 Hz | Dell Pro 13 Premium PA13250 B133UAN (AUOBEB0), IPS, 1920x1200, 13.3", 60 Hz | Framework Laptop 13.5 Ryzen AI 9 HX 370 BOE NE135A1M-NY1, IPS, 2880x1920, 13.5", 120 Hz | Microsoft Surface Pro OLED Lunar Lake ATNA30DW02-0, OLED, 2880x1920, 13", 120 Hz | MSI Prestige 13 AI Plus Evo A2VMG ATNA33AA07-0, OLED, 2880x1800, 13.3", 60 Hz | Lenovo ThinkPad X13 Gen 4 21J3001VGE R133NW4K R0, IPS LED, 1920x1200, 13.3", 60 Hz | HP EliteBook x360 830 G10 7L7U1ET LGD06E5, IPS LED, 1920x1200, 13.3", Hz | |
|---|---|---|---|---|---|---|---|
| Display | 6% | 2% | 25% | 28% | -4% | -6% | |
| Display P3 Coverage (%) | 69.3 | 74.3 7% | 71.9 4% | 99.5 44% | 99.9 44% | 65.3 -6% | 63.2 -9% |
| sRGB Coverage (%) | 97 | 99.1 2% | 95.9 -1% | 100 3% | 100 3% | 96.1 -1% | 92.7 -4% |
| AdobeRGB 1998 Coverage (%) | 69.5 | 75.9 9% | 70.8 2% | 89.7 29% | 95.8 38% | 66.8 -4% | 65.1 -6% |
| Response Times | -29% | -3% | 99% | 93% | -29% | -13% | |
| Response Time Grey 50% / Grey 80% * (ms) | 37.5 ? | 52.8 ? -41% | 40 ? -7% | 0.43 ? 99% | 1.94 ? 95% | 48.9 ? -30% | 39.8 ? -6% |
| Response Time Black / White * (ms) | 22.6 ? | 26.4 ? -17% | 22.3 ? 1% | 0.54 ? 98% | 2.02 ? 91% | 28.6 ? -27% | 26.8 ? -19% |
| PWM Frequency (Hz) | 480 ? | 60 ? | |||||
| PWM Amplitude * (%) | 25 | 21.9 | |||||
| Screen | -17% | -52% | 37% | -2% | -26% | -37% | |
| Brightness middle (cd/m²) | 527.9 | 456 -14% | 529.9 0% | 574 9% | 382.4 -28% | 373 -29% | 394 -25% |
| Brightness (cd/m²) | 500 | 460 -8% | 506 1% | 578 16% | 383 -23% | 354 -29% | 372 -26% |
| Brightness Distribution (%) | 88 | 89 1% | 94 7% | 99 13% | 99 13% | 86 -2% | 84 -5% |
| Black Level * (cd/m²) | 0.31 | 0.23 26% | 0.3 3% | 0.28 10% | 0.17 45% | ||
| Contrast (:1) | 1703 | 1983 16% | 1766 4% | 1332 -22% | 2318 36% | ||
| Colorchecker dE 2000 * | 2.29 | 3.3 -44% | 5.7 -149% | 0.9 61% | 3.84 -68% | 3.1 -35% | 4.1 -79% |
| Colorchecker dE 2000 max. * | 4.37 | 6.47 -48% | 10.6 -143% | 2.3 47% | 6.66 -52% | 7 -60% | 8.3 -90% |
| Colorchecker dE 2000 calibrated * | 1.5 | 1.7 -13% | 1.5 -0% | 0.41 73% | 0.9 40% | ||
| Greyscale dE 2000 * | 2.6 | 4.35 -67% | 7.5 -188% | 0.6 77% | 0.7 73% | 5.4 -108% | 6.6 -154% |
| Gamma | 2.27 97% | 2.51 88% | 2.07 106% | 2.16 102% | 2.23 99% | 2.19 100% | 2.17 101% |
| CCT | 6780 96% | 6215 105% | 6967 93% | 6482 100% | 6475 100% | 6750 96% | 6019 108% |
| Total Average (Program / Settings) | -13% /
-14% | -18% /
-33% | 54% /
45% | 40% /
22% | -20% /
-22% | -19% /
-26% |
* ... smaller is better
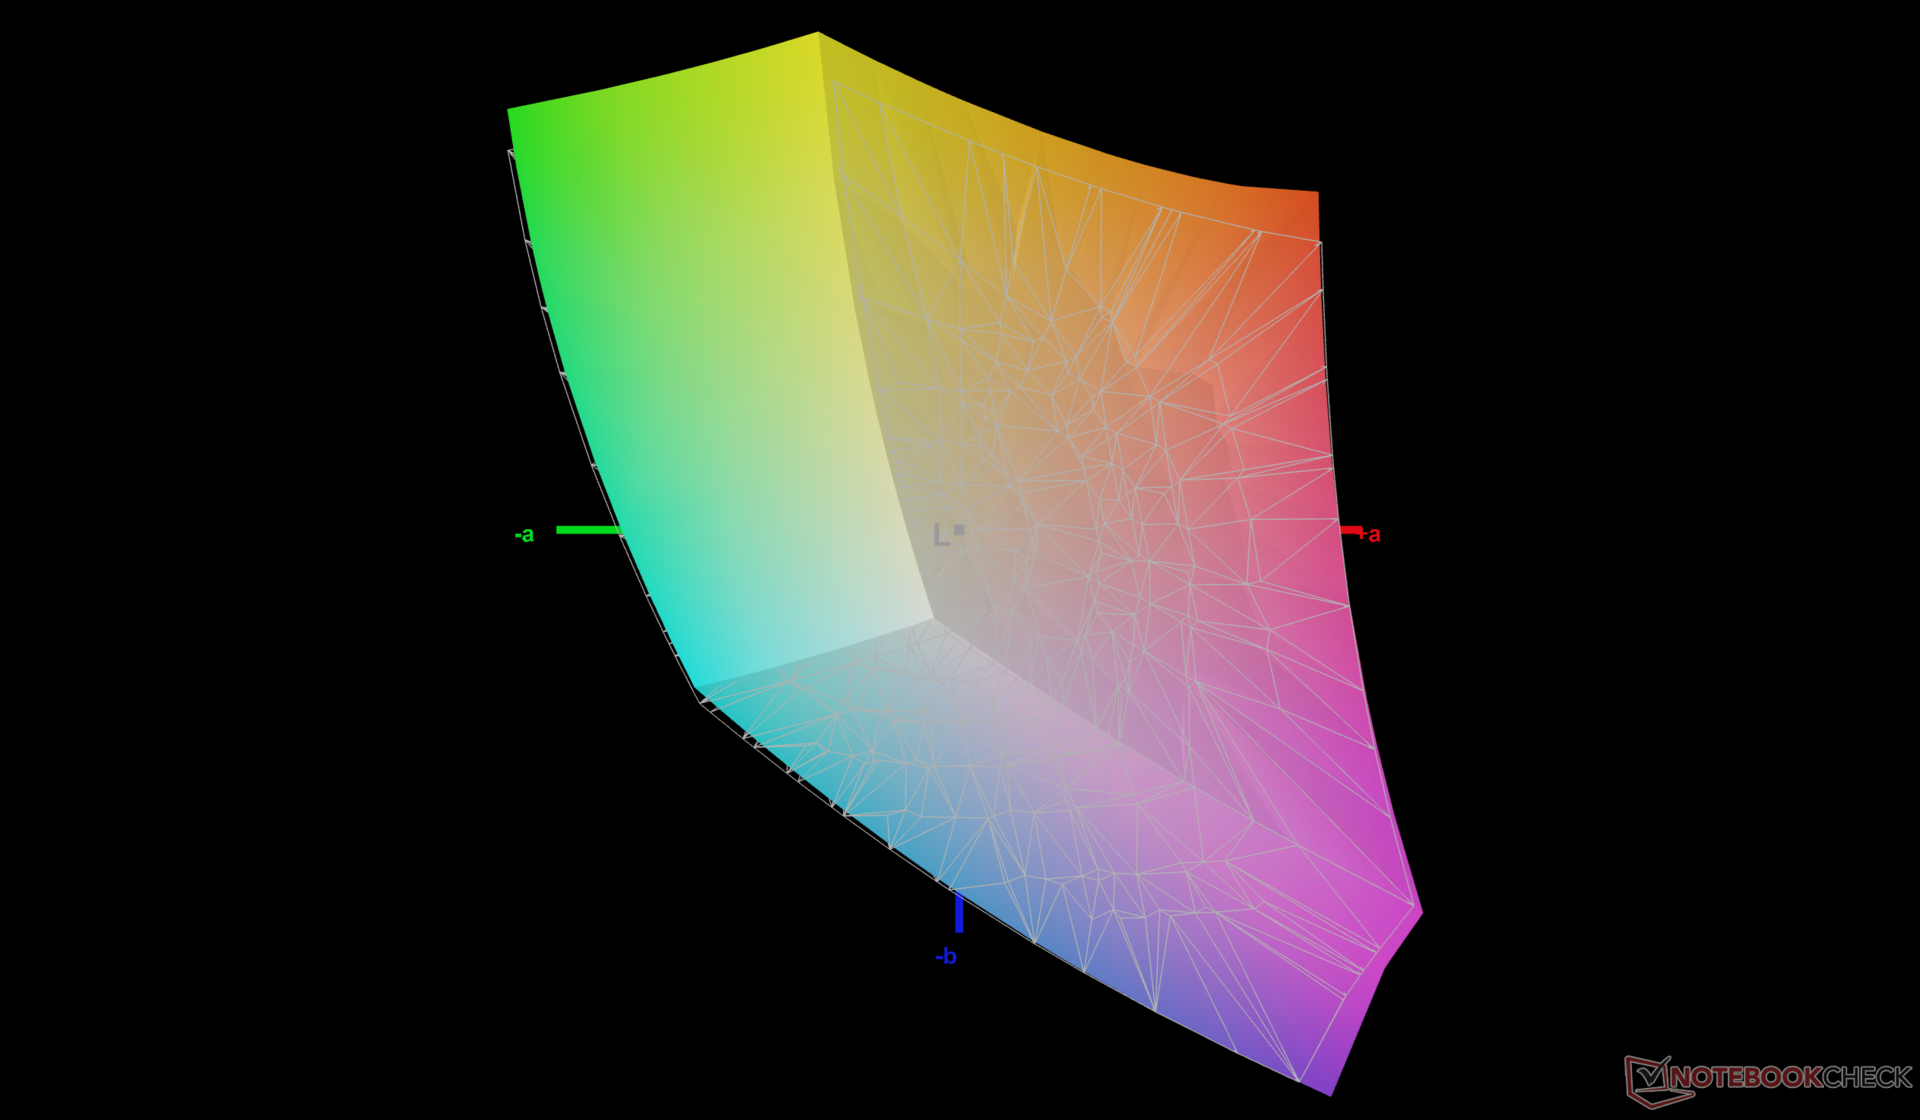
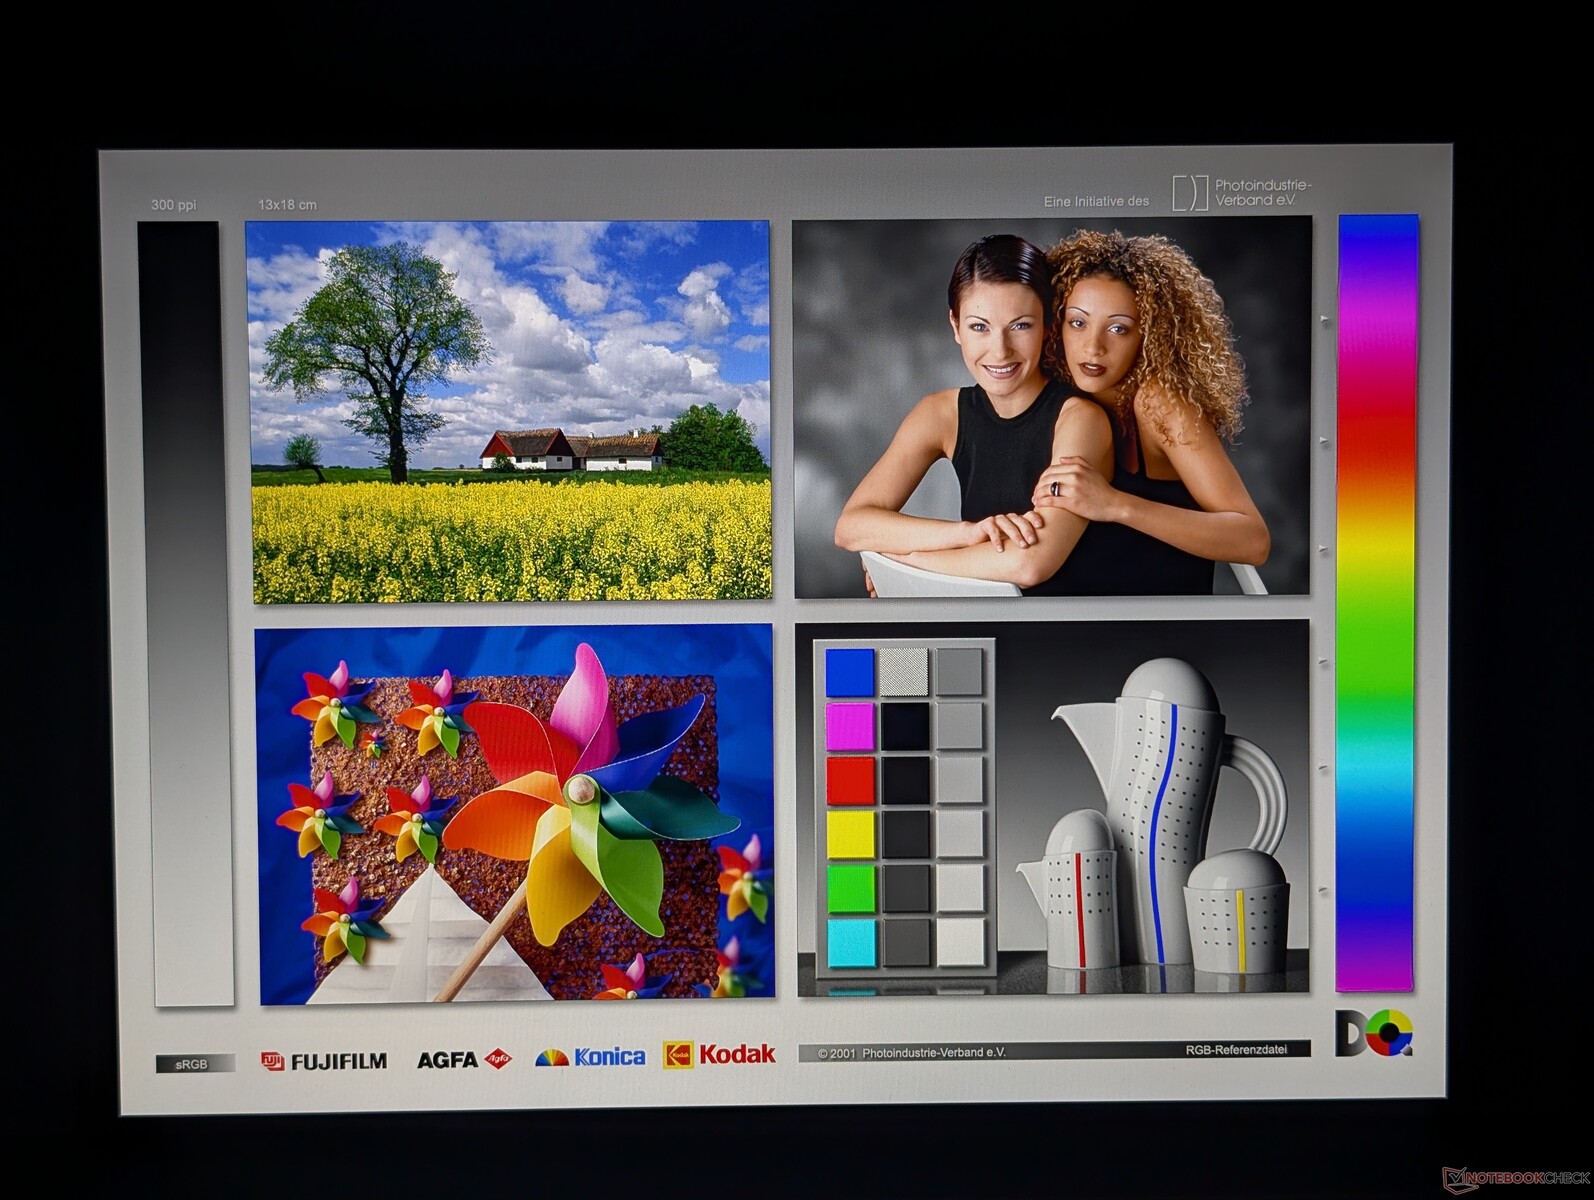
显示器开箱即进行了良好的校准,灰度和色彩 deltaE 平均值相对较低,分别仅为 2.6 和 2.29。
Display Response Times
| ↔ Response Time Black to White | ||
|---|---|---|
| 22.6 ms ... rise ↗ and fall ↘ combined | ↗ 9.7 ms rise | 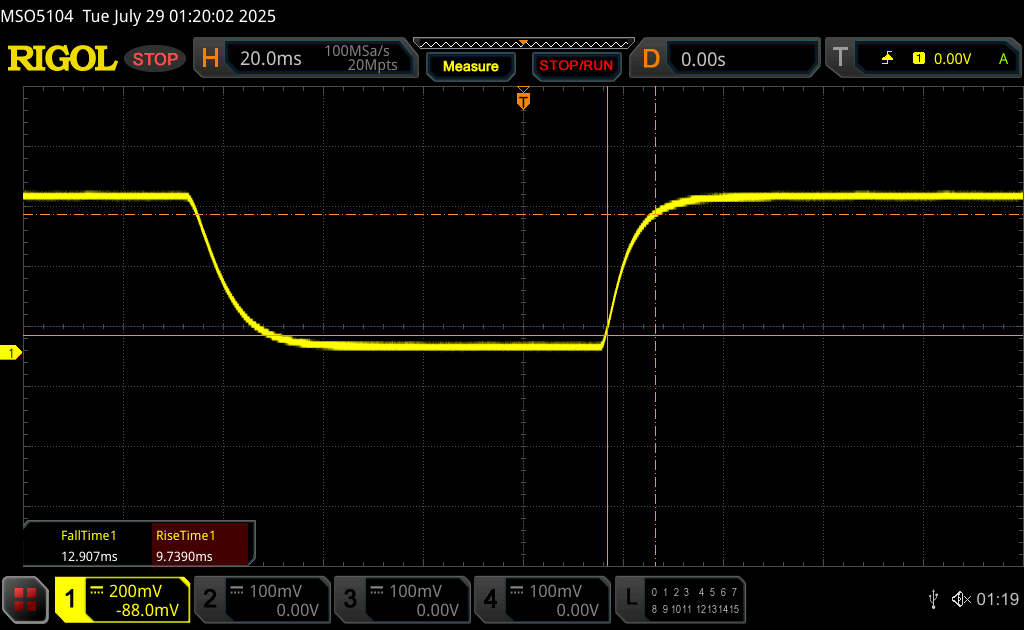 |
| ↘ 12.9 ms fall | ||
| The screen shows good response rates in our tests, but may be too slow for competitive gamers. In comparison, all tested devices range from 0.1 (minimum) to 240 (maximum) ms. » 51 % of all devices are better. This means that the measured response time is worse than the average of all tested devices (19.8 ms). | ||
| ↔ Response Time 50% Grey to 80% Grey | ||
| 37.5 ms ... rise ↗ and fall ↘ combined | ↗ 17.4 ms rise | 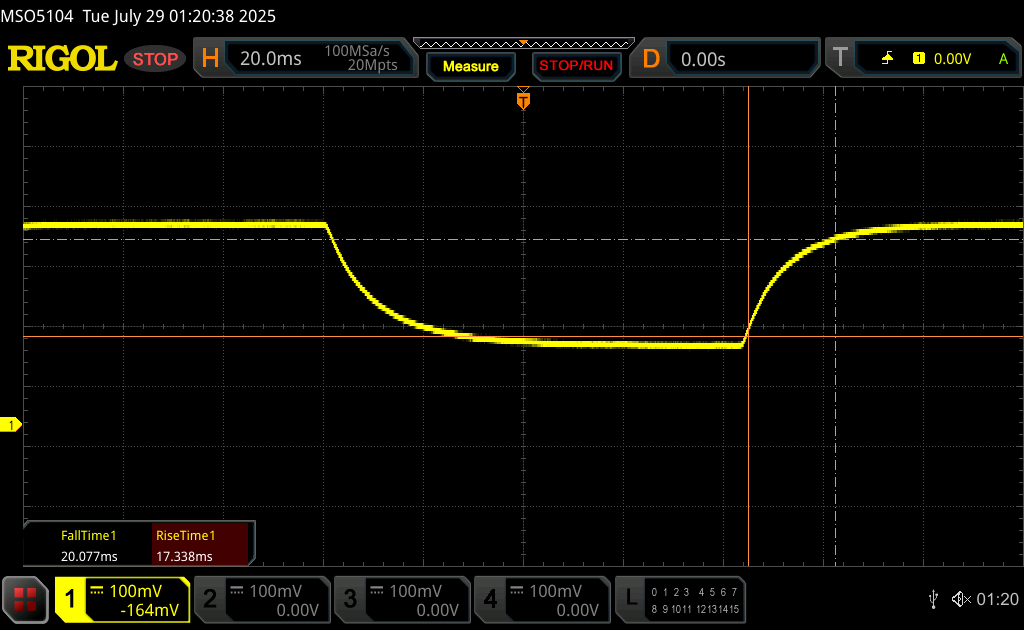 |
| ↘ 20.1 ms fall | ||
| The screen shows slow response rates in our tests and will be unsatisfactory for gamers. In comparison, all tested devices range from 0.165 (minimum) to 636 (maximum) ms. » 55 % of all devices are better. This means that the measured response time is worse than the average of all tested devices (30.9 ms). | ||
Screen Flickering / PWM (Pulse-Width Modulation)
| Screen flickering / PWM not detected | 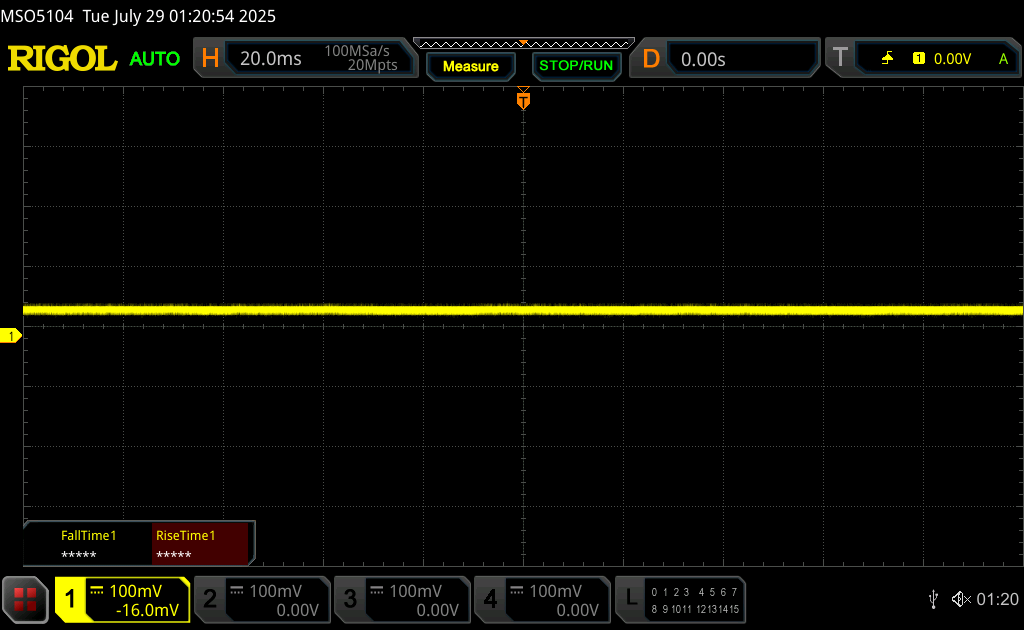 | ||
In comparison: 52 % of all tested devices do not use PWM to dim the display. If PWM was detected, an average of 7748 (minimum: 5 - maximum: 343500) Hz was measured. | |||
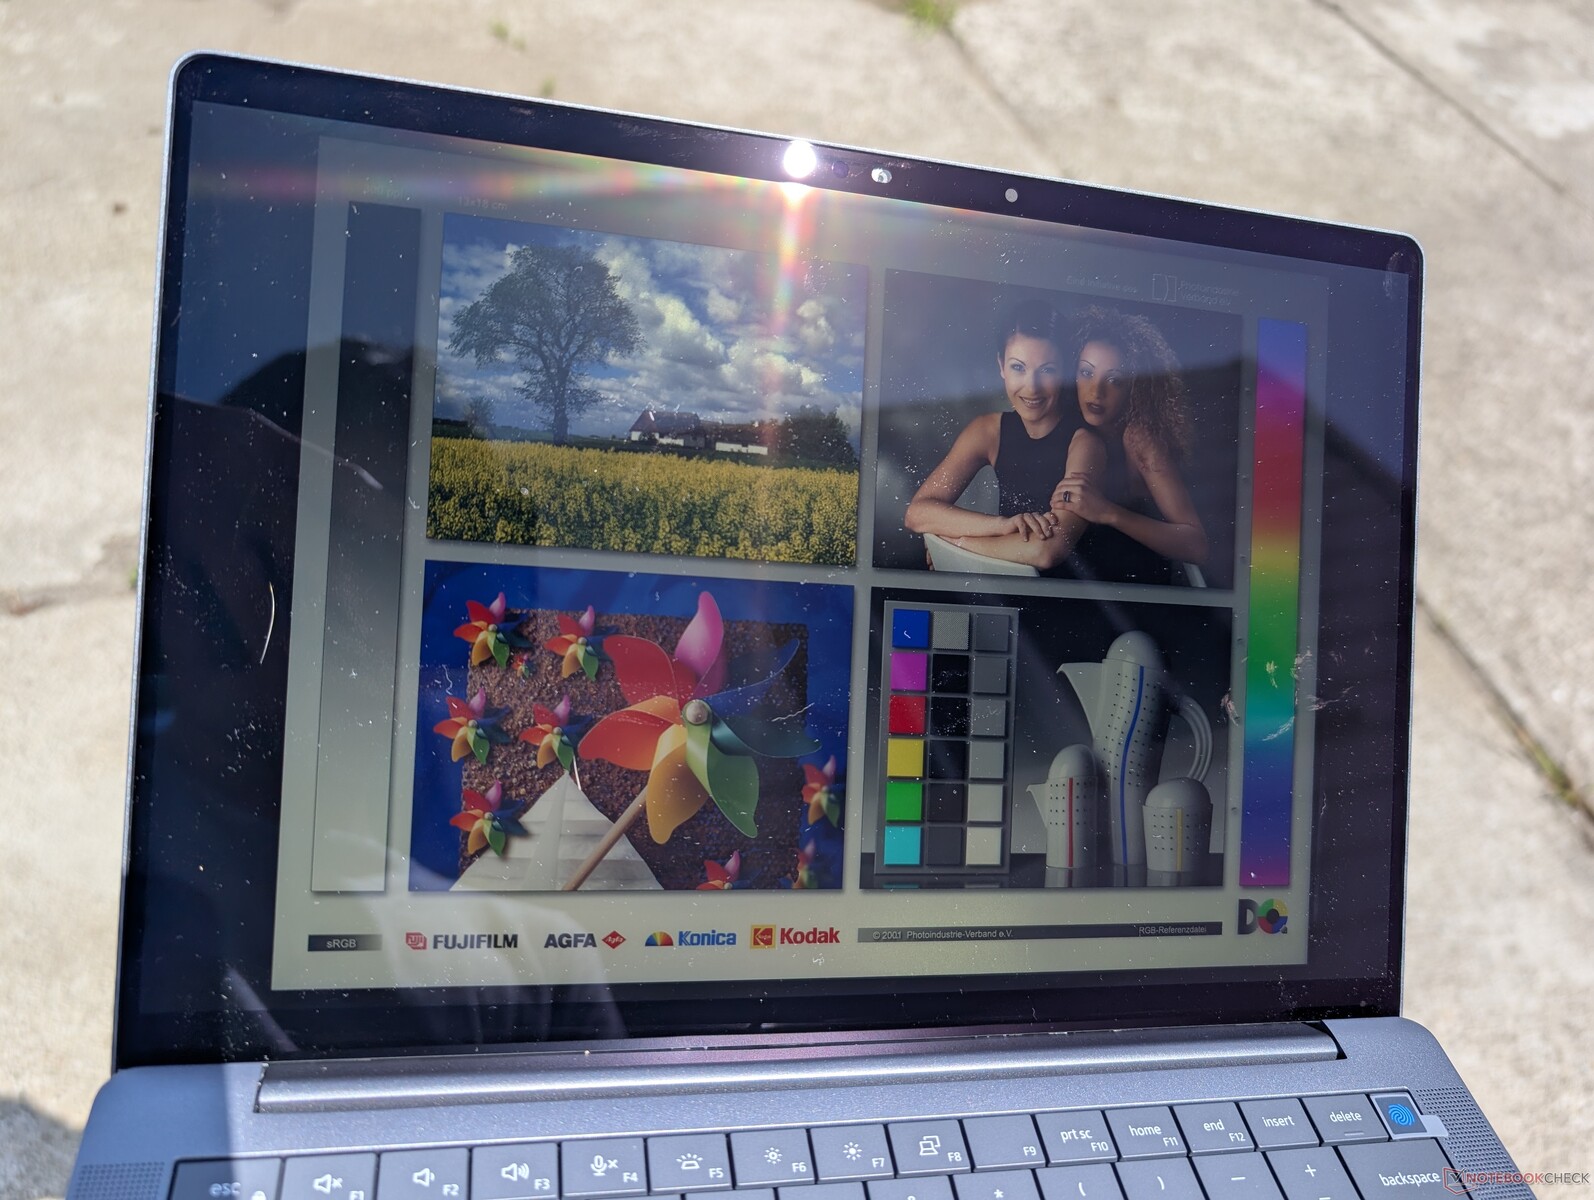
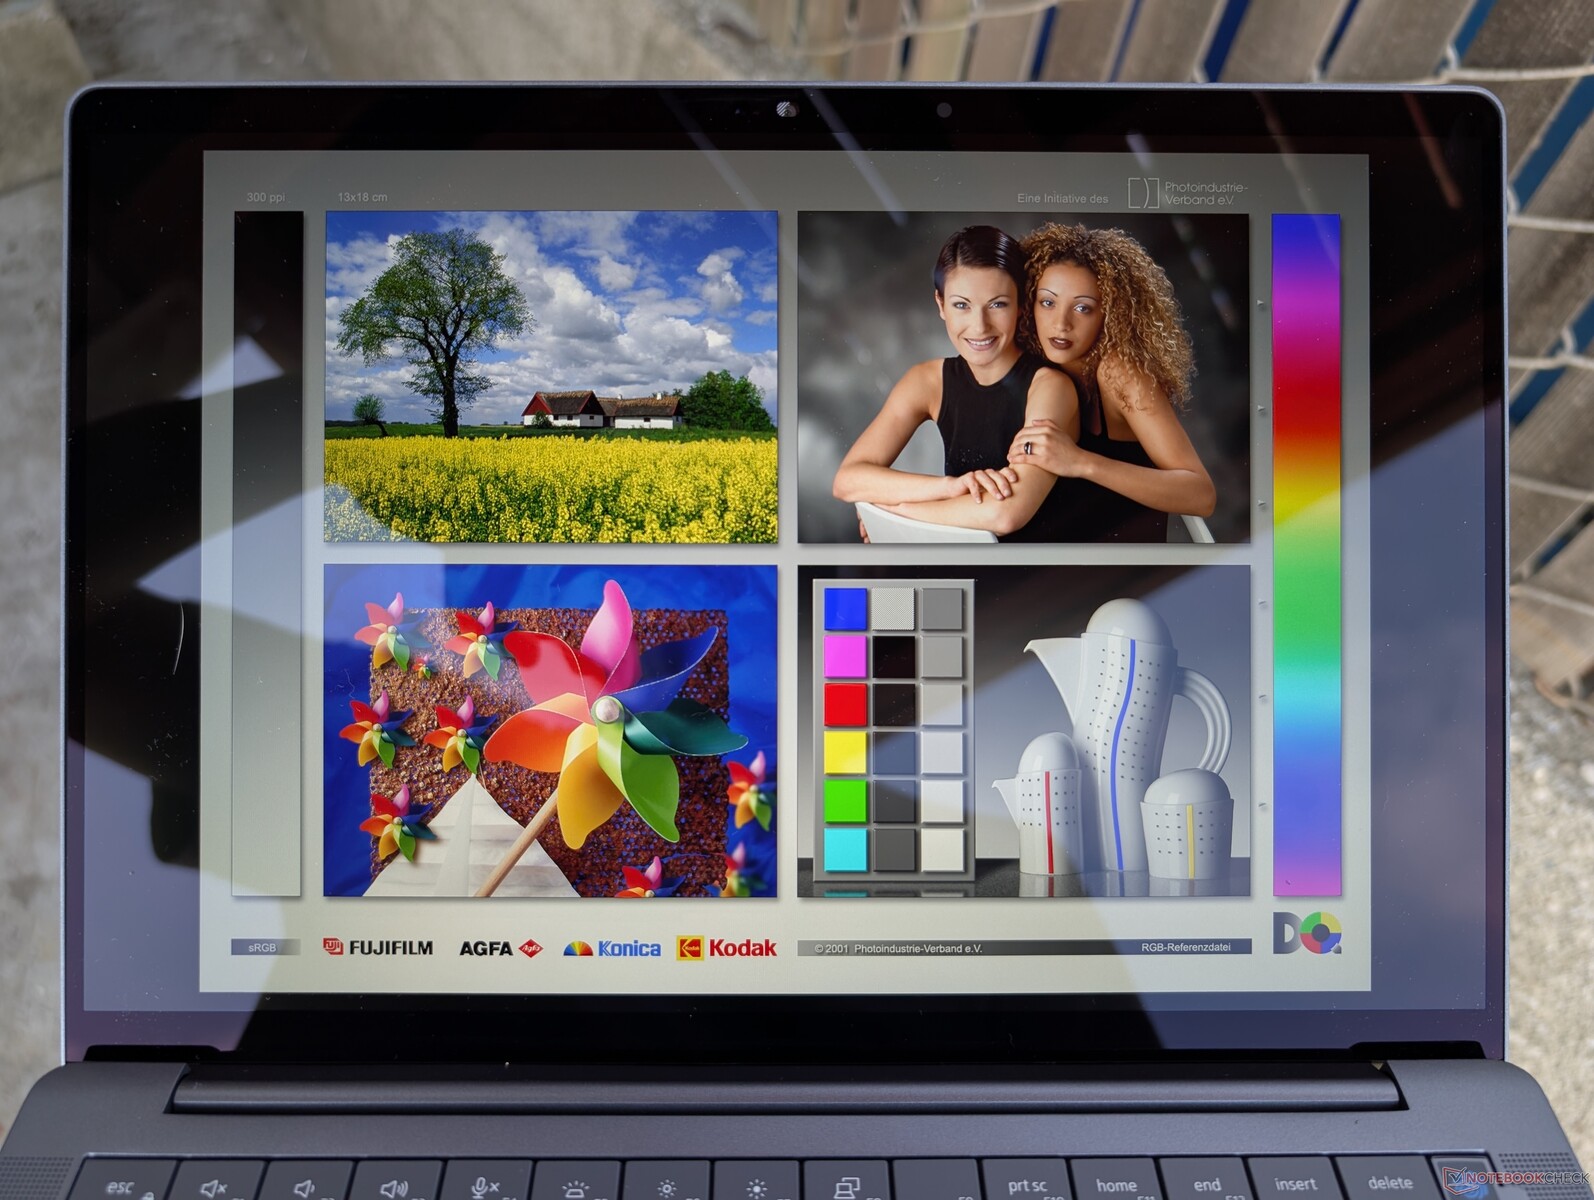
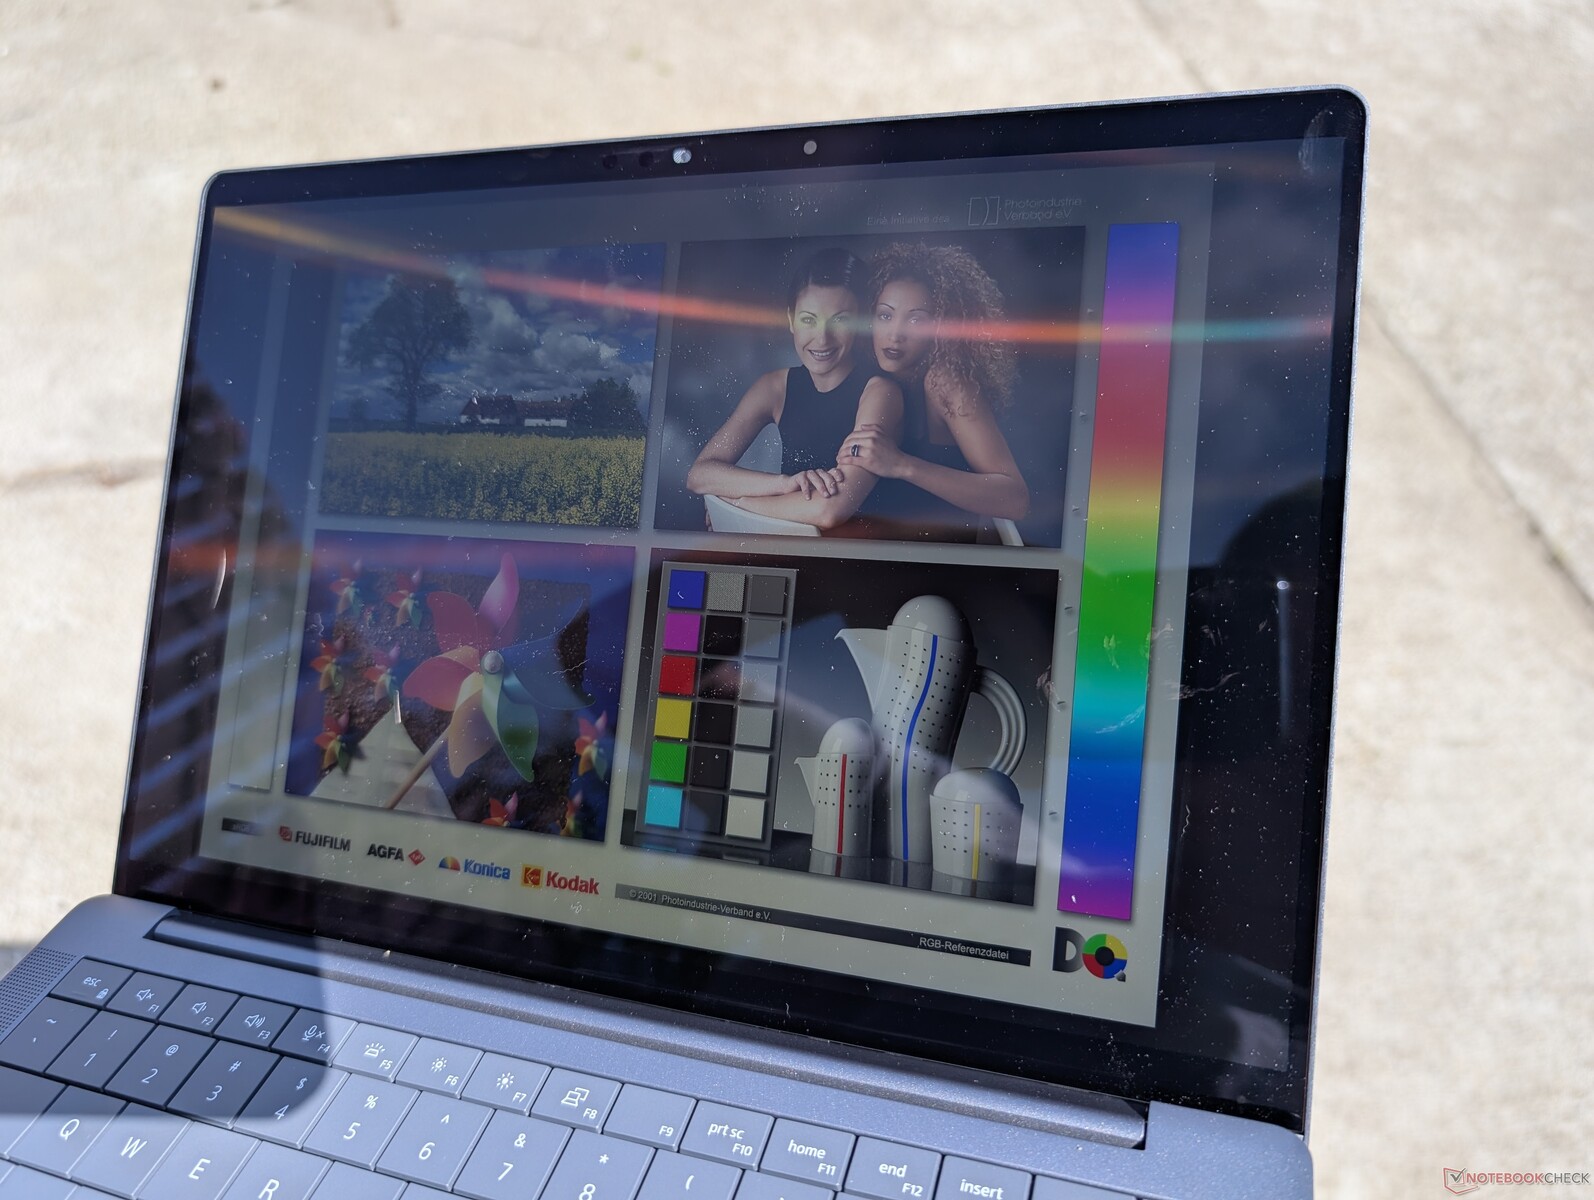
QHD+ 配置比 FHD+ 配置更亮,因此在大多数环境条件下眩光会更明显。显示屏的亮度可能略高,但不足以克服额外的眩光。


能源管理
耗电量
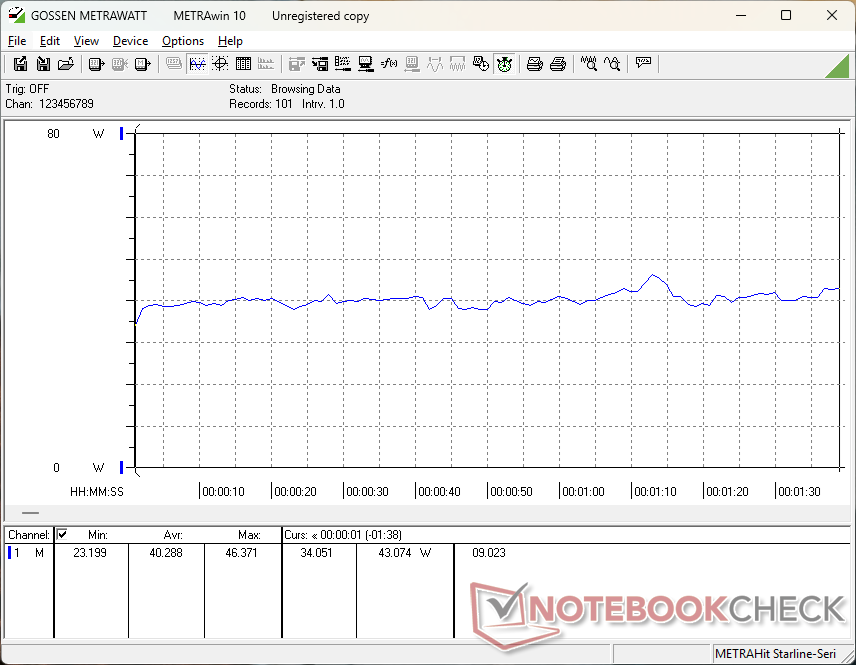
QHD+ 配置比 FHD+ 配置在桌面上空转时的功耗略高,这是意料之中的。不过,两者的差距微乎其微,最多只有几瓦。
| Off / Standby | |
| Idle | |
| Load |
|
Key:
min: | |
| Dell Pro 13 Premium 1600p Core Ultra 7 268V, Arc 140V, , IPS, 2560x1600, 13.3" | Dell Pro 13 Premium PA13250 Core Ultra 7 268V, Arc 140V, Micron 2550 1TB, IPS, 1920x1200, 13.3" | Framework Laptop 13.5 Ryzen AI 9 HX 370 Ryzen AI 9 HX 370, Radeon 890M, , IPS, 2880x1920, 13.5" | Microsoft Surface Pro OLED Lunar Lake Core Ultra 7 268V, Arc 140V, Kioxia BG6 KBG60ZNS1T02, OLED, 2880x1920, 13" | MSI Prestige 13 AI Plus Evo A2VMG Core Ultra 7 258V, Arc 140V, , OLED, 2880x1800, 13.3" | Lenovo ThinkPad X13 Gen 4 21J3001VGE R7 PRO 7840U, Radeon 780M, Samsung PM9B1 512GB MZVL4512HBLU, IPS LED, 1920x1200, 13.3" | HP EliteBook x360 830 G10 7L7U1ET i5-1335U, Iris Xe G7 80EUs, Samsung PM991 MZVLQ512HBLU, IPS LED, 1920x1200, 13.3" | |
|---|---|---|---|---|---|---|---|
| Power Consumption | 4% | -87% | -17% | -31% | -3% | -28% | |
| Idle Minimum * (Watt) | 2.4 | 2 17% | 7.6 -217% | 4.5 -88% | 3.5 -46% | 3 -25% | 4.5 -88% |
| Idle Average * (Watt) | 4.8 | 4.3 10% | 11.3 -135% | 6 -25% | 5.9 -23% | 5.2 -8% | 6 -25% |
| Idle Maximum * (Watt) | 5.5 | 4.75 14% | 11.5 -109% | 6.7 -22% | 10 -82% | 6.5 -18% | 6.5 -18% |
| Load Average * (Watt) | 40.3 | 40 1% | 54.7 -36% | 34.9 13% | 38.7 4% | 27 33% | 36.7 9% |
| Cyberpunk 2077 ultra external monitor * (Watt) | 34 | 38 -12% | 51.3 -51% | 39 -15% | 45.6 -34% | 36.8 -8% | |
| Cyberpunk 2077 ultra * (Watt) | 36.3 | 36.4 -0% | 54.6 -50% | 39.4 -9% | 46.3 -28% | 37.6 -4% | |
| Load Maximum * (Watt) | 55.7 | 57 -2% | 60.9 -9% | 41.6 25% | 61.5 -10% | 52.3 6% | 66.3 -19% |
| Witcher 3 ultra * (Watt) | 40.2 |
* ... smaller is better
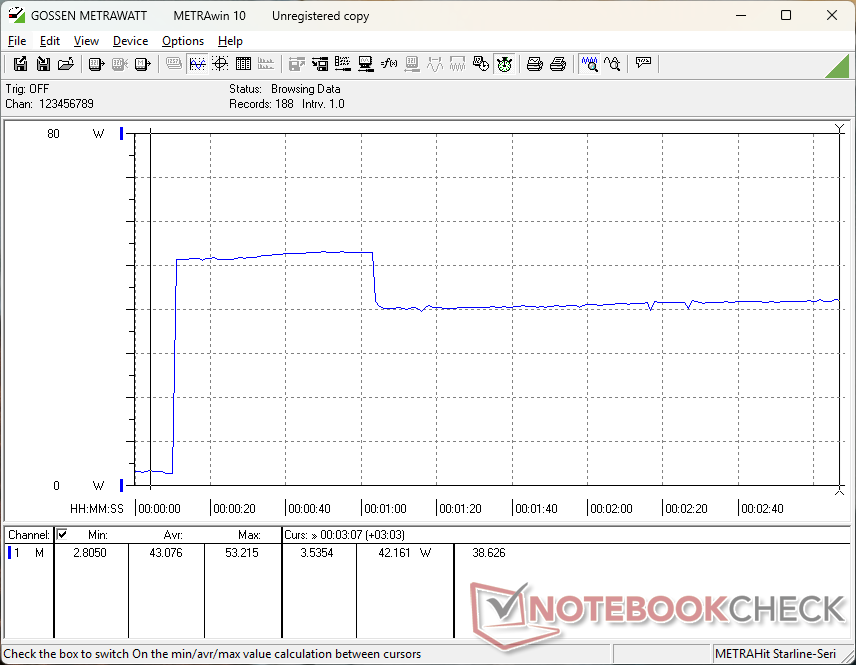
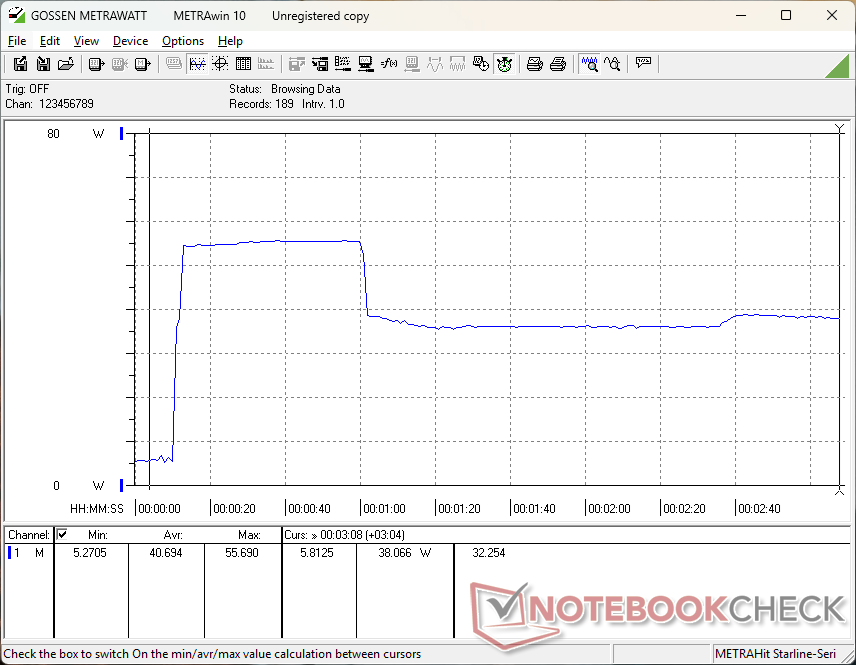
Power Consumption Cyberpunk / Stress Test
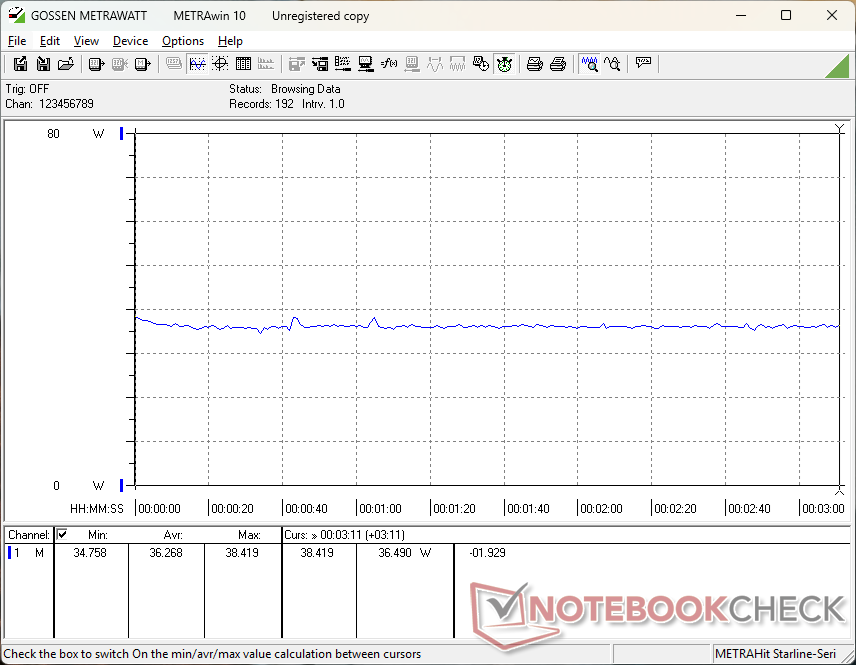
Power Consumption external Monitor
电池寿命
| Dell Pro 13 Premium 1600p Core Ultra 7 268V, Arc 140V, 60 Wh | Dell Pro 13 Premium PA13250 Core Ultra 7 268V, Arc 140V, 60 Wh | Framework Laptop 13.5 Ryzen AI 9 HX 370 Ryzen AI 9 HX 370, Radeon 890M, 61 Wh | Microsoft Surface Pro OLED Lunar Lake Core Ultra 7 268V, Arc 140V, 53 Wh | MSI Prestige 13 AI Plus Evo A2VMG Core Ultra 7 258V, Arc 140V, 75 Wh | Lenovo ThinkPad X13 Gen 4 21J3001VGE R7 PRO 7840U, Radeon 780M, 54.7 Wh | HP EliteBook x360 830 G10 7L7U1ET i5-1335U, Iris Xe G7 80EUs, 51.3 Wh | |
|---|---|---|---|---|---|---|---|
| Battery runtime | 40% | -53% | -35% | -22% | -41% | -46% | |
| WiFi v1.3 (h) | 17.1 | 24 40% | 8 -53% | 11.1 -35% | 13.4 -22% | 10.1 -41% | 9.2 -46% |
| H.264 (h) | 23.8 | 14.6 | |||||
| Load (h) | 2.8 | 1.6 | 1.9 |
潜在竞争对手比较
Transparency
The selection of devices to be reviewed is made by our editorial team. The test sample was provided to the author as a loan by the manufacturer or retailer for the purpose of this review. The lender had no influence on this review, nor did the manufacturer receive a copy of this review before publication. There was no obligation to publish this review. As an independent media company, Notebookcheck is not subjected to the authority of manufacturers, retailers or publishers.
This is how Notebookcheck is testing
Every year, Notebookcheck independently reviews hundreds of laptops and smartphones using standardized procedures to ensure that all results are comparable. We have continuously developed our test methods for around 20 years and set industry standards in the process. In our test labs, high-quality measuring equipment is utilized by experienced technicians and editors. These tests involve a multi-stage validation process. Our complex rating system is based on hundreds of well-founded measurements and benchmarks, which maintains objectivity. Further information on our test methods can be found here.

