Notebookcheck Logo

TheWitcher 3 v4.00:笔记本和台式机基准测试

现在有了 "光线追踪"。 尽管这款旗舰角色扮演游戏已经存在了几年,但开发者并没有错过在补丁过程中增加各种新(图形)功能的机会。我们用目前的版本测试了几个桌面和笔记本的GPU--包括RT基准测试。
Gaming Laptop / Notebook Desktop Gamecheck
ǞǞǞWitcher 3

技术

Witcher 3 ,几年来不仅是我们笔记本测试中的标准基准之一,而且还被用来检查长期的3D性能。然而,由于开发者CD项目--如一开始所提到的--随着时间的推移已经纳入了许多技术创新,我们认为改用当前版本是合适的。
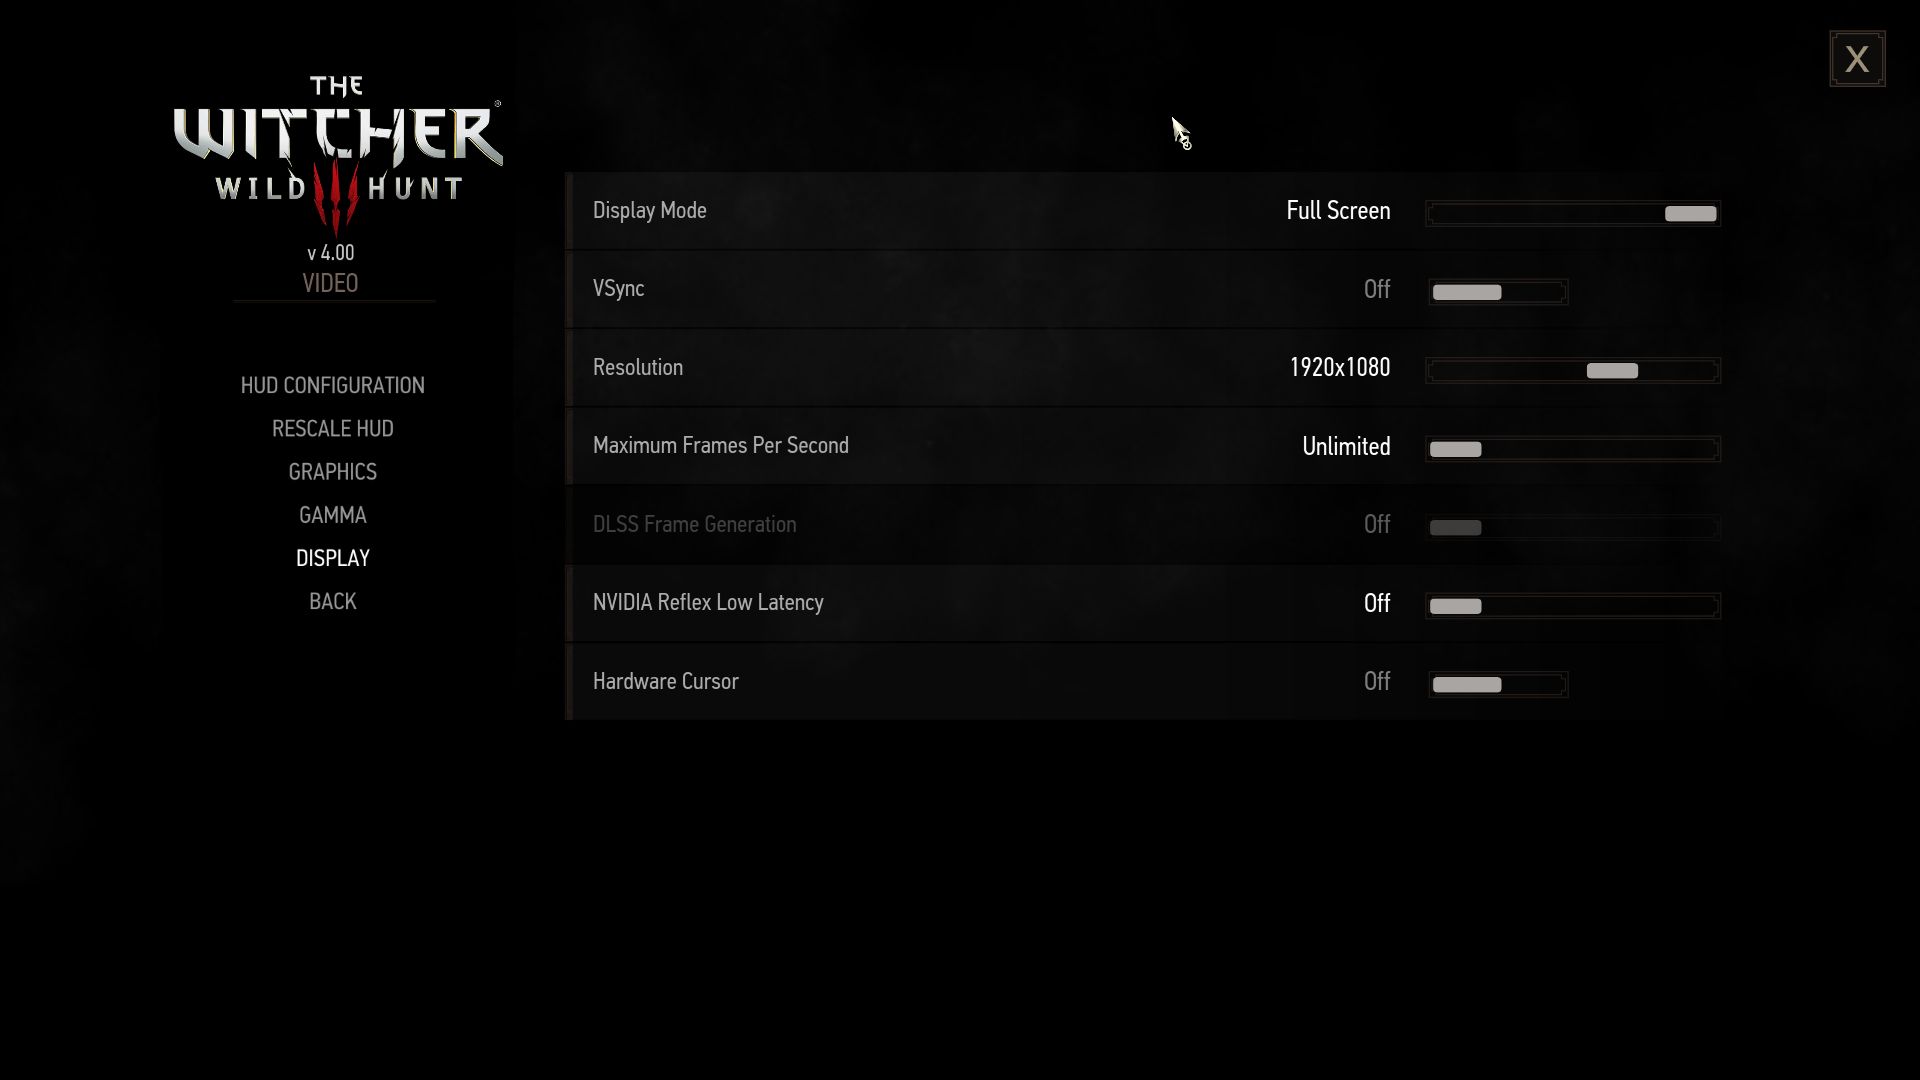
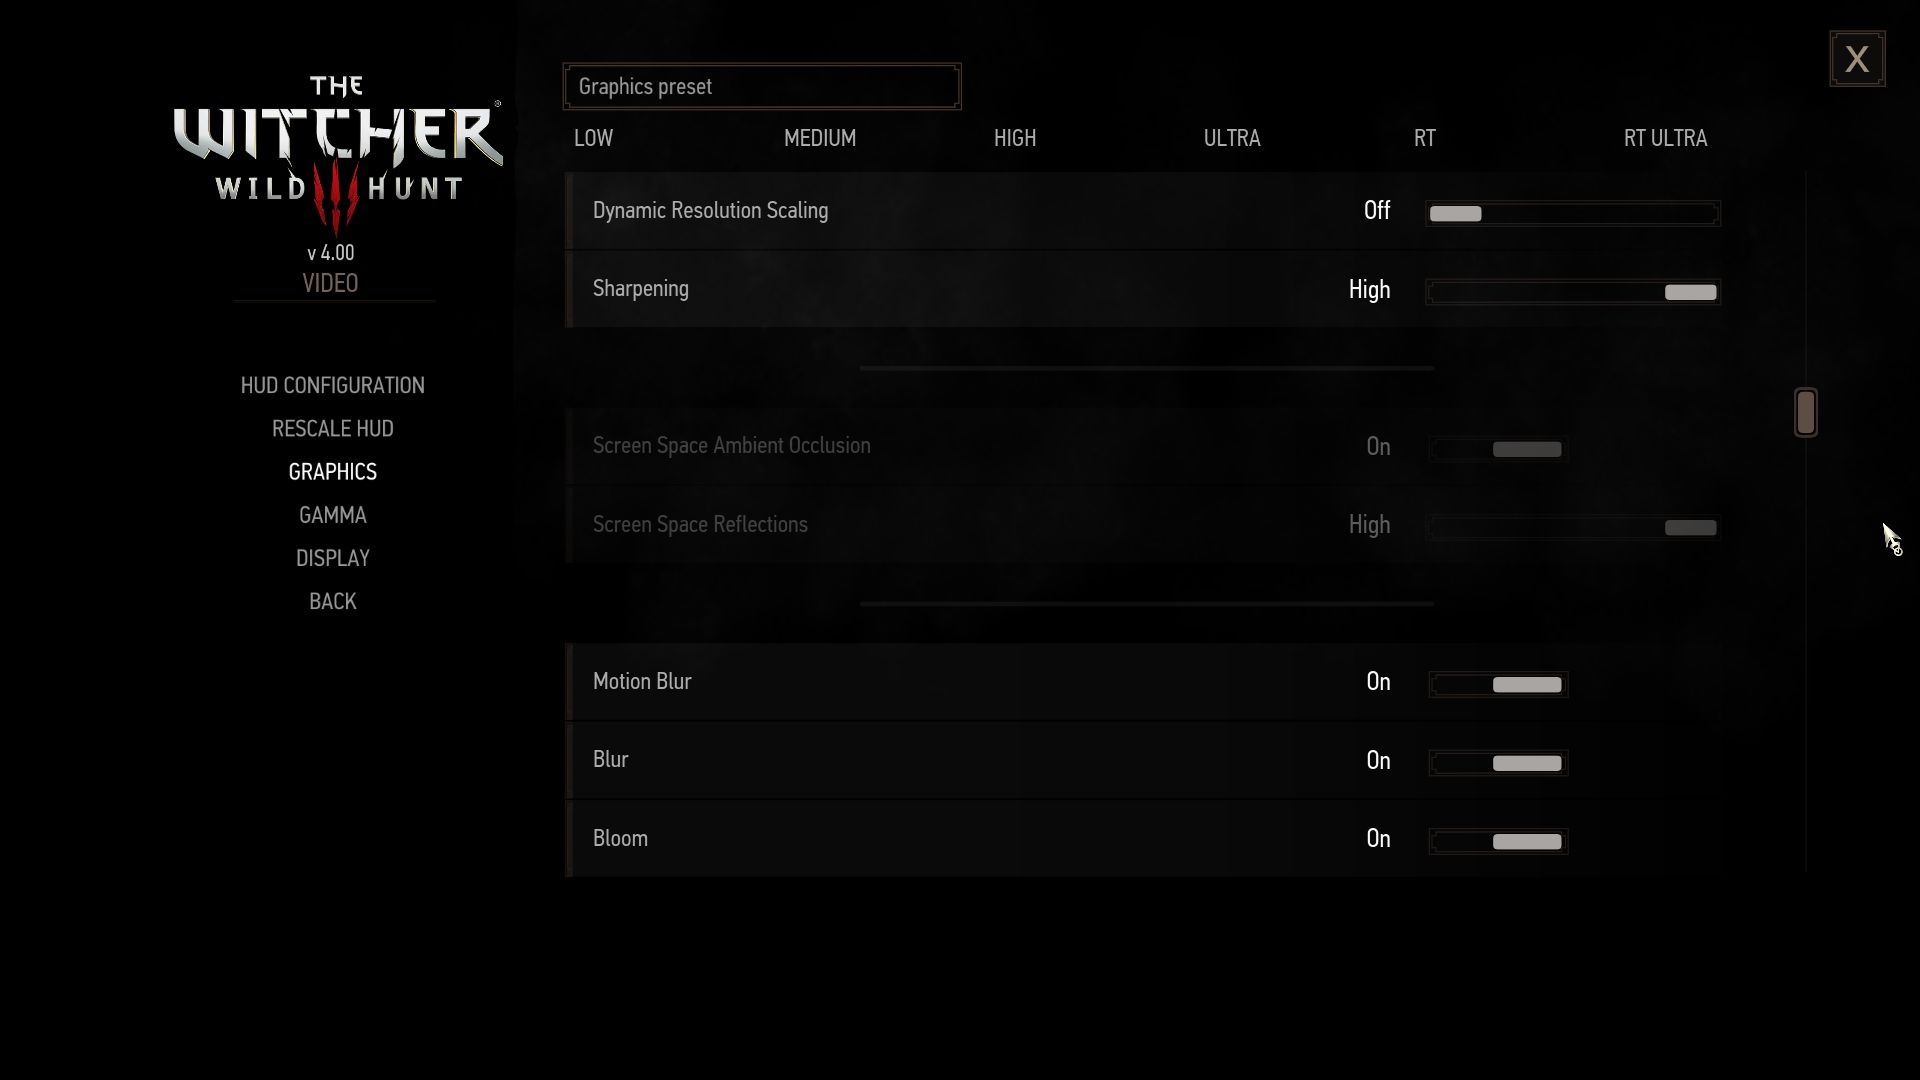
ǞǞǞWitcher 3
ǞǞǞWitcher 3
ǞǞǞWitcher 3
ǞǞǞWitcher 3
ǞǞǞWitcher 3
ǞǞǞWitcher 3

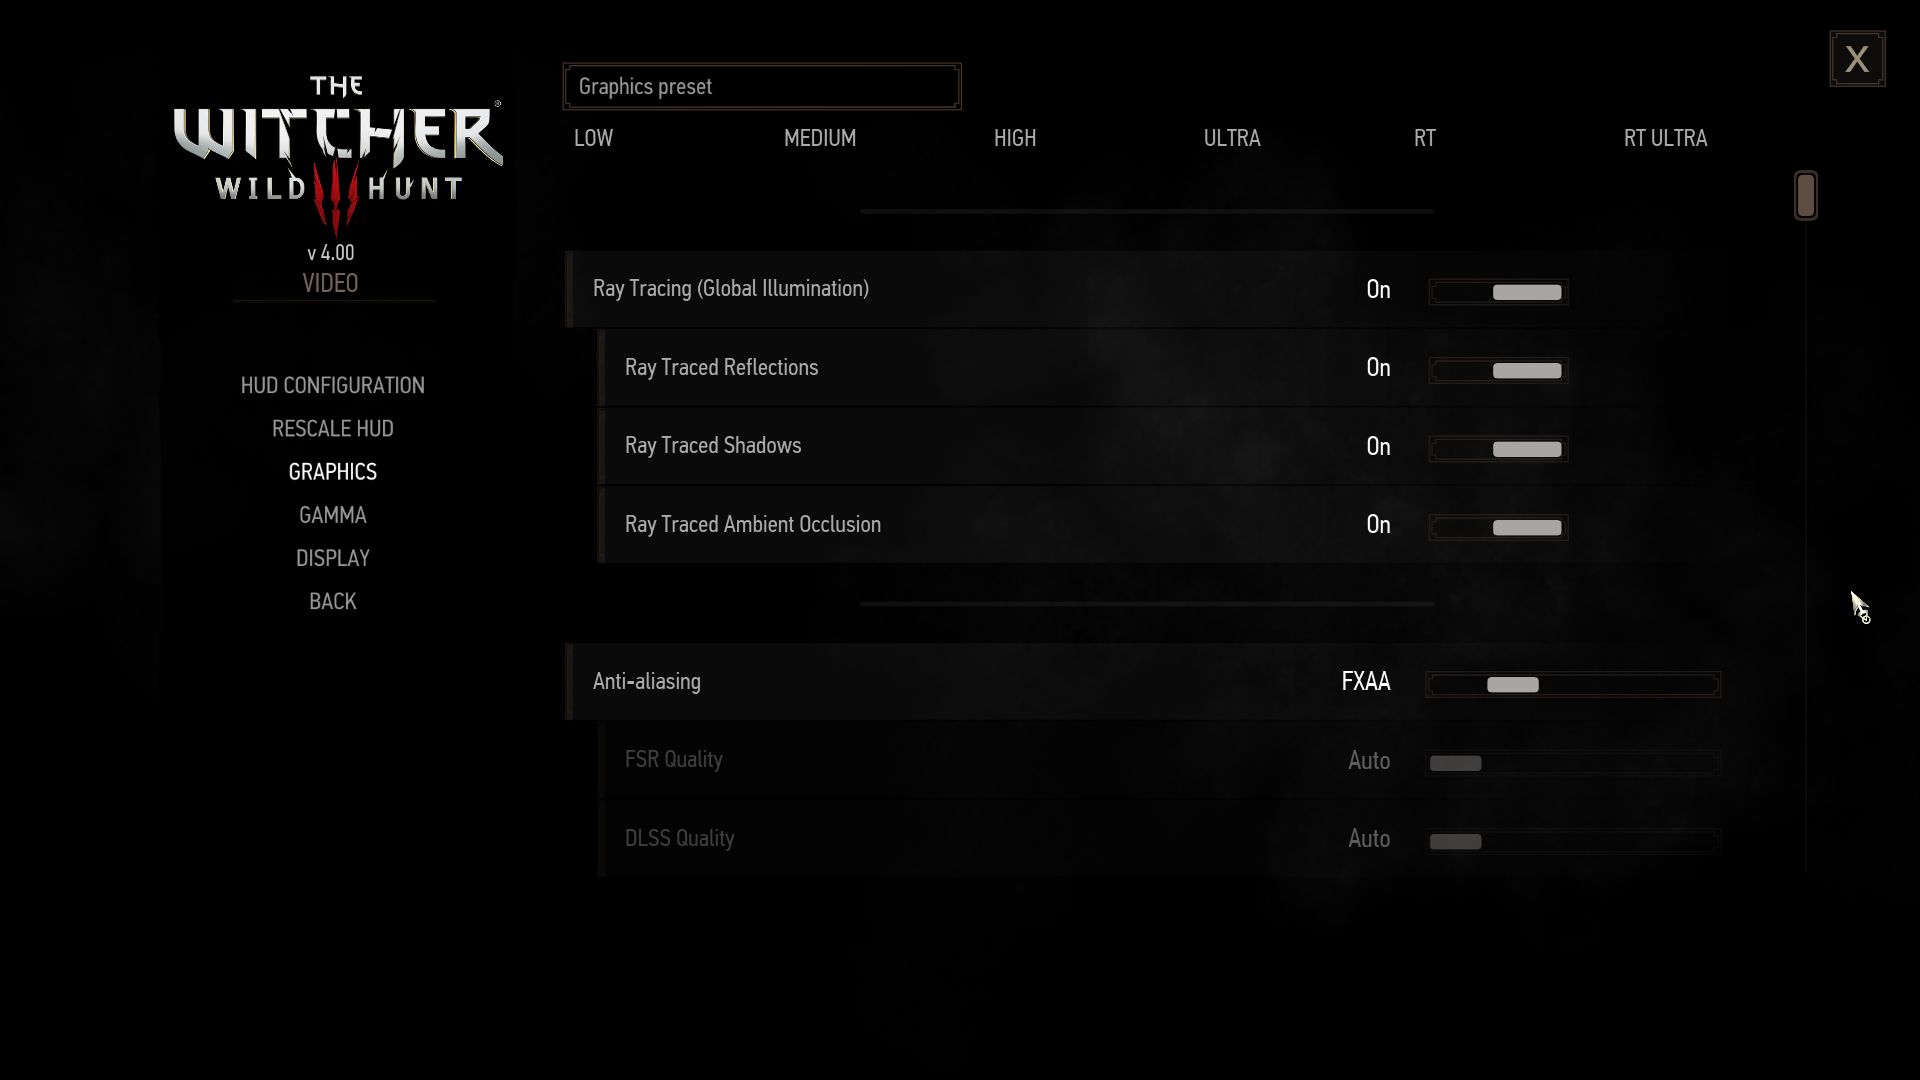
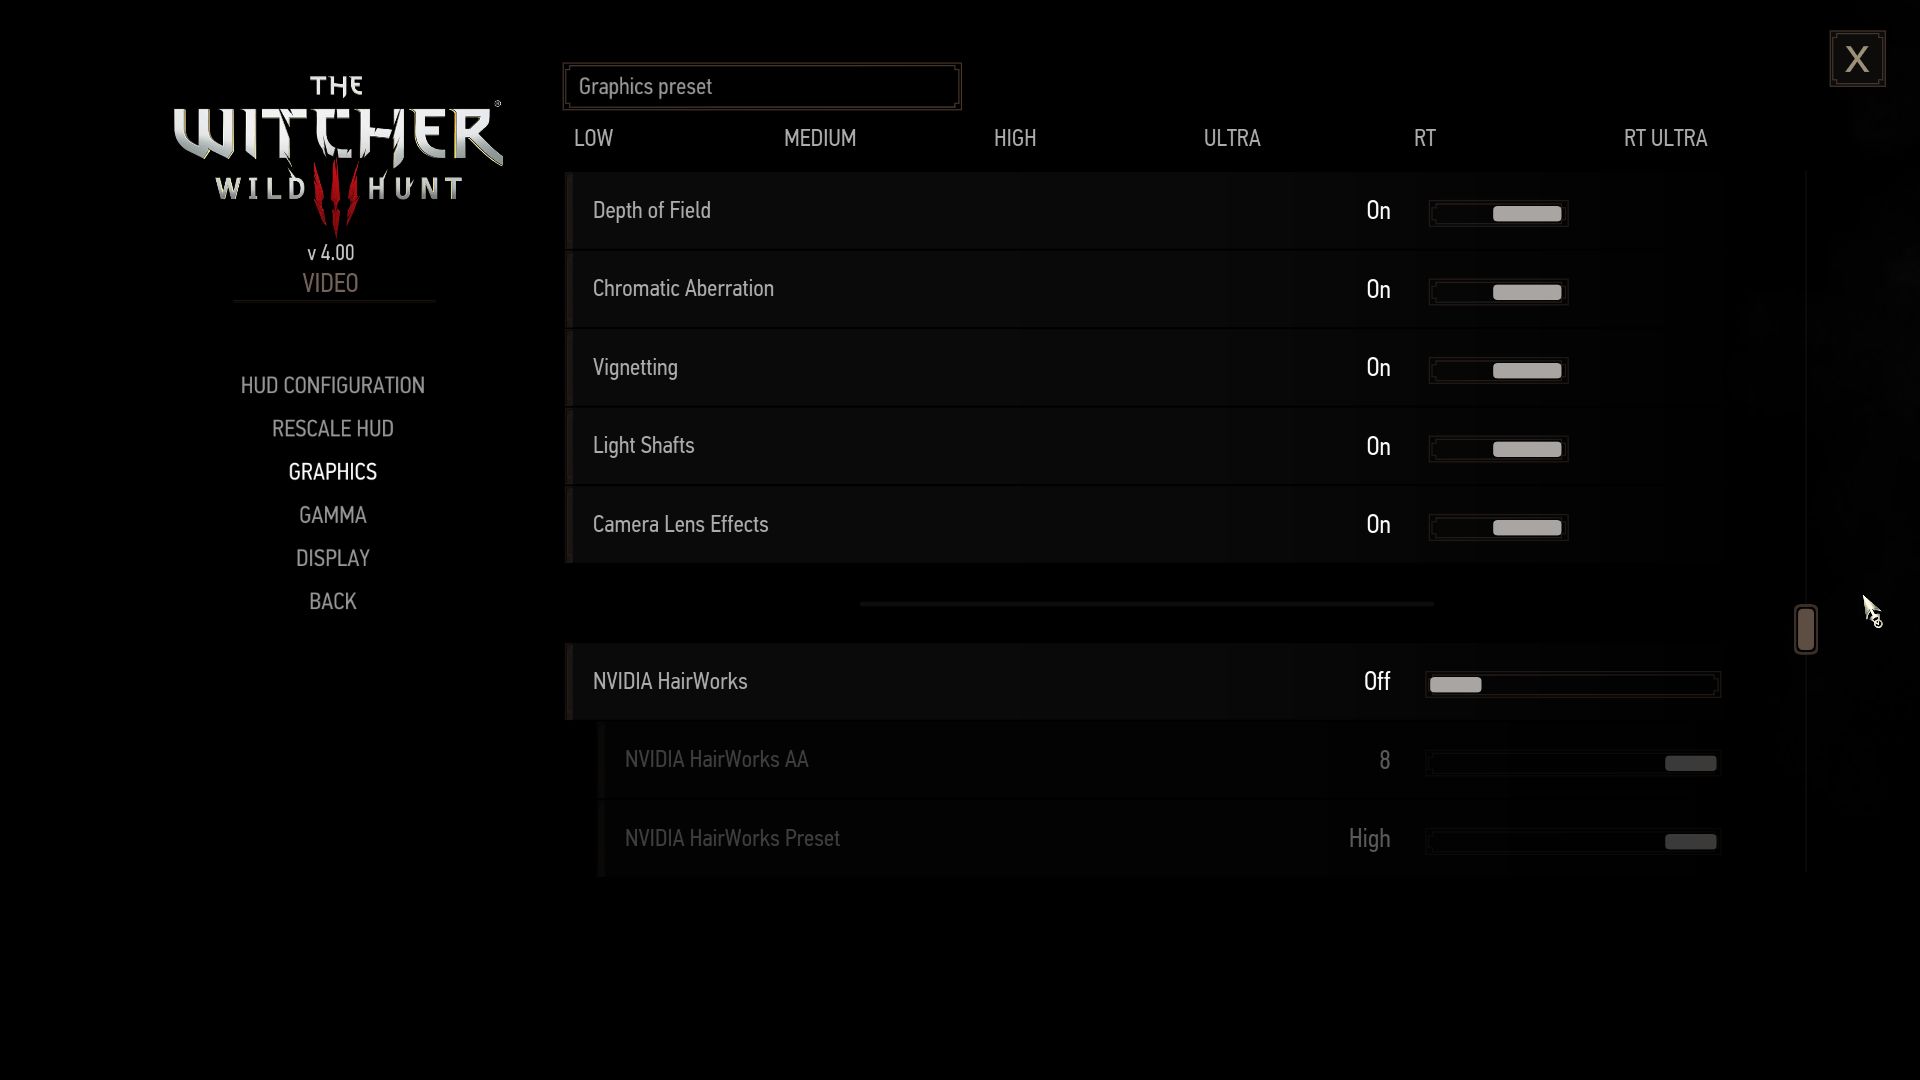
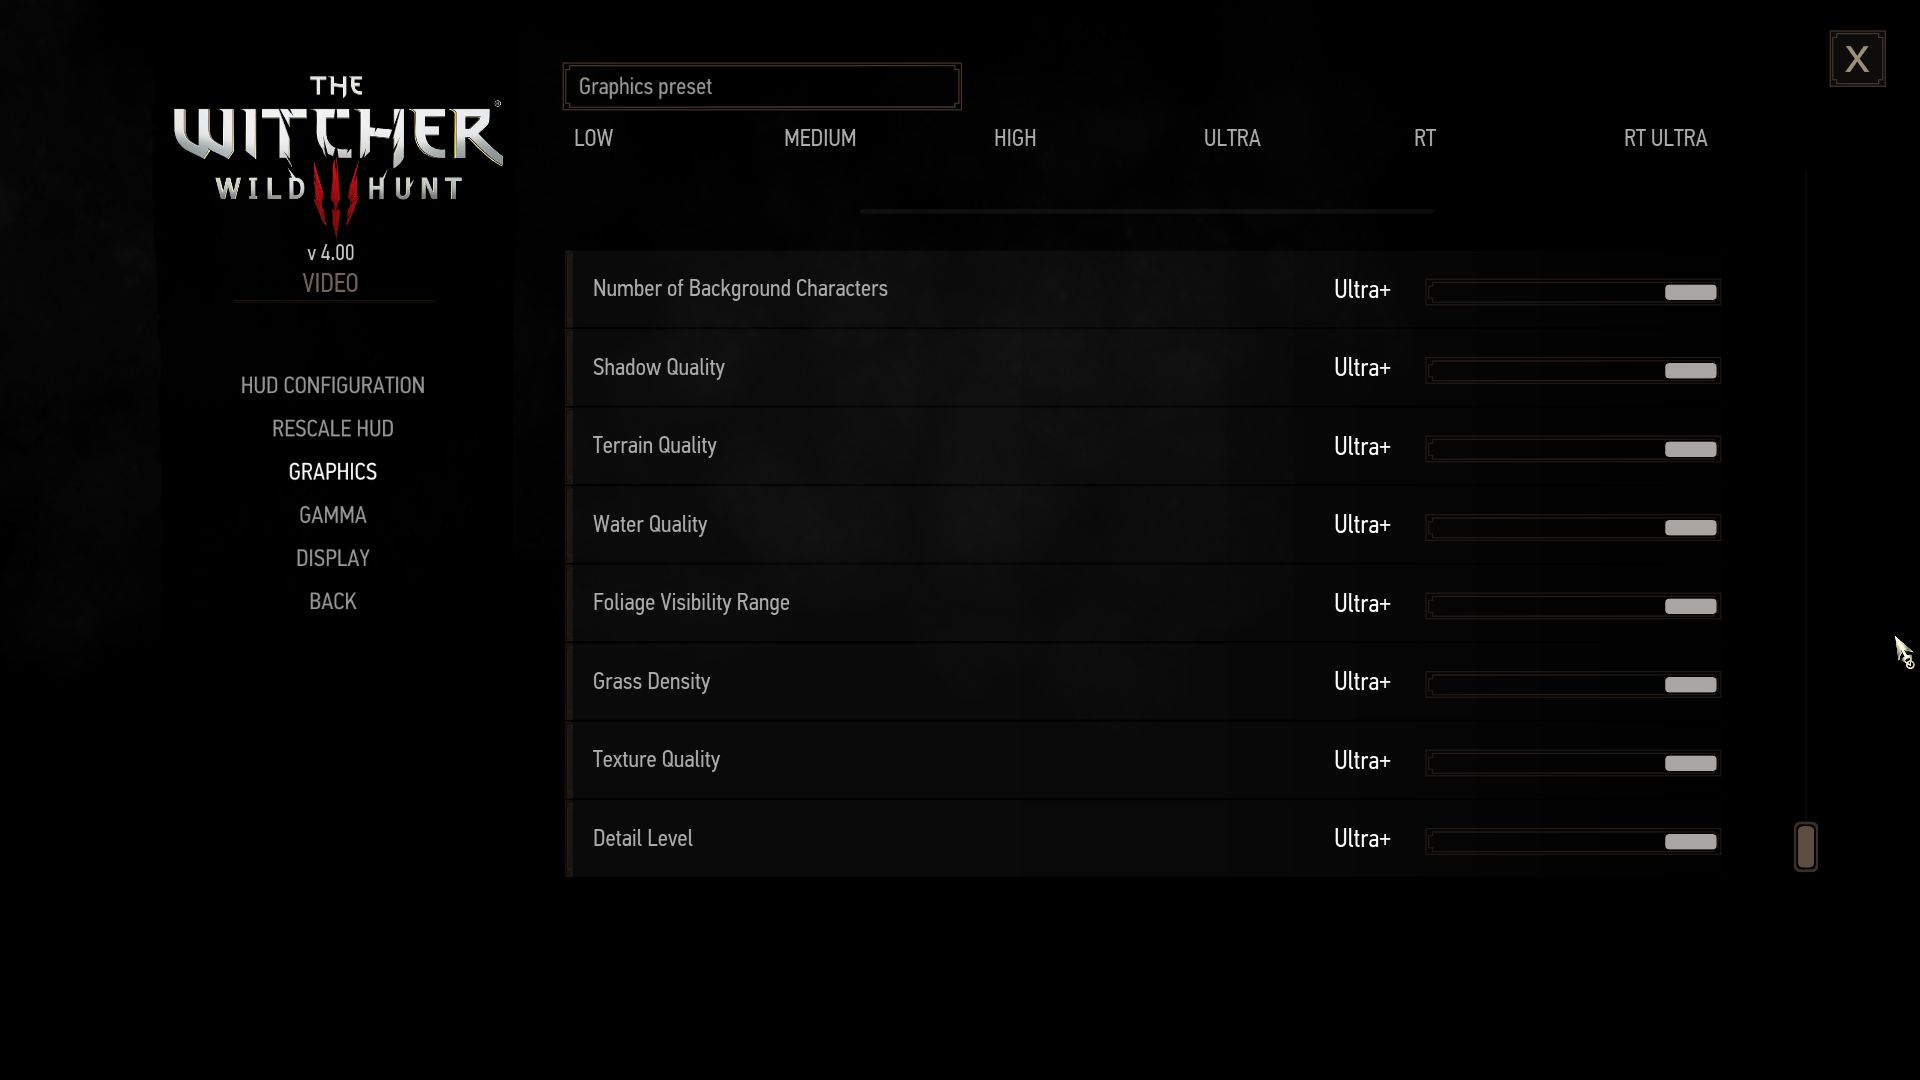
此外,现在有许多新鲜的设置,特别是针对光线追踪的设置,开发者专门为其设置了两个预设。普通的RT预设只激活了光线追踪照明,而RT Ultra预设(用于光线追踪基准)还包括相应的反射、阴影和环境遮挡。此外,还有对DLSS和FSR 2的支持。

ǞǞǞWitcher 3
ǞǞǞWitcher 3
ǞǞǞWitcher 3
ǞǞǞWitcher 3
ǞǞǞWitcher 3
ǞǞǞWitcher 3

另一方面,有点遗憾的是,你又一次不得不对个别设置不作解释,有些选项不受预设的影响,而且由于功能太多,有很多滚动的地方。另一方面,更改后无需重新启动即可应用。自我们的参考版本以来,游戏的大小已经从不到30GB增加到40GB左右,这仍然是在限制范围之内。

ǞǞǞWitcher 3
ǞǞǞWitcher 3
ǞǞǞWitcher 3
ǞǞǞWitcher 3
ǞǞǞWitcher 3
 

基准

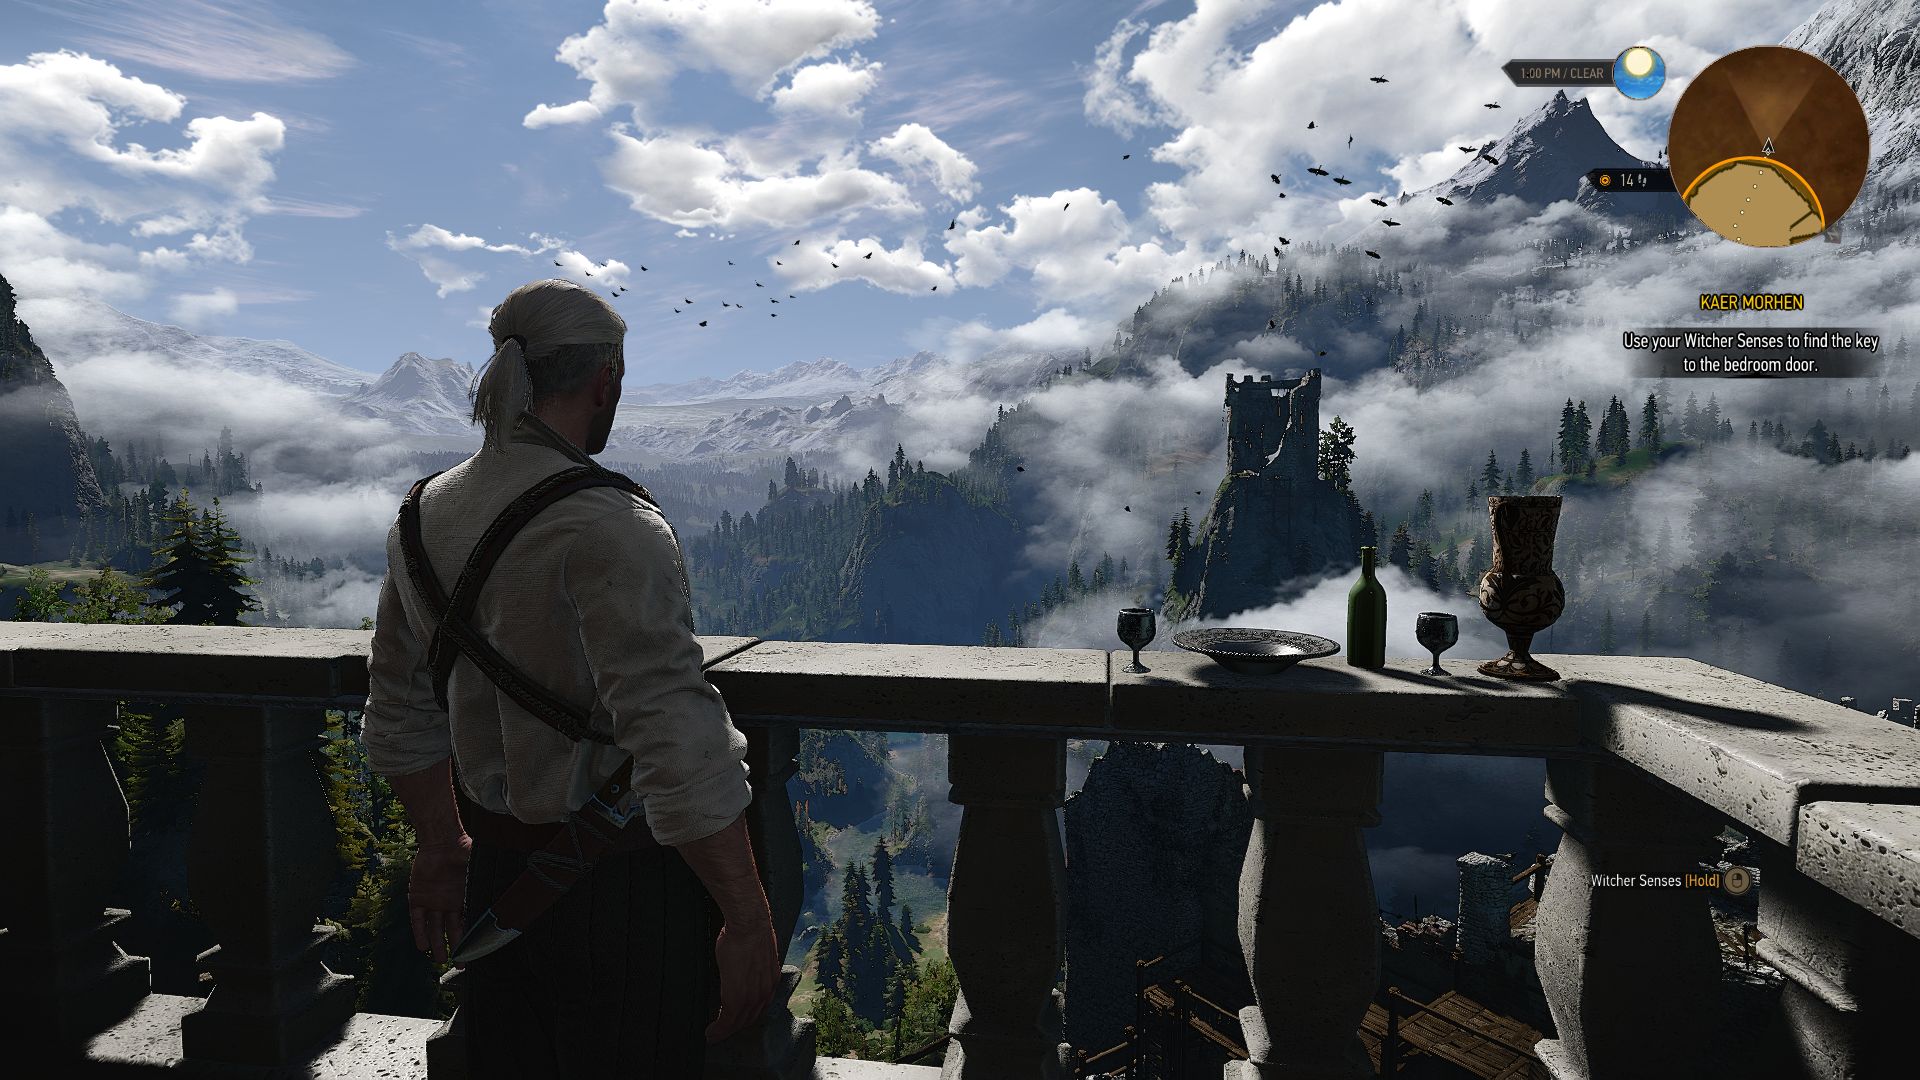
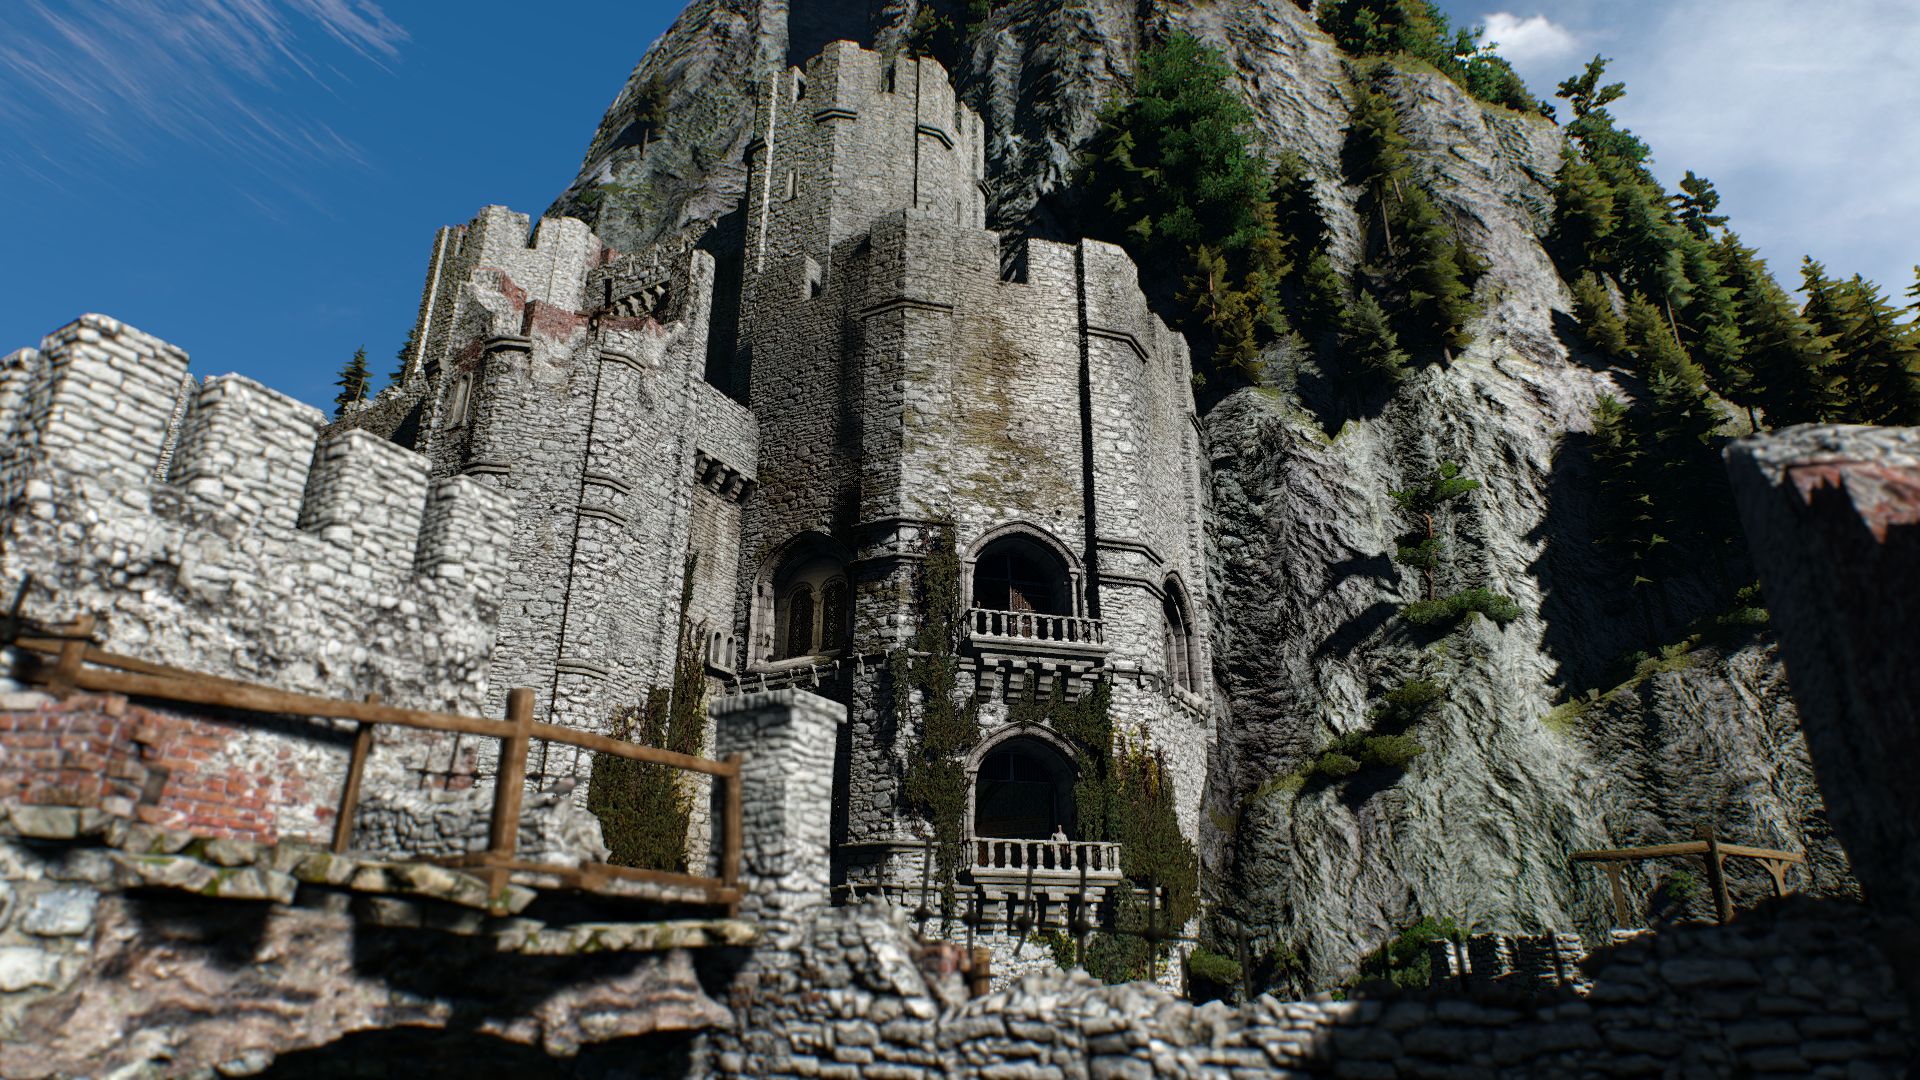
为了更好地进行比较,以当年的相同序列作为基准。在教程结束后不久,主角Geralt被释放到开放的游戏世界中,并被允许与他的马一起探索乡村地区。正如你在下面的视频中所看到的,我们跟着巫师同事在一条固定的路线上骑行了大约一分钟,直到在一座桥附近开始了一段视频序列。帧率是用CapeFrameX工具记录的。对于像样的游戏,我们建议在基准中至少有40 FPS作为平均值。

结果

对于基准,我们主要使用来自XMG(Schenker Technologies)的租赁设备。.

FHD (1,920 x 1,080)

在适度的分辨率和设置下,《Witcher 3 》的要求不是特别高。虽然英特尔的iGPU(如 Iris Xe Graphics G7有96个EUs)可以处理最大1,280 x 720像素和预设的低分辨率,而AMD的一些iGPU(如 Radeon 680M)也能处理全高清的最低细节。中档芯片的水平为 GeForce RTX 3050 Ti另一方面,在1920x1080像素下没有任何问题,即使是在中等和最高设置下。

The Witcher 3 v4.00
    1920x1080 Low Preset / Off     1920x1080 Medium Preset / On AA:FX     1920x1080 High Preset / On AA:FX     1920x1080 Ultra Preset / On AA:FX
NVIDIA GeForce RTX 3080, i9-12900K
Desktop-PC
257 (56.6min, 145.9P0.1, 183.2P1) fps ∼41%
222 (61.5min, 141.2P0.1, 166.3P1) fps ∼45%
191.6 (97.6min, 121.2P0.1, 132.8P1) fps ∼42%
NVIDIA GeForce RTX 3070, i9-12900K
Desktop-PC
226 (10.6min, 43.2P0.1, 154.5P1) fps ∼36%
188.2 (17.3min, 118.8P0.1, 136.2P1) fps ∼38%
151.5 (56.1min, 93.8P0.1, 105.3P1) fps ∼34%
NVIDIA GeForce RTX 3080 Ti Laptop GPU, i9-12900HX
MSI Titan GT77 12UHS
226 (33.7min, 106.9P0.1, 164.8P1) fps ∼30%
195.6 (29.9min, 65.9P0.1, 141P1) fps ∼31%
168.1 (30.5min, 55.1P0.1, 121.1P1) fps ∼34%
140 (25.5min, 73.5P0.1, 97.6P1) fps ∼31%
NVIDIA GeForce RTX 3080 Laptop GPU, i7-11800H
XMG Neo 15 @165 W TGP
189.3 (9.59min, 28.5P0.1, 129.3P1) fps ∼25%
164.4 (50.2min, 95.1P0.1, 120.2P1) fps ∼26%
142.2 (49.6min, 92.1P0.1, 105.1P1) fps ∼29%
120.9 (48.9min, 72.1P0.1, 82.2P1) fps ∼27%
NVIDIA GeForce RTX 3070 Laptop GPU, i7-11800H
XMG Neo 17 @140 W TGP
188.6 (7.29min, 30P0.1, 132.3P1) fps ∼25%
160.7 (51.5min, 86.1P0.1, 120.1P1) fps ∼26%
136.7 (16.8min, 85.2P0.1, 101.4P1) fps ∼28%
117.3 (33.6min, 62.6P0.1, 80.3P1) fps ∼26%
AMD Radeon RX 6800M, R9 5900HX
Asus ROG Strix G15
119.6 (5.39min, 14.3P0.1, 82.4P1) fps ∼19%
110.3 (36.9min, 75.1P0.1, 85.9P1) fps ∼22%
97.5 (59.2min, 64P0.1, 74.5P1) fps ∼22%
NVIDIA GeForce RTX 3060 Laptop GPU, i7-11800H
XMG Core 15 @130 W TGP
158.3 (37.7min, 89.4P0.1, 113P1) fps ∼21%
138.7 (9.84min, 29.1P0.1, 93.3P1) fps ∼22%
108.6 (32.2min, 50.8P0.1, 76.8P1) fps ∼22%
87.6 (27.7min, 50.5P0.1, 60.5P1) fps ∼19%
AMD Radeon RX 6600M, R7 5800H
Lenovo Legion 5
110.3 (4.86min, 9.46P0.1, 80.6P1) fps ∼18%
95.3 (28.7min, 65.8P0.1, 75.3P1) fps ∼19%
76.7 (39.5min, 47P0.1, 53.8P1) fps ∼17%
NVIDIA GeForce RTX 3050 Ti Laptop GPU, i7-11800H
XMG Focus 17 @75 W TGP
127.2 (66.7min, 79.9P0.1, 90.5P1) fps ∼17%
92.5 (50.1min, 57.1P0.1, 63.3P1) fps ∼15%
74 (41.4min, 46.6P0.1, 53P1) fps ∼15%
58 (26.3min, 37.4P0.1, 41.8P1) fps ∼13%
AMD Radeon 680M, R9 6900HS
Asus ROG Zephyrus G14
44.7 (22.2min, 22.7P0.1, 24.8P1) fps ∼6%
35.7 (16.7min, 22.1P0.1, 26.8P1) fps ∼6%
30.2 (19.1min, 19.5P0.1, 23.6P1) fps ∼6%
24.5 (12min, 12.2P0.1, 13.5P1) fps ∼5%
Intel Iris Xe Graphics G7 96EUs, i7-1165G7
Zotac ZBOX CI665 Nano
28.1 (15.5min, 21.3P0.1, 23.2P1) fps ∼4%
21.5 (16.6min, 17.1P0.1, 18.2P1) fps ∼3%
18.3 (14.7min, 14.7P0.1, 15.6P1) fps ∼4%
15.1 (11.7min, 11.8P0.1, 12.7P1) fps ∼3%

QHD (2,560 x 1,440)

对于2,560 x 1,440像素的QHD显示器,应该是中高档的显卡。这里使用的是Ultra-Preset,首先是一个 Radeon RX 6600M顺利地在屏幕上显示。

The Witcher 3 v4.00
    2560x1440 Ultra Preset / On AA:FX
NVIDIA GeForce RTX 3080, i9-12900K
Desktop-PC
154 (88.1min, 98.8P0.1, 106.1P1) fps ∼38%
NVIDIA GeForce RTX 3080 Ti Laptop GPU, i9-12900HX
MSI Titan GT77 12UHS
110 (43min) fps ∼27%
NVIDIA GeForce RTX 3070, i9-12900K
Desktop-PC
109.9 (63min, 68.6P0.1, 78.3P1) fps ∼27%
NVIDIA GeForce RTX 3080 Laptop GPU, i7-11800H
XMG Neo 15 @165 W TGP
85.8 (36.5min, 54.8P0.1, 60.9P1) fps ∼21%
NVIDIA GeForce RTX 3070 Laptop GPU, i7-11800H
XMG Neo 17 @140 W TGP
83 (34.7min, 52.2P0.1, 59.4P1) fps ∼20%
AMD Radeon RX 6800M, R9 5900HX
Asus ROG Strix G15
78.2 (46.2min, 51.2P0.1, 60.3P1) fps ∼19%
AMD Radeon RX 6600M, R7 5800H
Lenovo Legion 5
51.7 (24.3min, 38.1P0.1, 42P1) fps ∼13%

UHD (3,840 x 2,160)

另一方面,如果需要最大的细节,4K显示器则需要真正的高端GPU。3,840 x 2,160像素和超预设的混合物至少需要Radeon RX 6800M或更好。如果你错过了我们的Nvidia笔记本的4K结果:不幸的是,我们不得不在外部屏幕上挣扎了几周,部分性能明显下降(可能是较新的驱动版本的错误)。幸运的是,AMD的设备没有受到影响。

The Witcher 3 v4.00
    3840x2160 Ultra Preset / On AA:FX
NVIDIA GeForce RTX 3080, i9-12900K
Desktop-PC
87.8 (54.2min, 63.3P0.1, 66.9P1) fps ∼26%
NVIDIA GeForce RTX 3070, i9-12900K
Desktop-PC
61.9 (39.4min, 42.5P0.1, 47.9P1) fps ∼18%
AMD Radeon RX 6800M, R9 5900HX
Asus ROG Strix G15
43 (29min, 31.5P0.1, 34.1P1) fps ∼13%
AMD Radeon RX 6600M, R7 5800H
Lenovo Legion 5
27.6 (9.74min, 23.1P0.1, 24.2P1) fps ∼8%

光线追踪

Witcher 3 启用光线追踪后,要求变得非常高。大多数笔记本电脑的显卡已经达到了全高清的极限。只有Nvidia的顶级型号,即 GeForce RTX 3080 Ti在RT Ultra预设中达到了40 FPS大关。

The Witcher 3 v4.00
    1920x1080 RT Ultra Preset / On AA:FX
NVIDIA GeForce RTX 3080, i9-12900K
Desktop-PC
53.6 (6.43min, 8.23P0.1, 19.8P1) fps ∼30%
NVIDIA GeForce RTX 3080 Ti Laptop GPU, i9-12900HX
MSI Titan GT77 12UHS
39.5 (5.02min, 5.86P0.1, 15.7P1) fps ∼22%
NVIDIA GeForce RTX 3070, i9-12900K
Desktop-PC
37 (6.25min, 7.08P0.1, 13.5P1) fps ∼21%
NVIDIA GeForce RTX 3080 Laptop GPU, i7-11800H
XMG Neo 15 @165 W TGP
32.3 (4.43min, 5.42P0.1, 12.4P1) fps ∼18%
NVIDIA GeForce RTX 3070 Laptop GPU, i7-11800H
XMG Neo 17 @140 W TGP
30.1 (4.72min, 5.65P0.1, 11.7P1) fps ∼17%
NVIDIA GeForce RTX 3060 Laptop GPU, i7-11800H
XMG Core 15 @130 W TGP
23.5 (3.92min, 4.65P0.1, 8.51P1) fps ∼13%
AMD Radeon RX 6800M, R9 5900HX
Asus ROG Strix G15
22.4 (2.58min, 3P0.1, 16.2P1) fps ∼13%
AMD Radeon RX 6600M, R7 5800H
Lenovo Legion 5
15.6 (2.76min, 3.08P0.1, 6.06P1) fps ∼9%
NVIDIA GeForce RTX 3050 Ti Laptop GPU, i7-11800H
XMG Focus 17 @75 W TGP
14.5 (3.24min, 4.64P0.1, 5.26P1) fps ∼8%

注意事项

由于游戏测试非常耗时,而且经常受到安装或激活限制的限制,我们只能为您提供文章发表的部分基准。更多的显卡将在未来几天和几周内安装。

Overview

Show Restrictions
PosModel< PrevNext >The Witcher 3 v4.00
 The Witcher 3 v4.00 (2023)
low
1920x1080
Low Preset / Off
med.
1920x1080
Medium Preset / On
FXAA
high
1920x1080
High Preset / On
FXAA
ultra
1920x1080
Ultra Preset / On
FXAA
QHD
2560x1440
Ultra Preset / On
FXAA
4K
3840x2160
Ultra Preset / On
FXAA
NVIDIA GeForce RTX 4090
351n9
297n9
269n9
226n9
223n9
169n9
AMD Radeon RX 7900 XTX
365
318
298
275
268
146.1
NVIDIA GeForce RTX 4080 Super
363n2
314n2
279.5n2
265n2
230.5n2
117.8n2
NVIDIA GeForce RTX 4070 Ti
276.5n2
242.5n2
222.5n2
203.25n2
170.9n2
92.9n2
AMD Radeon RX 7900 GRE
279.1n2
238.25n2
213.75n2
189.4n2
150.05n2
73.9n2
AMD Radeon RX 6950 XT
450
356
176.2
148
122.2
81.3
NVIDIA GeForce RTX 4090 Laptop GPU
230n2
174n3
158n3
139.7n6
101.2n7
49.5n6
NVIDIA GeForce RTX 3090
296
260
229
208
169.6
97.8
AMD Radeon RX 7800 XT
323
280.4
247.4
217.6
157.8
76.9
NVIDIA GeForce RTX 4080 Laptop GPU
161.4
144
125.3
81.1
42.8
NVIDIA GeForce RTX 3080
257
222
191.6
154
87.8
NVIDIA GeForce RTX 4070
263n2
257
183.65n2
156.8n2
108.45n2
56.35n2
AMD Radeon RX 6800
279
227
192.8
159.1
119.2
65.4
AMD Radeon RX 7700 XT
307
264
233
198
122.6
59.3
NVIDIA Titan RTX
298
245
208
175.3
125.2
72.6
NVIDIA GeForce RTX 4060 Ti 16G
273
229
190.9
149.9
99.7
52
NVIDIA GeForce RTX 4060 Ti 8G
276n3
227.2n3
188.1n3
151.8n3
99.8n3
52.6n3
NVIDIA GeForce RTX 3080 Ti Laptop GPU
226
195.6
168.1
148n2
110
NVIDIA GeForce RTX 4070 Laptop GPU
101
85
54
28
PosModel< PrevNext >The Witcher 3 v4.00
low med. high ultra QHD 4K
NVIDIA GeForce RTX 3070
226
188.2
151.5
109.9
61.9
AMD Radeon RX 6750 XT
247
199
169.1
137.9
99.8
51.2
AMD Radeon RX 6700 XT
237
191.5
163.2
130.8
95.5
48.9
NVIDIA GeForce RTX 3080 Laptop GPU
193.7n2
164.65n2
139.65n2
115.45n2
83.95n2
46.4
NVIDIA GeForce RTX 3060 Ti
175.35n4
149.6n4
128.35n4
105.1n4
81.85n4
51.25n4
Intel Arc A770
154.9
129.7
115.6
104.5
94.8
52.1
NVIDIA GeForce RTX 4060
225
177.6
149.1
117.4
79.7
44.2
AMD Radeon RX 7600
210.4
175.1
149.9
121.3
77.3
40.1
NVIDIA GeForce RTX 3070 Ti Laptop GPU
174.4
149.6
81.3
71.4
47.4
NVIDIA GeForce RTX 4060 Laptop GPU
179.3n2
144.75n2
72.3n2
66.3n3
42.65n2
21.4
AMD Radeon RX 6800M
119.6
110.3
97.5
78.2
43
AMD Radeon RX 6650 XT
181.5
149.6
126.5
101
67.8
35.8
NVIDIA GeForce RTX 3070 Laptop GPU
174.85n2
155.95n2
132.55n2
114.95n2
82.45n2
46.5
AMD Radeon RX 7600M XT
197.9
169.8
141.5
113.7
72.6
37.7
NVIDIA Titan X Pascal
212
172.3
144.6
112.2
79.5
44.4
NVIDIA GeForce RTX 2070 Super (Desktop)
223
177.1
149.6
119.6
85
47.9
AMD Radeon RX 5700 XT (Desktop)
190.1
149.7
125.8
105.1
74.2
40.9
NVIDIA GeForce RTX 3060 Laptop GPU
164.2n2
135.45n2
108.5n2
87.55n2
71.4
AMD Radeon RX 7600S
156.7
129.5
103.1
69.3
36.3
Intel Arc A580
189.9
154.8
132.6
110.1
78.3
42.1
PosModel< PrevNext >The Witcher 3 v4.00
low med. high ultra QHD 4K
NVIDIA GeForce RTX 2060 Super (Desktop)
191.8
153.3
125.8
100.2
71.3
40.3
Intel Arc A770M
143.7
125.1
111.3
99.2
44.1
AMD Radeon RX 6600
153.7
123.2
104.7
89.1
57.1
29.6
AMD Radeon RX 5700 (Desktop)
167.6
133.6
112.7
94.3
66.6
36.2
AMD Radeon RX 6600M
149.3
115.4n2
100.75n2
83.45n2
54.7n2
28.55n2
NVIDIA GeForce RTX 3050
145.8
128.2
88.7
70.7
50.4
28.2
AMD Radeon RX 5600 XT (Desktop)
158.9
123
105.2
88.6
62
33.6
NVIDIA GeForce GTX 1660 Super (Desktop)
141
105.8
87.6
71.4
49.8
27.5
AMD Radeon RX 6500 XT
99.9
75.1
65.7
54.1
30.4
9.91
AMD Radeon RX 5500 XT (Desktop)
106.7
82.6
71
58
41.1
22.5
NVIDIA GeForce RTX 4050 Laptop GPU
109.7n2
79.25n2
55.5n2
48.55n2
30.4n2
17
Intel Arc A730M
126.2
102.8
51.2
44.4
NVIDIA GeForce GTX 1660 Ti Mobile
134
101.4
43.2
37
NVIDIA GeForce RTX 3050 Ti Laptop GPU
107.8n2
84.05n2
55.4n2
45.2n2
19.6
NVIDIA GeForce GTX 1660 (Desktop)
123.5
92.9
78
63.9
44.2
23.8
NVIDIA GeForce GTX 1650 Super (Desktop)
112.6
83.9
70.4
56.1
37.2
13.5
NVIDIA GeForce RTX 3050 4GB Laptop GPU
98.1
79.9
64.7
49.4
AMD Radeon RX 6500M
81.4
61
29.4
25.7
NVIDIA GeForce GTX 1060 Mobile
85.2
28.9
26.8
23.7
NVIDIA GeForce GTX 1650 Ti Mobile
91.4
68.1
55.6
41.1
PosModel< PrevNext >The Witcher 3 v4.00
low med. high ultra QHD 4K
AMD Radeon RX 5500M
86.5
66.7
29.1
25.9
NVIDIA GeForce RTX 2050 Mobile
66.7
46.2
18.8
15.8
NVIDIA GeForce GTX 1650 Mobile
79.4
58.7
21.25n2
Intel Arc A380
76
57.8
49.2
40.3
Intel Arc A350M
56.3
42.6
36.1
29.7
20.4
AMD Radeon 780M
52.6n2
39.65n2
33.85n2
28.3n2
21.3
10.5
AMD Radeon 680M
43.3n3
35.7n3
30.2n3
24.5n3
16.4
8.28
NVIDIA GeForce MX450
45.8
32.4
24.9
14.1
NVIDIA GeForce GTX 1050 Mobile
53.6
40.6
32.2
12.8
AMD Radeon 660M
31.8
25.3
10.1
AMD Radeon RX 560X (Laptop)
44.3
33.7
28.5
22.3
Intel Iris Xe Graphics G7 96EUs
29.75n2
23.2n2
19.65n2
16.15n2
NVIDIA GeForce MX350
33.8
24.6
7.42
AMD Radeon RX 550 (Laptop)
20.6
15.8
12.3
NVIDIA GeForce MX250
28.2
20.7
7.83
Intel Iris Xe Graphics G7 80EUs
20.7
15.9
7.41
AMD Radeon 540X
17.3
AMD Radeon RX Vega 10
20.2
15.3
Intel UHD Graphics Xe G4 48EUs
21
16.4
Intel UHD Graphics 32EUs (Alder Lake)
14.1
11.2
PosModel< PrevNext >The Witcher 3 v4.00
low med. high ultra QHD 4K
Intel UHD Graphics Xe 32EUs (Tiger Lake-H)
23
18.2
Intel UHD Graphics 770
21.3
16.7
AMD Radeon RX Vega 8 (Ryzen 4000/5000)
24.4
17.6
7.14
AMD Radeon RX Vega 7
24.9
18
15.3
11.1
NVIDIA GeForce MX130
13.6
AMD Radeon RX Vega 8 (Ryzen 2000/3000)
14
NVIDIA GeForce 930MX
6.73
AMD Radeon RX Vega 6 (Ryzen 4000/5000)
21.9
17.1
6.69
AMD Radeon RX Vega 6 (Ryzen 2000/3000)
11.1
AMD Radeon RX Vega 5
16.3
12.1
Intel UHD Graphics Xe 16EUs (Tiger Lake-H)
9.76
AMD Radeon R5 M255
8.74
AMD Radeon RX Vega 3
11.4
(-) * Smaller values are better. / n123 Number of benchmarks for this median value / * Approximate position


Legend
5Stutters – This game is very likely to stutter and have poor frame rates. Based on all known benchmarks using the specified graphical settings, average frame rates are expected to fall below 25fps
May Stutter – This graphics card has not been explicitly tested on this game. Based on interpolated information from surrounding graphics cards of similar performance levels, stutters and poor frame rates are expected.
30Fluent – Based on all known benchmarks using the specified graphical settings, this game should run at or above 25fps
40Fluent – Based on all known benchmarks using the specified graphical settings, this game should run at or above 35fps
60Fluent – Based on all known benchmarks using the specified graphical settings, this game should run at or above 58fps
May Run Fluently – This graphics card has not been explicitly tested on this game. Based on interpolated information from surrounding graphics cards of similar performance levels, fluent frame rates are expected.
?Uncertain – This graphics card experienced unexpected performance issues during testing for this game. A slower card may be able to achieve better and more consistent frame rates than this particular GPU running the same benchmark scene.
Uncertain – This graphics card has not been explicitly tested on this game and no reliable interpolation can be made based on the performances of surrounding cards of the same class or family.
The value in the fields displays the average frame rate of all values in the database. Move your cursor over the value to see individual results.

Test systems

XMG Neo 15 (RTX 3080) - 点击照片,打开配置器 (bestware.com)
XMG Neo 17 (RTX 3070) - 点击照片,打开配置器 (bestware.com)
XMG Core 15 (RTX 3060) - 点击照片打开配置器 (bestware.com)
XMG Focus 17 (RTX 3050 Ti) - 点击照片打开配置器 (bestware.com)
设备 显卡 处理器 内存 操作系统
笔记本
MSI Titan GT77 12UHS NvidiaGeForce RTX 3080 Ti @175 W TGP (16 GB GDDR6) Intel Core i9-12900 2 x 16 GB DDR5 Windows 11
XMG Neo 15 NvidiaGeForce RTX 3080 @165 W TGP (16 GB GDDR6) Intel Core i7-11800H 2 x 16 GB DDR4 Windows 11
XMG Neo 17 NvidiaGeForce RTX 3070 @140 W TGP (8 GB GDDR6) Intel Core i7-11800H 2 x 16 GB DDR4 Windows 11
XMG Core 15 NvidiaGeForce RTX 3060 @130 W TGP (6 GB GDDR6) Intel Core i7-11800H 2 x 16 GB DDR4 Windows 11
XMG Focus 17 NvidiaGeForce RTX 3050 Ti @75 W TGP (4 GB GDDR6) Intel Core i7-11800H 2 x 16 GB DDR4 Windows 11
华硕ROG Strix G15 AMD Radeon RX 6800M(12 GB GDDR6) AMD Ryzen 9 5900HX 2 x 8 GB DDR4 Windows 11
联想Legion 5 AMD Radeon RX 6600M(8 GB GDDR6) AMD Ryzen 7 5800H 2 x 8 GB DDR4 Windows 11
华硕ROG Zephyrus G14 AMD Radeon 680M AMD Ryzen 9 6900HS 2 x 16 GB DDR5 Windows 11
塔式电脑
定制 I MSIGeForce RTX 3080 (10 GB GDDR6X)
MSIGeForce RTX 3070 (8 GB GDDR6)
Intel Core i9-12900K 2 x 16 GB DDR4 Windows 11
Custom II PalitGeForce RTX 4090 GameRock OC (24 GB GDDR6X)
NvidiaGeForce RTX 3090 FE (24 GB GDDR6X)
NvidiaGeForce RTX 3060 Ti (8GB GDDR6X)
Nvidia Titan RTX (24 GB GDDR6)
lNvidia GeForce RTX 2070 Super (8 GB GDDR6)
NvidiaGeForce RTX 2060 Super (8 GB GDDR6)
KFA2GeForce GTX 1660 Super (6 GB GDDR6)
PNYGeForce GTX 1660 (6 GB GDDR5)
KFA2GeForce GTX 1650 Super (4 GB GDDR6)AMDGDDR6)
AMD Radeon RX 6800 (16 GB DDR6)
AMD Radeon RX 6700 XT (12 GB DDR6)
AMD Radeon RX 6650 XT (8GB GDDR6)
AMD Radeon RX 6600 (8GB GDDR6)
AMD Radeon RX5700XT(8 GB GDDR6)
AMD Radeon RX 5700 (8 GB GDDR6)
AMD Radeon RX 5600 XT (6 GB GDDR6)
AMD Radeon RX 5500 XT (8GB GDDR6)
AMD Ryzen 9 7950X 2 x 16 GB DDR5 Windows 11
Custom III NvidiaGeForce RTX 2080 Super FE Intel Core i9-11900K 2 x 8 GB DDR4 Windows 11
迷你电脑
Zotac ZBOX CI665 Nano Intel Iris Xe Graphics G7 (96 CUs) Intel Core i7-1165G7 2 x 8 GB DDR4 Windows 11
Morefine S500+ AMD Radeon RX Vega 8 AMD Ryzen 9 5900HX 2 x 16 GB DDR4 Windows 11
Minisforum NUCXi7 NvidiaGeForce RTX 3070 @125 W TGP (8 GB GDDR6) Intel Core i7-11800H 2 x 8 GB DDR4 Windows 11
Minisforum HX90G AMD Radeon RX 6600M @100 W TGP (8 GB GDDR6) AMD Ryzen 9 5900HX 2 x 16 GB DDR4 Windows 11
4K显示器 Nvidia驱动 AMD驱动
华硕PB287Q,飞利浦Brilliance 329P9H, Gigabyte M32U ForceWare 528.02 Adrenalin 22.11.2
Please share our article, every link counts!
> Notebookcheck中文版(NBC中国) > 评测 > TheWitcher 3 v4.00:笔记本和台式机基准测试
Florian Glaser, 2023-01-21 (Update: 2023-01-21)