Notebookcheck Logo

测试中的 "采石场"。笔记本和台式机基准测试

互动电影。 虽然恐怖故事大作《直到黎明》是保留给Playstation 4的,但Supermassive Games的新后代也已经发布了PC版。我们仔细看了一下图形要求。
Gaming Laptop / Notebook Desktop Gamecheck
采石场

技术

如果你对无要求的游戏玩法(简单的快速事件等)没有意见,并想在沙发上舒适地享受一个令人毛骨悚然的故事,其中有故意的(但也有部分是无意的)垃圾参考,你可能会喜欢《采石场》。

采石场
采石场
采石场
采石场

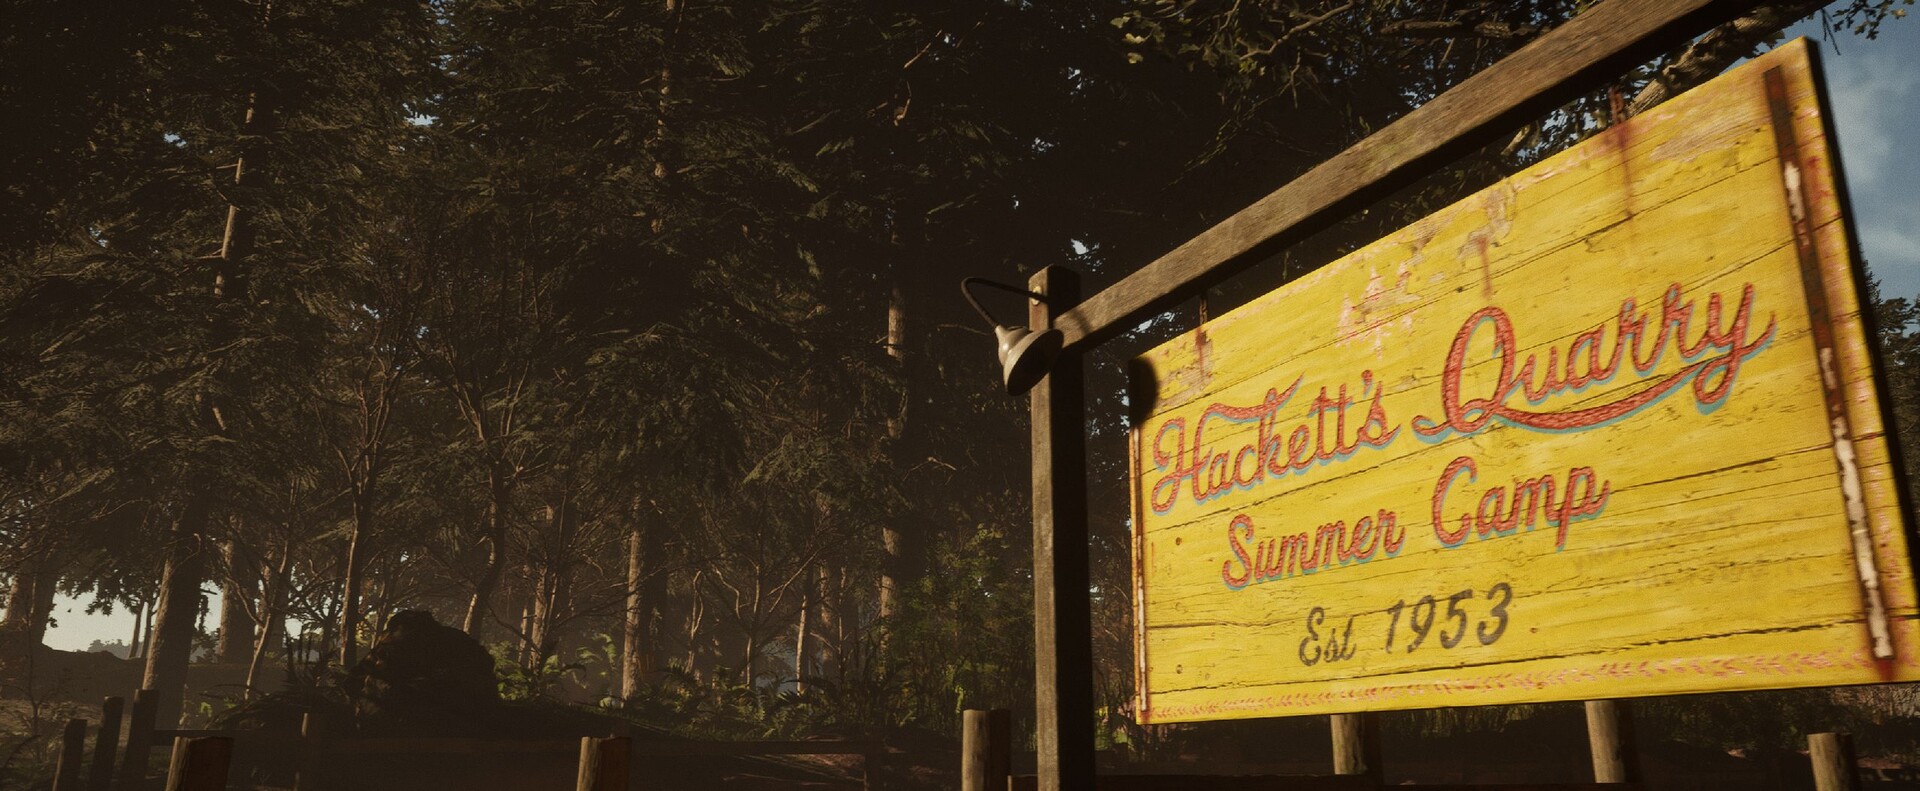
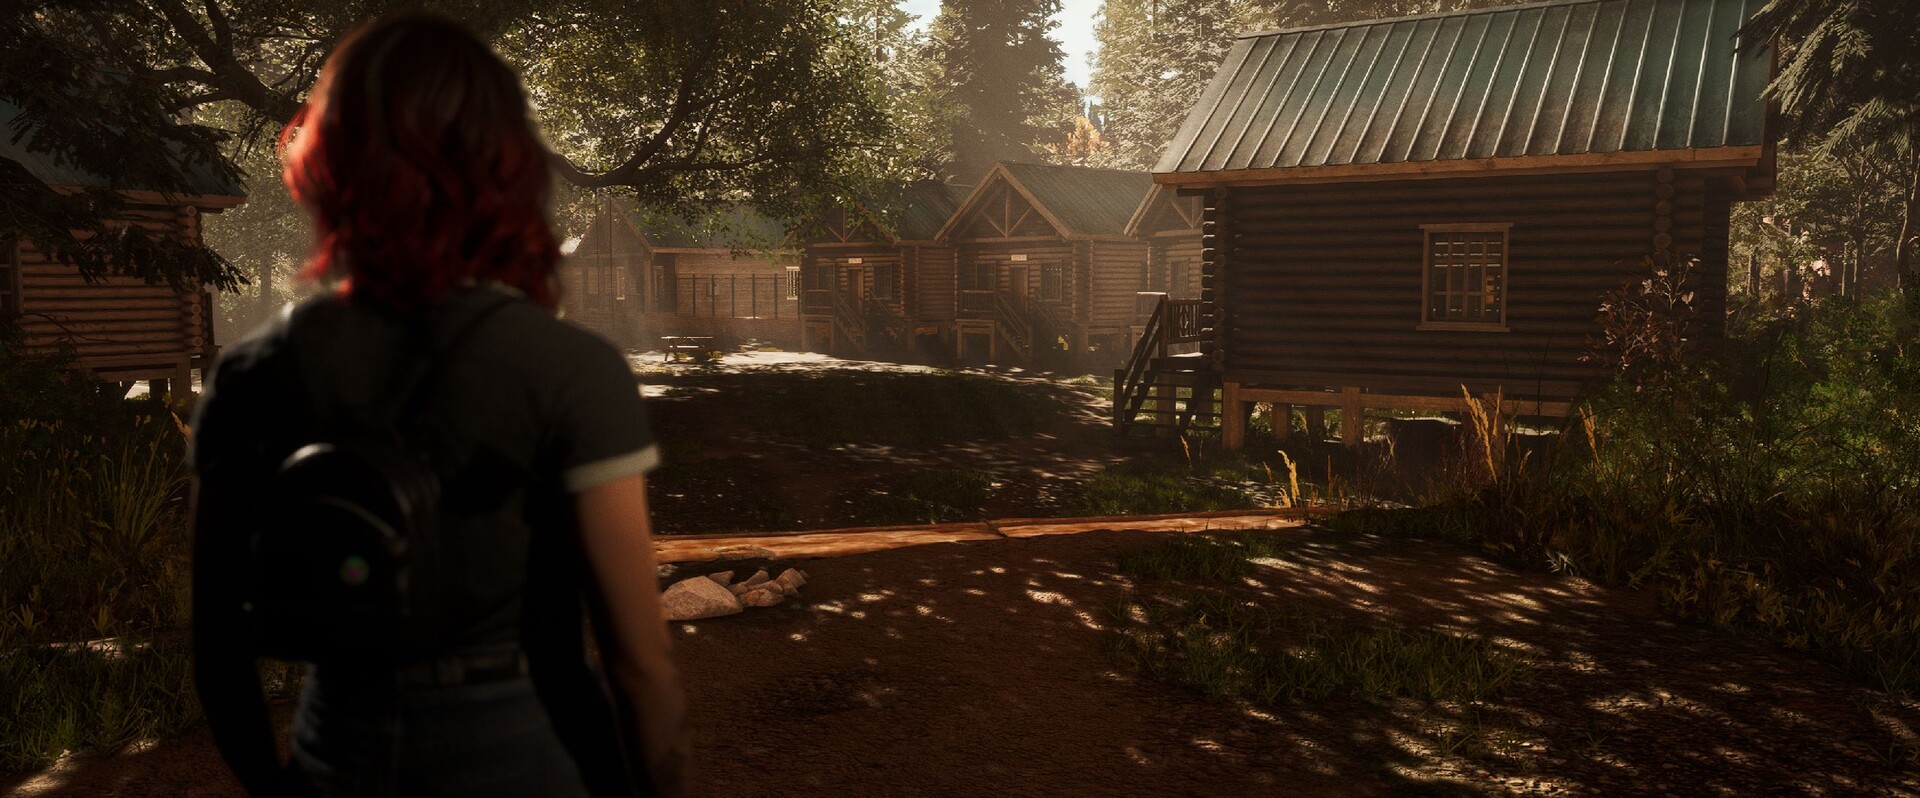
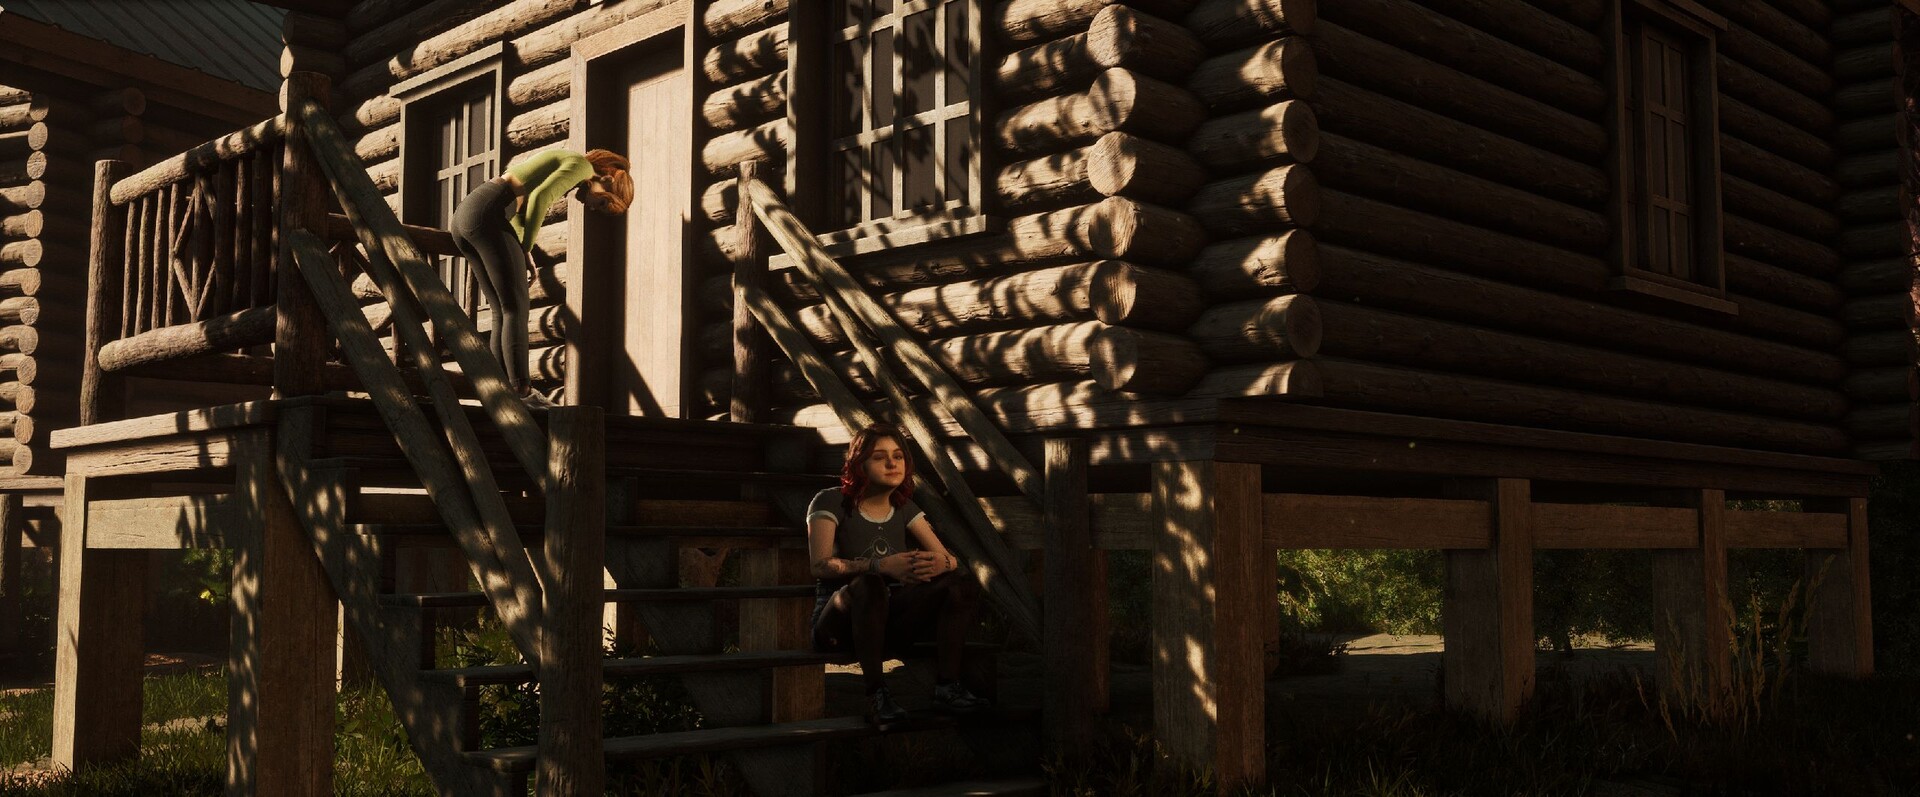
第三人称游戏的最大优势之一是令人信服的视觉效果。青年或儿童冒险营周围的环境设计得非常有气氛,并在大多数情况下提供了现代图形。特别是人物的细节给人留下了深刻的印象,尽管一些动画--无论是错误还是基础技术的问题--看起来有点奇怪。

顺便说一下,对话的质量也同样不稳定。它们的质量参差不齐,从成功的/好的到尴尬的/坏的,特别是由于一些角色的反应极其令人难以置信,或者对话退化为无关紧要的 "胡言乱语",这只会人为地拉长游戏时间,不必要地消除紧张感。

采石场
采石场
采石场
采石场

但回到技术方面:由于电影式的舞台设计,加上很酷的摄像机视角和 "视频序列 "与可播放段落之间的动态过渡,你会得到一种真正的电影感觉。PC版也可以用鼠标和键盘控制得出奇的好--除了轻微的掉线。

采石场
采石场
采石场
采石场

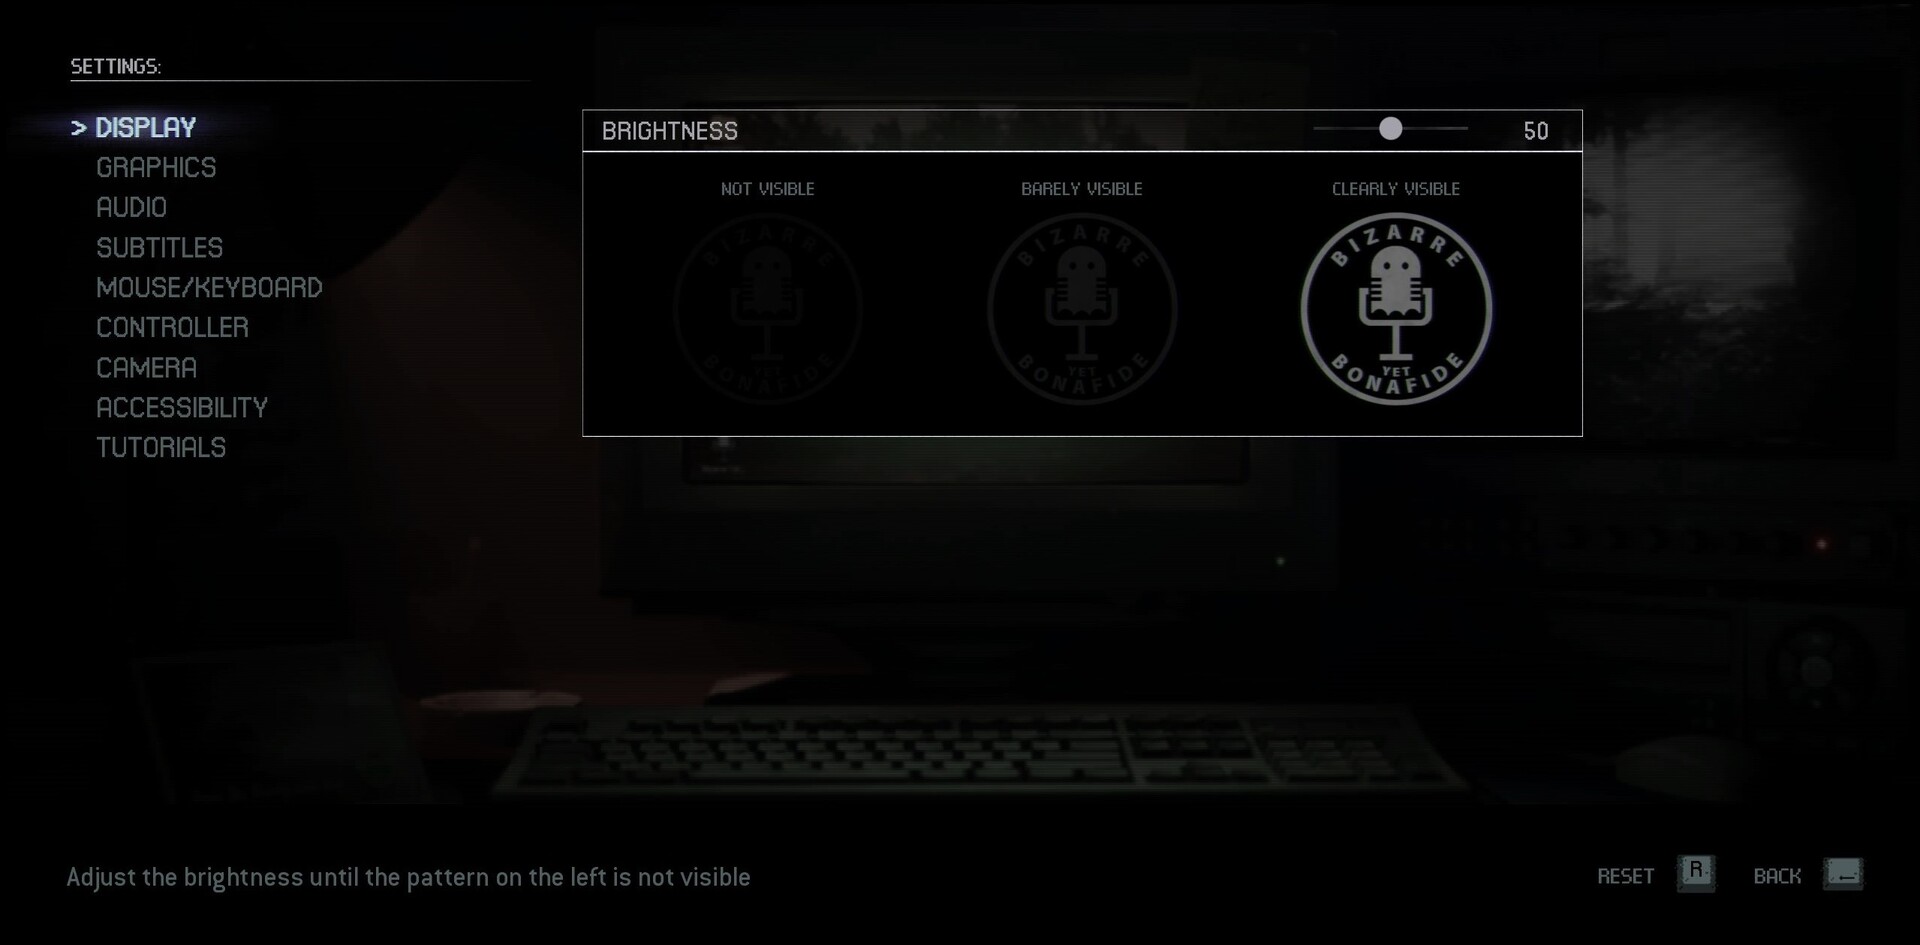
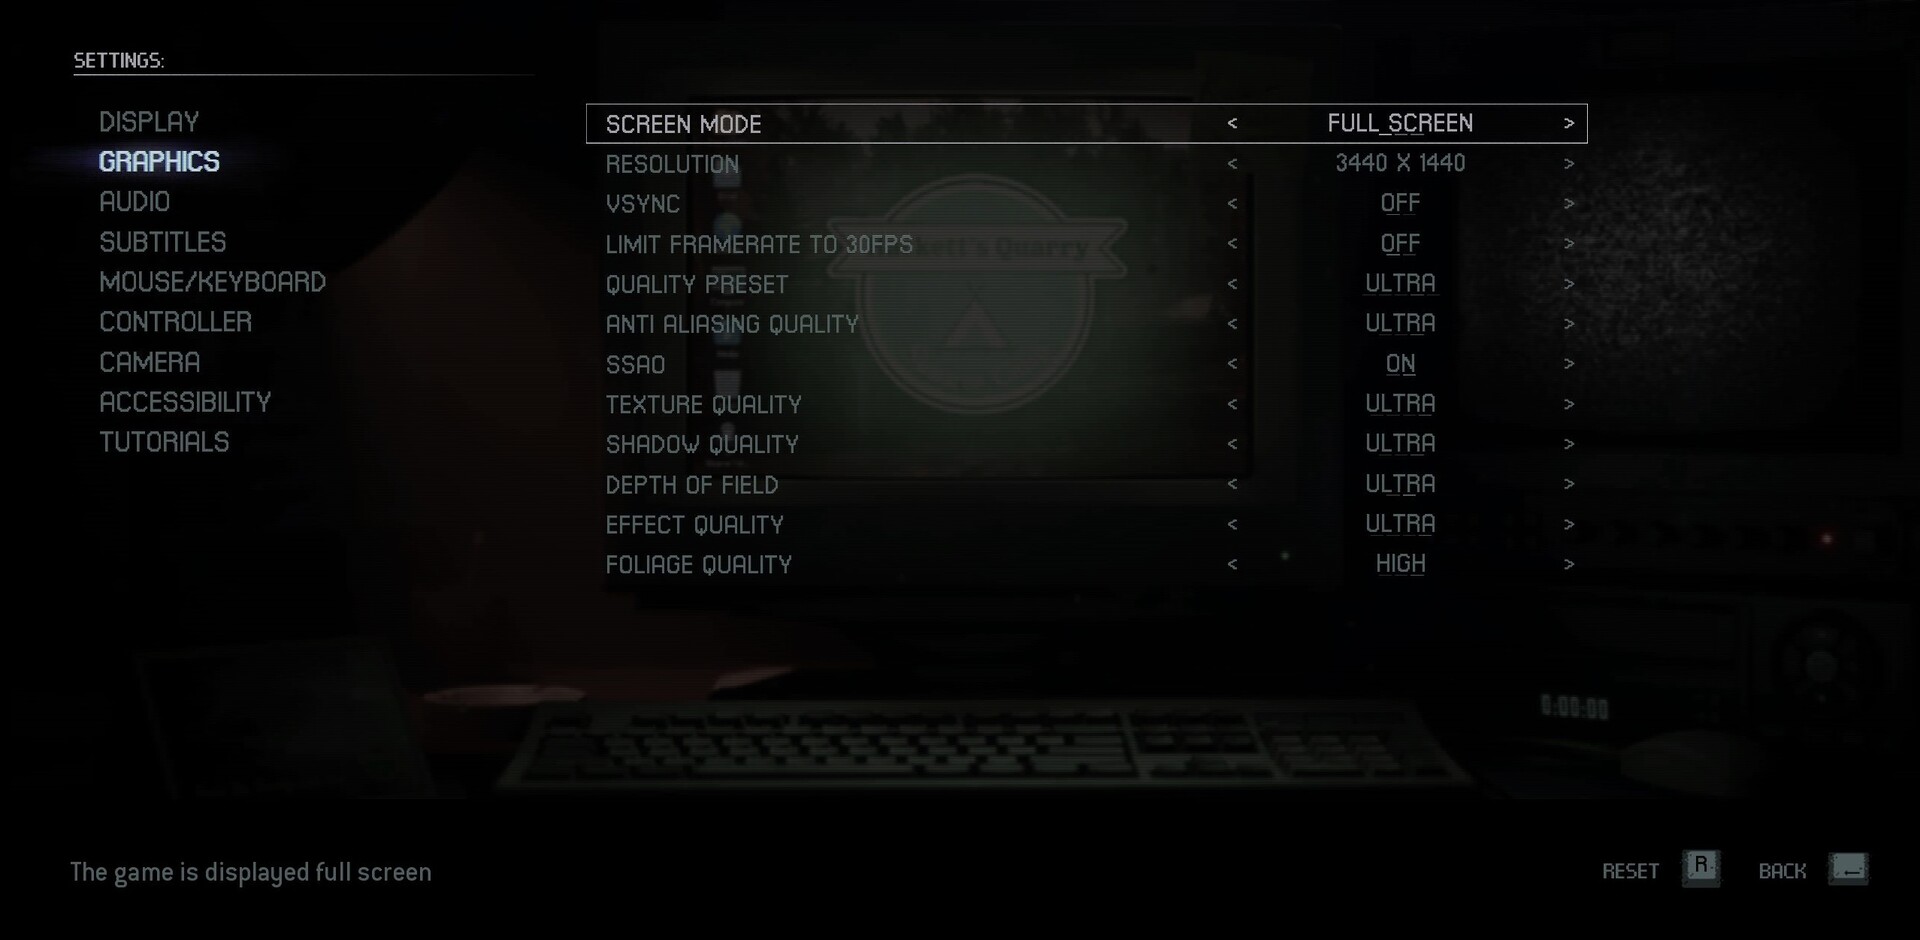
图形菜单包含适量的设置。除了调整分辨率外,还可以激活V-Sync和FPS限制(30帧),例如。此外,七个质量控制可以通过预设在全球范围内改变,不需要重新启动。

在技术上,不幸的是,《采石场》在PC上并非(还)完全干净。即使在更强大的系统上,最低的FPS也往往很一般--无论选择何种设置(抽风)。没有真正的21:9长宽比的事实对于拥有合适显示器的人来说也是一个遗憾。

采石场
采石场

基准

我们的基准序列是在故事的第二章。正如你在下面的视频中看到的,它是一个自动运行的段落。使用CapFrameX工具,我们记录了两个人物在森林中的行走,时间不到50秒。

FHD (1,920 x 1,080)

如果你看一下入门级的芯片,如目前英特尔处理器中使用的芯片 Iris Xe Graphics G7在使用1,920 x 1,080像素时,要求是适中的。中档代表的水平是 GeForce RTX 3050(Ti)有时可以在全高清中处理高到最大的设置。

The Quarry
    1920x1080 Low Preset     1920x1080 Medium Preset     1920x1080 High Preset     1920x1080 Ultra Preset
NVIDIA GeForce RTX 3090, i9-12900K
Desktop-PC
221 (36.9min, 107.3P0.1, 166.8P1) fps ∼44%
182.7 (26.4min, 76.2P0.1, 139.5P1) fps ∼39%
151.1 (32.5min, 69.6P0.1, 121.4P1) fps ∼35%
NVIDIA GeForce RTX 3080, i9-12900K
Desktop-PC
203 (51.5min, 91.3P0.1, 151.9P1) fps ∼40%
166.8 (42.5min, 76.7P0.1, 127.6P1) fps ∼36%
134.4 (33.5min, 61.1P0.1, 107.5P1) fps ∼31%
NVIDIA GeForce RTX 3080 Laptop GPU, i7-11800H
XMG Neo 15 @165 W TGP
126 (29.7min, 57.3P0.1, 85P1) fps ∼25%
102.8 (18min, 40.6P0.1, 76.3P1) fps ∼22%
81.8 (32.6min, 37.5P0.1, 65.7P1) fps ∼19%
NVIDIA GeForce RTX 3070 Laptop GPU, i7-11800H
XMG Neo 17 @140 W TGP
121.8 (20.9min, 58.3P0.1, 89.9P1) fps ∼24%
101.8 (19min, 48.7P0.1, 79.4P1) fps ∼22%
80.8 (30.8min, 41.2P0.1, 65.5P1) fps ∼19%
AMD Radeon RX 6800M, R9 5900HX
Asus ROG Strix G15
105.7 (34.3min, 50.5P0.1, 81.7P1) fps ∼21%
88.6 (33.9min, 43.6P0.1, 67.2P1) fps ∼19%
69.2 (27.1min, 33.7P0.1, 50.4P1) fps ∼16%
NVIDIA GeForce RTX 3060 Laptop GPU, i7-11800H
XMG Core 15 @130 W TGP
90.9 (22.6min, 46.5P0.1, 68.9P1) fps ∼18%
75.5 (15.6min, 32.2P0.1, 57.1P1) fps ∼16%
59.4 (23.5min, 27.8P0.1, 47.2P1) fps ∼14%
AMD Radeon RX 6800S, R9 6900HS
Asus ROG Zephyrus G14
88.1 (34min, 57.4P0.1, 66P1) fps ∼17%
68 (29.2min, 40.7P0.1, 52P1) fps ∼15%
49.9 (20.7min, 22.3P0.1, 38.7P1) fps ∼11%
NVIDIA GeForce RTX 3050 Ti Laptop GPU, i7-11800H
XMG Focus 17 @75 W TGP
67.1 (26.4min, 34.2P0.1, 54P1) fps ∼13%
55.3 (17.3min, 24.8P0.1, 44.3P1) fps ∼12%
42.4 (17.1min, 20.6P0.1, 33.8P1) fps ∼10%
NVIDIA GeForce RTX 3050 4GB Laptop GPU, i5-10500H
Dell G15 5510
85.5 (34.6min, 49.2P0.1, 64.1P1) fps ∼3%
63.7 (24.9min, 32.3P0.1, 45.4P1) fps ∼13%
52 (12.3min, 26.2P0.1, 37P1) fps ∼11%
39.7 (11min, 15.5P0.1, 25.6P1) fps ∼9%
Intel Iris Xe Graphics G7 96EUs, i7-1185G7
MSI Prestige 14
16.1 (5.02min, 5.6P0.1, 8.69P1) fps ∼0%
11.8 (3.98min, 3.99P0.1, 4.65P1) fps ∼2%
9.87 (2.91min, 3.02P0.1, 7.12P1) fps ∼2%
7.51 (2.03min, 2.08P0.1, 2.74P1) fps ∼2%

QHD (2,560 x 1,440)

在QHD范围内,它变得更加苛刻。2,560 x 1,440像素和Ultra预设的组合只能由一台 GeForce RTX 3060Radeon RX 6800M.

The Quarry
    2560x1440 Ultra Preset
NVIDIA GeForce RTX 3090, i9-12900K
Desktop-PC
108.7 (42.3min, 51.9P0.1, 90.6P1) fps ∼5%
NVIDIA GeForce RTX 3080, i9-12900K
Desktop-PC
97.2 (40.2min, 42.1P0.1, 81.4P1) fps ∼5%
NVIDIA GeForce RTX 3080 Laptop GPU, i7-11800H
XMG Neo 15 @165 W TGP
56.9 (24.4min, 25.3P0.1, 46.2P1) fps ∼3%
NVIDIA GeForce RTX 3070 Laptop GPU, i7-11800H
XMG Neo 17 @140 W TGP
55.5 (22.6min, 24.9P0.1, 45.4P1) fps ∼3%
AMD Radeon RX 6800M, R9 5900HX
Asus ROG Strix G15
45.4 (17.1min, 20.9P0.1, 31.3P1) fps ∼2%
NVIDIA GeForce RTX 3060 Laptop GPU, i7-11800H
XMG Core 15 @130 W TGP
40.8 (11.8min, 17.1P0.1, 31.5P1) fps ∼2%
AMD Radeon RX 6800S, R9 6900HS
Asus ROG Zephyrus G14
32.6 (5.55min, 9.78P0.1, 16.8P1) fps ∼2%
NVIDIA GeForce RTX 3050 Ti Laptop GPU, i7-11800H
XMG Focus 17 @75 W TGP
28.6 (9.21min, 12.9P0.1, 16P1) fps ∼1%

UHD (3,840 x 2,160)

在3,840 x 2,160像素的情况下,即使是绝对的高端笔记本,也要配备一个 GeForce RTX 3070RTX 3080达到其极限,前提是使用Ultra预设。桌面上的同类产品在这里的表现要好得多--情况往往如此。

The Quarry
    3840x2160 Ultra Preset
NVIDIA GeForce RTX 3090, i9-12900K
Desktop-PC
61.4 (26.5min, 27.6P0.1, 52.5P1) fps ∼18%
NVIDIA GeForce RTX 3080, i9-12900K
Desktop-PC
53.8 (22min, 24.4P0.1, 46P1) fps ∼16%
NVIDIA GeForce RTX 3080 Laptop GPU, i7-11800H
XMG Neo 15 @165 W TGP
31.4 (9.91min, 11.6P0.1, 21.9P1) fps ∼9%
NVIDIA GeForce RTX 3070 Laptop GPU, i7-11800H
XMG Neo 17 @140 W TGP
28.3 (11.1min, 11.8P0.1, 19.3P1) fps ∼8%
AMD Radeon RX 6800M, R9 5900HX
Asus ROG Strix G15
23.2 (2.16min, 2.62P0.1, 12.2P1) fps ∼7%
NVIDIA GeForce RTX 3060 Laptop GPU, i7-11800H
XMG Core 15 @130 W TGP
20.7 (7.25min, 7.33P0.1, 9.73P1) fps ∼6%
AMD Radeon RX 6800S, R9 6900HS
Asus ROG Zephyrus G14
15.9 (1.024min, 2.12P0.1, 6.24P1) fps ∼5%
NVIDIA GeForce RTX 3050 Ti Laptop GPU, i7-11800H
XMG Focus 17 @75 W TGP
6.58 (1.237min, 1.261P0.1, 2.82P1) fps ∼2%

注意事项

由于游戏测试非常耗时,而且经常受到安装或激活限制的限制,我们只能为您提供文章发表时的部分基准测试。更多的显卡将在未来几天和几周内安装。

Overview

Show Restrictions
PosModel< PrevNext >The Quarry
 The Quarry (2022)
low
1920x1080
Low Preset
med.
1920x1080
Medium Preset
high
1920x1080
High Preset
ultra
1920x1080
Ultra Preset
QHD
2560x1440
Ultra Preset
4K
3840x2160
Ultra Preset
NVIDIA GeForce RTX 4090
420n13
334n13
284n13
252n13
193.8n13
76.5n13
AMD Radeon RX 7900 XTX
371.5n2
297n2
248.5n2
201.25n2
141.2n2
76.35n2
NVIDIA GeForce RTX 4080 Super
384n2
293.5n2
254n2
209n2
148.85n2
82.65n2
NVIDIA GeForce RTX 4080
376
291
249
207
149
79.2
AMD Radeon RX 7900 XT
342
258
216
169.3
118.7
62.4
NVIDIA GeForce RTX 4070 Ti
331.5n2
252n2
211n2
168.05n2
116.45n2
61.05n2
AMD Radeon RX 7900 GRE
282n2
214n2
175.45n2
140.75n2
95.9n2
51.5n2
AMD Radeon RX 6950 XT
310
233.5n2
190.6n2
146.65n2
101.65n2
54.3n2
NVIDIA GeForce RTX 4090 Laptop GPU
278
211
177.3
146.1
100.2
NVIDIA GeForce RTX 3090
279.5n6
216n7
177.7n7
145.9n7
105n7
59n7
NVIDIA GeForce RTX 3080 Ti
285
219
181.5
149.1
106.9
60.3
AMD Radeon RX 7800 XT
257
192
154.3
121.5
84.6
45.9
NVIDIA GeForce RTX 4080 Laptop GPU
206
174.1
142
102.5
48.7
NVIDIA GeForce RTX 3080
203
166.8
134.4
97.2
53.8
NVIDIA GeForce RTX 4070
277
204
167
132.8
90.9
32.5
AMD Radeon RX 6800
258.5n2
169.05n2
135.65n2
103.7n2
71.8n2
43.95n2
AMD Radeon RX 7700 XT
234
172.9
136.9
106.3
73.6
37.8
NVIDIA Titan RTX
219n2
169.05n2
139.2n2
109.4n2
75.5n2
40.8n2
NVIDIA GeForce RTX 3070 Ti
234
174.3
143.5
115.6
81.1
44.4
PosModel< PrevNext >The Quarry
low med. high ultra QHD 4K
NVIDIA GeForce RTX 4060 Ti 16G
201
147.7
124.5
98.6
68.1
22.6
NVIDIA GeForce RTX 4060 Ti 8G
225n3
164.6n3
135.2n3
106n3
71.7n3
22.4n3
NVIDIA GeForce RTX 3080 Ti Laptop GPU
151
126
101
NVIDIA GeForce RTX 4070 Laptop GPU
146
122.1
98
68.2
28.7
AMD Radeon RX 6750 XT
191.2n2
144.55n2
115.65n2
86.3n2
59.2n2
29.15n2
AMD Radeon RX 6700 XT
178.25n2
133.8n2
107.75n2
82.45n2
54n2
27.5n2
NVIDIA GeForce RTX 3080 Laptop GPU
152.5
121.4n2
99.7n2
79.85n2
55.6n2
30.6n2
NVIDIA GeForce RTX 3060 Ti
189.05n2
139.55n2
115.15n2
91.35n2
63.7n2
22.75n2
Intel Arc A770
125.4
100
80.4
61.5
43.4
22.4
NVIDIA GeForce RTX 4060
174
126
103
80.5
54.7
17.5
AMD Radeon RX 7600
168.5
124.5
101.3
74.6
49.4
22.8
NVIDIA GeForce RTX 3070 Ti Laptop GPU
152.9n2
119.9n2
99.95n2
80.75n2
56.1
NVIDIA GeForce RTX 4060 Laptop GPU
135.85n2
104.7n2
86.6n2
67.55n2
AMD Radeon RX 6800M
105.7
88.6
69.2
45.4
23.2
AMD Radeon RX 6650 XT
158.5n3
120.8n3
96.7n3
70.4n3
44.5n3
15.8n3
NVIDIA GeForce RTX 3070 Laptop GPU
155.9
118.05n2
98.85n2
78n2
55.5
28.3
AMD Radeon RX 6800S
88.1
68
49.9
32.6
15.9
AMD Radeon RX 7600M XT
145.1
108
88.7
66.8
39.4
11.6
Intel Arc A750
116.7
90.9
74
56.9
39.5
20.3
NVIDIA Titan X Pascal
146.75n2
110.3n2
89.35n2
69.25n2
47.55n2
25.2n2
PosModel< PrevNext >The Quarry
low med. high ultra QHD 4K
NVIDIA GeForce RTX 2070 Super (Desktop)
161.25n2
124.2n2
100.25n2
76.55n2
51.4n2
23.4n2
AMD Radeon RX 5700 XT (Desktop)
135.95n2
107.1n2
86.4n2
63.9n2
42.25n2
20.45n2
NVIDIA GeForce RTX 3060 Laptop GPU
126.9
94.05n2
80n3
64.1n3
40.8
20.7
AMD Radeon RX 7600S
95
77.9
57.1
37.9
12.8
Intel Arc A580
111.5
86.5
69.4
53
35.6
16.6
NVIDIA GeForce RTX 2060 Super (Desktop)
136.4n2
103.5n2
83.25n2
64.1n2
43.4n2
19.95n2
Intel Arc A770M
108
84.9
69.3
52.9
35.9
18.8
AMD Radeon RX 6600
123.4n2
92.5n2
74.9n2
55.1n2
33.95n2
16.35n2
AMD Radeon RX 5700 (Desktop)
120.65n2
94.65n2
76.75n2
56.05n2
36.5n2
13.55n2
AMD Radeon RX 6600M
118n2
91n3
73.3n3
52.1n3
33.9n2
13.4n2
AMD Radeon RX 6700S
95.3
76.1
54.8
35.3
NVIDIA GeForce RTX 3050
105.7
76.9
62.5
49
33.4
10.3
AMD Radeon RX 5600 XT (Desktop)
116.15n2
90.85n2
73.85n2
53.6n2
35.1n2
13.55n2
NVIDIA GeForce GTX 1660 Super (Desktop)
96.85n2
72.5n2
59.7n2
45.15n2
26.25n2
8.24n2
AMD Radeon RX 6500 XT
78.95n2
57.6n2
45.35n2
25.7n2
8.73n2
4.23
AMD Radeon RX 5500 XT (Desktop)
75.3
57.7n2
46.8n2
54.2n2
22.55n2
9.21n2
NVIDIA GeForce RTX 4050 Laptop GPU
91
88.45n2
72.3n2
56n2
35.4n2
10.6
Intel Arc A730M
58.9
47.5
38.1
24.8
NVIDIA GeForce GTX 1660 Ti Mobile
91.7
69
56.2
42.8
NVIDIA GeForce RTX 3050 Ti Laptop GPU
67.1n3
55.3n3
42.4n3
28.6
6.58
PosModel< PrevNext >The Quarry
low med. high ultra QHD 4K
NVIDIA GeForce GTX 1660 (Desktop)
90.2n2
67.45n2
54.6n2
36.4n2
18.55n2
6.06n2
NVIDIA GeForce GTX 1650 Super (Desktop)
79.55n2
56.1n2
51.4n2
28.45n2
14.65n2
4.26n2
NVIDIA GeForce RTX 3050 4GB Laptop GPU
85.5
56.35n2
46.15n2
35.7n2
AMD Radeon RX 6500M
64.1
48.3
38.9
25.4
NVIDIA GeForce GTX 1060 Mobile
57.7
43.4
35.6
25.8
NVIDIA GeForce GTX 1650 Ti Mobile
60.7
44.5
36.1
27.5
AMD Radeon RX 5500M
65.5
47
40.3
23.8
NVIDIA GeForce RTX 2050 Mobile
50.7
36.9
30.7
23.6
NVIDIA GeForce GTX 1650 Mobile
57
41.6
34.3
25.3
Intel Arc A380
44.8
34.3
27.4
20.2
AMD Radeon 780M
37.2
27.8
22.3
15.6
NVIDIA GeForce GTX 1050 Ti Mobile
42.4
30.8
23.5
14.4
AMD Radeon 680M
35.05n2
25.75n2
19.65n2
12
NVIDIA GeForce MX450
30
21.1
14.9
9.31
NVIDIA GeForce GTX 1050 Mobile
35.8
25.2
19
11.6
AMD Radeon 660M
24.5
18
14.4
AMD Radeon RX 560X (Laptop)
31.2
23.9
18.9
12.8
Intel Iris Xe Graphics G7 96EUs
16.1
11.8
9.87
7.51
NVIDIA GeForce MX350
23.5
16.7
11.1
AMD Radeon RX 550 (Laptop)
16.8
12.3
PosModel< PrevNext >The Quarry
low med. high ultra QHD 4K
NVIDIA GeForce MX250
19.4
14.1
10.4
Intel Iris Xe Graphics G7 80EUs
11.7n2
8.65n2
6.25n2
AMD Radeon 540X
14
10.3
Intel UHD Graphics 64EUs (Alder Lake 12th Gen)
13.8
Intel Iris Plus Graphics G7 (Ice Lake 64 EU)
11
AMD Radeon RX Vega 10
17.3
12.5
9.97
Intel UHD Graphics Xe G4 48EUs
8.07
6.42
Intel UHD Graphics Xe 32EUs (Tiger Lake-H)
8.24
Intel UHD Graphics 770
8.05
AMD Radeon RX Vega 8 (Ryzen 4000/5000)
16.6n3
11.4n3
8.8n3
6.12
AMD Radeon RX Vega 7
18.4n2
13.05n2
10.32n2
6.76n2
NVIDIA GeForce MX130
12.2
9.01
AMD Radeon RX Vega 8 (Ryzen 2000/3000)
10.7
NVIDIA GeForce 930MX
9.93
Intel Iris Graphics 550
5.4
AMD Radeon RX Vega 6 (Ryzen 4000/5000)
15.7
11.6
AMD Radeon RX Vega 5
11.6
Intel UHD Graphics G1 (Ice Lake 32 EU)
5.32
Intel UHD Graphics Xe 16EUs (Tiger Lake-H)
3.52
AMD Radeon R5 M255
6.25
PosModel< PrevNext >The Quarry
low med. high ultra QHD 4K
AMD Radeon RX Vega 3
7.15
(-) * Smaller values are better. / n123 Number of benchmarks for this median value / * Approximate position


Legend
5Stutters – This game is very likely to stutter and have poor frame rates. Based on all known benchmarks using the specified graphical settings, average frame rates are expected to fall below 25fps
May Stutter – This graphics card has not been explicitly tested on this game. Based on interpolated information from surrounding graphics cards of similar performance levels, stutters and poor frame rates are expected.
30Fluent – Based on all known benchmarks using the specified graphical settings, this game should run at or above 25fps
40Fluent – Based on all known benchmarks using the specified graphical settings, this game should run at or above 35fps
60Fluent – Based on all known benchmarks using the specified graphical settings, this game should run at or above 58fps
May Run Fluently – This graphics card has not been explicitly tested on this game. Based on interpolated information from surrounding graphics cards of similar performance levels, fluent frame rates are expected.
?Uncertain – This graphics card experienced unexpected performance issues during testing for this game. A slower card may be able to achieve better and more consistent frame rates than this particular GPU running the same benchmark scene.
Uncertain – This graphics card has not been explicitly tested on this game and no reliable interpolation can be made based on the performances of surrounding cards of the same class or family.
The value in the fields displays the average frame rate of all values in the database. Move your cursor over the value to see individual results.

Test systems

XMG Neo 15 (RTX 3080) - 点击照片,打开配置器 (bestware.com)
XMG Neo 17 (RTX 3070) - 点击照片,打开配置器 (bestware.com)
XMG Core 15 (RTX 3060) - 点击照片打开配置器 (bestware.com)
XMG Focus 17 (RTX 3050 Ti) - 点击照片打开配置器 (bestware.com)

设备
显卡 处理器 内存 操作系统
XMG Neo 15 NvidiaGeForce RTX 3080 @165 W TGP (16 GB GDDR6) Intel Core i7-11800H 2 x 16 GB DDR4 Windows 11
XMG Neo 17 NvidiaGeForce RTX 3070 @140 W TGP (8 GB GDDR6) Intel Core i7-11800H 2 x 16 GB DDR4 Windows 11
XMG Core 15 NvidiaGeForce RTX 3060 @130 W TGP (6 GB GDDR6) Intel Core i7-11800H 2 x 16 GB DDR4 Windows 11
XMG Focus 17 NvidiaGeForce RTX 3050 Ti @75 W TGP (4 GB GDDR6) Intel Core i7-11800H 2 x 16 GB DDR4 Windows 11
华硕ROG Strix G15 AMD Radeon RX 6800M(12 GB GDDR6) AMD Ryzen 9 5900HX 2 x 8 GB DDR4 Windows 11
华硕ROG Zephyrus G14 AMD Radeon RX 6800S(8 GB GDDR6) AMD Ryzen 9 6900HS 2 x 16 GB DDR4 Windows 11
微星 Prestige 14 Evo Intel Iris Xe (96 CUs) Intel Core i7-1185G7 1 x 16 GB DDR4 Windows 11
Acer Swift 3 AMD Radeon Vega 7 AMD Ryzen 7 4700U 2 x 4 GB DDR4 Windows 11
台式电脑 I MSIGeForce RTX 3090 (24 GB GDDR6X)
MSIGeForce RTX 3080 (10 GB GDDR6X)
MSIGeForce RTX 3070 (8 GB GDDR6)
Intel Core i9-12900K 2 x 16 GB DDR4 Windows 11
桌面-PC II NvidiaGeForce RTX 3090 FE (24 GB GDDR6X)
NvidiaGeForce RTX 3060 (12 GB GDDR6X)
Nvidia Titan RTX (24 GB GDDR6)
NvidiaGeForce RTX 2070 Super (8 GB GDDR6) Nvidia
GeForce RTX 2060 Super (8 GB GDDR6)
KFA2GeForce GTX 1660 Super (6 GB GDDR6)
PNYGeForce GTX 1660 (6 GB GDDR5)
KFA2GeForce GTX 1650 Super (4 GB GDDR6)
AMD RadeonRX 6700 XT (12 GB DDR6)
AMD Radeon RX 6600 XT (8 GB GDDR6)
AMD Radeon RX 6600 (8 GB GDDR6)
AMD Radeon RX 5700 XT (8 GB GDDR6)
AMD RadeonRX 5700 (8 GB GDDR6)
AMD Radeon RX 5600 XT (6 GB GDDR6)
AMD Radeon RX 5500 XT (8 GB GDDR6)
AMD Ryzen 9 5900X 2 x 32 GB DDR4 Windows 10 64 Bit
桌面电脑III NvidiaGeForce RTX 2080 Super FE Intel Core i9-11900K 2 x 8 GB DDR4 Windows 11
4K显示器 Nvidia驱动 AMD驱动
华硕PB287Q,飞利浦Brilliance 329P9H, 宏碁Predator XB321HK ForceWare 516.40 Adrenalin 22.5.2
Please share our article, every link counts!
> Notebookcheck中文版(NBC中国) > 评测 > 测试中的 "采石场"。笔记本和台式机基准测试
Florian Glaser, 2022-06-23 (Update: 2022-06-23)