Notebookcheck Logo

High On Life回顾。笔记本电脑和台式机基准测试

嗑药是什么感觉。 你不会真的想知道《High on Life》的创作者在开发游戏时是怎么想的。这个标题变成了过去几年中最有趣、最有创意的第一人称射击游戏之一。但是,引擎是否也像展示的机智一样被优化了呢?
Gaming Laptop / Notebook Desktop Gamecheck
生命的高度

技术审查

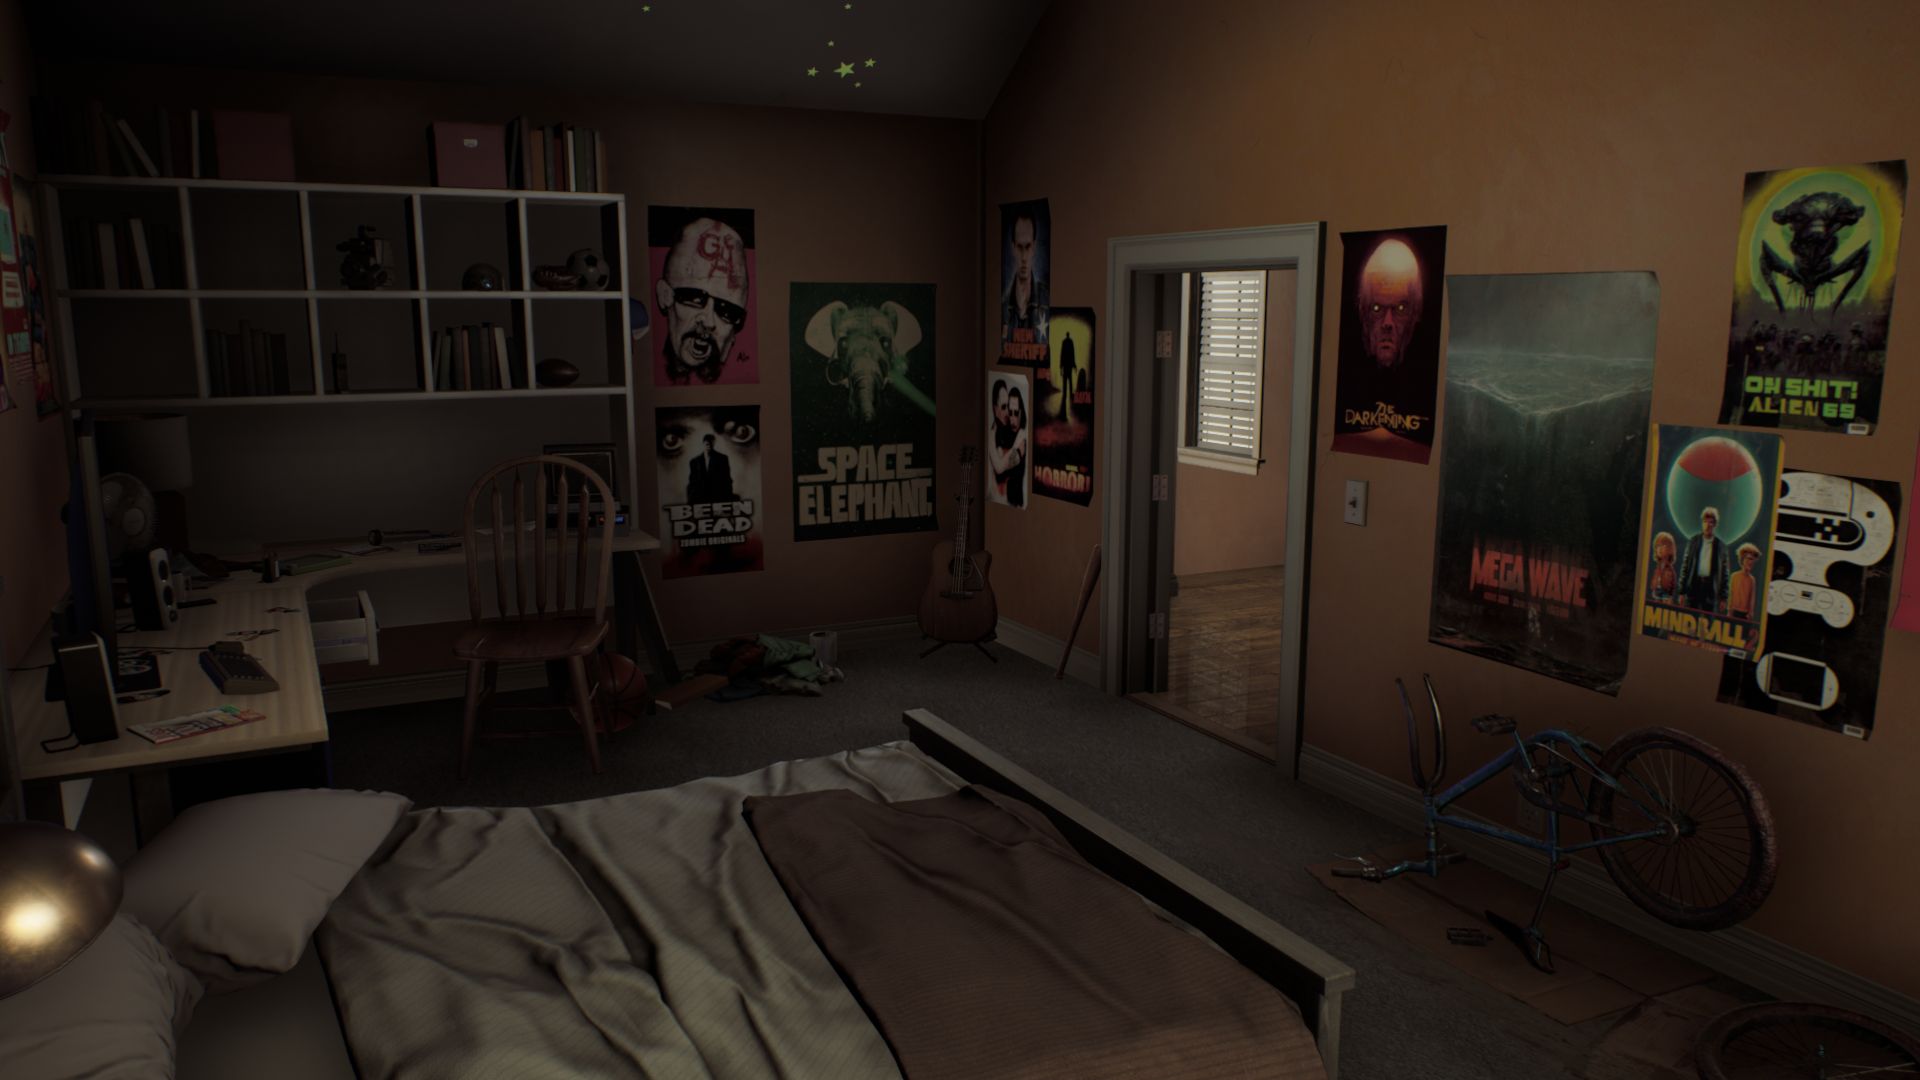
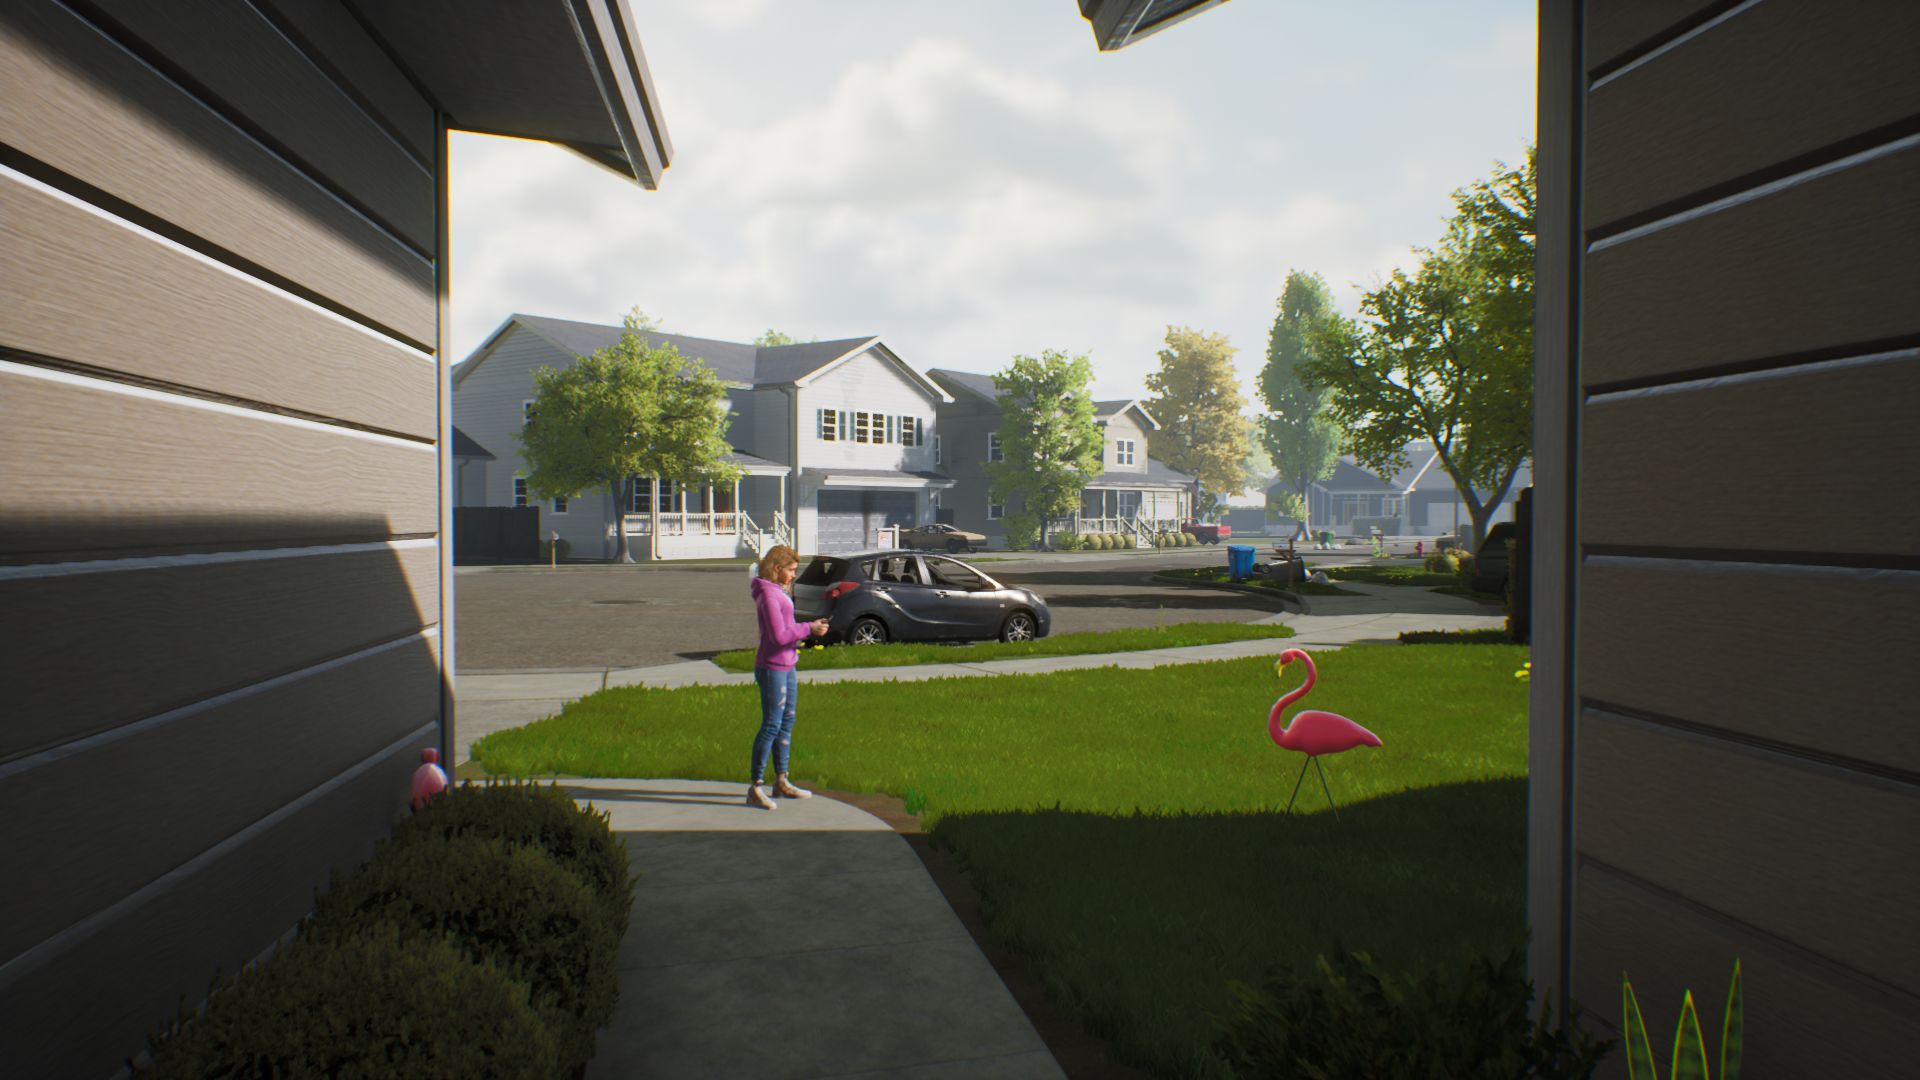
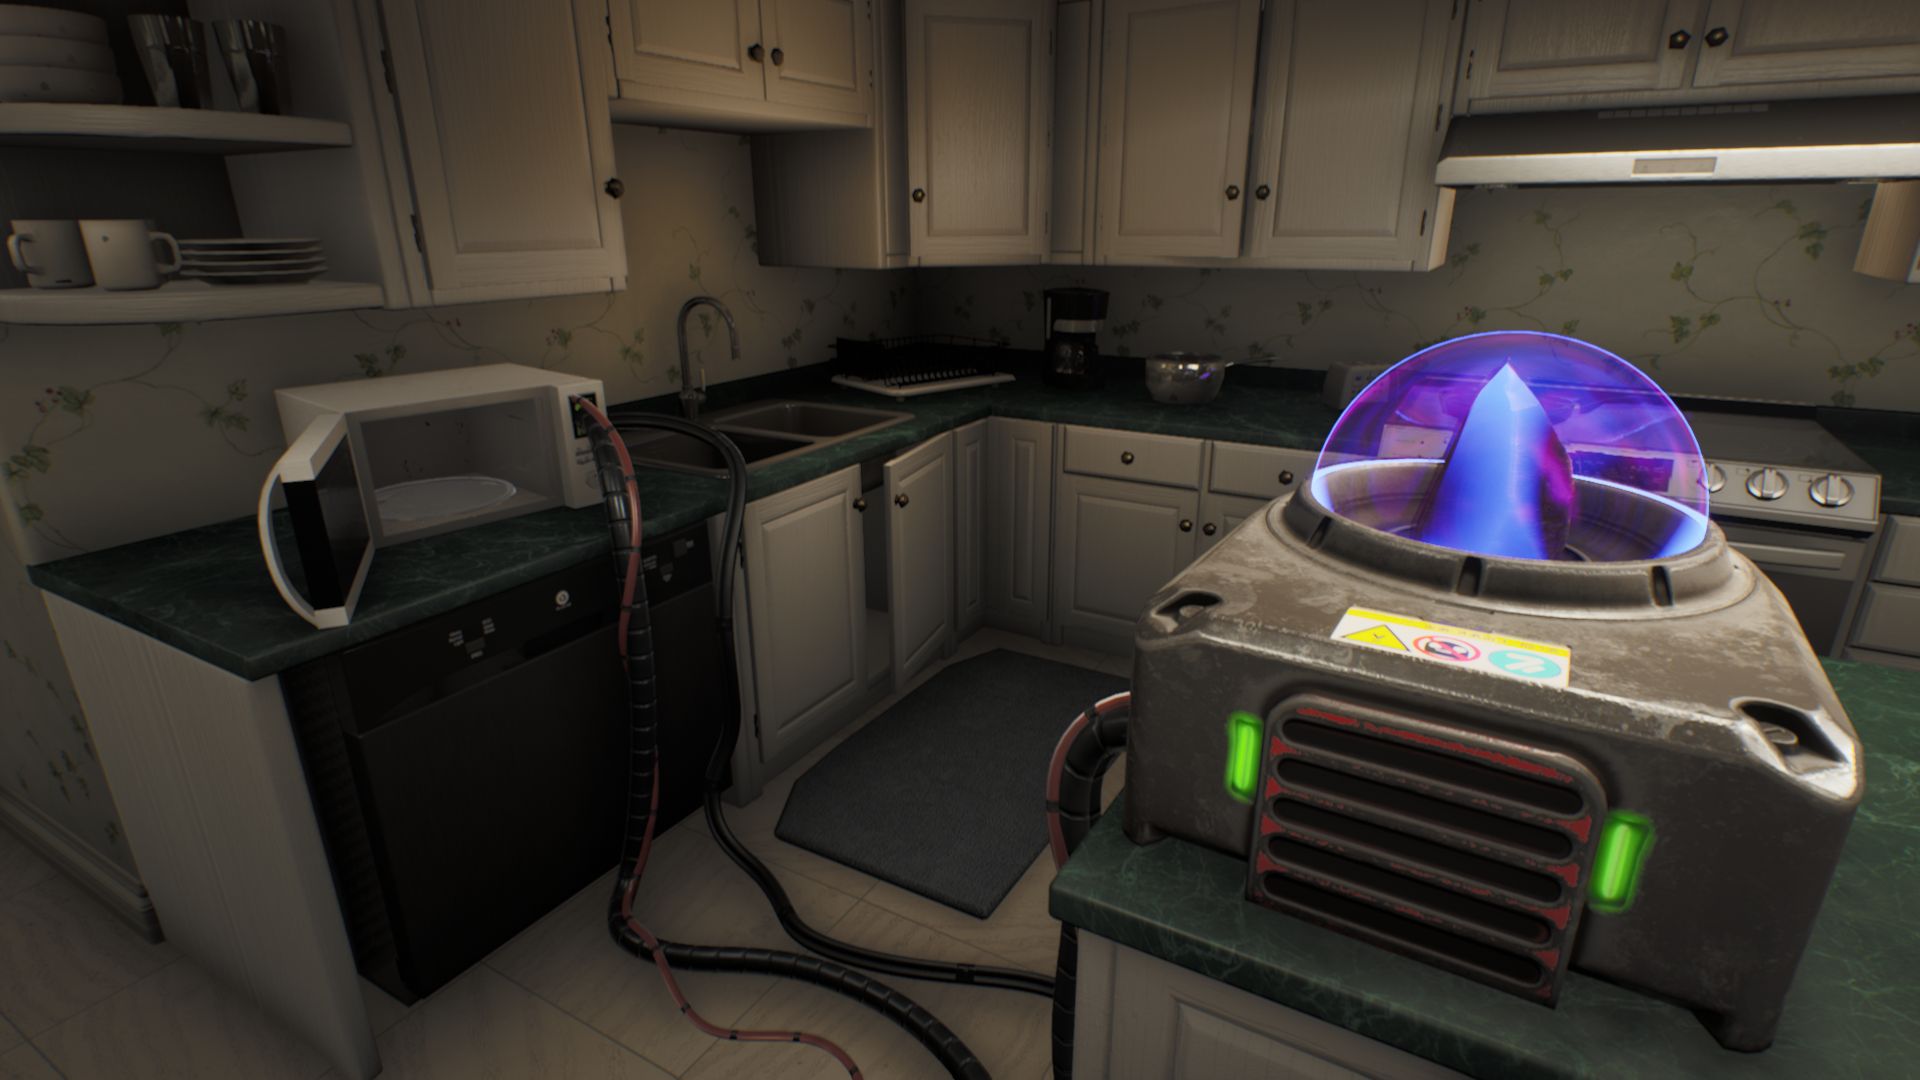
High on Life是由Squanch Games制作的,这是一个以前不太知名的工作室,它建立在流行和非常成功的虚幻引擎4上。仔细观察,你会发现它的画面有一些弱点(例如,面部动画相当粗糙)。也就是说,这款第一人称射击游戏绝对是一款好看的游戏。

生命的高度
生命的高度
生命的高度
生命的高度
生命的高度
生命的高度

在中等及以上的设置下,《High on Life》具有相当令人印象深刻的视觉效果,尤其是极富色彩的表现,高对比度和古怪的武器设计。游戏中还有一些设计非常周到的区域,细节也很好(见截图)。总的来说,这款游戏以其怪异和自嘲的氛围以及悠闲的游戏和枪械游戏而脱颖而出,你已经从《严肃的山姆》等游戏中了解到了这一点。 严肃的山姆边境之地系列游戏中了解到的。

生命的高度
生命的高度
生命的高度
生命的高度
生命的高度
生命的高度

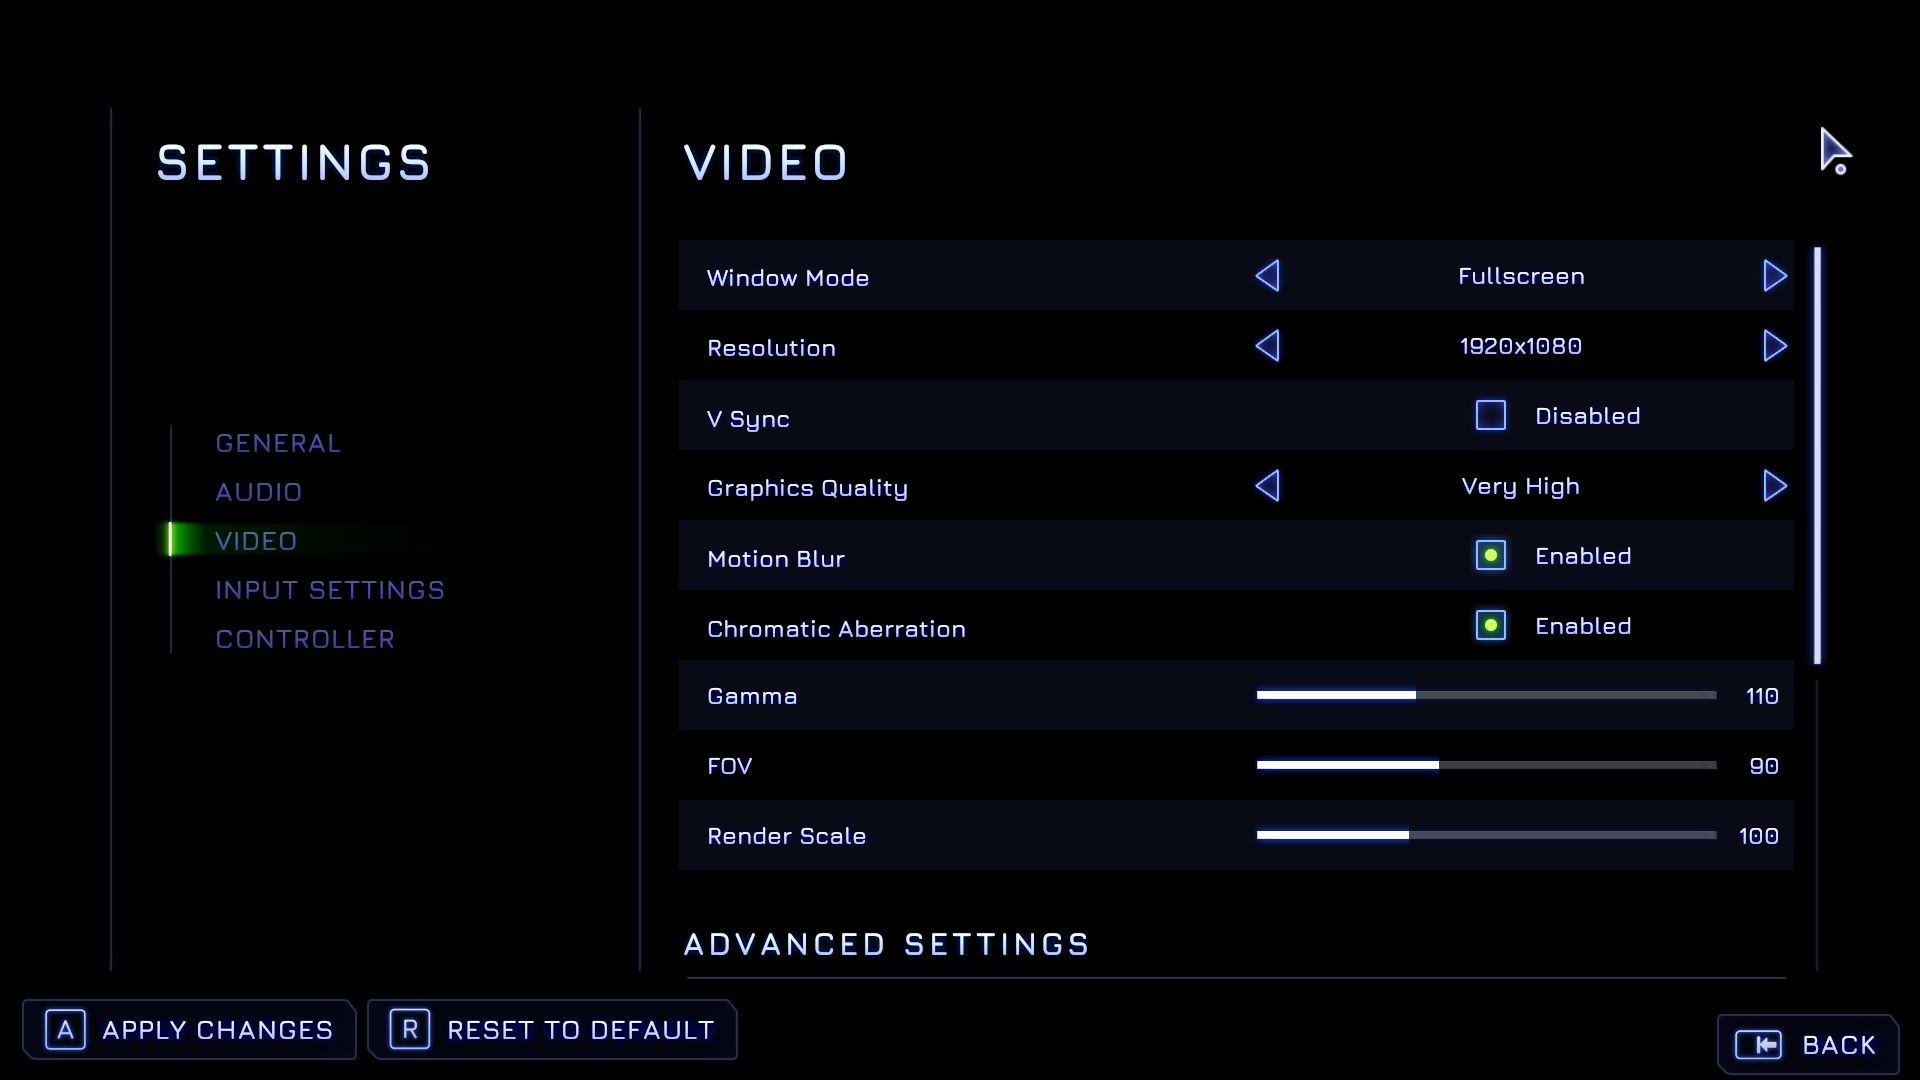
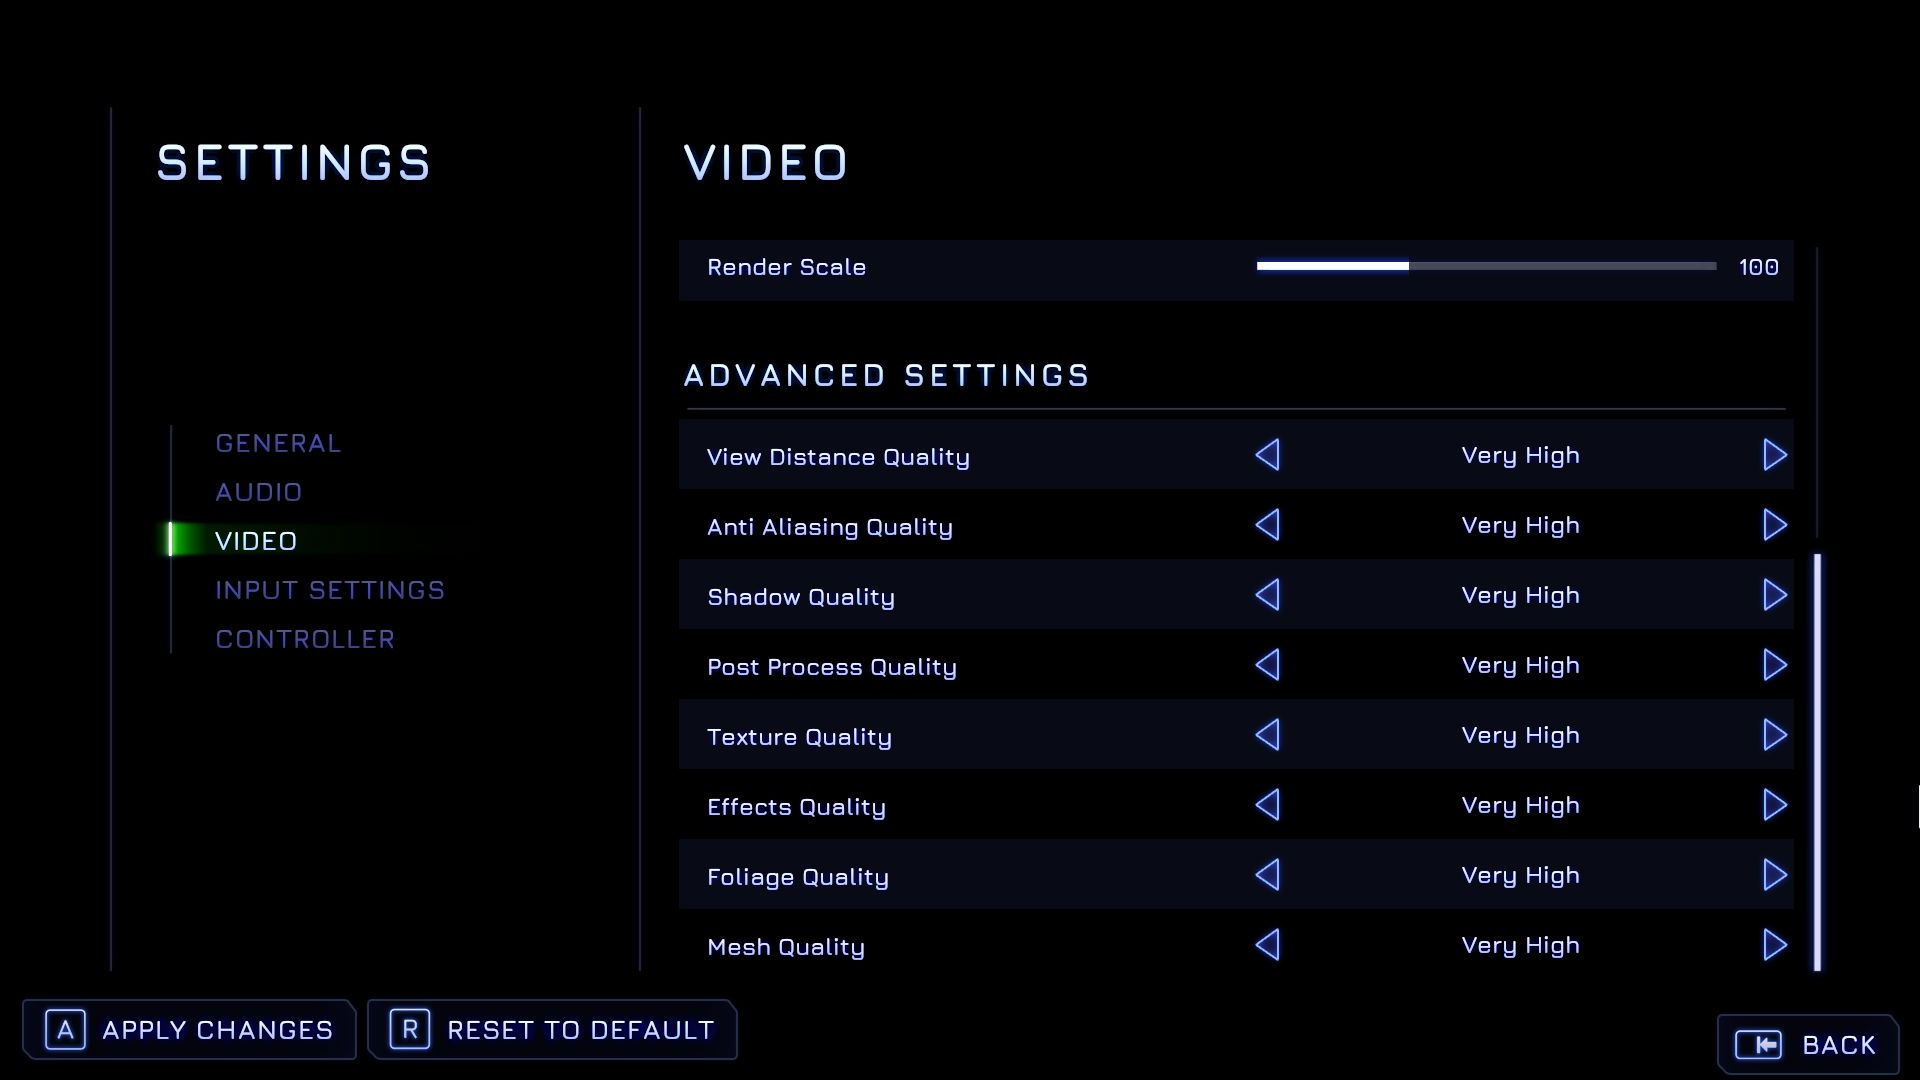
图形菜单也同样令人印象深刻。即使许多三A级游戏相比之下提供了更多的选项,但《High on Life》中的设置数量对于一个PC游戏来说是足够的。在菜单的顶部,用户可以改变窗口模式、分辨率、伽玛、FOV和渲染比例等设置。还有用于VSync、运动模糊和色差的切换开关。在下面,你会发现高级选项部分有八个质量设置,可以通过调整 "图形质量 "一次性改变,而无需重新启动。

生命的高度
生命的高度
生命的高度
生命的高度
生命的高度
生命的高度

从技术角度看,该游戏感觉相当成熟。然而,在加载时,游戏和它的主菜单在某些系统上会有一点卡顿(特别是那些使用英特尔和AMD GPU的系统)。值得庆幸的是,加载时间很短。High on Life》占用了大约50GB的存储空间(我们的基准测试使用的是Steam版本)。

生命的高度
生命的高度

基准

对于基准测试,我们使用了时尚的外星城市,主角在介绍部分和教程后不久就到达了那里。我们使用CapFrameX在预定义的路线上记录了游戏的性能,大约30秒。你可以在下面的视频中看一下这个部分。在我们看来,如果平均帧率至少为40帧,《High on Life》是可以玩的。但理想情况下,游戏应该以60帧或更高的速度运行。

结果


FHD (1,920 x 1,080)

各种图形预设之间存在着非常明显的性能差异。英特尔的iGPU最多只能在1,280 x 720和最低设置下运行游戏,而AMD的更强大的iGPU(如 Radeon 680M)可以在1,920 x 1,080和中等设置下处理该游戏。A GeForce RTX 3050 Ti或更高的配置才能在全高清状态下以最高设置运行该游戏。

High On Life
    1920x1080 Low Preset     1920x1080 Medium Preset     1920x1080 High Preset     1920x1080 Very High Preset
AMD Radeon RX 7900 XTX, i9-12900K
Desktop-PC
369 (21.5min, 112.5P0.1, 216P1) fps ∼53%
298 (75.3min, 105.1P0.1, 157.6P1) fps ∼46%
273 (87.7min, 112.7P0.1, 157.6P1) fps ∼47%
222 (79.7min, 113.5P0.1, 139P1) fps ∼39%
NVIDIA GeForce RTX 3080, i9-12900K
Desktop-PC
348 (86.5min, 165.6P0.1, 235P1) fps ∼50%
275 (89.4min, 128.8P0.1, 168.4P1) fps ∼43%
206 (61.4min, 102.3P0.1, 129.9P1) fps ∼36%
170.9 (56.5min, 88.5P0.1, 108.8P1) fps ∼30%
NVIDIA GeForce RTX 3070, i9-12900K
Desktop-PC
324 (92.8min, 149.8P0.1, 207P1) fps ∼47%
219 (56.8min, 105.7P0.1, 134.9P1) fps ∼34%
171.5 (52.3min, 77.7P0.1, 106.4P1) fps ∼30%
136.2 (61.1min, 66.2P0.1, 88.7P1) fps ∼24%
NVIDIA GeForce RTX 3080 Ti Laptop GPU, i9-12900HX
MSI Titan GT77 12UHS
252 (59.7min, 88.3P0.1, 142.7P1) fps ∼37%
204 (30.2min, 71.1P0.1, 104.9P1) fps ∼32%
154.1 (48.9min, 59P0.1, 84.8P1) fps ∼27%
129.7 (51.5min, 62.5P0.1, 73.8P1) fps ∼23%
AMD Radeon RX 6800M, R9 5900HX
Asus ROG Strix G15
168.5 (23.1min, 50.5P0.1, 73.9P1) fps ∼24%
122.9 (39.8min, 44.1P0.1, 63.2P1) fps ∼19%
108.1 (36.2min, 47.6P0.1, 56.4P1) fps ∼19%
95.3 (19.7min, 42.3P0.1, 53.1P1) fps ∼17%
NVIDIA GeForce RTX 3060 Laptop GPU, i7-12700H
Lenovo Legion 5 Pro
223 (54.2min, 93.3P0.1, 144.4P1) fps ∼32%
156.7 (31min, 72.1P0.1, 98.8P1) fps ∼24%
109.3 (32.8min, 43.3P0.1, 69.2P1) fps ∼19%
86.9 (18.1min, 31P0.1, 57.6P1) fps ∼15%
AMD Radeon RX 6600M, R7 5800H
Lenovo Legion 5
164 (53.7min, 68.6P0.1, 91.2P1) fps ∼24%
120.3 (39.2min, 55.5P0.1, 67.3P1) fps ∼19%
100.8 (43.9min, 47.5P0.1, 57.7P1) fps ∼17%
79.7 (35.5min, 43.3P0.1, 48.4P1) fps ∼14%
AMD Radeon RX 6800S, R9 6900HS
Asus ROG Zephyrus G14
170.1 (24.8min, 65.1P0.1, 118.5P1) fps ∼25%
125 (54.4min, 62.7P0.1, 76.2P1) fps ∼19%
101.6 (44.5min, 48.6P0.1, 61.6P1) fps ∼18%
76.1 (30.1min, 44.6P0.1, 53.2P1) fps ∼13%
AMD Radeon 680M, R9 6900HS
Asus ROG Zephyrus G14
63.1 (32.4min, 33.1P0.1, 36.6P1) fps ∼9%
45 (21.7min, 23.4P0.1, 25.9P1) fps ∼7%
33.8 (18.1min, 18.1P0.1, 19.8P1) fps ∼6%
25.7 (12.2min, 12.7P0.1, 14.8P1) fps ∼4%
Intel Iris Xe Graphics G7 96EUs, i7-1165G7
Zotac ZBOX CI665 Nano
31.8 (13.3min, 14.6P0.1, 18.2P1) fps ∼5%
19.3 (7.45min, 7.54P0.1, 8.74P1) fps ∼3%
18.3 (6.12min, 6.21P0.1, 6.87P1) fps ∼3%
12.8 (4.46min, 4.52P0.1, 6.45P1) fps ∼2%

QHD (2,560 x 1,440)

要在2,560 x 1,440和Ultra预设下玩游戏,你至少应该有一块中上等的显卡,如 GeForce RTX 3060Radeon RX 6600M.

High On Life
    2560x1440 Very High Preset
AMD Radeon RX 7900 XTX, i9-12900K
Desktop-PC
151.8 (73.4min, 80.2P0.1, 90.7P1) fps ∼33%
NVIDIA GeForce RTX 3080, i9-12900K
Desktop-PC
108.5 (53.5min, 55.3P0.1, 65.9P1) fps ∼24%
NVIDIA GeForce RTX 3070, i9-12900K
Desktop-PC
84.8 (37.8min, 42.7P0.1, 55.8P1) fps ∼19%
NVIDIA GeForce RTX 3080 Ti Laptop GPU, i9-12900HX
MSI Titan GT77 12UHS
82 (35.4min, 41P0.1, 52P1) fps ∼18%
AMD Radeon RX 6800M, R9 5900HX
Asus ROG Strix G15
63.1 (35.2min, 35.7P0.1, 39.5P1) fps ∼14%
NVIDIA GeForce RTX 3060 Laptop GPU, i7-12700H
Lenovo Legion 5 Pro
52.1 (23.5min, 24.5P0.1, 30.2P1) fps ∼11%
AMD Radeon RX 6600M, R7 5800H
Lenovo Legion 5
46.1 (22.7min, 23.3P0.1, 26.8P1) fps ∼10%

UHD (3,840 x 2,160)

一旦我们达到3840 x 2160,不仅游戏的图形要求变得更高,而且与其他游戏相比,这种增加也是不成比例地大。在这个分辨率下,即使是高端桌面CPU,如GeForce RTX 3080,也有他们的工作要做了。

High On Life
    3840x2160 Very High Preset
AMD Radeon RX 7900 XTX, i9-12900K
Desktop-PC
72.1 (31min, 36P0.1, 42.1P1) fps ∼17%
NVIDIA GeForce RTX 3080, i9-12900K
Desktop-PC
44 (20min, 20.2P0.1, 22.9P1) fps ∼10%
NVIDIA GeForce RTX 3070, i9-12900K
Desktop-PC
35.9 (14.9min, 15.8P0.1, 19.2P1) fps ∼8%
NVIDIA GeForce RTX 3080 Ti Laptop GPU, i9-12900HX
MSI Titan GT77 12UHS
34.6 (14.8min, 15.6P0.1, 19.1P1) fps ∼8%
AMD Radeon RX 6800M, R9 5900HX
Asus ROG Strix G15
26.8 (13.5min, 14.5P0.1, 16P1) fps ∼6%
NVIDIA GeForce RTX 3060 Laptop GPU, i7-12700H
Lenovo Legion 5 Pro
21.2 (9.32min, 9.73P0.1, 10.8P1) fps ∼5%
AMD Radeon RX 6600M, R7 5800H
Lenovo Legion 5
19.5 (7.94min, 8.08P0.1, 8.67P1) fps ∼5%

注意事项

由于游戏测试非常耗时,而且经常受到安装或激活限制的制约,因此在发表本文时,我们只能为您提供部分基准测试结果。我们将在未来几天和几周内增加更多的显卡。

Overview

Show Restrictions
PosModel< PrevNext >High On Life
 High On Life (2023)
low
1920x1080
Low Preset
med.
1920x1080
Medium Preset
high
1920x1080
High Preset
ultra
1920x1080
Very High Preset
QHD
2560x1440
Very High Preset
4K
3840x2160
Very High Preset
NVIDIA GeForce RTX 4090
437n5
390n5
331n5
300n5
224n5
107.8n5
AMD Radeon RX 7900 XTX
405n2
345n2
304.5n2
249n2
161.75n2
76.35n2
NVIDIA GeForce RTX 4080 Super
465.5n2
404.5n2
324.5n2
278.5n2
178.5n2
76.4n2
NVIDIA GeForce RTX 4080
304
258
226
157.1
71.5
NVIDIA GeForce RTX 4070 Ti
383
317
248
205
132.3
57.2
AMD Radeon RX 7900 GRE
323n2
272.5n2
214.35n2
175.4n2
110.5n2
49.85n2
AMD Radeon RX 6950 XT
385
326
255
205
132.7
57.3
NVIDIA GeForce RTX 4090 Laptop GPU
277
246
211
182.75n2
123.15n2
54.45n2
NVIDIA GeForce RTX 3090
384
303
230
189.7
121.4
52.7
AMD Radeon RX 7800 XT
354
286
217
170.5
105.2
44.3
NVIDIA GeForce RTX 4080 Laptop GPU
214
162.8
148.4
100.6
42.6
NVIDIA GeForce RTX 3080
348
275
206
170.9
108.5
44
NVIDIA GeForce RTX 4070
406
267
213
169.7
106.3
45.7
AMD Radeon RX 6800
361
252
181.9
142.8
90.2
38.4
AMD Radeon RX 7700 XT
350
263
194.1
150.3
89.6
38
NVIDIA Titan RTX
339
235
172.6
136.6
87.1
39.6
NVIDIA GeForce RTX 4060 Ti 16G
323
216
160.5
129.1
77.8
32.7
NVIDIA GeForce RTX 4060 Ti 8G
338n3
220n3
164.3n3
139n3
77.4n3
32.2n3
NVIDIA GeForce RTX 3080 Ti Laptop GPU
252
204
154.1
129.7
82
34.6
PosModel< PrevNext >High On Life
low med. high ultra QHD 4K
NVIDIA GeForce RTX 4070 Laptop GPU
228n2
178.35n4
132.85n4
109.55n4
66.9n3
25.7
NVIDIA GeForce RTX 3070
324
219
171.5
136.2
84.8
35.9
AMD Radeon RX 6750 XT
336
218
166.4
132.5
78.8
32
AMD Radeon RX 6700 XT
317
195.6
158.6
118.9
73.4
30.1
NVIDIA GeForce RTX 3080 Laptop GPU
204
177.2
133
109.8
67
28.8
NVIDIA GeForce RTX 3060 Ti
230.75n2
160.9n2
124.55n2
103.55n2
65.85n2
28n2
Intel Arc A770
268
175.3
142.5
113.7
73
33.7
NVIDIA GeForce RTX 4060
287
170.6
141.3
109
65.1
26.4
AMD Radeon RX 7600
283
180.7
141.2
106.2
62.9
26.2
NVIDIA GeForce RTX 3070 Ti Laptop GPU
175.7
139.4
117.5
97.1
60.8
NVIDIA GeForce RTX 4060 Laptop GPU
191.6n2
144.4n2
108.85n2
85.55n2
AMD Radeon RX 6800M
168.5
122.9
108.1
95.3
63.1
26.8
AMD Radeon RX 6650 XT
289
179.3
142.2
107.8
62
24.5
NVIDIA GeForce RTX 3070 Laptop GPU
216
157
170.15n2
103
65.5
27.6
AMD Radeon RX 6800S
170.1
125
101.6
76.1
AMD Radeon RX 7600M XT
270
130.8
168.5
101.1
57.1
20
Intel Arc A750
241
158.2
130.8
104.3
66.5
30.9
NVIDIA Titan X Pascal
231
147.2
115.5
93
57.5
25.1
NVIDIA GeForce RTX 2070 Super (Desktop)
260
164
125
98.9
59.7
26
AMD Radeon RX 5700 XT (Desktop)
256
155.8
127.1
98
59.1
26.7
PosModel< PrevNext >High On Life
low med. high ultra QHD 4K
NVIDIA GeForce RTX 3060 Laptop GPU
200.05n2
145.45n2
104.3n2
83.15n2
52.1
21.2
AMD Radeon RX 7600S
138.7
103.7
80.5
49.1
21
Intel Arc A580
227
141.8
121.9
95.5
59.3
27
NVIDIA GeForce RTX 2060 Super (Desktop)
221
137.7
105.1
86.2
51.2
19.4
Intel Arc A770M
178.5
126.5
99.7
80.9
52.9
24.9
AMD Radeon RX 6600
240n2
159.45n2
121.45n2
94.3n2
54.7n2
23n2
AMD Radeon RX 5700 (Desktop)
224
139.4
110.7
86.2
52.5
23.5
AMD Radeon RX 6600M
181.15n2
135.95n2
104.4n2
82.35n2
47.35n2
19.65n2
NVIDIA GeForce RTX 3050
176.7
108.8
80.7
64.2
38.2
15.5
AMD Radeon RX 5600 XT (Desktop)
211
128.6
104.6
79.7
49.7
23.5
NVIDIA GeForce GTX 1660 Super (Desktop)
172.8
99
79.4
63.6
37.1
15.8
AMD Radeon RX 6500 XT
150.6
81.2
56.2
54.4
32.1
11.8
AMD Radeon RX 5500 XT (Desktop)
147
86.3
72.2
55.5
32.8
14
NVIDIA GeForce RTX 4050 Laptop GPU
104.9
108.2n2
88.6n2
72.2n2
43.25n2
22.9
Intel Arc A730M
147.9
110.1
80.9
64.7
NVIDIA GeForce GTX 1660 Ti Mobile
143.6
95.8
77.7
61.2
NVIDIA GeForce RTX 3050 Ti Laptop GPU
104.7
77.5
60.3
50.8
31.8
NVIDIA GeForce GTX 1660 (Desktop)
157.3
89.9
72.6
57.6
34.8
14.3
NVIDIA GeForce GTX 1650 Super (Desktop)
139.4
76.9
60.1
50.7
31.3
7.78
NVIDIA GeForce RTX 3050 4GB Laptop GPU
98.3
60.2
47.3
39.3
PosModel< PrevNext >High On Life
low med. high ultra QHD 4K
NVIDIA GeForce GTX 1060 Mobile
103.7
59.7
47.8
38.1
NVIDIA GeForce GTX 1650 Ti Mobile
88.05n2
53.1
43.1
Intel Arc A370M
73.4
44.6
40.8
32.6
AMD Radeon RX 5500M
85.3
70.1
60.8
49.5
NVIDIA GeForce RTX 2050 Mobile
77.5
41.2
34.6
28.2
NVIDIA GeForce GTX 1650 Mobile
111.2
60.7
48.7
39.9
Intel Arc A380
102.1
58.5
50.7
37.9
Intel Arc A350M
71.9
42.6
38.2
27.8
18.8
4.36
AMD Radeon 780M
55.4
33.9
29
20.6
AMD Radeon 680M
63.1
45
33.8
25.7
NVIDIA GeForce MX450
29.4
15.8
14
12.4
NVIDIA GeForce GTX 1050 Mobile
60.3
32.3
26.7
22.1
AMD Radeon 760M
50.6
28.8
23.5
AMD Radeon 660M
37.8
23.3
19.2
14.5
AMD Radeon RX 560X (Laptop)
55.8
31.5
26.3
20.4
Intel Iris Xe Graphics G7 96EUs
31.8
19.3
18.3
12.8
NVIDIA GeForce MX350
21.9
14
AMD Radeon RX 550 (Laptop)
12.6
8.67
NVIDIA GeForce MX250
24
14.4
11.6
Intel Iris Xe Graphics G7 80EUs
27.9n2
16.9n2
15.75n2
11.25n2
PosModel< PrevNext >High On Life
low med. high ultra QHD 4K
AMD Radeon 540X
19.9
12.5
Intel UHD Graphics 64EUs (Alder Lake 12th Gen)
33.4
20.1
18.2
Intel Iris Plus Graphics G7 (Ice Lake 64 EU)
24.1
13.4
12
AMD Radeon RX Vega 10
29.9
15.5
13.5
9.55
Intel UHD Graphics Xe 32EUs (Tiger Lake-H)
23.7
14.1
Intel UHD Graphics 770
20.5
12.7
AMD Radeon RX Vega 8 (Ryzen 4000/5000)
40
19.7
18.2
12.2
AMD Radeon RX Vega 7
30.65n2
16.1
16
10.2
NVIDIA GeForce MX130
14.8
8.94
AMD Radeon RX Vega 8 (Ryzen 2000/3000)
17.4
9.8
NVIDIA GeForce 930MX
12.3
AMD Radeon RX Vega 6 (Ryzen 4000/5000)
27
13.9
12.8
AMD Radeon RX Vega 6 (Ryzen 2000/3000)
13.5
AMD Radeon RX Vega 5
21
10.6
Intel UHD Graphics G1 (Ice Lake 32 EU)
11.2
Intel UHD Graphics 630
10.8
Intel UHD Graphics Xe 16EUs (Tiger Lake-H)
9.8
Intel UHD Graphics 620
10.6
AMD Radeon R5 M255
10.1
AMD Radeon RX Vega 3
16.7
7.98
(-) * Smaller values are better. / n123 Number of benchmarks for this median value / * Approximate position


Legend
5Stutters – This game is very likely to stutter and have poor frame rates. Based on all known benchmarks using the specified graphical settings, average frame rates are expected to fall below 25fps
May Stutter – This graphics card has not been explicitly tested on this game. Based on interpolated information from surrounding graphics cards of similar performance levels, stutters and poor frame rates are expected.
30Fluent – Based on all known benchmarks using the specified graphical settings, this game should run at or above 25fps
40Fluent – Based on all known benchmarks using the specified graphical settings, this game should run at or above 35fps
60Fluent – Based on all known benchmarks using the specified graphical settings, this game should run at or above 58fps
May Run Fluently – This graphics card has not been explicitly tested on this game. Based on interpolated information from surrounding graphics cards of similar performance levels, fluent frame rates are expected.
?Uncertain – This graphics card experienced unexpected performance issues during testing for this game. A slower card may be able to achieve better and more consistent frame rates than this particular GPU running the same benchmark scene.
Uncertain – This graphics card has not been explicitly tested on this game and no reliable interpolation can be made based on the performances of surrounding cards of the same class or family.
The value in the fields displays the average frame rate of all values in the database. Move your cursor over the value to see individual results.

Test systems

设备 显卡 处理器 内存 操作系统
笔记本电脑
微星Titan GT77 12UHS NvidiaGeForce RTX 3080 Ti @175 W TGP (16 GB GDDR6) Intel Core i9-12900 2 x 16 GB DDR5 Windows 11
联想Legion 5 Pro NvidiaGeForce RTX 3060 @140 W TGP (6 GB GDDR6) Intel Core i7-12700H 2 x 8 GB DDR5 Windows 11
华硕ROG Strix G15 AMD Radeon RX 6800M(12 GB GDDR6) AMD Ryzen 9 5900HX 2 x 8 GB DDR4 Windows 11
联想Legion 5 AMD Radeon RX 6600M(8 GB GDDR6) AMD Ryzen 7 5800H 2 x 8 GB DDR4 Windows 11
华硕ROG Zephyrus G14 AMD Radeon 680M AMD Ryzen 9 6900HS 2 x 16 GB DDR5 Windows 11
台式电脑
定制 I AMD Radeon RX 7900 XTX (24 GB GDDR6)
MSIGeForce RTX 3080 (10 GB GDDR6X)
MSIGeForce RTX 3070 (8 GB GDDR6)
Intel Core i9-12900K 2 x 16 GB DDR4 Windows 11
Custom II PalitGeForce RTX 4090 GameRock OC (24 GB GDDR6X)
NvidiaGeForce RTX 3090 FE (24 GB GDDR6X)
NvidiaGeForce RTX 3060 Ti (8 GB GDDR6X)
Nvidia Titan RTX (24 GB GDDR6)
Nvidia GeForce RTX 2070 Super (8 GB GDDR6)
NvidiaGeForce RTX 2060 Super (8 GB GDDR6)
KFA2GeForce GTX 1660 Super (6 GB GDDR6)
PNYGeForce GTX 1660 (6 GB GDDR5)
KFA2GeForce GTX 1650 Super(4 GBGDDR6)GDDR6)
AMD Radeon RX 6800(16 GB DDR6)
AMD Radeon RX 6700 XT(12 GB DDR6)
AMD Radeon RX 6650 XT(8 GB GDDR6)
AMD Radeon RX 6600(8 GB GDDR6)
AMD Radeon RX 5700XT (8 GB GDDR6)
AMD Radeon RX 5700 (8 GB GDDR6)
AMD Radeon RX 5600 XT (6 GB GDDR6)
AMD Radeon RX 5500 XT (8 GB GDDR6)
AMD Ryzen 9 7950X 2 x 16 GB DDR5 Windows 11
Custom III NvidiaGeForce RTX 2080 Super FE Intel Core i9-11900K 2 x 8 GB DDR4 Windows 11
迷你电脑
Zotac ZBOX CI665 Nano Intel Iris Xe Graphics G7 (96 CUs) Intel Core i7-1165G7 2 x 8 GB DDR4 Windows 11
Morefine S500+ AMD Radeon RX Vega 8 AMD Ryzen 9 5900HX 2 x 16 GB DDR4 Windows 11
Minisforum NUCXi7 NvidiaGeForce RTX 3070 @125 W TGP (8 GB GDDR6) Intel Core i7-11800H 2 x 8 GB DDR4 Windows 11
Minisforum HX90G AMD Radeon RX 6600M @100 W TGP (8 GB GDDR6) AMD Ryzen 9 5900HX 2 x 16 GB DDR4 Windows 11
4K显示器 Nvidia驱动 AMD驱动
华硕PB287Q,飞利浦Brilliance 329P9H, Gigabyte M32U ForceWare 528.02 Adrenalin 22.11.2
Please share our article, every link counts!
> Notebookcheck中文版(NBC中国) > 评测 > High On Life回顾。笔记本电脑和台式机基准测试
Florian Glaser, 2023-01-26 (Update: 2023-01-26)