Notebookcheck Logo

Intel Core i5-L16G7

Intel i5-L16G7

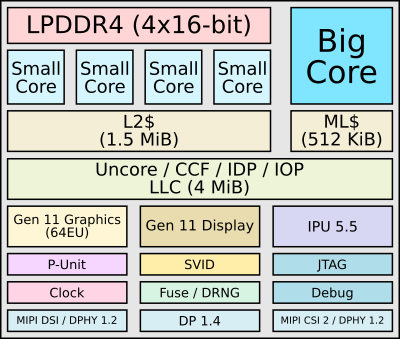
Core i5-L16G7是具有5个基于Lakefield架构的处理器内核的SoC。它使用一个高达3 GHz的快速Sunny Cove内核(从Ice-Lake CPU已知,但没有AVX512)和四个高达2.8 GHz的小型Tremont内核(Atom / Celeron)。全核可达到1.8 GHz,基本频率为1.4 GHz。 CPU不支持HyperThreading / SMT。 SoC的其余部分类似于Ice Lake芯片,例如具有64个EU的Gen 11图形卡(类似于Iris Plus G7,但仅有500 MHz的频率)。

英特尔表示,与旧的Core i7-8500Y(Amber Lake-Y,2核,1.5-4.2 GHz)相比,L16G7在多线程应用程序中的速度应该快约24%,在单线程应用程序中的速度要快12%。这意味着它应该比Core i3-8130U弱一些。

由于指定的TDP为7瓦(PL1、9.5瓦PL2),该CPU非常适合轻薄型笔记本电脑和基于Windows的平板电脑。 / 2合1。英特尔声称待机功耗大大降低(与2.5毫瓦的i7-8500Y相比,降低了91%)。该SoC以10纳米制程制造,并使用英特尔Foveros 3D封装技术。 Foveros用于堆叠22FFL制造的I / O芯片,10nm的计算芯片和高达8 GB的LPDDR4X-4267。

SeriesIntel Lakefield
CodenameLakefield

Series: Lakefield Lakefield

Intel Core i5-L16G7 « 1.4 - 3 GHz5 / 5 cores
Intel Core i3-L13G40.8 - 2.8 GHz5 / 5 cores4 MB L3
Clock Rate1400 - 3000 MHz
Number of Cores / Threads5 / 5
Power Consumption (TDP = Thermal Design Power)7 Watt
Manufacturing Technology10 nm
Max. Temperature100 °C
SocketCSP1016
FeaturesLPDDR4x-4266 RAM, PCIe 3, 4 GT/s bus, MMX, SSE, SSE2, SSE3, SSSE3, SSE4.1, SSE4.2, VMX, SMEP, SMAP, EIST, TM1, TM2, Turbo, SST, AES-NI, RDRAND, RDSEED, SHA
GPUIntel UHD Graphics G7 (Lakefield GT2 64 EU) (200 - 500 MHz)
64 Bit64 Bit support
Architecturex86
Starting Price$281 U.S.
Announcement Date05/28/2020
Product Link (external)ark.intel.com

Benchmarks

Performance Rating - CB R15 + R20 + 7-Zip + X265 + Blender + 3DM11 CPU
21.1 pt (29%)
AMD E1-2100
2.47 -88%
...
AMD A10-5750M
18.2 -14%
Intel Core i3-5005U
18.4 -13%
18.8 -11%
Intel Pentium Gold 4415U
18.9 -10%
19.1 -9%
19.5 -8%
19.9 -6%
20 -5%
20.2 -4%
Intel Core i5-L16G7
21.1
21.5 2%
21.6 2%
21.7 3%
Intel Core i5-4258U
21.8 3%
21.9 4%
22.1 5%
22.4 6%
22.7 8%
22.8 8%
...
57 170%
max:
72.1 242%
0%
100%
Cinebench R23 - Cinebench R23 Multi Core
1810 Points (2%)
AMD E1-2100
202 -89%
...
1390 -23%
1390 -23%
1406 -22%
Intel Core i5-4258U
1496 -17%
Intel Core i5-5250U
1529 -16%
Intel Core i3-6157U
1614 -11%
1618 -11%
1730 -4%
1786 -1%
Intel Core i5-L16G7
1810
AMD Ryzen Embedded R1606G
1842 2%
1868 3%
1944 7%
1989 10%
Intel Core i3-8109U
2004 11%
2142 18%
2174 20%
2175 20%
2303 27%
...
32782 1711%
max:
107681 5849%
0%
100%
Cinebench R23 - Cinebench R23 Single Core
710 Points (30%)
AMD A10-5745M
74.4 -90%
...
Intel Core m3-7Y32
637 -10%
Intel Core i3-6157U
638 -10%
Intel Core i5-5250U
660 -7%
663 -7%
669 -6%
671 -5%
679 -4%
690 -3%
Intel Core i7-2860QM
692 -3%
Intel Core i5-L16G7
710
721 2%
785 11%
Intel Core i3-10100Y
788 11%
820 15%
AMD Ryzen Embedded V1605B
841 18%
863 22%
874 23%
875 23%
877 24%
...
2178 207%
max:
2351 231%
0%
100%
Cinebench R20 - Cinebench R20 CPU (Single Core)
min: 276     avg: 282.5     median: 282.5 (31%)     max: 289 Points
Cinebench R20 - Cinebench R20 CPU (Multi Core)
min: 609     avg: 648     median: 647.5 (2%)     max: 686 Points
Cinebench R15 - Cinebench R15 CPU Multi 64 Bit
255 Points (2%)
AMD A4-1200
31 -88%
...
244 -4%
244.7 -4%
Intel Core i3-6100U
246.9 -3%
Intel Core i7-3537U
247 -3%
248.3 -3%
Intel Core i7-4500U
250.7 -2%
251.3 -1%
Intel Core i7-8500Y
252.3 -1%
Intel Core i7-4550U
253 -1%
Intel Core i5-L16G7
255
255.3 0%
255.7 0%
Intel Core i7-4650U
256 0%
Intel Core i3-7100U
257 1%
Intel Core i5-5250U
257.5 1%
Intel Core i5-3230M
258 1%
Intel Core i3-5157U
259 2%
Intel Core i5-4310U
261.5 3%
AMD Ryzen Embedded R1505G
264 4%
...
5600 2096%
max:
15842 6113%
0%
100%
0153045607590105120135150165180195210225240Tooltip
Cinebench R15 - Cinebench R15 CPU Single 64 Bit
min: 88.3     avg: 89.5     median: 89.5 (27%)     max: 90.7 Points
AMD A4-1200
19 -79%
...
Intel Core M-5Y10a
83 -7%
Intel Core M-5Y51
83 -7%
84 -6%
85 -5%
Intel Celeron 2970M
85 -5%
Intel Core i3-5015U
85 -5%
Intel Core i3-5010U
85.3 -5%
Intel Core i5-3337U
88.3 -1%
89 -1%
Intel Core i5-L16G7
89.5
Intel Core M-5Y71
90.5 1%
91 2%
92 3%
92.6 3%
Intel Core i7-2637M
93 4%
Intel Core i3-7020U
93 4%
93 4%
Intel Core M-5Y31
93.3 4%
Intel Pentium Gold 4415U
94 5%
...
311 247%
max:
332 271%
0%
100%
Cinebench R11.5 - Cinebench R11.5 CPU Multi 64 Bit
3.2 Points (4%)
Cinebench R11.5 - Cinebench R11.5 CPU Single 64 Bit
1.4 Points (35%)
Cinebench R10 - Cinebench R10 Rend. Single (32bit)
4079 points (25%)
Cinebench R10 - Cinebench R10 Rend. Multi (32bit)
9003 points (7%)
wPrime 2.10 - wPrime 2.0 1024m *
879 s (10%)
wPrime 2.10 - wPrime 2.0 32m *
28.6 s (6%)
7-Zip 18.03 - 7-Zip 18.03 Multli Thread 4 runs
min: 7230     avg: 7587     median: 7586.5 (4%)     max: 7943 MIPS
7-Zip 18.03 - 7-Zip 18.03 Single Thread 4 runs
min: 3174     avg: 3211     median: 3211 (38%)     max: 3248 MIPS
HWBOT x265 Benchmark v2.2 - HWBOT x265 4k Preset
min: 1.44     avg: 1.5     median: 1.5 (3%)     max: 1.48 fps
00.10.30.40.60.70.911.21.31.41.61.71.922.22.32.42.62.7Tooltip
Blender - Blender 2.79 BMW27 CPU *
min: 1897     avg: 2027     median: 2026.5 (14%)     max: 2156 Seconds
R Benchmark 2.5 - R Benchmark 2.5 *
min: 0.897     avg: 0.9     median: 0.9 (20%)     max: 0.987 sec
Super Pi mod 1.5 XS 1M - Super Pi mod 1.5 XS 1M *
11.7 s (3%)
Super Pi mod 1.5 XS 2M - Super Pi mod 1.5 XS 2M *
25.9 s (1%)
Super Pi Mod 1.5 XS 32M - Super Pi mod 1.5 XS 32M *
622 s (3%)
3DMark 11 - 3DM11 Performance Physics
min: 2926     avg: 3015     median: 3015 (8%)     max: 3104 Points
3DMark - 3DMark Ice Storm Physics
26353 Points (21%)
3DMark - 3DMark Ice Storm Extreme Physics
26635 Points (22%)
3DMark - 3DMark Ice Storm Unlimited Physics
32705 Points (28%)
3DMark - 3DMark Cloud Gate Physics
min: 2831     avg: 2834     median: 2834 (7%)     max: 2837 Points
3DMark - 3DMark Fire Strike Standard Physics
min: 4138     avg: 4306     median: 4305.5 (8%)     max: 4473 Points
3DMark - 3DMark Time Spy CPU
1148 Points (5%)
Geekbench 5.5 - Geekbench 5.1 - 5.4 64 Bit Single-Core
min: 797     avg: 827     median: 826.5 (35%)     max: 856 points
AMD E1-2100
125 -85%
...
797 -4%
803 -3%
808 -2%
AMD Ryzen 5 2600H
812 -2%
AMD Ryzen 7 2700U
813 -2%
816 -1%
819 -1%
AMD Ryzen Embedded V1605B
819 -1%
AMD Ryzen 3 3300U
824 0%
Intel Core i5-L16G7
827
831 0%
846 2%
863 4%
AMD Ryzen 3 3350U
864 4%
867 5%
874 6%
AMD Ryzen Embedded R1606G
877 6%
AMD Ryzen 7 PRO 2700U
882 7%
Intel Core i5-6287U
882 7%
...
2331 182%
0%
100%
Geekbench 5.5 - Geekbench 5.1 - 5.4 64 Bit Multi-Core
min: 1441     avg: 1634     median: 1633.5 (3%)     max: 1826 points
Mozilla Kraken 1.1 - Kraken 1.1 Total Score *
min: 1252     avg: 1278     median: 1277.5 (1%)     max: 1303 ms
Octane V2 - Octane V2 Total Score
min: 31228     avg: 32455     median: 32455 (29%)     max: 33682 Points
WebXPRT 3 - WebXPRT 3 Score
min: 121     avg: 124.5     median: 124.5 (26%)     max: 128 Points
- Range of benchmark values for this graphics card
- Average benchmark values for this graphics card
* Smaller numbers mean a higher performance

v1.26
log 24. 06:02:32

#0 no ids found in url (should be separated by "_") +0s ... 0s

#1 not redirecting to Ajax server +0s ... 0s

#2 did not recreate cache, as it is less than 5 days old! Created at Tue, 23 Apr 2024 05:40:15 +0200 +0.001s ... 0.001s

#3 no comparison url found in template nbc.compare_page_2 needed +0.007s ... 0.009s

#4 composed specs +0s ... 0.009s

#5 did output specs +0s ... 0.009s

#6 getting avg benchmarks for device 12215 +0.02s ... 0.029s

#7 got single benchmarks 12215 +0.014s ... 0.044s

#8 got avg benchmarks for devices +0s ... 0.044s

#9 min, max, avg, median took s +0.911s ... 0.955s

#10 no comparison url found in template nbc.compare_page_2 needed +0s ... 0.955s

#11 return log +0s ... 0.955s

Reviews for the Intel Core i5-L16G7 processor

Lenovo ThinkPad X1 Fold 20RL000FGE: Intel UHD Graphics G7 (Lakefield GT2 64 EU), 13.30", 1.2 kg
  External Review » Lenovo ThinkPad X1 Fold 20RL000FGE

Lenovo ThinkPad X1 Fold G1-20RL000GGE: Intel UHD Graphics G7 (Lakefield GT2 64 EU), 13.30", 1 kg
  External Review » Lenovo ThinkPad X1 Fold G1-20RL000GGE

Samsung Galaxy Book S Intel: Intel UHD Graphics G7 (Lakefield GT2 64 EU), 13.30", 0.9 kg
  External Review » Samsung Galaxy Book S Intel

Please share our article, every link counts!

»移动处理器 对比
所有移动处理器的对比


»移动处理器 基准测试
所有已有笔记本电脑中使用的处理器的基准测试成绩 (桌面处理器或移动处理器)

Other CPUs of the series Lakefield

» Intel Core i5-L16G7
   5x 1.4 GHz - 3 GHz
» Intel Core i3-L13G4
   5x 0.8 GHz - 2.8 GHz

Surrounding CPUs

+ Intel Core i7-4600U
   2x 2.1 GHz - 3.3 GHz
+ Intel Core i7-4650U
   2x 1.7 GHz - 3.3 GHz
+ Intel Core i5-10310Y
   4x 1.1 GHz - 4.1 GHz
+ Intel Core i3-7167U
   2x 2.8 GHz
+ Intel Core i5-10210Y
   4x 1 GHz - 4 GHz
» Intel Core i5-L16G7
   5x 1.4 GHz - 3 GHz
- Intel Core i5-6198DU
   2x 2.3 GHz - 2.8 GHz
- Intel Core i5-6200U
   2x 2.3 GHz - 2.8 GHz
- Intel Core i3-7130U
   2x 2.7 GHz
- AMD Athlon Gold 7220U
   2x 2.4 GHz - 3.7 GHz
- AMD Athlon Gold 7220C
   2x 2.4 GHz - 3.7 GHz
> Notebookcheck中文版(NBC中国) > FAQ / 小提示/ 技术参数 > 移动处理器 —— 基准测试成绩列表 > Intel Ice Lake i5-L16G7 笔记本处理器
Klaus Hinum (Update: 2020-07-28)