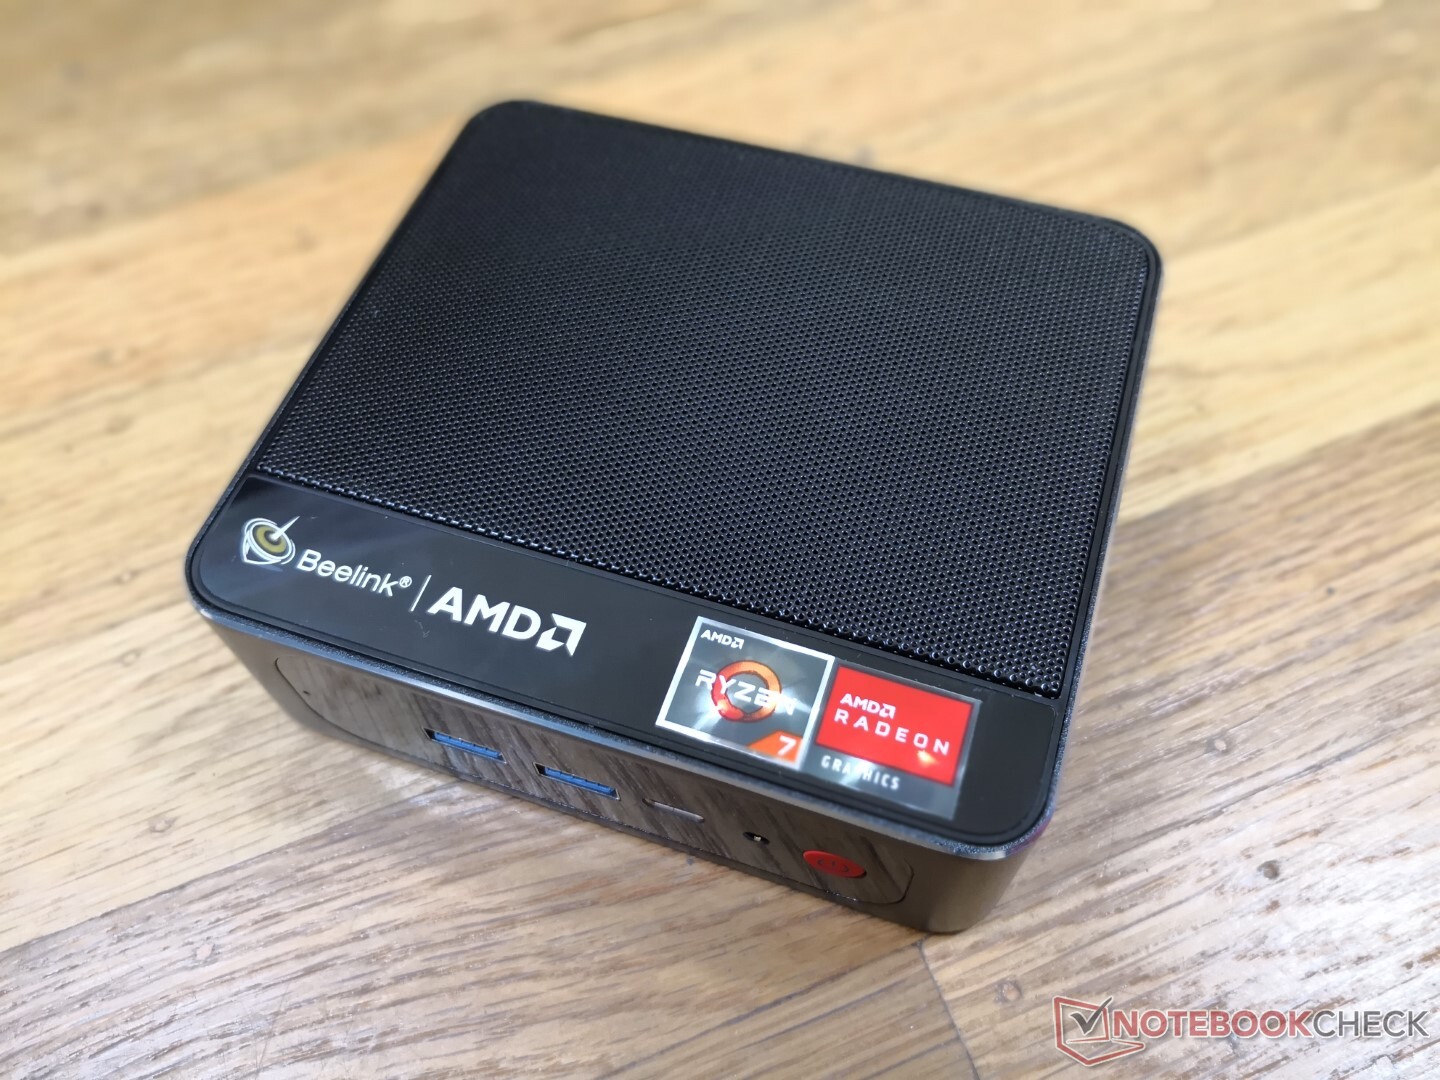
Beelink SER3迷你电脑回顾。老款Ryzen 7 3750H有其用途

Beelink有几款采用老式英特尔和AMD CPU的迷你电脑,作为由最新一代处理器驱动的英特尔NUC的廉价替代品。几乎所有的HTPC应用,从网页浏览到4K视频流,都不需要最快和最伟大的CPU,这意味着大多数用户可以用较便宜的硬件来解决。
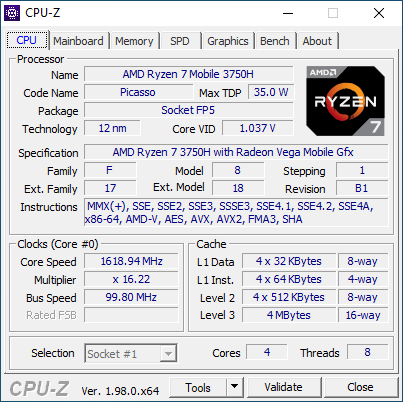
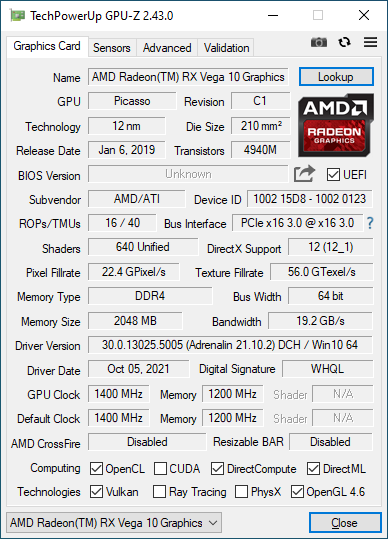
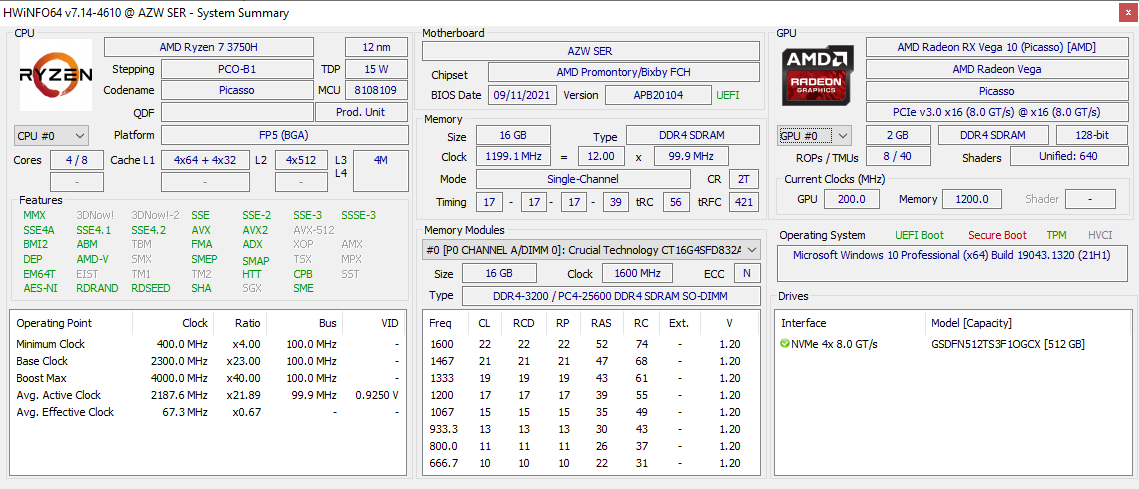
我们的Beelink SER3测试装置配备了两年前的AMD Zen+ Ryzen 7 3750HCPU,后来被更新的Zen 2 4000H和Zen 3 5000H系列取代。
更多Beelink的评论。
No, or more than one (0) Rating for the given SpecsID 326081 found
Potential Competitors in Comparison
Rating | Date | Model | Weight | Height | Size | Resolution | Price |
|---|---|---|---|---|---|---|---|
v (old) | 11 / 2021 | Beelink SER3 R7 3750H, Vega 10 | 492 g | 40 mm | x | ||
v (old) | Beelink SEi10 i3-1005G1, UHD Graphics G1 (Ice Lake 32 EU) | 350 g | 41 mm | x | |||
v (old) | Intel NUC8i7BE i7-8559U, Iris Plus Graphics 655 | 683 g | 51 mm | x | |||
v (old) | GMK NucBox 2 i5-8259U, Iris Plus Graphics 655 | 430 g | 50 mm | x | |||
v (old) | Zotac ZBox MI643 i5-10210U, UHD Graphics 620 | 550 g | 28.5 mm | x | |||
v (old) | Intel NUC11TNKi5 i5-1135G7, Iris Xe G7 80EUs | 504 g | 37 mm | x |
案例
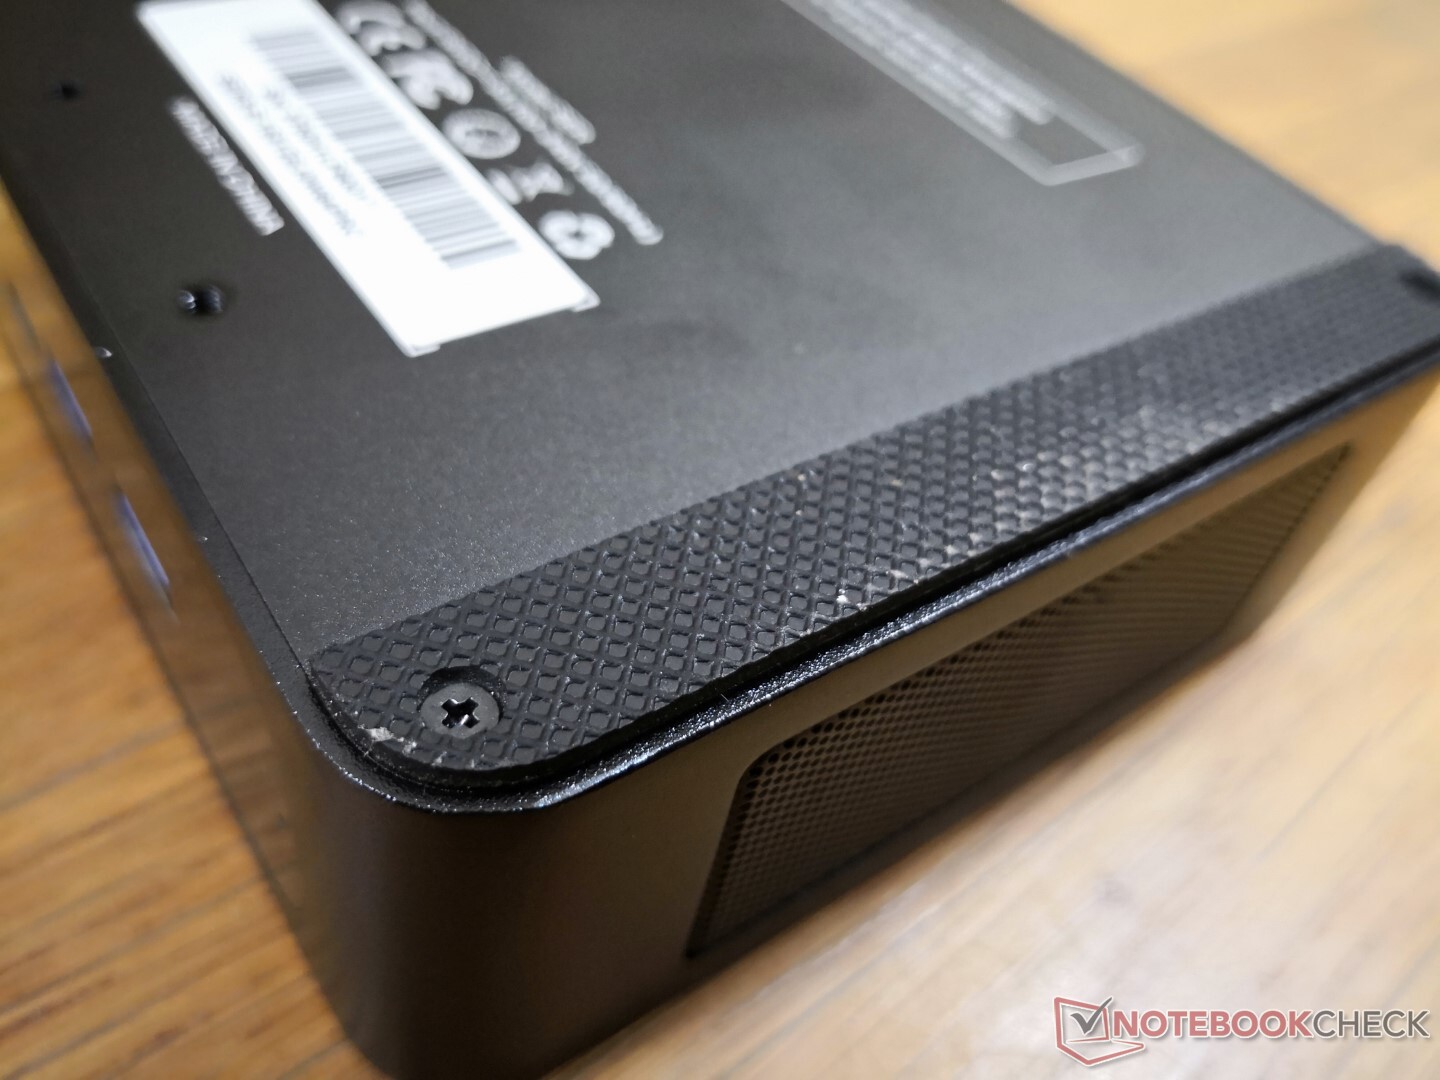
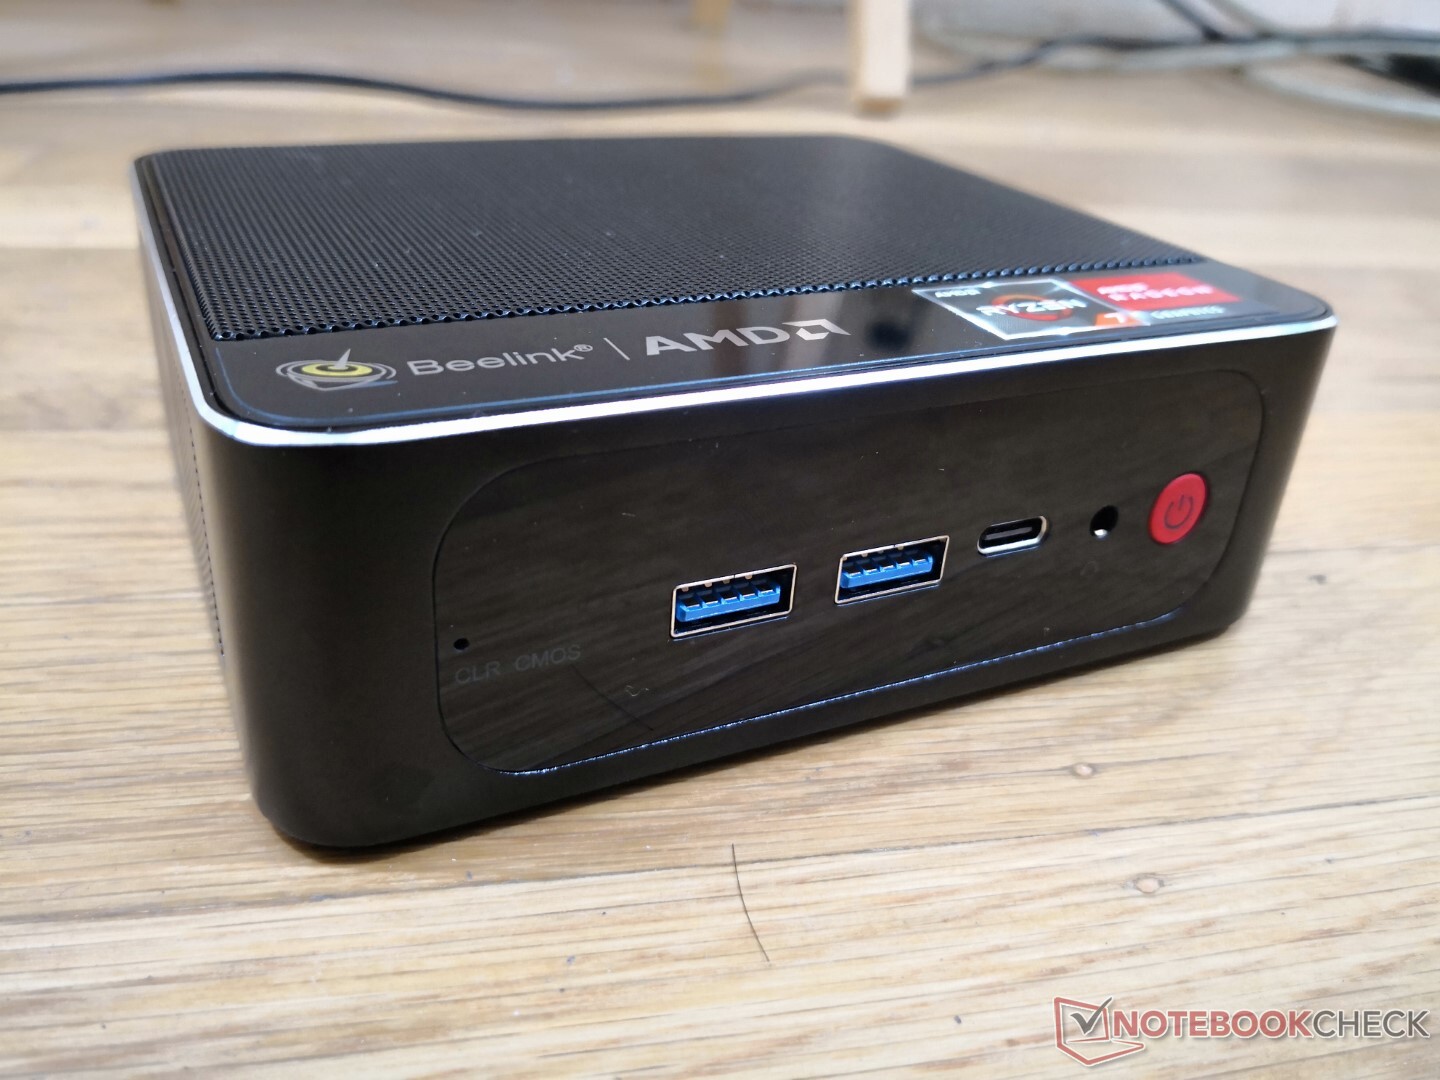
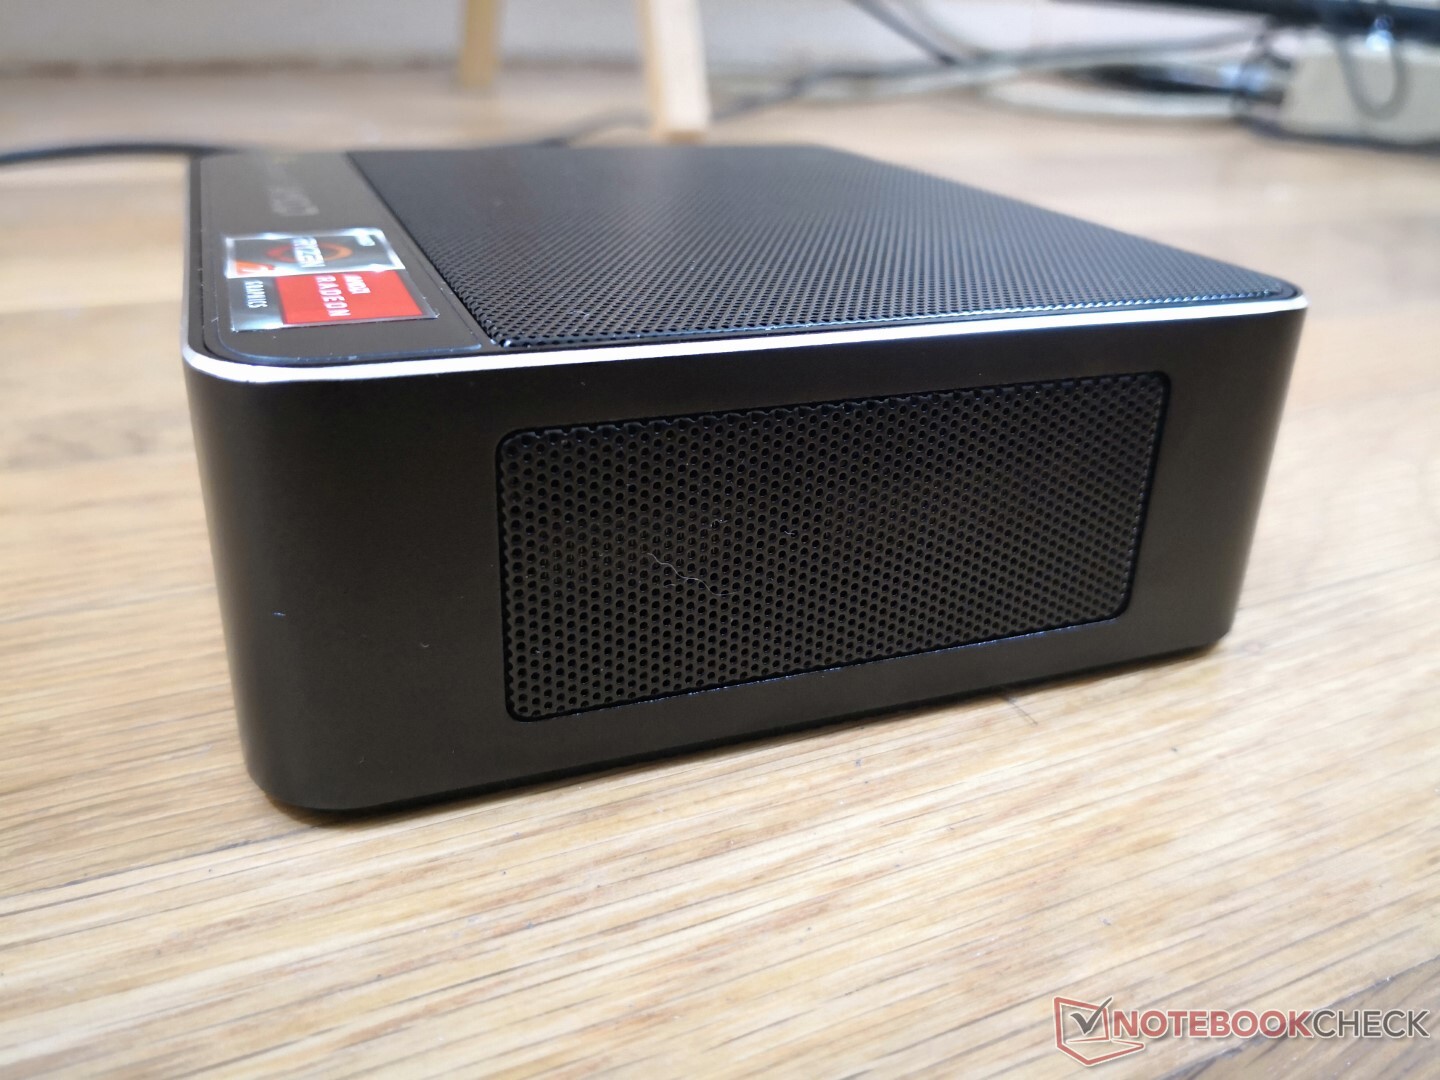
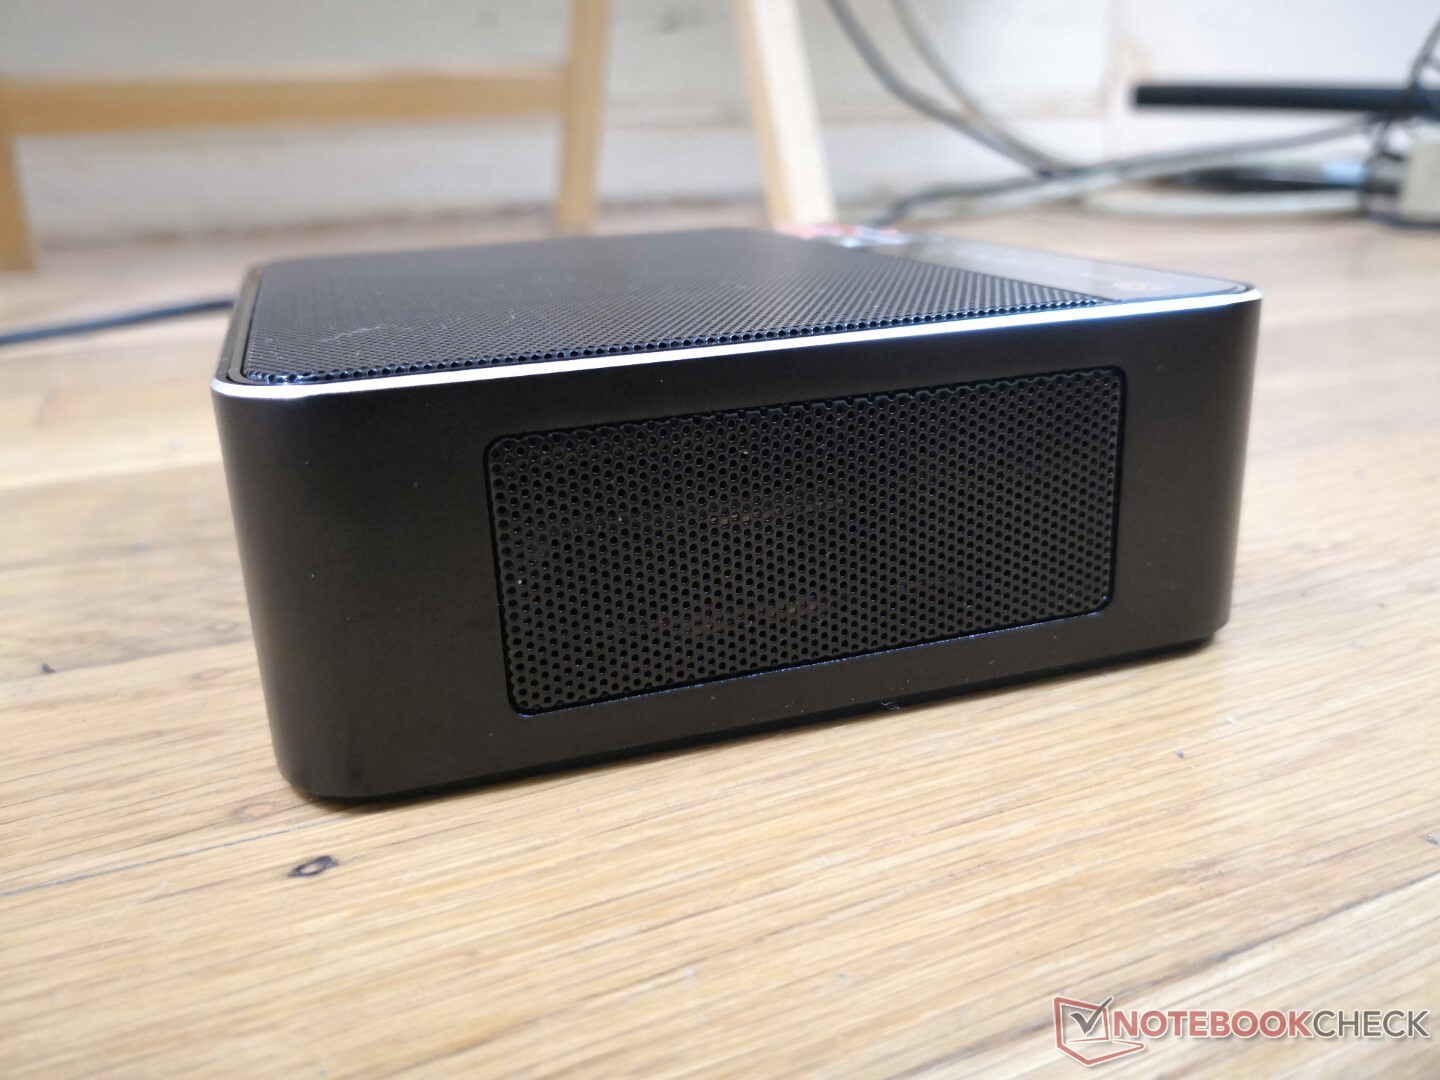
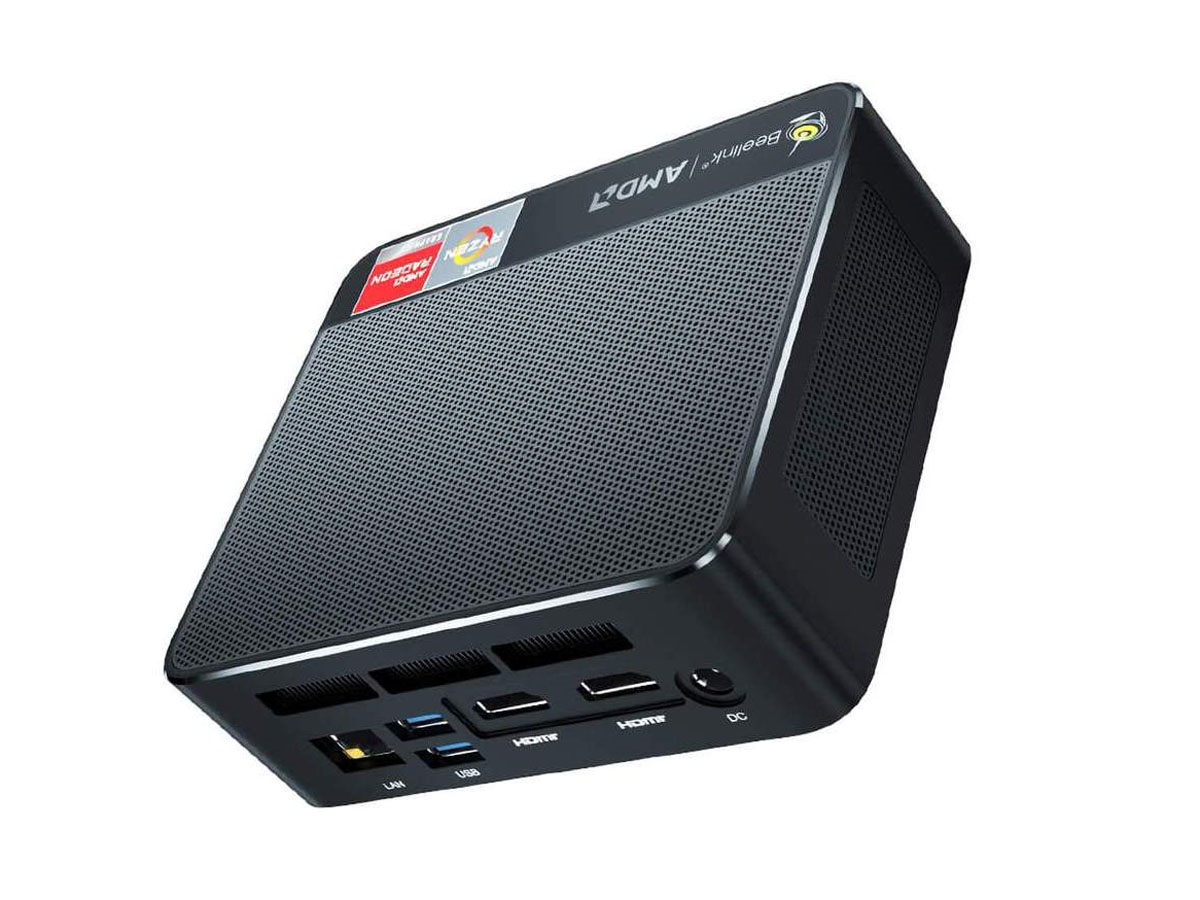
机箱大部分是哑光金属,前面和部分顶部有一点亮光塑料。第一印象是坚固,尽管不像英特尔NUC那样采用更厚更重的金属材料。
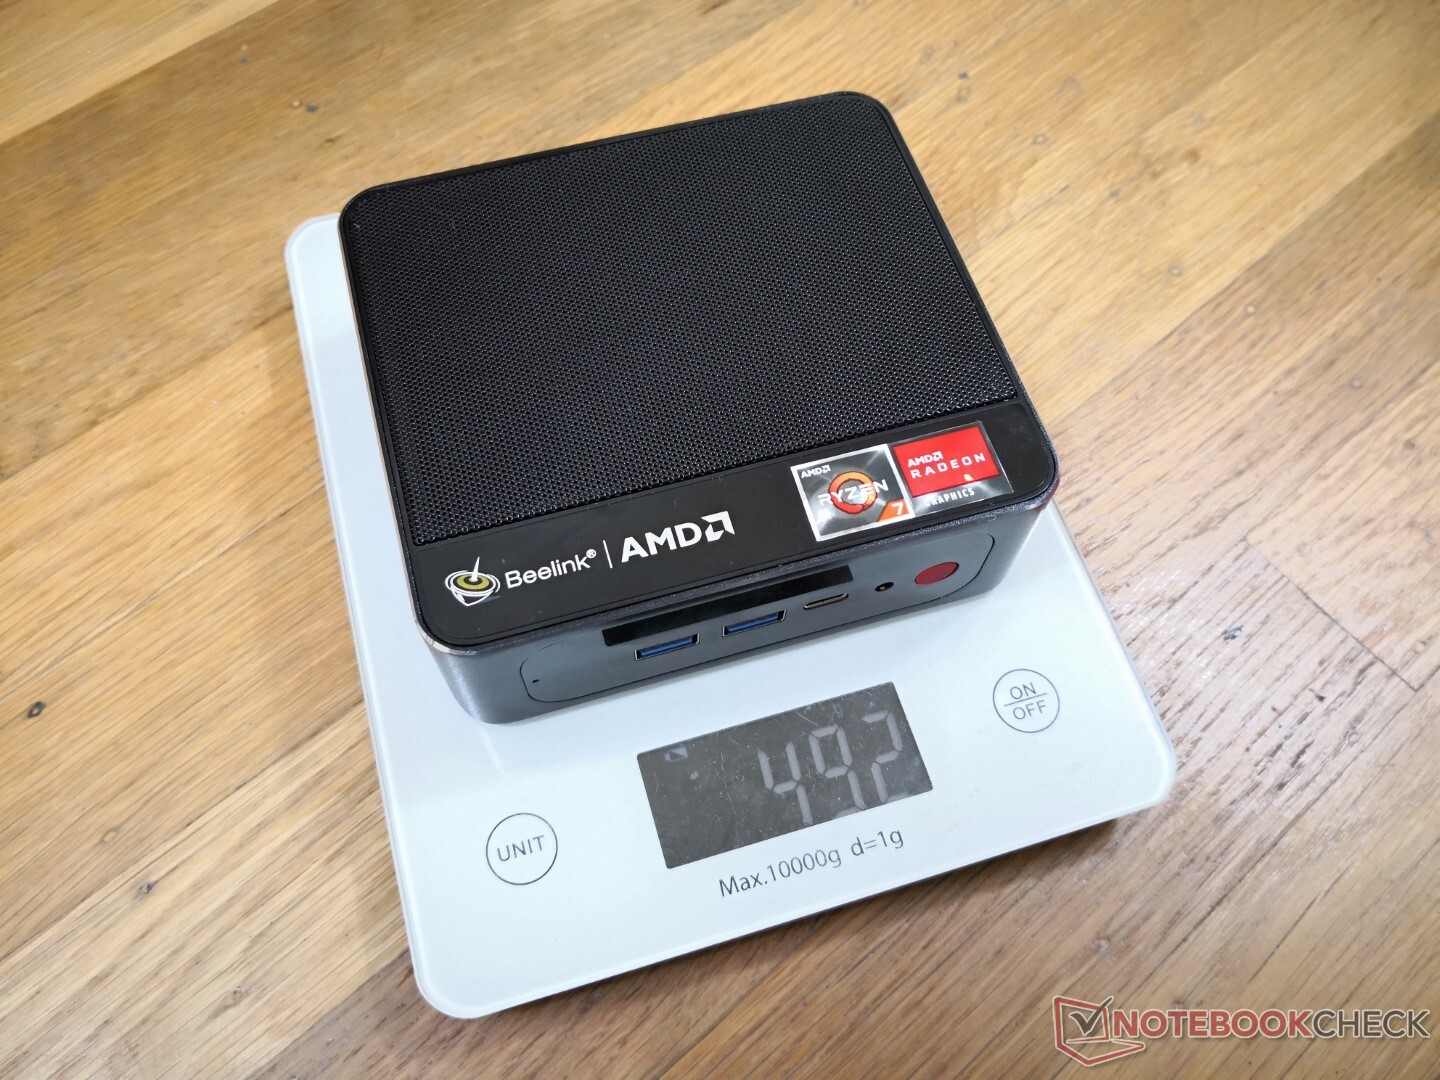
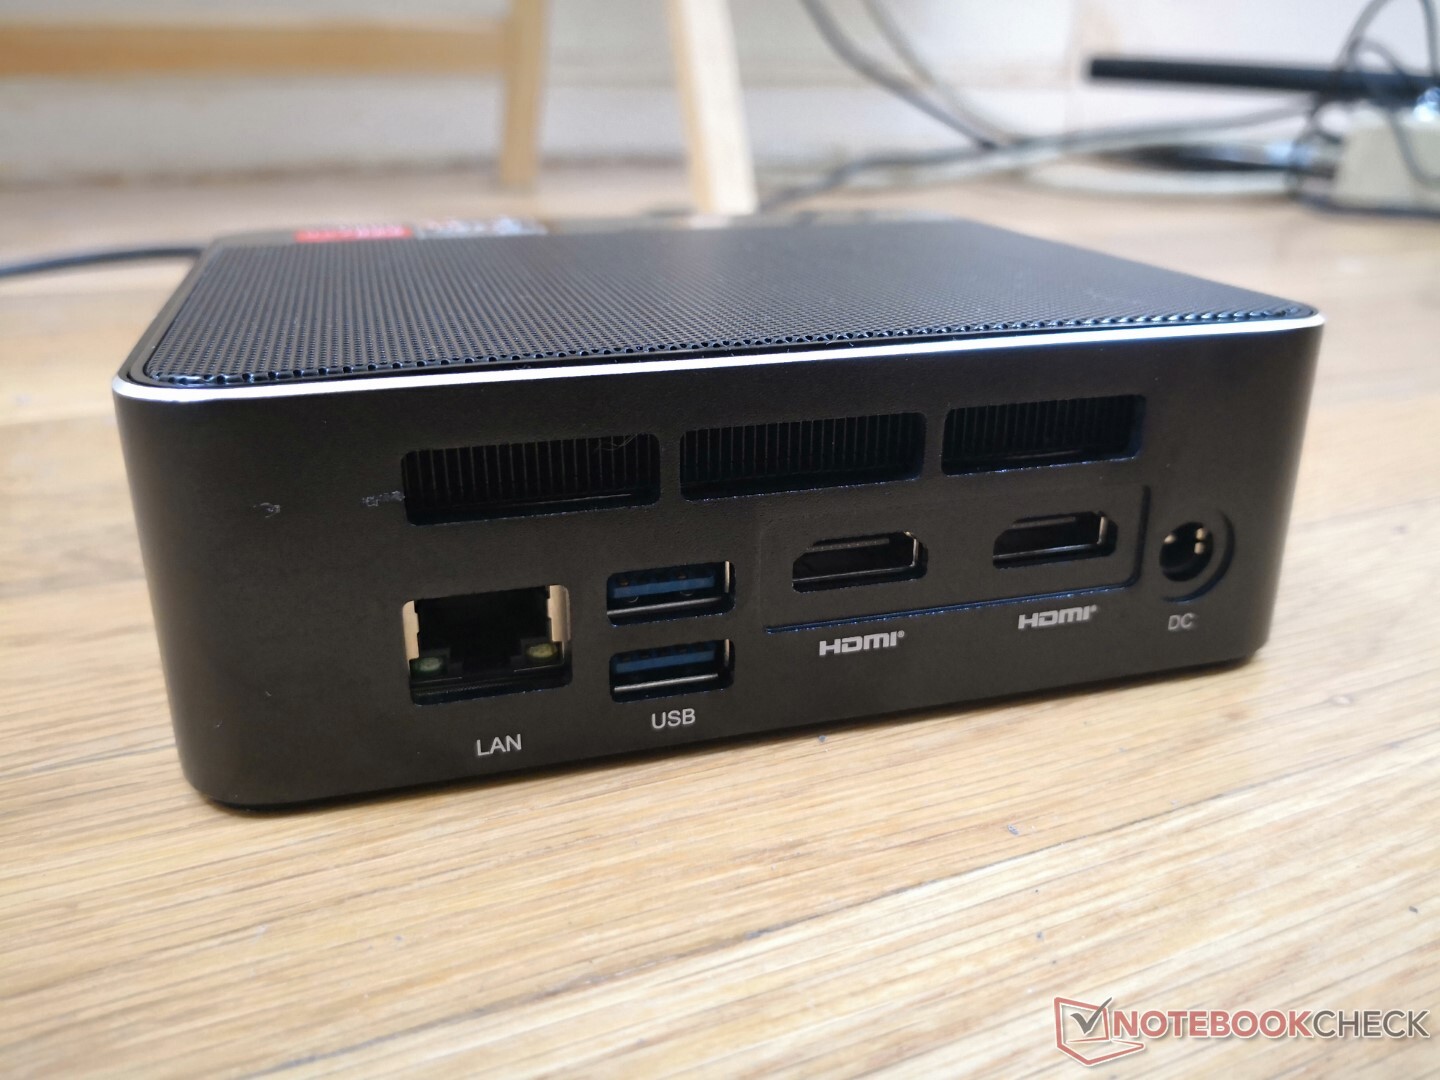
连接性
端口选项与Beelink SEi10完全相同。然而,请记住,SER3上没有Thunderbolt,因为其AMD CPU不支持该接口。
USB-C端口支持DisplayPort-out,但奇怪的是,它只能与一些而不是所有的外部显示器一起工作。
沟通
| Networking | |
| iperf3 transmit AX12 | |
| Intel NUC11TNKi5 | |
| Beelink SEi10 | |
| Intel NUC8i7BE | |
| GMK NucBox 2 | |
| Beelink SER3 | |
| Zotac ZBox MI643 | |
| iperf3 receive AX12 | |
| Intel NUC11TNKi5 | |
| Beelink SEi10 | |
| Beelink SER3 | |
| GMK NucBox 2 | |
| Intel NUC8i7BE | |
| Zotac ZBox MI643 | |
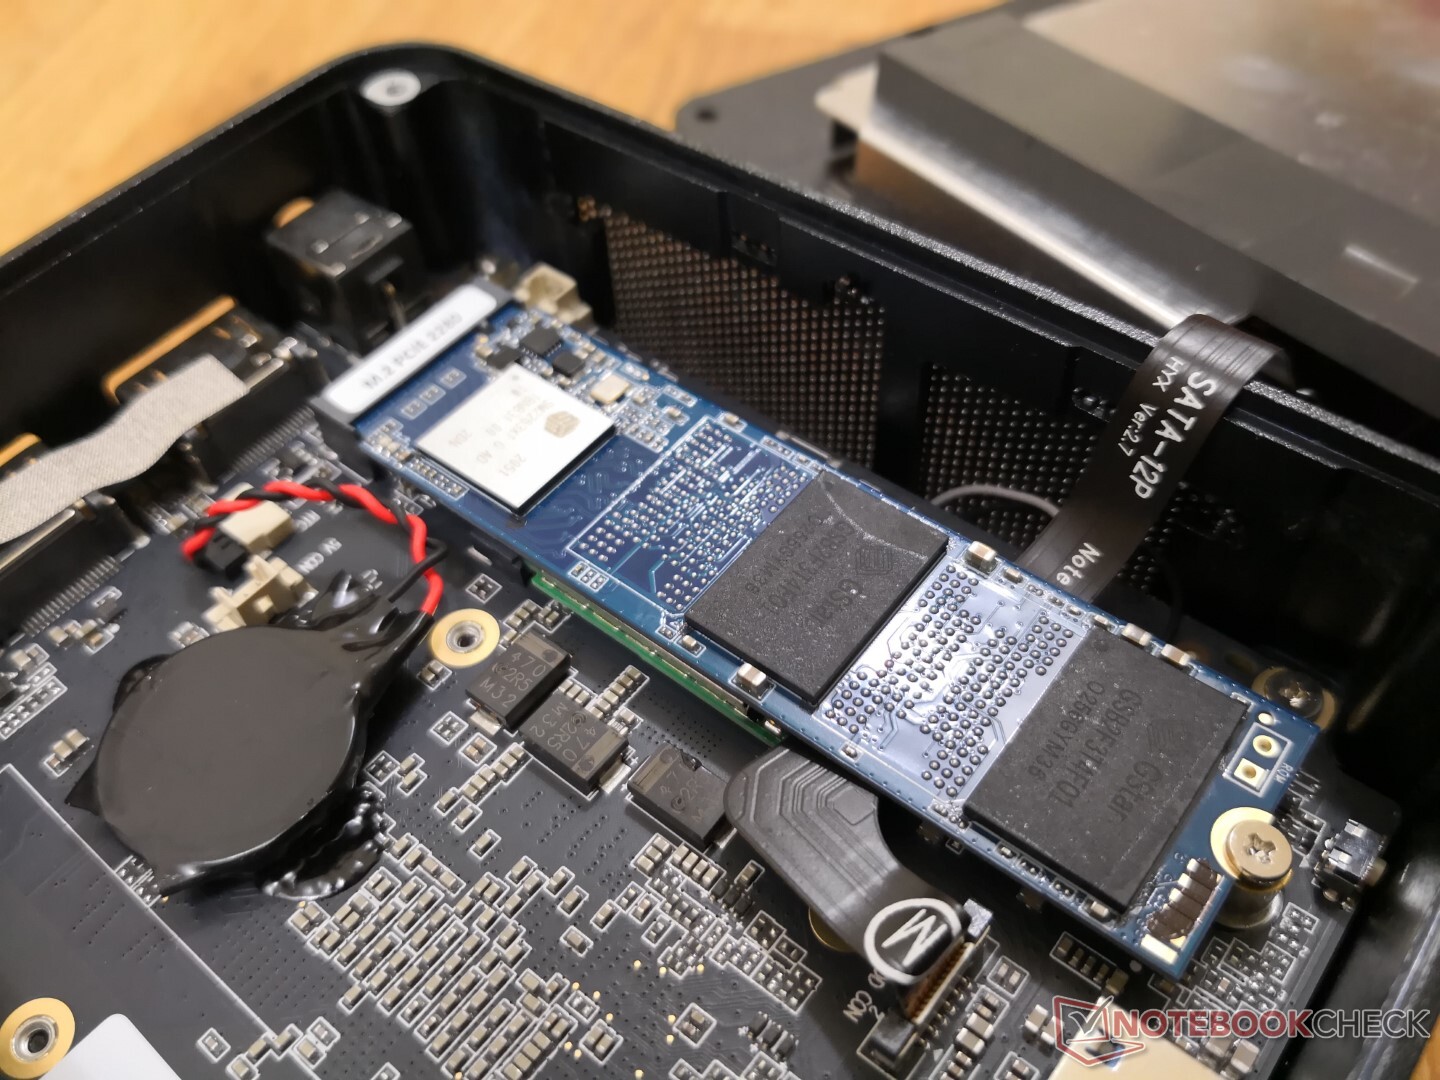
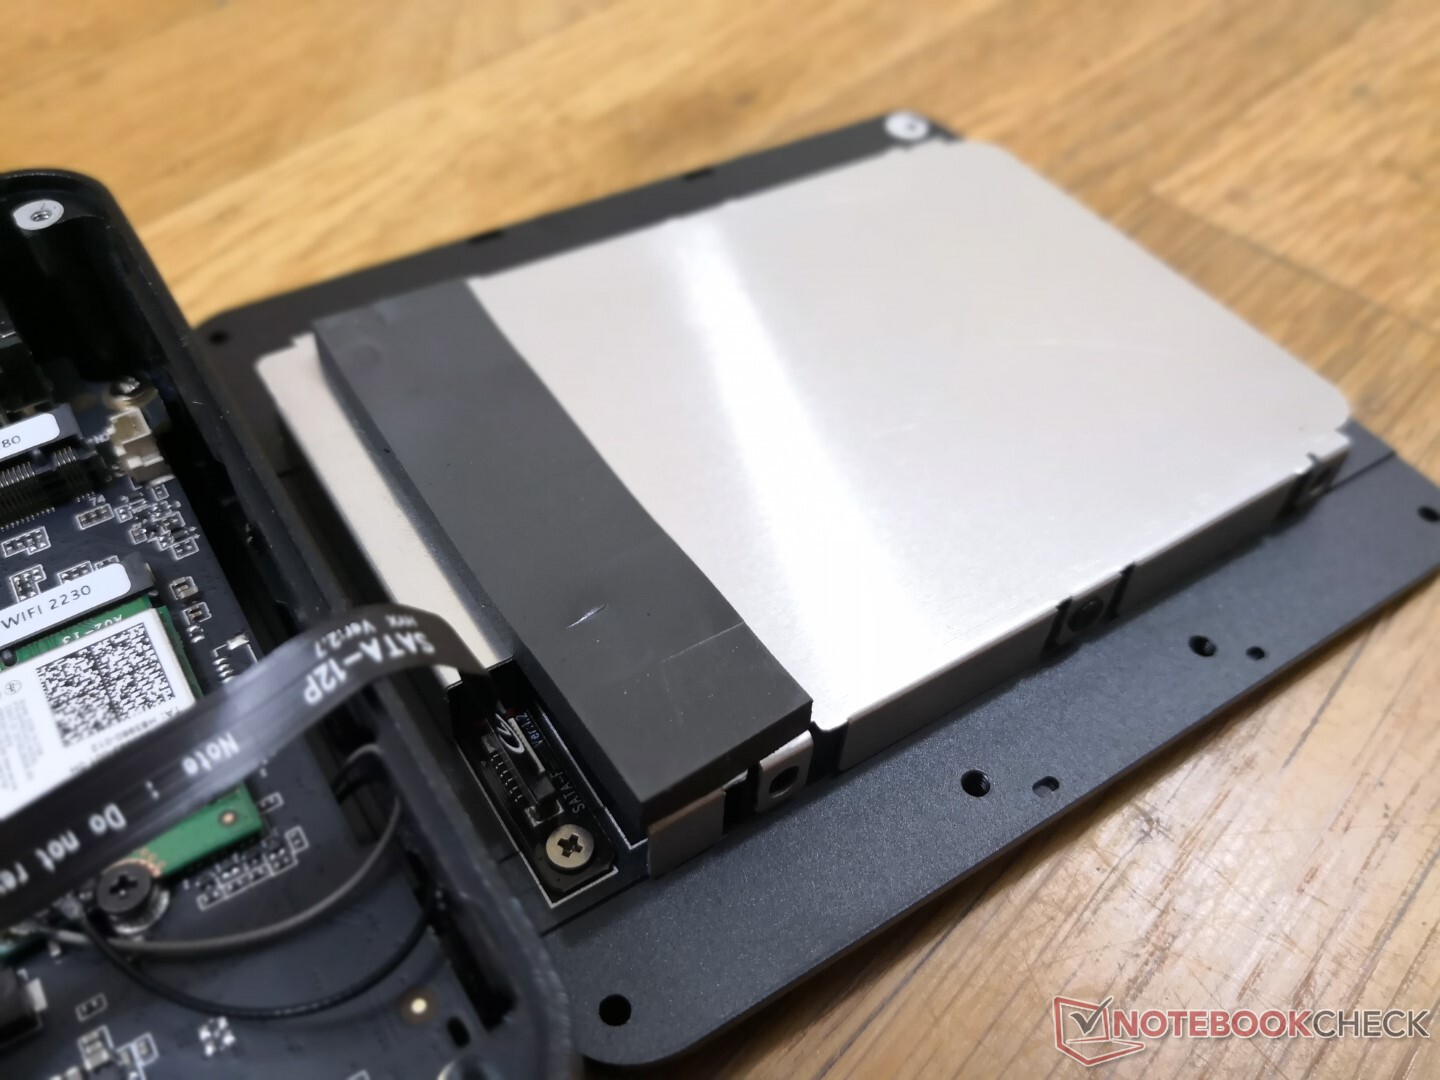
维护
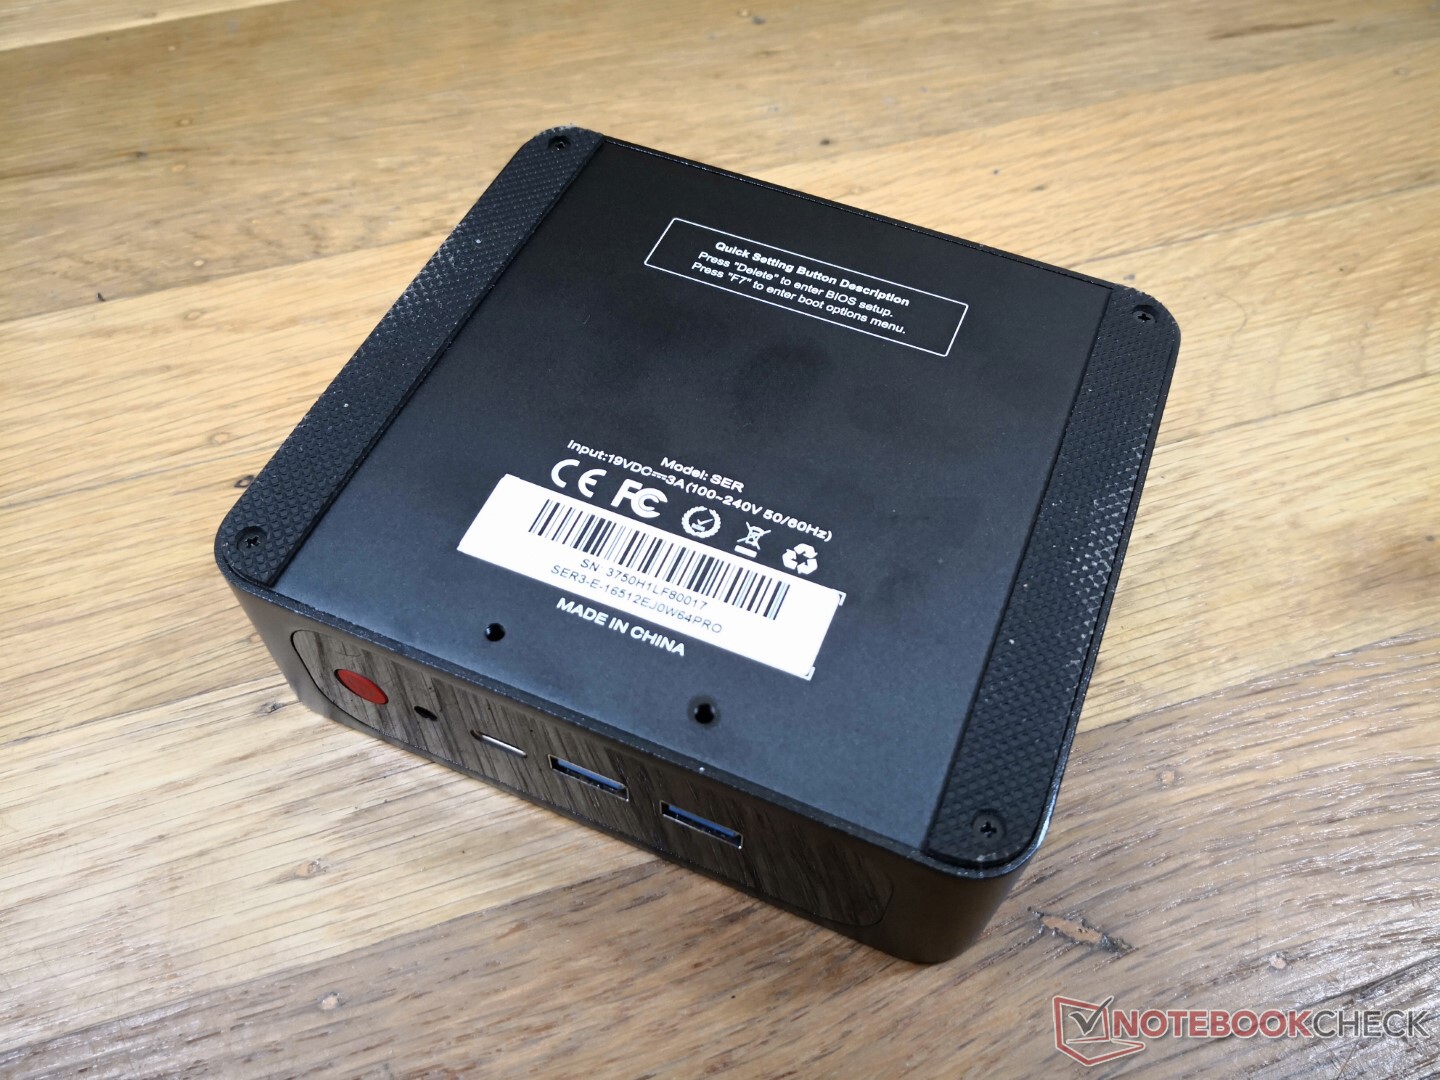
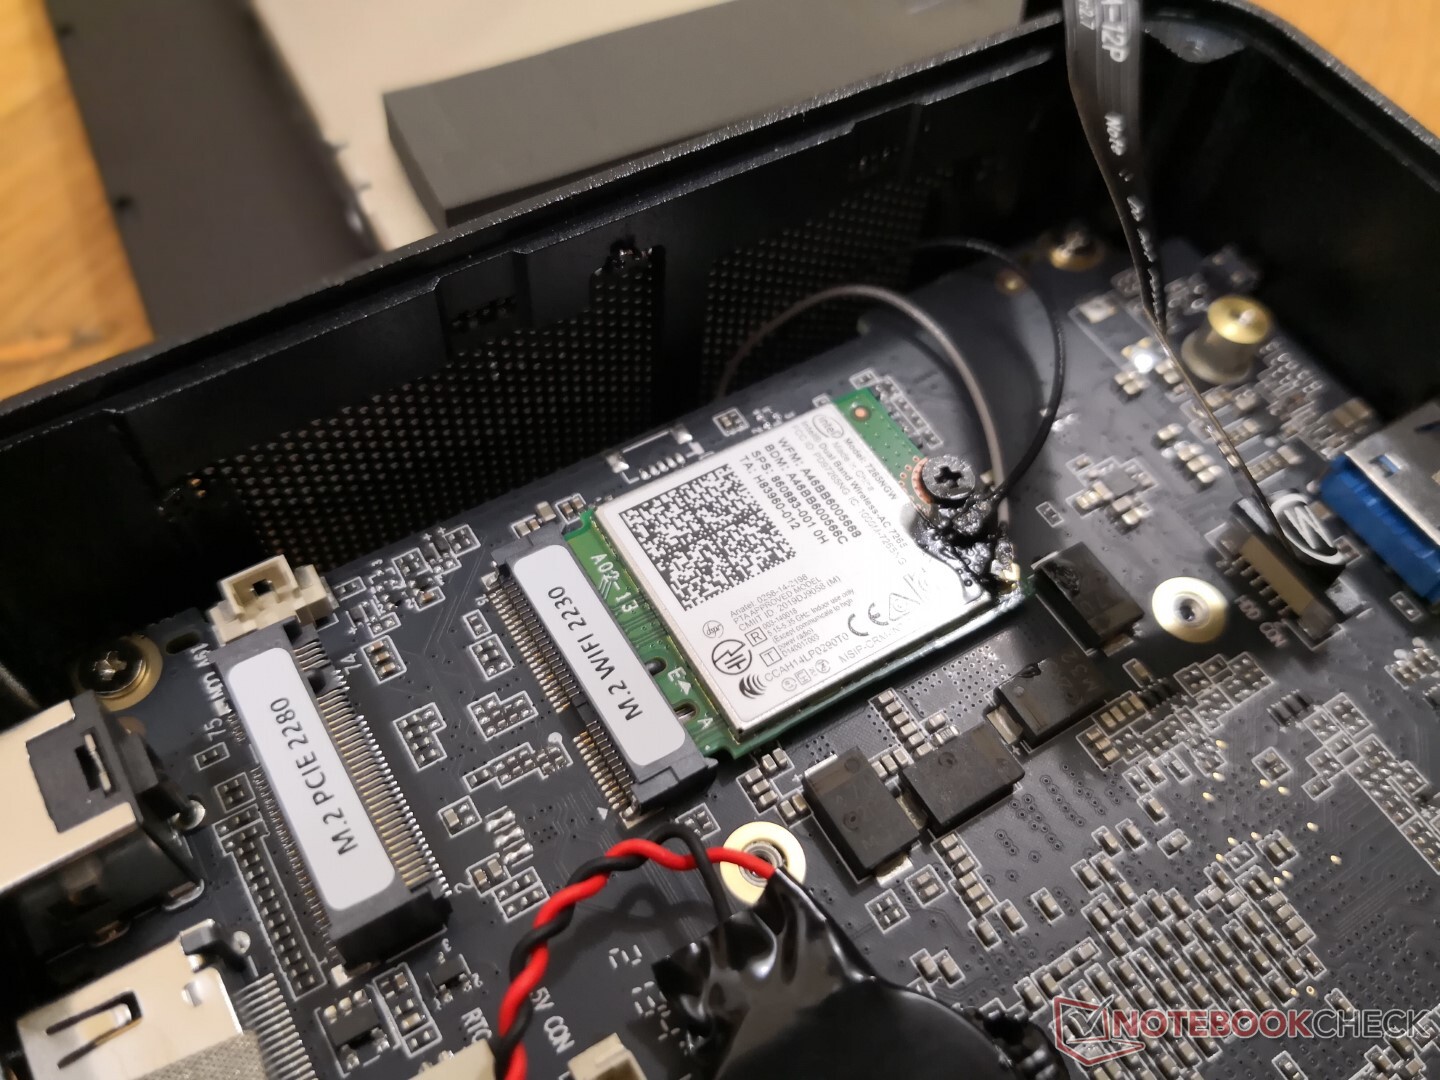
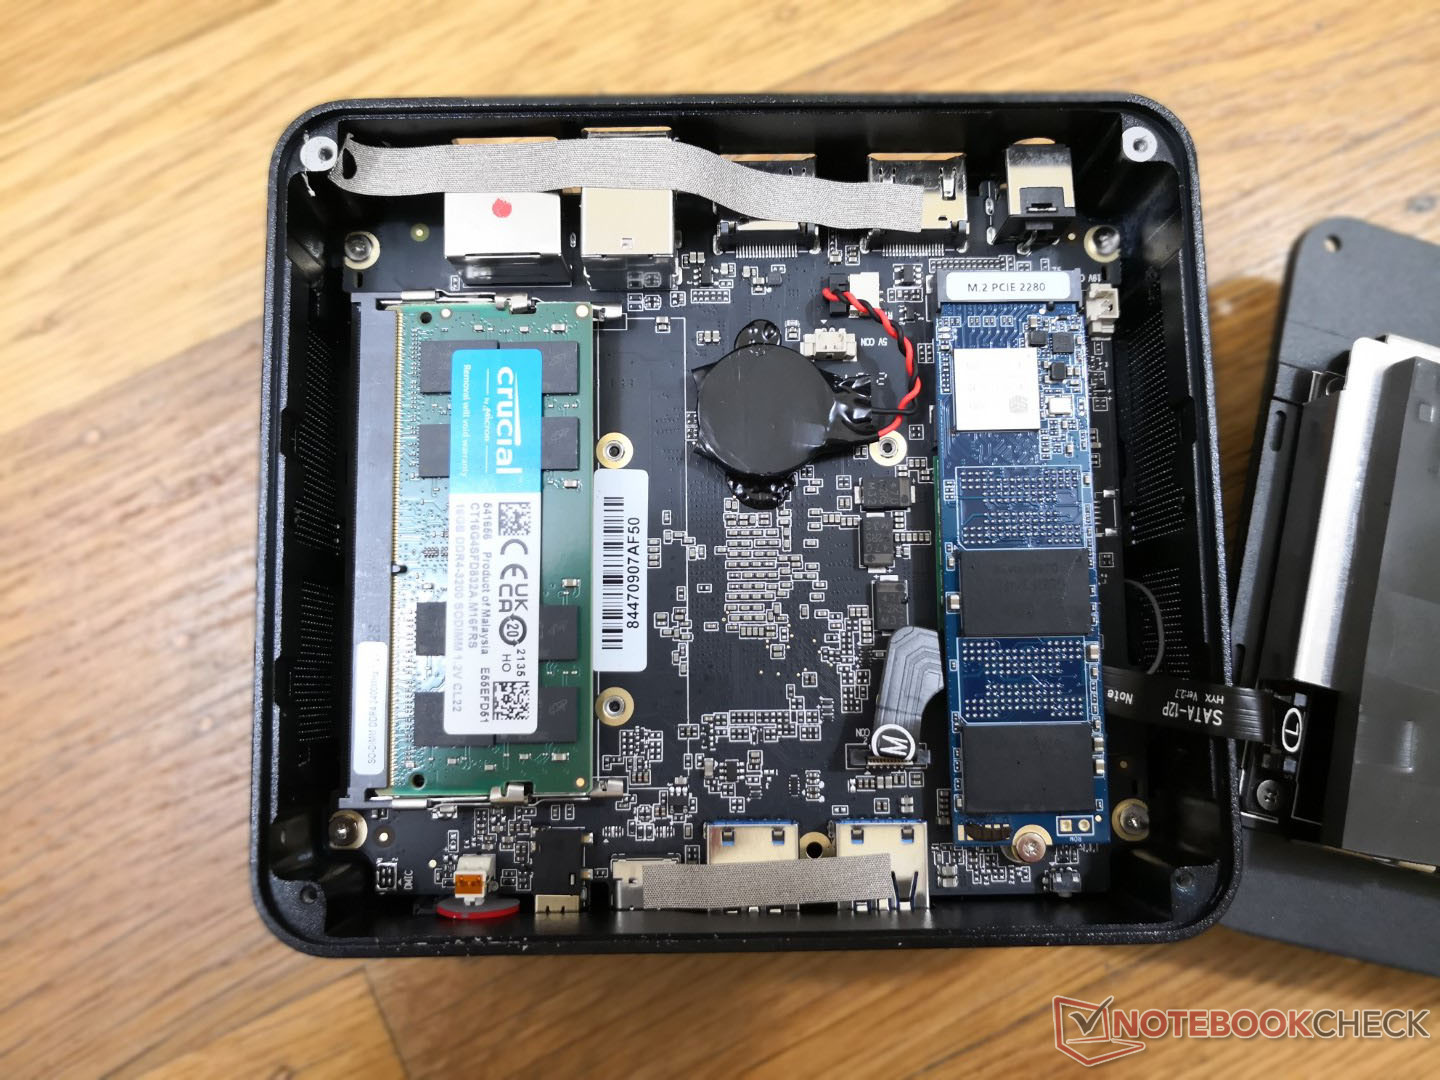
底部面板只需用一把飞利浦螺丝刀就可以轻松拆下,露出可拆卸的WLAN模块、可拆卸的M.2 2280 NVMe SSD和2个SODIMM插槽。
配件和保修
零售包装包括两条短的HDMI电缆,一个50毫米或100毫米的安装支架,以及额外的螺丝,此外还有通常的手册和AC适配器。制造商提供为期一年的保修服务。
业绩
测试条件
在运行以下任何基准测试之前,我们的设备被设置为性能模式,以获得可能的最高分数。
处理器
原始的CPU性能可与酷睿i5-8259U在竞争者GMK NucBox 2中。它还没有达到较新的Zen 2或Tiger Lake U系列CPU的性能,如 Ryzen 7 5700U或 酷睿i5-1135G7常见于最新的超极本上。不过,在长时间的高负荷下,性能是一致的,没有大的节流问题。
Cinebench R15 Multi Loop
Cinebench R23: Multi Core | Single Core
Cinebench R20: CPU (Multi Core) | CPU (Single Core)
Cinebench R15: CPU Multi 64Bit | CPU Single 64Bit
Blender: v2.79 BMW27 CPU
7-Zip 18.03: 7z b 4 | 7z b 4 -mmt1
Geekbench 5.5: Multi-Core | Single-Core
HWBOT x265 Benchmark v2.2: 4k Preset
LibreOffice : 20 Documents To PDF
R Benchmark 2.5: Overall mean
| CPU Performance rating | |
| Intel NUC11TNKi5 | |
| Intel NUC8i7BE -3! | |
| GMK NucBox 2 | |
| Average AMD Ryzen 7 3750H | |
| Zotac ZBox MI643 -2! | |
| Beelink SER3 -2! | |
| Beelink SEi10 -2! | |
| Cinebench R23 / Multi Core | |
| Intel NUC11TNKi5 | |
| Beelink SER3 | |
| Average AMD Ryzen 7 3750H (n=1) | |
| GMK NucBox 2 | |
| Cinebench R23 / Single Core | |
| Intel NUC11TNKi5 | |
| GMK NucBox 2 | |
| Beelink SER3 | |
| Average AMD Ryzen 7 3750H (n=1) | |
| Cinebench R20 / CPU (Multi Core) | |
| Intel NUC11TNKi5 | |
| Intel NUC8i7BE | |
| Average AMD Ryzen 7 3750H (1514 - 1825, n=4) | |
| Beelink SER3 | |
| GMK NucBox 2 | |
| Zotac ZBox MI643 | |
| Beelink SEi10 | |
| Cinebench R20 / CPU (Single Core) | |
| Intel NUC11TNKi5 | |
| Intel NUC8i7BE | |
| Zotac ZBox MI643 | |
| Beelink SEi10 | |
| GMK NucBox 2 | |
| Beelink SER3 | |
| Average AMD Ryzen 7 3750H (340 - 386, n=4) | |
| Cinebench R15 / CPU Multi 64Bit | |
| Intel NUC8i7BE | |
| Intel NUC11TNKi5 | |
| Average AMD Ryzen 7 3750H (672 - 805, n=7) | |
| Beelink SER3 | |
| GMK NucBox 2 | |
| Zotac ZBox MI643 | |
| Beelink SEi10 | |
| Cinebench R15 / CPU Single 64Bit | |
| Intel NUC11TNKi5 | |
| Intel NUC8i7BE | |
| Zotac ZBox MI643 | |
| Beelink SEi10 | |
| GMK NucBox 2 | |
| Beelink SER3 | |
| Average AMD Ryzen 7 3750H (135 - 157, n=7) | |
| Blender / v2.79 BMW27 CPU | |
| Beelink SEi10 | |
| Zotac ZBox MI643 | |
| GMK NucBox 2 | |
| Intel NUC8i7BE | |
| Intel NUC8i7BE | |
| Beelink SER3 | |
| Average AMD Ryzen 7 3750H (584 - 672, n=3) | |
| Intel NUC11TNKi5 | |
| 7-Zip 18.03 / 7z b 4 | |
| Intel NUC8i7BE | |
| Intel NUC8i7BE | |
| Intel NUC11TNKi5 | |
| GMK NucBox 2 | |
| Average AMD Ryzen 7 3750H (17077 - 19187, n=3) | |
| Beelink SER3 | |
| Zotac ZBox MI643 | |
| Beelink SEi10 | |
| 7-Zip 18.03 / 7z b 4 -mmt1 | |
| Intel NUC8i7BE | |
| Intel NUC8i7BE | |
| Intel NUC11TNKi5 | |
| Zotac ZBox MI643 | |
| Beelink SEi10 | |
| GMK NucBox 2 | |
| Beelink SER3 | |
| Average AMD Ryzen 7 3750H (3511 - 3752, n=3) | |
| Geekbench 5.5 / Multi-Core | |
| Intel NUC11TNKi5 | |
| Zotac ZBox MI643 | |
| Intel NUC8i7BE | |
| Average AMD Ryzen 7 3750H (n=1) | |
| GMK NucBox 2 | |
| Beelink SEi10 | |
| Geekbench 5.5 / Single-Core | |
| Intel NUC11TNKi5 | |
| Zotac ZBox MI643 | |
| Beelink SEi10 | |
| GMK NucBox 2 | |
| Average AMD Ryzen 7 3750H (n=1) | |
| Intel NUC8i7BE | |
| HWBOT x265 Benchmark v2.2 / 4k Preset | |
| Intel NUC11TNKi5 | |
| Intel NUC8i7BE | |
| Intel NUC8i7BE | |
| GMK NucBox 2 | |
| Average AMD Ryzen 7 3750H (4.14 - 4.4, n=3) | |
| Zotac ZBox MI643 | |
| Beelink SER3 | |
| Beelink SEi10 | |
| LibreOffice / 20 Documents To PDF | |
| Beelink SER3 | |
| Average AMD Ryzen 7 3750H (n=1) | |
| GMK NucBox 2 | |
| Zotac ZBox MI643 | |
| Beelink SEi10 | |
| Intel NUC11TNKi5 | |
| R Benchmark 2.5 / Overall mean | |
| GMK NucBox 2 | |
| Beelink SEi10 | |
| Beelink SER3 | |
| Average AMD Ryzen 7 3750H (0.69 - 0.723, n=2) | |
| Zotac ZBox MI643 | |
| Intel NUC8i7BE | |
| Intel NUC11TNKi5 | |
* ... smaller is better
AIDA64: FP32 Ray-Trace | FPU Julia | CPU SHA3 | CPU Queen | FPU SinJulia | FPU Mandel | CPU AES | CPU ZLib | FP64 Ray-Trace | CPU PhotoWorxx
| Performance rating | |
| Intel NUC11TNKi5 | |
| Intel NUC8i7BE -1! | |
| GMK NucBox 2 | |
| Average AMD Ryzen 7 3750H | |
| Zotac ZBox MI643 | |
| Beelink SER3 | |
| AIDA64 / FP32 Ray-Trace | |
| Intel NUC11TNKi5 | |
| Intel NUC8i7BE | |
| GMK NucBox 2 | |
| Zotac ZBox MI643 | |
| Average AMD Ryzen 7 3750H (3338 - 3668, n=2) | |
| Beelink SER3 | |
| AIDA64 / FPU Julia | |
| Intel NUC11TNKi5 | |
| Intel NUC8i7BE | |
| GMK NucBox 2 | |
| Zotac ZBox MI643 | |
| Average AMD Ryzen 7 3750H (16912 - 19132, n=2) | |
| Beelink SER3 | |
| AIDA64 / CPU SHA3 | |
| Intel NUC11TNKi5 | |
| GMK NucBox 2 | |
| Average AMD Ryzen 7 3750H (897 - 1001, n=2) | |
| Zotac ZBox MI643 | |
| Beelink SER3 | |
| AIDA64 / CPU Queen | |
| Intel NUC8i7BE | |
| Zotac ZBox MI643 | |
| Average AMD Ryzen 7 3750H (43632 - 50328, n=2) | |
| Intel NUC11TNKi5 | |
| Beelink SER3 | |
| GMK NucBox 2 | |
| AIDA64 / FPU SinJulia | |
| Average AMD Ryzen 7 3750H (5639 - 6478, n=2) | |
| Beelink SER3 | |
| Intel NUC8i7BE | |
| Intel NUC11TNKi5 | |
| GMK NucBox 2 | |
| Zotac ZBox MI643 | |
| AIDA64 / FPU Mandel | |
| Intel NUC11TNKi5 | |
| Intel NUC8i7BE | |
| GMK NucBox 2 | |
| Zotac ZBox MI643 | |
| Average AMD Ryzen 7 3750H (8846 - 9928, n=2) | |
| Beelink SER3 | |
| AIDA64 / CPU AES | |
| Intel NUC11TNKi5 | |
| Average AMD Ryzen 7 3750H (28977 - 32668, n=2) | |
| Beelink SER3 | |
| Intel NUC8i7BE | |
| GMK NucBox 2 | |
| Zotac ZBox MI643 | |
| AIDA64 / CPU ZLib | |
| Intel NUC11TNKi5 | |
| Intel NUC8i7BE | |
| Average AMD Ryzen 7 3750H (313 - 350, n=2) | |
| Beelink SER3 | |
| GMK NucBox 2 | |
| Zotac ZBox MI643 | |
| AIDA64 / FP64 Ray-Trace | |
| Intel NUC11TNKi5 | |
| Intel NUC8i7BE | |
| GMK NucBox 2 | |
| Zotac ZBox MI643 | |
| Average AMD Ryzen 7 3750H (1758 - 1935, n=2) | |
| Beelink SER3 | |
| AIDA64 / CPU PhotoWorxx | |
| Zotac ZBox MI643 | |
| Intel NUC8i7BE | |
| Intel NUC11TNKi5 | |
| Average AMD Ryzen 7 3750H (10338 - 18898, n=2) | |
| Beelink SER3 | |
| GMK NucBox 2 | |
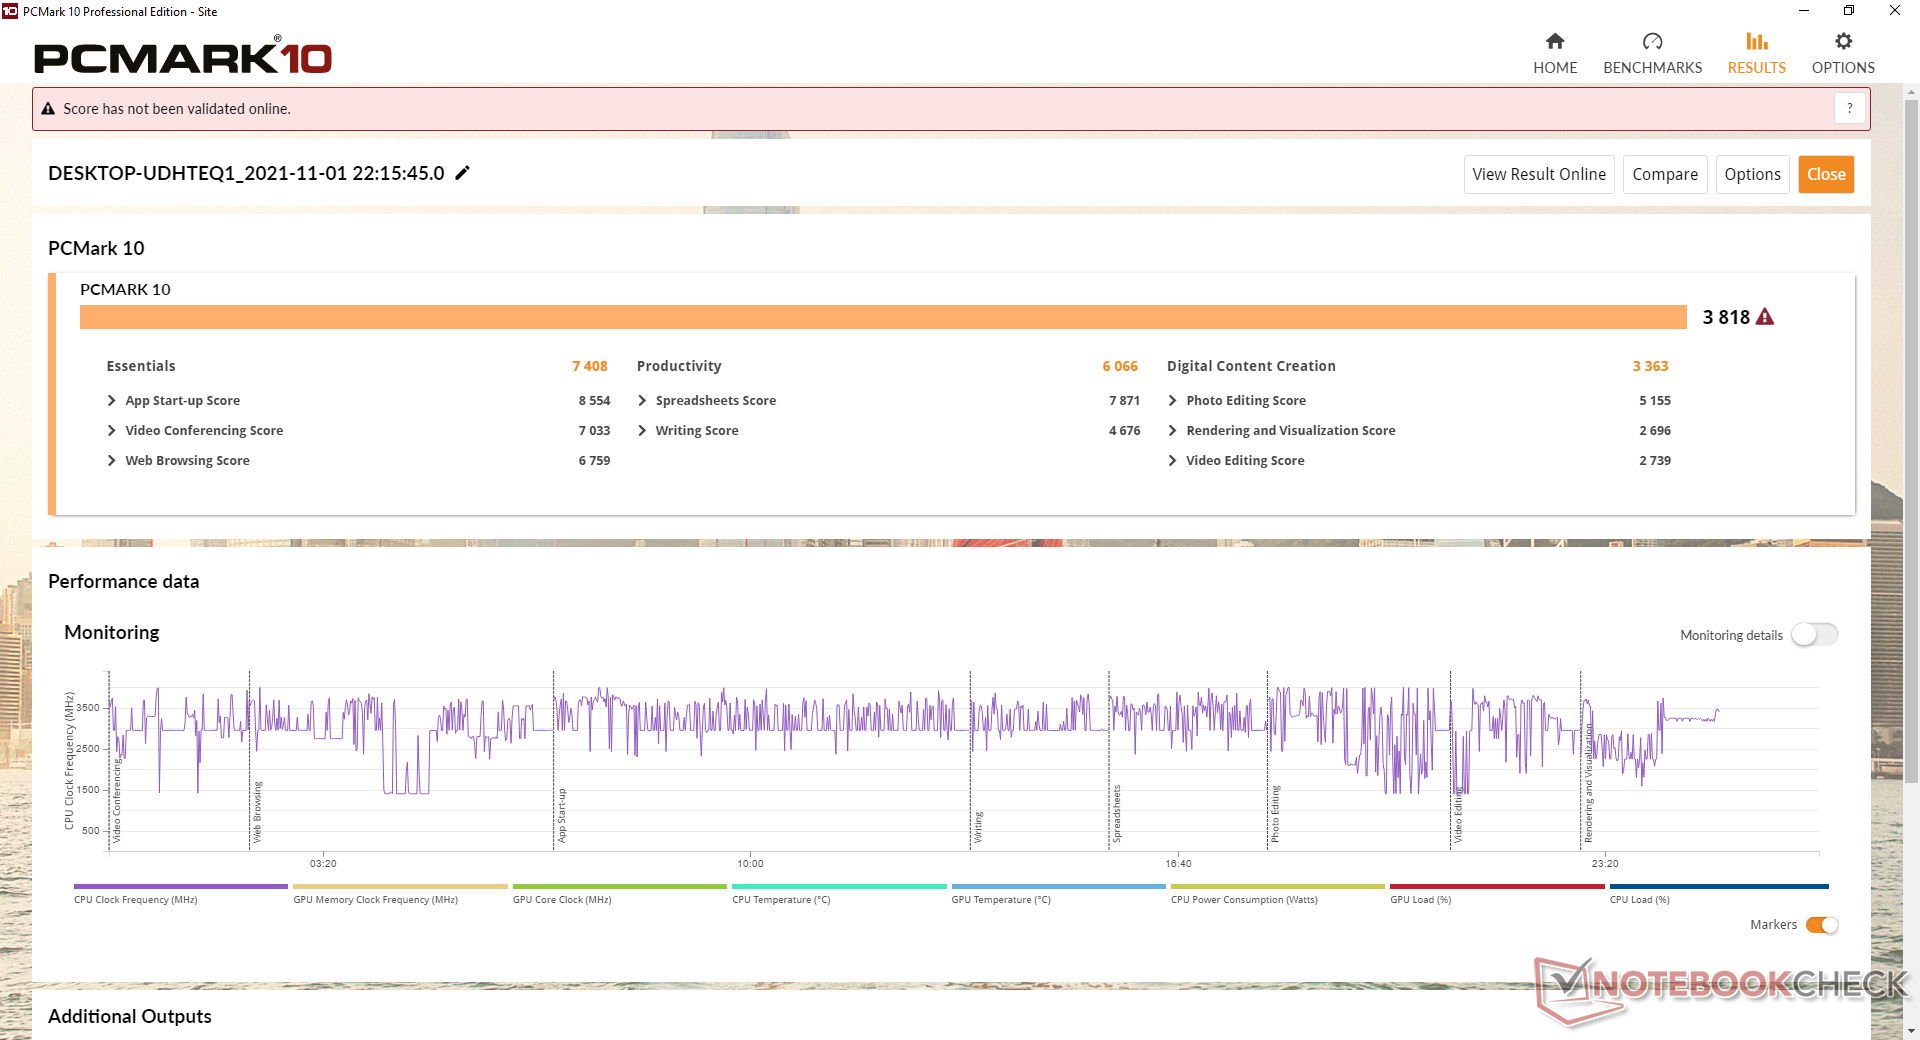
系统性能
| PCMark 10 / Score | |
| Intel NUC8i7BE | |
| Intel NUC11TNKi5 | |
| Zotac ZBox MI643 | |
| GMK NucBox 2 | |
| Beelink SER3 | |
| Average AMD Ryzen 7 3750H, AMD Radeon RX Vega 10 (n=1) | |
| Beelink SEi10 | |
| PCMark 10 / Essentials | |
| Zotac ZBox MI643 | |
| Intel NUC11TNKi5 | |
| Intel NUC8i7BE | |
| GMK NucBox 2 | |
| Beelink SEi10 | |
| Beelink SER3 | |
| Average AMD Ryzen 7 3750H, AMD Radeon RX Vega 10 (n=1) | |
| PCMark 10 / Productivity | |
| Intel NUC8i7BE | |
| Zotac ZBox MI643 | |
| GMK NucBox 2 | |
| Intel NUC11TNKi5 | |
| Beelink SER3 | |
| Average AMD Ryzen 7 3750H, AMD Radeon RX Vega 10 (n=1) | |
| Beelink SEi10 | |
| PCMark 10 / Digital Content Creation | |
| Intel NUC11TNKi5 | |
| Intel NUC8i7BE | |
| GMK NucBox 2 | |
| Beelink SER3 | |
| Average AMD Ryzen 7 3750H, AMD Radeon RX Vega 10 (n=1) | |
| Zotac ZBox MI643 | |
| Beelink SEi10 | |
| PCMark 10 Score | 3818 points | |
Help | ||
| AIDA64 / Memory Copy | |
| Intel NUC8i7BE | |
| GMK NucBox 2 | |
| Zotac ZBox MI643 | |
| Average AMD Ryzen 7 3750H (16249 - 30963, n=2) | |
| Intel NUC11TNKi5 | |
| Beelink SER3 | |
| AIDA64 / Memory Read | |
| Intel NUC8i7BE | |
| GMK NucBox 2 | |
| Zotac ZBox MI643 | |
| Average AMD Ryzen 7 3750H (18268 - 35218, n=2) | |
| Intel NUC11TNKi5 | |
| Beelink SER3 | |
| AIDA64 / Memory Write | |
| Intel NUC8i7BE | |
| GMK NucBox 2 | |
| Zotac ZBox MI643 | |
| Average AMD Ryzen 7 3750H (18455 - 35988, n=2) | |
| Intel NUC11TNKi5 | |
| Beelink SER3 | |
| AIDA64 / Memory Latency | |
| Average AMD Ryzen 7 3750H (95.8 - 118, n=2) | |
| Beelink SER3 | |
| Intel NUC11TNKi5 | |
| Zotac ZBox MI643 | |
| GMK NucBox 2 | |
| Intel NUC8i7BE | |
* ... smaller is better
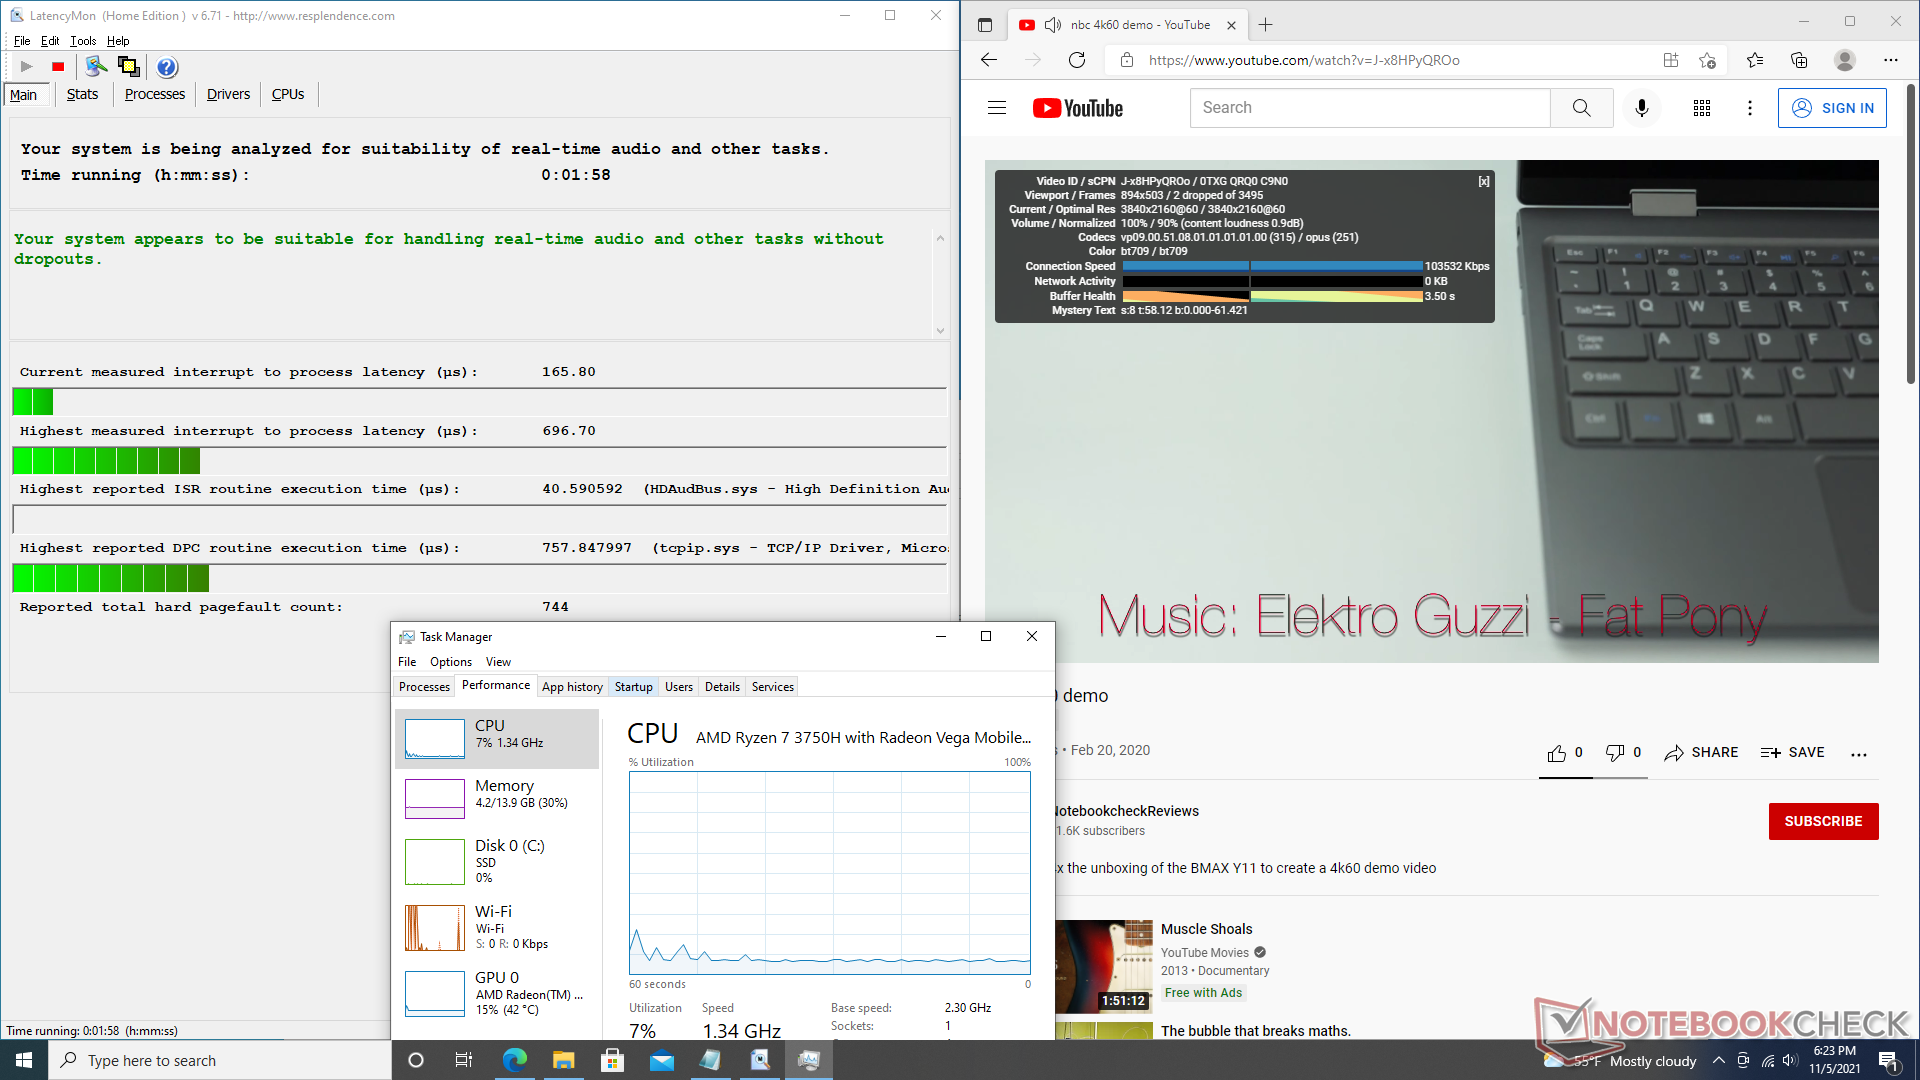
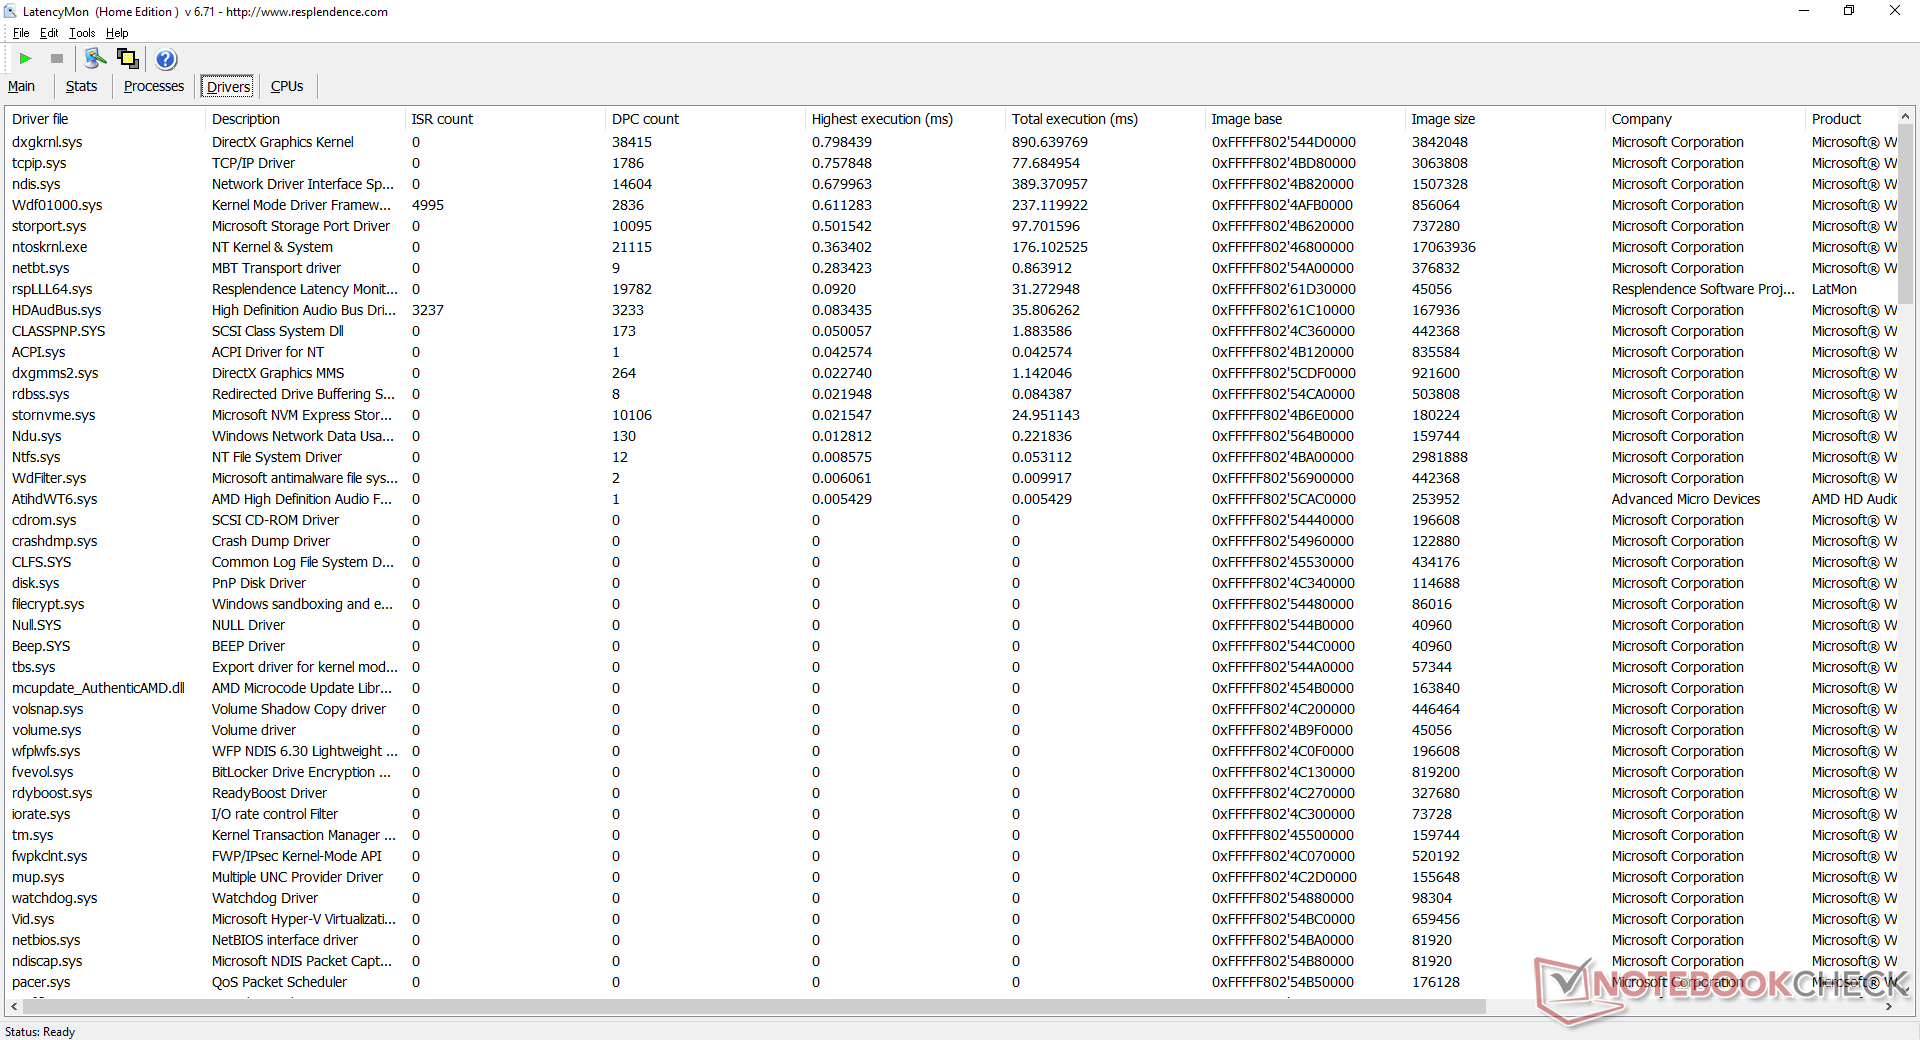
DPC延时
LatencyMon显示,在我们的主页上打开多个浏览器标签或运行Prime95压力时,没有DPC问题。在60FPS下的4K视频播放很流畅,几乎没有丢帧。
| DPC Latencies / LatencyMon - interrupt to process latency (max), Web, Youtube, Prime95 | |
| Beelink SEi10 | |
| GMK NucBox 2 | |
| Zotac ZBox MI643 | |
| Beelink SER3 | |
| Intel NUC11TNKi5 | |
* ... smaller is better
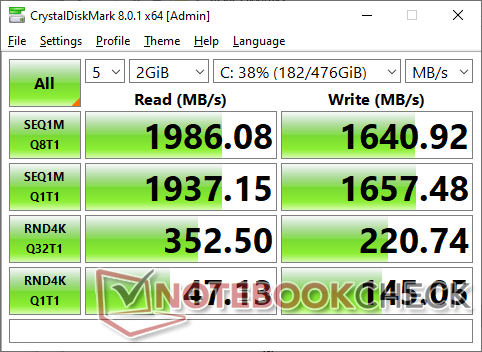
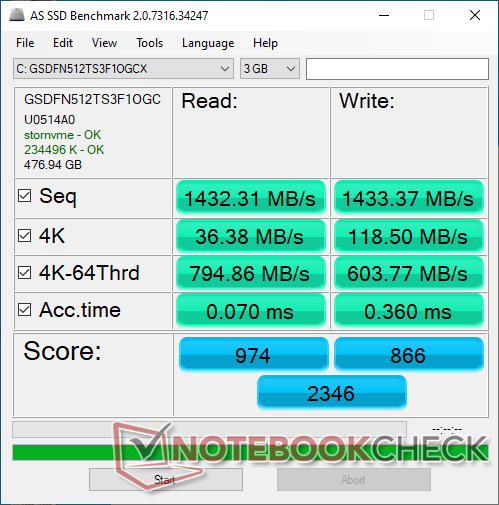
存储设备
我们的SEi10配备了256GB的Silicon Motion AZW NVMe SSD,而我们的SER3配备了512GB的版本。顺序读取和写入率显示,该驱动器是一个中档的NVMe产品。由于散热的限制,传输率会随着时间的推移从1900 MB/s降至1400 MB/s或更慢。许多英特尔NUC在NVMe固态硬盘的顶部集成了一个散热片,以防止或延迟性能减慢。

| Drive Performance rating - Percent | |
| Zotac ZBox MI643 | |
| Beelink SER3 | |
| GMK NucBox 2 | |
| Beelink SEi10 | |
| Intel NUC11TNKi5 | |
| DiskSpd | |
| seq read | |
| Zotac ZBox MI643 | |
| GMK NucBox 2 | |
| Beelink SER3 | |
| Beelink SEi10 | |
| Intel NUC11TNKi5 | |
| seq write | |
| Zotac ZBox MI643 | |
| Beelink SER3 | |
| GMK NucBox 2 | |
| Beelink SEi10 | |
| Intel NUC11TNKi5 | |
| seq q8 t1 read | |
| GMK NucBox 2 | |
| Zotac ZBox MI643 | |
| Beelink SER3 | |
| Beelink SEi10 | |
| Intel NUC11TNKi5 | |
| seq q8 t1 write | |
| Zotac ZBox MI643 | |
| Beelink SER3 | |
| GMK NucBox 2 | |
| Beelink SEi10 | |
| Intel NUC11TNKi5 | |
| 4k q1 t1 read | |
| Zotac ZBox MI643 | |
| Beelink SEi10 | |
| Beelink SER3 | |
| GMK NucBox 2 | |
| Intel NUC11TNKi5 | |
| 4k q1 t1 write | |
| Zotac ZBox MI643 | |
| Beelink SEi10 | |
| GMK NucBox 2 | |
| Beelink SER3 | |
| Intel NUC11TNKi5 | |
| 4k q32 t16 read | |
| Beelink SER3 | |
| Zotac ZBox MI643 | |
| Beelink SEi10 | |
| GMK NucBox 2 | |
| Intel NUC11TNKi5 | |
| 4k q32 t16 write | |
| Zotac ZBox MI643 | |
| GMK NucBox 2 | |
| Beelink SEi10 | |
| Beelink SER3 | |
| Intel NUC11TNKi5 | |
| AS SSD | |
| Score Total | |
| Zotac ZBox MI643 | |
| Beelink SER3 | |
| GMK NucBox 2 | |
| Beelink SEi10 | |
| Intel NUC11TNKi5 | |
| Score Read | |
| Zotac ZBox MI643 | |
| Beelink SER3 | |
| GMK NucBox 2 | |
| Beelink SEi10 | |
| Intel NUC11TNKi5 | |
| Score Write | |
| Zotac ZBox MI643 | |
| Beelink SER3 | |
| GMK NucBox 2 | |
| Intel NUC11TNKi5 | |
| Beelink SEi10 | |
| Seq Read | |
| GMK NucBox 2 | |
| Zotac ZBox MI643 | |
| Beelink SER3 | |
| Beelink SEi10 | |
| Intel NUC11TNKi5 | |
| Seq Write | |
| Zotac ZBox MI643 | |
| Beelink SER3 | |
| GMK NucBox 2 | |
| Intel NUC11TNKi5 | |
| Beelink SEi10 | |
| 4K Read | |
| Zotac ZBox MI643 | |
| GMK NucBox 2 | |
| Beelink SER3 | |
| Beelink SEi10 | |
| Intel NUC11TNKi5 | |
| 4K Write | |
| GMK NucBox 2 | |
| Zotac ZBox MI643 | |
| Beelink SER3 | |
| Beelink SEi10 | |
| Intel NUC11TNKi5 | |
| 4K-64 Read | |
| Zotac ZBox MI643 | |
| Beelink SER3 | |
| GMK NucBox 2 | |
| Beelink SEi10 | |
| Intel NUC11TNKi5 | |
| 4K-64 Write | |
| Zotac ZBox MI643 | |
| Beelink SER3 | |
| GMK NucBox 2 | |
| Intel NUC11TNKi5 | |
| Beelink SEi10 | |
| Access Time Read | |
| Intel NUC11TNKi5 | |
| Beelink SER3 | |
| Beelink SEi10 | |
| GMK NucBox 2 | |
| Zotac ZBox MI643 | |
| Access Time Write | |
| Beelink SEi10 | |
| Beelink SER3 | |
| GMK NucBox 2 | |
| Intel NUC11TNKi5 | |
| Zotac ZBox MI643 | |
* ... smaller is better
Disk Throttling: DiskSpd Read Loop, Queue Depth 8
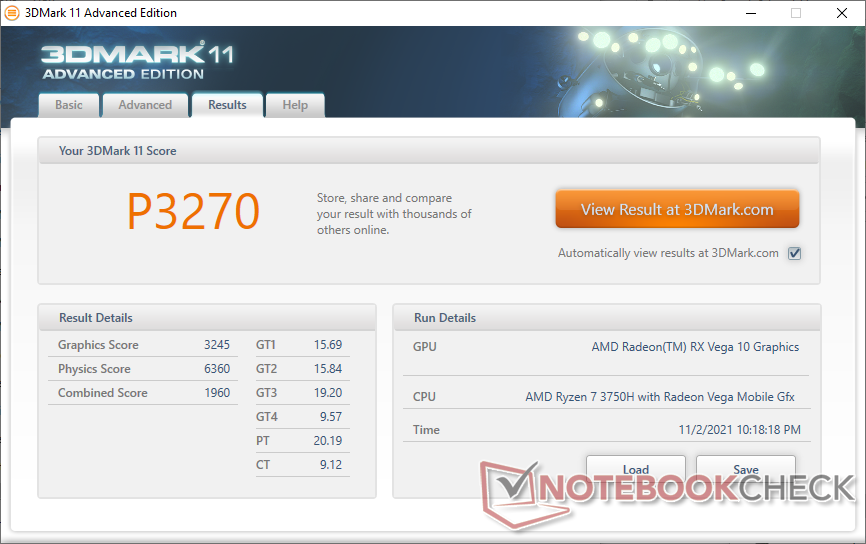
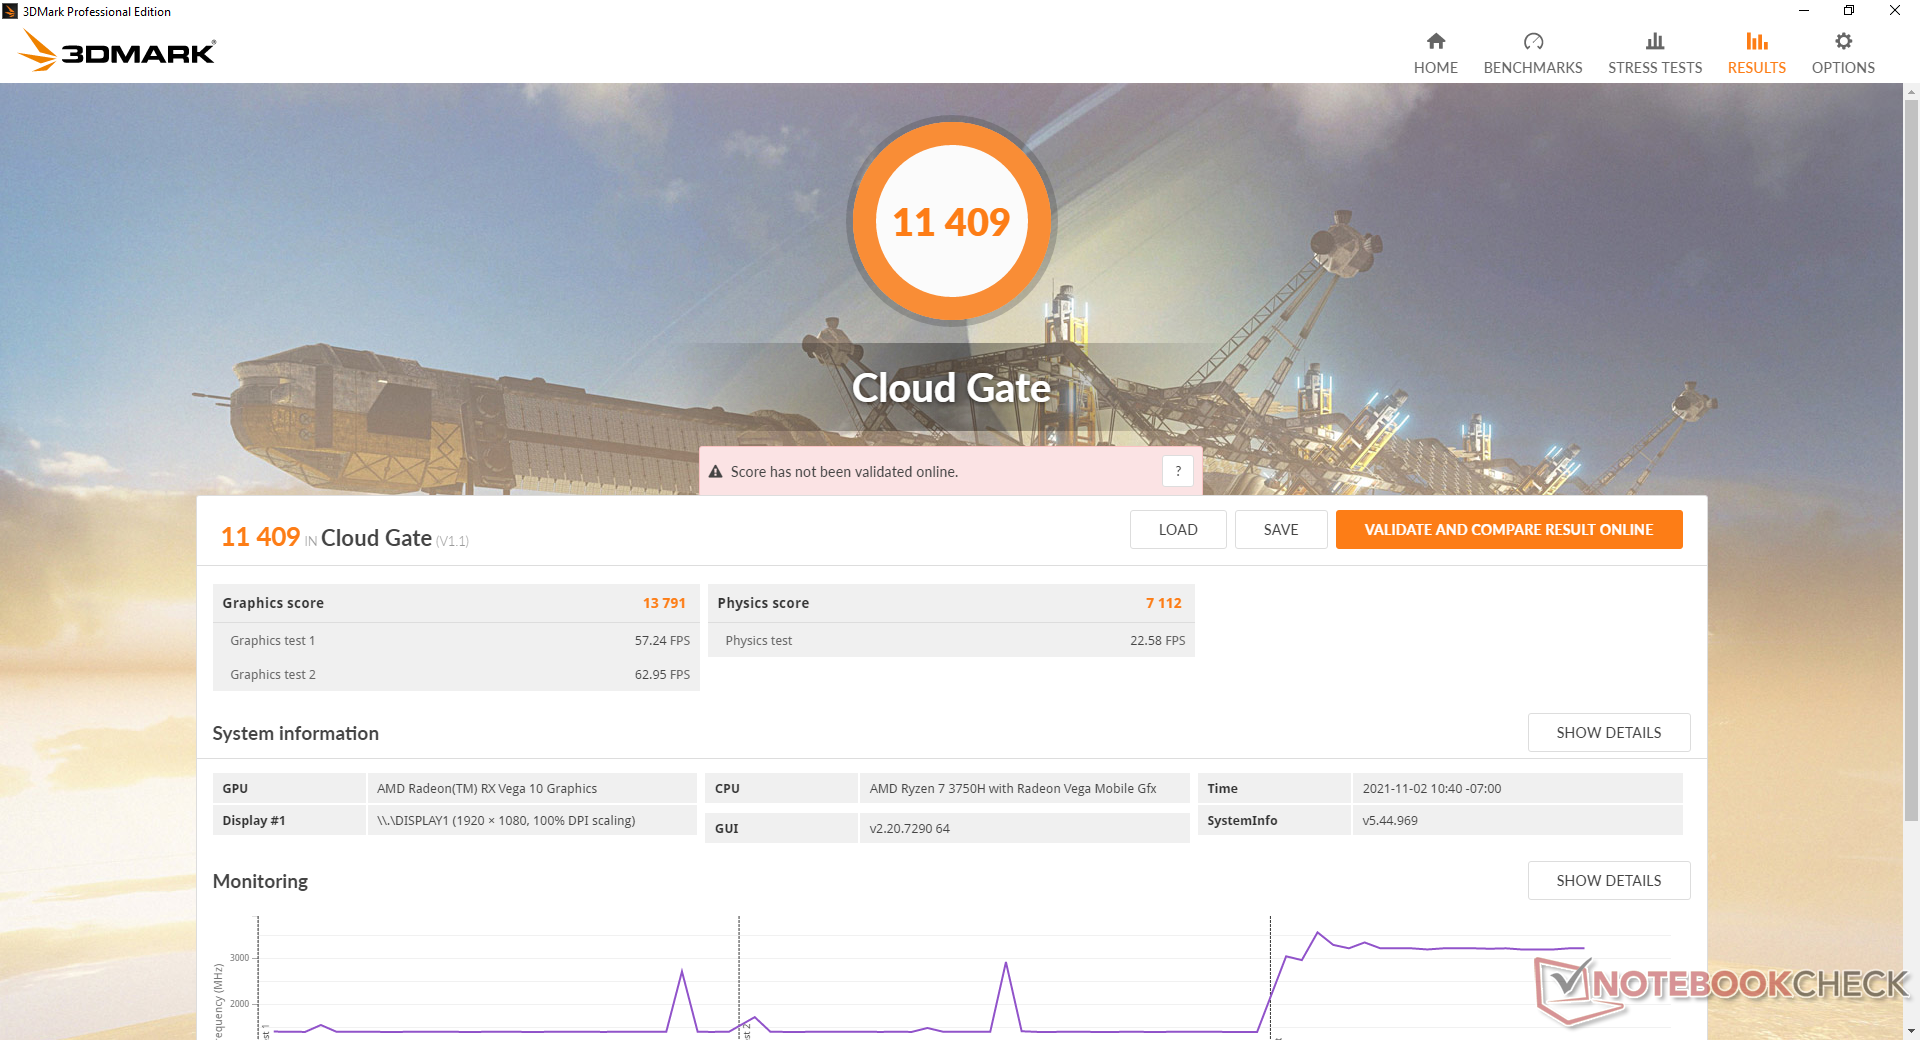
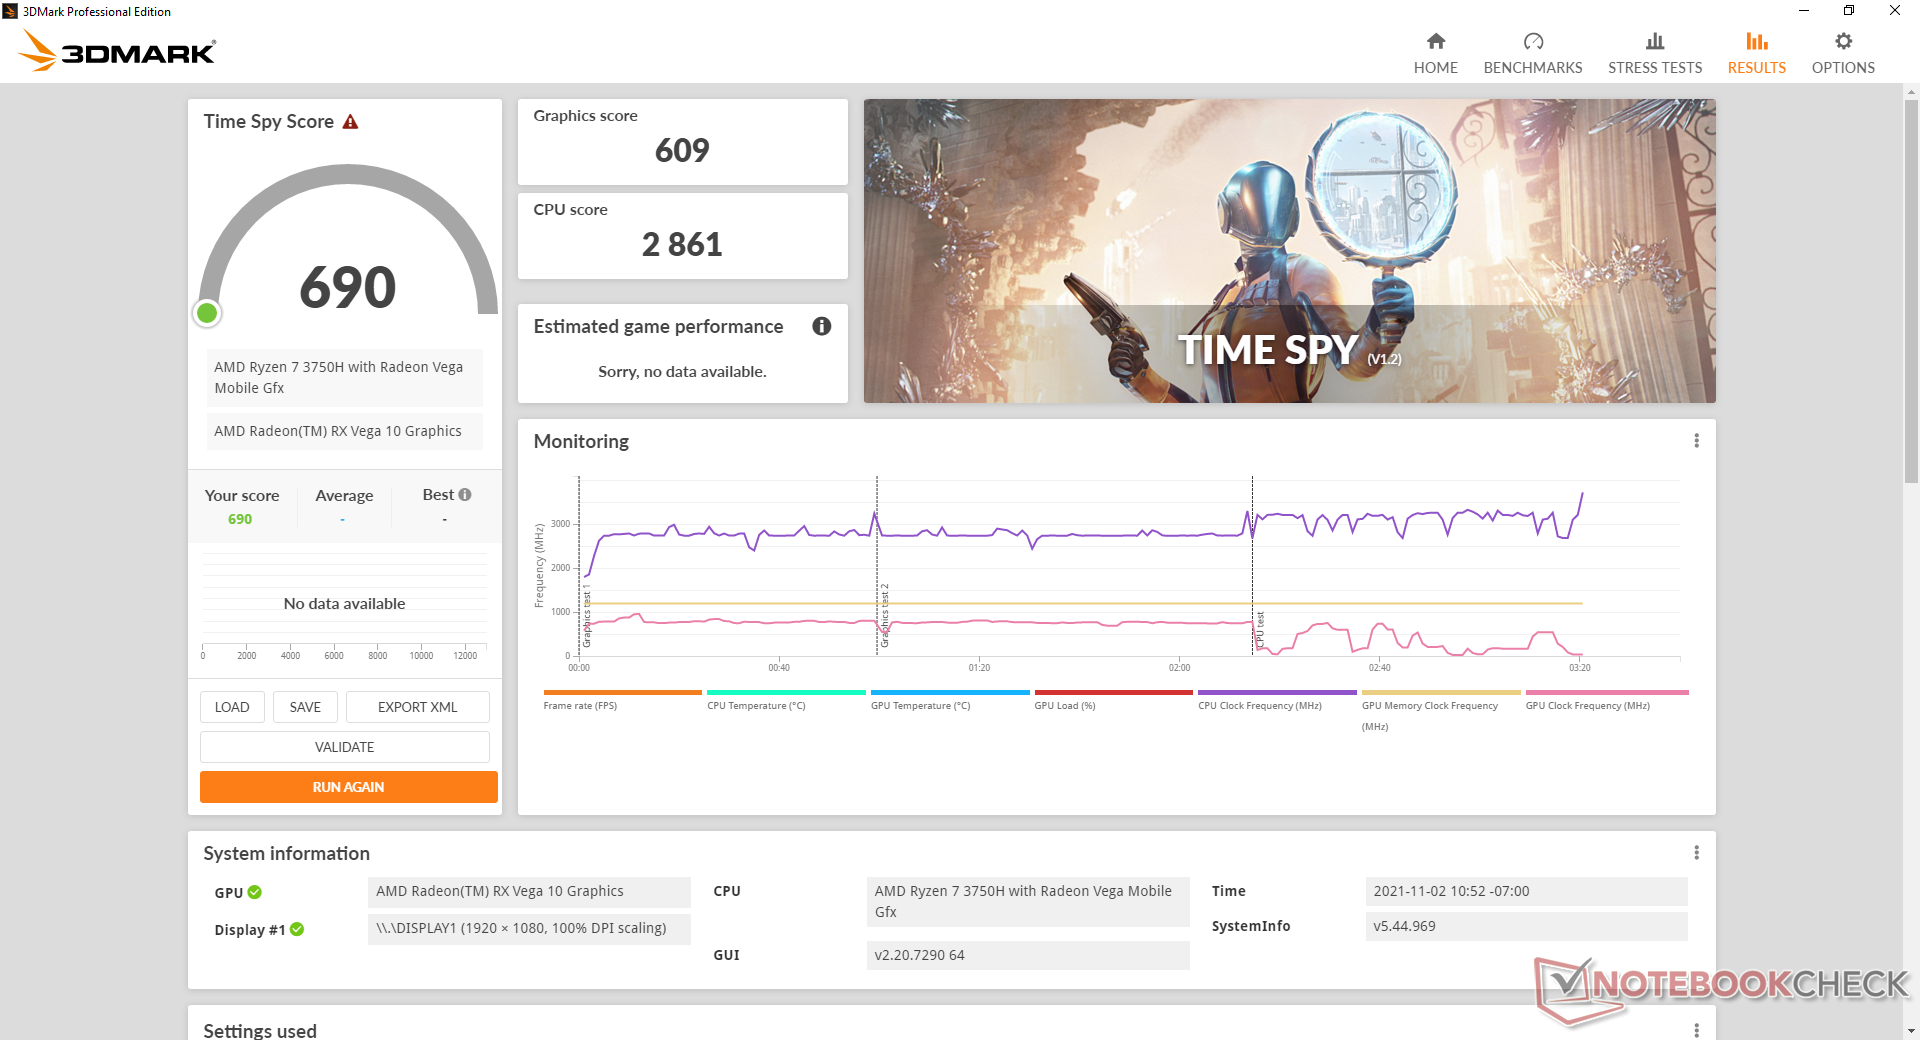
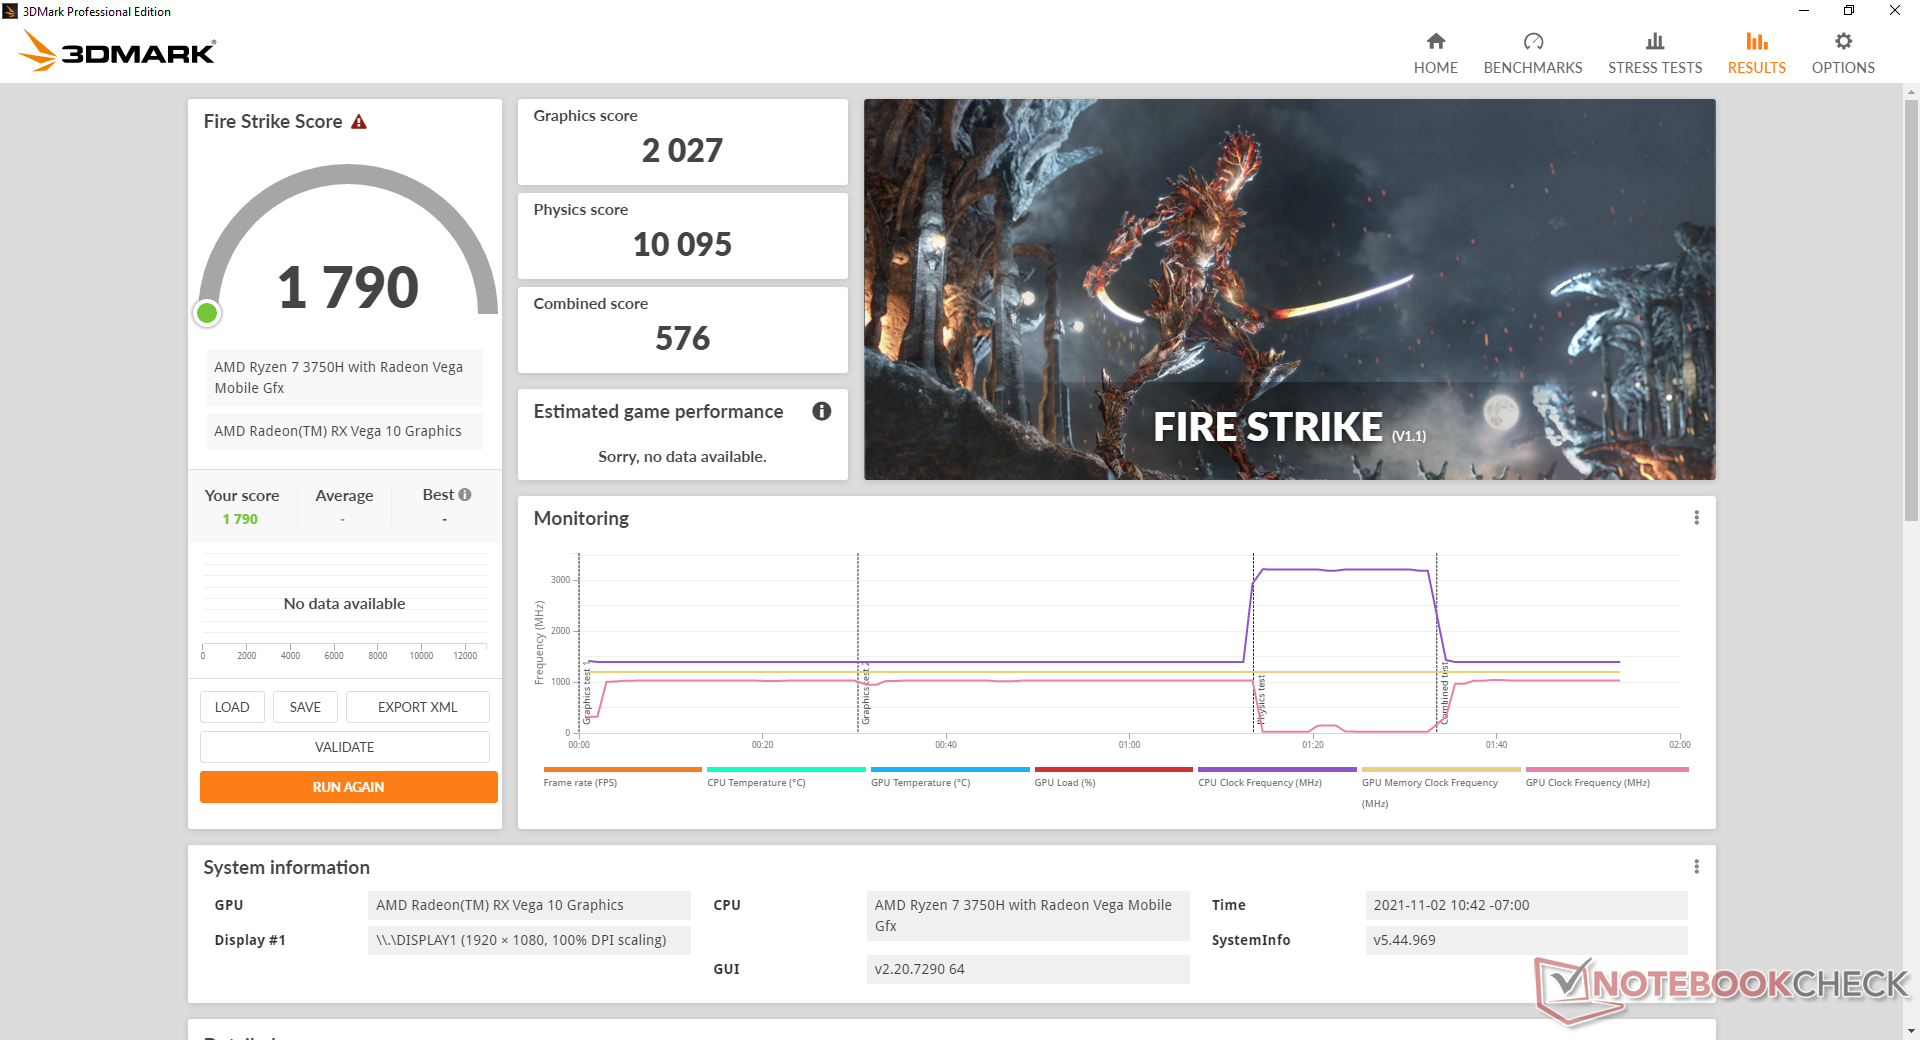
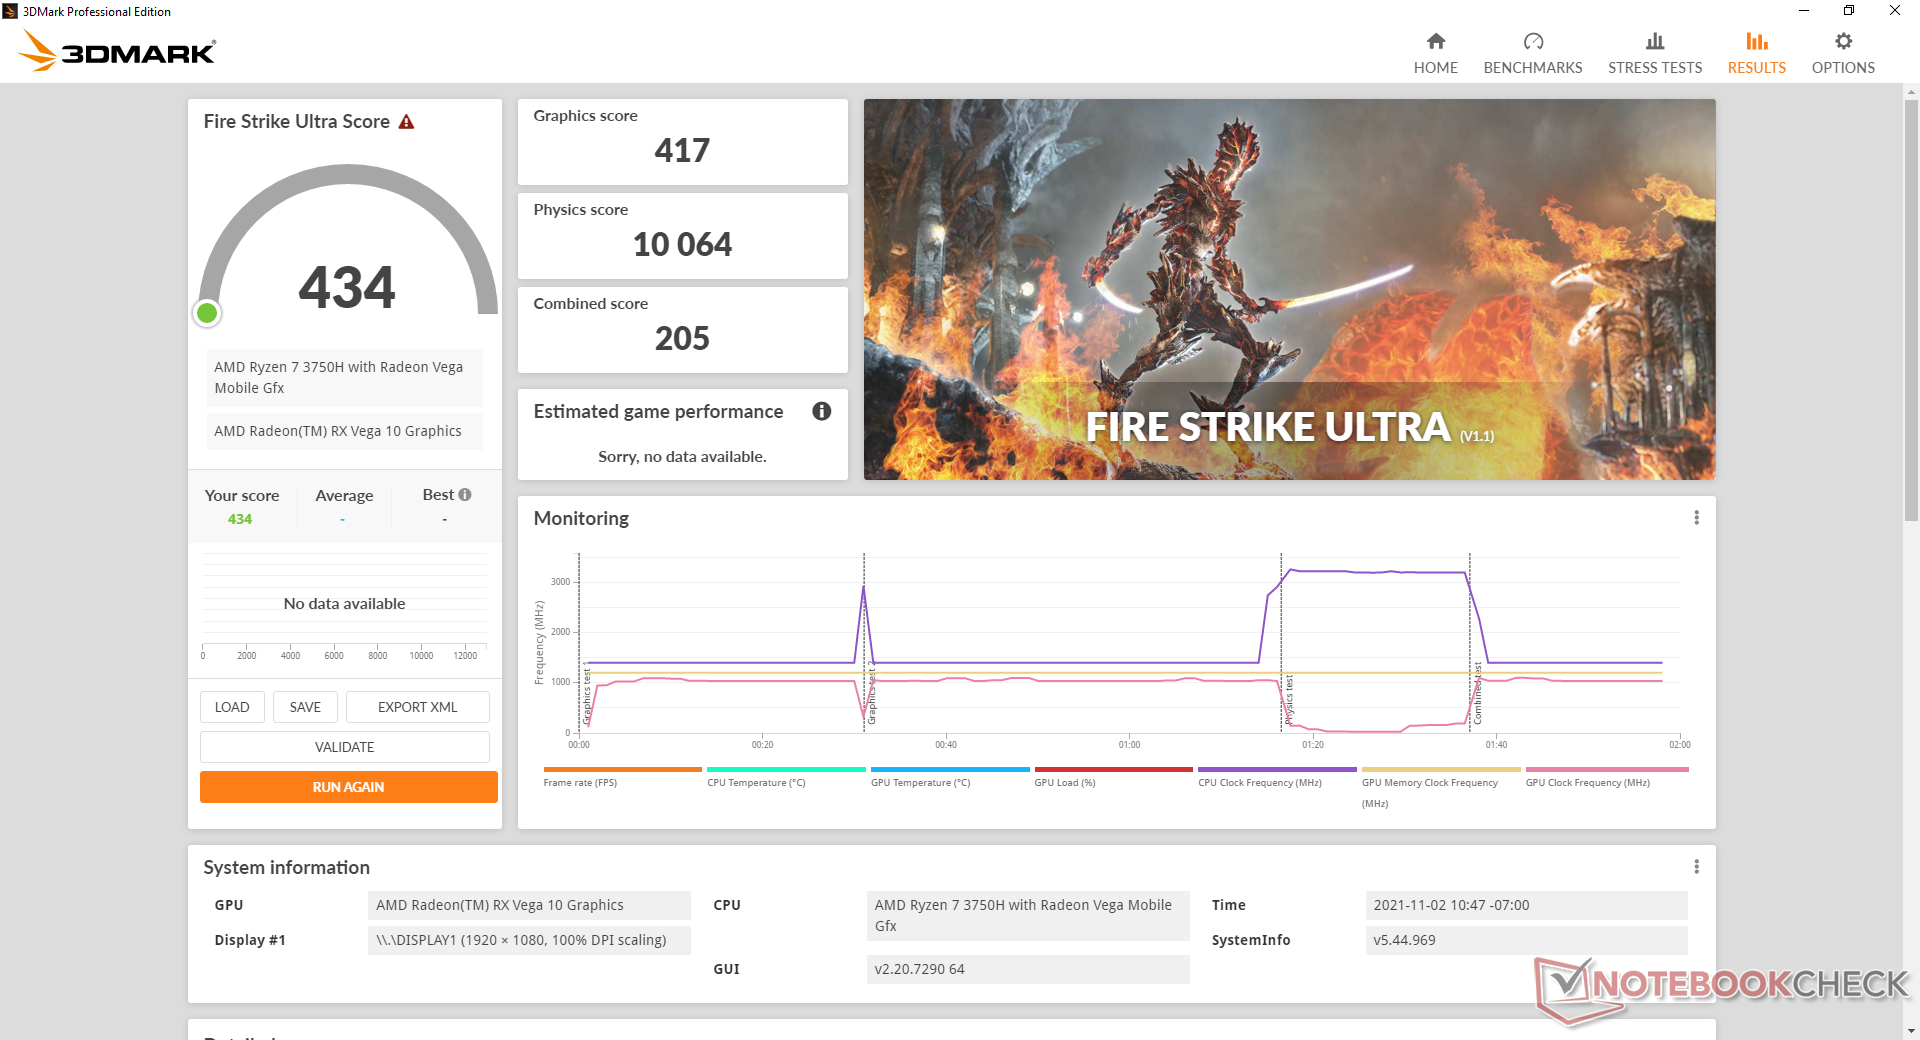
GPU性能
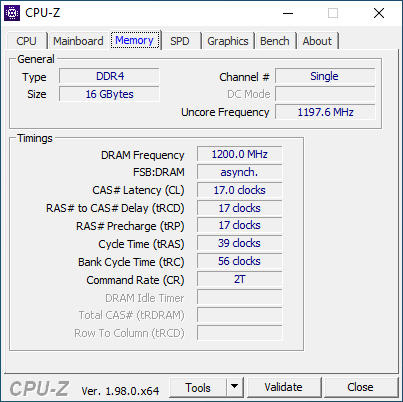
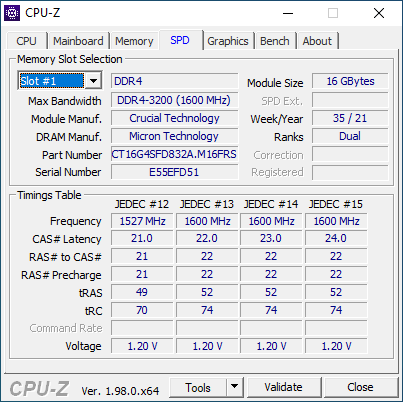
图形性能最类似于 Iris Plus Graphics 655.虽然我们的 Radeon RX Vega 10是一个体面的升级,比 UHD Graphics 620的升级,但它仍然明显慢于最新的 Iris Xe NUC选项英特尔的最新选择。总体性能比我们数据库中的平均RX Vega 10稍慢,因为我们的SER3测试单元只配备了单通道内存。如果配置双通道内存,用户可以从GPU中榨取更多的性能。
| 3DMark Performance rating - Percent | |
| VAIO SX14 VJS144X0111K | |
| Asus Zenbook 14X UX5400E -1! | |
| Huawei MateBook 16 R7 5800H | |
| Lenovo Yoga 6 13ALC6 | |
| Dell Latitude 14 5411-WJ40N | |
| Intel NUC11TNKi5 | |
| Average AMD Radeon RX Vega 10 | |
| Intel NUC8i7BE | |
| Beelink SER3 | |
| GMK NucBox 2 | |
| Zotac ZBox MI643 | |
| Beelink SEi10 | |
| 3DMark | |
| 1920x1080 Fire Strike Graphics | |
| VAIO SX14 VJS144X0111K | |
| Asus Zenbook 14X UX5400E | |
| Dell Latitude 14 5411-WJ40N | |
| Huawei MateBook 16 R7 5800H | |
| Lenovo Yoga 6 13ALC6 | |
| Intel NUC11TNKi5 | |
| Intel NUC8i7BE | |
| Average AMD Radeon RX Vega 10 (1567 - 2999, n=17) | |
| Beelink SER3 | |
| GMK NucBox 2 | |
| Zotac ZBox MI643 | |
| Beelink SEi10 | |
| 2560x1440 Time Spy Graphics | |
| VAIO SX14 VJS144X0111K | |
| Asus Zenbook 14X UX5400E | |
| Huawei MateBook 16 R7 5800H | |
| Dell Latitude 14 5411-WJ40N | |
| Lenovo Yoga 6 13ALC6 | |
| Intel NUC11TNKi5 | |
| Average AMD Radeon RX Vega 10 (578 - 852, n=7) | |
| Intel NUC8i7BE | |
| Beelink SER3 | |
| GMK NucBox 2 | |
| Zotac ZBox MI643 | |
| Beelink SEi10 | |
| 2560x1440 Time Spy Score | |
| VAIO SX14 VJS144X0111K | |
| Asus Zenbook 14X UX5400E | |
| Huawei MateBook 16 R7 5800H | |
| Dell Latitude 14 5411-WJ40N | |
| Lenovo Yoga 6 13ALC6 | |
| Intel NUC11TNKi5 | |
| Average AMD Radeon RX Vega 10 (647 - 955, n=8) | |
| Intel NUC8i7BE | |
| Beelink SER3 | |
| GMK NucBox 2 | |
| Zotac ZBox MI643 | |
| Beelink SEi10 | |
| 3DMark 11 - 1280x720 Performance GPU | |
| VAIO SX14 VJS144X0111K | |
| Huawei MateBook 16 R7 5800H | |
| Lenovo Yoga 6 13ALC6 | |
| Intel NUC11TNKi5 | |
| Dell Latitude 14 5411-WJ40N | |
| Average AMD Radeon RX Vega 10 (2688 - 4165, n=17) | |
| Beelink SER3 | |
| Intel NUC8i7BE | |
| GMK NucBox 2 | |
| Zotac ZBox MI643 | |
| Beelink SEi10 | |
| 3DMark 11 Performance | 3270 points | |
| 3DMark Cloud Gate Standard Score | 11409 points | |
| 3DMark Fire Strike Score | 1790 points | |
| 3DMark Time Spy Score | 690 points | |
Help | ||
| Final Fantasy XV Benchmark | |
| 1280x720 Lite Quality | |
| MSI Alpha 15 A3DDK-034 | |
| Dell Inspiron 15 5518-2X3JR | |
| VAIO SX14 VJS144X0111K | |
| Dell Latitude 14 5411-WJ40N | |
| Huawei MateBook 16 R7 5800H | |
| Lenovo Yoga 6 13ALC6 | |
| Intel NUC11TNKi5 | |
| Beelink SER3 | |
| GMK NucBox 2 | |
| Average AMD Radeon RX Vega 10 (16.1 - 19, n=3) | |
| Intel NUC8i7BE | |
| 1920x1080 Standard Quality | |
| MSI Alpha 15 A3DDK-034 | |
| Dell Inspiron 15 5518-2X3JR | |
| VAIO SX14 VJS144X0111K | |
| Dell Latitude 14 5411-WJ40N | |
| Huawei MateBook 16 R7 5800H | |
| Lenovo Yoga 6 13ALC6 | |
| Intel NUC11TNKi5 | |
| Beelink SER3 | |
| GMK NucBox 2 | |
| Average AMD Radeon RX Vega 10 (8.1 - 9.98, n=3) | |
| 1920x1080 High Quality | |
| MSI Alpha 15 A3DDK-034 | |
| VAIO SX14 VJS144X0111K | |
| Dell Inspiron 15 5518-2X3JR | |
| Huawei MateBook 16 R7 5800H | |
| Lenovo Yoga 6 13ALC6 | |
| Intel NUC11TNKi5 | |
| Beelink SER3 | |
| Average AMD Radeon RX Vega 10 (n=1) | |
| GMK NucBox 2 | |
| Far Cry 5 | |
| 1280x720 Low Preset AA:T | |
| VAIO SX14 VJS144X0111K | |
| Lenovo Yoga 6 13ALC6 | |
| Average AMD Radeon RX Vega 10 (20 - 33, n=5) | |
| Intel NUC8i7BE | |
| Beelink SER3 | |
| Huawei MateBook 16 R7 5800H | |
| 1920x1080 Low Preset AA:T | |
| Huawei MateBook 16 R7 5800H | |
| VAIO SX14 VJS144X0111K | |
| Lenovo Yoga 6 13ALC6 | |
| Average AMD Radeon RX Vega 10 (13 - 19, n=2) | |
| Intel NUC8i7BE | |
| Beelink SER3 | |
| 1920x1080 Medium Preset AA:T | |
| Asus Zenbook 14X UX5400E | |
| VAIO SX14 VJS144X0111K | |
| Huawei MateBook 16 R7 5800H | |
| Lenovo Yoga 6 13ALC6 | |
| Average AMD Radeon RX Vega 10 (10 - 16, n=5) | |
| Beelink SER3 | |
| Intel NUC8i7BE | |
| 1920x1080 High Preset AA:T | |
| Asus Zenbook 14X UX5400E | |
| VAIO SX14 VJS144X0111K | |
| Huawei MateBook 16 R7 5800H | |
| Lenovo Yoga 6 13ALC6 | |
| Average AMD Radeon RX Vega 10 (9 - 15, n=5) | |
| Beelink SER3 | |
| 1920x1080 Ultra Preset AA:T | |
| Asus Zenbook 14X UX5400E | |
| VAIO SX14 VJS144X0111K | |
| Lenovo Yoga 6 13ALC6 | |
| Average AMD Radeon RX Vega 10 (9 - 13, n=3) | |
| Beelink SER3 | |
| X-Plane 11.11 | |
| 1280x720 low (fps_test=1) | |
| Dell Latitude 14 5411-WJ40N | |
| Dell Inspiron 15 5518-2X3JR | |
| Asus Zenbook 14X UX5400E | |
| Huawei MateBook 16 R7 5800H | |
| VAIO SX14 VJS144X0111K | |
| Lenovo Yoga 6 13ALC6 | |
| Intel NUC11TNKi5 | |
| Intel NUC8i7BE | |
| GMK NucBox 2 | |
| Average AMD Radeon RX Vega 10 (23 - 28.4, n=7) | |
| Beelink SER3 | |
| Zotac ZBox MI643 | |
| 1920x1080 med (fps_test=2) | |
| Dell Latitude 14 5411-WJ40N | |
| Dell Inspiron 15 5518-2X3JR | |
| Asus Zenbook 14X UX5400E | |
| Huawei MateBook 16 R7 5800H | |
| VAIO SX14 VJS144X0111K | |
| Lenovo Yoga 6 13ALC6 | |
| Intel NUC11TNKi5 | |
| Intel NUC8i7BE | |
| Average AMD Radeon RX Vega 10 (15.6 - 22, n=7) | |
| Beelink SER3 | |
| GMK NucBox 2 | |
| Zotac ZBox MI643 | |
| 1920x1080 high (fps_test=3) | |
| Dell Latitude 14 5411-WJ40N | |
| Dell Inspiron 15 5518-2X3JR | |
| Asus Zenbook 14X UX5400E | |
| Huawei MateBook 16 R7 5800H | |
| VAIO SX14 VJS144X0111K | |
| Intel NUC11TNKi5 | |
| Lenovo Yoga 6 13ALC6 | |
| Intel NUC8i7BE | |
| Beelink SER3 | |
| Average AMD Radeon RX Vega 10 (14.2 - 19.7, n=7) | |
| GMK NucBox 2 | |
| Zotac ZBox MI643 | |
Witcher 3 FPS Chart
| low | med. | high | ultra | |
|---|---|---|---|---|
| GTA V (2015) | 51.8 | 46.3 | 13.2 | 6.76 |
| The Witcher 3 (2015) | 35.7 | 22.9 | 12.2 | 8 |
| Dota 2 Reborn (2015) | 67.4 | 52 | 30.1 | 28.3 |
| Final Fantasy XV Benchmark (2018) | 19 | 9.98 | 6.8 | |
| X-Plane 11.11 (2018) | 23.8 | 18.5 | 16.7 | |
| Far Cry 5 (2018) | 23 | 12 | 11 | 10 |
| Strange Brigade (2018) | 37.9 | 15.1 | 12.6 | 10.9 |
排放
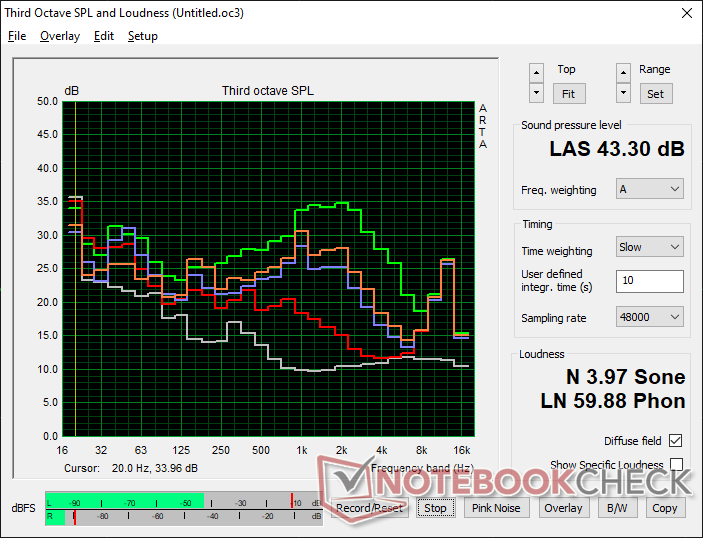
系统噪音
当运行典型的HTPC负载(如浏览或视频流)时,风扇会频繁跳动。脉动并不极端,在23.4 dB(A)的无声背景下,最高只有29.4 dB(A),但在安静的办公室环境中,它是明显的。值得庆幸的是,在大音量的音乐或视频播放过程中,它还没有大到让人分心的程度。
运行更高的负载,如游戏,会引起高达37至43 dB(A)的风扇噪音,这与许多U系列的超极本或旧的英特尔NUC8i7BE.
Noise level
| Idle |
| 23.4 / 23.4 / 29.4 dB(A) |
| Load |
| 35.2 / 43.3 dB(A) |
 | ||
30 dB silent 40 dB(A) audible 50 dB(A) loud |
||
min: | ||
| Beelink SER3 Vega 10, R7 3750H, GSemi AZW GSDFN512TS3F1OGCX | Beelink SEi10 UHD Graphics G1 (Ice Lake 32 EU), i3-1005G1, Silicon Motion AZW 256G M.2280 NVMe 4X 200725 D | Intel NUC8i7BE Iris Plus Graphics 655, i7-8559U | GMK NucBox 2 Iris Plus Graphics 655, i5-8259U, Netac S930E8/256GPN | Zotac ZBox MI643 UHD Graphics 620, i5-10210U, Lexar NM610 1TB | Intel NUC11TNKi5 Iris Xe G7 80EUs, i5-1135G7, Transcend M.2 SSD 430S TS512GMTS430S | |
|---|---|---|---|---|---|---|
| Noise | -23% | -13% | 1% | -4% | -21% | |
| off / environment * (dB) | 23.4 | 27.5 -18% | 28.7 -23% | 25.6 -9% | 26.1 -12% | 24.8 -6% |
| Idle Minimum * (dB) | 23.4 | 30.9 -32% | 28.7 -23% | 25.7 -10% | 27.5 -18% | 35.6 -52% |
| Idle Average * (dB) | 23.4 | 33.5 -43% | 29.3 -25% | 25.7 -10% | 27.5 -18% | 35.6 -52% |
| Idle Maximum * (dB) | 29.4 | 33.5 -14% | 31.8 -8% | 25.7 13% | 27.5 6% | 35.6 -21% |
| Load Average * (dB) | 35.2 | 38.5 -9% | 39 -11% | 35.3 -0% | 28.9 18% | 36.2 -3% |
| Witcher 3 ultra * (dB) | 37.2 | 39 -5% | 38 -2% | |||
| Load Maximum * (dB) | 43.3 | 51.6 -19% | 41.4 4% | 35.1 19% | 42 3% | 47.6 -10% |
* ... smaller is better
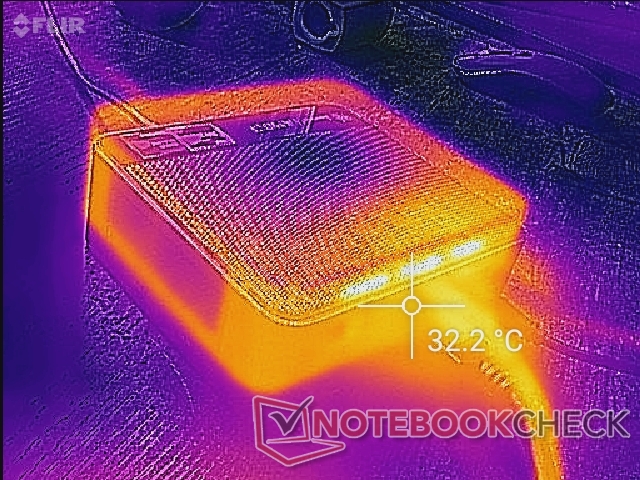
温度
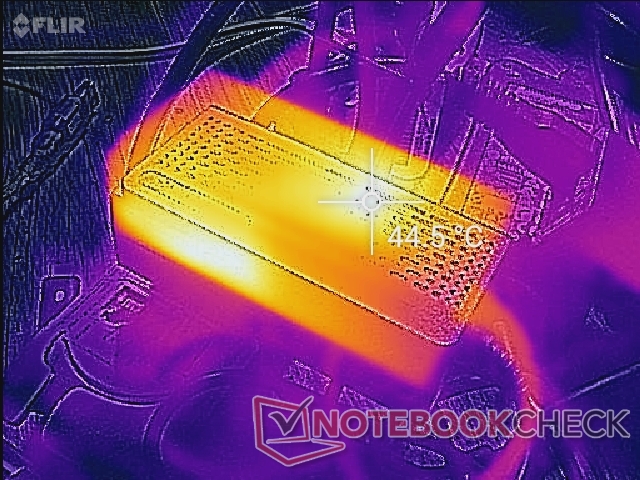
表面温度对SER3来说不是一个问题。暖空气从后面排出,而冷空气从顶部进入,因此我们不建议在迷你电脑上堆放任何书籍或纸张。
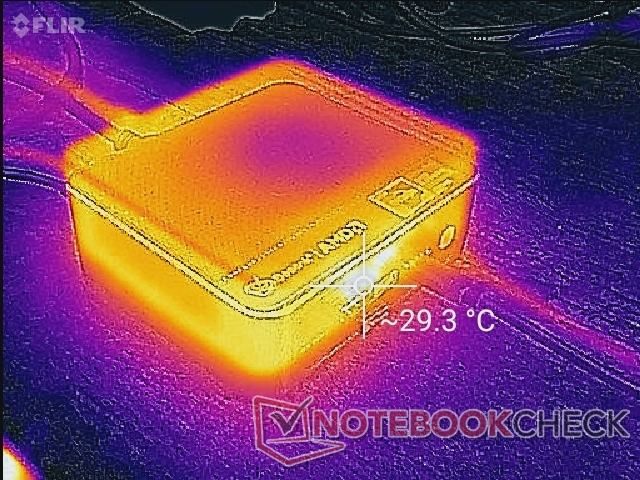
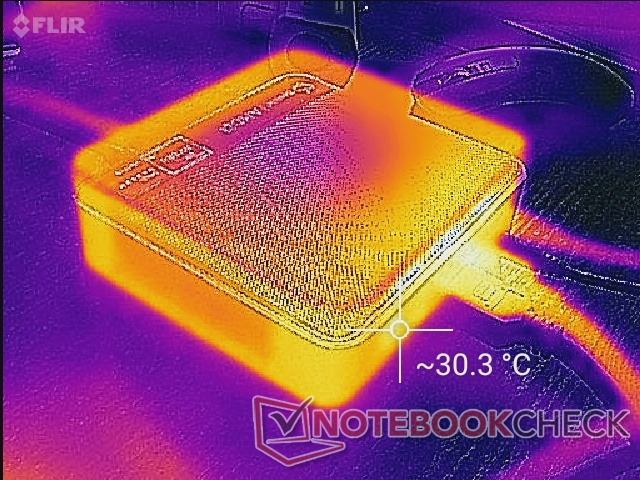
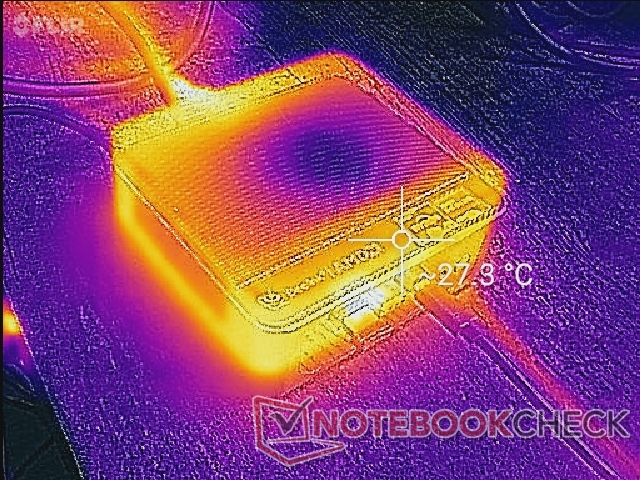
如我们的温度图所示,在高负荷运行时,AC适配器的温度可能比迷你电脑本身还要高。
压力测试
当运行prime95时,CPU的时钟频率在最初的一分钟左右会提升到3.3GHz,直到达到78C的核心温度,然后时钟频率会下降到3.0GHz,以保持72C的较低核心温度。
核心温度相对较低,运行时只有56摄氏度。 Witcher 3相比之下,英特尔NUC11TNK5的温度为62摄氏度。 英特尔NUC11TNKi5 Pro.
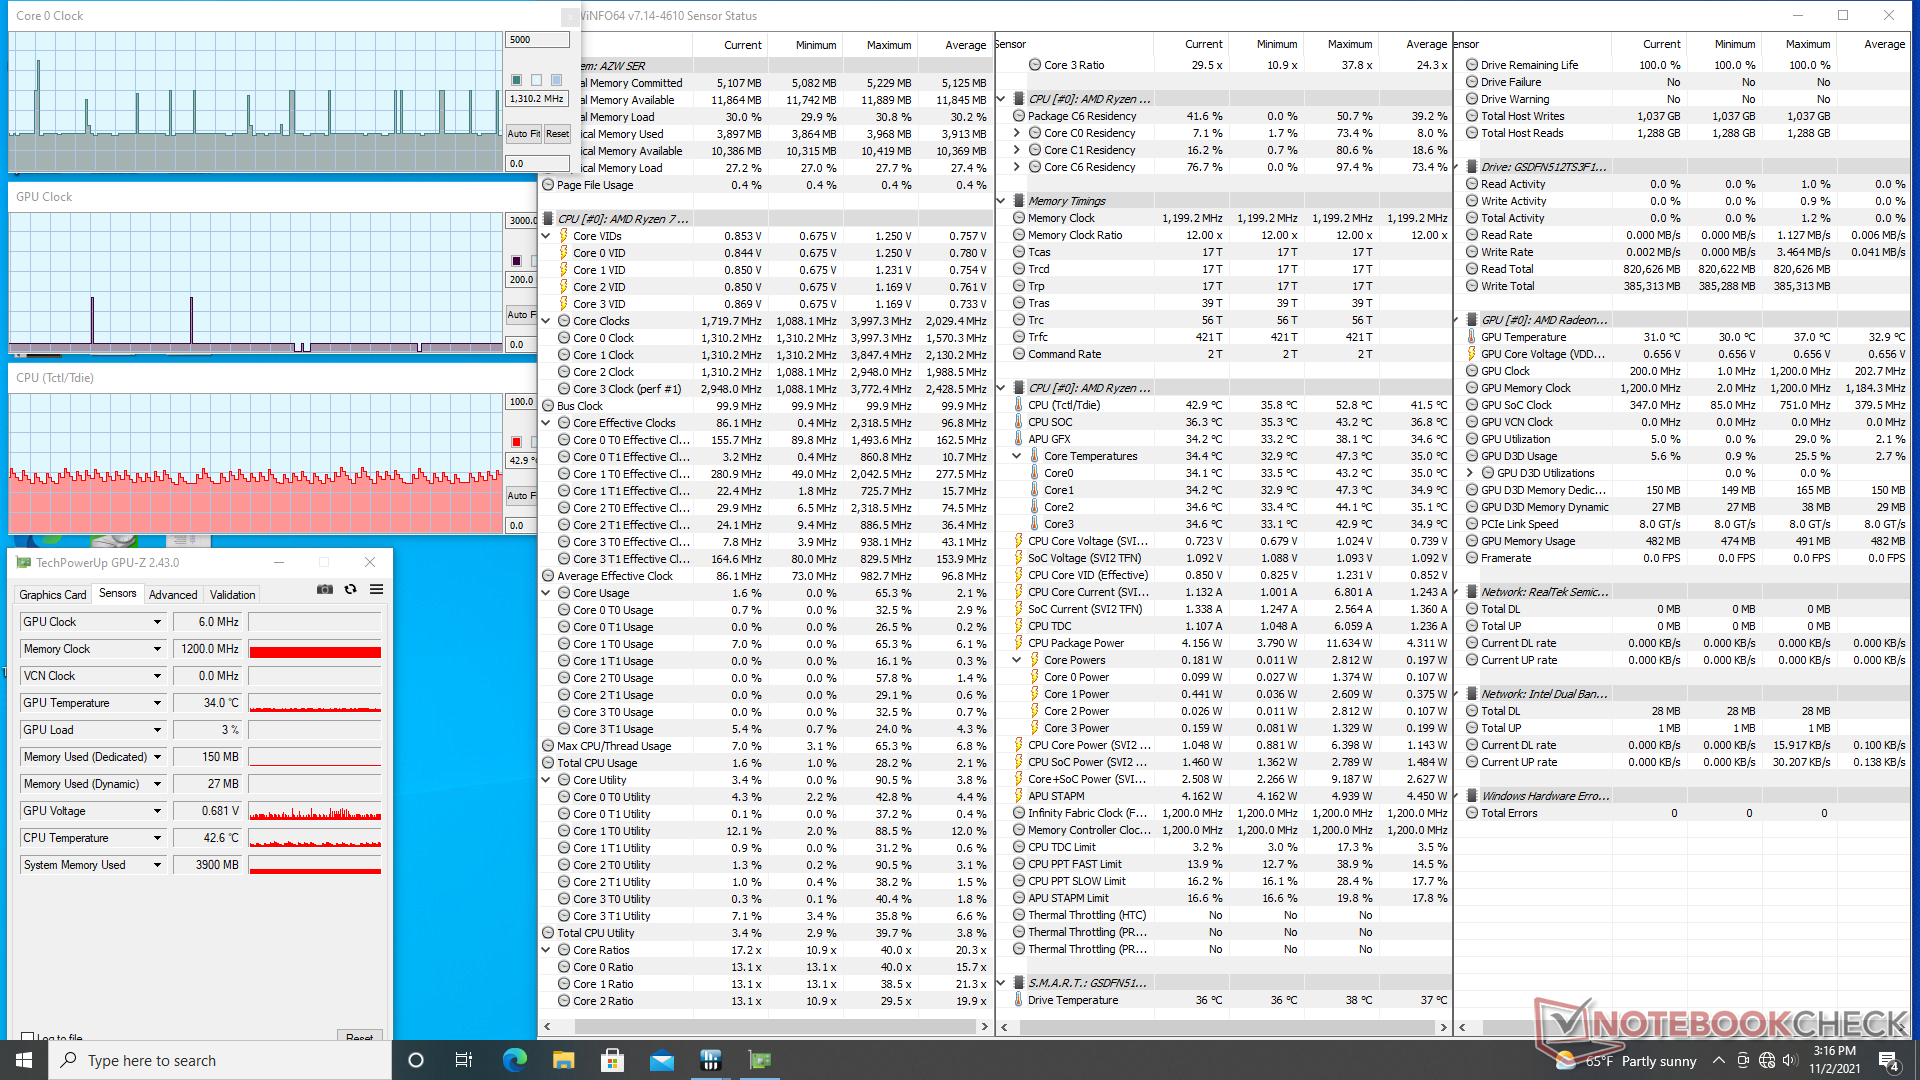
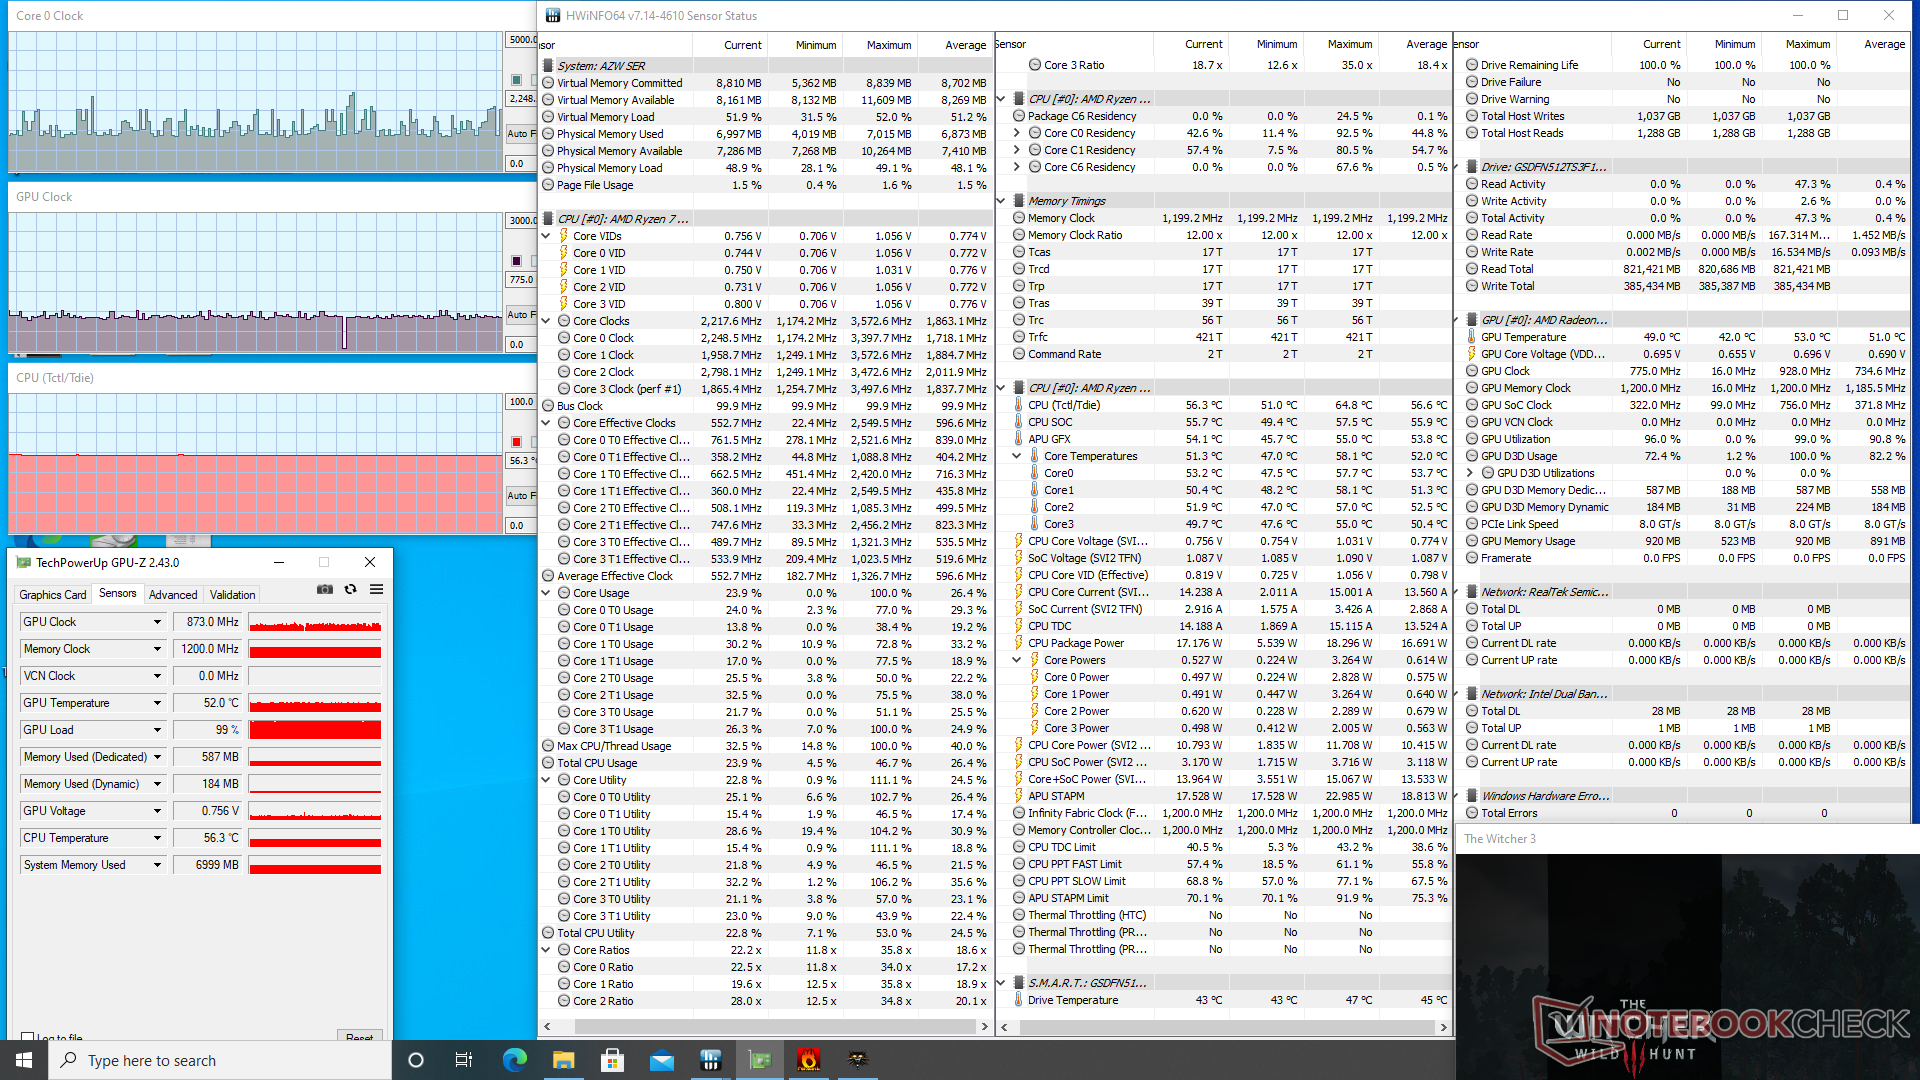
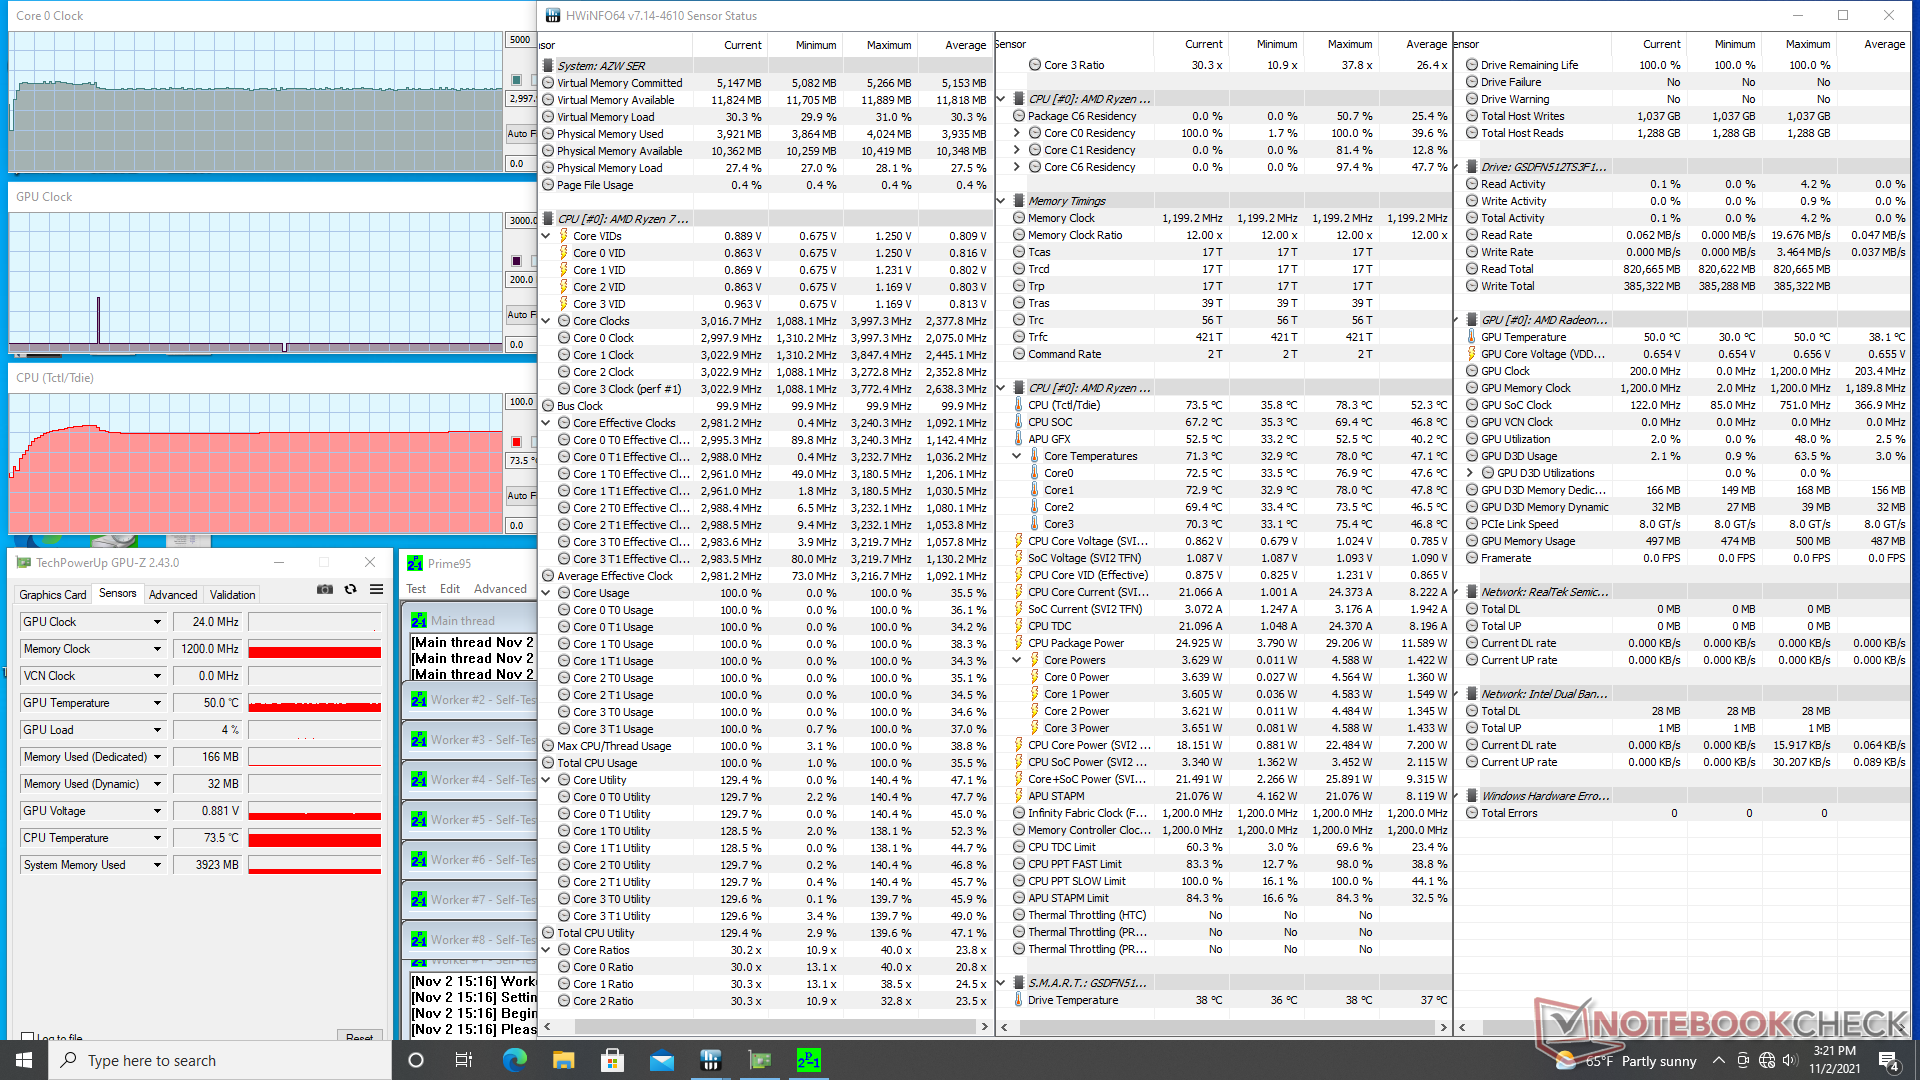
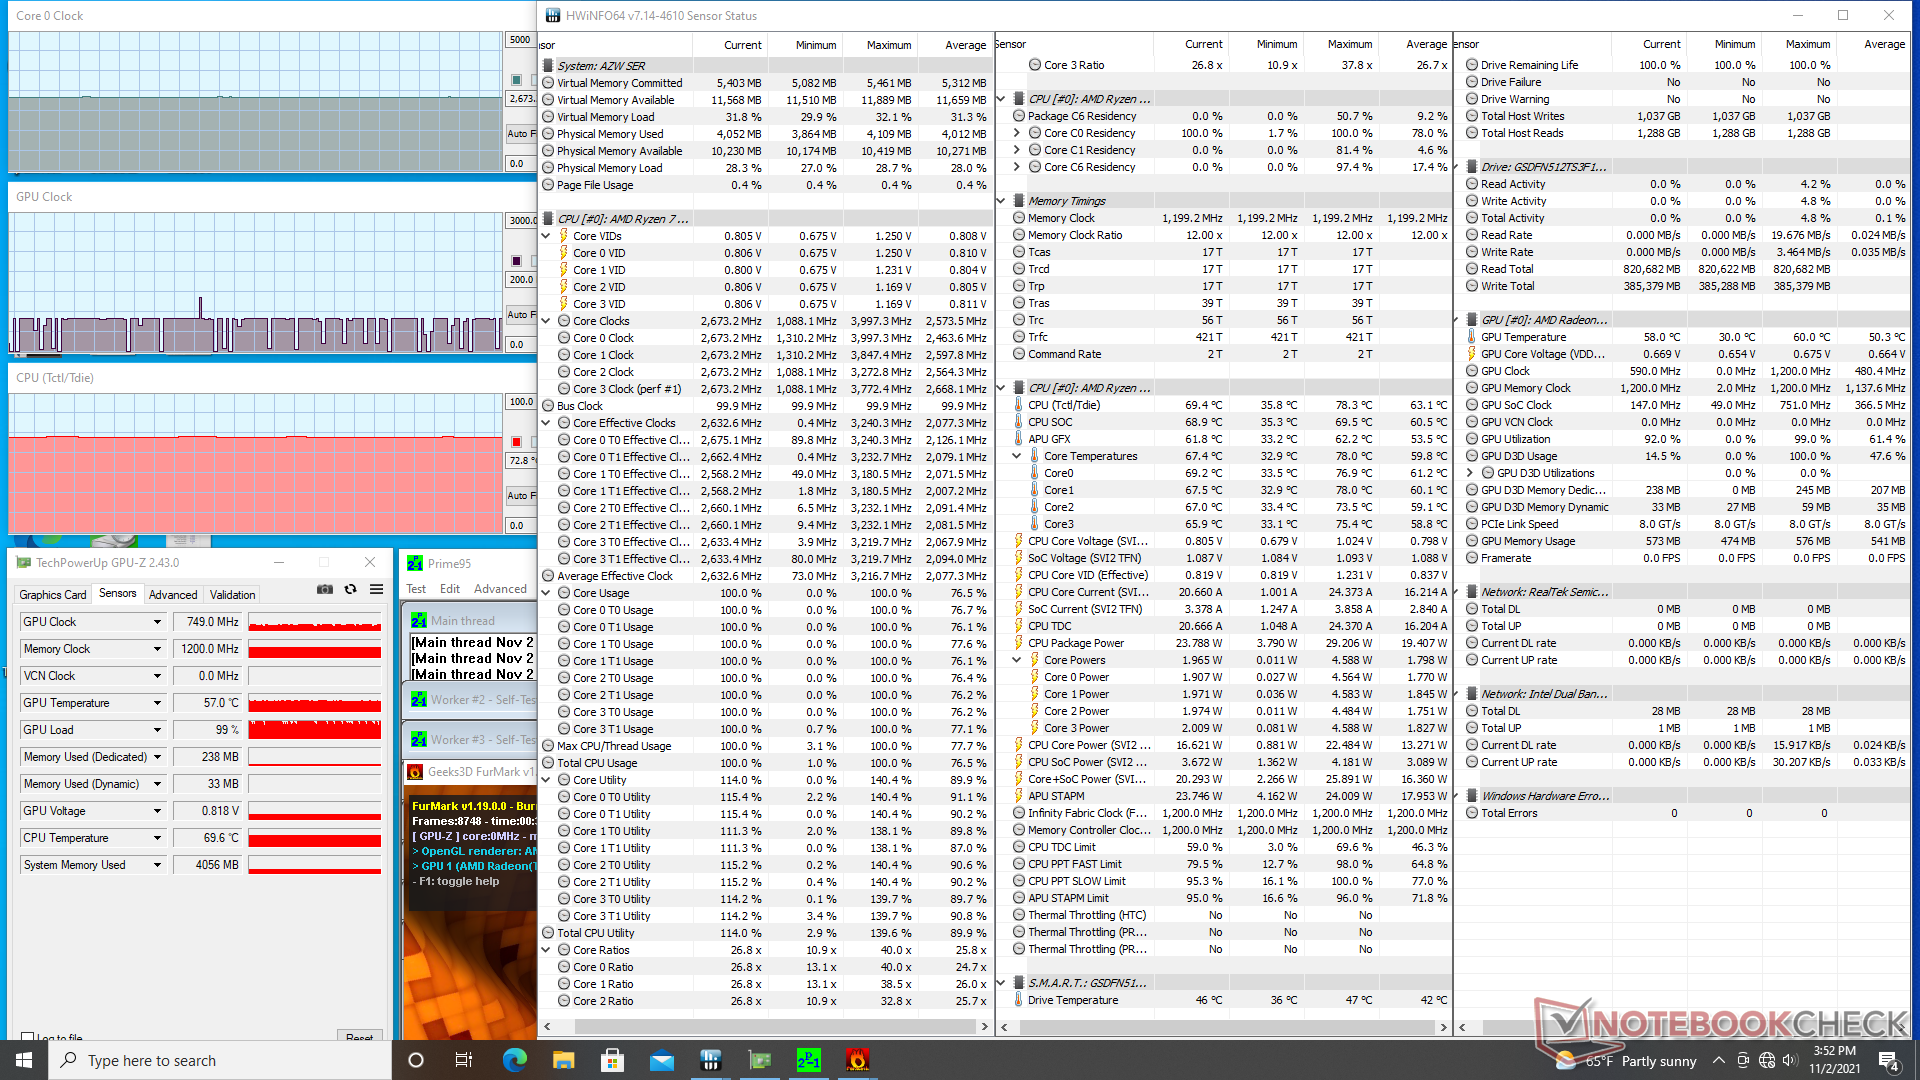
| CPU时钟(GHz) | GPU时钟(MHz) | CPU平均温度Tctl/Tdie(℃) | |
| 系统空闲 | -- | -- | 43 |
| Prime95压力 | 3.0 | -- | 74 |
| Prime95 + FurMark压力 | 2.7 | 749 | 73 |
| Witcher 3 Stress | 0.3 - 0.8 | ~873 | 56 |
能源管理
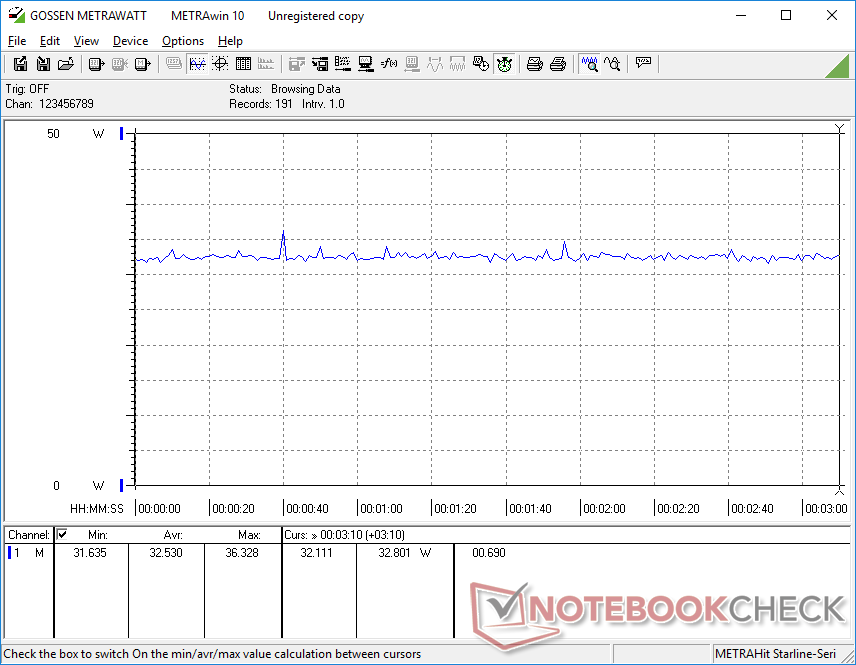
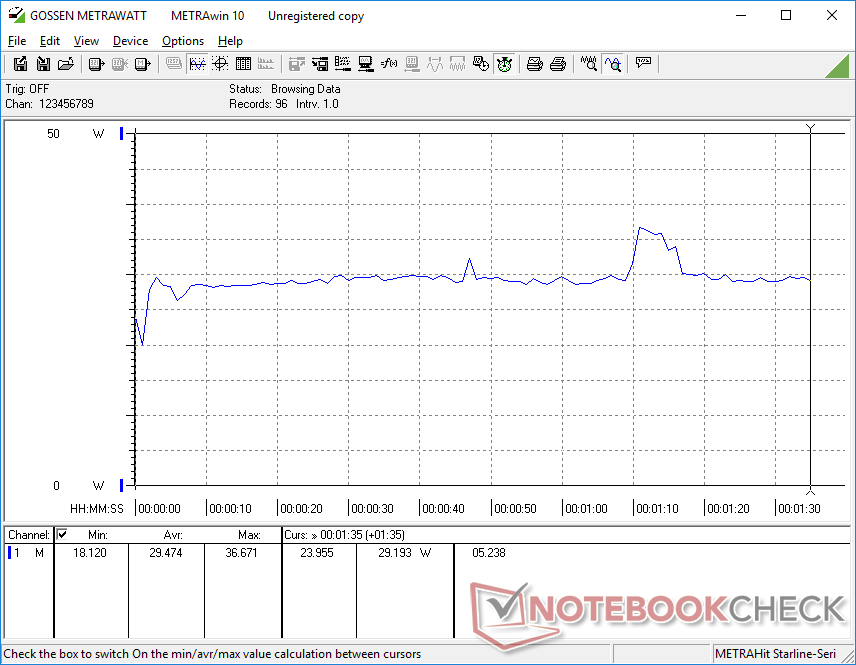
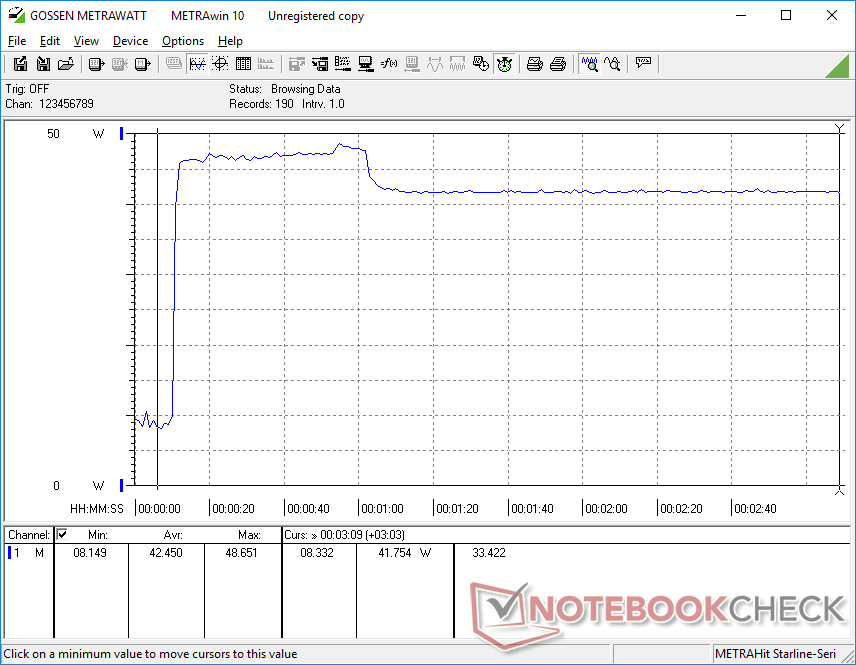
消耗功率
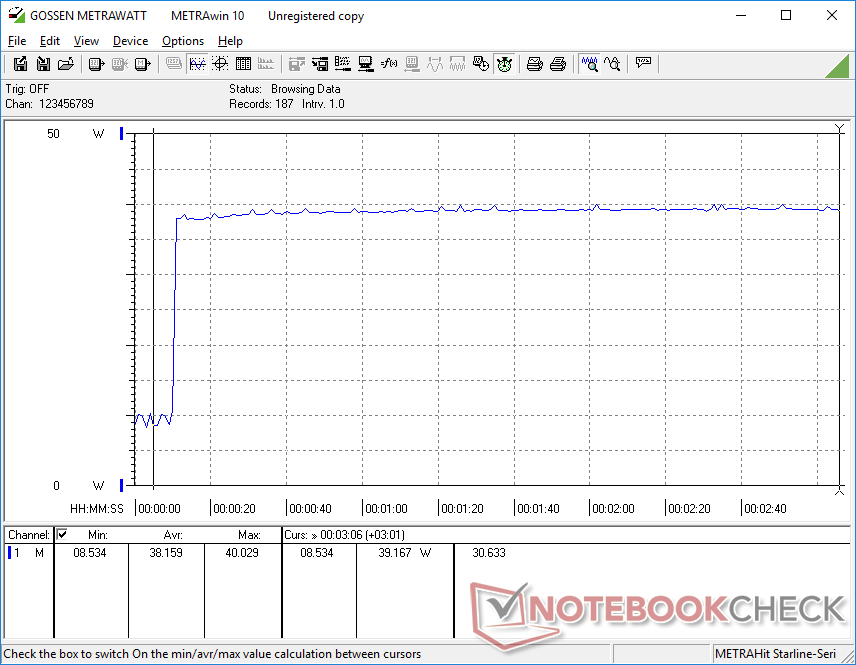
由于我们的SER3采用了要求更高的H系列处理器,因此在桌面上空转时的功耗比其他大多数运行在酷睿U系列CPU上的迷你PC略高。尽管如此,在运行更高的负载时,耗电量比预期的要低,平均只有30至40瓦。
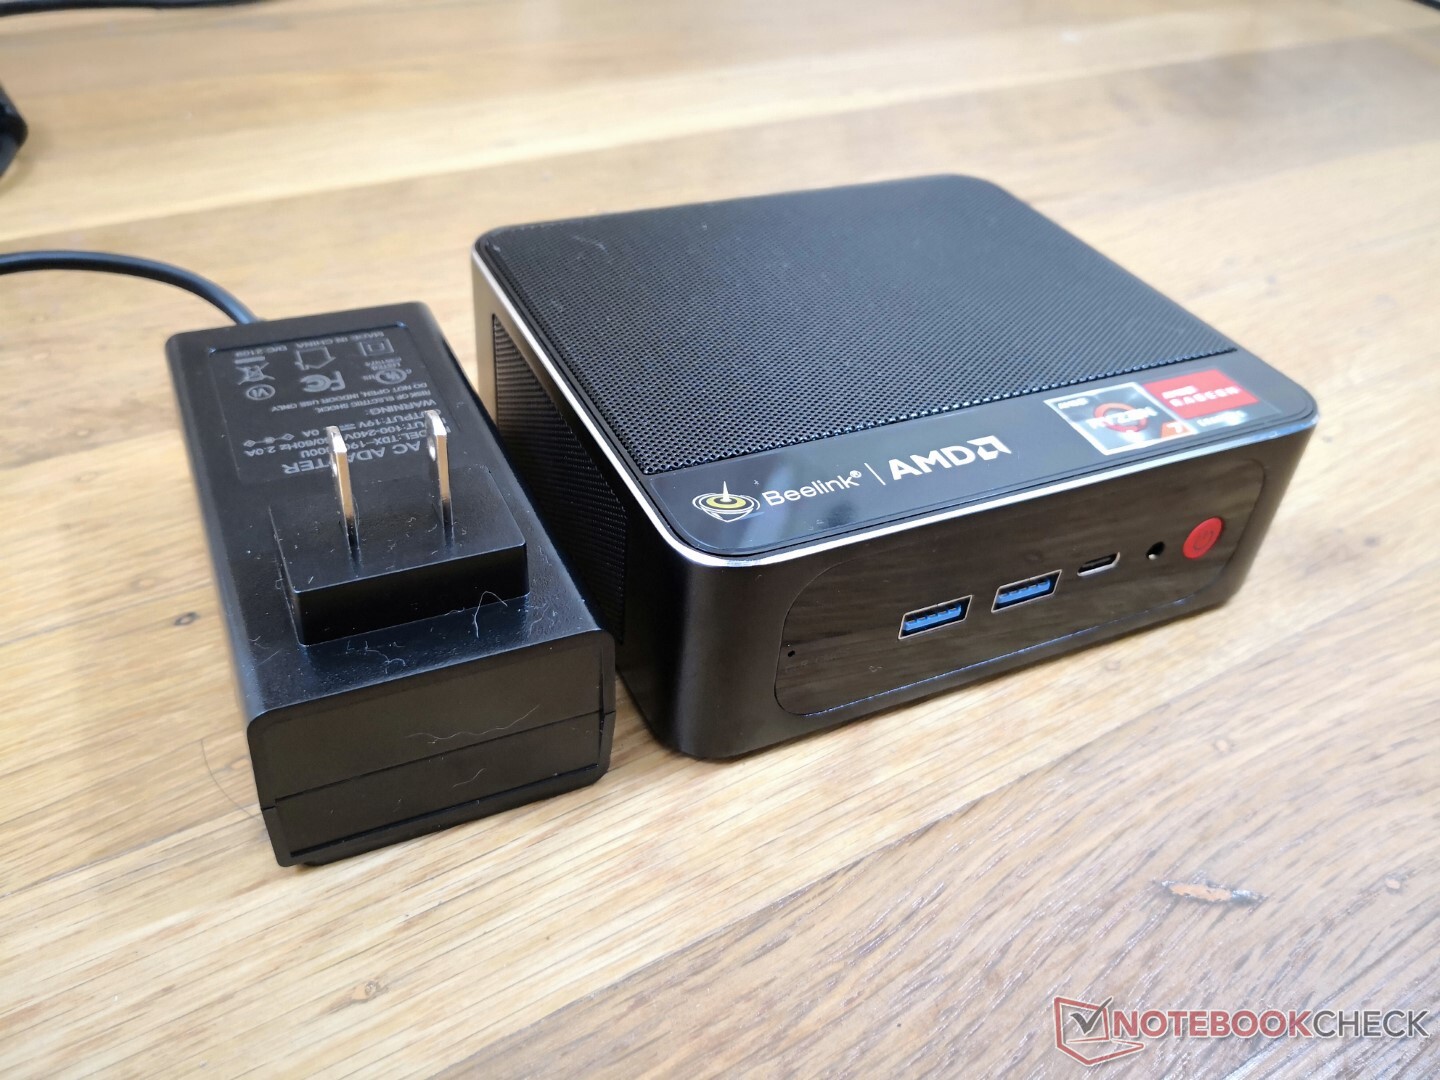
我们能够从中等大小(约10 x 5 x 6厘米,包括插头)的57瓦交流适配器中记录到最大的49瓦,当CPU利用率为100%时。由于散热限制,这一比率在大约一分钟后下降。
| Off / Standby | |
| Idle | |
| Load |
|
Key:
min: | |
| Beelink SER3 R7 3750H, Vega 10, GSemi AZW GSDFN512TS3F1OGCX, , x, | Beelink SEi10 i3-1005G1, UHD Graphics G1 (Ice Lake 32 EU), Silicon Motion AZW 256G M.2280 NVMe 4X 200725 D, , x, | Intel NUC8i7BE i7-8559U, Iris Plus Graphics 655, , , x, | GMK NucBox 2 i5-8259U, Iris Plus Graphics 655, Netac S930E8/256GPN, , x, | Zotac ZBox MI643 i5-10210U, UHD Graphics 620, Lexar NM610 1TB, , x, | Intel NUC11TNKi5 i5-1135G7, Iris Xe G7 80EUs, Transcend M.2 SSD 430S TS512GMTS430S, , x, | |
|---|---|---|---|---|---|---|
| Power Consumption | 17% | -8% | 0% | -10% | -43% | |
| Idle Minimum * (Watt) | 7 | 6.3 10% | 2.7 61% | 6.1 13% | 7.5 -7% | 11.5 -64% |
| Idle Average * (Watt) | 9.1 | 6.6 27% | 3.1 66% | 6.8 25% | 9.2 -1% | 12.4 -36% |
| Idle Maximum * (Watt) | 9.7 | 6.7 31% | 6.3 35% | 7.3 25% | 9.6 1% | 12.9 -33% |
| Load Average * (Watt) | 29.5 | 25.9 12% | 59.7 -102% | 46.3 -57% | 34.4 -17% | 40.7 -38% |
| Witcher 3 ultra * (Watt) | 32.5 | 47.2 -45% | 43.9 -35% | |||
| Load Maximum * (Watt) | 48.7 | 46.7 4% | 78 -60% | 50.7 -4% | 60.6 -24% | 73.5 -51% |
* ... smaller is better
Power Consumption Witcher 3 / Stresstest
Pros
Cons
判决书
用户以不到500美元的价格获得了一台HTPC就绪的迷你PC,其性能水平类似于 酷睿i5-8259U在一些英特尔NUC中的性能水平。该系统比其他运行Atom或Celeron CPU的廉价迷你PC高出几个档次,如 楚威云雀盒或 GBox 这些产品即使在运行要求不高的应用程序时也是出了名的慢。我们赞赏Beelink将SER3作为即用型电脑提供,并配有内存和存储器,而英特尔NUC几乎总是作为裸机SKU出售。
Beelink SER3是一个易于使用的谨慎的HTPC,具有可获得的升级选项。特别是在运行要求很高的应用程序时,要准备好一点风扇的噪音。
买家应该知道,SER3省略了一些辅助功能,可能是为了保持低价。没有Kensington锁、SD阅读器、红外接收器或Thunderbolt支持,而DP-over-USB-C可能不可靠。风扇频繁跳动,壁挂式交流电适配器既厚又短。附带的NVMe固态硬盘,虽然速度不错,但由于缺乏内置的散热片,在受压时性能会下降。
价格和可用性
Beelink SER3可以在亚马逊上找到https://www.amazon.com/Beelink-Versatile-Windows-Channel-Graphics/dp/B09JFGKNG9/?tag=nbcreviewsnet-20售价479美元,配备8GB内存和256GB固态硬盘,或559美元,配备双倍的内存和存储。
No, or more than one (0) Rating for the given SpecsID 326081 found

