Notebookcheck Logo

原子之心回顾。笔记本和台式机基准测试

真的很养眼。 原子之心》不仅在玩法上很时尚--从技术角度来看,它也是一款顶级的游戏。这款第一人称射击游戏绝对是过去几年中发布的最好看的PC游戏之一。你可以在我们的基准检查中了解到这在硬件要求方面意味着什么。
Gaming Laptop / Notebook Desktop Gamecheck
原子之心

技术方面

原子之心》并不是一个普通的射击游戏,这一点在游戏的前几分钟就变得很清楚。游戏有一种非常浓郁的气氛,这是由其对细节的极度关注以及其独特的风格--科幻和蒸汽朋克的混合--所推动的。游戏的粉丝们,如 亵渎》(Dishonored,死神生化奇兵系列的人在玩《原子之心》时将会得到真正的享受。

在高到最大的细节水平上,《原子之心》由于其锐利的纹理、伟大的反射和良好的执行效果,看起来令人惊叹。

原子之心
原子之心
原子之心
原子之心
原子之心
原子之心

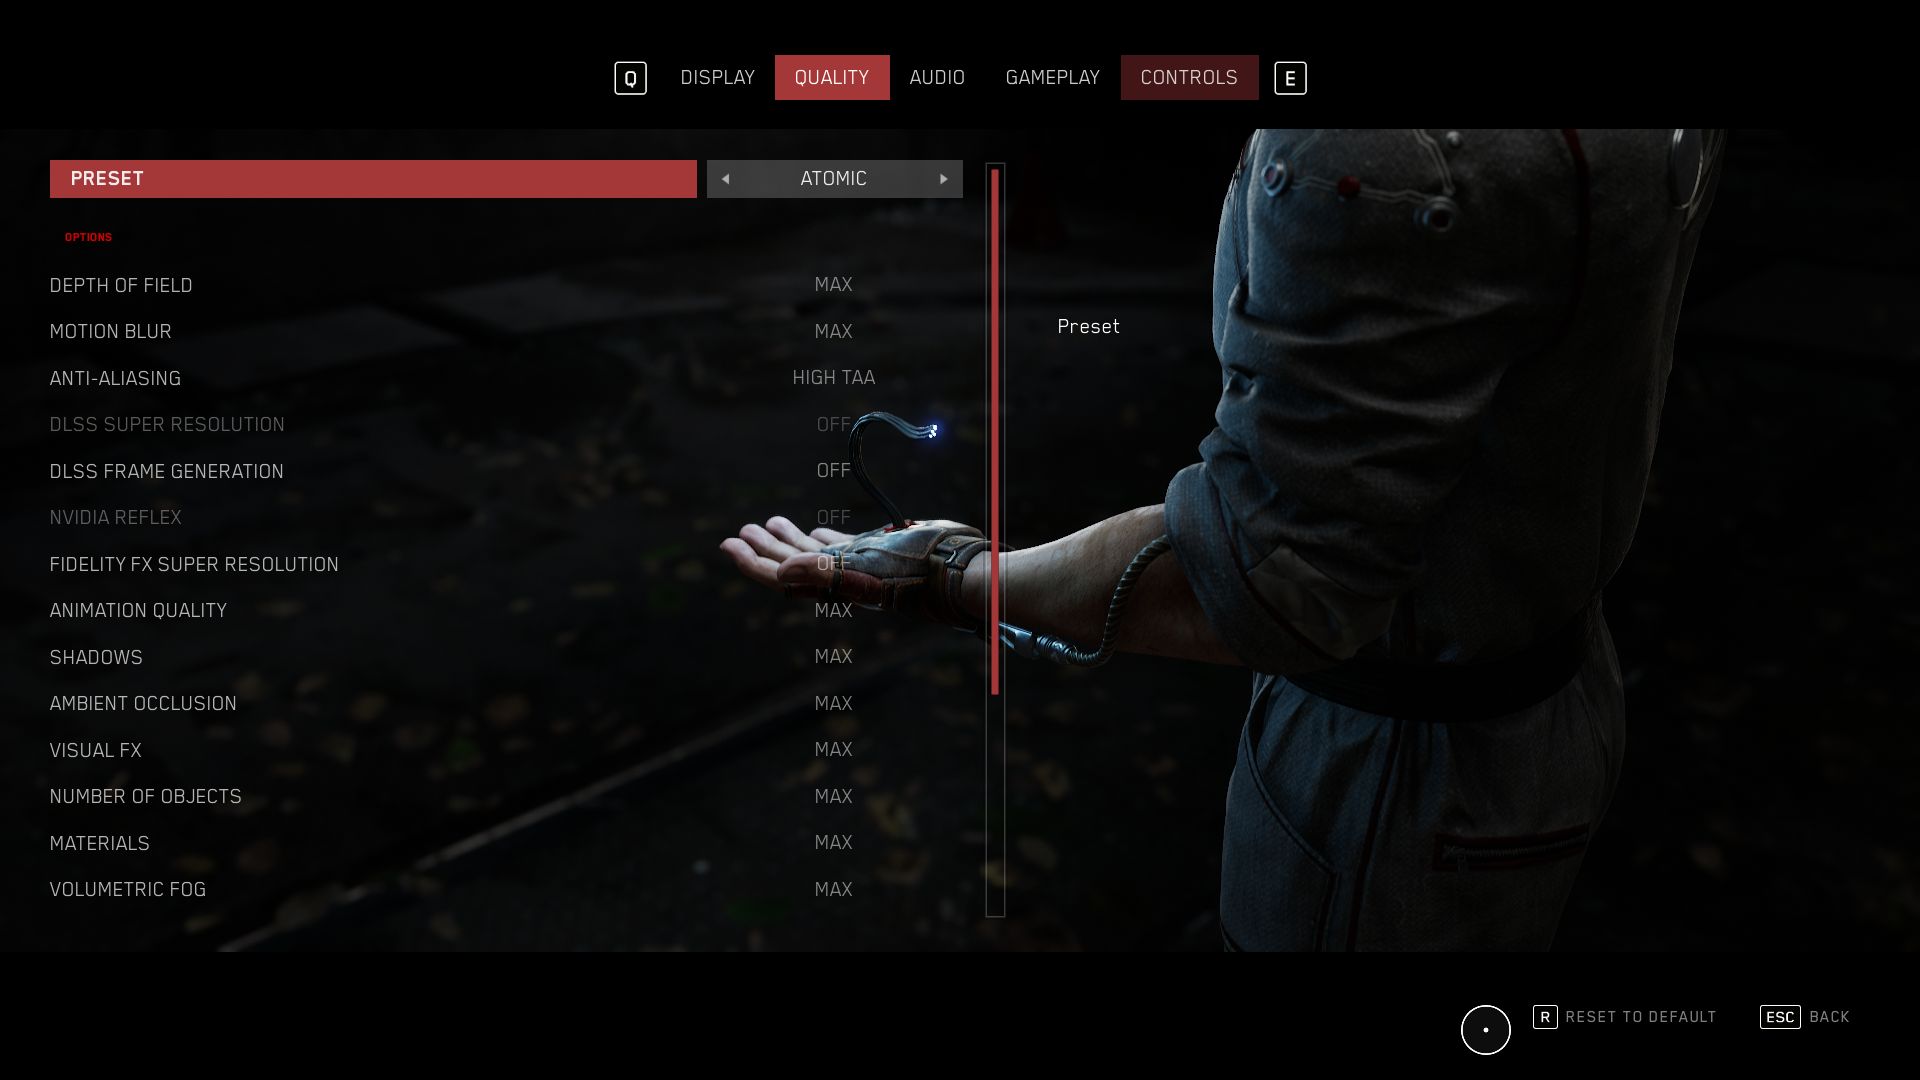
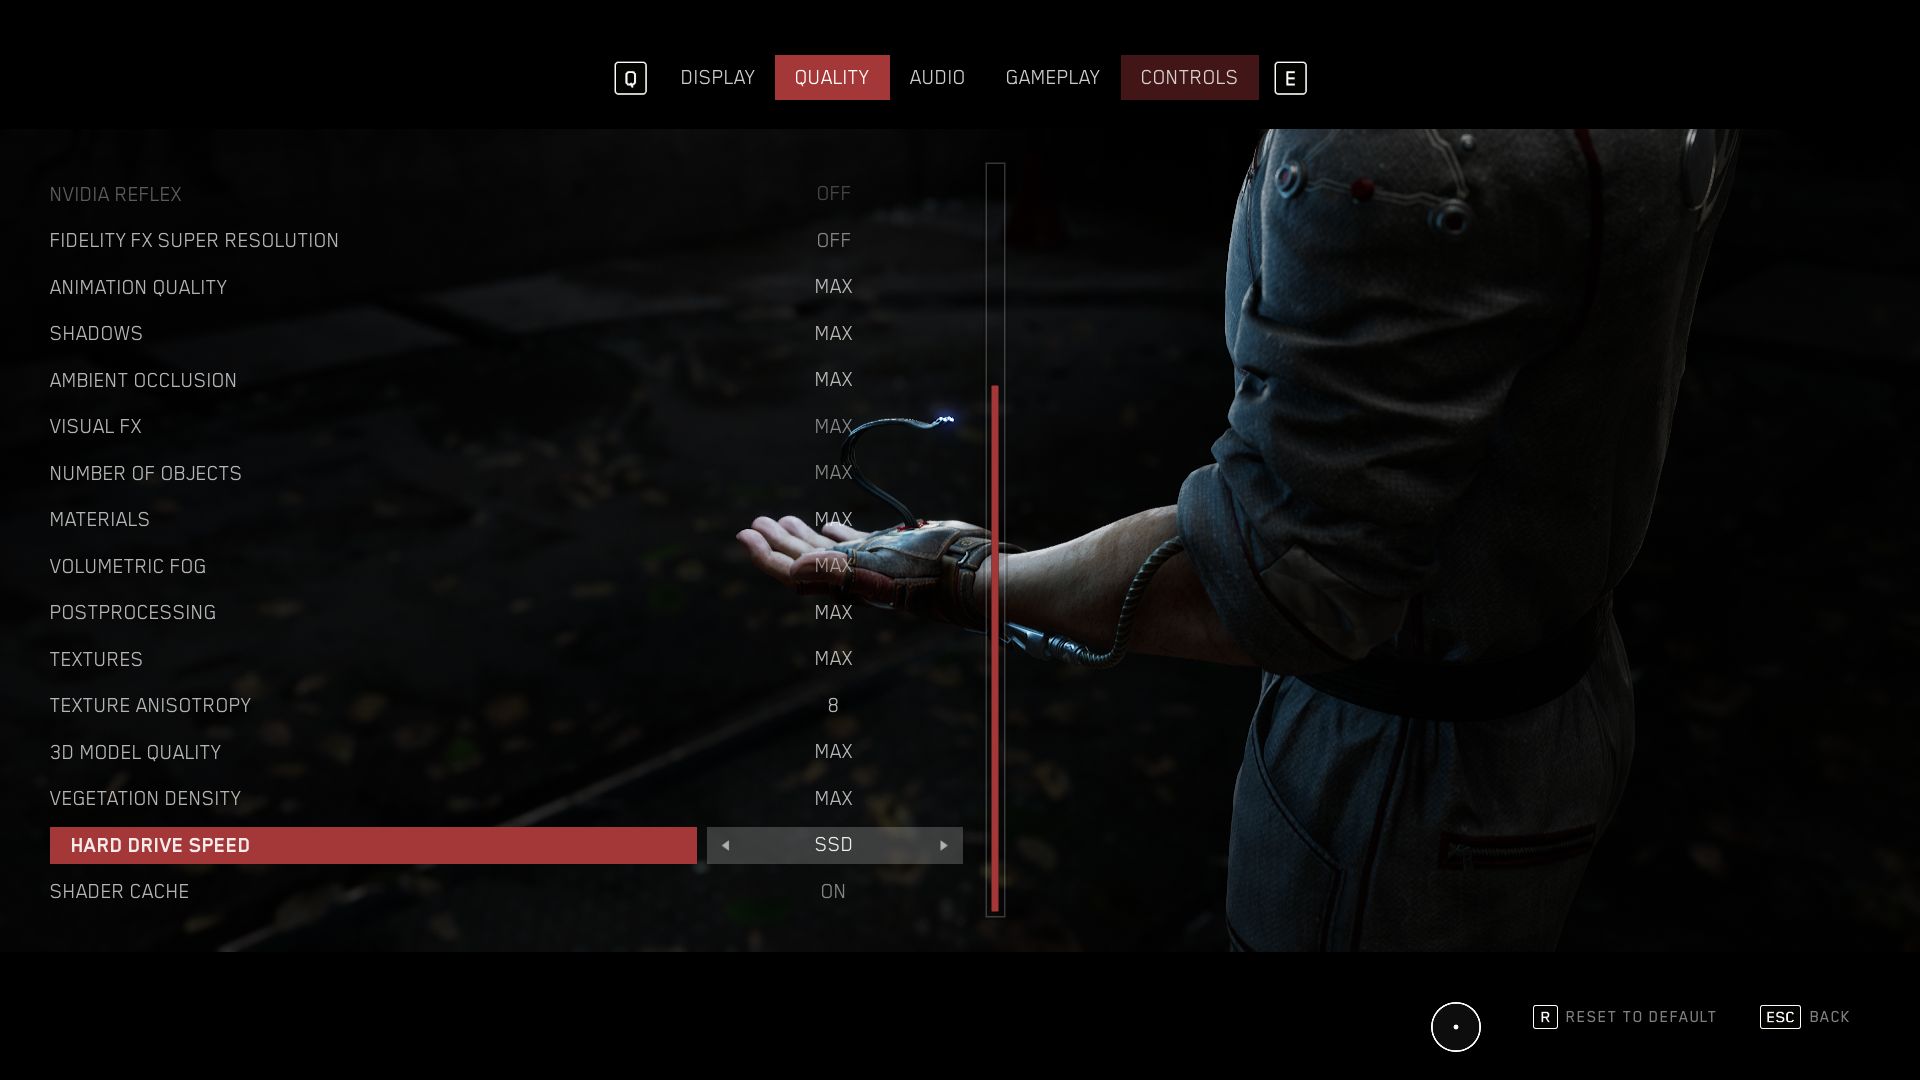
图形菜单给我们留下了一些混合的感觉。虽然显示菜单有点节俭,只有几个选项(分辨率、FPS限制、VSync等),但质量菜单真正抢了风头,不仅有多个预设(最大级别非常贴切地称为 "原子"),还有20多个细节设置,无需重新启动游戏即可应用。

尽管如此,《原子之心》可能需要花点时间来重新定位,因为设置的改变通常会提示游戏优化其着色器--这在启动游戏时总是会发生的(在《霍格沃茨遗产》中也可以看到)。 霍格沃茨遗产),这可能需要好几分钟的时间。

原子之心
原子之心
原子之心
原子之心
原子之心
原子之心

一般来说,游戏支持各种现代功能,如DLSS或Fidelity FX。最初宣布的光线追踪仍然缺失,然而,由于游戏的光学效果已经非常惊人,这一点可以被原谅(至少我们没有错过光线追踪)。但回到图形菜单上。各项设置只伴随着简短的描述。更加全面的解释和对比图片,可以在下面看到返回首页中可以看到的更全面的解释和对比图片,现在还找不到。

原子之心
原子之心
原子之心
原子之心
原子之心
原子之心

从技术角度看,我们发现《原子之心》出乎意料地成熟--除了在较低的细节水平上有一些图形问题(被移除的物体有抖动的倾向,路人的头发有时会奇怪地飘动)。在我们的测试中,我们没有遇到任何崩溃或性能滑坡的情况。说到性能。较低的帧率(即降低质量水平时)似乎并不真正影响游戏,这意味着你不一定需要一台原子电脑来运行《原子之心》。

原子之心
原子之心
原子之心

基准

游戏开始时的船行是测量速度的最佳选择,因为它对图形的要求相当高,而且它总是运行得完全一样。正如你在下面的视频中看到的,我们测量了大约1分钟的帧率(使用CapFrameX),直到一个飞行机器人给主角提供了一些柠檬水。

由于该游戏是一个快节奏的第一人称射击游戏--至少在后来--理想情况下,你会希望看到超过60 FPS的结果。我们的GPU推荐也相应地保留了。

结果


FHD (1,920 x 1,080)

虽然iGPU通常只能流畅地显示中等分辨率和细节(见 Radeon 680M& Iris Xe Graphics G7),中档GPU如 Radeon RX 6600M的速度足以在预设的 "高 "上以1,920 x 1,080像素运行《原子之心》。为了获得最大的细节,你最好在一个中端设备上运行游戏--例如,在一个 GeForce RTX 3060,你可以用全高清并使用预设 "原子 "运行它。

Atomic Heart
    1920x1080 Low Preset     1920x1080 Medium Preset     1920x1080 High Preset     1920x1080 Atomic Preset
AMD Radeon RX 7900 XTX, i9-12900K
Desktop-PC
338 (164.8min, 228P0.1, 276P1) fps ∼73%
273 (126.7min, 184.2P0.1, 216P1) fps ∼74%
188.2 (96.3min, 124.2P0.1, 160.3P1) fps ∼58%
155.6 (91.2min, 105.9P0.1, 129.3P1) fps ∼51%
AMD Radeon RX 7900 XT, i9-12900K
Desktop-PC
328 (26.2min, 209P0.1, 275P1) fps ∼71%
262 (94.5min, 182.2P0.1, 221P1) fps ∼71%
169.8 (85min, 105.2P0.1, 142.4P1) fps ∼52%
137.9 (48.8min, 87.9P0.1, 108.6P1) fps ∼45%
NVIDIA GeForce RTX 3080, i9-12900K
Desktop-PC
307 (161.6min, 210P0.1, 250P1) fps ∼66%
239 (135.8min, 163.4P0.1, 192.3P1) fps ∼64%
147.4 (92.8min, 115P0.1, 124.8P1) fps ∼45%
121.4 (86.9min, 97.7P0.1, 102.8P1) fps ∼40%
NVIDIA GeForce RTX 3070, i9-12900K
Desktop-PC
263 (95.3min, 185.8P0.1, 211P1) fps ∼57%
195.9 (113.3min, 145.6P0.1, 161.5P1) fps ∼53%
112.9 (69.7min, 92.3P0.1, 97.4P1) fps ∼35%
91.7 (69.3min, 73.4P0.1, 78.7P1) fps ∼30%
NVIDIA GeForce RTX 3080 Ti Laptop GPU, i9-12900HX
MSI Titan GT77 12UHS
221 (33.3min, 143.7P0.1, 171.7P1) fps ∼48%
169.2 (37.4min, 111.2P0.1, 132.8P1) fps ∼46%
99.8 (42.2min, 73P0.1, 84.3P1) fps ∼31%
84.1 (35.7min, 59.7P0.1, 71.8P1) fps ∼27%
AMD Radeon RX 6800M, R9 5900HX
Asus ROG Strix G15
153.8 (79.3min, 111.3P0.1, 125.9P1) fps ∼33%
121.4 (67.8min, 82.5P0.1, 96.1P1) fps ∼33%
84.6 (43.5min, 60.6P0.1, 73.6P1) fps ∼26%
68.6 (30.7min, 54.3P0.1, 60.2P1) fps ∼22%
NVIDIA GeForce RTX 3060 Laptop GPU, i7-12700H
Lenovo Legion 5 Pro
174.2 (67.2min, 111.4P0.1, 141.7P1) fps ∼37%
130.5 (79.6min, 103.2P0.1, 109.6P1) fps ∼35%
75.3 (30.3min, 61.3P0.1, 65.1P1) fps ∼23%
60.2 (27.5min, 49.8P0.1, 51.8P1) fps ∼20%
AMD Radeon RX 6600M, R7 5800H
Lenovo Legion 5
154.5 (24.9min, 109.1P0.1, 132.8P1) fps ∼33%
107.7 (64.9min, 85.1P0.1, 96.4P1) fps ∼29%
64 (37.4min, 48P0.1, 58P1) fps ∼20%
50.8 (32.7min, 44.9P0.1, 45.6P1) fps ∼17%
AMD Radeon 680M, R9 6900HS
Asus ROG Zephyrus G14
47.2 (20.2min, 25.5P0.1, 30.6P1) fps ∼10%
36.8 (20.7min, 21.1P0.1, 25.7P1) fps ∼10%
20.3 (10.7min, 11.8P0.1, 14.1P1) fps ∼6%
16.9 (10.2min, 11.7P0.1, 12.4P1) fps ∼6%
Intel Iris Xe Graphics G7 96EUs, i7-1165G7
Zotac ZBOX CI665 Nano
25.8 (15.8min, 16.5P0.1, 22.5P1) fps ∼6%
17.7 (10.6min, 10.7P0.1, 14.8P1) fps ∼5%
12.2 (6.99min, 8.96P0.1, 10.7P1) fps ∼4%
8.66 (5.55min, 6.16P0.1, 7.81P1) fps ∼3%

QHD (2,560 x 1,440)

要在QHD或UHD显示器上运行游戏,并具有高质量的图形,你很可能需要一个高端GPU。2,560 x 1,440像素需要一个 GeForce RTX 3080 Ti或更好。

Atomic Heart
    2560x1440 Atomic Preset
AMD Radeon RX 7900 XTX, i9-12900K
Desktop-PC
129.8 (81.3min, 94.7P0.1, 108.4P1) fps ∼49%
AMD Radeon RX 7900 XT, i9-12900K
Desktop-PC
112.9 (49.1min, 77.1P0.1, 87.3P1) fps ∼42%
NVIDIA GeForce RTX 3080, i9-12900K
Desktop-PC
95.7 (71.3min, 79.2P0.1, 83.3P1) fps ∼36%
NVIDIA GeForce RTX 3070, i9-12900K
Desktop-PC
71.6 (58.8min, 60.3P0.1, 62.5P1) fps ∼27%
NVIDIA GeForce RTX 3080 Ti Laptop GPU, i9-12900HX
MSI Titan GT77 12UHS
67.1 (19.7min, 53P0.1, 57.9P1) fps ∼25%
AMD Radeon RX 6800M, R9 5900HX
Asus ROG Strix G15
55.2 (29.1min, 46.6P0.1, 49P1) fps ∼21%
NVIDIA GeForce RTX 3060 Laptop GPU, i7-12700H
Lenovo Legion 5 Pro
47.7 (33.3min, 39.7P0.1, 41P1) fps ∼18%
AMD Radeon RX 6600M, R7 5800H
Lenovo Legion 5
38.4 (32.2min, 34.6P0.1, 35.2P1) fps ∼14%

UHD (3,840 x 2,160)

在4K,即3840 x 2160像素下,几乎所有笔记本芯片都达到了它们的极限。即使是之前提到的RTX 3080 Ti,在选择预设的 "原子 "时,也仅能达到40 FPS以上。桌面设备由于其更高的TDP而更适合。A GeForce RTX 3080能够达到60-FPS大关。

Atomic Heart
    3840x2160 Atomic Preset
AMD Radeon RX 7900 XTX, i9-12900K
Desktop-PC
86 (51.1min, 70.4P0.1, 74P1) fps ∼36%
AMD Radeon RX 7900 XT, i9-12900K
Desktop-PC
71.4 (48.4min, 58.9P0.1, 61.2P1) fps ∼30%
NVIDIA GeForce RTX 3080, i9-12900K
Desktop-PC
60 (47.3min, 51.6P0.1, 53.7P1) fps ∼25%
NVIDIA GeForce RTX 3070, i9-12900K
Desktop-PC
43.8 (37.5min, 38.2P0.1, 39.8P1) fps ∼18%
NVIDIA GeForce RTX 3080 Ti Laptop GPU, i9-12900HX
MSI Titan GT77 12UHS
42.6 (35.9min, 36.5P0.1, 37.8P1) fps ∼18%
AMD Radeon RX 6800M, R9 5900HX
Asus ROG Strix G15
34.2 (22min, 28.9P0.1, 30.2P1) fps ∼14%
NVIDIA GeForce RTX 3060 Laptop GPU, i7-12700H
Lenovo Legion 5 Pro
28.9 (23.2min, 23.7P0.1, 24.7P1) fps ∼12%
AMD Radeon RX 6600M, R7 5800H
Lenovo Legion 5
22.7 (20.8min, 20.8P0.1, 21.1P1) fps ∼9%

注意事项

由于游戏测试非常耗时,而且经常受到安装或激活限制的制约,因此在发表本文时,我们只能为您提供部分基准测试结果。我们将在未来几天和几周内增加更多的显卡。

Overview

Show Restrictions
PosModel< PrevNext >Atomic Heart
 Atomic Heart (2023)
low
1920x1080
Low Preset
med.
1920x1080
Medium Preset
high
1920x1080
High Preset
ultra
1920x1080
Atomic Preset
QHD
2560x1440
Atomic Preset
4K
3840x2160
Atomic Preset
NVIDIA GeForce RTX 4090
316n5
251n5
234n5
223n5
181.6n5
110.9n5
AMD Radeon RX 7900 XTX
359n2
290n2
199.1n2
162.85n2
134.05n2
87.7n2
NVIDIA GeForce RTX 4080 Super
300n2
279.5n2
216.5n2
177.3n2
138.2n2
82.35n2
NVIDIA GeForce RTX 4080
227
205
179.6
142.7
83.6
AMD Radeon RX 7900 XT
328
262
169.8
137.9
112.9
71.4
NVIDIA GeForce RTX 4070 Ti
316
253
180.1
148
112.3
63.4
AMD Radeon RX 7900 GRE
302.5n2
231.5n2
149.6n2
116.45n2
94.9n2
58.1n2
AMD Radeon RX 6950 XT
347
257
158.9
130.7
104.2
65.3
NVIDIA GeForce RTX 4090 Laptop GPU
211n2
174.45n2
166.6n3
138.5n3
107.8n3
62.7
NVIDIA GeForce RTX 3090
325
262
156.3
129.3
101.7
63.3
AMD Radeon RX 7800 XT
317
236
141.1
109.8
87.9
53.6
NVIDIA GeForce RTX 4080 Laptop GPU
170.8
142.3
121.1
100.3
79.2
NVIDIA GeForce RTX 3080 12 GB
248
145.2
142.6
111.4
69.1
NVIDIA GeForce RTX 3080
307
239
147.4
121.4
95.7
60
NVIDIA GeForce RTX 4070
320
250
148.3
144.8
109.4
62.4
AMD Radeon RX 6800
262
197.7
120
96.3
77.5
47.7
AMD Radeon RX 7700 XT
265
199.4
118.8
93.6
73.9
43.8
NVIDIA Titan RTX
264
197.6
117.7
96.9
74.9
45
NVIDIA GeForce RTX 4060 Ti 16G
259
197.9
117.3
92.3
68
38.3
PosModel< PrevNext >Atomic Heart
low med. high ultra QHD 4K
NVIDIA GeForce RTX 4060 Ti 8G
264n3
202n3
117.3n3
92.5n3
68.8n3
38.4n3
NVIDIA GeForce RTX 3080 Ti Laptop GPU
221
169.2
99.8
84.1
67.1
42.6
NVIDIA GeForce RTX 4070 Laptop GPU
188.2n2
139.95n4
95.05n4
76.1n4
58.6n3
NVIDIA GeForce RTX 3070
263
195.9
112.9
91.7
71.6
43.8
AMD Radeon RX 6750 XT
245
175.9
104.1
82.7
64.8
38
AMD Radeon RX 6700 XT
232
169.4
101.2
79.4
61.9
36.3
NVIDIA GeForce RTX 3080 Laptop GPU
174.7
138.5
84.8
70.15n2
54.3n2
33.25n2
NVIDIA GeForce RTX 3060 Ti
236
179.7
103.1
82.4
63.6
38.4
Intel Arc A770
179.1
131.9
99.3
72.2
58.3
34.1
NVIDIA GeForce RTX 4060
213
159.3
93.5
70.9
53.1
30.1
AMD Radeon RX 7600
213
158.3
92.6
70.7
52
30.5
NVIDIA GeForce RTX 3070 Ti Laptop GPU
157.9
94.5
76.3
60.2
37
NVIDIA GeForce RTX 4060 Laptop GPU
150.6n2
122.1n3
81.6n3
64.9n3
50.7
AMD Radeon RX 6800M
153.8
121.4
84.6
68.6
55.2
34.2
AMD Radeon RX 6650 XT
212
152.9
89.4
69.5
51.4
29.3
NVIDIA GeForce RTX 3070 Laptop GPU
186.7
143.9
88.5
63.7n2
49.1n2
29.85n2
AMD Radeon RX 7600M XT
173.1
130.9
79.9
60.9
46.4
27.6
Intel Arc A750
163.6
122.6
89.3
64.6
51.8
30.5
NVIDIA Titan X Pascal
172.5
126.6
78.4
62.2
48.4
28.6
NVIDIA GeForce RTX 2070 Super (Desktop)
195.4
147.3
85.8
68.3
52
30.4
PosModel< PrevNext >Atomic Heart
low med. high ultra QHD 4K
AMD Radeon RX 5700 XT (Desktop)
174.6
133.2
78
61.7
47.2
27.7
NVIDIA GeForce RTX 3060 Laptop GPU
174.2
130.5
75.3
60.2
47.7
28.9
AMD Radeon RX 7600S
167.1
125.5
71.6
56.6
Intel Arc A580
148.8
110.1
79.2
56.7
45.1
27.1
NVIDIA GeForce RTX 2060 Super (Desktop)
168.3
124.3
72.7
58.1
43.6
25.6
AMD Radeon RX 6600
168.5
120.4
69.5
53.8
39.7
22.8
AMD Radeon RX 5700 (Desktop)
159
120.8
69.8
55.3
41.8
24.7
AMD Radeon RX 6600M
163.5n3
114.4n3
67.1n3
50.8n3
38.4n3
22.7n3
NVIDIA GeForce RTX 3050
127.3
98.6
56.9
44.7
33.9
19.6
AMD Radeon RX 5600 XT (Desktop)
146.5
114.6
66.3
53.4
40.2
23.5
NVIDIA GeForce GTX 1660 Super (Desktop)
124.2
90.7
52
41.5
30.7
17
AMD Radeon RX 6500 XT
110.9
84.2
47.9
37.4
27.2
13.8
AMD Radeon RX 5500 XT (Desktop)
97.5
75.4
43.4
34.7
26.2
15.1
NVIDIA GeForce RTX 4050 Laptop GPU
132.45n2
124n3
72n3
57.1n3
43.4n3
24.6
Intel Arc A730M
69n2
51.9n2
40.35n2
33.4n2
27.8
NVIDIA GeForce GTX 1660 Ti Mobile
109
81.4
49.6
38
NVIDIA GeForce RTX 3050 Ti Laptop GPU
94.3
71.4
41.6
32.3
24.5
NVIDIA GeForce GTX 1660 (Desktop)
111.4
83.4
48.5
38.4
28.1
14.8
NVIDIA GeForce GTX 1650 Super (Desktop)
98.9
73.4
42.4
33.2
24
10.1
NVIDIA GeForce RTX 3050 4GB Laptop GPU
71.4
54.3
31.6
24.5
PosModel< PrevNext >Atomic Heart
low med. high ultra QHD 4K
NVIDIA GeForce GTX 1060 Mobile
72.9
51.3
31.9
25.8
NVIDIA GeForce GTX 1650 Ti Mobile
76.4
56.3
34
25.7
Intel Arc A370M
55.5
42.4
24
20.2
AMD Radeon RX 5500M
75.1
56.7
35.9
28.3
NVIDIA GeForce RTX 2050 Mobile
48.7
29.5
29.1
NVIDIA GeForce GTX 1650 Mobile
68.7
50.5
30.3
23
Intel Arc A380
64.8
48.3
32.3
22.6
Intel Arc A310
54.2
40.3
27.4
18.8
Intel Arc 8-Cores iGPU
61
44.1
30.9
22.2
Intel Arc 7-Cores iGPU
40.7
31.9
22.8
16.4
AMD Radeon 780M
40.4
32.6
19.1
15.6
AMD Radeon 680M
47.2
36.8
20.3
16.9
NVIDIA GeForce GTX 1050 Mobile
45.3
32.9
20.2
15.3
AMD Radeon 760M
38.6
28.8
16.7
AMD Radeon 660M
29
22.9
13
10.2
AMD Radeon RX 560X (Laptop)
40.8
29.8
17.6
13.6
Intel Iris Xe Graphics G7 96EUs
25.8
17.7
12.2
8.66
NVIDIA GeForce MX350
30.9
23.9
6.89
AMD Radeon RX 550 (Laptop)
18.4
10.2
6.87
NVIDIA GeForce MX250
26.6
19.5
7.41
PosModel< PrevNext >Atomic Heart
low med. high ultra QHD 4K
Intel Iris Xe Graphics G7 80EUs
22.6
16.4
11.7
8.42
AMD Radeon 540X
13.3
9.62
Intel UHD Graphics 64EUs (Alder Lake 12th Gen)
24.4
17.5
12.5
Intel Iris Plus Graphics G7 (Ice Lake 64 EU)
15.2
11.6
AMD Radeon RX Vega 10
19.4
15.1
8.82
Intel UHD Graphics Xe 32EUs (Tiger Lake-H)
14.9
Intel UHD Graphics 770
15.2
10.9
AMD Radeon RX Vega 8 (Ryzen 4000/5000)
24.3
18.9
11.2
NVIDIA GeForce MX130
12.1
7.62
AMD Radeon RX Vega 8 (Ryzen 2000/3000)
13.9
10.3
AMD Radeon RX Vega 6 (Ryzen 4000/5000)
19
15
8.79
AMD Radeon RX Vega 6 (Ryzen 2000/3000)
9.63
AMD Radeon RX Vega 5
14.1
11.1
6.7
Intel UHD Graphics G1 (Ice Lake 32 EU)
7.56
Intel UHD Graphics 630
7.98
Intel UHD Graphics Xe 16EUs (Tiger Lake-H)
6.75
Intel UHD Graphics 620
7.74
AMD Radeon R5 M255
8.5
(-) * Smaller values are better. / n123 Number of benchmarks for this median value / * Approximate position


Legend
5Stutters – This game is very likely to stutter and have poor frame rates. Based on all known benchmarks using the specified graphical settings, average frame rates are expected to fall below 25fps
May Stutter – This graphics card has not been explicitly tested on this game. Based on interpolated information from surrounding graphics cards of similar performance levels, stutters and poor frame rates are expected.
30Fluent – Based on all known benchmarks using the specified graphical settings, this game should run at or above 25fps
40Fluent – Based on all known benchmarks using the specified graphical settings, this game should run at or above 35fps
60Fluent – Based on all known benchmarks using the specified graphical settings, this game should run at or above 58fps
May Run Fluently – This graphics card has not been explicitly tested on this game. Based on interpolated information from surrounding graphics cards of similar performance levels, fluent frame rates are expected.
?Uncertain – This graphics card experienced unexpected performance issues during testing for this game. A slower card may be able to achieve better and more consistent frame rates than this particular GPU running the same benchmark scene.
Uncertain – This graphics card has not been explicitly tested on this game and no reliable interpolation can be made based on the performances of surrounding cards of the same class or family.
The value in the fields displays the average frame rate of all values in the database. Move your cursor over the value to see individual results.

Test systems

设备 显卡 处理器 内存 操作系统
笔记本
微星Titan GT77 12UHS NvidiaGeForce RTX 3080 Ti @175 W TGP (16 GB GDDR6) Intel Core i9-12900 2 x 16 GB DDR5 Windows 11
联想Legion 5 Pro NvidiaGeForce RTX 3060 @140 W TGP (6 GB GDDR6) Intel Core i7-12700H 2 x 8 GB DDR5 Windows 11
华硕ROG Strix G15 AMD Radeon RX 6800M(12 GB GDDR6) AMD Ryzen 9 5900HX 2 x 8 GB DDR4 Windows 11
联想Legion 5 AMD Radeon RX 6600M(8 GB GDDR6) AMD Ryzen 7 5800H 2 x 8 GB DDR4 Windows 11
华硕ROG Zephyrus G14 AMD Radeon 680M AMD Ryzen 9 6900HS 2 x 16 GB DDR5 Windows 11
塔式电脑
定制 I AMD Radeon RX 7900 XTX (24 GB GDDR6)
AMD Radeon RX 7900 XT (20 GB GDDR6)
MSIGeForce RTX 3080 (10 GB GDDR6X)
MSIGeForce RTX 3070 (8 GB GDDR6)
Intel Core i9-12900K 2 x 16 GB DDR4 Windows11
Custom II PalitGeForce RTX 4090 GameRock OC (24 GB GDDR6X)
Nvidia GeForce RTX 3090 FE (24 GB GDDR6X)
Nvidia GeForce RTX 3060 Ti (8 GB GDDR6X)
NvidiaTitan RTX (24 GB GDDR6)
lNvidia GeForce RTX2070 Super (8 GB GDDR6)
Nvidia GeForce RTX 2060 Super (8 GB GDDR6)
KFA2 GeForce GTX 1660 Super (6 GB GDDR6)
PNY GeForce GTX 1660 (6 GB GDDR5)
KFA2 GeForce GTX 1650 Super (4 GB GDDR6)
AMD Radeon RX6950 XT (16 GB DDR6)
AMD Radeon RX 6800 (16 GB DDR6)
AMD Radeon RX 6700 XT (12 GB DDR6)
AMD Radeon RX 6650 XT (8 GB GDDR6)
AMD Radeon RX 6600 (8 GB GDDR6)
AMD RadeonRX 5700 XT (8 GB GDDR6)
AMD Radeon RX 5700 (8 GB GDDR6)
AMD Radeon RX 5600 XT (6 GB GDDR6)
AMD Radeon RX 5500 XT (8 GB GDDR6)
AMD Ryzen 9 7950X 2 x 16 GB DDR5 Windows 11
Custom III NvidiaGeForce RTX 2080 Super FE Intel Core i9-11900K 2 x 8 GB DDR4 Windows 11
迷你电脑
Zotac ZBOX CI665 Nano Intel Iris Xe Graphics G7 (96 CUs) Intel Core i7-1165G7 2 x 8 GB DDR4 Windows 11
Morefine S500+ AMD Radeon RX Vega 8 AMD Ryzen 9 5900HX 2 x 16 GB DDR4 Windows 11
Minisforum NUCXi7 NvidiaGeForce RTX 3070 @125 W TGP (8 GB GDDR6) Intel Core i7-11800H 2 x 8 GB DDR4 Windows 11
Minisforum HX99G AMD Radeon RX 6600M @100 W TGP (8 GB GDDR6) AMD Ryzen 9 6900HX 2 x 16 GB DDR5 Windows 11
4K显示器 Nvidia驱动 AMD驱动
Philips Brilliance 329P9H, Gigabyte M32U ForceWare 531.18 Adrenalin 23.3.1
Please share our article, every link counts!
> Notebookcheck中文版(NBC中国) > 评测 > 原子之心回顾。笔记本和台式机基准测试
Florian Glaser, 2023-03-13 (Update: 2023-03-13)