英雄连3》评测。笔记本电脑和台式机基准测试

技术方面
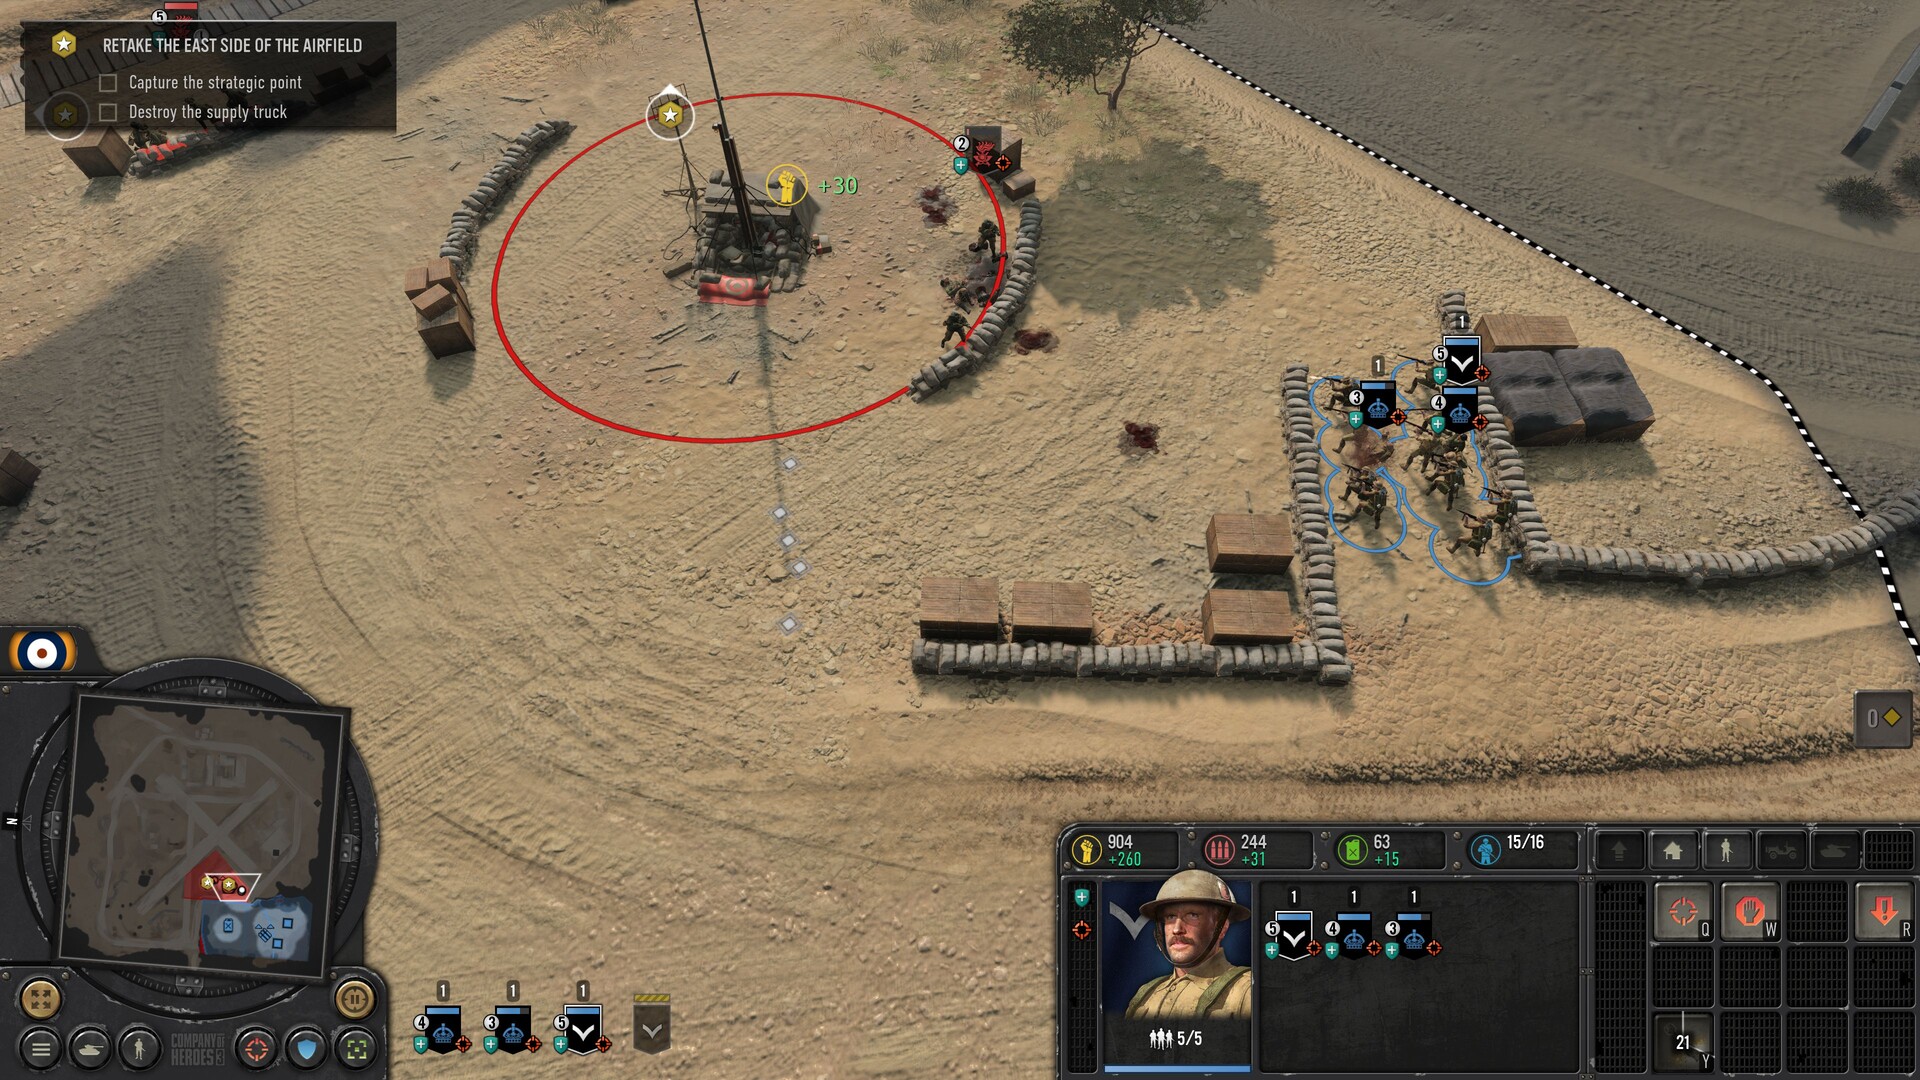
让我们先把话说清楚:我们并不完全理解为什么《英雄连3》从媒体那里得到了如此全面的好评。首先,现在的控制仍然有些笨拙(你也只能放大一点);其次,游戏的画面看起来相当过时、沉闷和荒芜。


从技术角度来看,游戏与近10年的前作相比没有什么变化(物体有时有棱有角,纹理看起来相当平淡,等等)。唯一需要强调的积极因素是详细的破坏物理学。例如,在被重型弹丸击中后,房屋在变成废墟前会开始失去个别部分。这在视觉上是相当令人印象深刻的。尽管如此,我们会将画面描述为刚刚好,这无疑是令人失望的,但对于一个重战术的战略游戏来说,还是相当可以接受的。


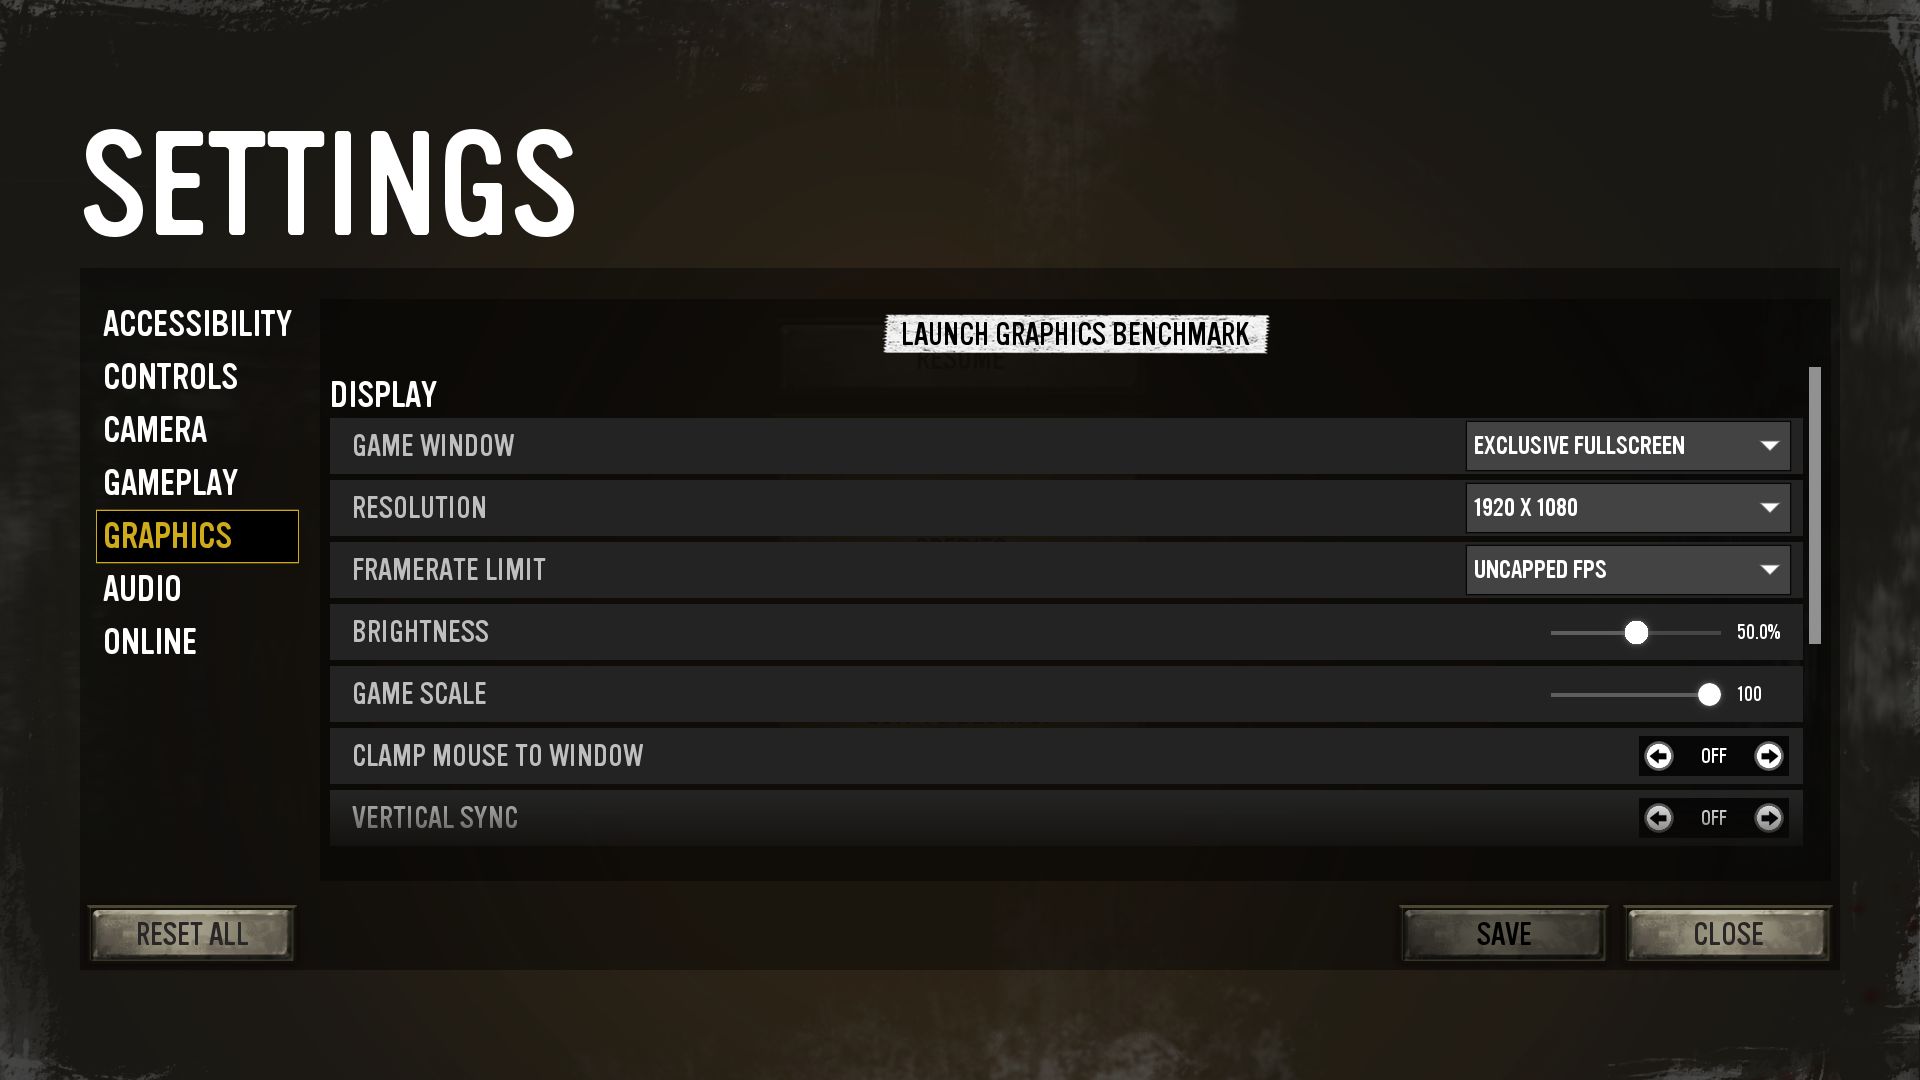
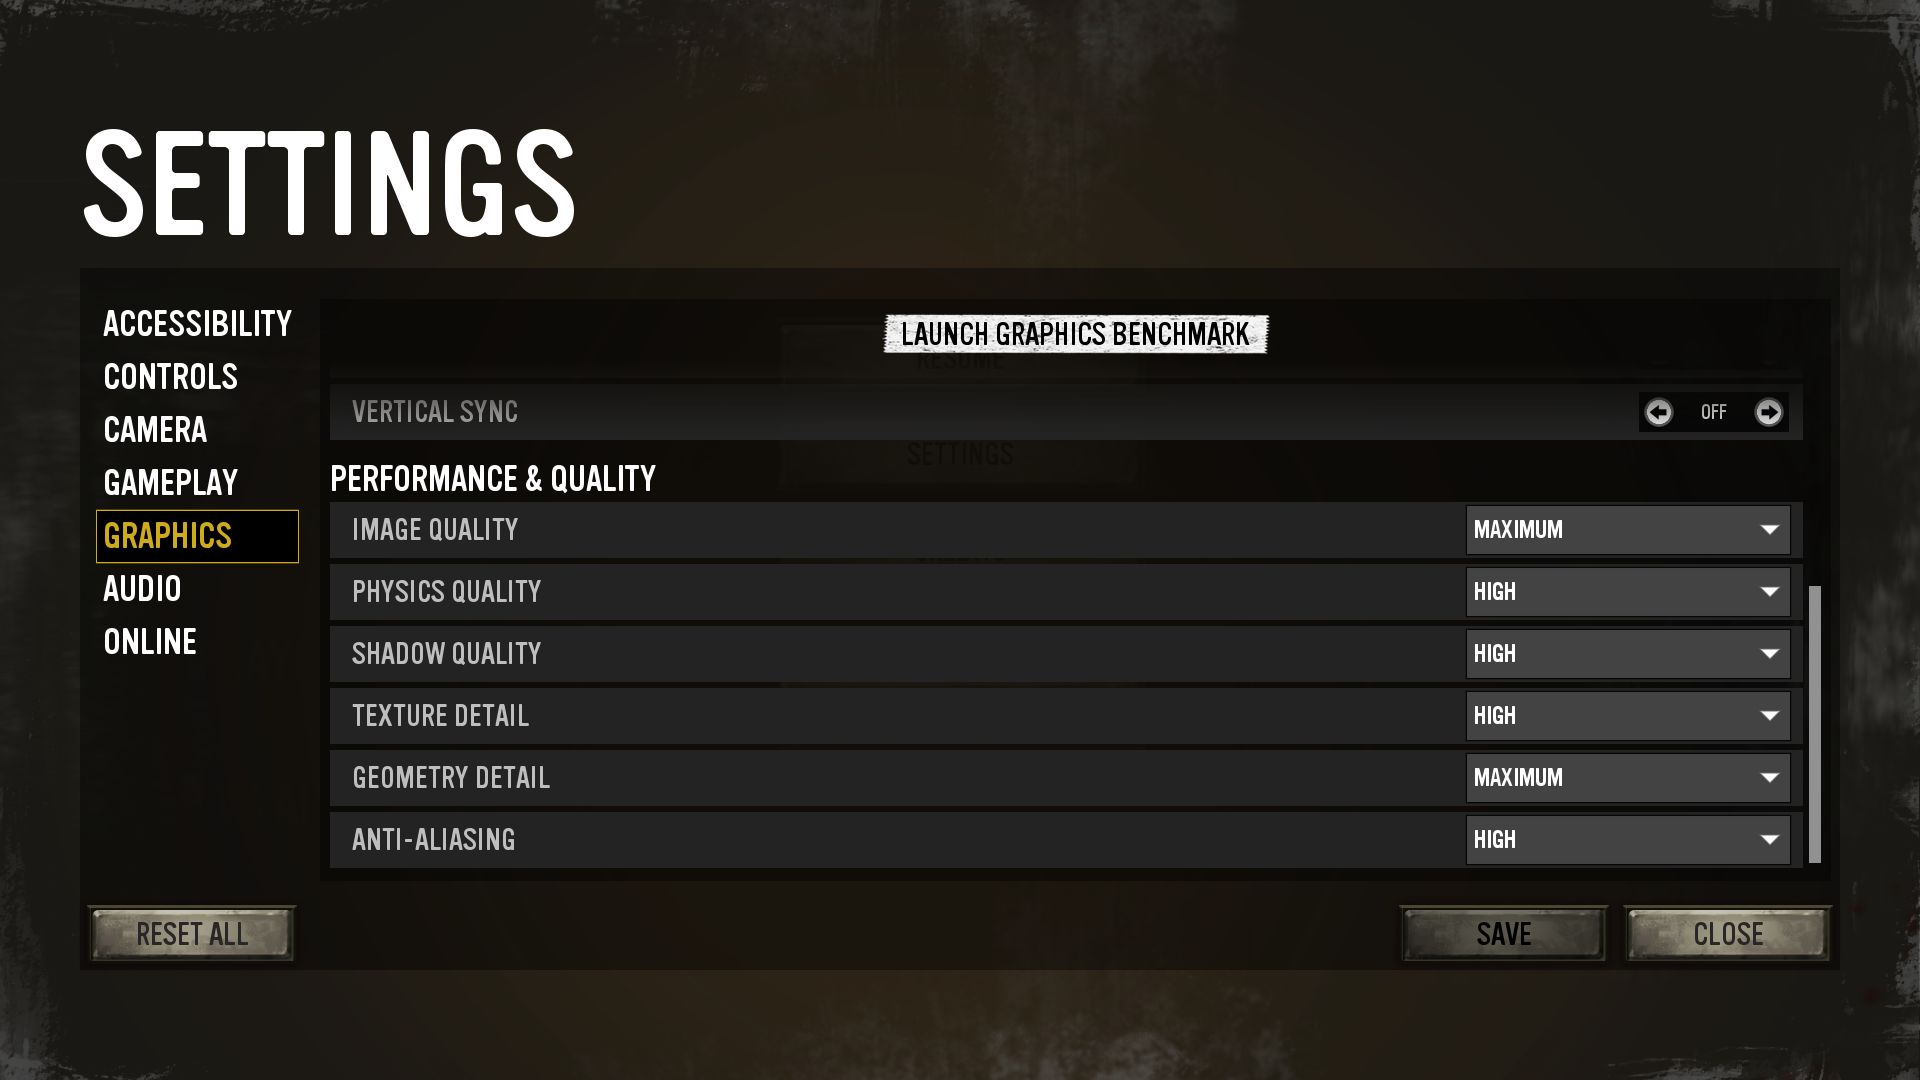
图形菜单同样也是相对温和的。上面的部分让你改变显示模式、分辨率、帧数限制、亮度、缩放和VSync,而下面的部分只提供六个性能和质量选项。我们对缺乏预设并不太在意,因为只有少数几个选项可用。


一个令人讨厌的事情是,一些变化需要你重新启动游戏,但至少可以跳过介绍视频。同样令人遗憾的是,游戏会根据你系统中的(V)RAM数量,自动阻止你选择超过某个纹理细节水平的东西。
基准
我们喜欢《英雄连3》中的综合基准测试。虽然基准中使用的序列相当长,有1.5分钟,但人工智能比赛的特点是各种步兵单位和车辆之间的小规模冲突(确切的序列从测试运行到测试运行都会改变),并且很好地代表了真实的比赛。
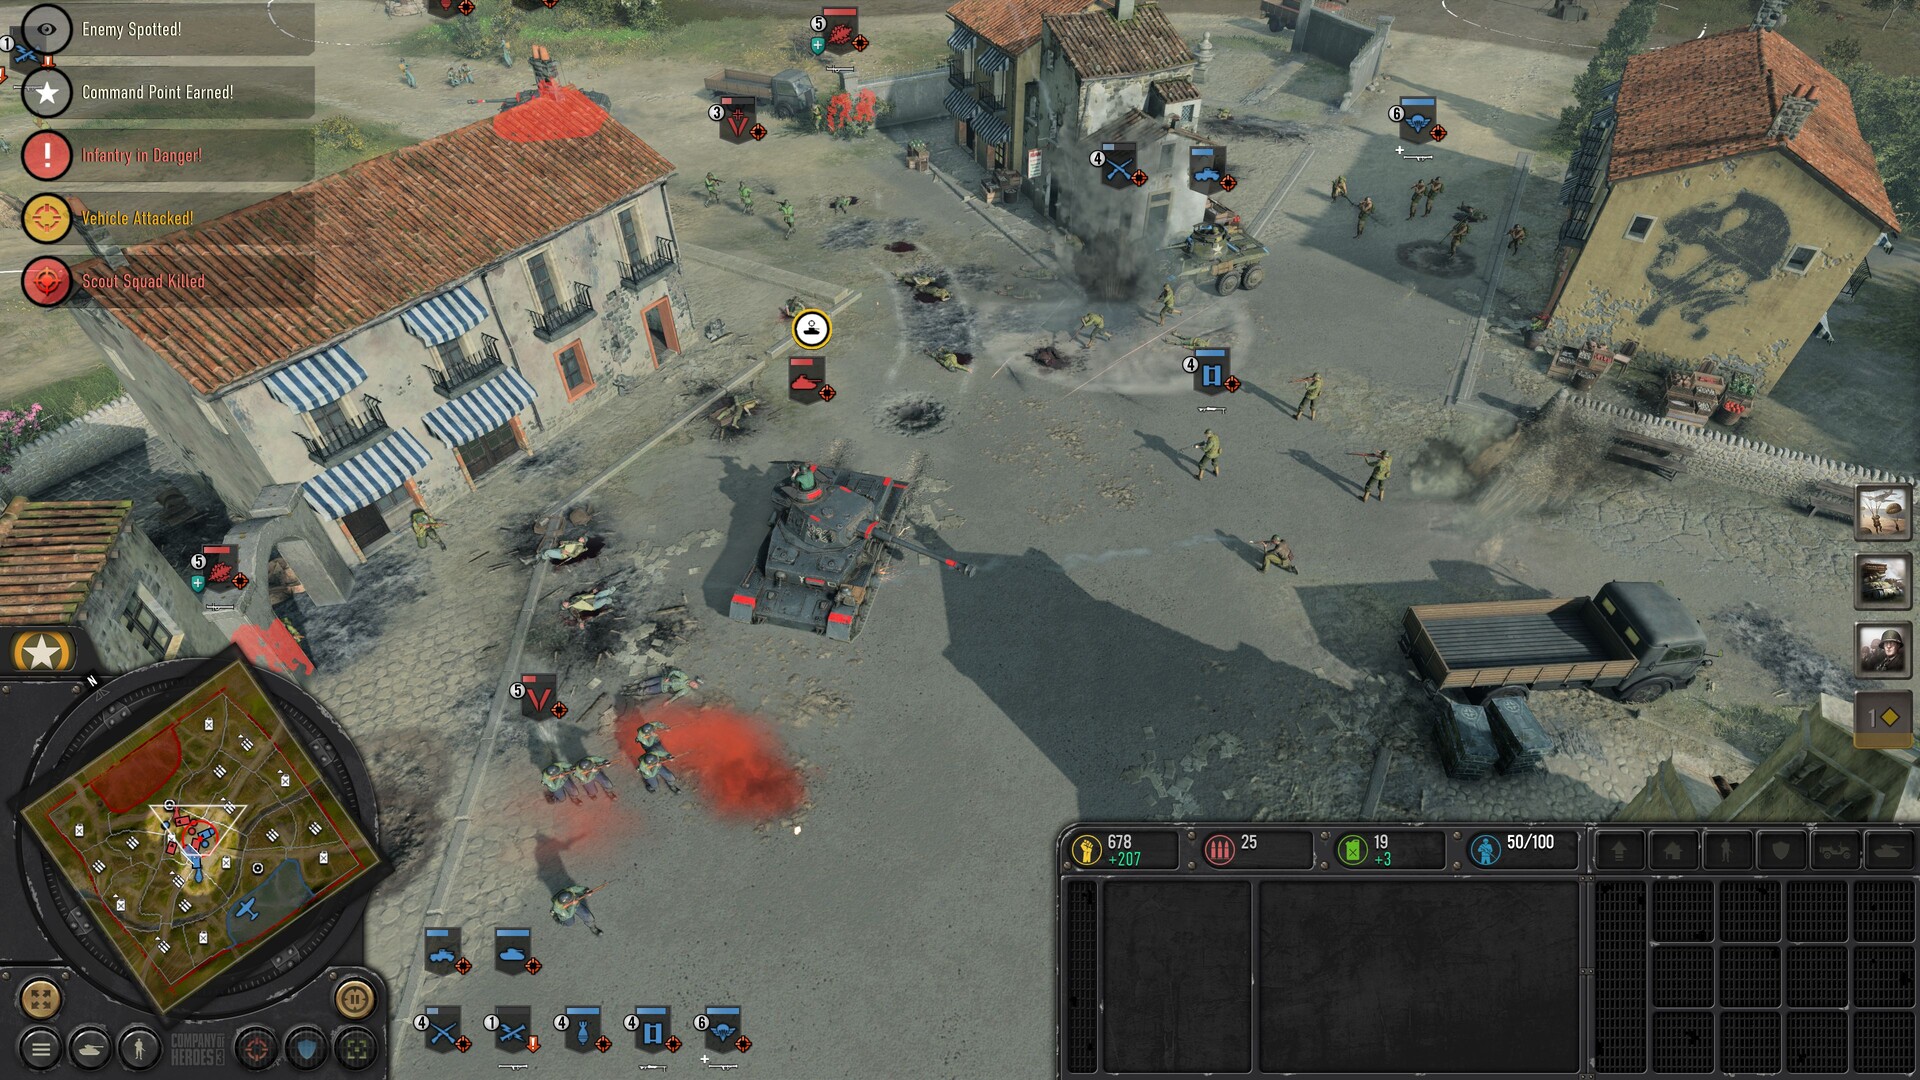
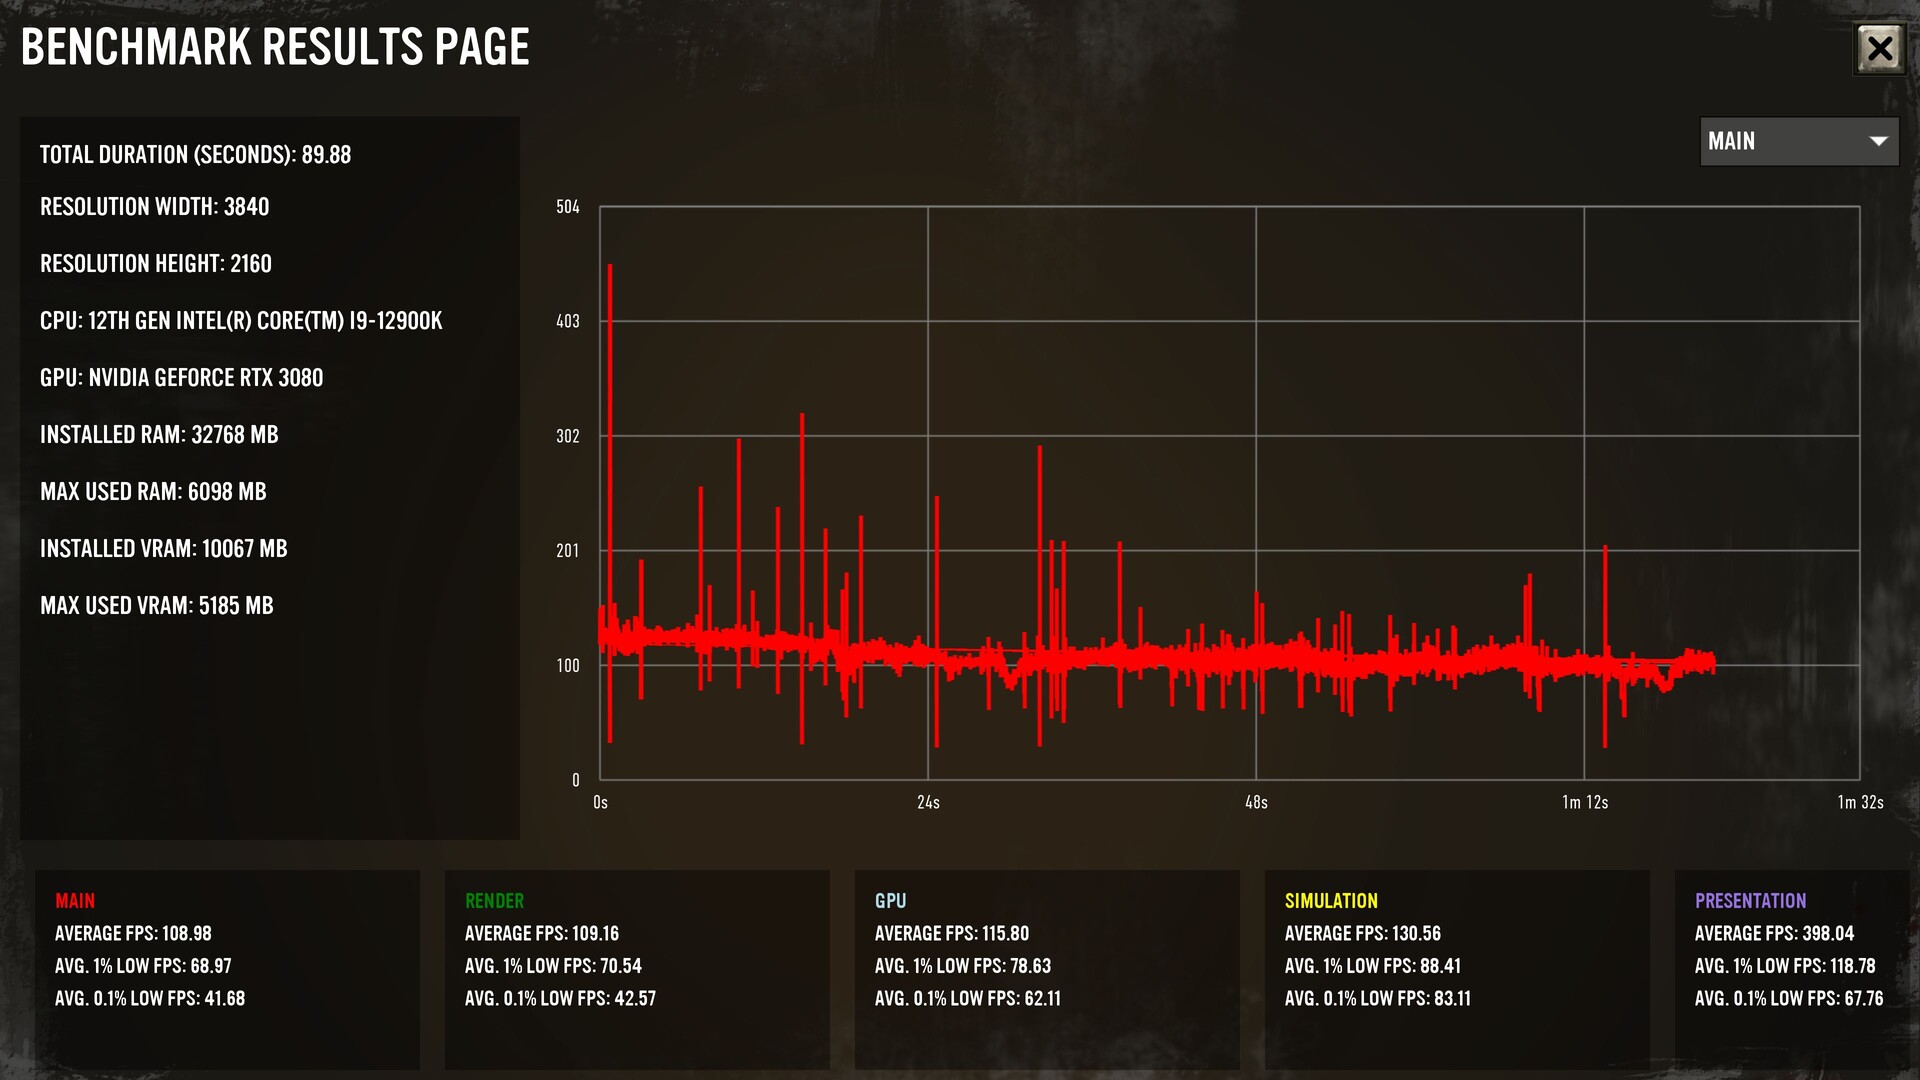
一旦基准测试结束,游戏将向你展示一个完整的规格和性能图表的简要分析。
结果
FHD (1,920 x 1,080)
英雄连3》在图形性能方面的要求不高,令人高兴。虽然 "更好的 "英特尔iGPU,如 Iris Xe Graphics G7可以在不高于1,280 x 720的最低设置下流畅地运行游戏,而好的AMD iGPU如 Radeon 680M有时也能在1,920 x 1,080和中低设置下运行超过40 fps。
| Company of Heroes 3 | |
| 1920x1080 Low Settings 1920x1080 Medium Settings 1920x1080 High Settings 1920x1080 Maximum Settings | |
| AMD Radeon RX 7900 XTX, i9-12900K | |
| AMD Radeon RX 7900 XT, i9-12900K | |
| NVIDIA GeForce RTX 3080, i9-12900K | |
| NVIDIA GeForce RTX 3070, i9-12900K | |
| NVIDIA GeForce RTX 3080 Ti Laptop GPU, i9-12900HX | |
| NVIDIA GeForce RTX 3060 Laptop GPU, i7-12700H | |
| AMD Radeon RX 6800M, R9 5900HX | |
| AMD Radeon RX 6600M, R7 5800H | |
| AMD Radeon 680M, R9 6900HS | |
| Intel Iris Xe Graphics G7 96EUs, i7-1165G7 | |
QHD (2,560 x 1,440)
只有当你打算以高于全高清的分辨率运行游戏时,才建议使用中端GPU。A Radeon RX 6600M已经足够强大,可以让游戏在2,560 x 1,440和最大设置下运行60帧以上。
| Company of Heroes 3 | |
| 2560x1440 Maximum Settings | |
| AMD Radeon RX 7900 XTX, i9-12900K | |
| AMD Radeon RX 7900 XT, i9-12900K | |
| NVIDIA GeForce RTX 3080, i9-12900K | |
| NVIDIA GeForce RTX 3070, i9-12900K | |
| NVIDIA GeForce RTX 3080 Ti Laptop GPU, i9-12900HX | |
| NVIDIA GeForce RTX 3060 Laptop GPU, i7-12700H | |
| AMD Radeon RX 6800M, R9 5900HX | |
| AMD Radeon RX 6600M, R7 5800H | |
UHD (3,840 x 2,160)
在设置全部打开的情况下,在3840 x 2160的条件下运行游戏所需要的是一个中上层的显卡,如GeForce RTX 3060.
| Company of Heroes 3 | |
| 3840x2160 Maximum Settings | |
| AMD Radeon RX 7900 XTX, i9-12900K | |
| AMD Radeon RX 7900 XT, i9-12900K | |
| NVIDIA GeForce RTX 3080, i9-12900K | |
| NVIDIA GeForce RTX 3080 Ti Laptop GPU, i9-12900HX | |
| NVIDIA GeForce RTX 3070, i9-12900K | |
| NVIDIA GeForce RTX 3060 Laptop GPU, i7-12700H | |
| AMD Radeon RX 6800M, R9 5900HX | |
| AMD Radeon RX 6600M, R7 5800H | |
注意事项
由于游戏测试非常耗时,而且经常受到安装或激活限制的制约,因此在发表本文时,我们只能为您提供部分基准测试结果。我们将在未来几天和几周内增加更多的显卡。
Overview
Test systems
| 设备 | 显卡 | 处理器 | 内存 | 操作系统 |
|---|---|---|---|---|
| 笔记本 | ||||
| 微星Titan GT77 12UHS | NvidiaGeForce RTX 3080 Ti @175 W TGP (16 GB GDDR6) | Intel Core i9-12900 | 2 x 16 GB DDR5 | Windows 11 |
| 联想Legion 5 Pro | NvidiaGeForce RTX 3060 @140 W TGP (6 GB GDDR6) | Intel Core i7-12700H | 2 x 8 GB DDR5 | Windows 11 |
| 华硕ROG Strix G15 | AMD Radeon RX 6800M(12 GB GDDR6) | AMD Ryzen 9 5900HX | 2 x 8 GB DDR4 | Windows 11 |
| 联想Legion 5 | AMD Radeon RX 6600M(8 GB GDDR6) | AMD Ryzen 7 5800H | 2 x 8 GB DDR4 | Windows 11 |
| 华硕ROG Zephyrus G14 | AMD Radeon 680M | AMD Ryzen 9 6900HS | 2 x 16 GB DDR5 | Windows 11 |
| 塔式电脑 | ||||
| 定制 I | AMD Radeon RX 7900 XTX (24 GB GDDR6) AMD Radeon RX 7900 XT (20 GB GDDR6) MSIGeForce RTX 3080 (10 GB GDDR6X) MSIGeForce RTX 3070 (8 GB GDDR6) |
Intel Core i9-12900K | 2 x 16 GB DDR4 | Windows 11 |
| Custom II | PalitGeForce RTX 4090 GameRock OC (24 GB GDDR6X) Nvidia GeForce RTX 3090 FE (24 GB GDDR6X) Nvidia GeForce RTX 3060 Ti (8 GB GDDR6X) NvidiaTitan RTX (24 GB GDDR6) lNvidia GeForce RTX2070 Super (8 GB GDDR6) Nvidia GeForce RTX 2060 Super (8 GB GDDR6) KFA2 GeForce GTX 1660 Super (6 GB GDDR6) PNY GeForce GTX 1660 (6 GB GDDR5) KFA2 GeForce GTX 1650 Super (4 GB GDDR6) AMD Radeon RX6950 XT (16 GB DDR6) AMD Radeon RX 6800 (16 GB DDR6) AMD Radeon RX 6700 XT (12 GB DDR6) AMD Radeon RX 6650 XT (8 GB GDDR6) AMD Radeon RX 6600 (8 GB GDDR6) AMD RadeonRX 5700 XT (8 GB GDDR6) AMD Radeon RX 5700 (8 GB GDDR6) AMD Radeon RX 5600 XT (6 GB GDDR6) AMD Radeon RX 5500 XT (8 GB GDDR6) |
AMD Ryzen 9 7950X | 2 x 16 GB DDR5 | Windows 11 |
| Custom III | NvidiaGeForce RTX 2080 Super FE | Intel Core i9-11900K | 2 x 8 GB DDR4 | Windows 11 |
| 迷你电脑 | ||||
| Zotac ZBOX CI665 Nano | Intel Iris Xe Graphics G7 (96 CUs) | Intel Core i7-1165G7 | 2 x 8 GB DDR4 | Windows 11 |
| Morefine S500+ | AMD Radeon RX Vega 8 | AMD Ryzen 9 5900HX | 2 x 16 GB DDR4 | Windows 11 |
| Minisforum NUCXi7 | NvidiaGeForce RTX 3070 @125 W TGP (8 GB GDDR6) | Intel Core i7-11800H | 2 x 8 GB DDR4 | Windows 11 |
| Minisforum HX99G | AMD Radeon RX 6600M @100 W TGP (8 GB GDDR6) | AMD Ryzen 9 6900HX | 2 x 16 GB DDR5 | Windows 11 |
| 4K显示器 | Nvidia驱动 | AMD驱动 |
|---|---|---|
| Philips Brilliance 329P9H, Gigabyte M32U | ForceWare 528.49 | Adrenalin 23.2.2 |

