Notebookcheck Logo

森林之子 "回顾。笔记本电脑和台式机基准测试

一个令人难忘的经历。 在他们的惊世之作《森林》首次亮相近5年后,加拿大工作室Endnight Games的开发者发布了该作品的续集。森林之子》再次提供了一个有趣的游戏设计,结合了开放世界的探索和生存恐怖。阅读我们的基准检查,了解其硬件要求是否同样可怕。
Gaming Laptop / Notebook Desktop Gamecheck
森林之子

技术方面

尽管仍处于早期访问阶段,《森林之子》已经非常受欢迎。当你看到它在Steam上收到的无数好评,以及它在YouTube和Twitch社区中获得的巨大成功时,这是很明显的。我们绝对可以理解这种积极的接待。像许多Early Access游戏一样,《森林之子》仍然存在各种小问题,如卡顿(无论你的硬件有多强大)、剪切问题和其他图形故障(如闪烁和物体弹出)。尽管如此,该游戏的图形大多是相当令人印象深刻的。

森林之子
森林之子
森林之子
森林之子
森林之子
森林之子

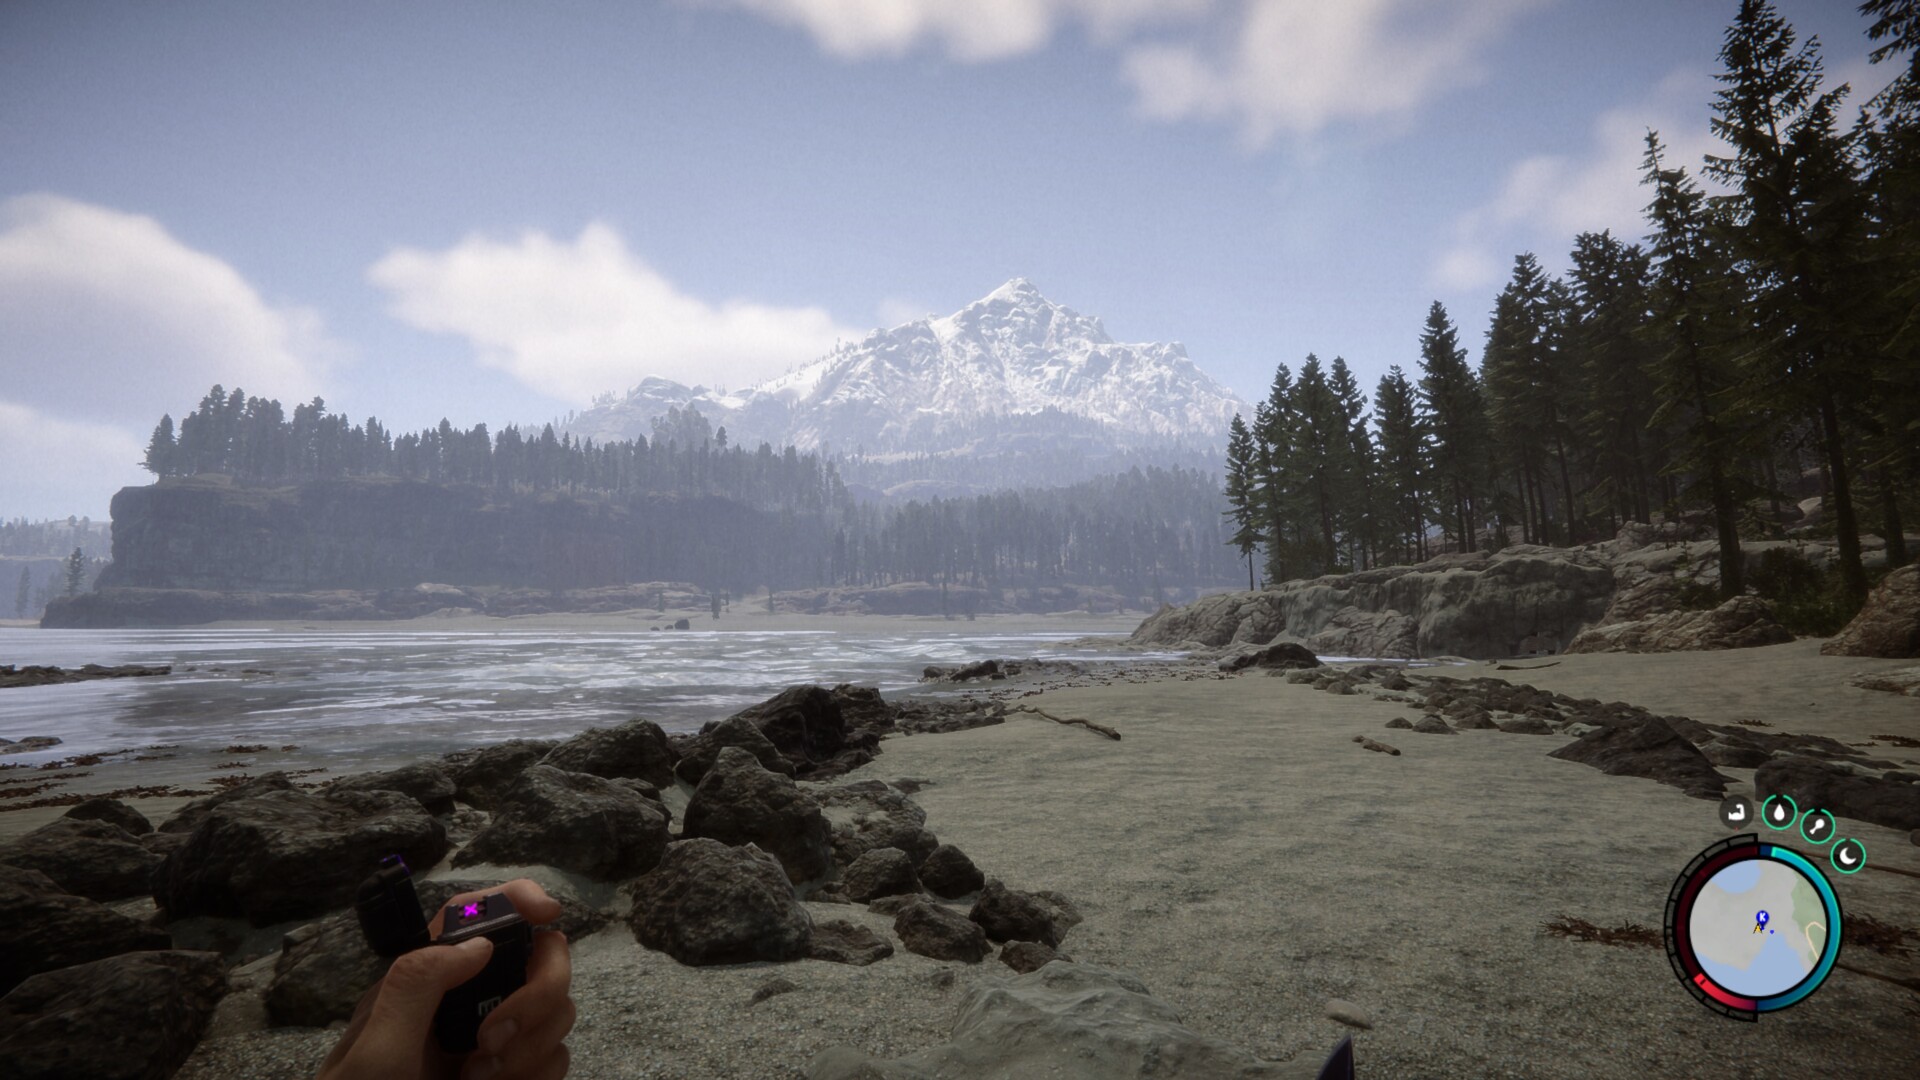
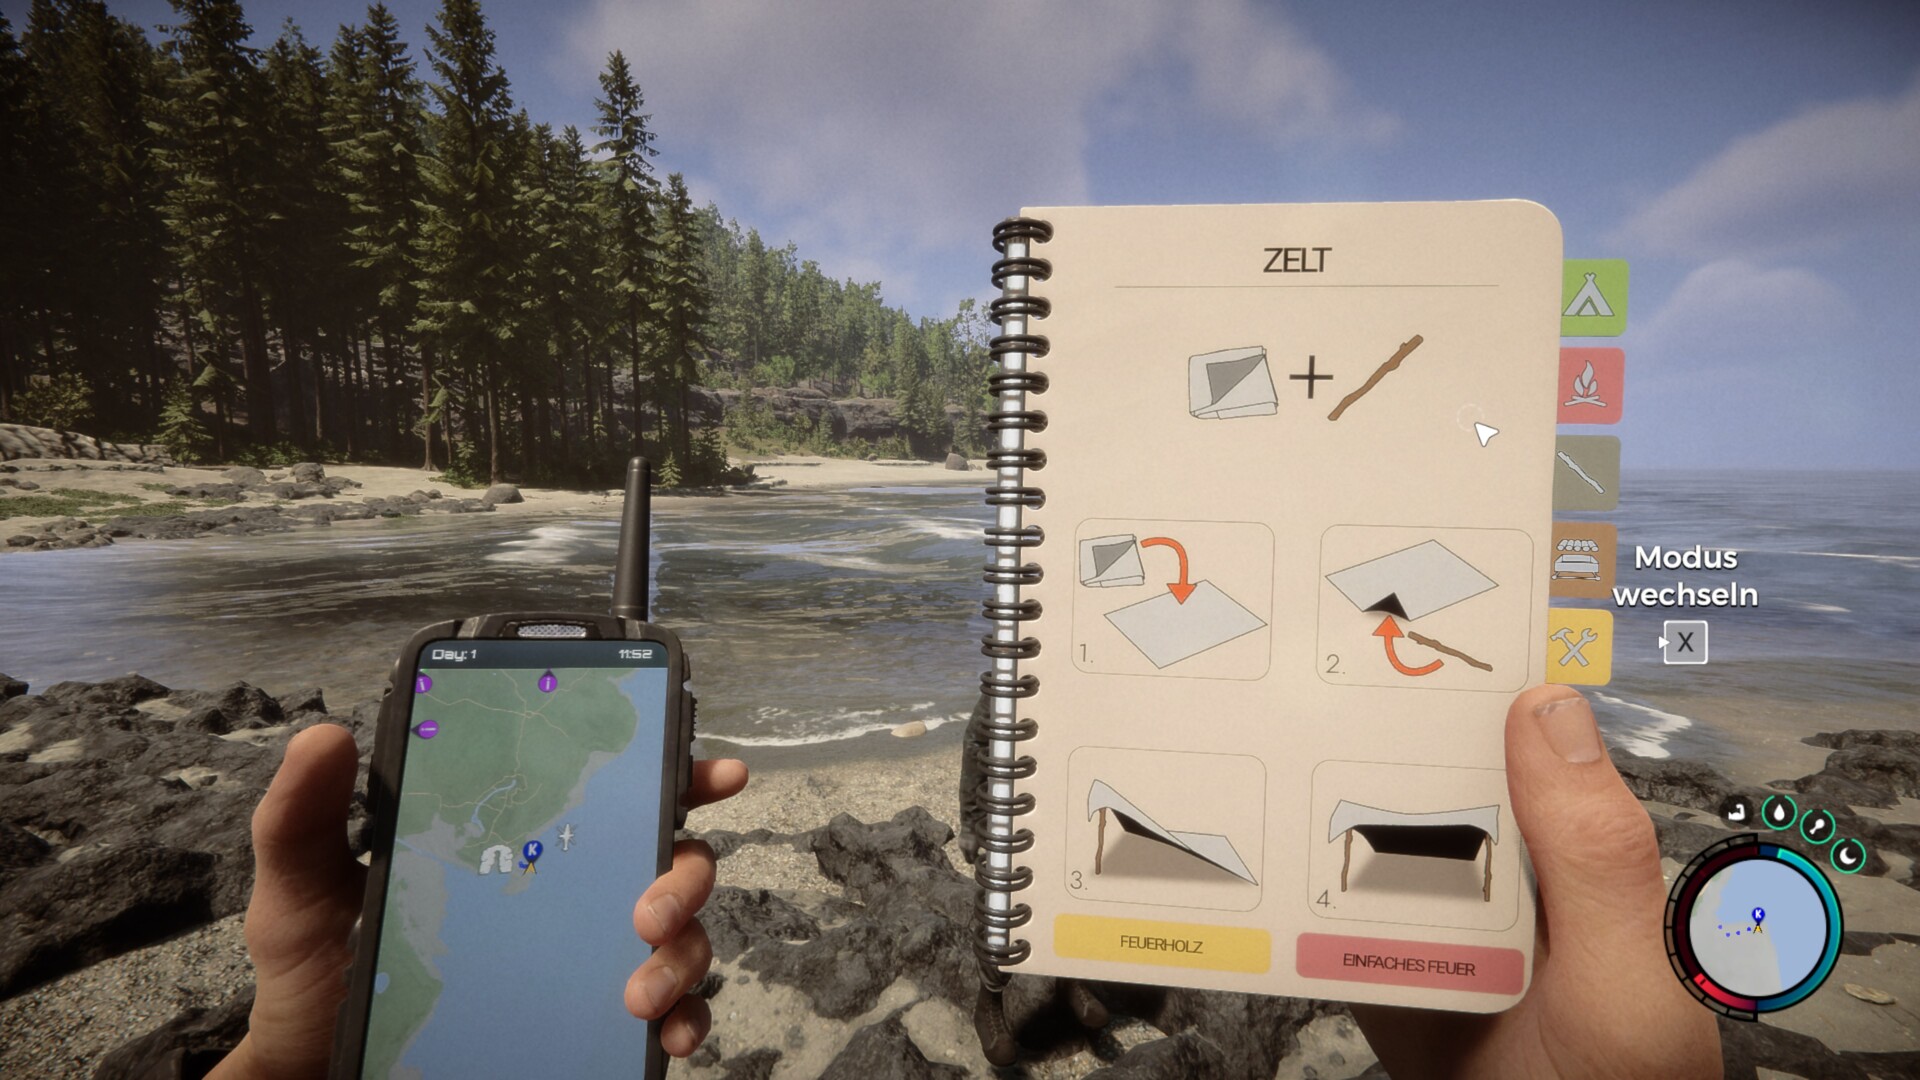
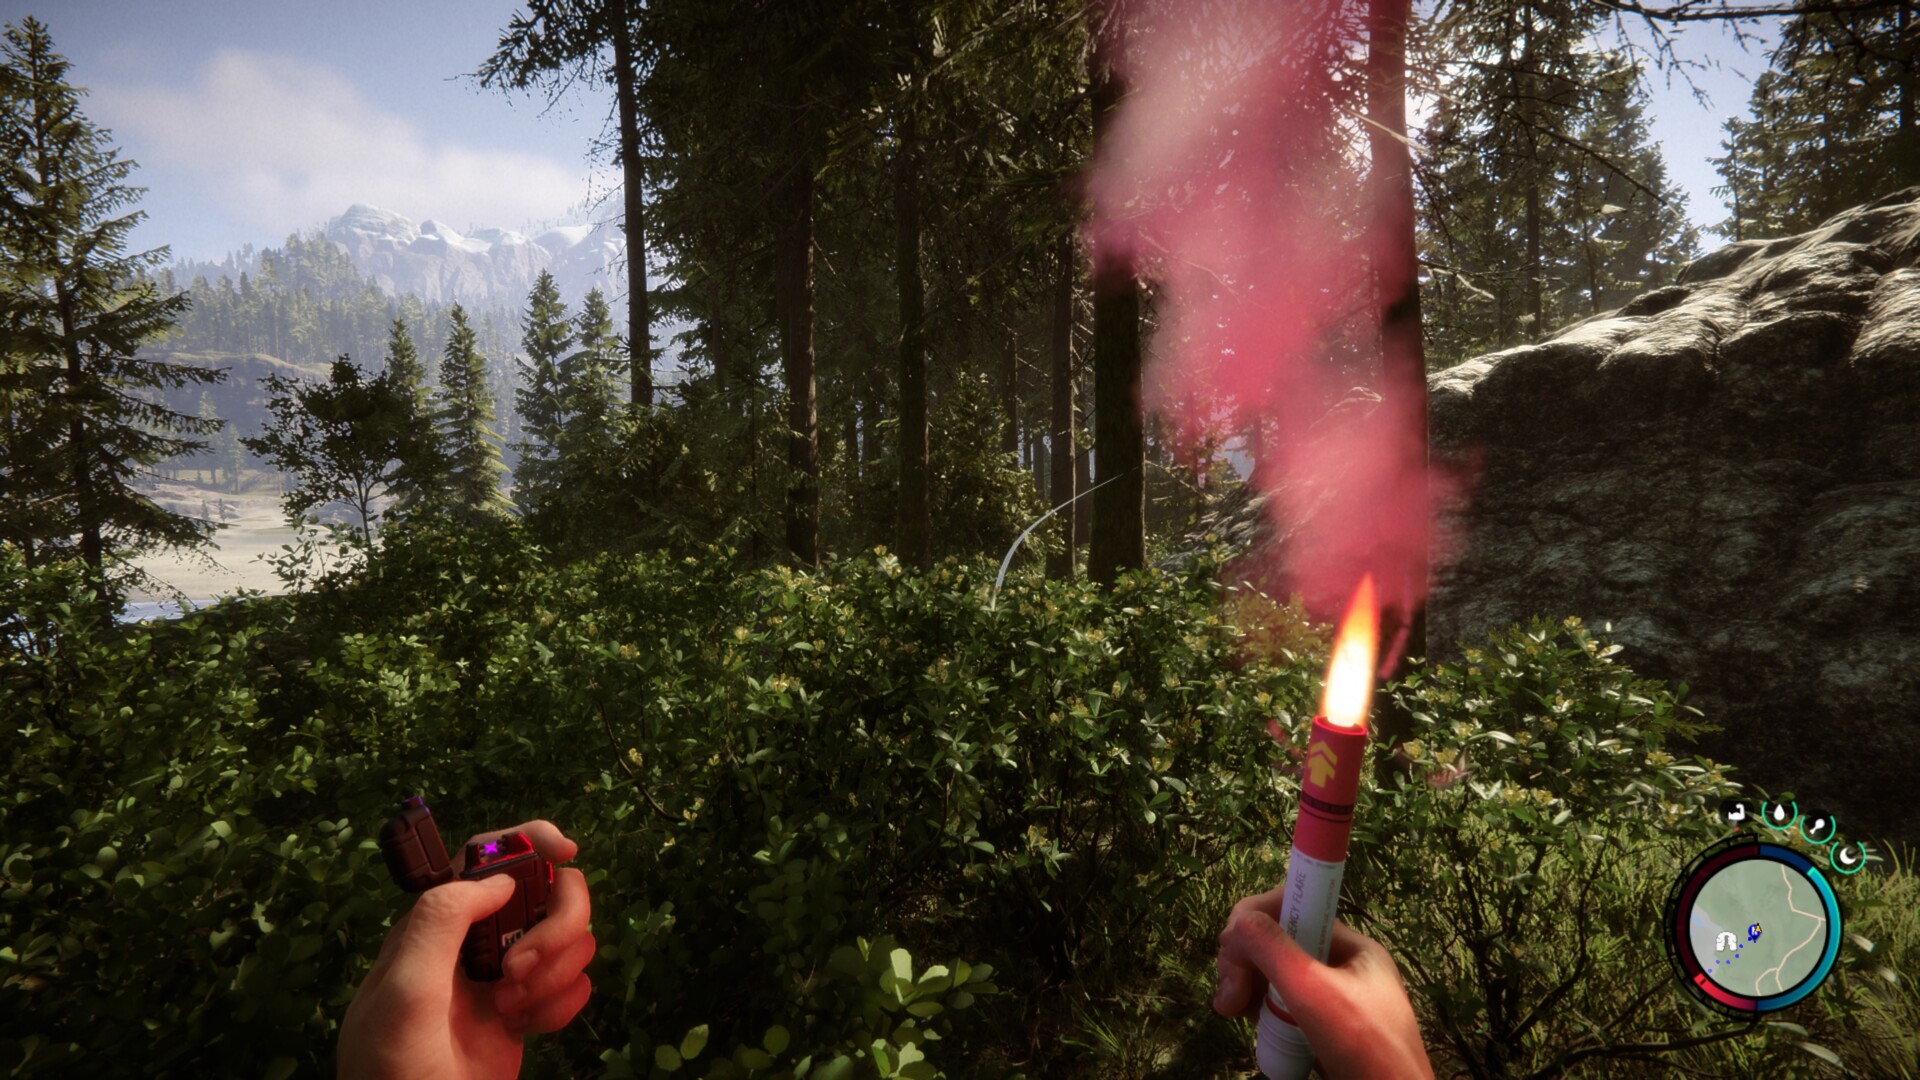
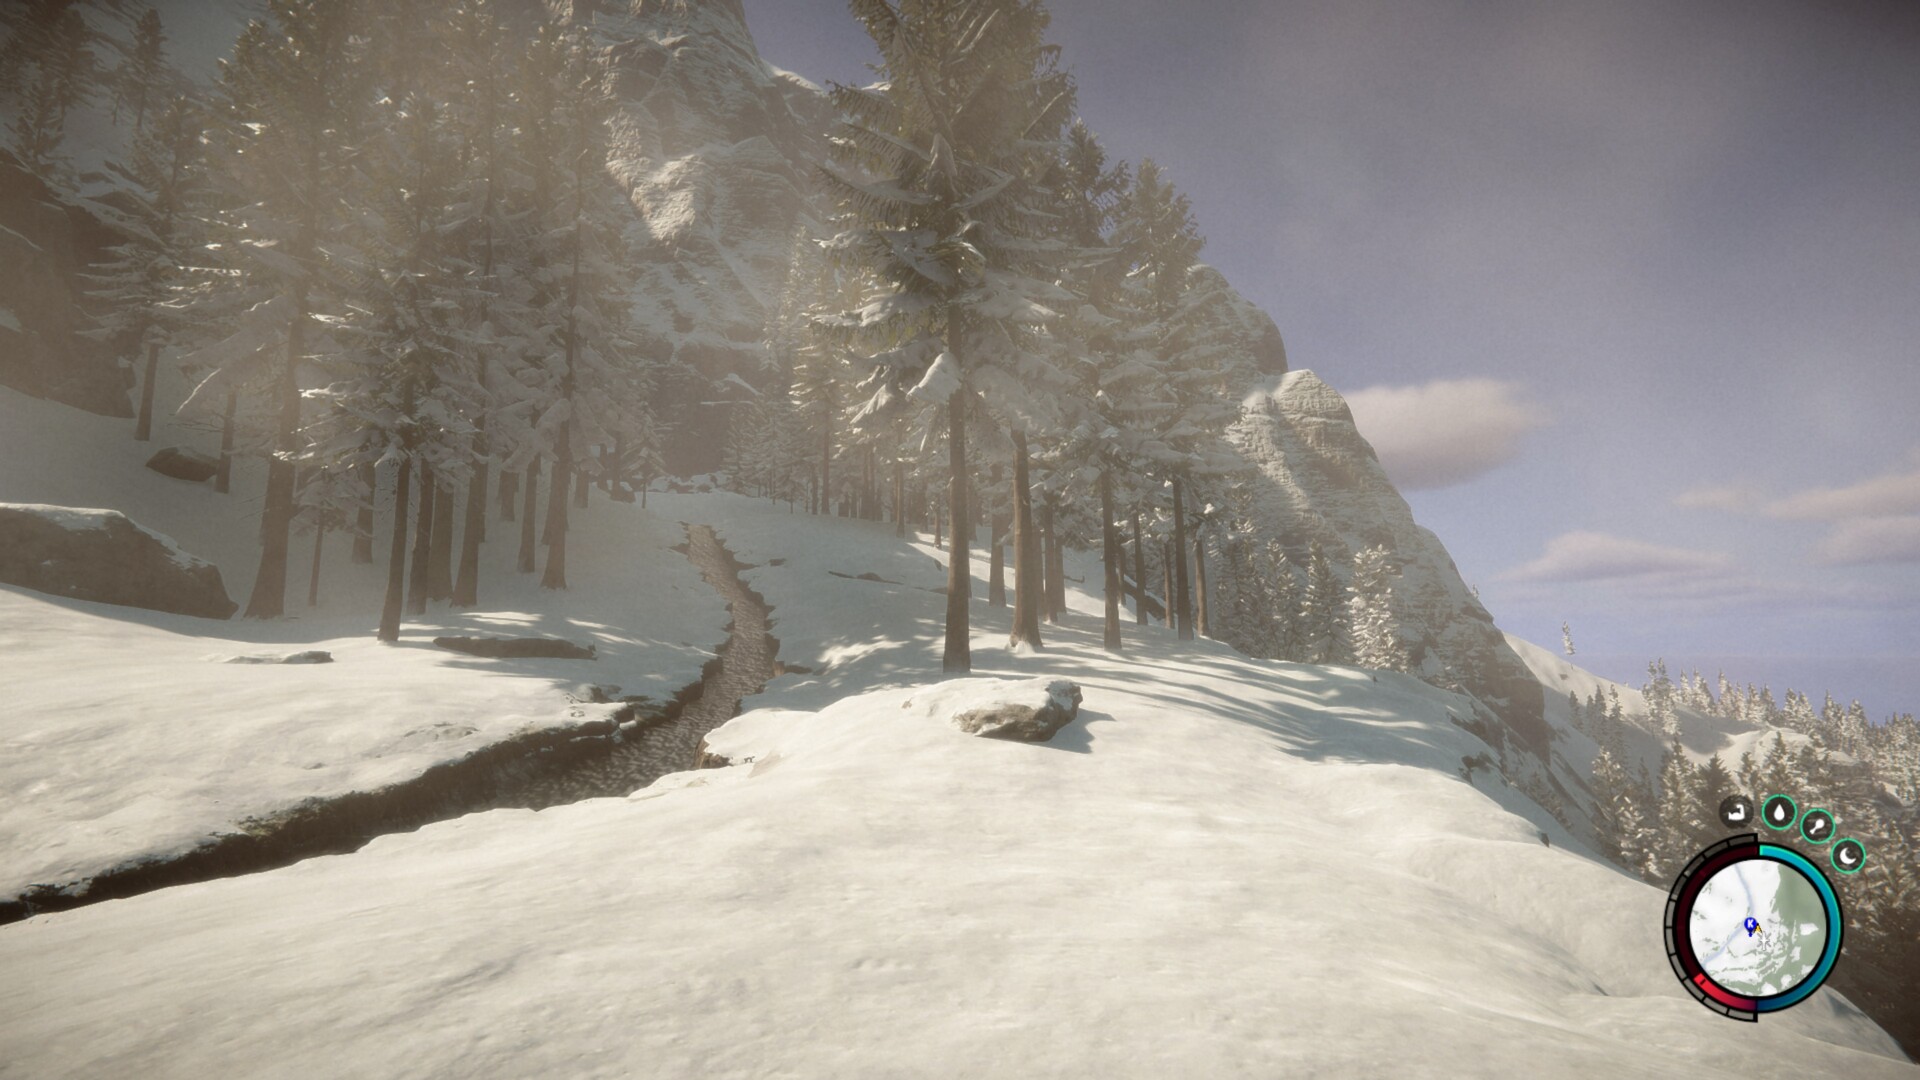
如果你忽略了有些模糊的云层,《森林之子》在大多数情况下具有清晰的纹理、茂盛的植被、高拉距和时尚的效果(如灯光)。结合各种气候区(绿色森林、雪山等),昼夜循环和天气的定期变化也使游戏具有奇妙和相当独特的氛围。另一个亮点是玩家角色在雪地或潮湿的海滩上留下的美丽足迹。总的来说,开发者已经成功地从Unity引擎中获得了很多东西,不必被大型工作室的典型三A级游戏所吓倒。

森林之子
森林之子
森林之子
森林之子
森林之子
森林之子

从技术角度看,游戏已经相对完善,在目前的状态下运行得相当好(只要你至少有一个中端GPU)。我们将在后面的基准测试部分讨论这个问题。加载时间也同样可以接受。虽然游戏启动非常快,但初始加载过程需要一段时间才能完成。也就是说,其他加载时间是相当合理的。还有一件事要提到,就是安装尺寸很小。森林之子》的下载量为9GB,占用13GB的存储空间--对于2023年的游戏来说,这个数字少得令人吃惊。

森林之子
森林之子
森林之子
森林之子
森林之子
森林之子

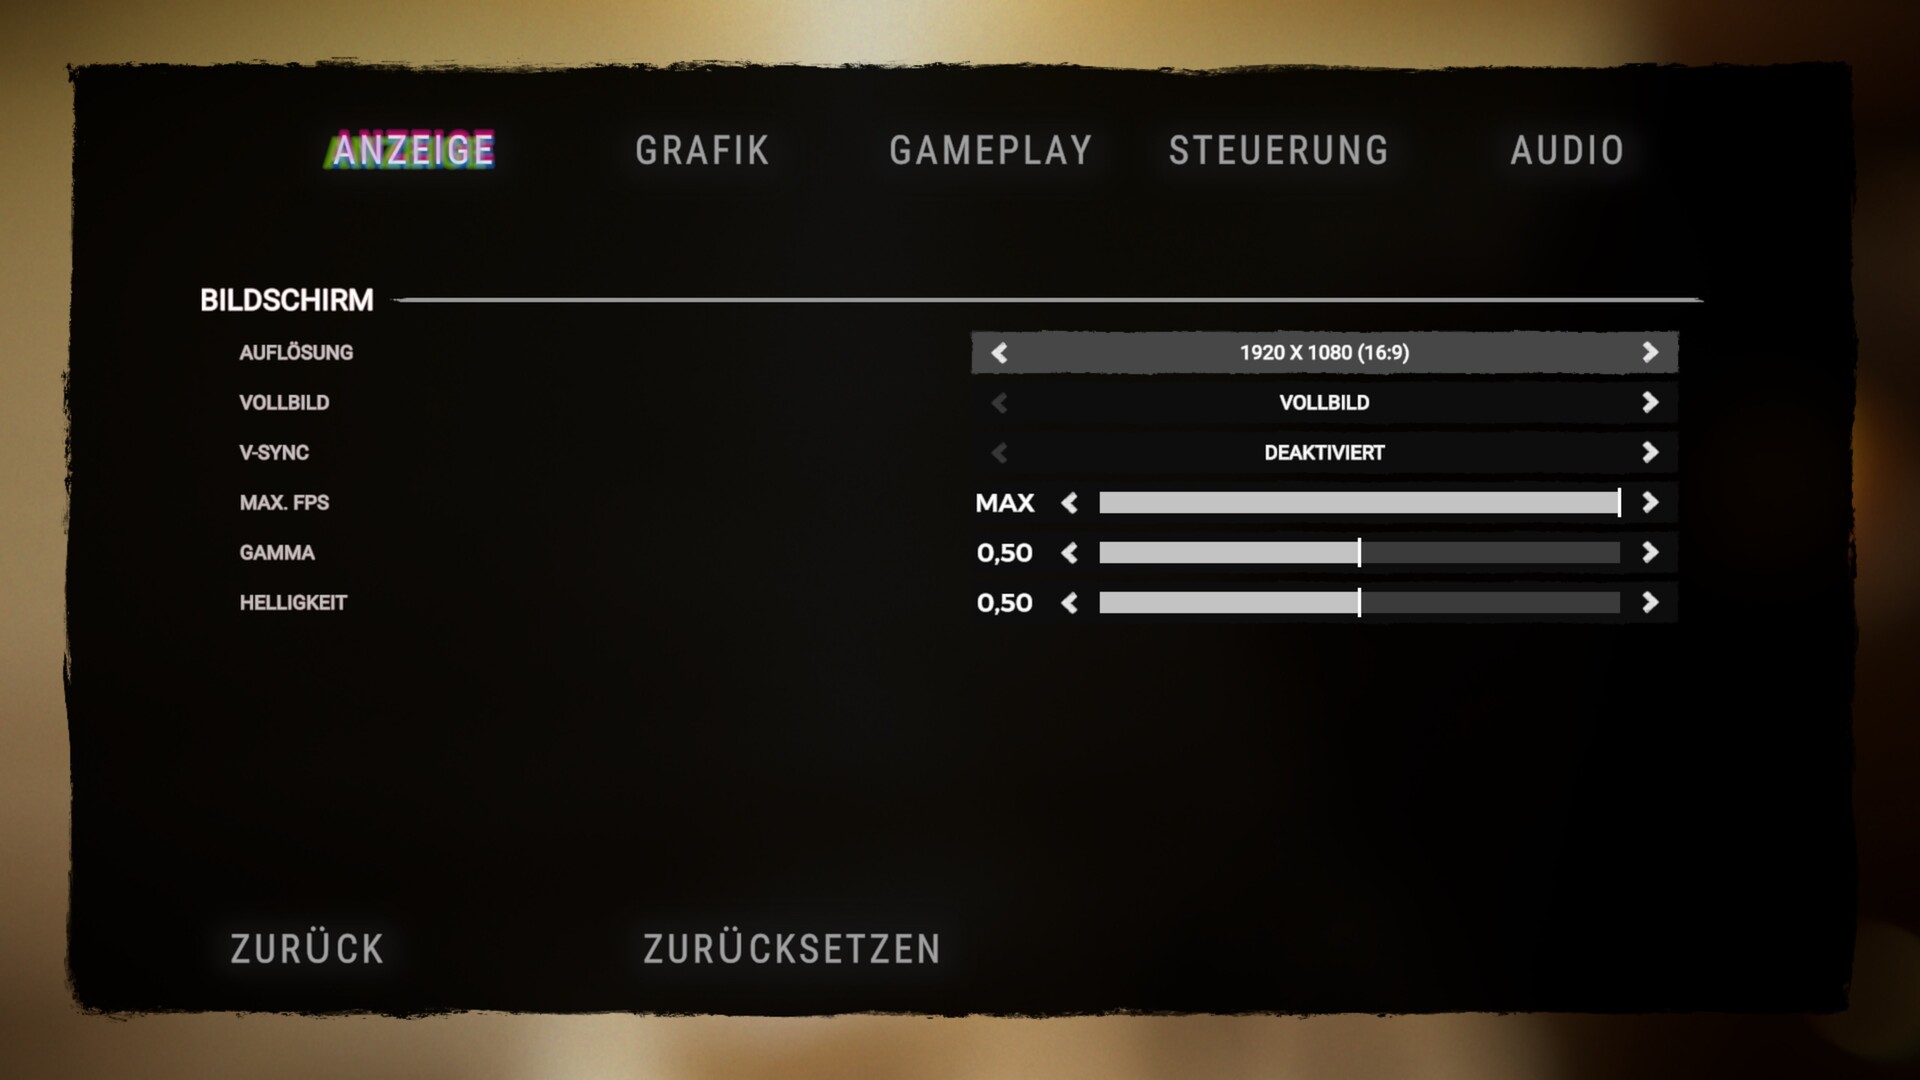
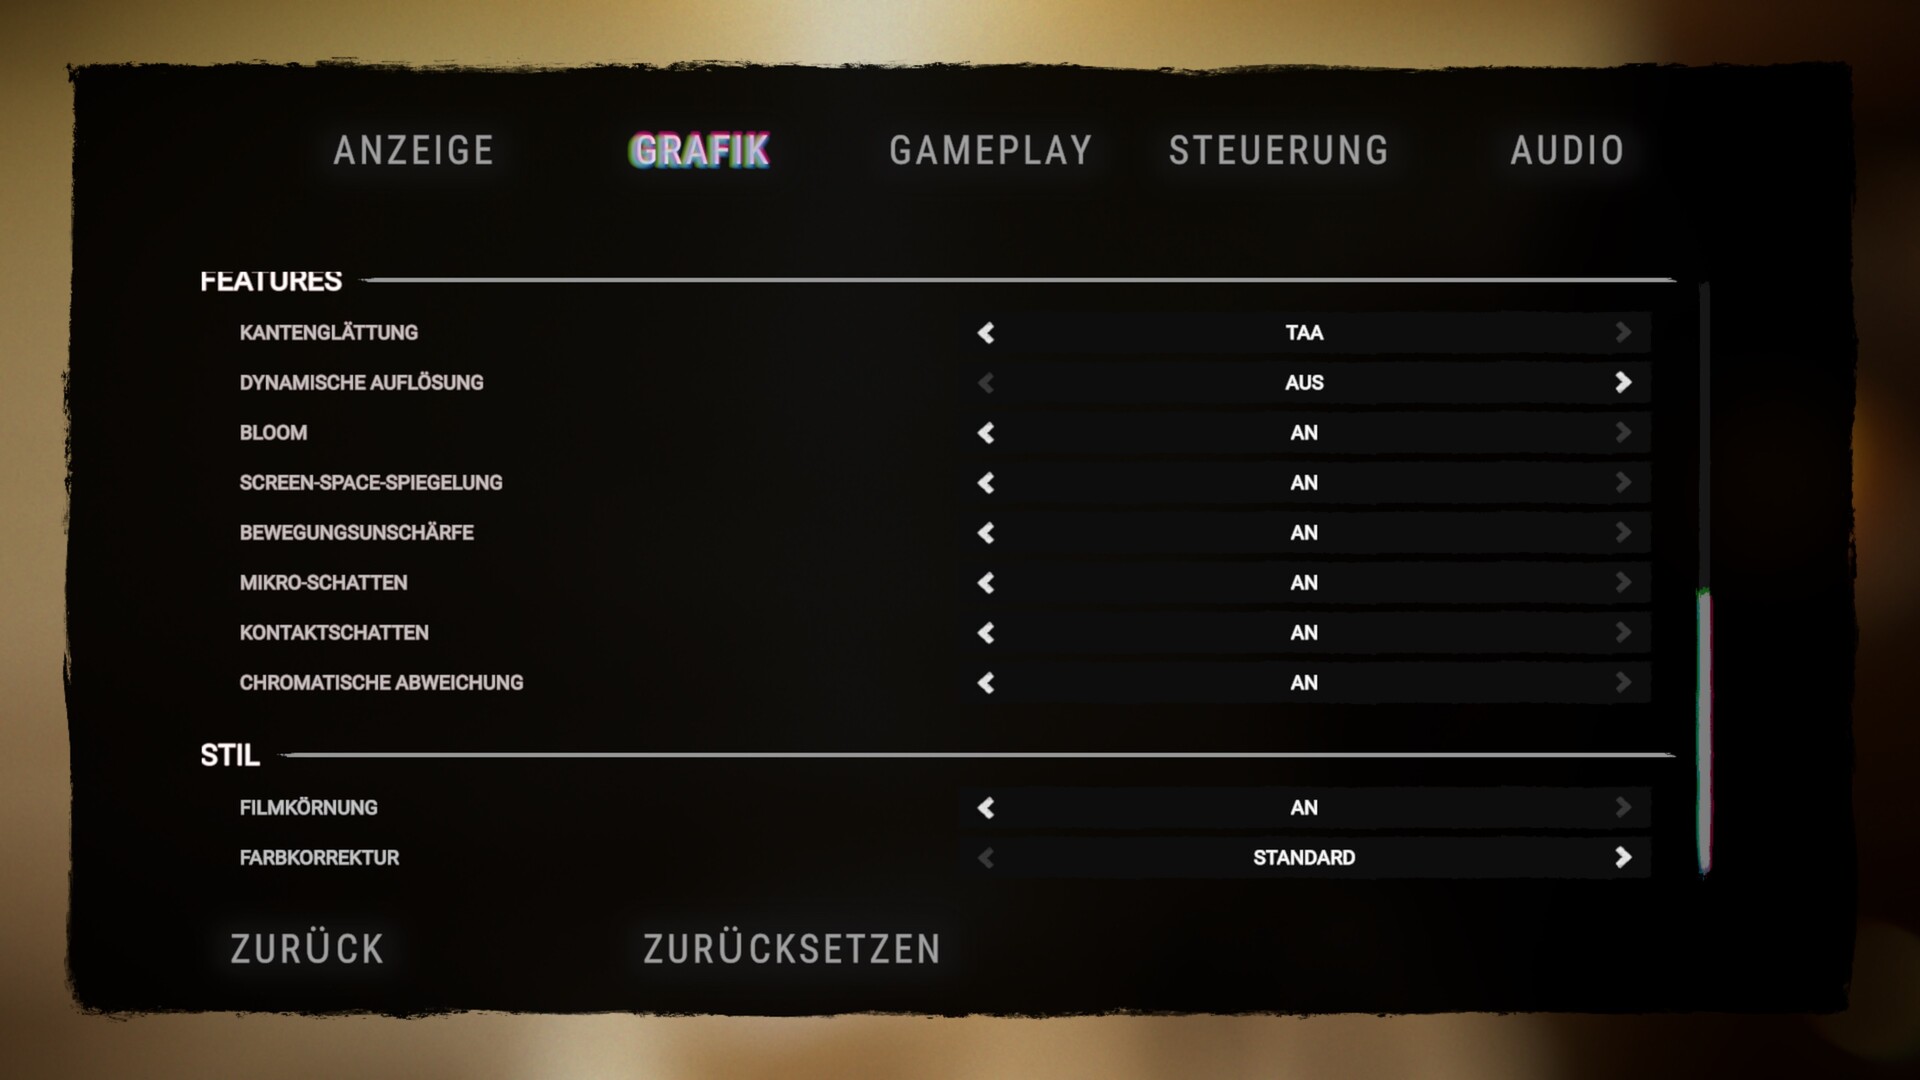
选项菜单同样也不会太寒酸。图形选项卡包含20多个选项,可以通过选择其中一个质量预设来集体调整。有一件好事是,所有的设置都可以在不重新启动游戏的情况下进行更改。与当前许多其他游戏类似,《森林之子》支持动态升频方法,如FSR和DLSS(我们在测试中禁用了这些方法)。相比之下,显示选项卡并没有什么可提供的。除了分辨率,它只让你调整显示模式、VSync、伽玛、亮度和帧率限制(20至240或未锁定)。

森林之子
森林之子
森林之子

基准

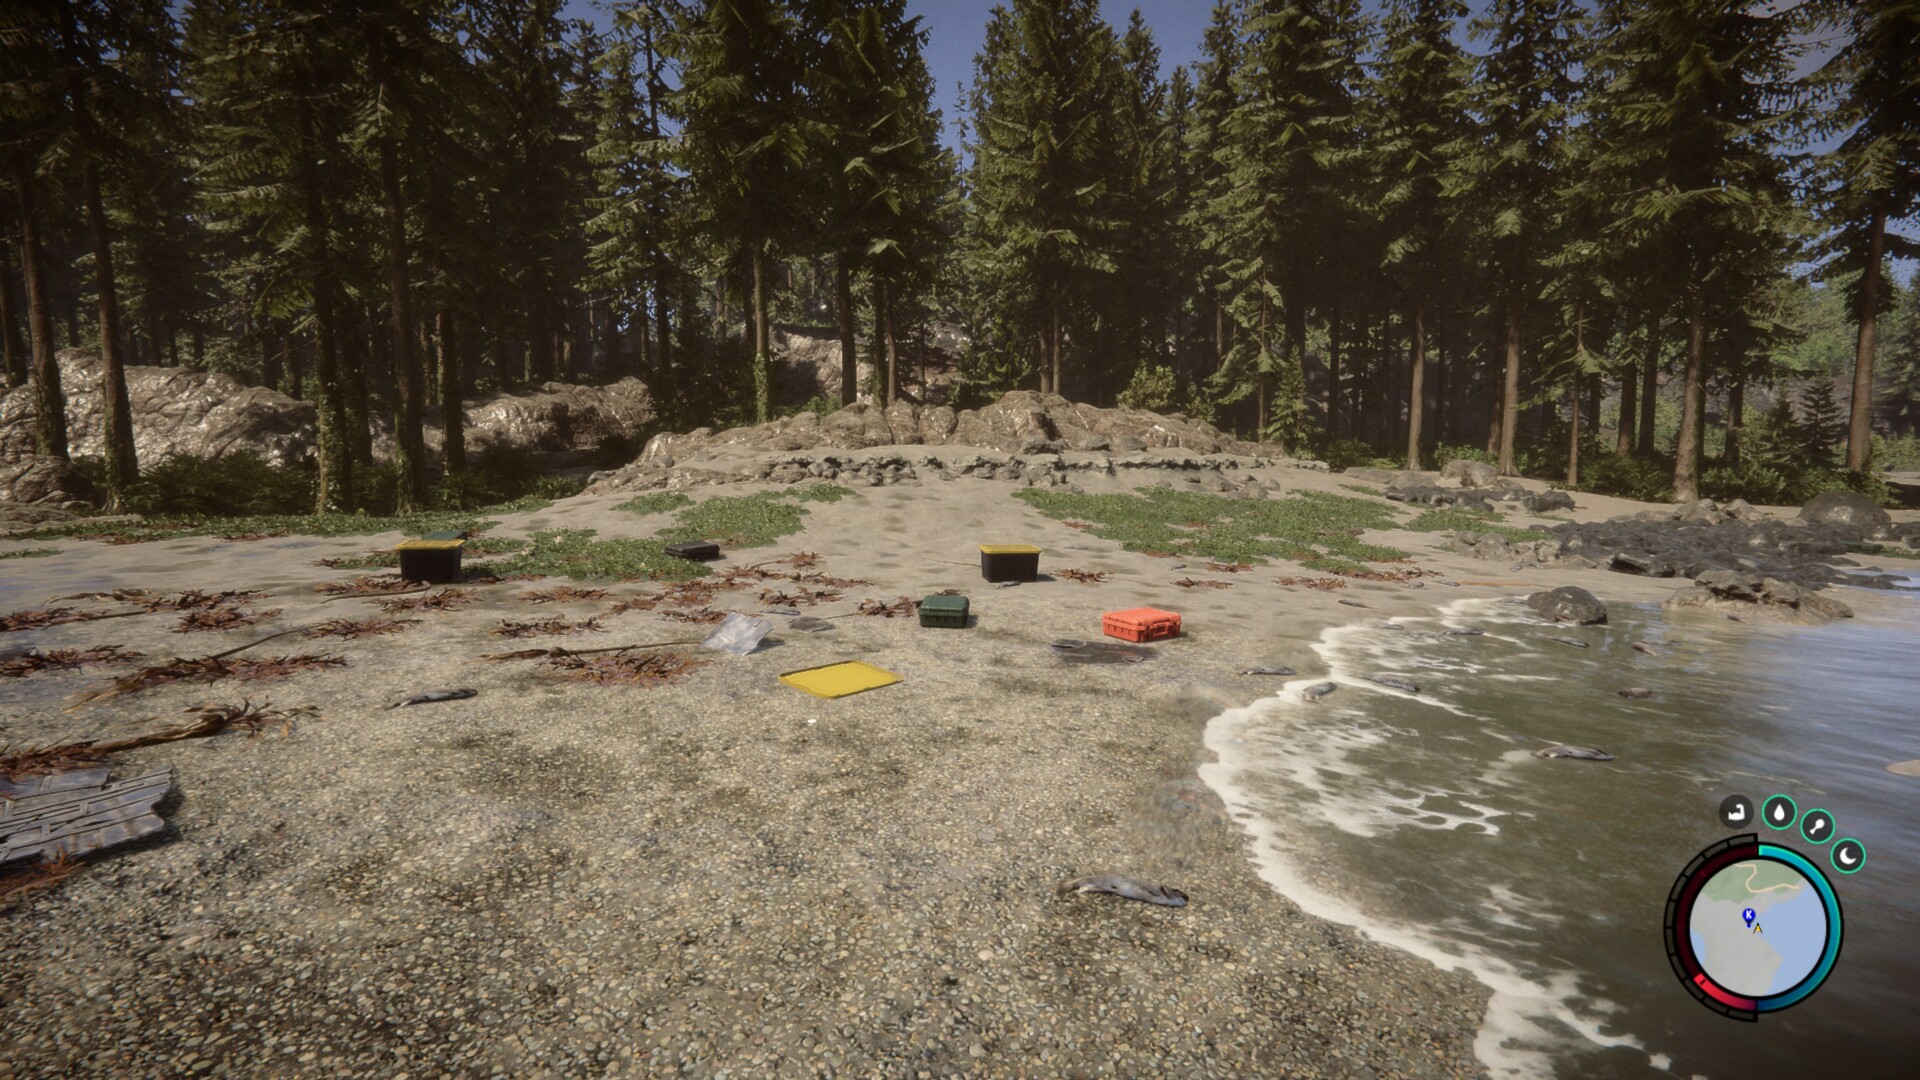
由于《森林之子》没有一个内置的基准,我们使用了一个标准化的游戏序列来帮助我们测量帧率。如下面的视频所示,我们让玩家角色在海滩(游戏开始时的一个产卵点)上的预定义路径上走了大约40秒。帧率是用CapFrameX捕获的。

结果

FHD (1,920 x 1,080)

虽然iGPU,如 锐龙680MIris Xe Graphics G7已经很难处理全高清和低预设(<40帧)下的游戏,中级GPU大多有足够的功率来处理高至最大设置。然而,正如你在全高清的表格中所看到的那样,当与中端GPU或更高版本搭配时,处理器很快就会成为一个限制因素。例如,在Ultra预设下,我们的 桌面RTX 3070几乎不比本来快得多的 桌上型RX 7900 XTX.更为显著的是:我们的 RX 6600M笔记本电脑成功地超越了 RX 6800M笔记本电脑得益于更好的CPU利用率。

Sons of the Forest
    1920x1080 Low Preset     1920x1080 Medium Preset AA:T     1920x1080 High Preset AA:T     1920x1080 Ultra Preset AA:T
AMD Radeon RX 7900 XTX, i9-12900K
Desktop-PC
122.7 (55.5min, 94.4P0.1, 99.7P1) fps ∼50%
119.3 (50min, 88.5P0.1, 95.9P1) fps ∼48%
113.6 (57.5min, 79.6P0.1, 92.6P1) fps ∼47%
113.4 (53.3min, 84.3P0.1, 93.9P1) fps ∼48%
NVIDIA GeForce RTX 3080, i9-12900K
Desktop-PC
120.9 (79.2min, 89.9P0.1, 98.1P1) fps ∼49%
116.5 (83.7min, 87.3P0.1, 95P1) fps ∼47%
114 (70.5min, 84.7P0.1, 90.8P1) fps ∼48%
112.4 (41.3min, 73.5P0.1, 86.8P1) fps ∼48%
AMD Radeon RX 7900 XT, i9-12900K
Desktop-PC
122.1 (39.8min, 52.2P0.1, 97.2P1) fps ∼49%
116.8 (56.6min, 91.6P0.1, 97.8P1) fps ∼47%
113.3 (44.8min, 87.4P0.1, 93.3P1) fps ∼47%
111.6 (40.5min, 83P0.1, 92.3P1) fps ∼48%
NVIDIA GeForce RTX 3070, i9-12900K
Desktop-PC
114.7 (47min, 57.8P0.1, 85.7P1) fps ∼46%
104.4 (51.6min, 63.1P0.1, 75.9P1) fps ∼42%
103.3 (47min, 69.7P0.1, 76.1P1) fps ∼43%
102 (37.4min, 57.8P0.1, 70.5P1) fps ∼44%
NVIDIA GeForce RTX 3080 Ti Laptop GPU, i9-12900HX
MSI Titan GT77 12UHS
91.7 (58.7min, 69.4P0.1, 74.9P1) fps ∼37%
87.8 (58.9min, 63.5P0.1, 71.4P1) fps ∼36%
85.7 (53.5min, 64.8P0.1, 69.4P1) fps ∼36%
84.6 (33.6min, 63.5P0.1, 68.9P1) fps ∼36%
NVIDIA GeForce RTX 3060 Laptop GPU, i7-12700H
Lenovo Legion 5 Pro
83.8 (46.1min, 53.8P0.1, 65.9P1) fps ∼34%
70.5 (39.8min, 43.6P0.1, 48.9P1) fps ∼29%
65.9 (30.7min, 36.9P0.1, 46.8P1) fps ∼27%
65.4 (36.4min, 40.1P0.1, 46.7P1) fps ∼28%
AMD Radeon RX 6600M, R7 5800H
Lenovo Legion 5
71.6 (49.3min, 57.4P0.1, 60.1P1) fps ∼29%
68.4 (51.2min, 53.5P0.1, 57.1P1) fps ∼28%
65.6 (36.4min, 48.4P0.1, 54.4P1) fps ∼27%
64.7 (26.4min, 43.3P0.1, 50.3P1) fps ∼28%
AMD Radeon RX 6800M, R9 5900HX
Asus ROG Strix G15
59.2 (40.9min, 47.8P0.1, 49.8P1) fps ∼24%
56.5 (43.9min, 46P0.1, 48.2P1) fps ∼23%
54.6 (43.9min, 44.5P0.1, 46P1) fps ∼23%
53.1 (33.3min, 35.2P0.1, 39P1) fps ∼23%
AMD Radeon 680M, R9 6900HS
Asus ROG Zephyrus G14
33.7 (19.4min, 19.8P0.1, 22.2P1) fps ∼14%
24.9 (12.6min, 15P0.1, 16.8P1) fps ∼10%
23.6 (12.9min, 13.5P0.1, 15.5P1) fps ∼10%
23.3 (11.2min, 13.6P0.1, 15.8P1) fps ∼10%
Intel Iris Xe Graphics G7 96EUs, i7-1165G7
Zotac ZBOX CI665 Nano
9.53 (2.15min, 2.15P0.1, 2.6P1) fps ∼4%
7.73 (2.32min, 2.38P0.1, 2.58P1) fps ∼3%
7.35 (2.42min, 2.43P0.1, 2.61P1) fps ∼3%
7.24 (2.22min, 2.22P0.1, 2.34P1) fps ∼3%

QHD (2,560 x 1,440)

如果你想在QHD显示器上玩游戏,你应该使用中高端的显卡。根据我们的测试,一个 GeForce RTX 3060或更高,才能在2,560 x 1,440和Ultra预设下达到平均50帧以上的效果。

Sons of the Forest
    2560x1440 Ultra Preset AA:T
AMD Radeon RX 7900 XTX, i9-12900K
Desktop-PC
108.5 (5.81min, 44P0.1, 88.2P1) fps ∼49%
AMD Radeon RX 7900 XT, i9-12900K
Desktop-PC
108.3 (72.3min, 86P0.1, 91.1P1) fps ∼49%
NVIDIA GeForce RTX 3080, i9-12900K
Desktop-PC
98.5 (52.2min, 55.7P0.1, 62.4P1) fps ∼44%
NVIDIA GeForce RTX 3070, i9-12900K
Desktop-PC
82.3 (45.7min, 54.5P0.1, 61.1P1) fps ∼37%
NVIDIA GeForce RTX 3080 Ti Laptop GPU, i9-12900HX
MSI Titan GT77 12UHS
74 (27.1min, 27.4P0.1, 35.4P1) fps ∼33%
NVIDIA GeForce RTX 3060 Laptop GPU, i7-12700H
Lenovo Legion 5 Pro
51.1 (24.8min, 28.6P0.1, 37.5P1) fps ∼23%
AMD Radeon RX 6800M, R9 5900HX
Asus ROG Strix G15
49.9 (30.8min, 32.4P0.1, 34.6P1) fps ∼22%
AMD Radeon RX 6600M, R7 5800H
Lenovo Legion 5
47.5 (33.7min, 36.1P0.1, 39.2P1) fps ∼21%

UHD (3,840 x 2,160)

一般来说,如果你想以4K(3,840 x 2,160)和Ultra预设的方式玩游戏,使用绝对顶级的显卡是绕不过去的。对于一个便携式系统,只有一个 GeForce RTX 3080 Ti或更好的显卡才能突破50帧大关。

Sons of the Forest
    3840x2160 Ultra Preset AA:T
AMD Radeon RX 7900 XTX, i9-12900K
Desktop-PC
98.4 (34.2min, 40.3P0.1, 71.7P1) fps ∼41%
AMD Radeon RX 7900 XT, i9-12900K
Desktop-PC
86 (48.2min, 62.8P0.1, 66.8P1) fps ∼36%
NVIDIA GeForce RTX 3080, i9-12900K
Desktop-PC
69.5 (40.2min, 48P0.1, 51.4P1) fps ∼29%
NVIDIA GeForce RTX 3080 Ti Laptop GPU, i9-12900HX
MSI Titan GT77 12UHS
53.8 (6.45min, 30.1P0.1, 41.2P1) fps ∼23%
NVIDIA GeForce RTX 3070, i9-12900K
Desktop-PC
50.5 (33.1min, 35.4P0.1, 40.7P1) fps ∼21%
AMD Radeon RX 6800M, R9 5900HX
Asus ROG Strix G15
39.9 (19.7min, 24.1P0.1, 30.4P1) fps ∼17%
NVIDIA GeForce RTX 3060 Laptop GPU, i7-12700H
Lenovo Legion 5 Pro
31.9 (11.9min, 15.3P0.1, 22.9P1) fps ∼13%
AMD Radeon RX 6600M, R7 5800H
Lenovo Legion 5
27.7 (21.4min, 21.5P0.1, 22.3P1) fps ∼12%

注意事项

由于游戏测试非常耗时,而且经常受到安装或激活限制的制约,因此在发表本文时,我们只能为您提供部分基准测试结果。我们将在未来几天和几周内增加更多的显卡。

Overview

Show Restrictions
PosModel< PrevNext >Sons of the Forest
 Sons of the Forest (2023)
low
1920x1080
Low Preset
med.
1920x1080
Medium Preset
TAA
high
1920x1080
High Preset
TAA
ultra
1920x1080
Ultra Preset
TAA
QHD
2560x1440
Ultra Preset
TAA
4K
3840x2160
Ultra Preset
TAA
NVIDIA GeForce RTX 4090
154.85n4
149.65n4
144.3n4
145.3n3
139.05n4
131.5n5
AMD Radeon RX 7900 XTX
132.65n2
129.1n2
123.6n2
123n2
118.35n2
102.9n2
NVIDIA GeForce RTX 4080 Super
144.95n2
141.25n2
137n2
134.9n2
132.35n2
103.05n2
NVIDIA GeForce RTX 4080
118.1
111.5
108.5
103
92.3
AMD Radeon RX 7900 XT
122.1
116.8
113.3
111.6
108.3
86
NVIDIA GeForce RTX 4070 Ti
119.3
116.8
113.4
112.7
109.8
82.7
AMD Radeon RX 7900 GRE
117.05n2
112.5n2
110.1n2
107.9n2
106.35n2
76.6n2
AMD Radeon RX 6950 XT
128.5
123.5
119.8
117.6
116
77.6
NVIDIA GeForce RTX 4090 Laptop GPU
99.65n2
93.75n2
90.9n2
89.8n2
87.4n2
72.5
NVIDIA GeForce RTX 3090
132.4
127.8
123.4
120.3
109.4
72.8
AMD Radeon RX 7800 XT
120.2
115
112.7
109.7
107
69.4
NVIDIA GeForce RTX 4080 Laptop GPU
78.1
75
74.6
69.7
66.8
NVIDIA GeForce RTX 3080 12 GB
142.4
136.5
130.2
104.1
68.6
NVIDIA GeForce RTX 3080
120.9
116.5
114
112.4
98.5
69.5
NVIDIA GeForce RTX 4070
133
126.3
122.5
120.1
99.9
59.7
AMD Radeon RX 6800
124.2
120.2
115.8
113.9
92.8
54.6
AMD Radeon RX 7700 XT
118.7
115.6
112.4
112.2
99.1
59
NVIDIA Titan RTX
130.8
118.4
113
112.2
87.4
55.7
NVIDIA GeForce RTX 4060 Ti 16G
122.3
111.8
109.5
108
84
51.7
PosModel< PrevNext >Sons of the Forest
low med. high ultra QHD 4K
NVIDIA GeForce RTX 4060 Ti 8G
120.4n3
109.9n3
105.6n3
103.1n3
81.9n3
49.6n3
NVIDIA GeForce RTX 3080 Ti Laptop GPU
91.7
87.8
85.7
84.6
74
53.8
NVIDIA GeForce RTX 4070 Laptop GPU
98.3
87.45n4
84.55n4
83.85n4
65.25n2
NVIDIA GeForce RTX 3070
114.7
104.4
103.3
102
82.3
50.5
AMD Radeon RX 6750 XT
119.5
113
108.8
105.7
79.3
45.5
AMD Radeon RX 6700 XT
122.7
110.5
105.9
104.1
74.3
42.5
NVIDIA GeForce RTX 3080 Laptop GPU
81.9
80.5
76.7
72.45n2
63.25n2
44.85n2
NVIDIA GeForce RTX 3060 Ti
123.7
101.5
95.1
94.1
73.7
45.1
Intel Arc A770
70.3
54.5
54.2
54
39.5
23
NVIDIA GeForce RTX 4060
107.1
92.3
88.4
86.8
65.5
38.2
AMD Radeon RX 7600
125.4
112
105.2
104.8
71.6
41.2
NVIDIA GeForce RTX 3070 Ti Laptop GPU
85
82.8
81.7
65.5
44.2
NVIDIA GeForce RTX 4060 Laptop GPU
80.1n2
79.1n3
73.3n3
71.8n3
64.2
AMD Radeon RX 6800M
59.2
56.5
54.6
53.1
49.9
39.9
AMD Radeon RX 6650 XT
126.5
97.7
92.5
90.4
64.4
35.4
NVIDIA GeForce RTX 3070 Laptop GPU
80.4
75.8
72.8
67.15n2
53.8n2
34.8n2
AMD Radeon RX 7600M XT
111.6
101.1
93.1
92.1
64.7
35.3
Intel Arc A750
65.5
51
50.5
49.7
36.7
21.7
NVIDIA Titan X Pascal
97.7
79.4
76.1
75.5
56
33.1
NVIDIA GeForce RTX 2070 Super (Desktop)
112.7
89.7
85.5
83.4
64.5
38.4
PosModel< PrevNext >Sons of the Forest
low med. high ultra QHD 4K
AMD Radeon RX 5700 XT (Desktop)
112.4
86.9
82.3
80
58.6
32.3
NVIDIA GeForce RTX 3060 Laptop GPU
83.8
70.5
65.9
65.4
51.1
31.9
AMD Radeon RX 7600S
93.2
81.4
78
76.7
Intel Arc A580
78.3
61.5
58
56.9
43.3
24.3
NVIDIA GeForce RTX 2060 Super (Desktop)
94.5
78.4
74.9
72.7
54.5
32.3
AMD Radeon RX 6600
105.4
82.9
78.9
76.8
53.8
29.3
AMD Radeon RX 5700 (Desktop)
100.4
73.3
71.2
69.3
50.6
28.8
AMD Radeon RX 6600M
78.2n3
74.2n3
70.1n3
69.7n3
50.3n3
27.7n3
NVIDIA GeForce RTX 3050
60.2
56.2
65.25n2
39.8
23.7
AMD Radeon RX 5600 XT (Desktop)
89.5
68.8
66.6
64.7
49.1
25.7
NVIDIA GeForce GTX 1660 Super (Desktop)
71.6
55
52.9
51.4
37.2
20.4
AMD Radeon RX 6500 XT
40.4
29.4
26.7
24.5
18.1
10.5
AMD Radeon RX 5500 XT (Desktop)
59.7
44.9
47.7
44.7
32
17.9
NVIDIA GeForce RTX 4050 Laptop GPU
73.85n2
74.75n4
71.5n4
49.2n2
24.5
Intel Arc A730M
53.8n2
37.25n2
35.35n2
32.65n2
15.4
NVIDIA GeForce GTX 1660 Ti Mobile
72.9
55.8
55
54
NVIDIA GeForce RTX 3050 Ti Laptop GPU
54.9
38.8
35.4
33.3
25.6
NVIDIA GeForce GTX 1660 (Desktop)
67.2
51.2
47.6
47.1
33.2
18.1
NVIDIA GeForce GTX 1650 Super (Desktop)
57.8
41.7
39.3
39
26.7
14.5
NVIDIA GeForce RTX 3050 4GB Laptop GPU
50.1
31.5
30.8
28.9
PosModel< PrevNext >Sons of the Forest
low med. high ultra QHD 4K
NVIDIA GeForce GTX 1060 Mobile
48.2
35
34.5
33.9
NVIDIA GeForce GTX 1650 Ti Mobile
58.3
38.3
35.9
34.1
Intel Arc A370M
27.6
17.4
11.5
11.4
AMD Radeon RX 5500M
44.4
35.9
35.4
34.5
NVIDIA GeForce RTX 2050 Mobile
35.9
34.1
33
NVIDIA GeForce GTX 1650 Mobile
53
32.3
31.5
30.1
Intel Arc A380
35.9
26.9
25.4
25.1
Intel Arc A310
29.9
18.9
17.4
17.1
Intel Arc 8-Cores iGPU
29.8
21
19.4
18.7
Intel Arc 7-Cores iGPU
24.9
17.3
15.5
15.2
AMD Radeon 780M
32.8
21.1
19.8
19.4
AMD Radeon 680M
33.7
24.9
23.6
23.3
NVIDIA GeForce GTX 1050 Mobile
35.8
22.2
20.8
AMD Radeon 760M
32
19.6
19
AMD Radeon 660M
24.7
16.7
15.3
14.8
AMD Radeon RX 560X (Laptop)
34.7
21.5
20.3
20.2
Intel Iris Xe Graphics G7 96EUs
9.53
8.29n2
7.91n2
7.66n2
NVIDIA GeForce MX350
26.2
13.8
12.8
AMD Radeon RX 550 (Laptop)
12.1
8.73
NVIDIA GeForce MX250
20
10.7
PosModel< PrevNext >Sons of the Forest
low med. high ultra QHD 4K
Intel Iris Xe Graphics G7 80EUs
10.2
7.74
AMD Radeon 540X
12.5
Intel UHD Graphics 64EUs (Alder Lake 12th Gen)
12.4
Intel Iris Plus Graphics G7 (Ice Lake 64 EU)
8.54
AMD Radeon RX Vega 10
16
10.5
Intel UHD Graphics Xe 32EUs (Tiger Lake-H)
9.56
Intel UHD Graphics 770
9.64
AMD Radeon RX Vega 8 (Ryzen 4000/5000)
18.7
11.7
NVIDIA GeForce MX130
7.88
AMD Radeon RX Vega 8 (Ryzen 2000/3000)
12.3
Intel Iris Graphics 550
5.37
AMD Radeon RX Vega 6 (Ryzen 4000/5000)
16.1
9.3
AMD Radeon RX Vega 6 (Ryzen 2000/3000)
8.35
AMD Radeon RX Vega 5
12.1
7.57
Intel UHD Graphics G1 (Ice Lake 32 EU)
4.7
Intel UHD Graphics 620
4.44
AMD Radeon R5 M255
7.37
AMD Radeon RX Vega 3
8.66
(-) * Smaller values are better. / n123 Number of benchmarks for this median value / * Approximate position


Legend
5Stutters – This game is very likely to stutter and have poor frame rates. Based on all known benchmarks using the specified graphical settings, average frame rates are expected to fall below 25fps
May Stutter – This graphics card has not been explicitly tested on this game. Based on interpolated information from surrounding graphics cards of similar performance levels, stutters and poor frame rates are expected.
30Fluent – Based on all known benchmarks using the specified graphical settings, this game should run at or above 25fps
40Fluent – Based on all known benchmarks using the specified graphical settings, this game should run at or above 35fps
60Fluent – Based on all known benchmarks using the specified graphical settings, this game should run at or above 58fps
May Run Fluently – This graphics card has not been explicitly tested on this game. Based on interpolated information from surrounding graphics cards of similar performance levels, fluent frame rates are expected.
?Uncertain – This graphics card experienced unexpected performance issues during testing for this game. A slower card may be able to achieve better and more consistent frame rates than this particular GPU running the same benchmark scene.
Uncertain – This graphics card has not been explicitly tested on this game and no reliable interpolation can be made based on the performances of surrounding cards of the same class or family.
The value in the fields displays the average frame rate of all values in the database. Move your cursor over the value to see individual results.

Test systems

设备 显卡 处理器 内存 操作系统
笔记本
微星Titan GT77 12UHS NvidiaGeForce RTX 3080 Ti @175 W TGP (16 GB GDDR6) Intel Core i9-12900 2 x 16 GB DDR5 Windows 11
联想Legion 5 Pro NvidiaGeForce RTX 3060 @140 W TGP (6 GB GDDR6) Intel Core i7-12700H 2 x 8 GB DDR5 Windows 11
华硕ROG Strix G15 AMD Radeon RX 6800M(12 GB GDDR6) AMD Ryzen 9 5900HX 2 x 8 GB DDR4 Windows 11
联想Legion 5 AMD Radeon RX 6600M(8 GB GDDR6) AMD Ryzen 7 5800H 2 x 8 GB DDR4 Windows 11
华硕ROG Zephyrus G14 AMD Radeon 680M AMD Ryzen 9 6900HS 2 x 16 GB DDR5 Windows 11
塔式电脑
定制 I AMD Radeon RX 7900 XTX (24 GB GDDR6)
AMD Radeon RX 7900 XT (20 GB GDDR6)
MSIGeForce RTX 3080 (10 GB GDDR6X)
MSIGeForce RTX 3070 (8 GB GDDR6)
Intel Core i9-12900K 2 x 16 GB DDR4 Windows 11
Custom II PalitGeForce RTX 4090 GameRock OC (24 GB GDDR6X)
Nvidia GeForce RTX 3090 FE (24 GB GDDR6X)
Nvidia GeForce RTX 3060 Ti (8 GB GDDR6X)
NvidiaTitan RTX (24 GB GDDR6)
Nvidia GeForce RTX2070 Super (8 GB GDDR6)
Nvidia GeForce RTX 2060 Super (8 GB GDDR6)
KFA2 GeForce GTX 1660 Super (6 GB GDDR6)
PNY GeForce GTX 1660 (6 GB GDDR5)
KFA2 GeForce GTX 1650 Super (4 GB GDDR6)
AMD Radeon RX6950 XT (16 GB DDR6)
AMD Radeon RX 6800 (16 GB DDR6)
AMD Radeon RX 6700 XT (12 GB DDR6)
AMD Radeon RX 6650 XT (8 GB GDDR6)
AMD Radeon RX 6600 (8 GB GDDR6)
AMD RadeonRX 5700 XT (8 GB GDDR6)
AMD Radeon RX 5700 (8 GB GDDR6)
AMD Radeon RX 5600 XT (6 GB GDDR6)
AMD Radeon RX 5500 XT (8 GB GDDR6)
AMD Ryzen 9 7950X 2 x 16 GB DDR5 Windows 11
Custom III NvidiaGeForce RTX 2080 Super FE Intel Core i9-11900K 2 x 8 GB DDR4 Windows 11
迷你电脑
Zotac ZBOX CI665 Nano Intel Iris Xe Graphics G7 (96 CUs) Intel Core i7-1165G7 2 x 8 GB DDR4 Windows 11
Morefine S500+ AMD Radeon RX Vega 8 AMD Ryzen 9 5900HX 2 x 16 GB DDR4 Windows 11
Minisforum NUCXi7 NvidiaGeForce RTX 3070 @125 W TGP (8 GB GDDR6) Intel Core i7-11800H 2 x 8 GB DDR4 Windows 11
Minisforum HX99G AMD Radeon RX 6600M @100 W TGP (8 GB GDDR6) AMD Ryzen 9 6900HX 2 x 16 GB DDR5 Windows 11
4K显示器 Nvidia驱动 AMD驱动
Philips Brilliance 329P9H, Gigabyte M32U ForceWare 528.49 Adrenalin 23.2.2
Please share our article, every link counts!
> Notebookcheck中文版(NBC中国) > 评测 > 森林之子 "回顾。笔记本电脑和台式机基准测试
Florian Glaser, 2023-03-16 (Update: 2023-03-16)