结论 - 兼顾性能和便携性
ZBook X G1i 16 介于速度较慢的 ZBook 8 系列和速度更快但重量更重的 ZBook Fury 系列之间。从外观上看,与去年的 ZBook Power 16 G11的用户体验保持一致,包括功能丰富的端口和舒适的按键。电池续航时间和性能都有所提高,但在运行高负载时,功耗也略有增加。
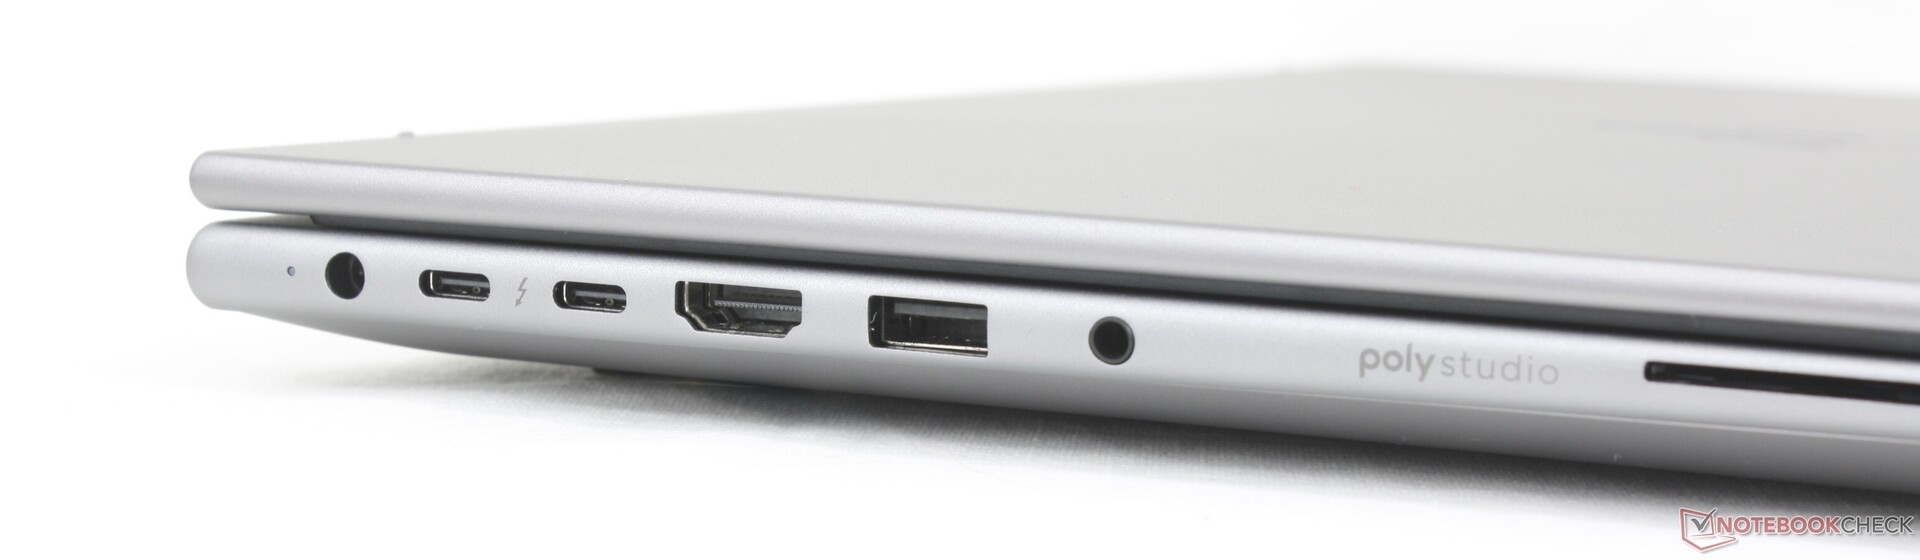
该机仍缺少一些功能。虽然高端 CPU 和 GPU 选项是意料之中的,但该机型缺乏对 OLED、HDR 和 ECC RAM 的支持,这可能会让一小部分用户感到不满。左侧边缘的端口感觉很拥挤,尤其是右侧边缘没有 USB-C 端口。喜欢强调 CPU 和 GPU 性能的用户还会发现,系统运行时的噪音并不比上一代产品小。
对于未来的机型,我们希望看到 ZBook X 系列不再使用专有的交流电桶充电,同时提供更好的 CPU Turbo Boost 性能。处理器在受压时会很快达到 100 摄氏度以上,这表明采用更强的冷却解决方案是有益的。
Pros
Cons
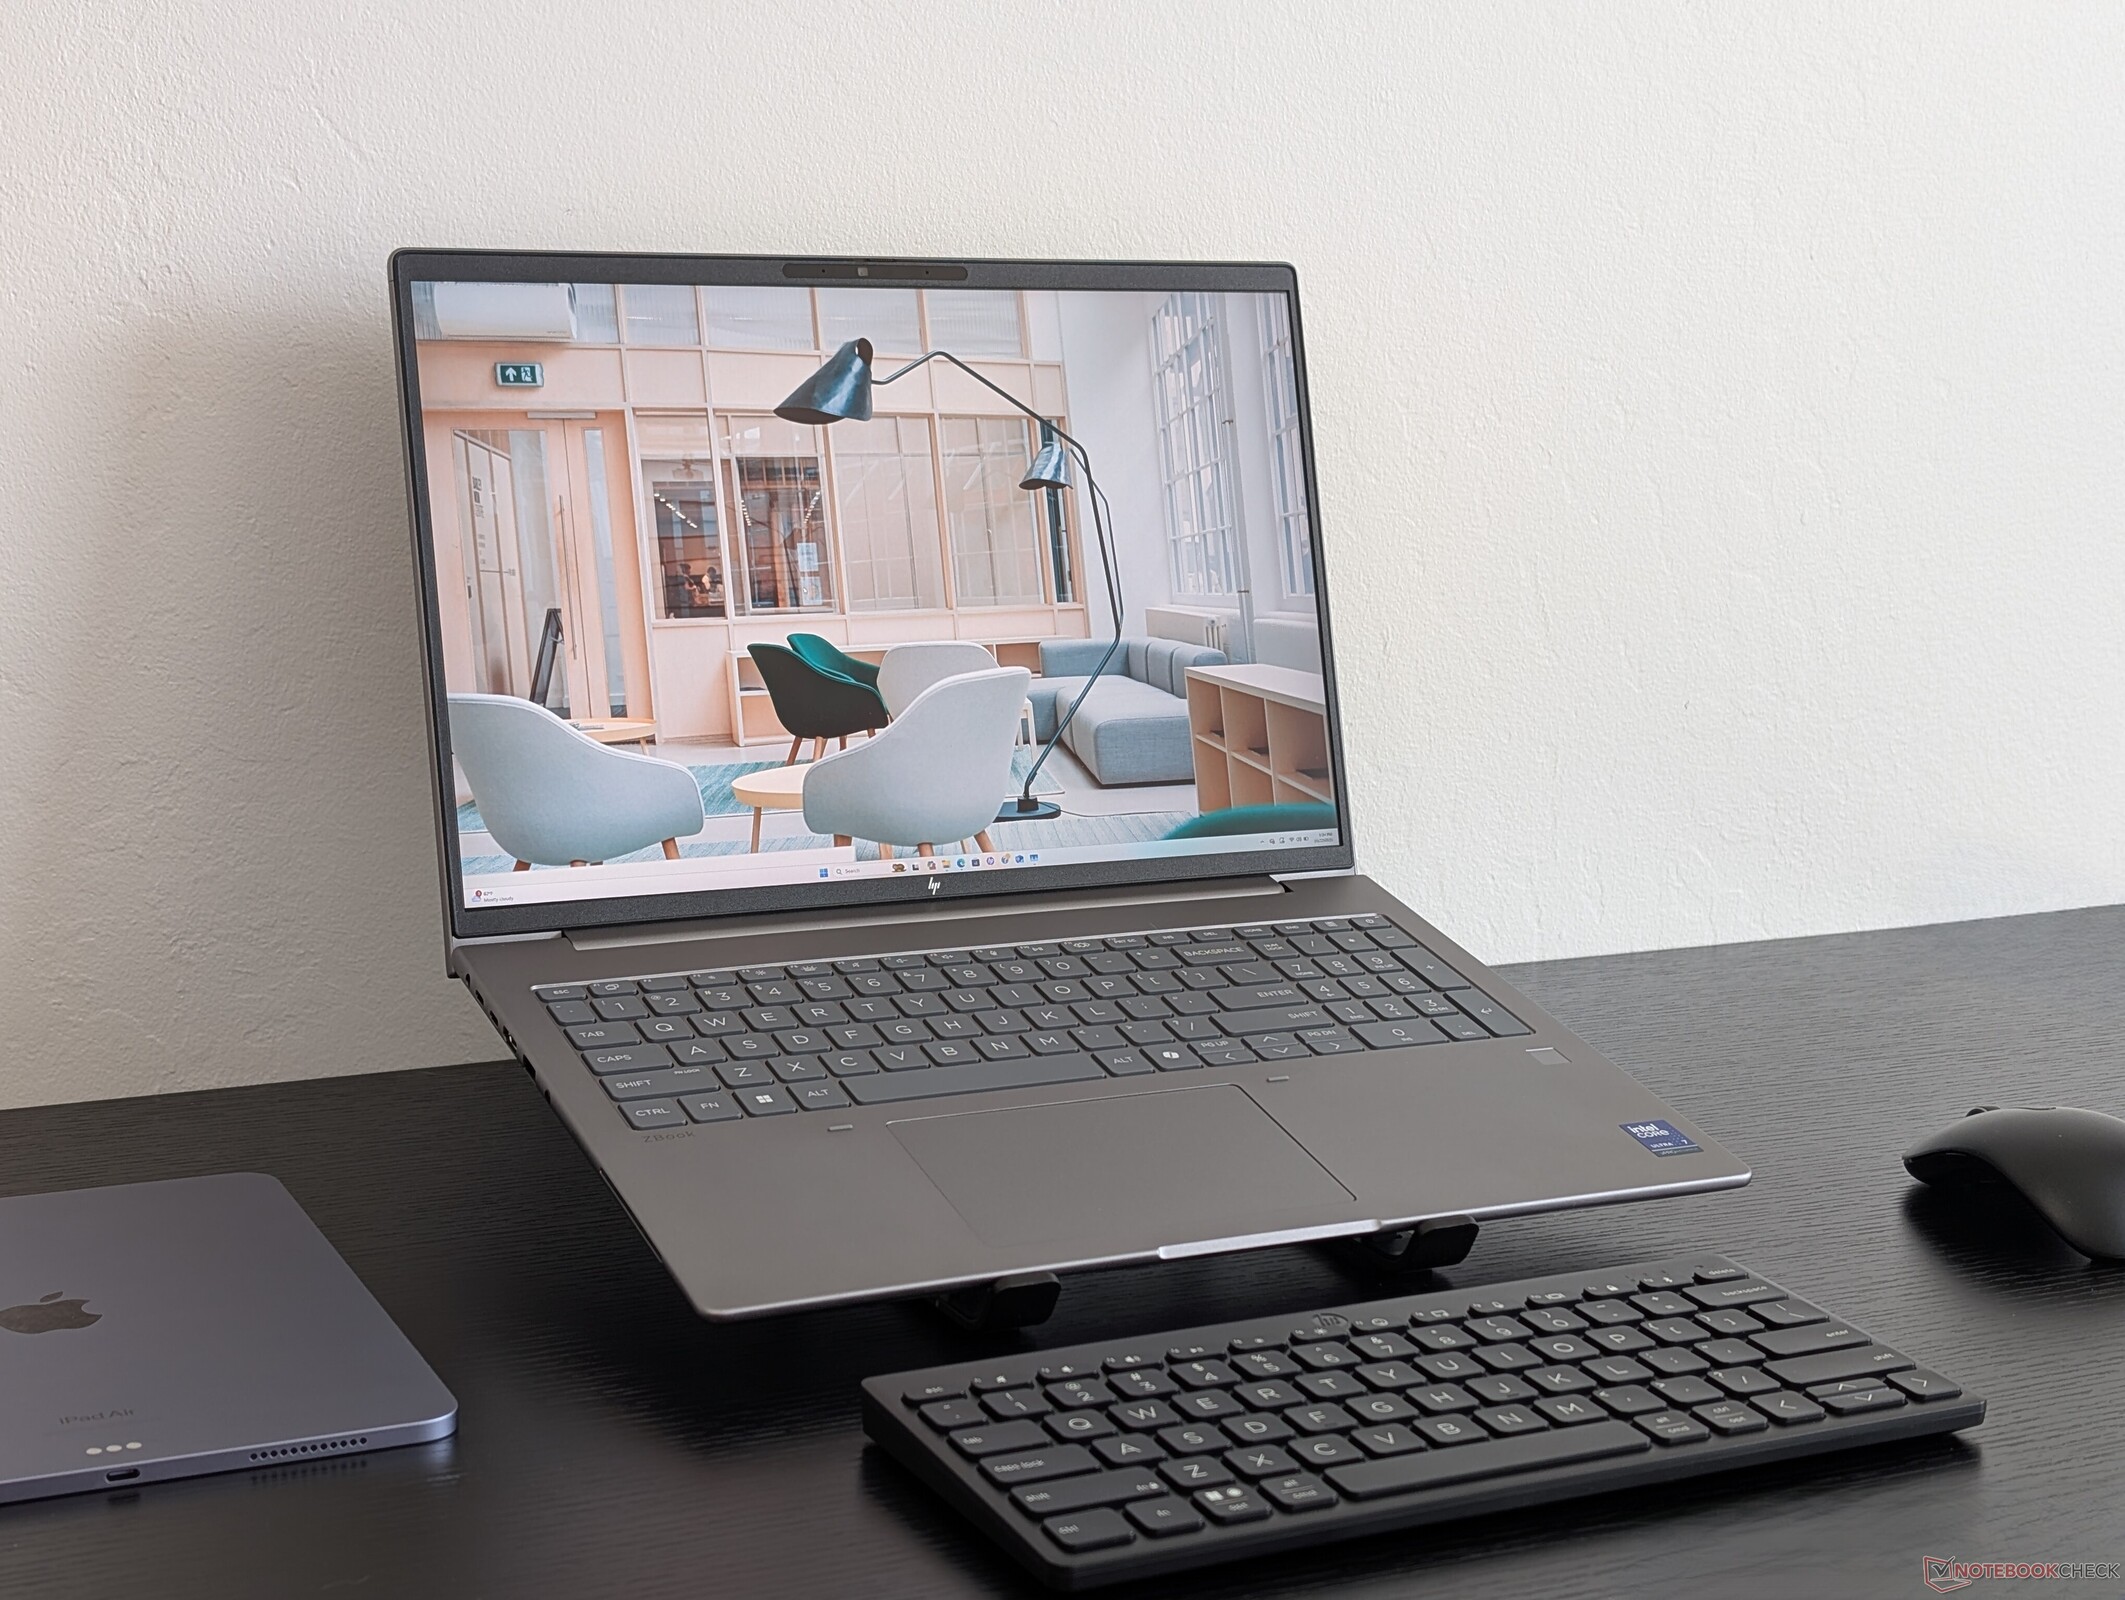
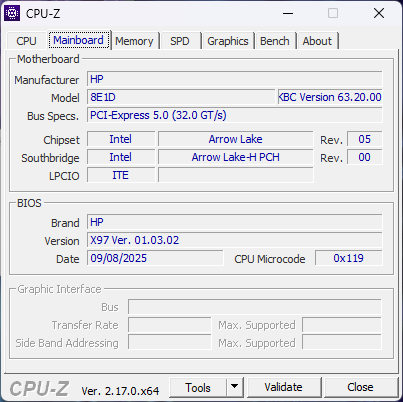
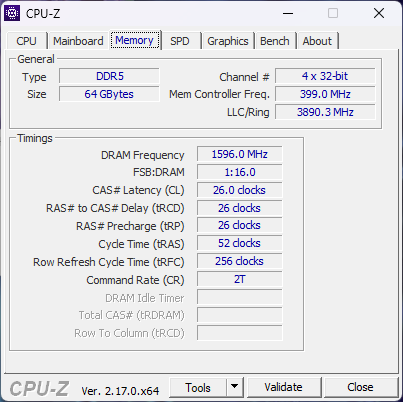
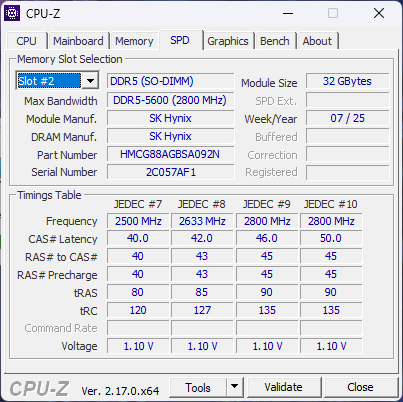
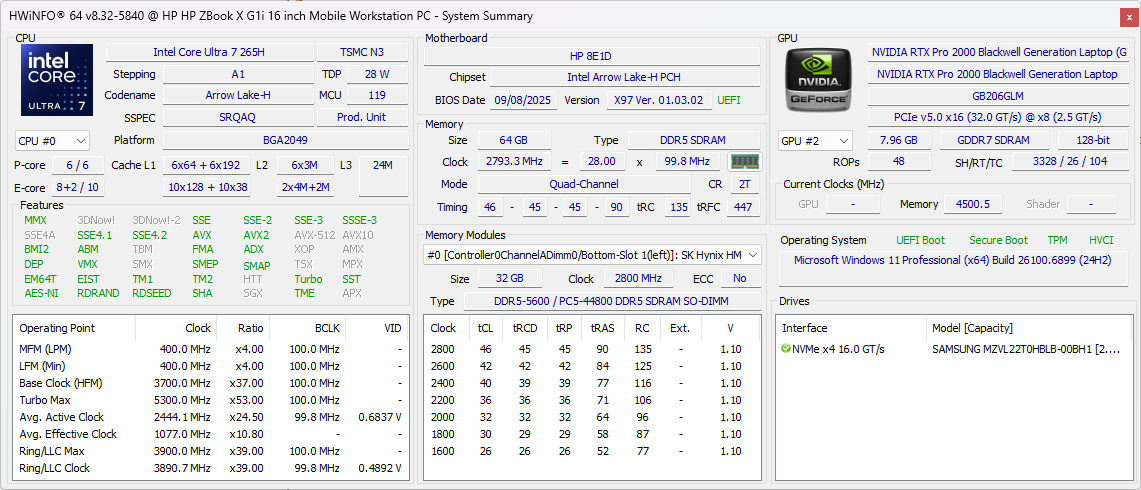
惠普 ZBook X G1i 16 是一款超薄移动工作站,配备中端 Arrow Lake-H 处理器和 Nvidia RTX Pro Blackwell GPU 图形处理器。它的最高配置为酷睿 Ultra 9 285H CPU 和 RTX Pro 2000 GPU,而更厚的 ZBook Fury G1i 16 可以配备更快的 Arrow Lake-HX 和 RTX Pro 5000 图形处理器。
我们的测试机是中间配置,配备 Core Ultra 7 265H、2K 1600p120 显示屏和 RTX Pro 2000 GPU,售价约为 2700 美元。可用配置的完整列表可在这里查看。.
ZBook X G1i 16 的替代产品包括其他超薄型 16 英寸工作站,如 戴尔Precision 5690, 联想 ThinkPad P16s G2或 微星 CreatorPro 系列.ZBook X G1i 16 不应与 ZBook 8 G1i 16 混淆,后者是低端版本,最高可使用较慢的 RTX Pro 500 GPU。
更多惠普评论:
规格
案例
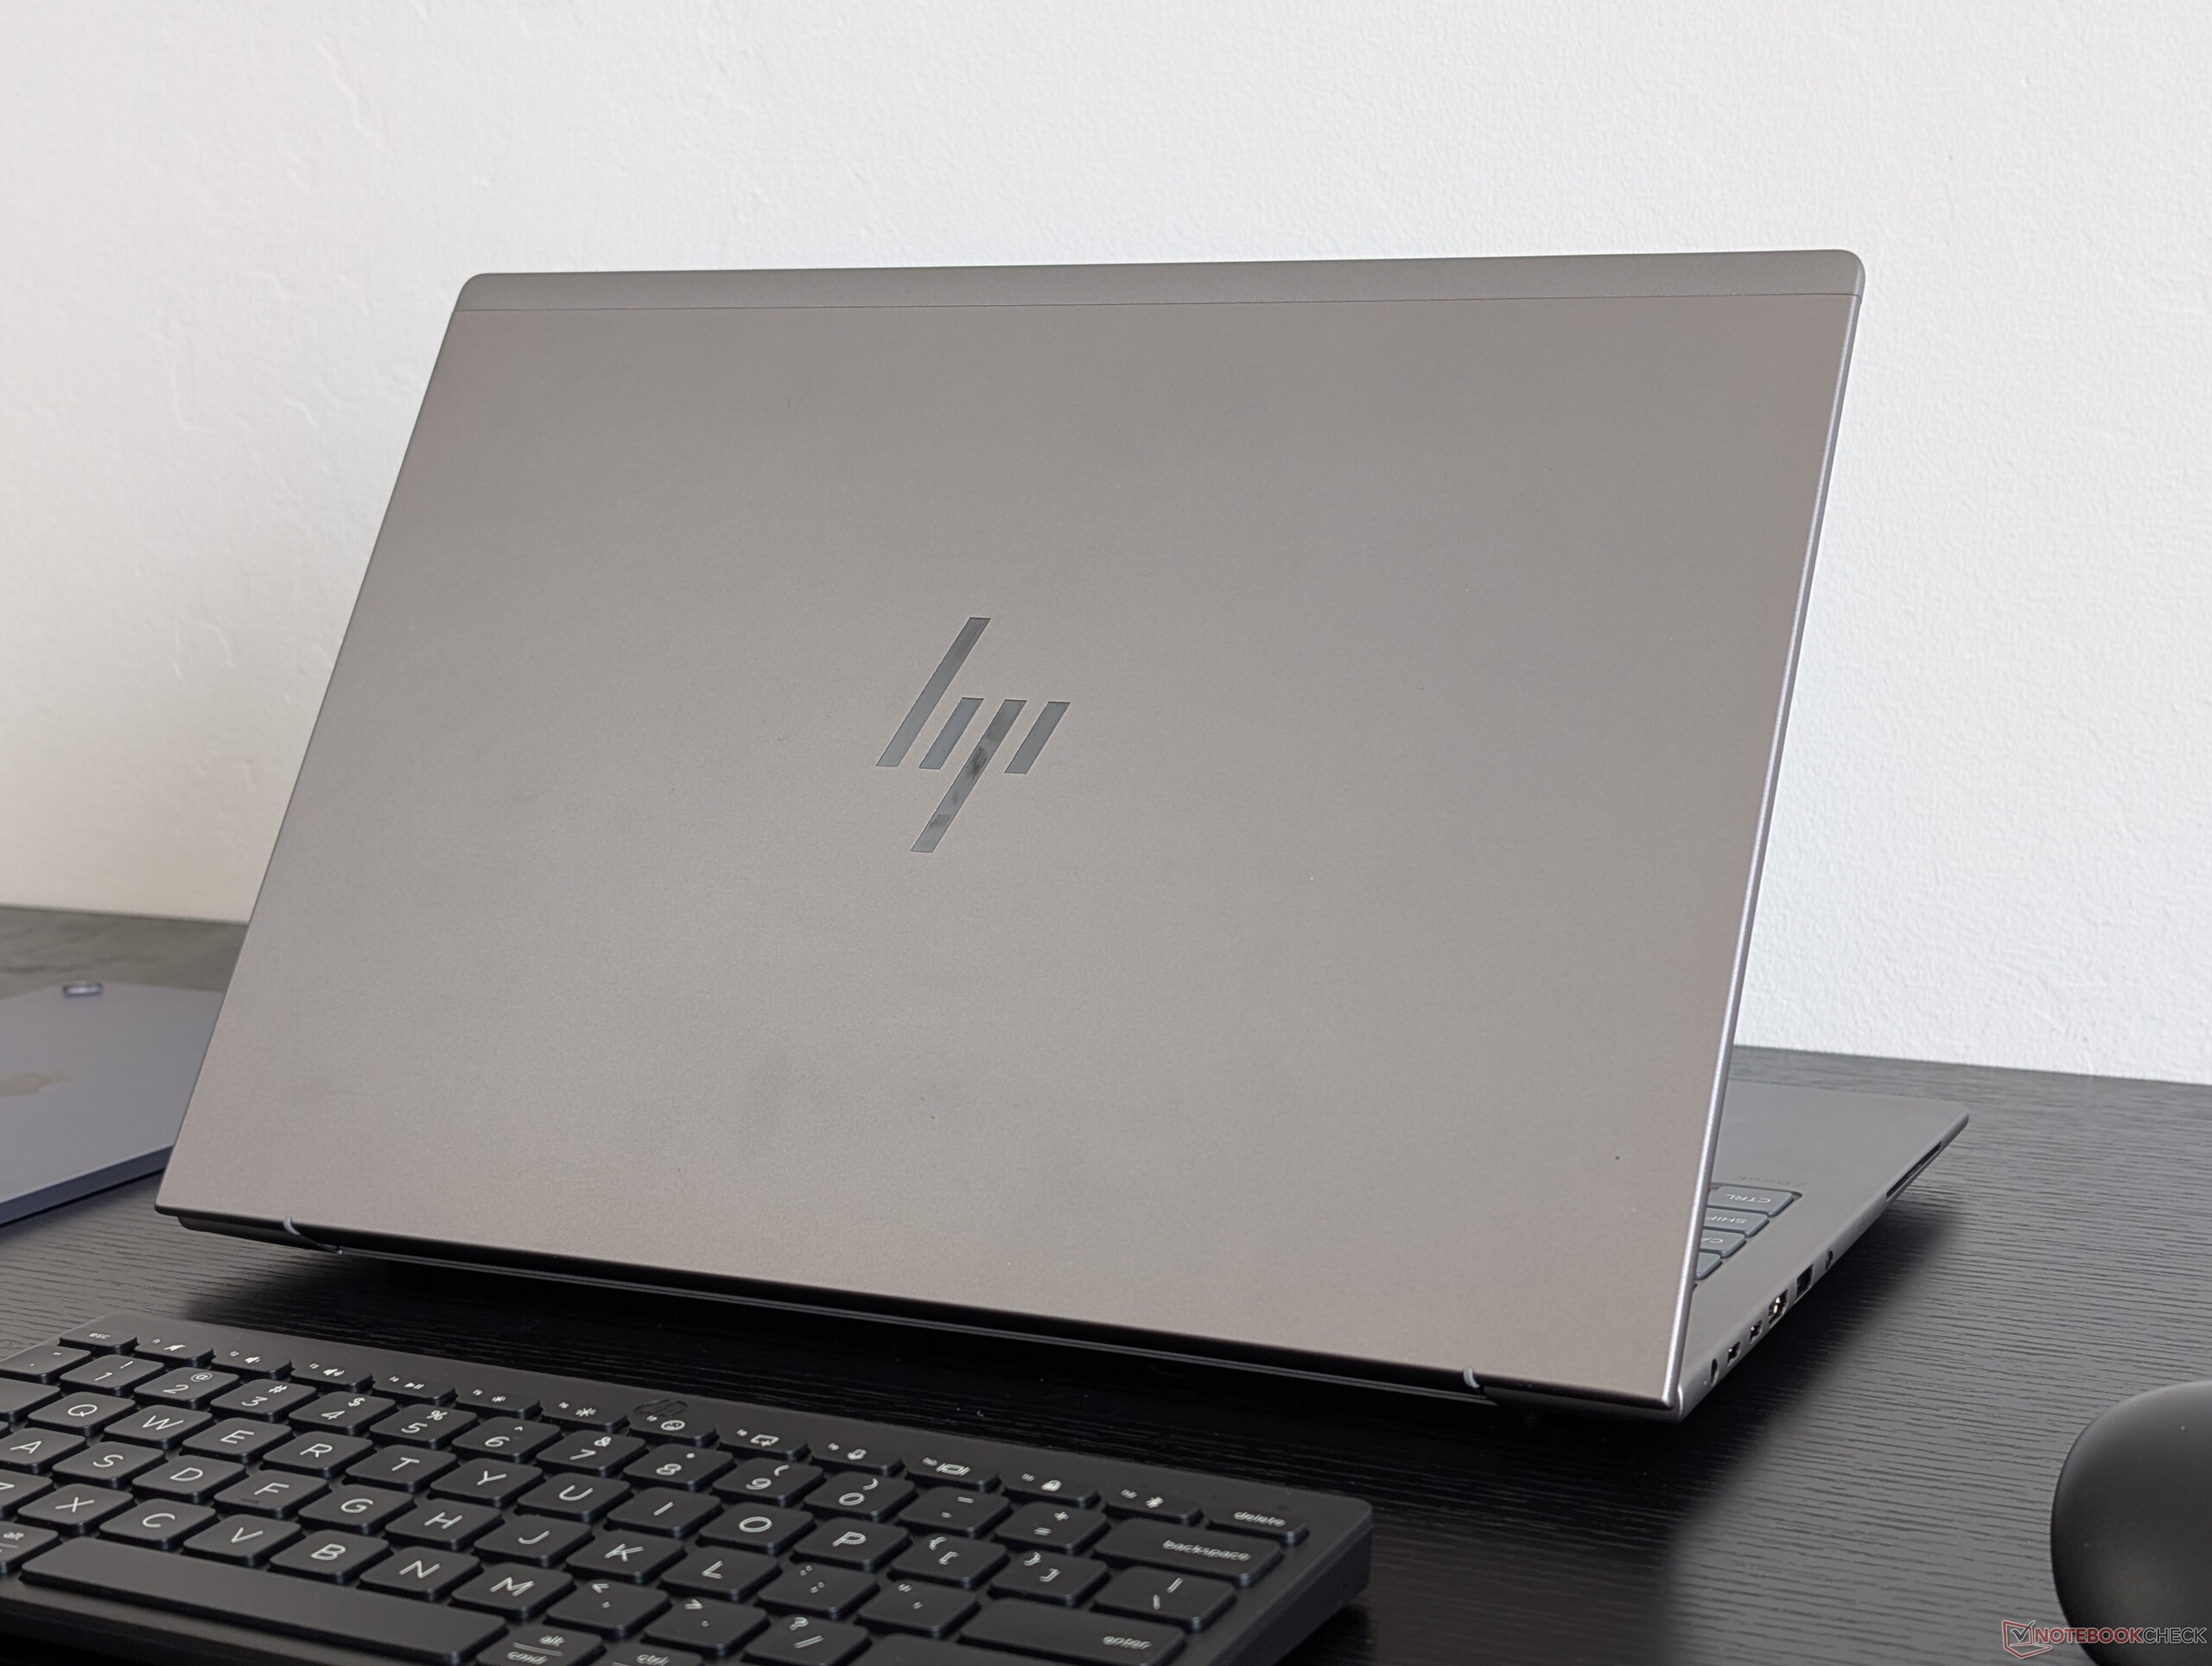
ZBook X G1i 16 直接取代了去年的 ZBook Power 16 G11尽管名称有所改变,但两款机型在外观上几乎完全相同。物理特性几乎保持不变,包括重量、尺寸和端口,因此我们对 ZBook Power 16 G11 的评论仍然适用于 ZBook X G1i 16。
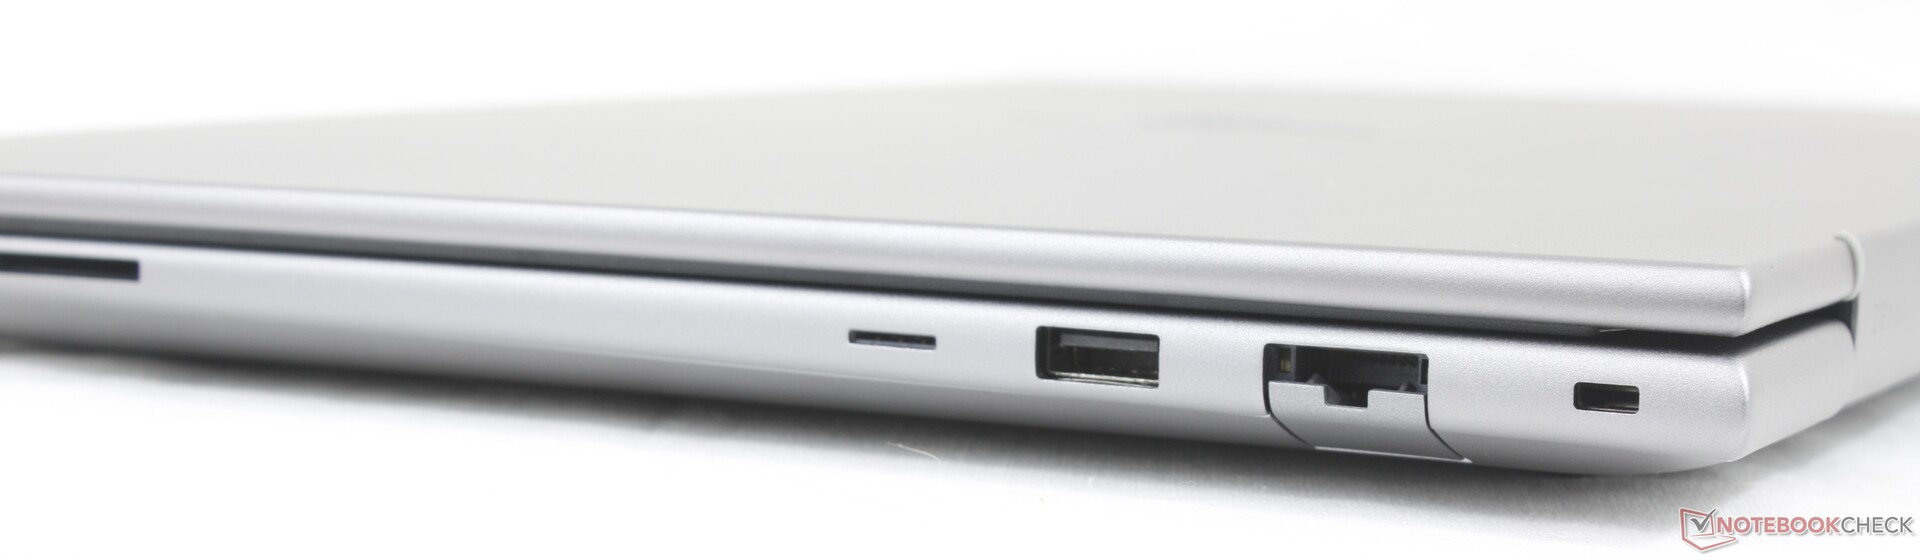
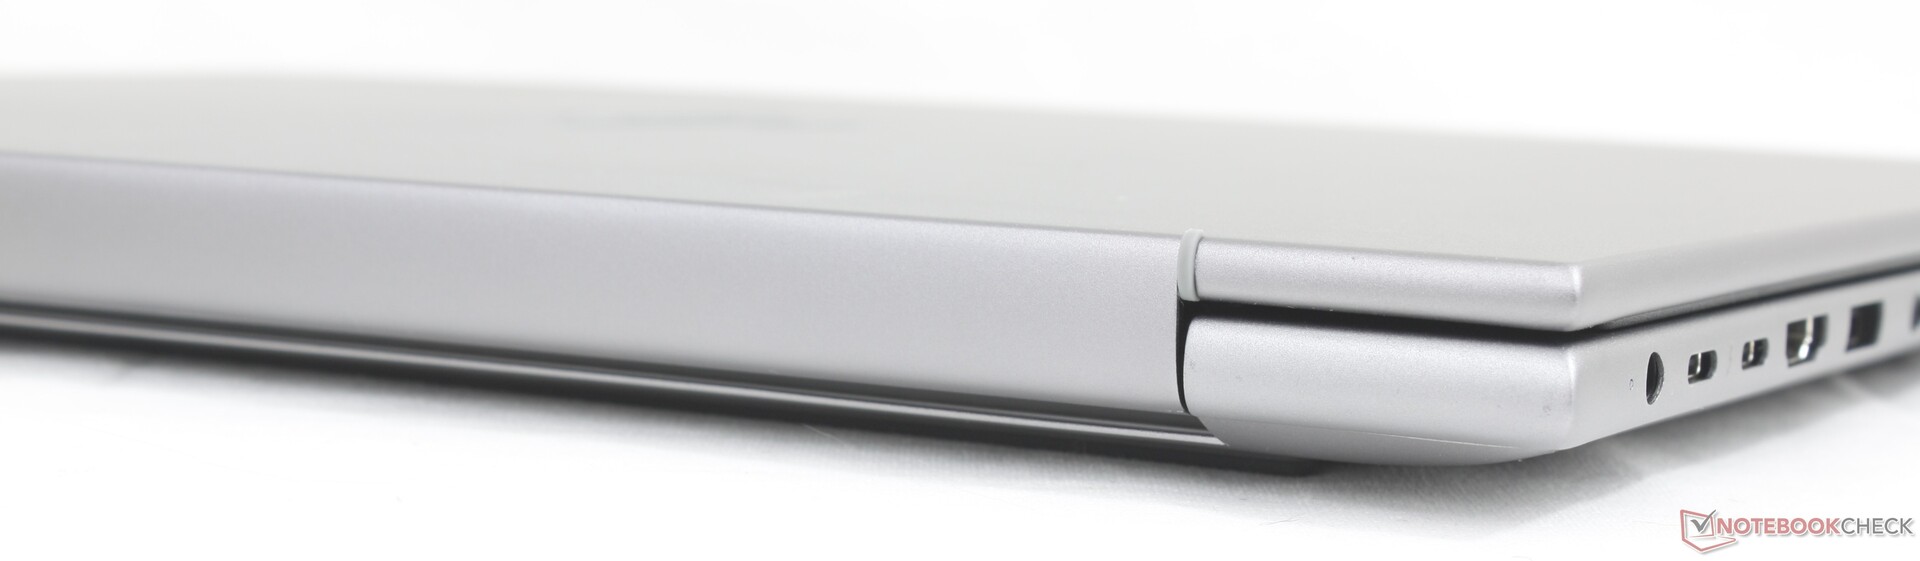
连接性
端口选项比去年的 ZBook Studio 16 G11有一个例外。虽然 ZBook X G1i 16 增加了 RJ-45、HDMI 和更多 USB-A 端口,但却取消了一个 USB-C 端口。此外,我们希望看到全面过渡到 USB-C 充电,就像最近的 戴尔 Pro Max 16 Plus.

SD 读卡器
| SD Card Reader | |
| average JPG Copy Test (av. of 3 runs) | |
| HP ZBook X G1i 16 (Toshiba Exceria Pro SDXC 64 GB UHS-II) | |
| HP ZBook Power 16 G11 A (Toshiba Exceria Pro SDXC 64 GB UHS-II) | |
| Lenovo ThinkPad P16 Gen 2 (Toshiba Exceria Pro SDXC 64 GB UHS-II) | |
| Dell Pro Max 16 Plus (Toshiba Exceria Pro SDXC 64 GB UHS-II) | |
| maximum AS SSD Seq Read Test (1GB) | |
| HP ZBook Power 16 G11 A (Toshiba Exceria Pro SDXC 64 GB UHS-II) | |
| HP ZBook X G1i 16 (Toshiba Exceria Pro SDXC 64 GB UHS-II) | |
| Dell Pro Max 16 Plus (Toshiba Exceria Pro SDXC 64 GB UHS-II) | |
| Lenovo ThinkPad P16 Gen 2 (Toshiba Exceria Pro SDXC 64 GB UHS-II) | |
交流
网络摄像头
网络摄像头选项包括 200 万像素或 500 万像素,带红外和物理快门。


可持续性
所有 HP Z 工作站都通过了 EPEAT 金牌或银牌认证,并在制造过程中采用了海洋塑料和回收塑料或金属。
配件和保修
包装盒内除了交流适配器和文件外,没有其他附件。如果通过制造商网站购买,则标配三年有限保修。
输入设备
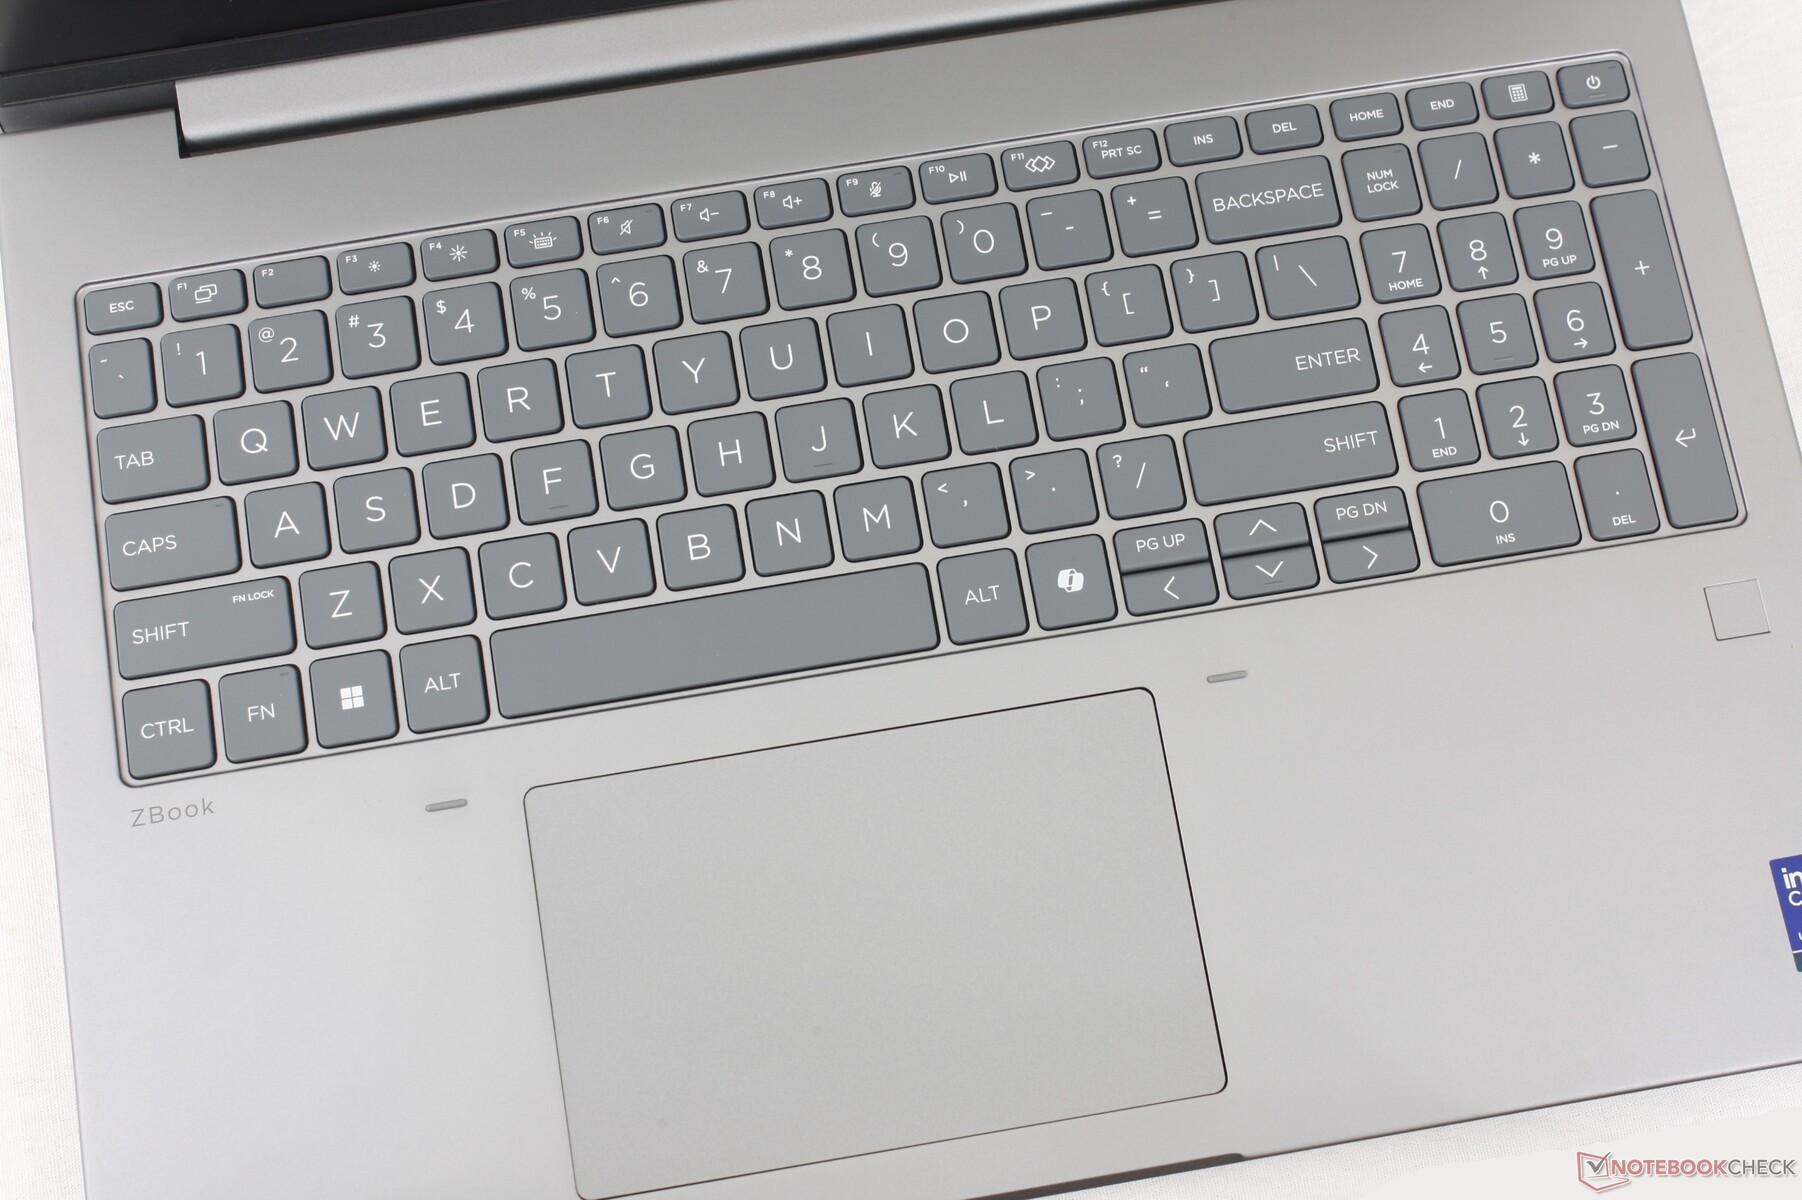
打字体验与旧款 ZBook Fury 16 G9键盘布局在各代 ZBook 中变化不大。不过,在 ZBook X G1i 16 上,惠普取消了专用鼠标按钮,但没有增加表面积(12 x 8 厘米,而 ZBook Fury 16 G9 为 12.4 x 8.3 厘米)。
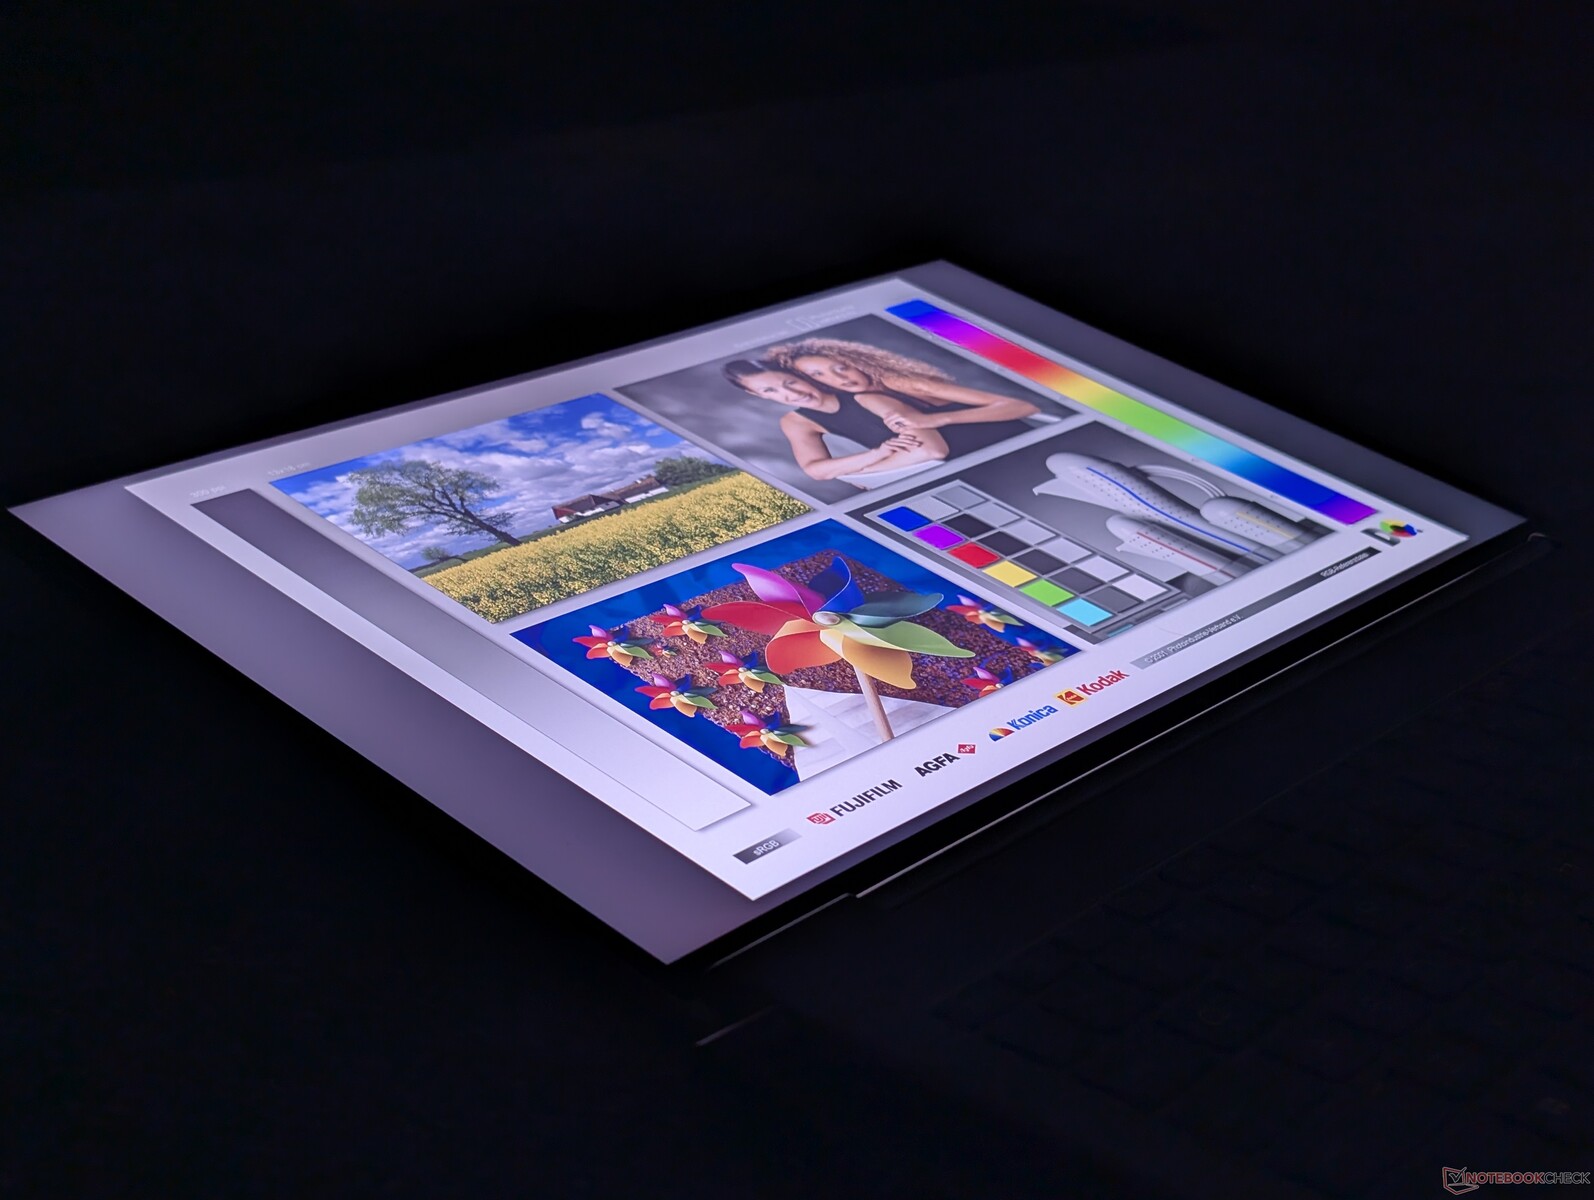
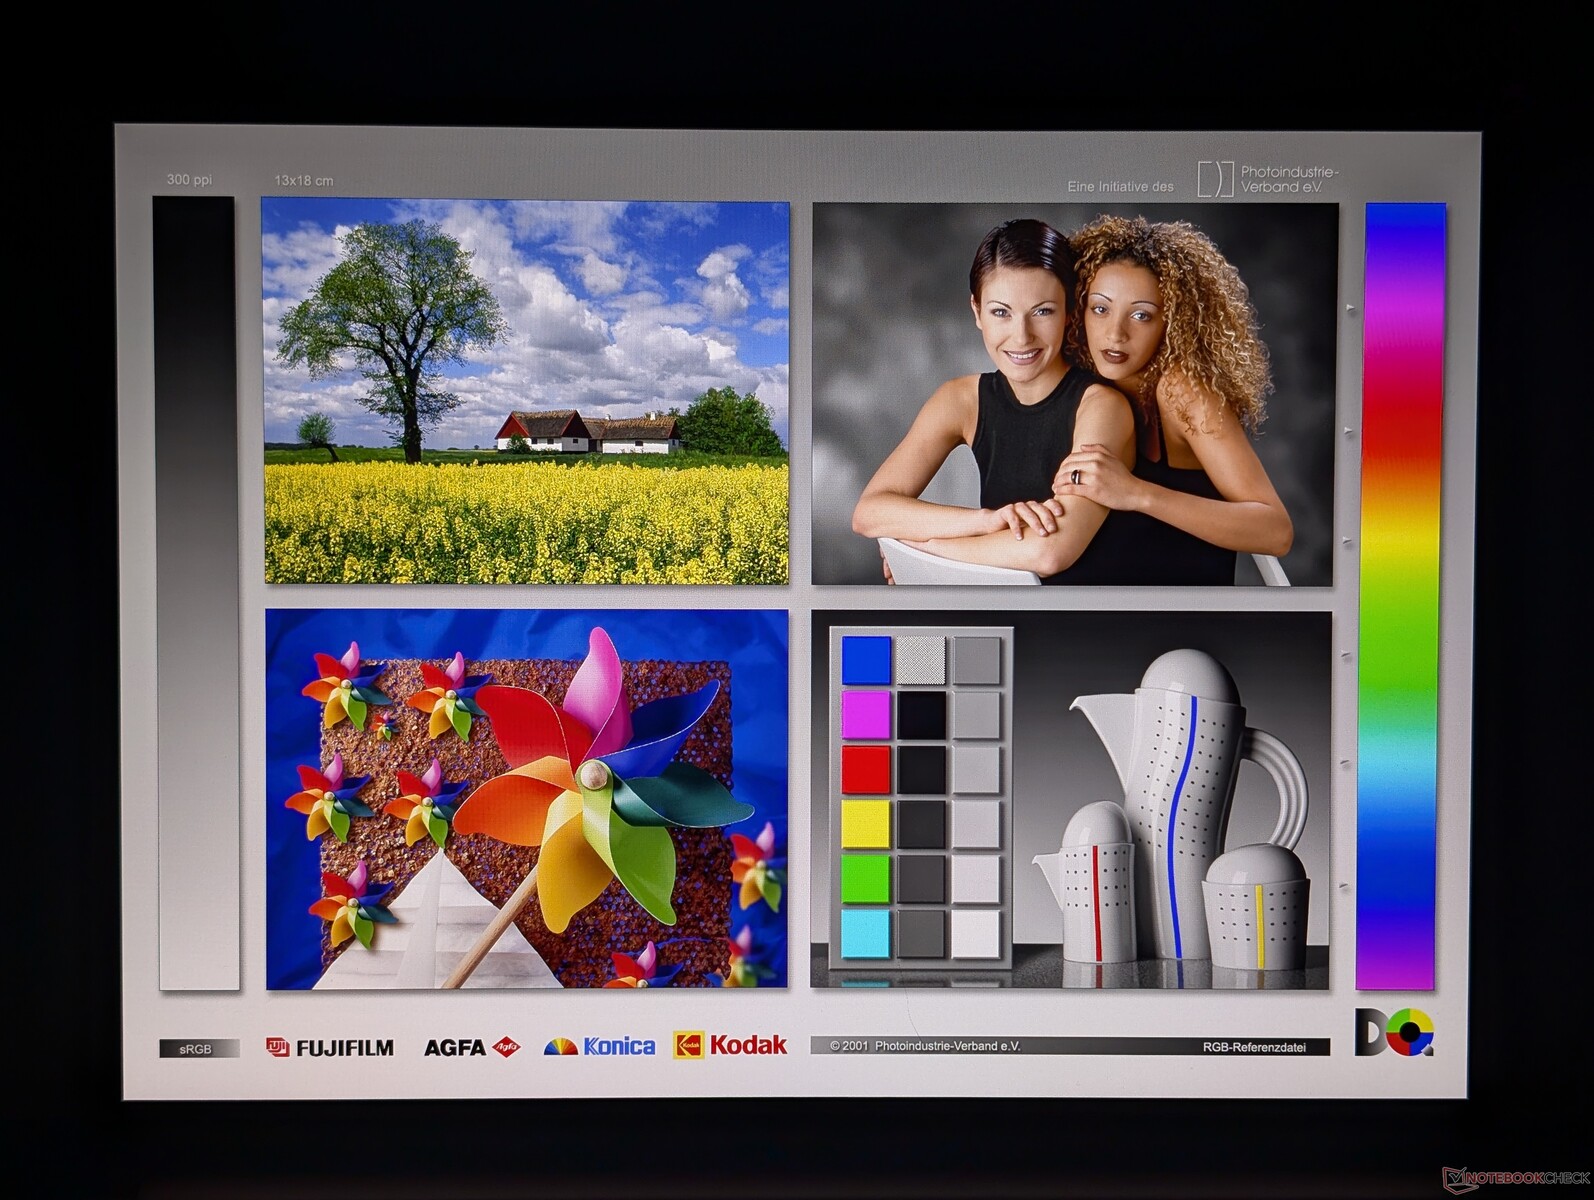
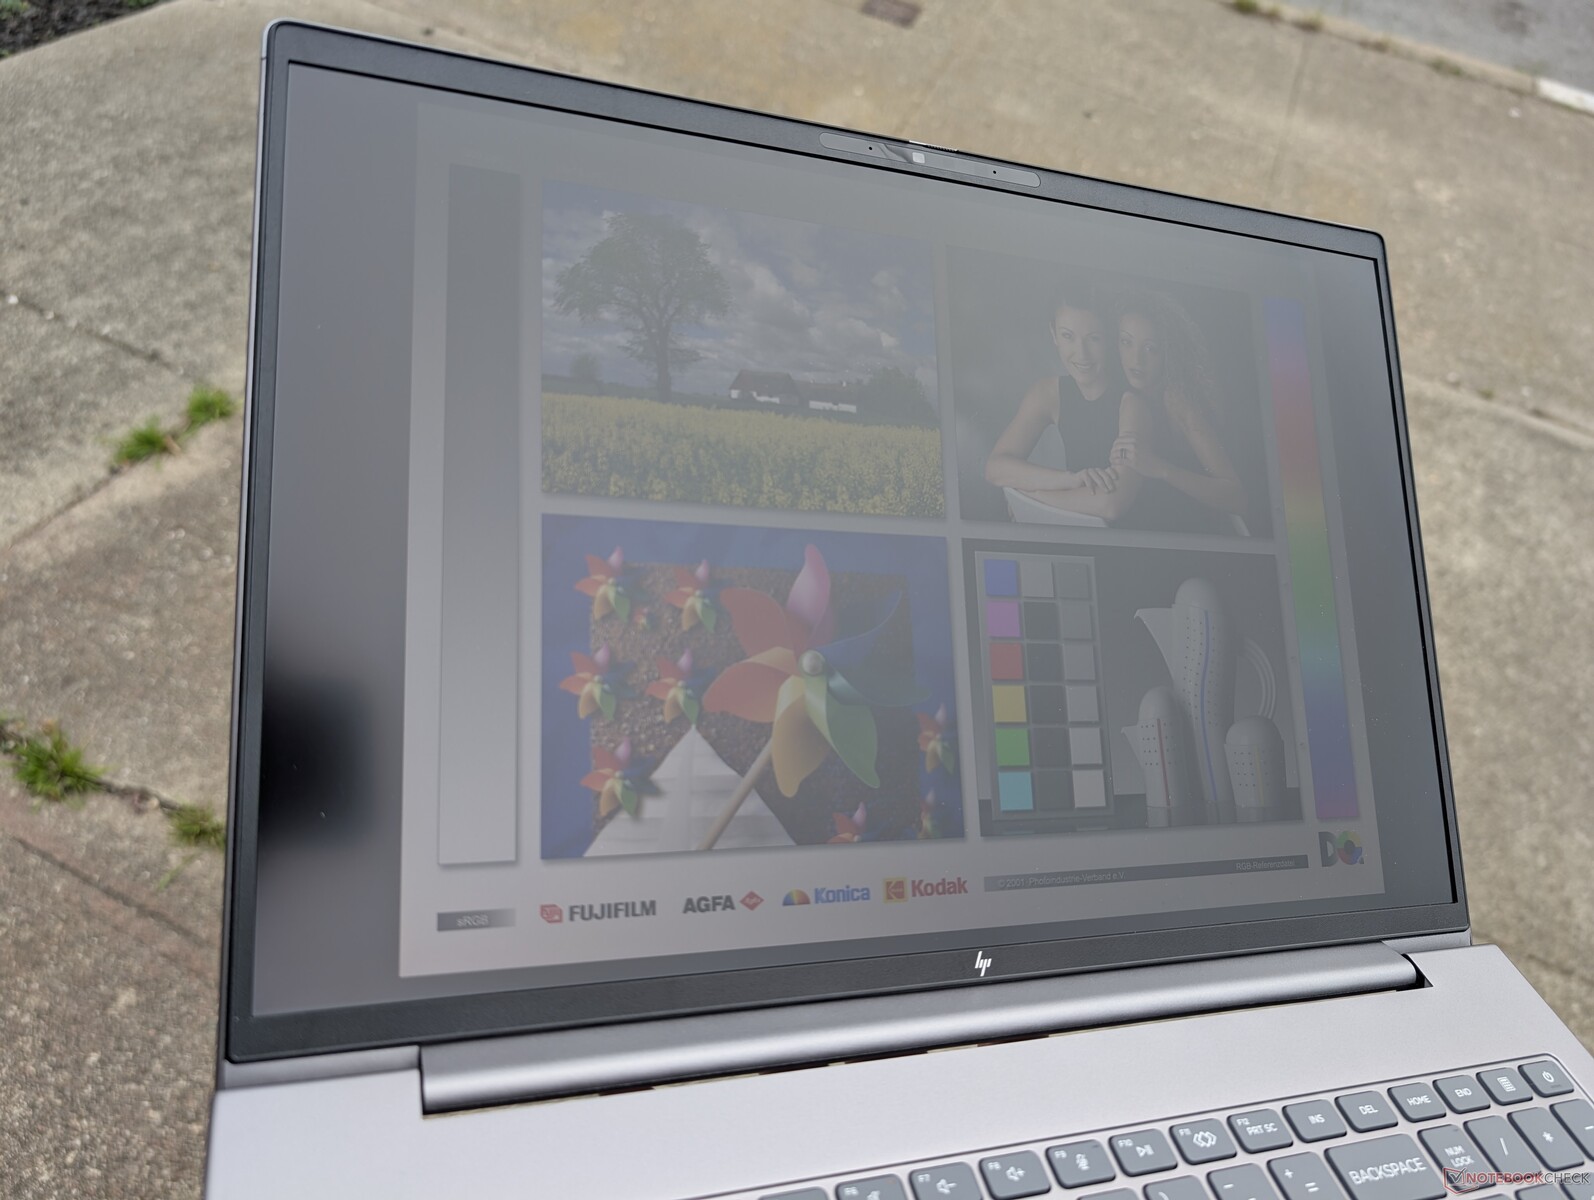
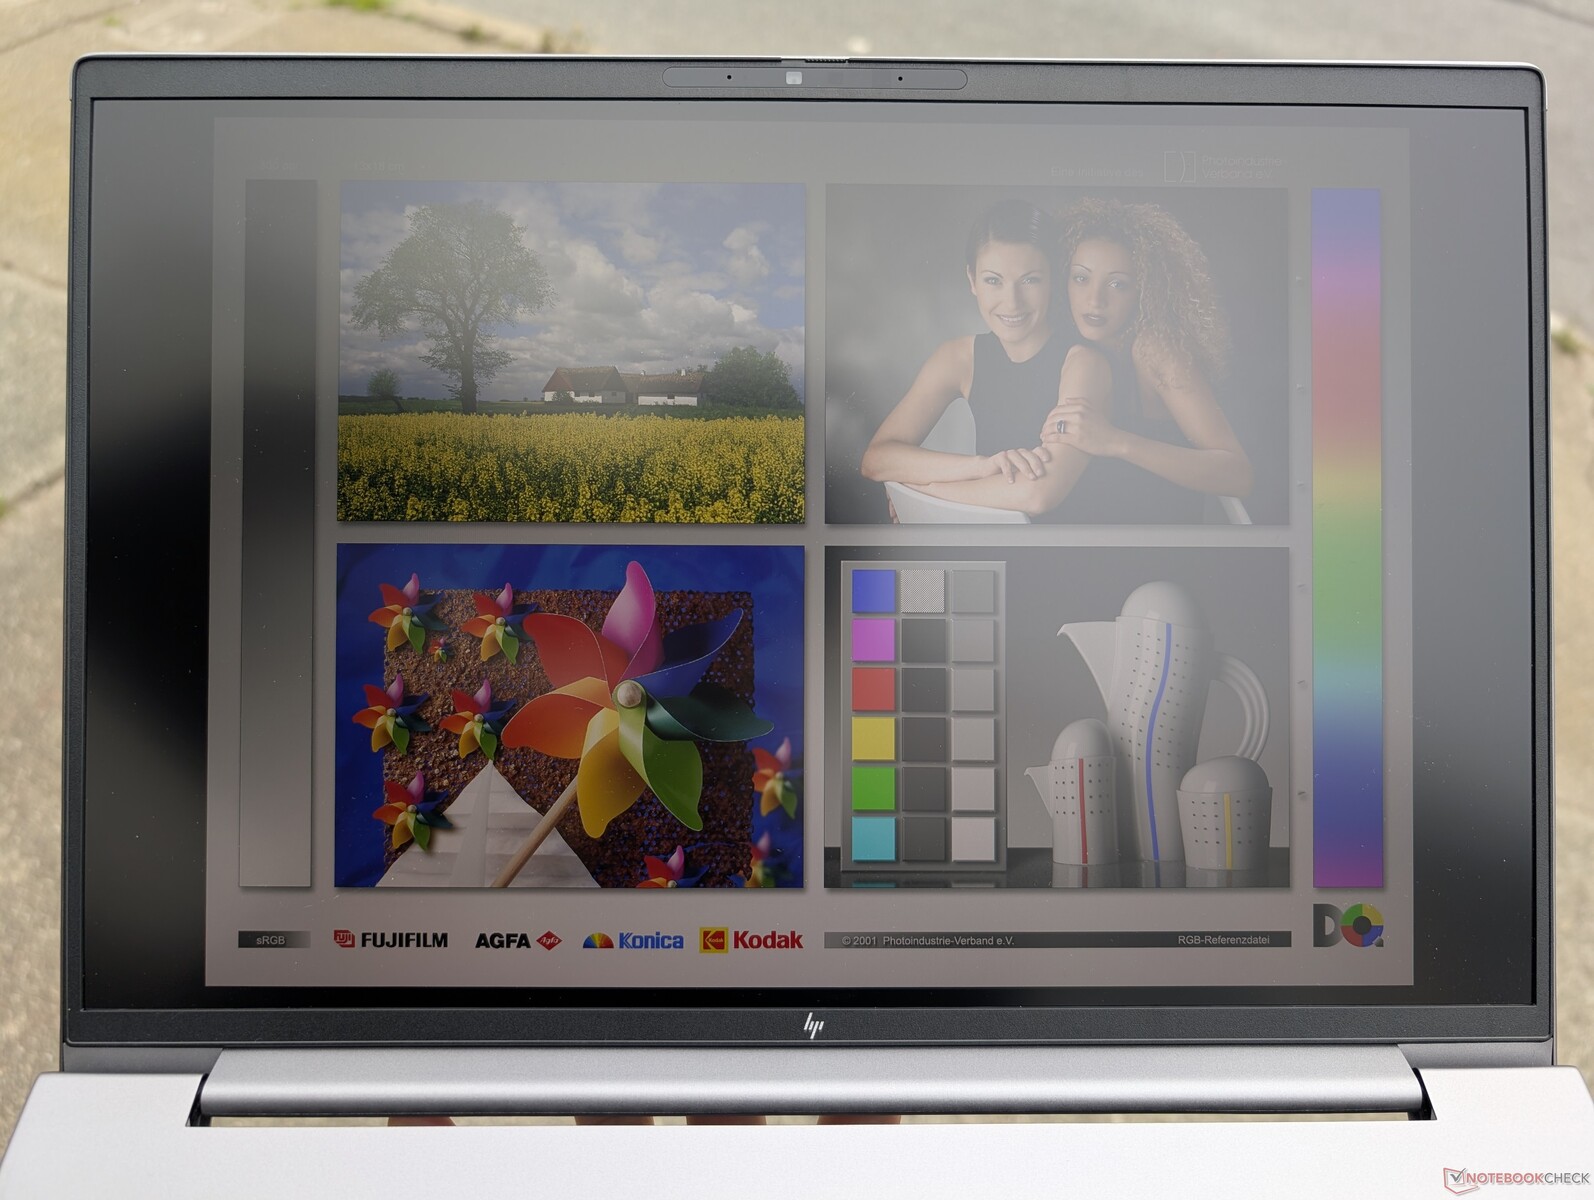
显示屏
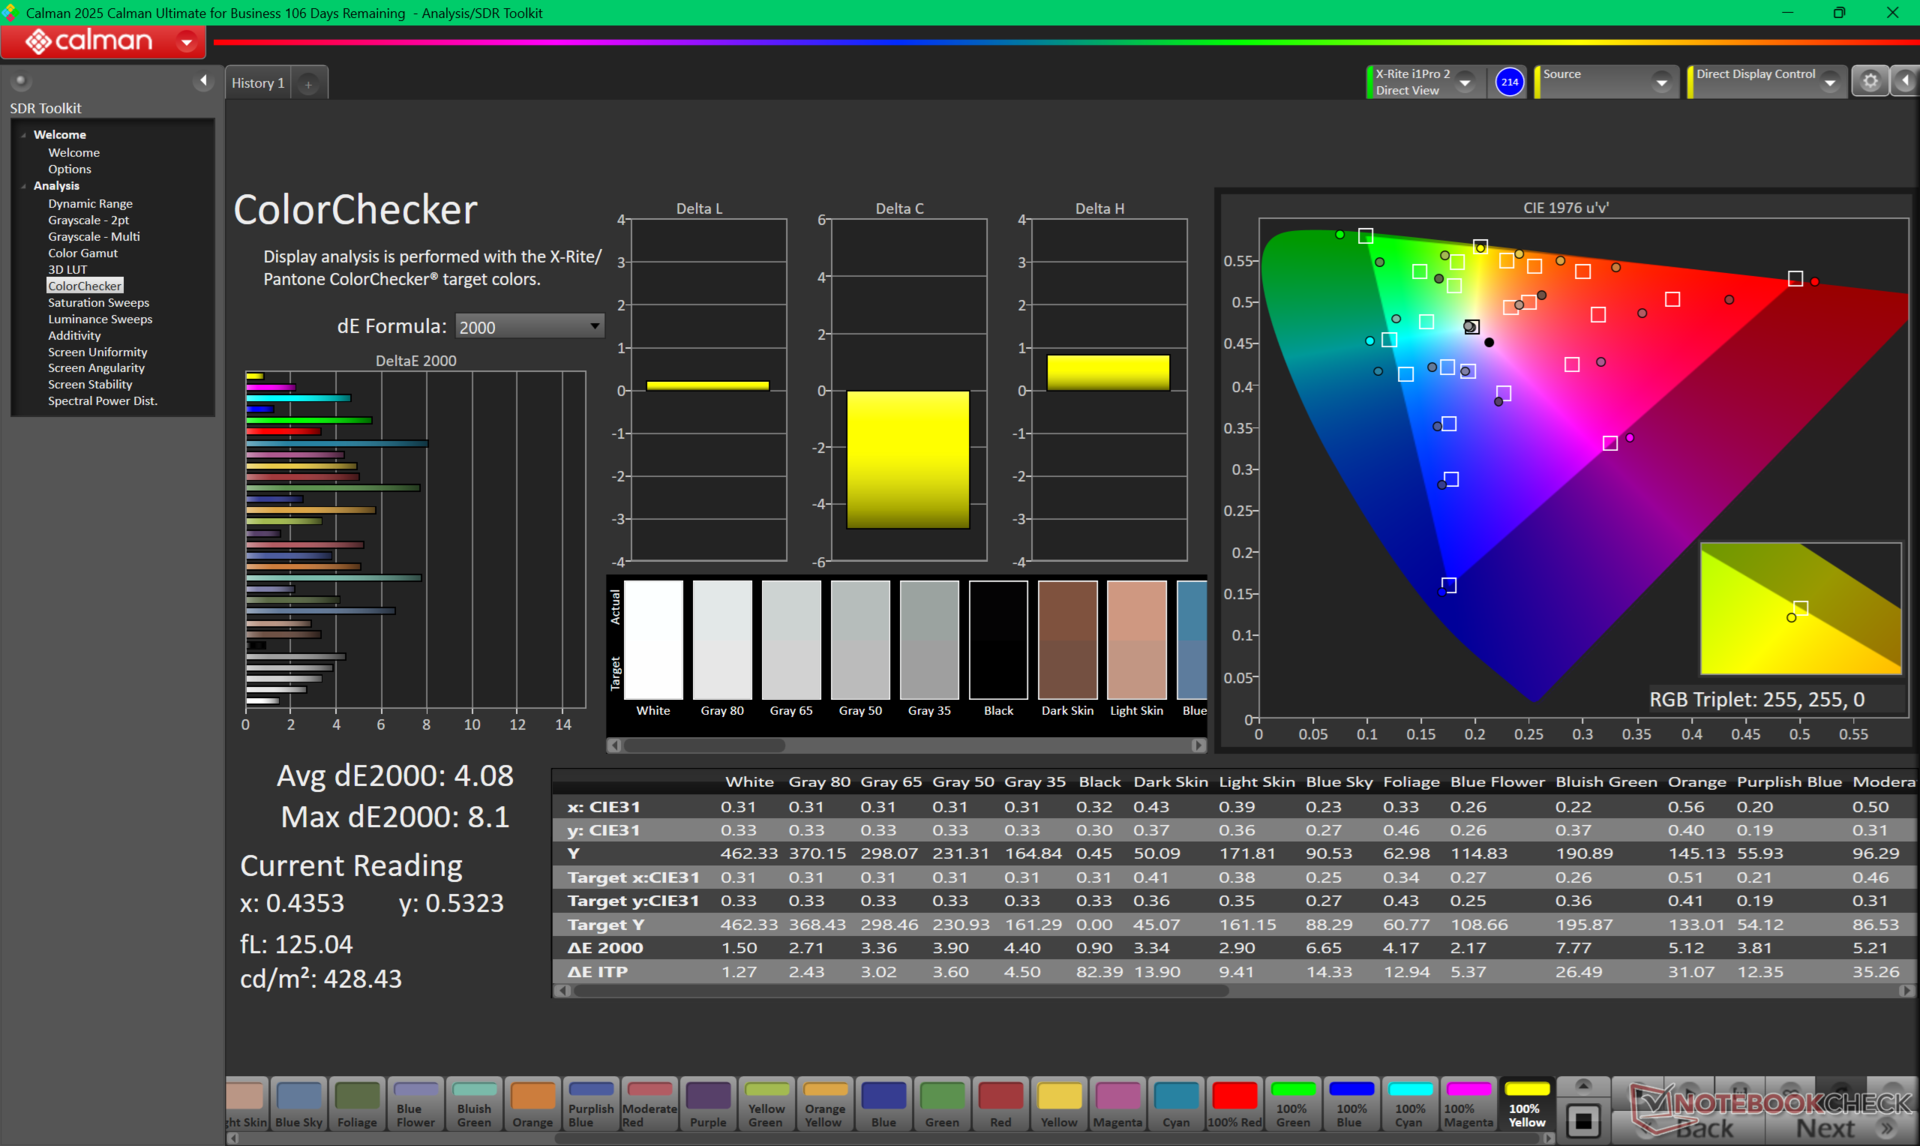
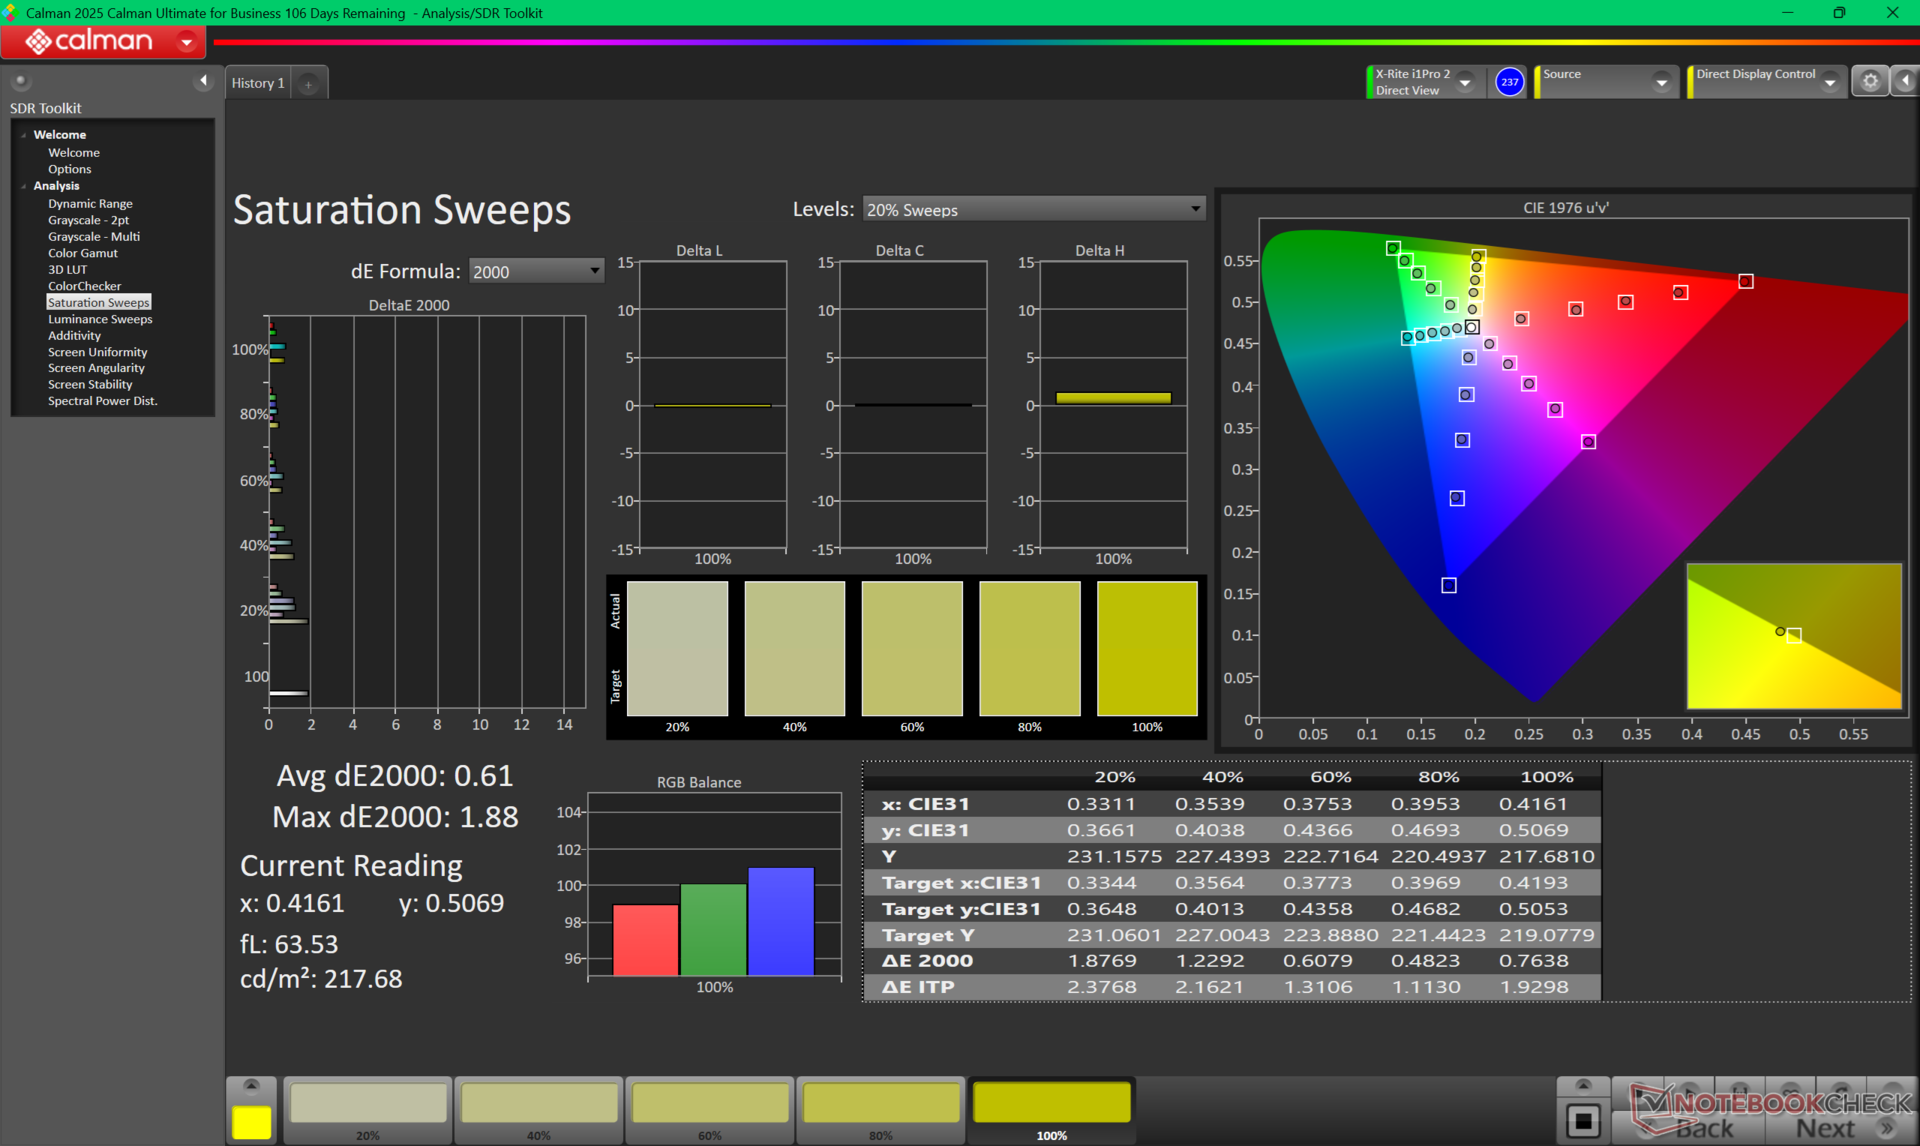
有六种 IPS 显示屏可供选择,亮度从 1200p60 和 300 尼特到 2400p120 和 500 尼特不等,具有完整的 DCI-P3 色彩。我们的测试机配备的是中间的 1600p 120 Hz 雾面显示屏,它仍然提供 P3 色彩,但没有触摸屏或 Sure View 功能。事实上,后者只在 1200p 非触摸面板上提供。
请注意,该机型没有 OLED 选项或 HDR 支持。如果色彩准确度很重要,我们建议避免选择一些低端的 1200p 产品,因为它们只能提供约 60% 的 sRGB 色彩。

| |||||||||||||||||||||||||
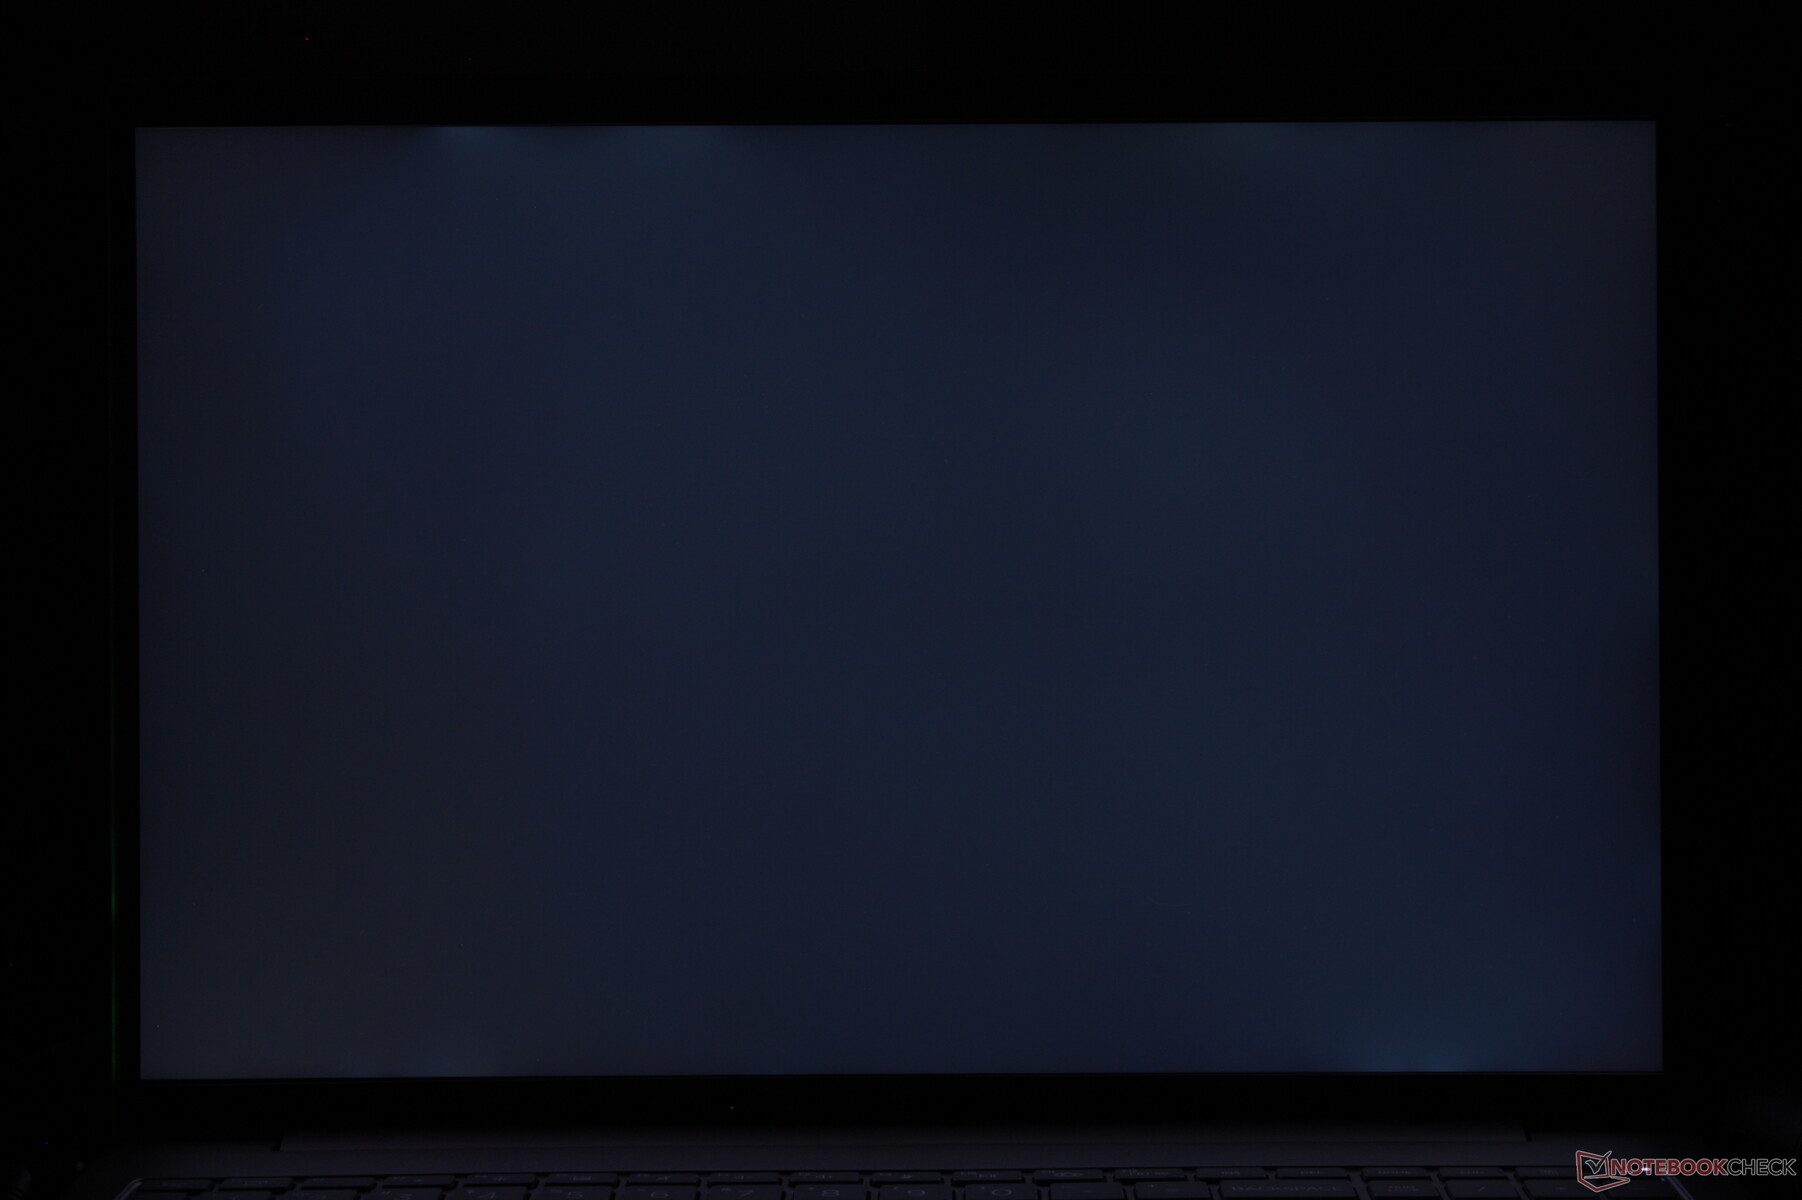
Brightness Distribution: 88 %
Center on Battery: 461.8 cd/m²
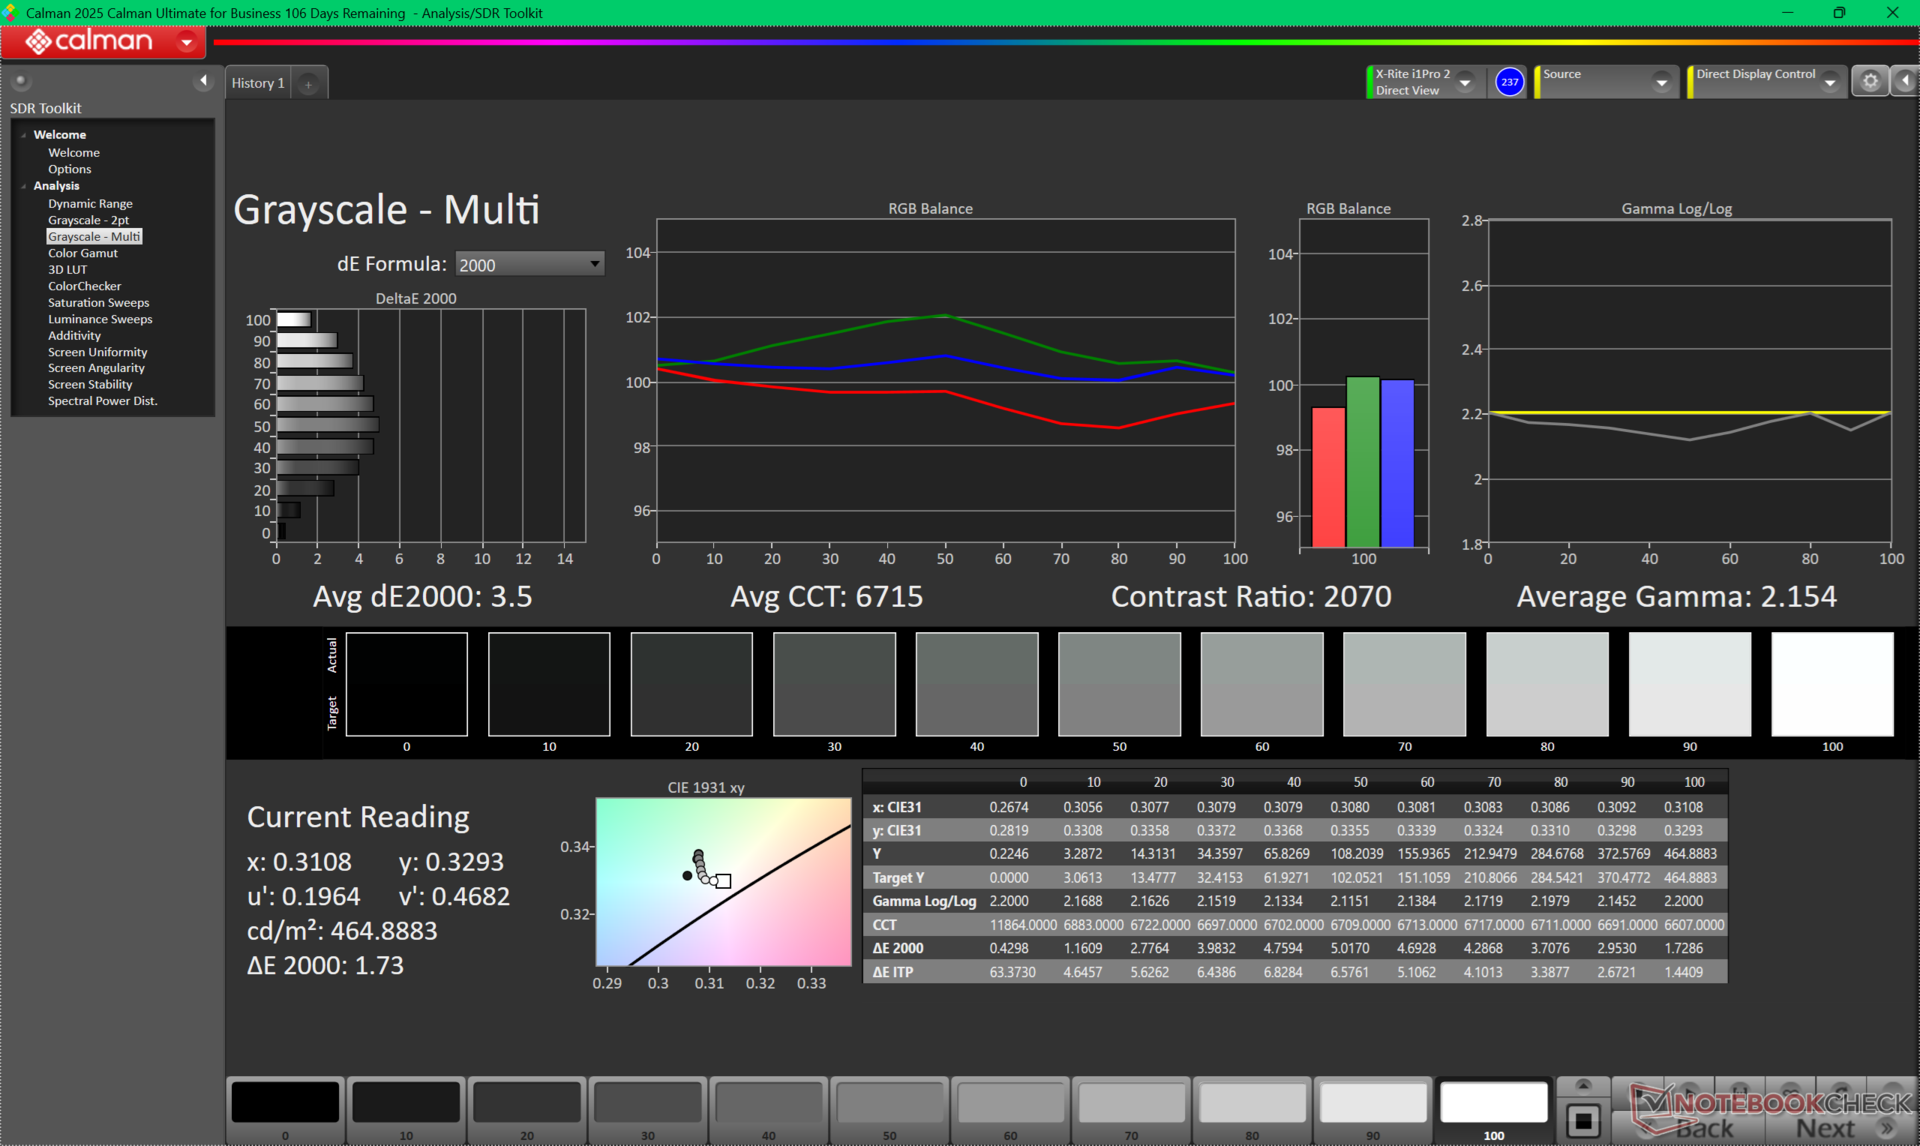
Contrast: 1004:1 (Black: 0.46 cd/m²)
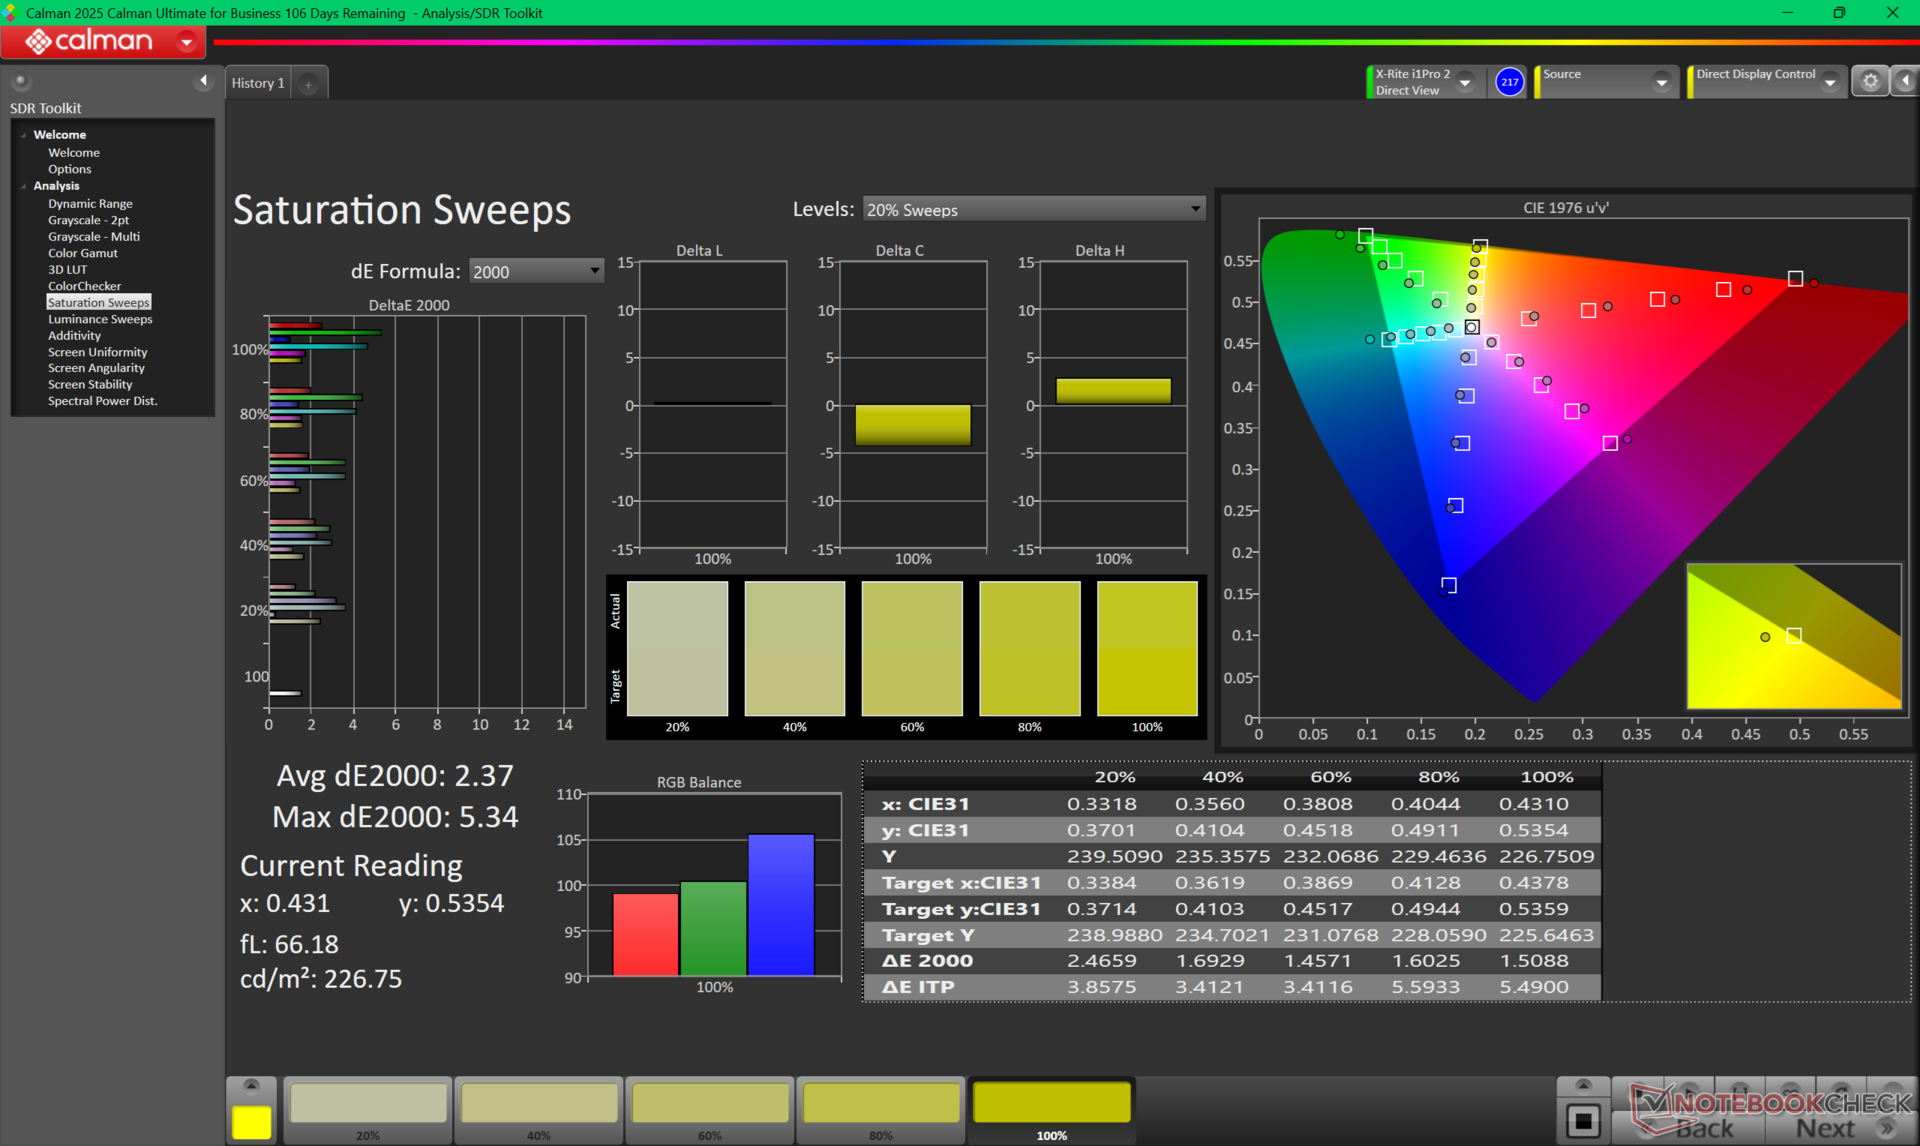
ΔE ColorChecker Calman: 4.08 | ∀{0.5-29.43 Ø4.71}
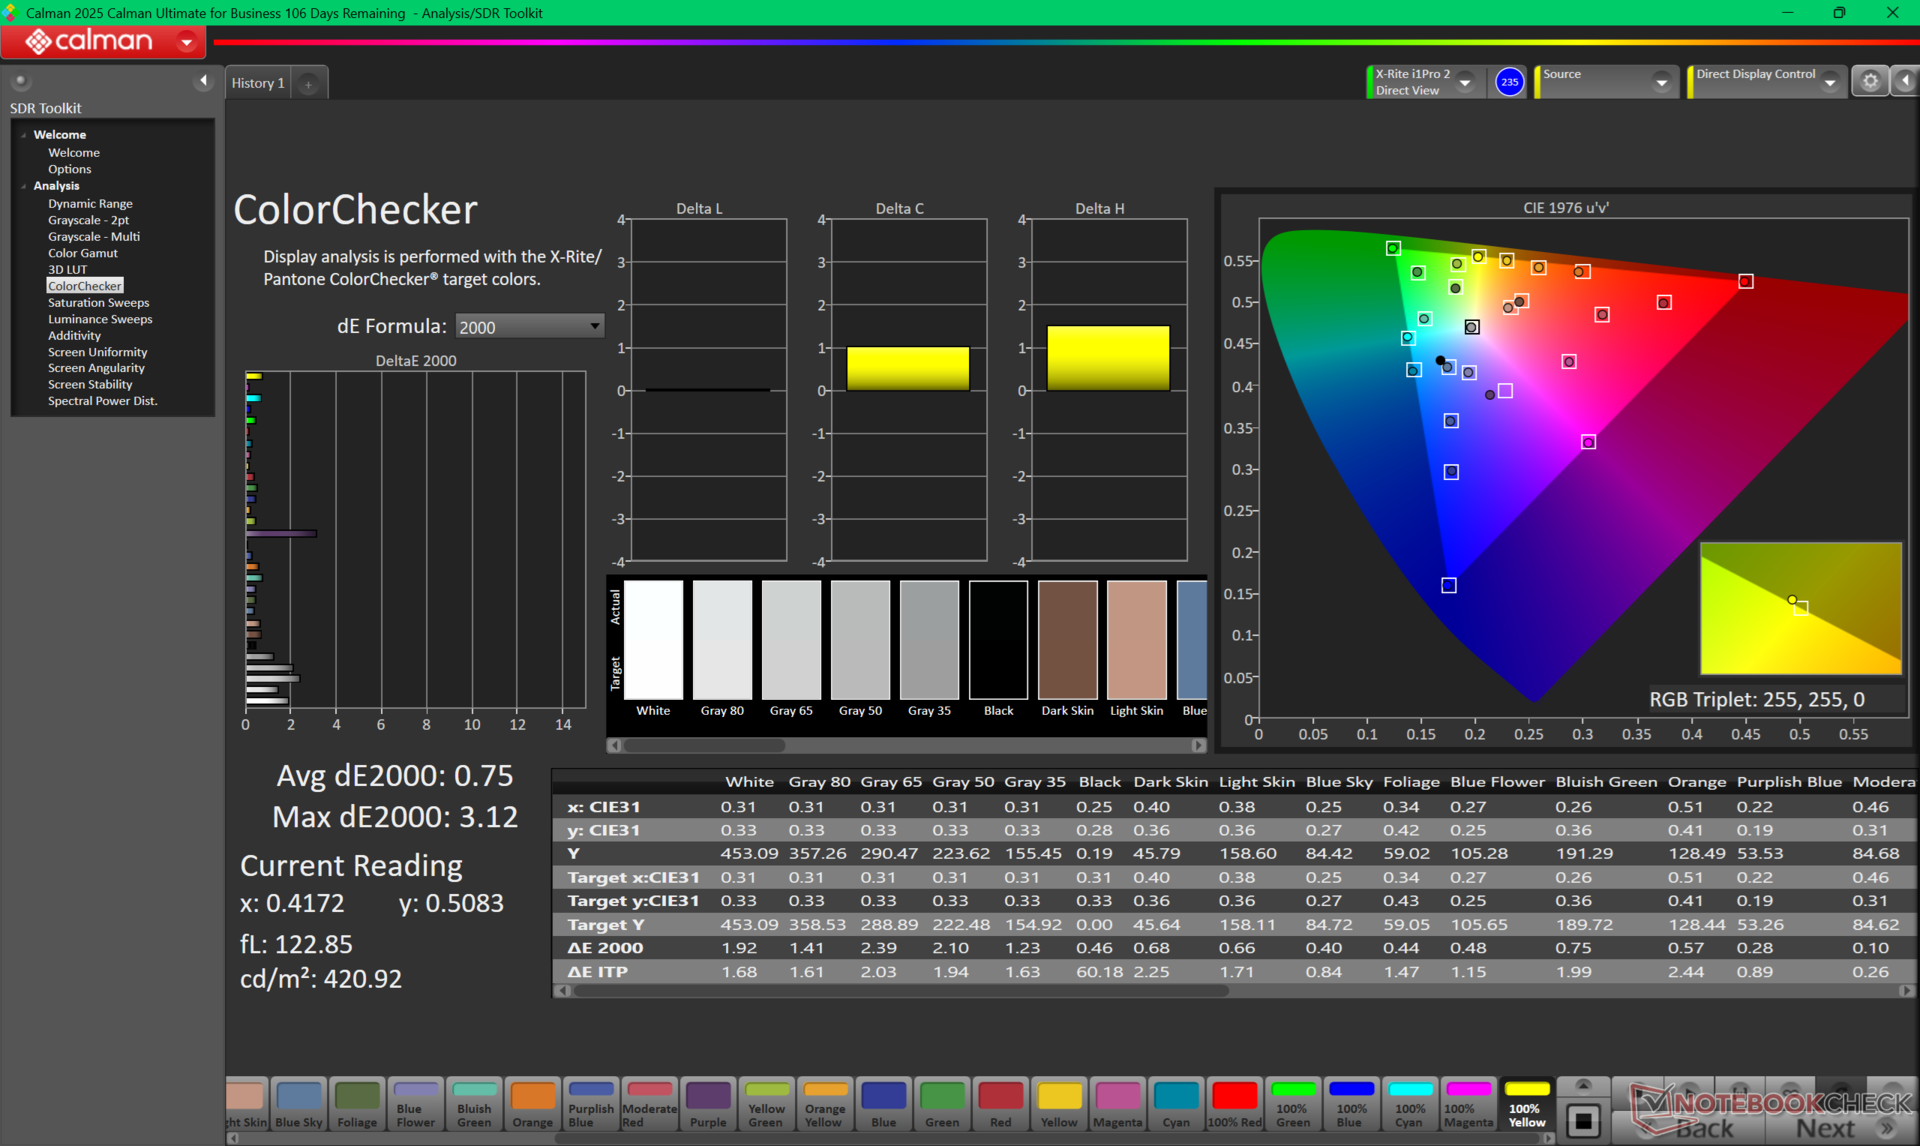
calibrated: 0.75
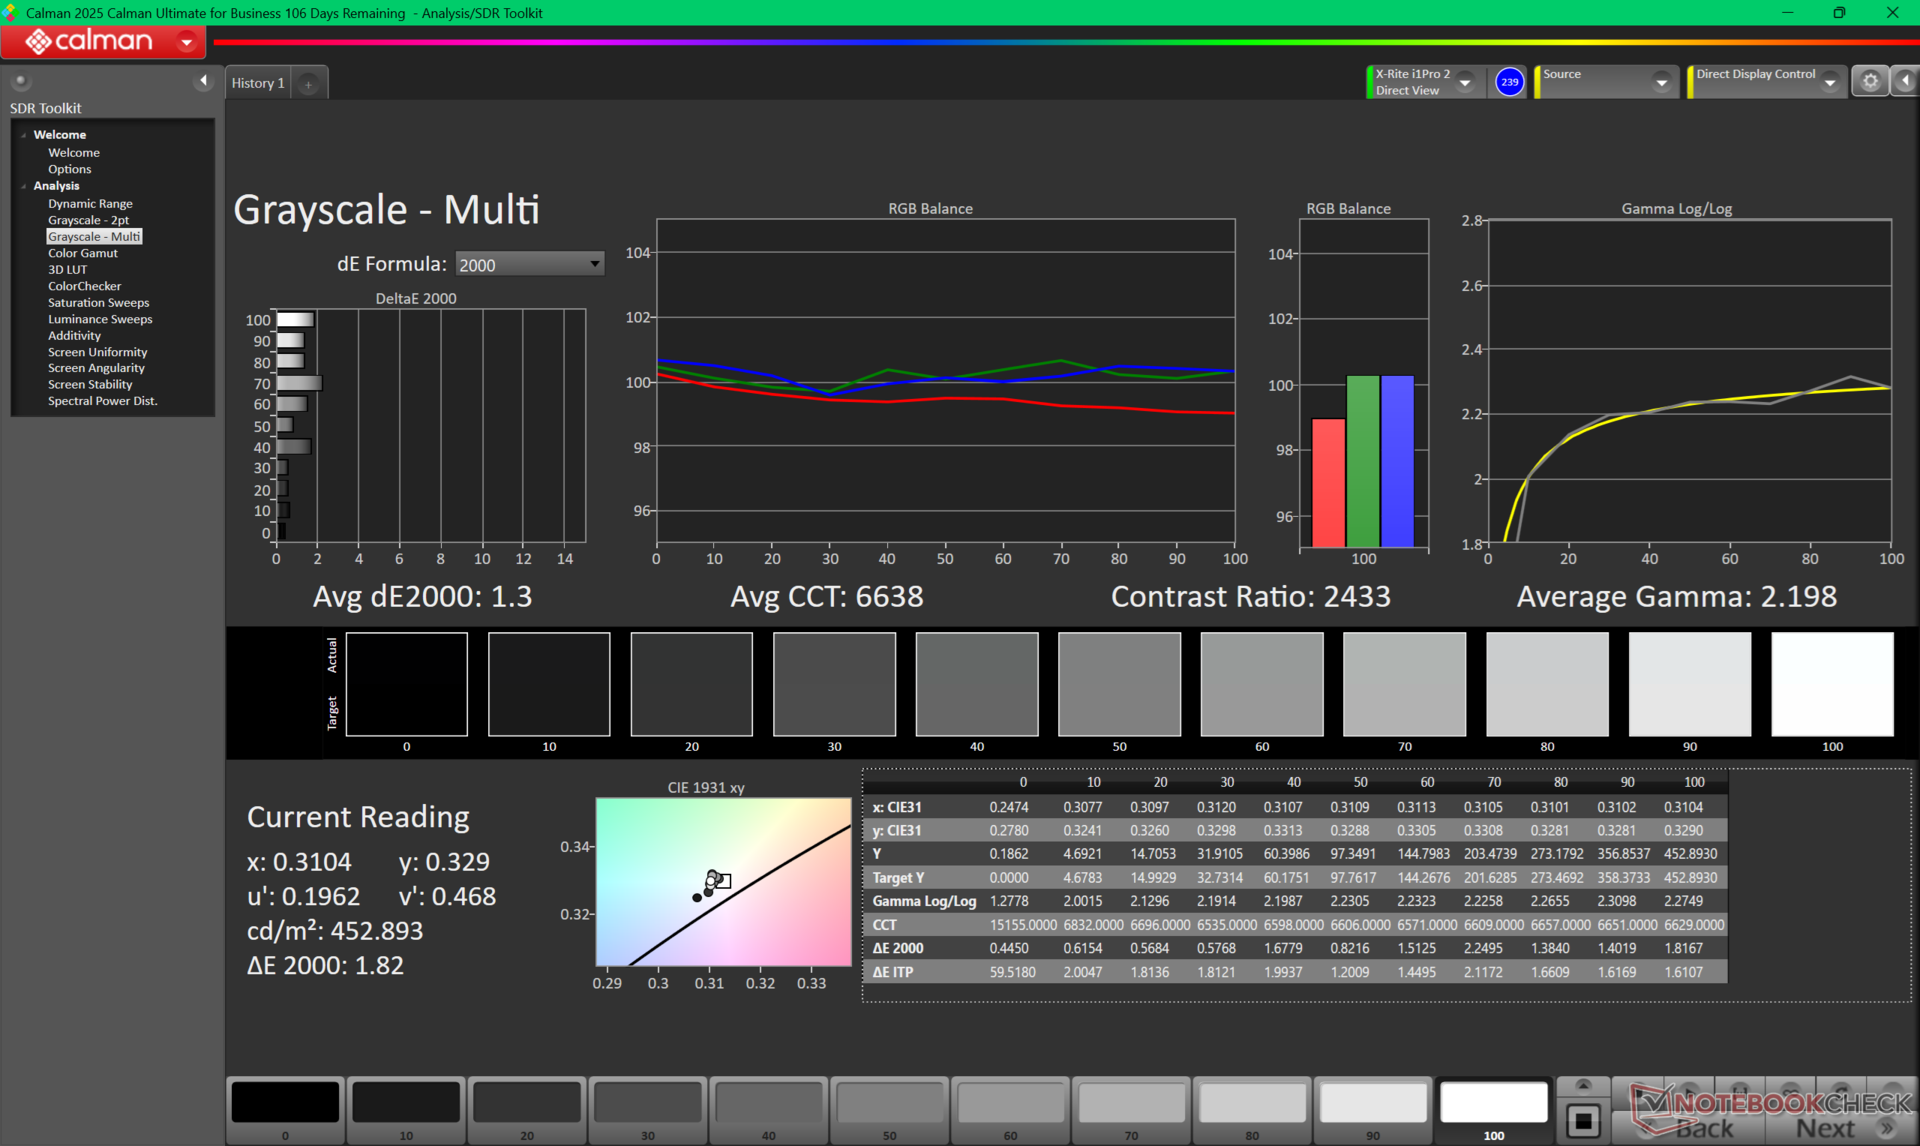
ΔE Greyscale Calman: 3.5 | ∀{0.09-98 Ø4.96}
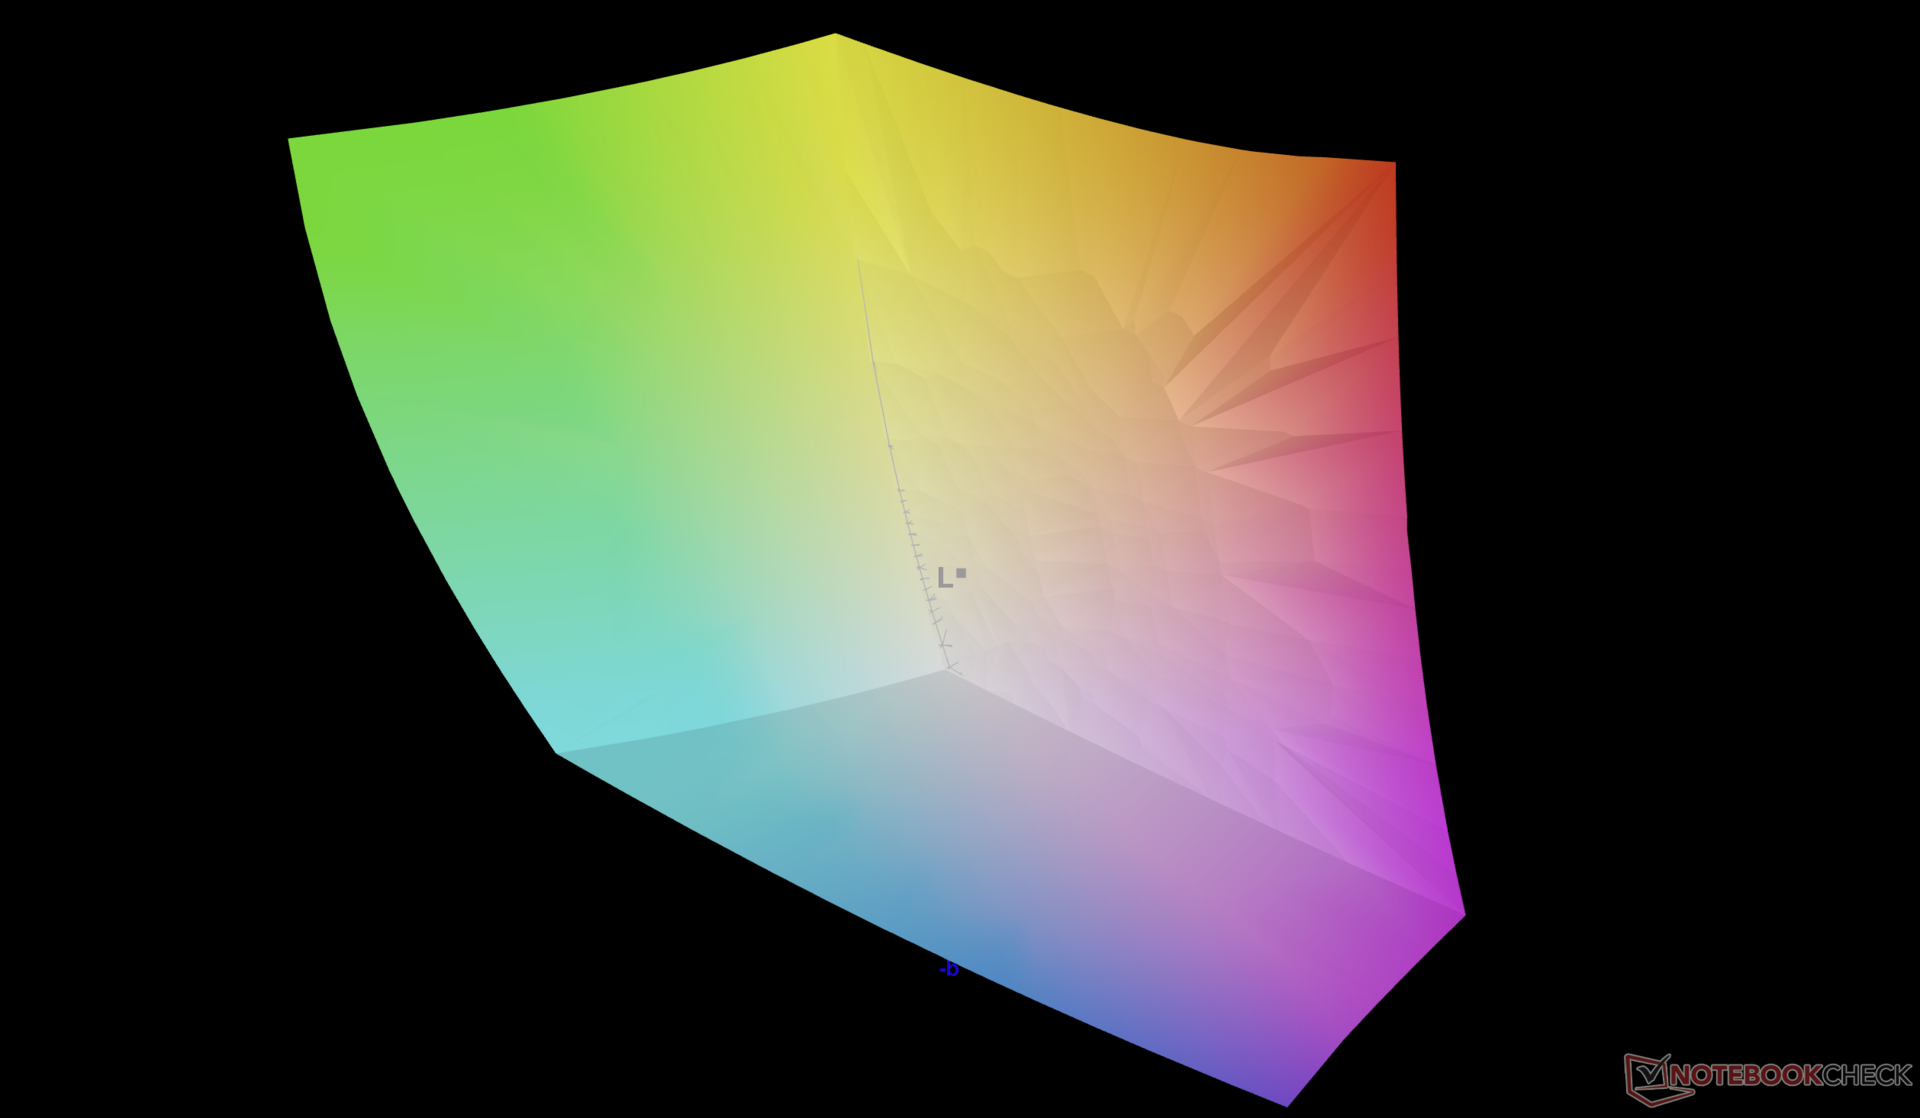
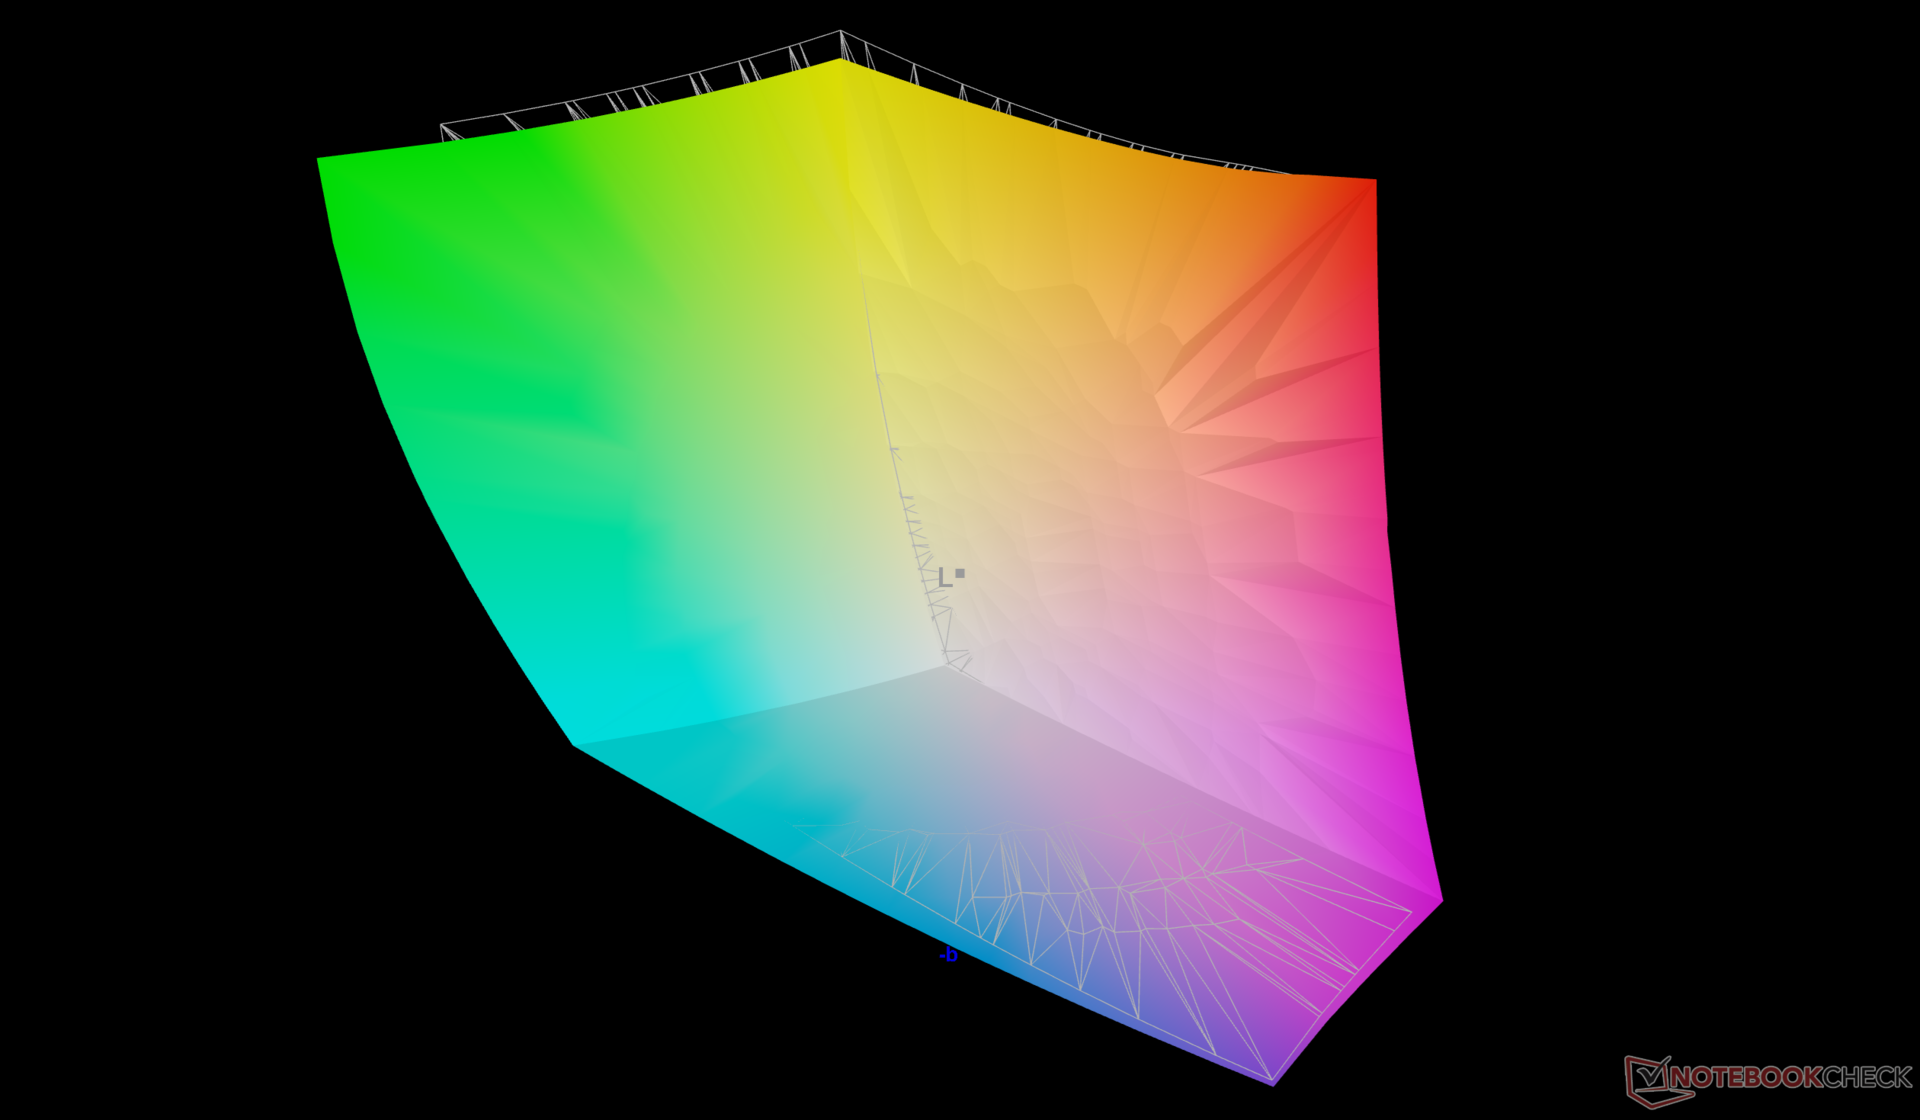
99.9% AdobeRGB 1998 (Argyll 3D)
100% sRGB (Argyll 3D)
97.2% Display P3 (Argyll 3D)
Gamma: 2.15
CCT: 6715 K
| HP ZBook X G1i 16 LG Philips LGD07B3, IPS, 2560x1600, 16", 120 Hz | HP ZBook Power 16 G11 A AUOA0A9, IPS, 2560x1600, 16", 120 Hz | HP ZBook Studio 16 G11 AUO87A8, IPS, 3840x2400, 16", 120 Hz | Lenovo ThinkPad P16 Gen 2 NE160QDM-NY1, IPS, 2560x1600, 16", 165 Hz | Dell Pro Max 16 Plus Samsung 160HC01, OLED, 3840x2400, 16", 120 Hz | Dell Precision 5690 Samsung 160YV03, OLED, 3840x2400, 16", 60 Hz | |
|---|---|---|---|---|---|---|
| Display | -20% | -4% | -21% | -4% | 0% | |
| Display P3 Coverage (%) | 97.2 | 69.1 -29% | 97.7 1% | 68.4 -30% | 97.3 0% | 99.8 3% |
| sRGB Coverage (%) | 100 | 97.7 -2% | 99.9 0% | 96.9 -3% | 100 0% | 100 0% |
| AdobeRGB 1998 Coverage (%) | 99.9 | 71 -29% | 85.7 -14% | 70.6 -29% | 88.8 -11% | 96.6 -3% |
| Response Times | 69% | 64% | 66% | 79% | 95% | |
| Response Time Grey 50% / Grey 80% * (ms) | 45.5 ? | 13.6 ? 70% | 14.2 ? 69% | 14.1 ? 69% | 0.63 ? 99% | 1.7 ? 96% |
| Response Time Black / White * (ms) | 26.1 ? | 8.4 ? 68% | 10.6 ? 59% | 9.9 ? 62% | 0.89 ? 97% | 1.7 ? 93% |
| PWM Frequency (Hz) | 26536 ? | 479.9 ? | 60 ? | |||
| PWM Amplitude * (%) | 47 | 28 40% | ||||
| Screen | -4% | 11% | 31% | 29% | 1% | |
| Brightness middle (cd/m²) | 461.8 | 470.7 2% | 404.3 -12% | 531.5 15% | 530.9 15% | 348.1 -25% |
| Brightness (cd/m²) | 427 | 431 1% | 405 -5% | 499 17% | 540 26% | 351 -18% |
| Brightness Distribution (%) | 88 | 88 0% | 92 5% | 89 1% | 95 8% | 97 10% |
| Black Level * (cd/m²) | 0.46 | 0.57 -24% | 0.28 39% | 0.38 17% | ||
| Contrast (:1) | 1004 | 826 -18% | 1444 44% | 1399 39% | ||
| Colorchecker dE 2000 * | 4.08 | 2.16 47% | 2.63 36% | 1.82 55% | 2.42 41% | 4.18 -2% |
| Colorchecker dE 2000 max. * | 8.1 | 4.39 46% | 4.48 45% | 4.1 49% | 5.76 29% | 6.68 18% |
| Colorchecker dE 2000 calibrated * | 0.75 | 1.37 -83% | 1.46 -95% | 0.63 16% | 0.7 7% | 0.97 -29% |
| Greyscale dE 2000 * | 3.5 | 3.7 -6% | 2.1 40% | 1.2 66% | 0.8 77% | 1.7 51% |
| Gamma | 2.15 102% | 2.38 92% | 2.3 96% | 2.15 102% | 2.23 99% | 2.2 100% |
| CCT | 6715 97% | 6765 96% | 6810 95% | 6484 100% | 6488 100% | 6198 105% |
| Total Average (Program / Settings) | 15% /
3% | 24% /
15% | 25% /
25% | 35% /
33% | 32% /
16% |
* ... smaller is better
Display Response Times
| ↔ Response Time Black to White | ||
|---|---|---|
| 26.1 ms ... rise ↗ and fall ↘ combined | ↗ 11.8 ms rise | 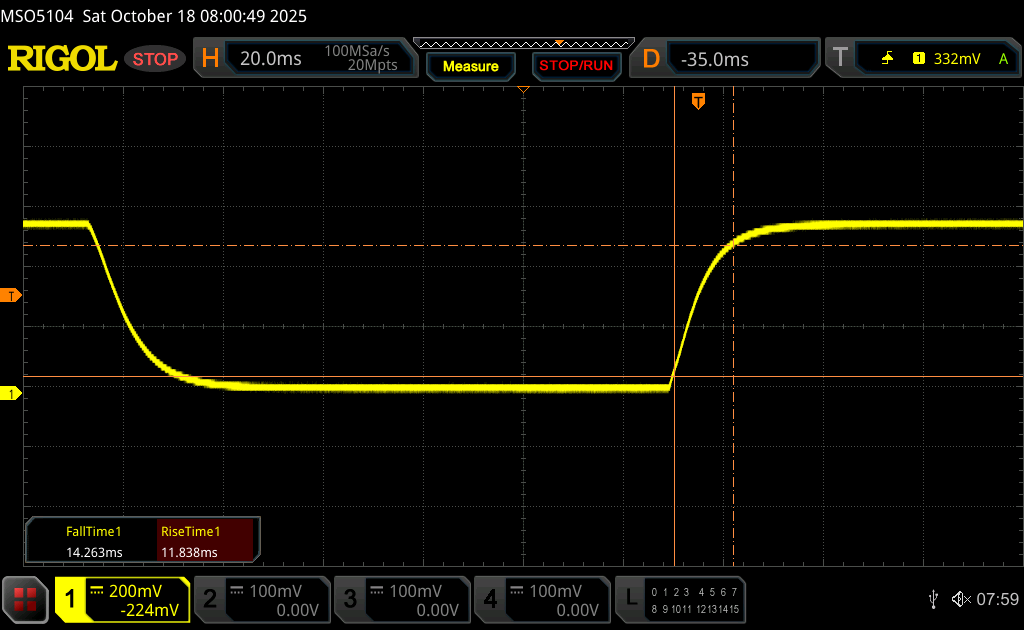 |
| ↘ 14.3 ms fall | ||
| The screen shows relatively slow response rates in our tests and may be too slow for gamers. In comparison, all tested devices range from 0.1 (minimum) to 240 (maximum) ms. » 65 % of all devices are better. This means that the measured response time is worse than the average of all tested devices (19.8 ms). | ||
| ↔ Response Time 50% Grey to 80% Grey | ||
| 45.5 ms ... rise ↗ and fall ↘ combined | ↗ 21.1 ms rise | 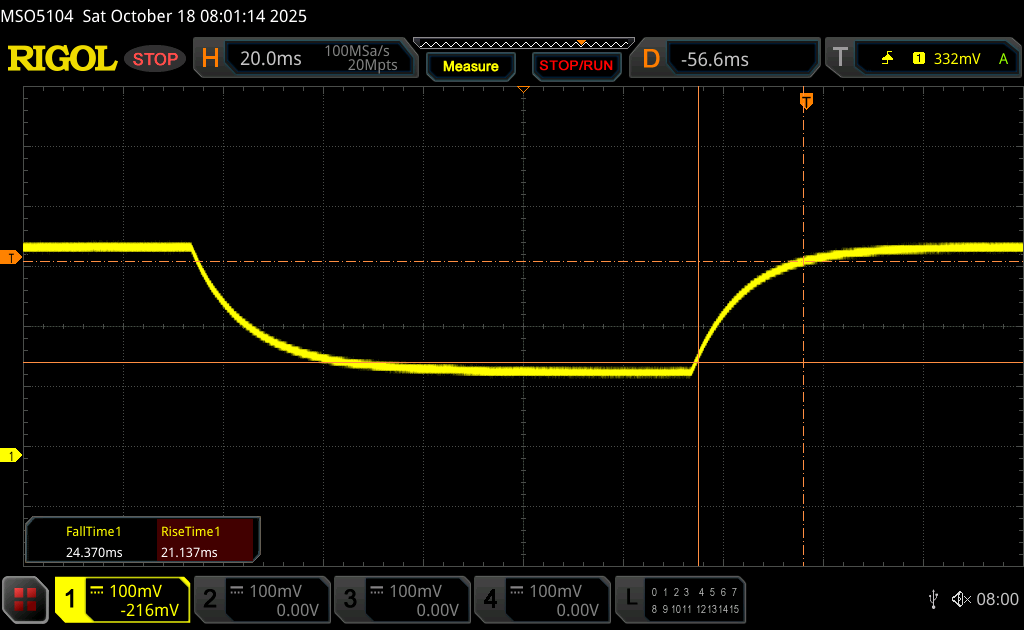 |
| ↘ 24.4 ms fall | ||
| The screen shows slow response rates in our tests and will be unsatisfactory for gamers. In comparison, all tested devices range from 0.165 (minimum) to 636 (maximum) ms. » 78 % of all devices are better. This means that the measured response time is worse than the average of all tested devices (31 ms). | ||
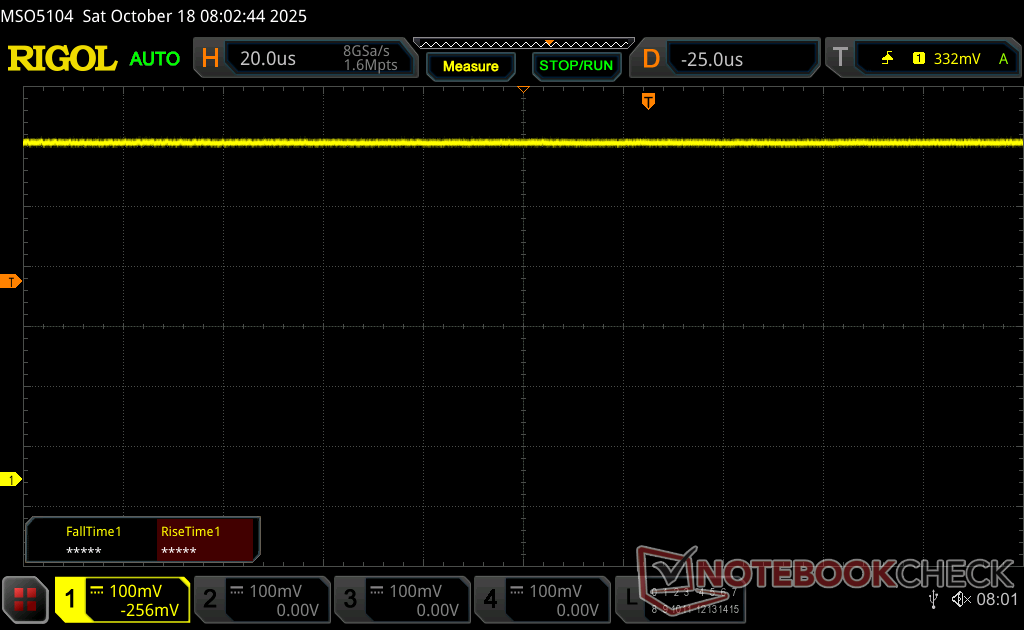
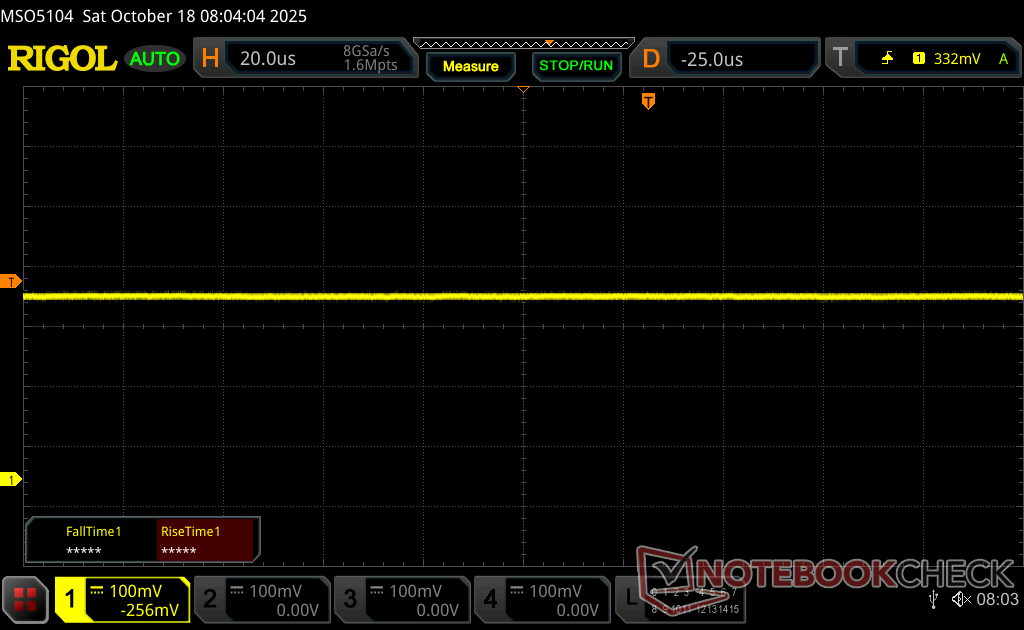
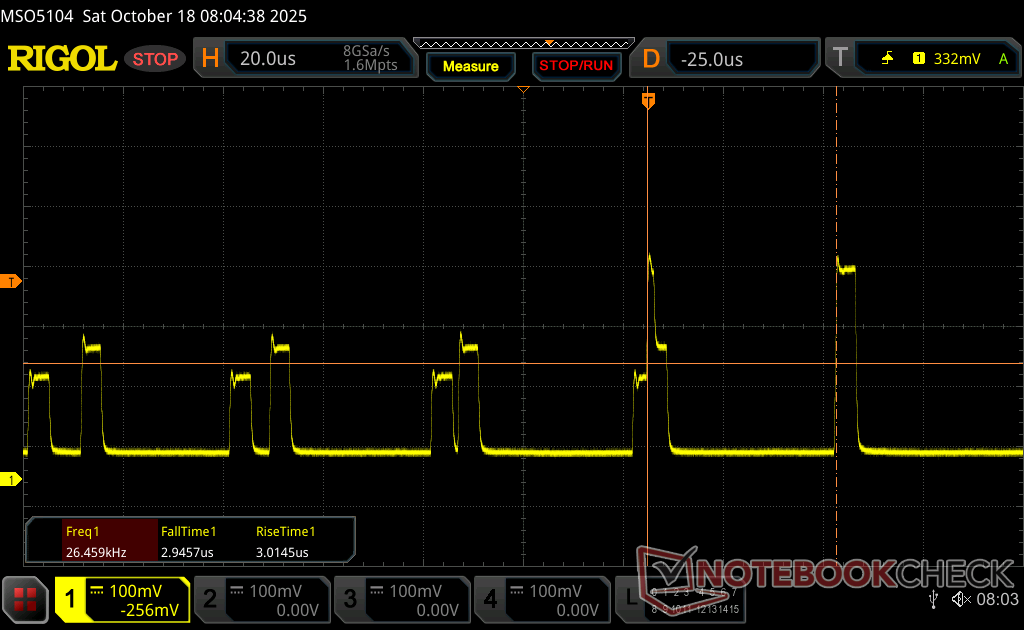
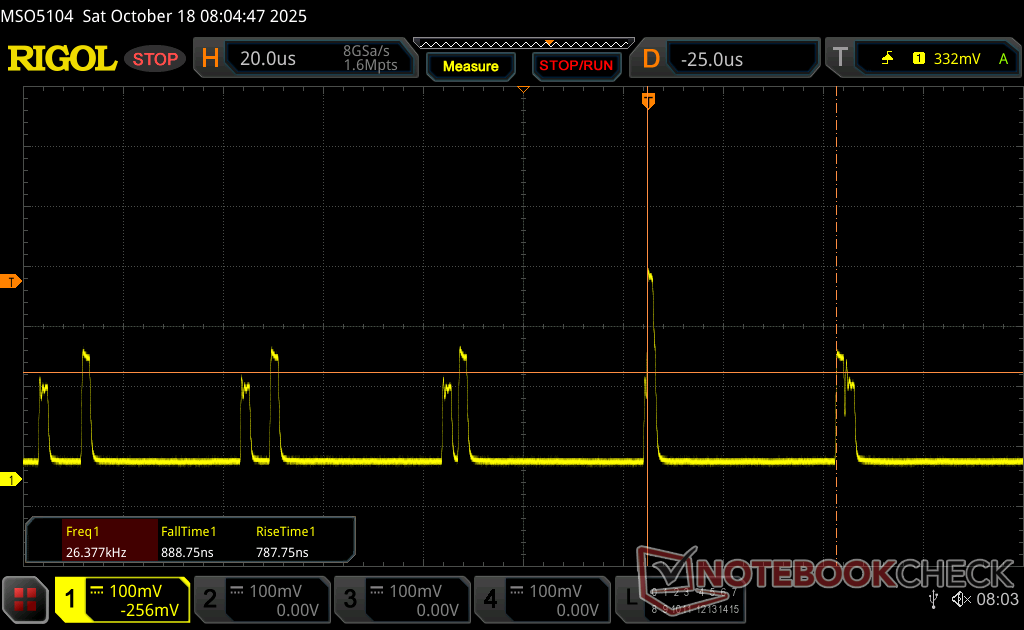
Screen Flickering / PWM (Pulse-Width Modulation)
| Screen flickering / PWM detected | 26536 Hz Amplitude: 47 % | ≤ 74 % brightness setting | 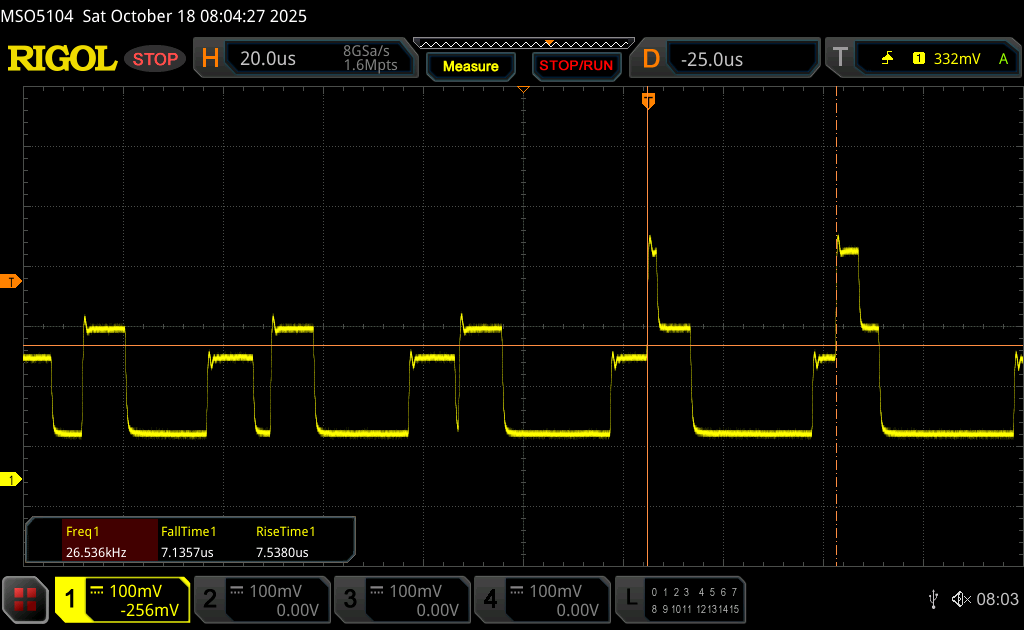 |
The display backlight flickers at 26536 Hz (worst case, e.g., utilizing PWM) Flickering detected at a brightness setting of 74 % and below. There should be no flickering or PWM above this brightness setting. The frequency of 26536 Hz is quite high, so most users sensitive to PWM should not notice any flickering. In comparison: 52 % of all tested devices do not use PWM to dim the display. If PWM was detected, an average of 7747 (minimum: 5 - maximum: 343500) Hz was measured. | |||


性能
测试条件
在运行以下基准测试之前,我们将 Windows 设置为性能模式。
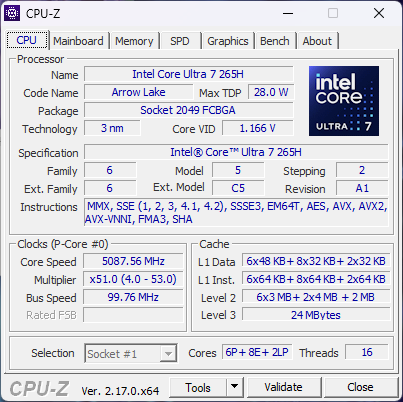
处理器
酷睿至尊 7 265H 酷睿至尊 7 265H性能比去年的 酷睿至尊 7 155H提升了约 15%。而从 HP ZBook Studio 16 G9 等更老的机型升级而来的用户则会看到更显著的提升,约为 30%。
由于 Turbo Boost 的限制,在运行循环 CineBench R15 xT 压力测试时,性能会下降约 10%,详情请参见下面的压力测试部分。
Cinebench R15 多回路运行
Cinebench R23: Multi Core | Single Core
Cinebench R20: CPU (Multi Core) | CPU (Single Core)
Cinebench R15: CPU Multi 64Bit | CPU Single 64Bit
Blender: v2.79 BMW27 CPU
7-Zip 18.03: 7z b 4 | 7z b 4 -mmt1
Geekbench 6.7: Multi-Core | Single-Core
Geekbench 5.5: Multi-Core | Single-Core
HWBOT x265 Benchmark v2.2: 4k Preset
LibreOffice : 20 Documents To PDF
R Benchmark 2.5: Overall mean
* ... smaller is better
系统性能
在我们的测试设备上,有一小部分基准测试会崩溃或无法完成,包括 PCMark 10、SpecViewPerf 13 Maya 和 AIDA64 Engineer。
CrossMark: Overall | Productivity | Creativity | Responsiveness
WebXPRT 3: Overall
WebXPRT 4: Overall
Mozilla Kraken 1.1: Total
| Performance rating | |
| Dell Pro Max 16 Plus | |
| Lenovo ThinkPad P16 Gen 2 | |
| HP ZBook X G1i 16 | |
| Average Intel Core Ultra 7 265H, NVIDIA RTX PRO 2000 Blackwell Generation Laptop | |
| Dell Precision 5690 | |
| HP ZBook Studio 16 G11 | |
| HP ZBook Power 16 G11 A | |
| CrossMark / Overall | |
| Dell Pro Max 16 Plus | |
| Lenovo ThinkPad P16 Gen 2 | |
| HP ZBook X G1i 16 | |
| Average Intel Core Ultra 7 265H, NVIDIA RTX PRO 2000 Blackwell Generation Laptop (n=1) | |
| Dell Precision 5690 | |
| HP ZBook Power 16 G11 A | |
| HP ZBook Studio 16 G11 | |
| CrossMark / Productivity | |
| Dell Pro Max 16 Plus | |
| HP ZBook X G1i 16 | |
| Average Intel Core Ultra 7 265H, NVIDIA RTX PRO 2000 Blackwell Generation Laptop (n=1) | |
| Lenovo ThinkPad P16 Gen 2 | |
| Dell Precision 5690 | |
| HP ZBook Power 16 G11 A | |
| HP ZBook Studio 16 G11 | |
| CrossMark / Creativity | |
| Dell Pro Max 16 Plus | |
| Lenovo ThinkPad P16 Gen 2 | |
| HP ZBook X G1i 16 | |
| Average Intel Core Ultra 7 265H, NVIDIA RTX PRO 2000 Blackwell Generation Laptop (n=1) | |
| HP ZBook Power 16 G11 A | |
| Dell Precision 5690 | |
| HP ZBook Studio 16 G11 | |
| CrossMark / Responsiveness | |
| Dell Pro Max 16 Plus | |
| Lenovo ThinkPad P16 Gen 2 | |
| Dell Precision 5690 | |
| HP ZBook X G1i 16 | |
| Average Intel Core Ultra 7 265H, NVIDIA RTX PRO 2000 Blackwell Generation Laptop (n=1) | |
| HP ZBook Studio 16 G11 | |
| HP ZBook Power 16 G11 A | |
| WebXPRT 3 / Overall | |
| Lenovo ThinkPad P16 Gen 2 | |
| Dell Pro Max 16 Plus | |
| HP ZBook X G1i 16 | |
| Average Intel Core Ultra 7 265H, NVIDIA RTX PRO 2000 Blackwell Generation Laptop (n=1) | |
| HP ZBook Power 16 G11 A | |
| HP ZBook Studio 16 G11 | |
| Dell Precision 5690 | |
| WebXPRT 4 / Overall | |
| Dell Pro Max 16 Plus | |
| Lenovo ThinkPad P16 Gen 2 | |
| HP ZBook X G1i 16 | |
| Average Intel Core Ultra 7 265H, NVIDIA RTX PRO 2000 Blackwell Generation Laptop (n=1) | |
| Dell Precision 5690 | |
| HP ZBook Studio 16 G11 | |
| HP ZBook Power 16 G11 A | |
| Mozilla Kraken 1.1 / Total | |
| HP ZBook Power 16 G11 A | |
| HP ZBook Studio 16 G11 | |
| Dell Precision 5690 | |
| HP ZBook X G1i 16 | |
| Average Intel Core Ultra 7 265H, NVIDIA RTX PRO 2000 Blackwell Generation Laptop (n=1) | |
| Lenovo ThinkPad P16 Gen 2 | |
| Dell Pro Max 16 Plus | |
* ... smaller is better
» No benchmarks for this notebook found!
DPC 延迟
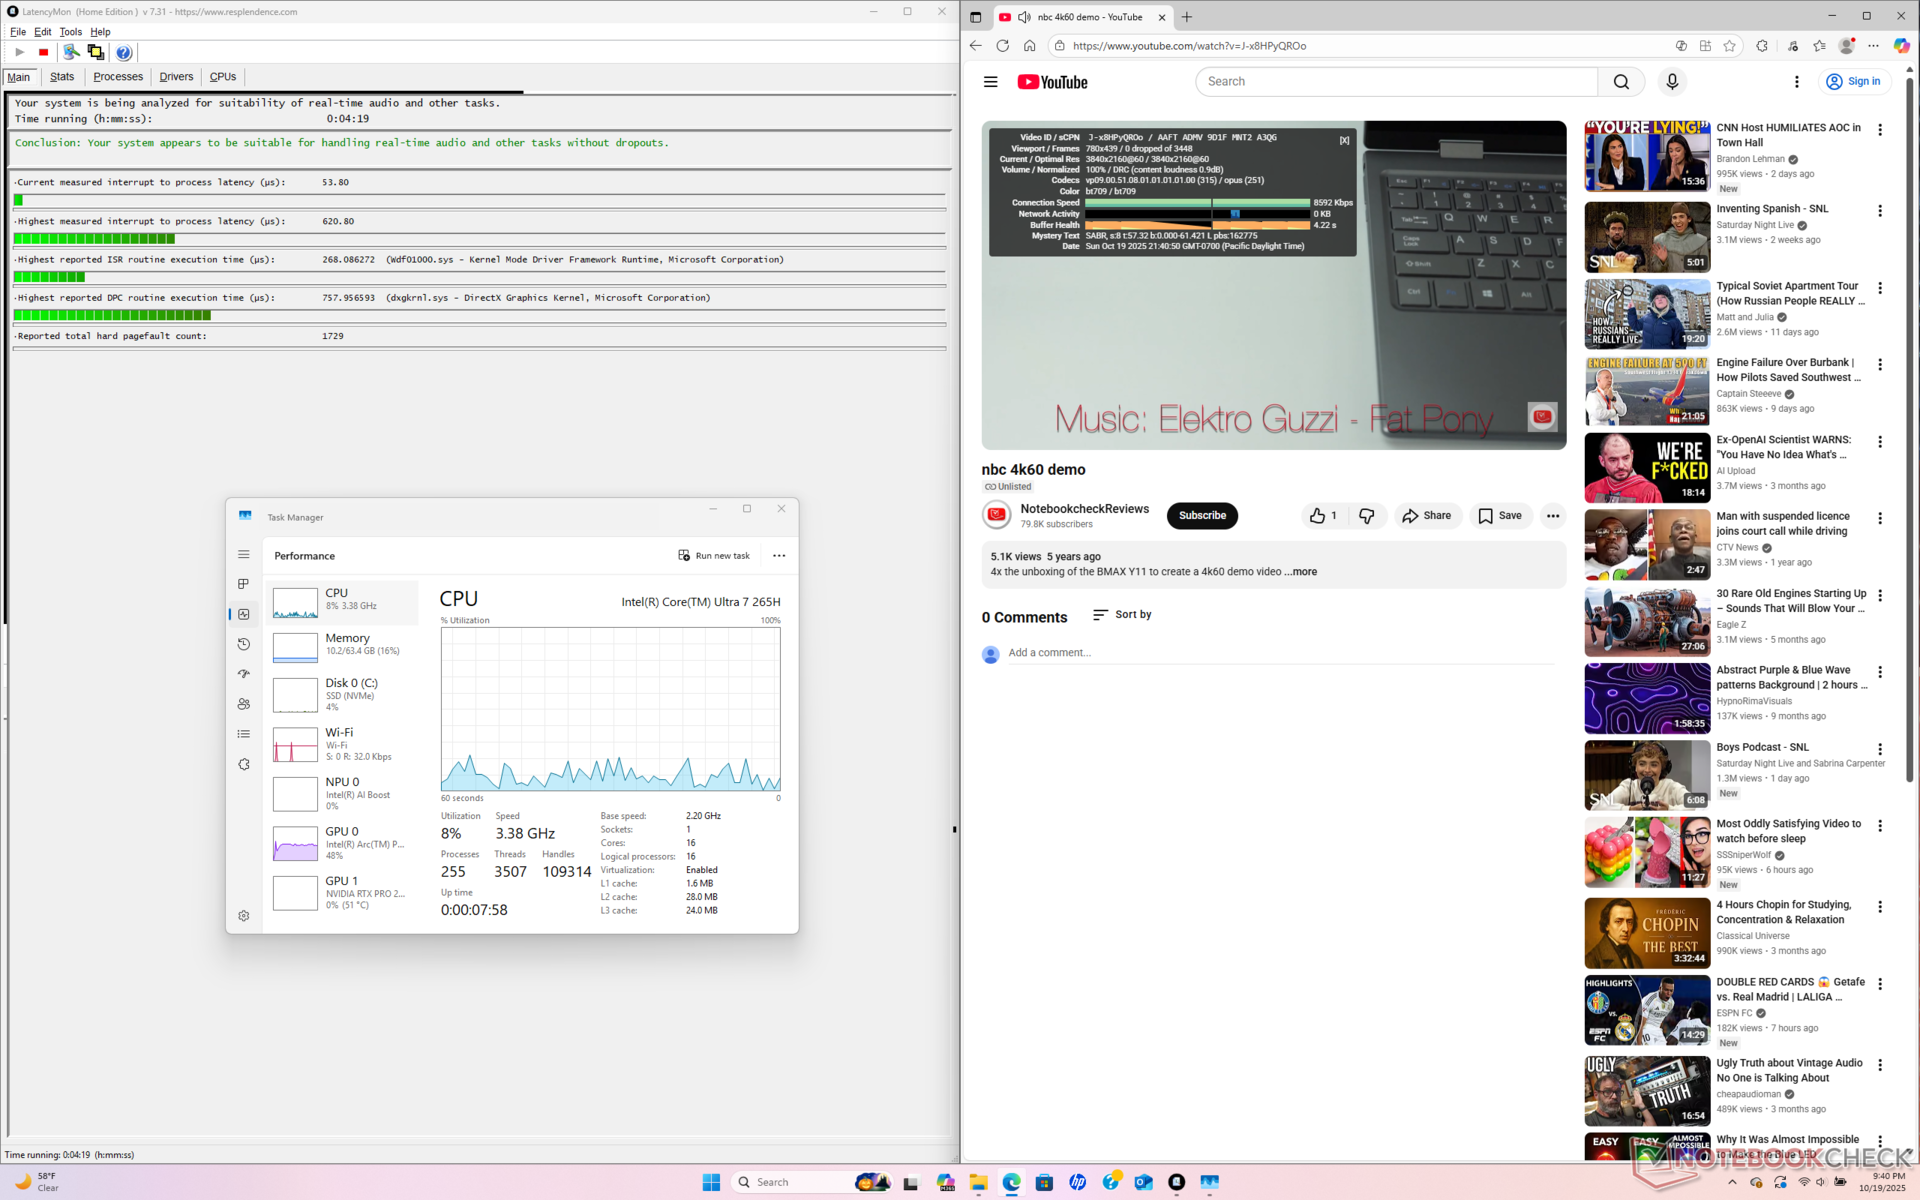
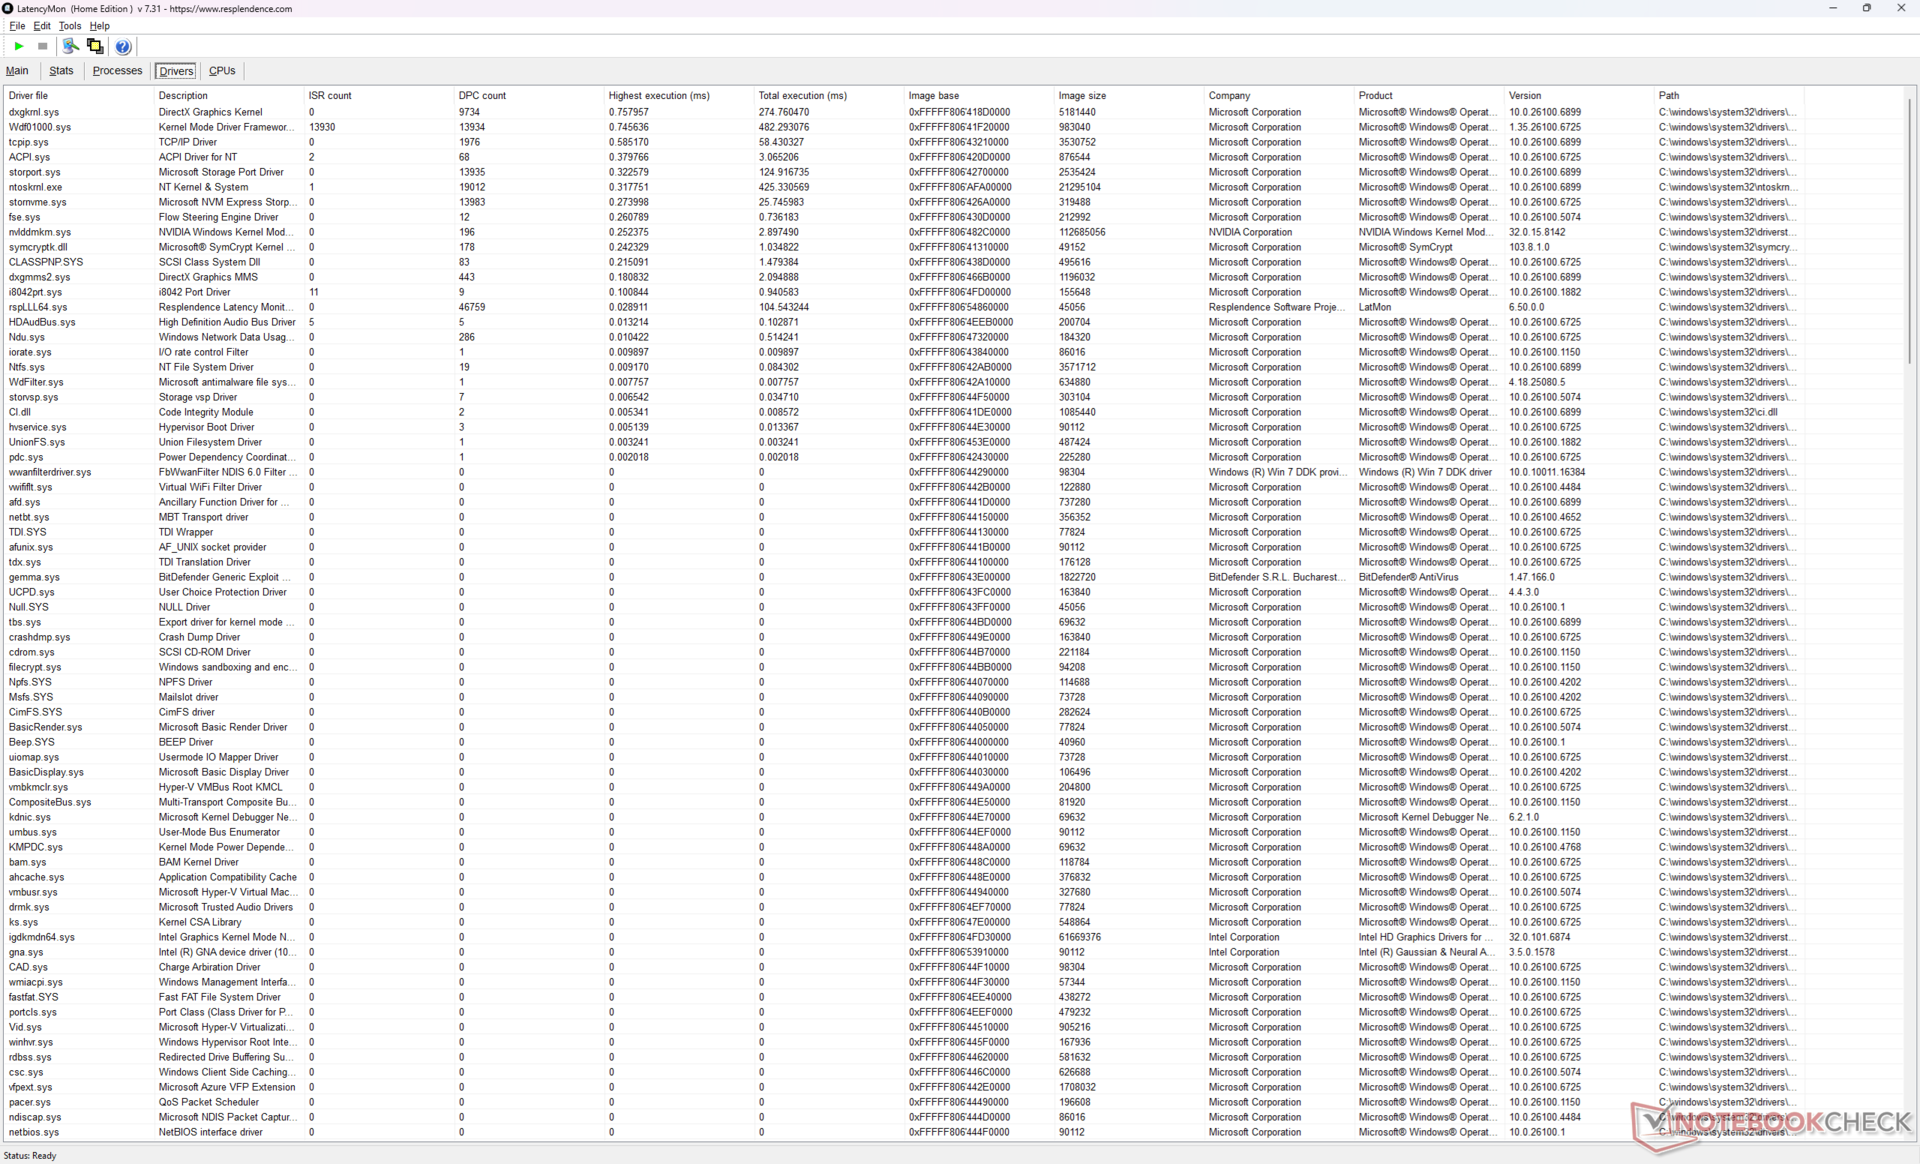
| DPC Latencies / LatencyMon - interrupt to process latency (max), Web, Youtube, Prime95 | |
| HP ZBook Power 16 G11 A | |
| Dell Pro Max 16 Plus | |
| HP ZBook Studio 16 G11 | |
| Lenovo ThinkPad P16 Gen 2 | |
| HP ZBook X G1i 16 | |
| Dell Precision 5690 | |
* ... smaller is better
存储设备
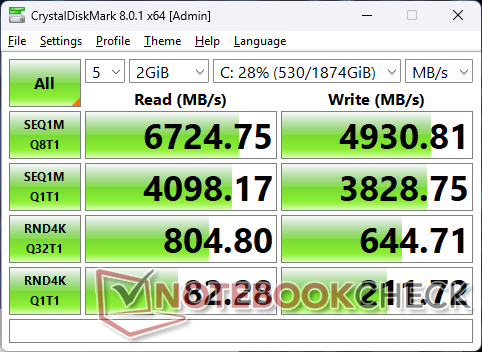
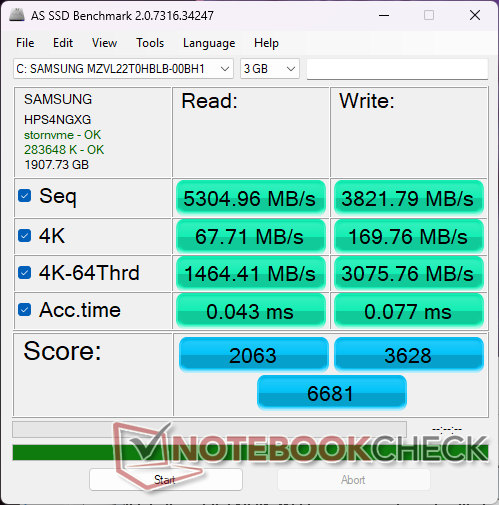

| Drive Performance rating - Percent | |
| HP ZBook X G1i 16 | |
| Dell Pro Max 16 Plus | |
| Dell Precision 5690 | |
| Lenovo ThinkPad P16 Gen 2 | |
| HP ZBook Power 16 G11 A | |
| HP ZBook Studio 16 G11 | |
* ... smaller is better
磁盘节流DiskSpd 读取循环,队列深度 8
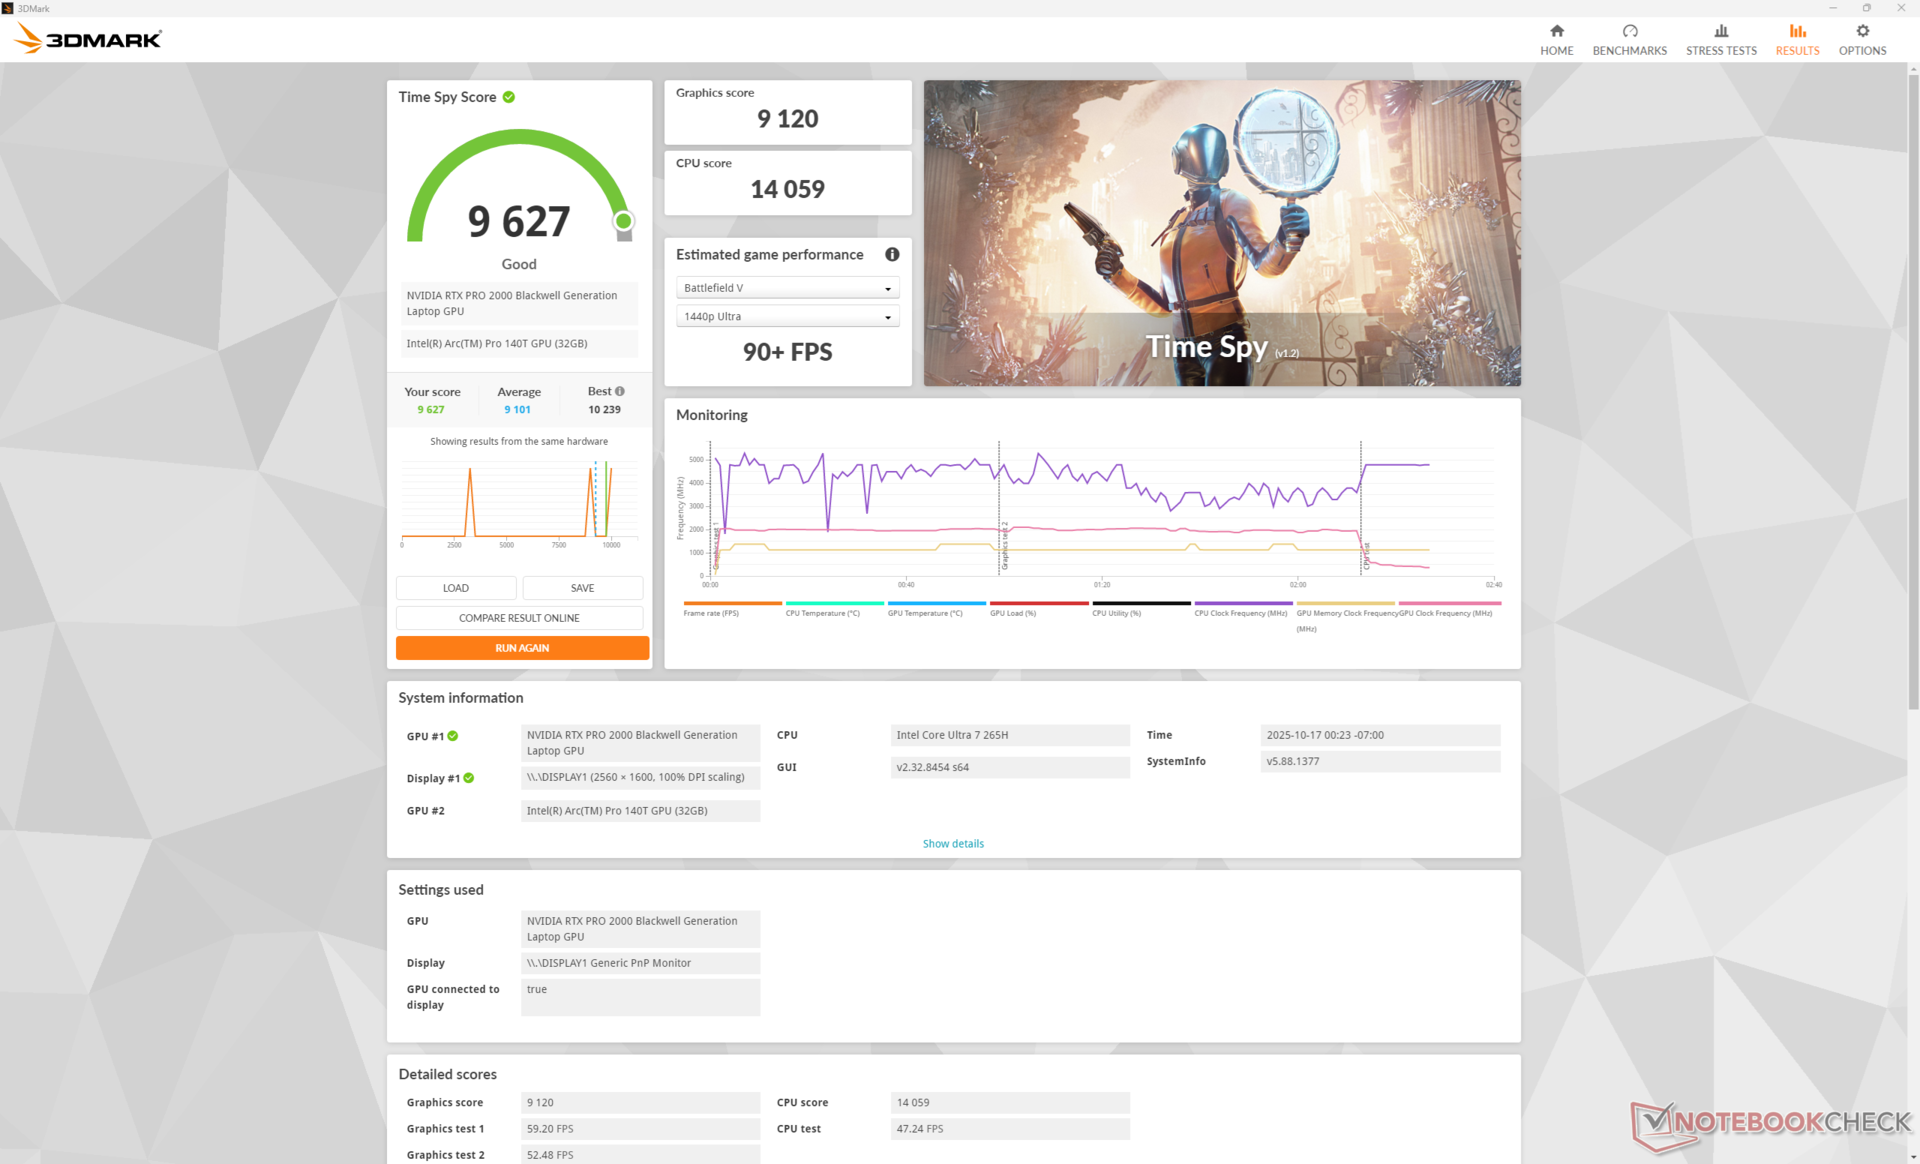
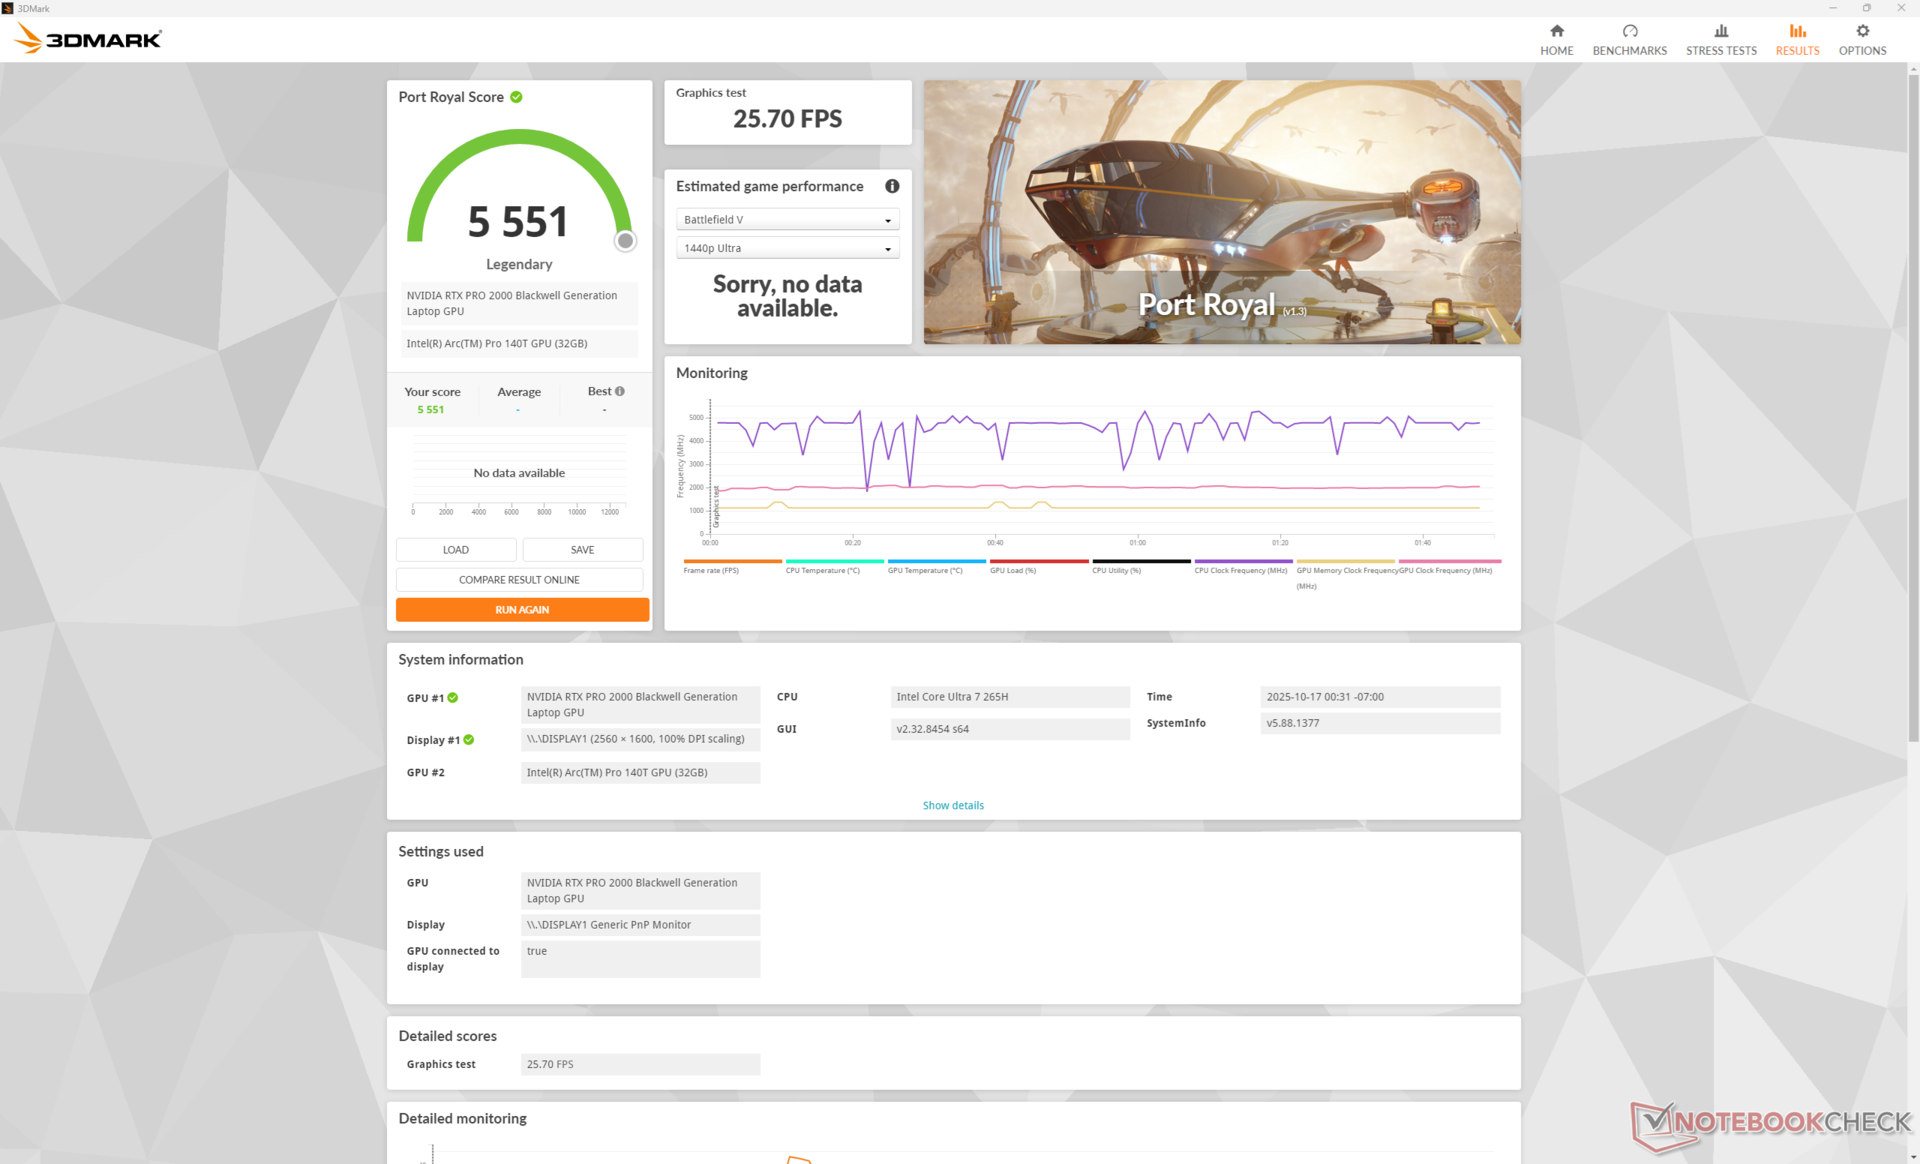
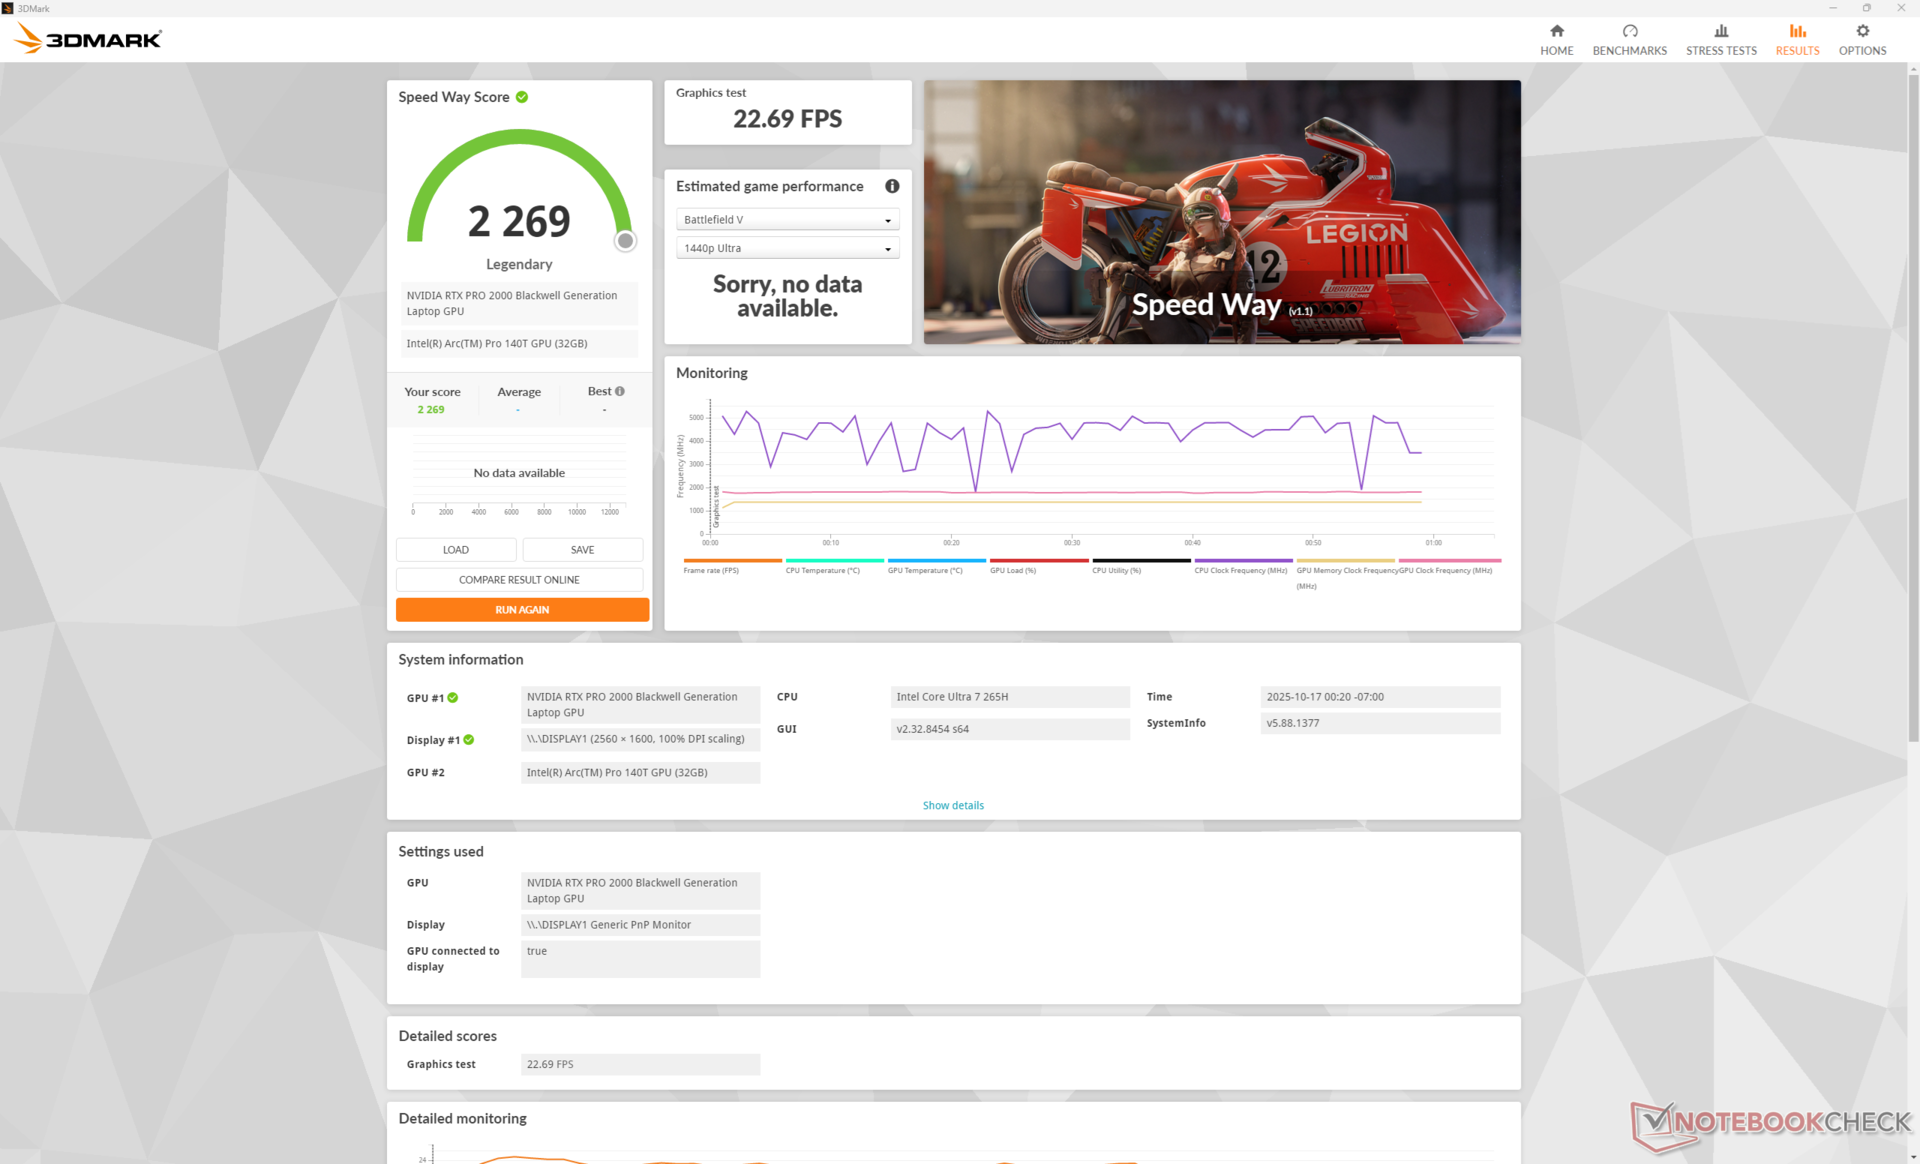
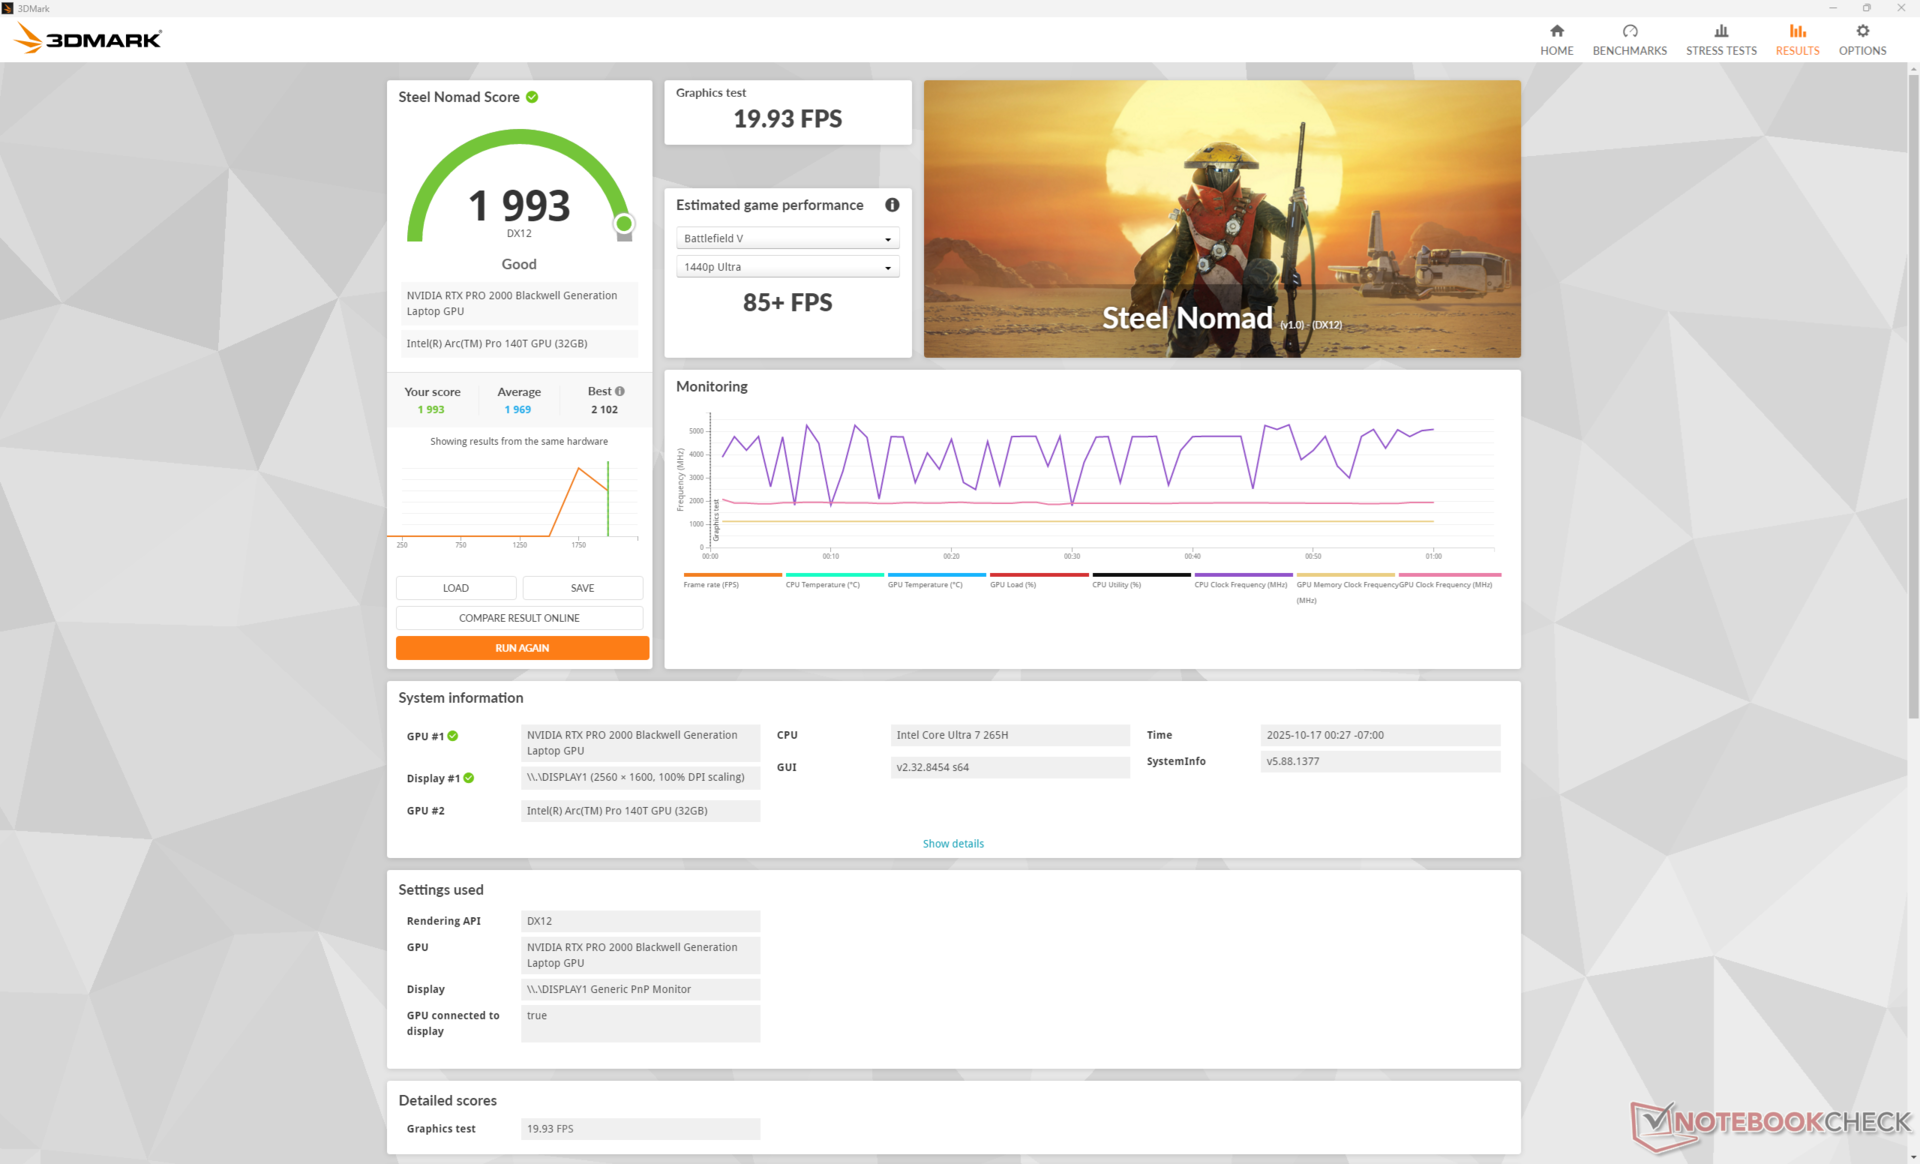
图形处理器性能
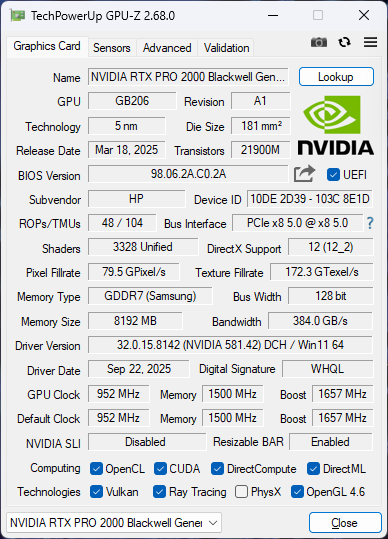
缆线 RTX Pro 2000 Blackwell惠普的目标是 60 瓦,原始性能水平略高于上一代 RTX 2000 Ada Lovelace.与此同时,从更早的 RTX A2000机型(如 2022 ZBook Studio 16 G9)升级的用户将看到 1.5 倍至 1.9 倍的更显著提升。
在平衡模式而非性能模式下运行,图形性能将受到约 5% 的影响,如下表Fire Strike 所示。在游戏方面,RTX Pro 2000 的表现与移动版的 移动版GeForce RTX 4060或 5060.
| 电源配置文件 | 图形得分 | 物理得分 | 综合得分 |
| 性能模式 | 25085 | 33858 | 11010 |
| 平衡模式 | 23771 (-5%) | 35309 (+4%) | 9366 (-15%) |
| 电池电量 | 18195 (-27%) | 25739 (-24%) | 5646 (-49%) |
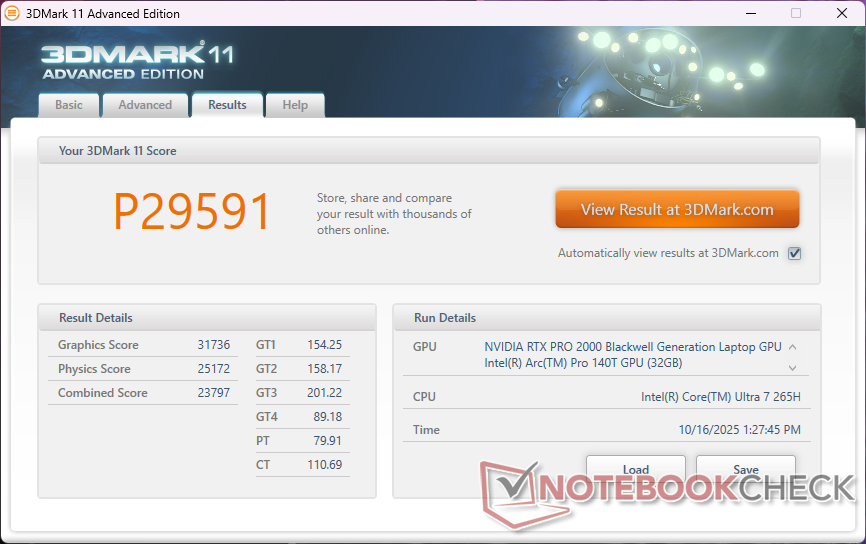

| 3DMark 11 Performance | 29591 points | |
| 3DMark Cloud Gate Standard Score | 60675 points | |
| 3DMark Fire Strike Score | 23035 points | |
| 3DMark Time Spy Score | 9627 points | |
| 3DMark Steel Nomad Score | 1993 points | |
Help | ||
* ... smaller is better
| Performance rating - Percent | |
| Dell Pro Max 16 Plus | |
| Lenovo ThinkPad P16 Gen 2 | |
| Dell Precision 5690 -1! | |
| HP ZBook X G1i 16 | |
| HP ZBook Studio 16 G11 | |
| HP ZBook Power 16 G11 A | |
| Cyberpunk 2077 - 1920x1080 Ultra Preset (FSR off) | |
| Dell Pro Max 16 Plus | |
| Dell Precision 5690 | |
| Lenovo ThinkPad P16 Gen 2 | |
| HP ZBook X G1i 16 | |
| HP ZBook Studio 16 G11 | |
| HP ZBook Power 16 G11 A | |
| Baldur's Gate 3 - 1920x1080 Ultra Preset AA:T | |
| Dell Pro Max 16 Plus | |
| Lenovo ThinkPad P16 Gen 2 | |
| Dell Precision 5690 | |
| HP ZBook Studio 16 G11 | |
| HP ZBook X G1i 16 | |
| HP ZBook Power 16 G11 A | |
| GTA V - 1920x1080 Highest AA:4xMSAA + FX AF:16x | |
| Dell Pro Max 16 Plus | |
| Lenovo ThinkPad P16 Gen 2 | |
| HP ZBook X G1i 16 | |
| HP ZBook Studio 16 G11 | |
| HP ZBook Power 16 G11 A | |
| Final Fantasy XV Benchmark - 1920x1080 High Quality | |
| Dell Pro Max 16 Plus | |
| Lenovo ThinkPad P16 Gen 2 | |
| Dell Precision 5690 | |
| HP ZBook X G1i 16 | |
| HP ZBook Studio 16 G11 | |
| HP ZBook Power 16 G11 A | |
| Strange Brigade - 1920x1080 ultra AA:ultra AF:16 | |
| Lenovo ThinkPad P16 Gen 2 | |
| Dell Pro Max 16 Plus | |
| Dell Precision 5690 | |
| HP ZBook Studio 16 G11 | |
| HP ZBook X G1i 16 | |
| HP ZBook Power 16 G11 A | |
| Dota 2 Reborn - 1920x1080 ultra (3/3) best looking | |
| Dell Pro Max 16 Plus | |
| Lenovo ThinkPad P16 Gen 2 | |
| HP ZBook Studio 16 G11 | |
| HP ZBook X G1i 16 | |
| Dell Precision 5690 | |
| HP ZBook Power 16 G11 A | |
| X-Plane 11.11 - 1920x1080 high (fps_test=3) | |
| Lenovo ThinkPad P16 Gen 2 | |
| Dell Pro Max 16 Plus | |
| Dell Precision 5690 | |
| HP ZBook Studio 16 G11 | |
| HP ZBook X G1i 16 | |
| HP ZBook Power 16 G11 A | |
赛博朋克 2077》超 FPS 图表
| low | med. | high | ultra | QHD DLSS | QHD | |
|---|---|---|---|---|---|---|
| GTA V (2015) | 186.2 | 183.1 | 177.8 | 112.7 | 88.4 | |
| Dota 2 Reborn (2015) | 170.1 | 158.1 | 151.1 | 141.8 | ||
| Final Fantasy XV Benchmark (2018) | 206 | 129.5 | 100.2 | 71 | ||
| X-Plane 11.11 (2018) | 102 | 92.2 | 80.6 | |||
| Strange Brigade (2018) | 480 | 252 | 198.7 | 171.3 | 119.2 | |
| Baldur's Gate 3 (2023) | 116.1 | 99.7 | 89.6 | 89.5 | 90 | 60.4 |
| Cyberpunk 2077 (2023) | 112.5 | 93.5 | 80 | 72.1 | 52.4 | 43.6 |
| F1 24 (2024) | 214 | 205 | 161.4 | 48.2 | 48.8 | 32.2 |
排放量
系统噪音
在运行要求不高的负载时,风扇很慵懒,但在长时间运行要求较高的负载(如《赛博朋克 2077》)时,风扇会变得相当响亮,噪音略高于 50 dB(A)。
Noise level
| Idle |
| 23.7 / 23.7 / 23.7 dB(A) |
| Load |
| 32.7 / 48 dB(A) |
 | ||
30 dB silent 40 dB(A) audible 50 dB(A) loud |
||
min: | ||
| HP ZBook X G1i 16 RTX PRO 2000 Blackwell Generation Laptop, Ultra 7 265H, Samsung PM9A1 MZVL22T0HBLB | HP ZBook Power 16 G11 A RTX 2000 Ada Generation Laptop, R7 8845HS, Samsung PM9A1 MZVL22T0HBLB | HP ZBook Studio 16 G11 RTX 3000 Ada Generation Laptop, Ultra 9 185H, Kioxia XG8 KXG80ZNV1T02 | Lenovo ThinkPad P16 Gen 2 RTX 4000 Ada Generation Laptop, i7-14700HX, SK hynix PC801 HFS001TEJ9X162N | Dell Pro Max 16 Plus RTX PRO 5000 Blackwell Generation Laptop, Ultra 9 285HX, SK hynix PCB01 HFS001TFM9X186N | Dell Precision 5690 RTX 5000 Ada Generation Laptop, Ultra 9 185H, 2x Samsung PM9A1 1TB (RAID 0) | |
|---|---|---|---|---|---|---|
| Noise | 6% | -4% | -16% | -18% | -11% | |
| off / environment * (dB) | 23.7 | 23.5 1% | 23.8 -0% | 23.9 -1% | 23.2 2% | 23.4 1% |
| Idle Minimum * (dB) | 23.7 | 23.8 -0% | 23.8 -0% | 29.1 -23% | 26.7 -13% | 23.6 -0% |
| Idle Average * (dB) | 23.7 | 24.2 -2% | 26.4 -11% | 29.1 -23% | 30.5 -29% | 24.9 -5% |
| Idle Maximum * (dB) | 23.7 | 24.2 -2% | 26.4 -11% | 29.1 -23% | 34 -43% | 30.9 -30% |
| Load Average * (dB) | 32.7 | 25.4 22% | 33.7 -3% | 41 -25% | 39.8 -22% | 40.4 -24% |
| Cyberpunk 2077 ultra * (dB) | 50.9 | 43 16% | 46.1 9% | 52.8 -4% | 54.3 -7% | |
| Load Maximum * (dB) | 48 | 45 6% | 53.2 -11% | 52.9 -10% | 54.3 -13% | 51.9 -8% |
| Witcher 3 ultra * (dB) | 48.3 |
* ... smaller is better
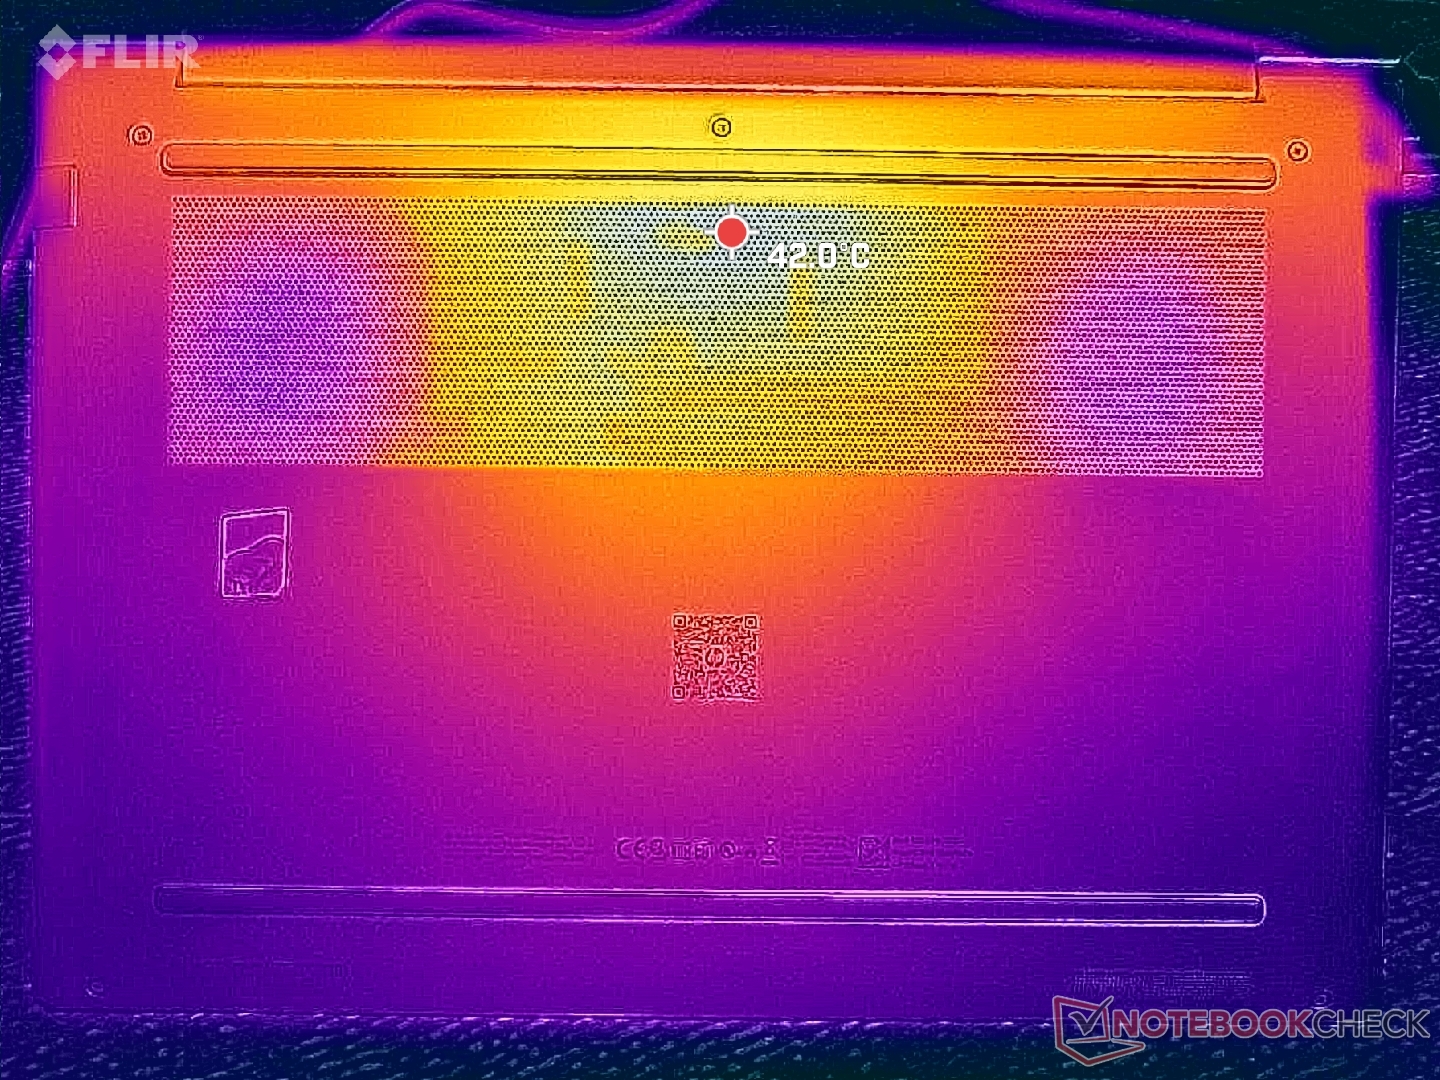
温度
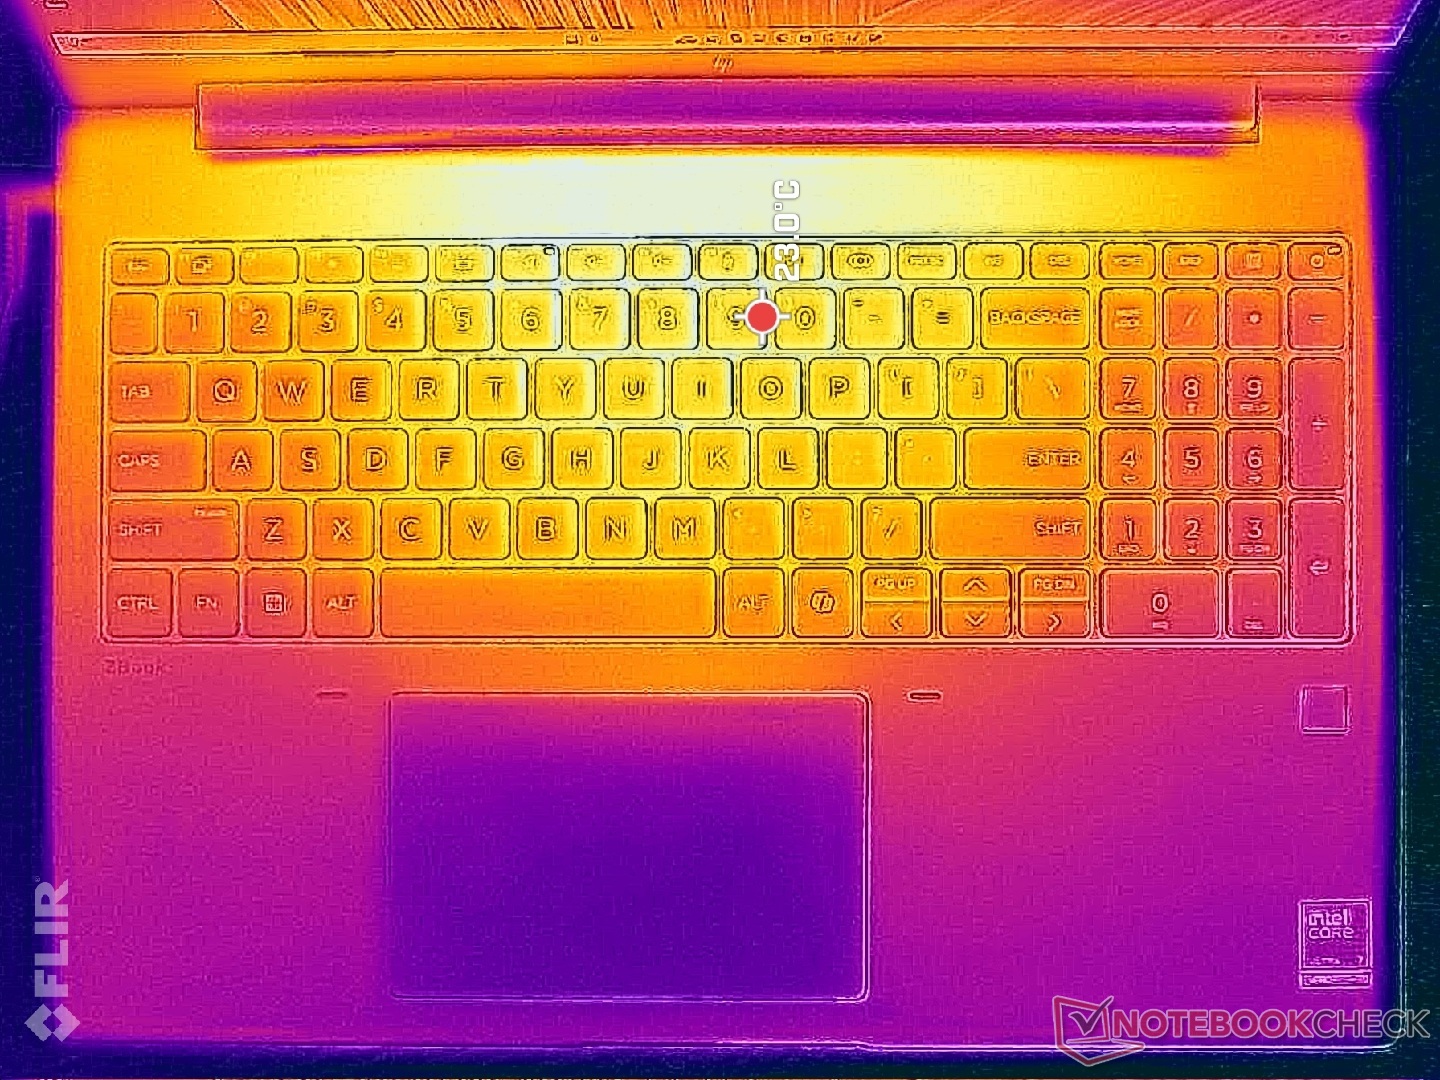
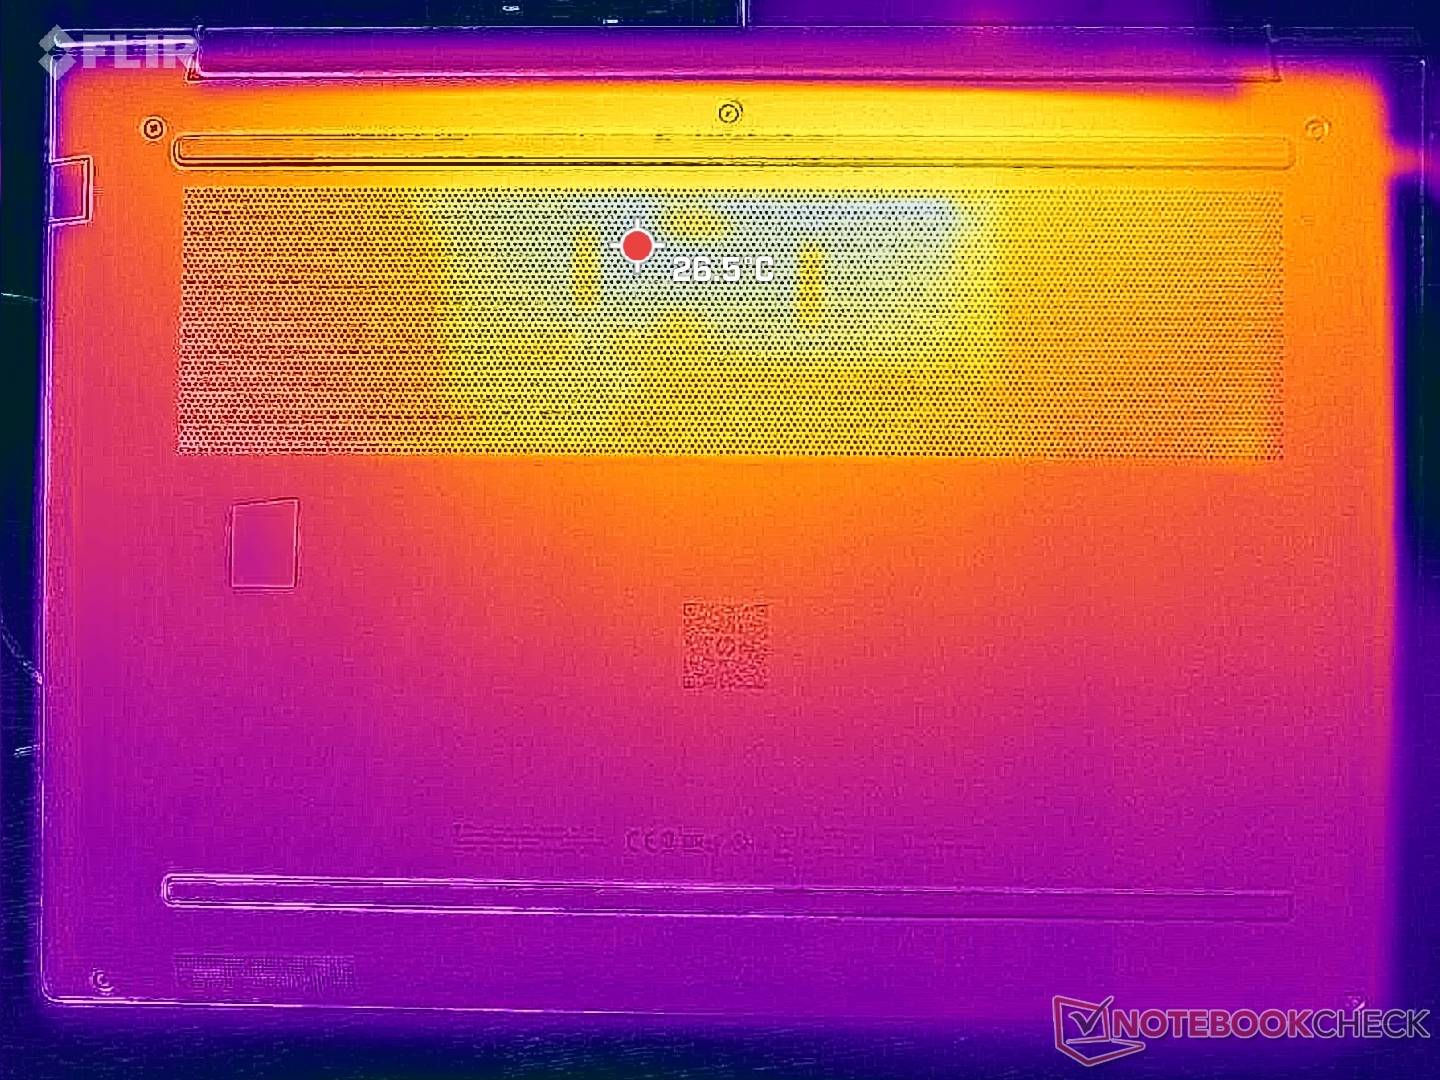
表面温度向中心发展的温度最高,在运行苛刻负载时可达到 36 摄氏度以上,明显低于我们在 ThinkPad P16 Gen 2 上记录的温度。 ThinkPad P16 Gen 2或 戴尔Precision 5690.
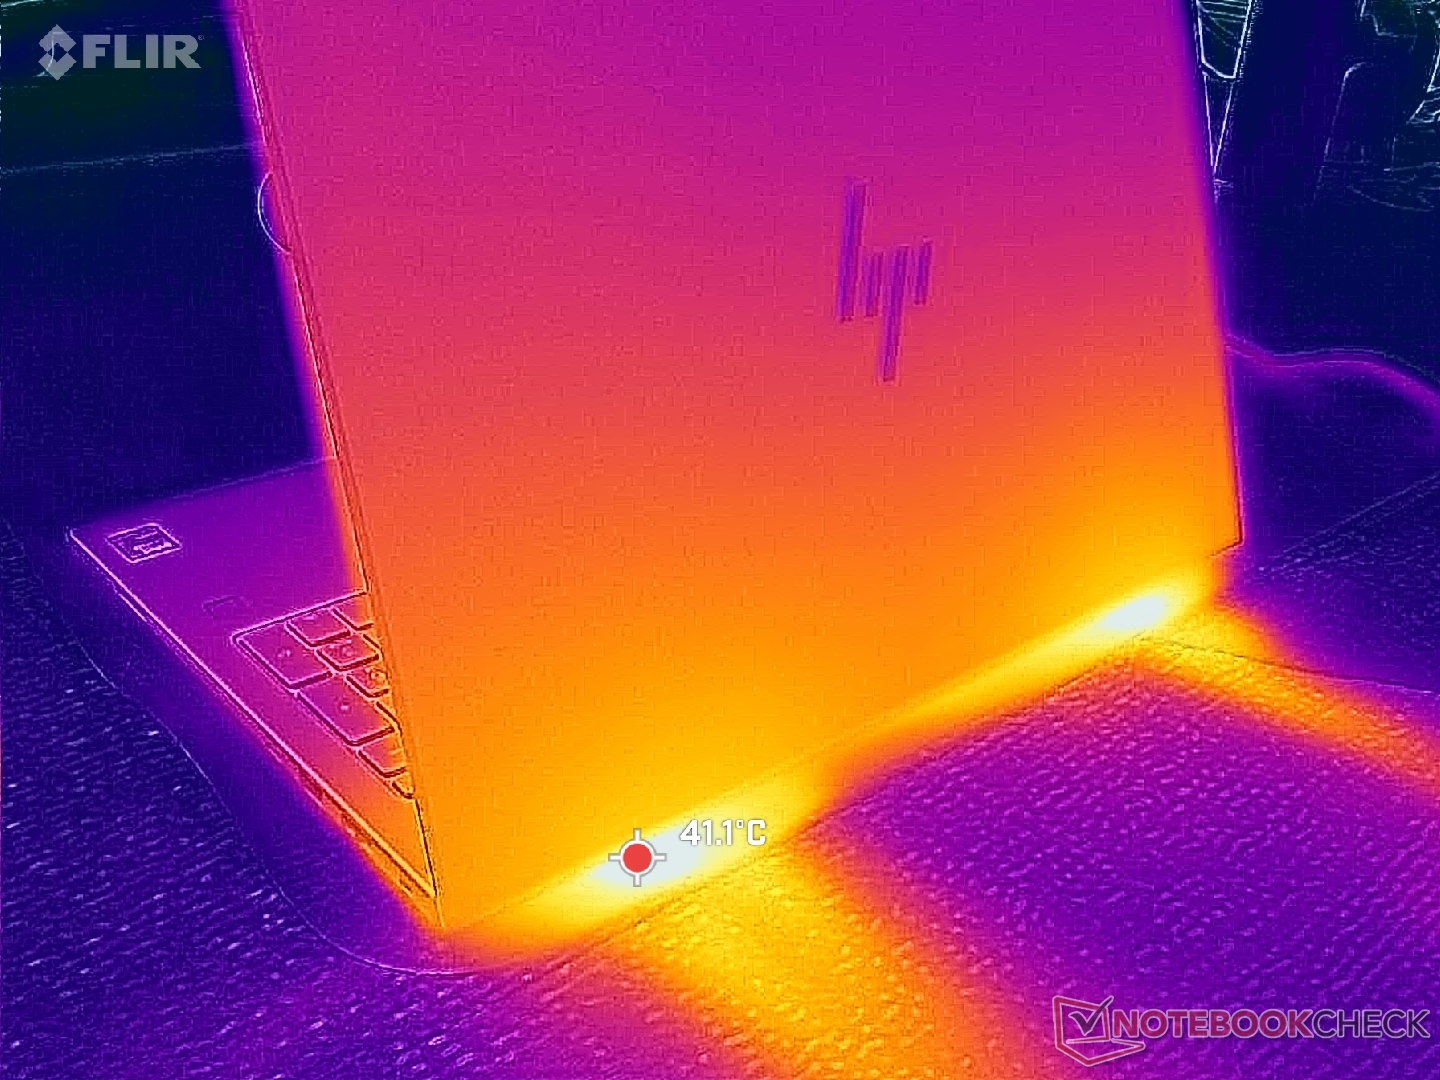
(+) The maximum temperature on the upper side is 36 °C / 97 F, compared to the average of 38.2 °C / 101 F, ranging from 22.2 to 69.8 °C for the class Workstation.
(+) The bottom heats up to a maximum of 39.4 °C / 103 F, compared to the average of 41.1 °C / 106 F
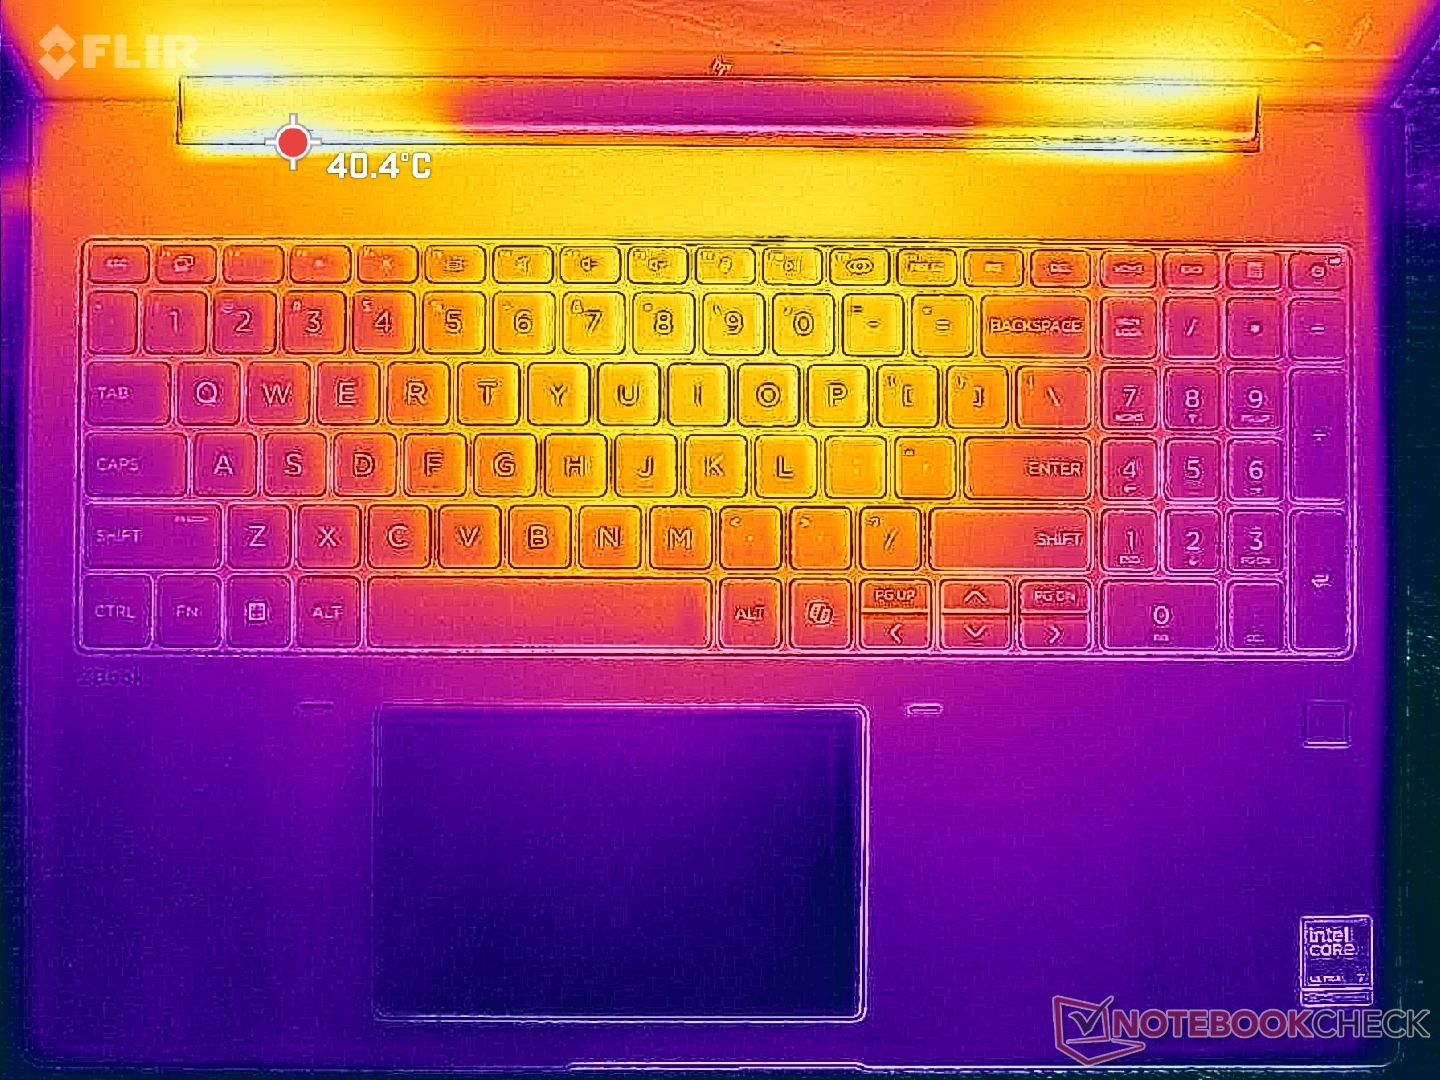
(+) In idle usage, the average temperature for the upper side is 26.9 °C / 80 F, compared to the device average of 32 °C / 90 F.
(+) The palmrests and touchpad are cooler than skin temperature with a maximum of 24.2 °C / 75.6 F and are therefore cool to the touch.
(+) The average temperature of the palmrest area of similar devices was 27.8 °C / 82 F (+3.6 °C / 6.4 F).
| HP ZBook X G1i 16 Intel Core Ultra 7 265H, NVIDIA RTX PRO 2000 Blackwell Generation Laptop | HP ZBook Power 16 G11 A AMD Ryzen 7 8845HS, NVIDIA RTX 2000 Ada Generation Laptop | HP ZBook Studio 16 G11 Intel Core Ultra 9 185H, NVIDIA RTX 3000 Ada Generation Laptop | Lenovo ThinkPad P16 Gen 2 Intel Core i7-14700HX, NVIDIA RTX 4000 Ada Generation Laptop | Dell Pro Max 16 Plus Intel Core Ultra 9 285HX, NVIDIA RTX PRO 5000 Blackwell Generation Laptop | Dell Precision 5690 Intel Core Ultra 9 185H, NVIDIA RTX 5000 Ada Generation Laptop | |
|---|---|---|---|---|---|---|
| Heat | 4% | -10% | -5% | -10% | -3% | |
| Maximum Upper Side * (°C) | 36 | 40.6 -13% | 36.6 -2% | 46.6 -29% | 40.4 -12% | 46.6 -29% |
| Maximum Bottom * (°C) | 39.4 | 40.6 -3% | 47.8 -21% | 51 -29% | 45.6 -16% | 33 16% |
| Idle Upper Side * (°C) | 30.4 | 26 14% | 31.4 -3% | 24.8 18% | 32.8 -8% | 32.4 -7% |
| Idle Bottom * (°C) | 31.8 | 26.6 16% | 35.6 -12% | 25.6 19% | 33 -4% | 29.4 8% |
* ... smaller is better
压力测试
在启动 Prime95 压力测试时,CPU 会提升到 3.6 GHz、108 W 和 104 C,然后再下降并稳定在 3.0 GHz、62 W 和 88 C,以表示有限的最大 Turbo Boost 持续性。有趣的是,同时运行 Prime95 和 FurMark 时,CPU 时钟速率会循环变化,而 GPU 时钟速率则保持不变。
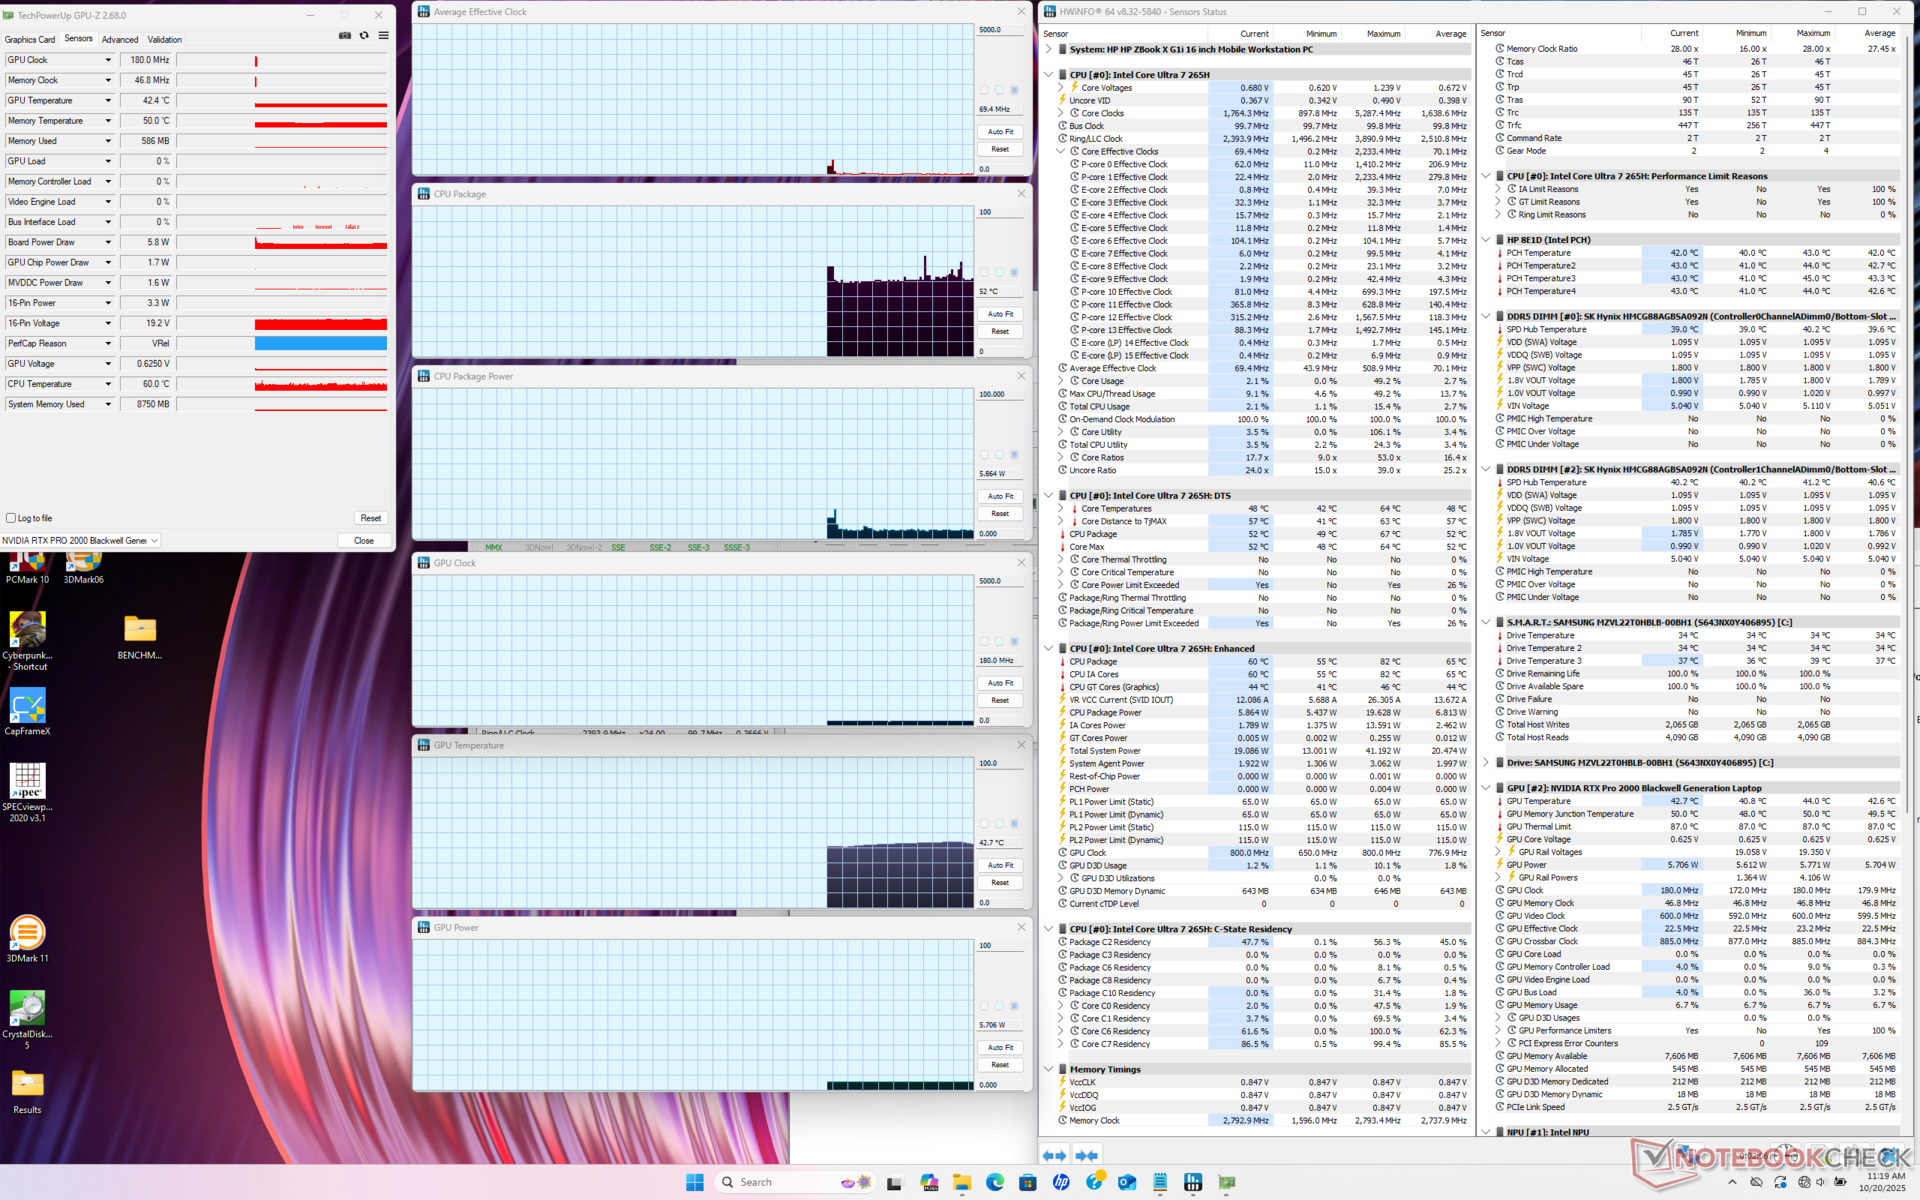
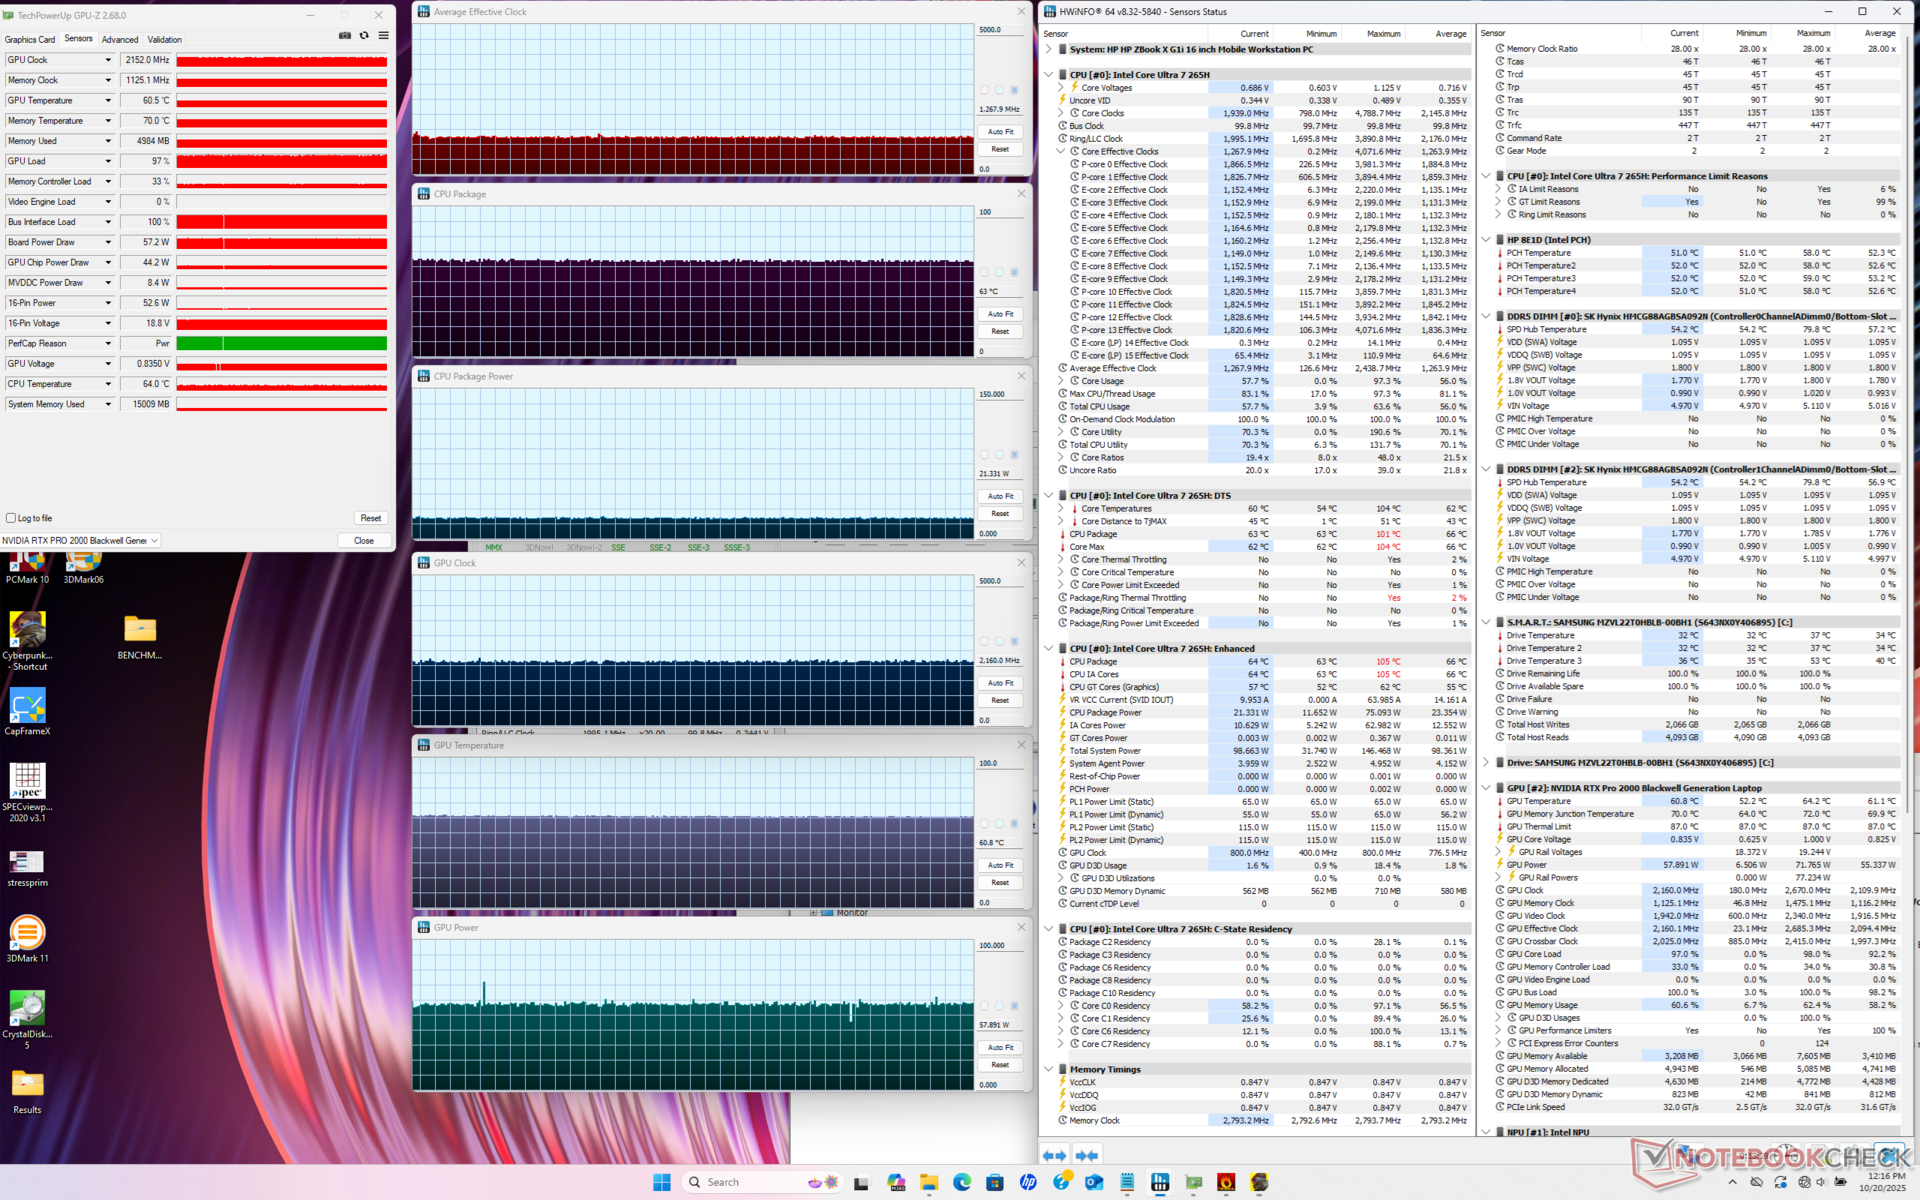
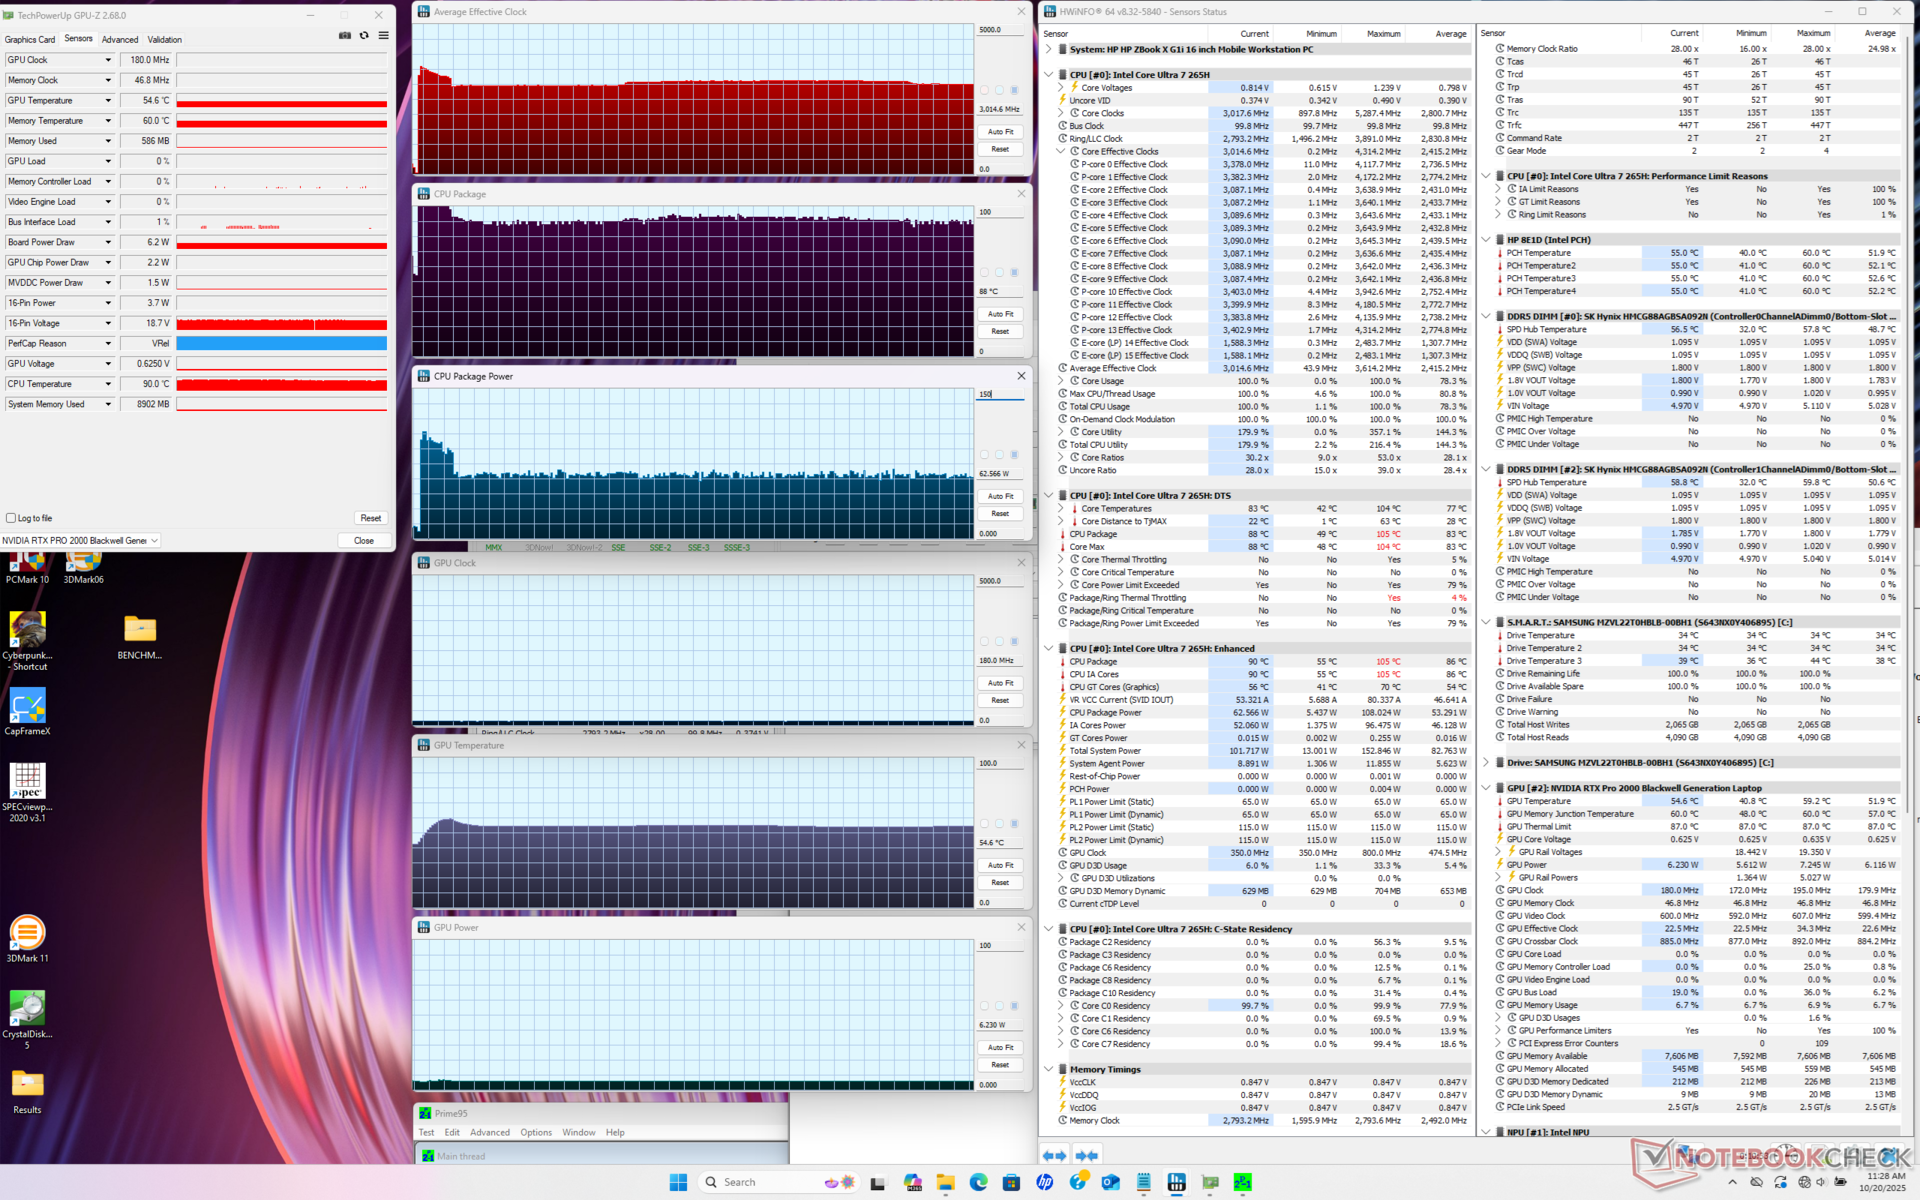

| 平均 CPU 时钟 (GHz) | GPU 时钟 (MHz) | 平均 CPU 温度 (°C) | 平均 GPU 温度 (°C) | |
| 系统闲置 | -- | -- | 52 | 43 |
| Prime95 压力 | 3.0 | -- | 88 | 55 |
| Prime95 + FurMark 压力 | 2.5 - 2.9 | 1215 | 83 - 91 | 65 |
| 赛博朋克 2077》压力 | 1.3 | 2160 | 63 | 61 |
发言人
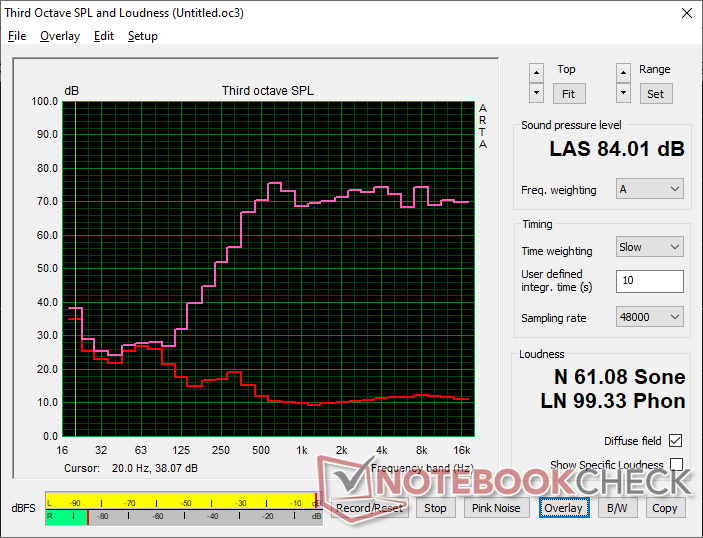
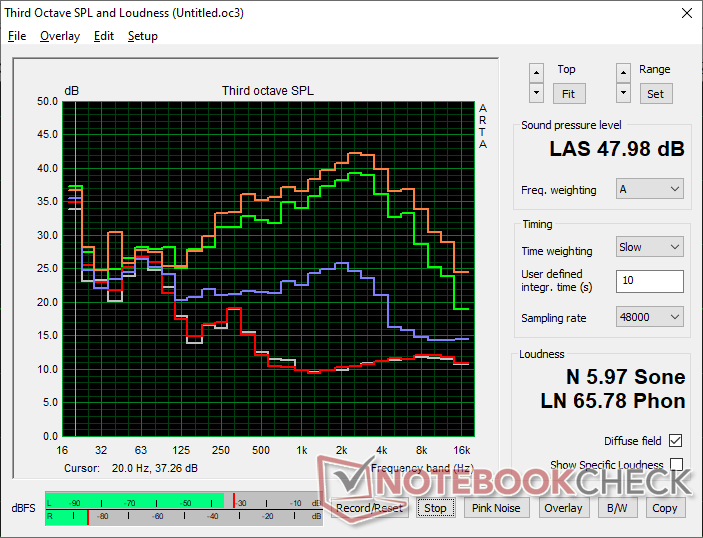
HP ZBook X G1i 16 audio analysis
(+) | speakers can play relatively loud (84 dB)
Bass 100 - 315 Hz
(-) | nearly no bass - on average 28% lower than median
(±) | linearity of bass is average (8.8% delta to prev. frequency)
Mids 400 - 2000 Hz
(+) | balanced mids - only 1.9% away from median
(+) | mids are linear (6.1% delta to prev. frequency)
Highs 2 - 16 kHz
(+) | balanced highs - only 2.9% away from median
(+) | highs are linear (5.1% delta to prev. frequency)
Overall 100 - 16.000 Hz
(±) | linearity of overall sound is average (15.6% difference to median)
Compared to same class
» 35% of all tested devices in this class were better, 11% similar, 54% worse
» The best had a delta of 7%, average was 17%, worst was 35%
Compared to all devices tested
» 23% of all tested devices were better, 5% similar, 72% worse
» The best had a delta of 4%, average was 23%, worst was 134%
Apple MacBook Pro 16 2021 M1 Pro audio analysis
(+) | speakers can play relatively loud (84.7 dB)
Bass 100 - 315 Hz
(+) | good bass - only 3.8% away from median
(+) | bass is linear (5.2% delta to prev. frequency)
Mids 400 - 2000 Hz
(+) | balanced mids - only 1.3% away from median
(+) | mids are linear (2.1% delta to prev. frequency)
Highs 2 - 16 kHz
(+) | balanced highs - only 1.9% away from median
(+) | highs are linear (2.7% delta to prev. frequency)
Overall 100 - 16.000 Hz
(+) | overall sound is linear (4.6% difference to median)
Compared to same class
» 0% of all tested devices in this class were better, 0% similar, 100% worse
» The best had a delta of 5%, average was 17%, worst was 45%
Compared to all devices tested
» 0% of all tested devices were better, 0% similar, 100% worse
» The best had a delta of 4%, average was 23%, worst was 134%
能源管理
耗电量
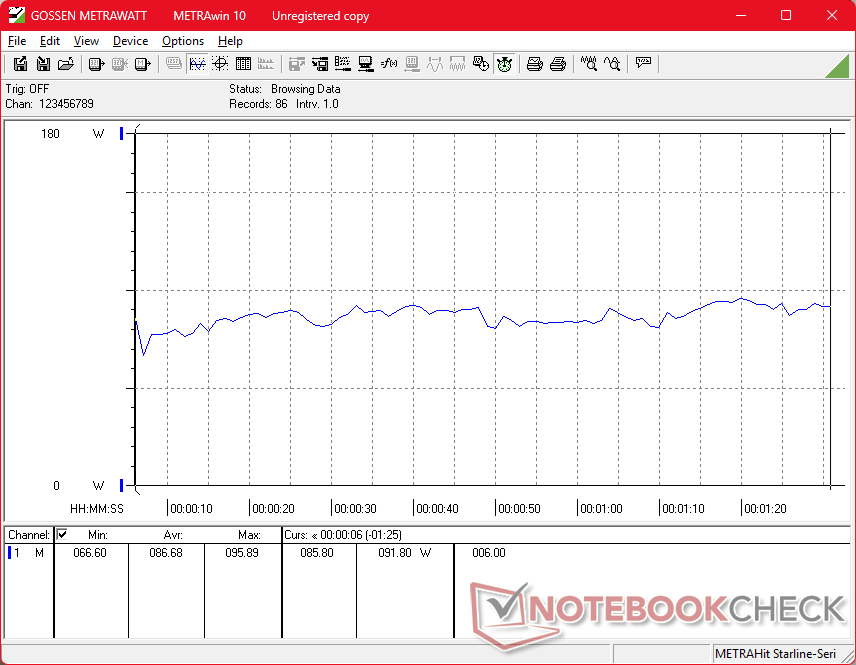
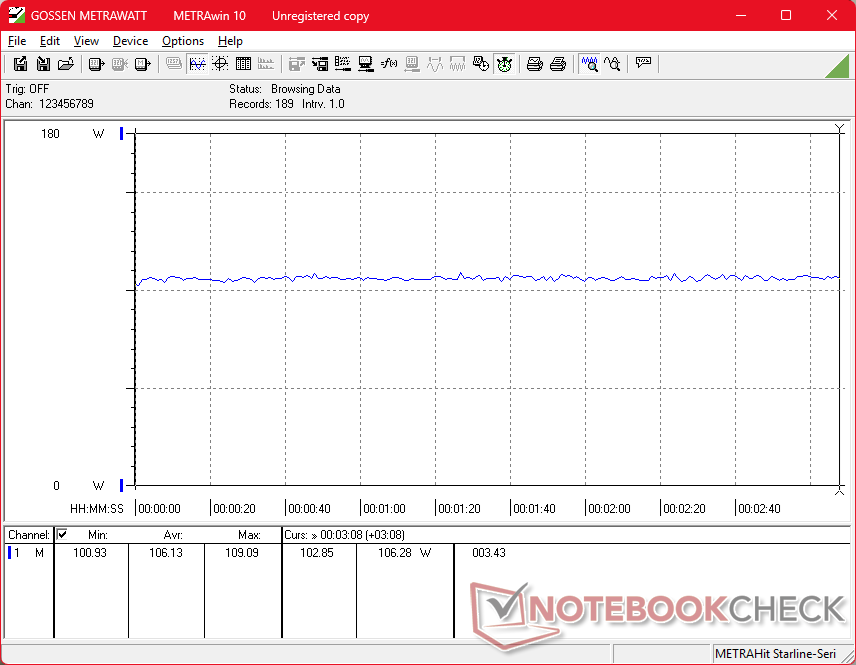
负载时的平均耗电量略高于我们在采用 AMD 技术的旧款 ZBook Power 16 G11 A.不过,我们的 ZBook X G1i 16 也是速度更快、更精简的机器,因此保留了较高的每瓦性能。
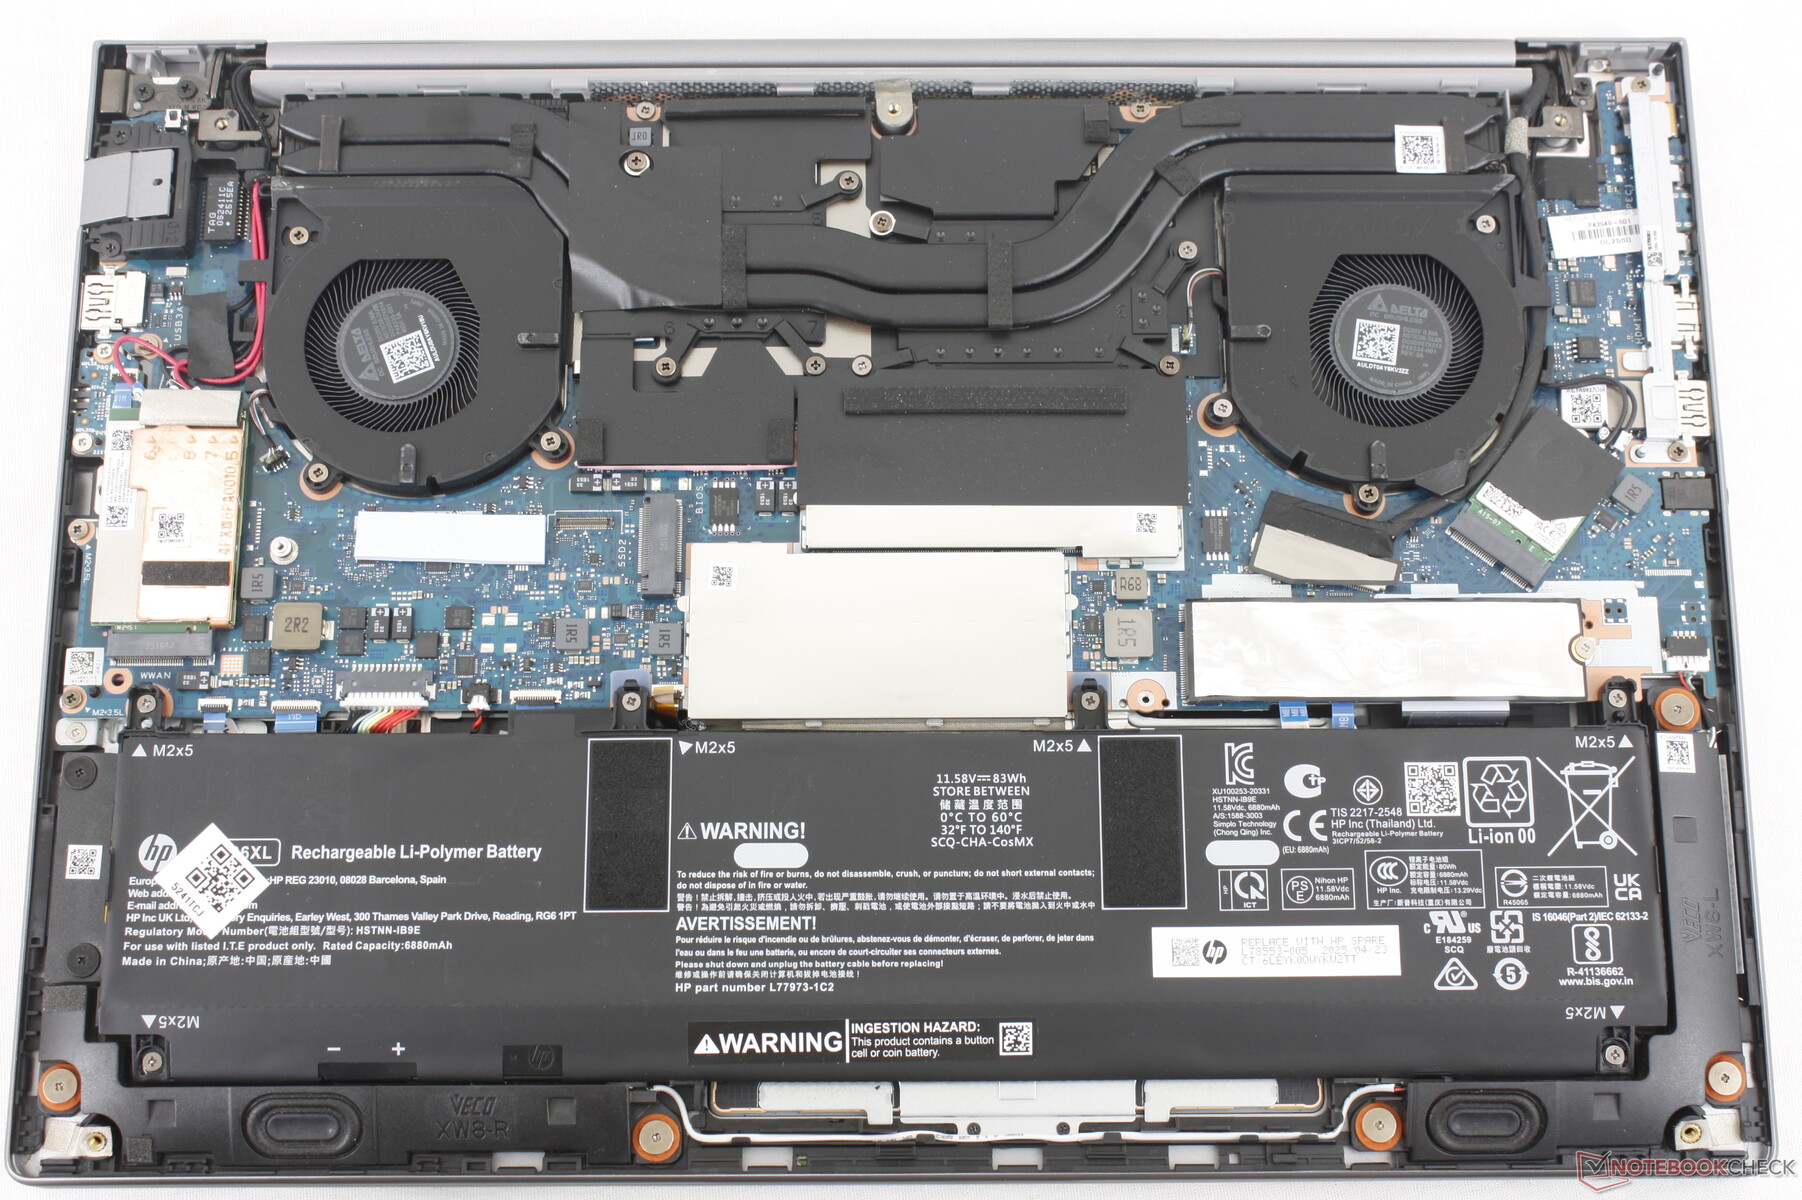
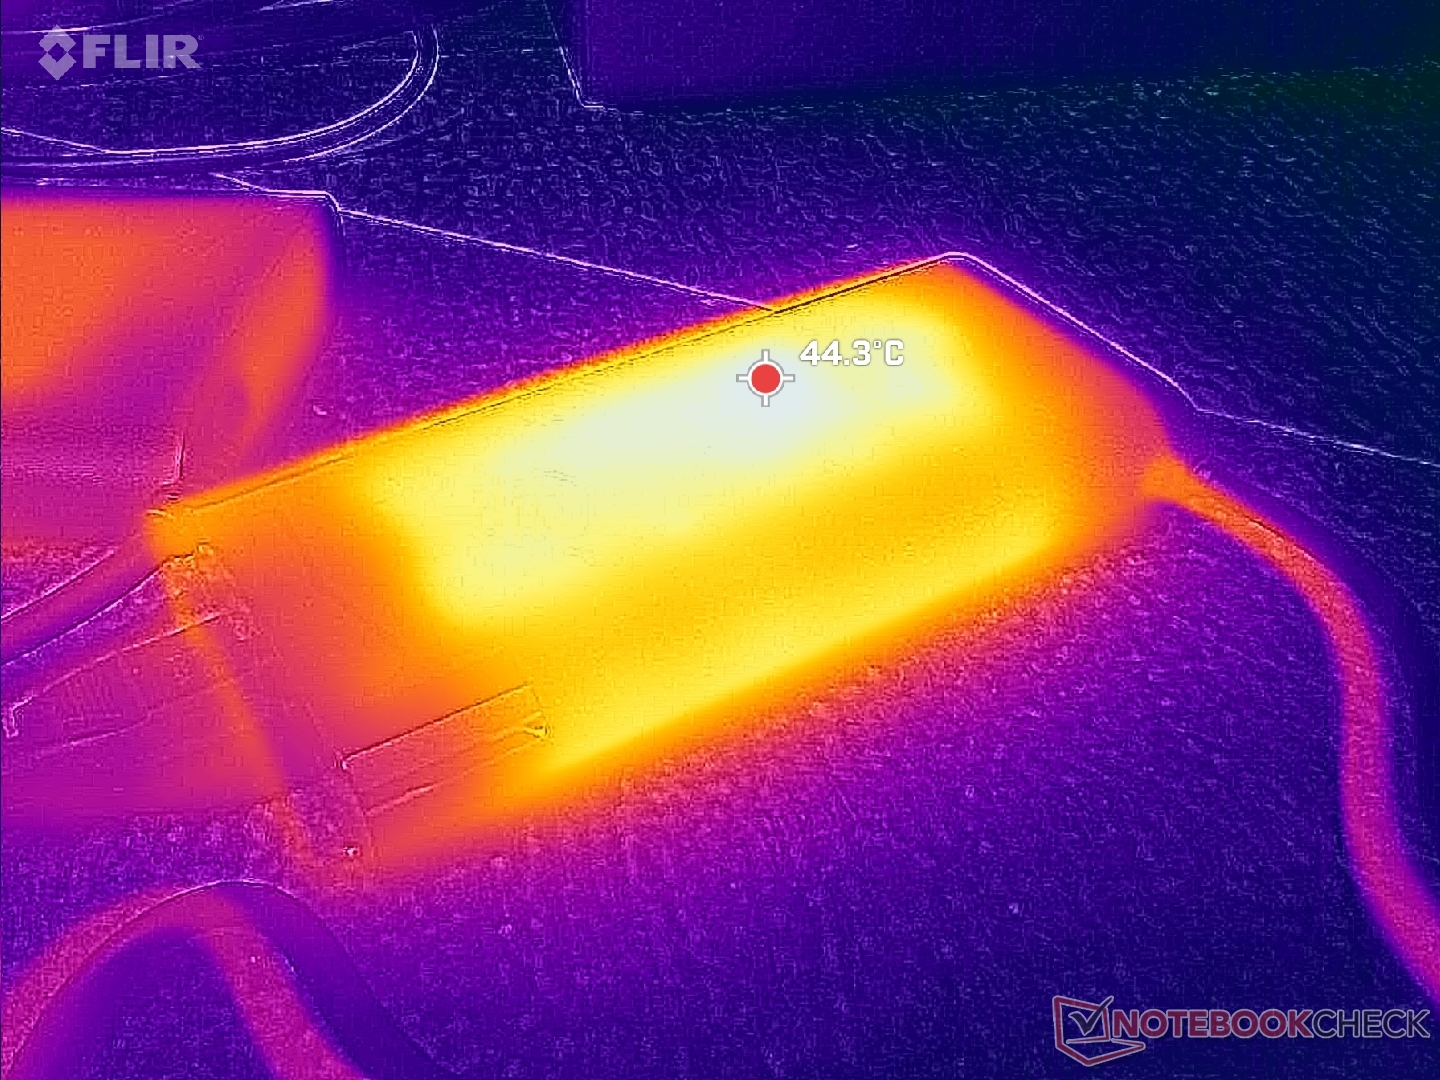
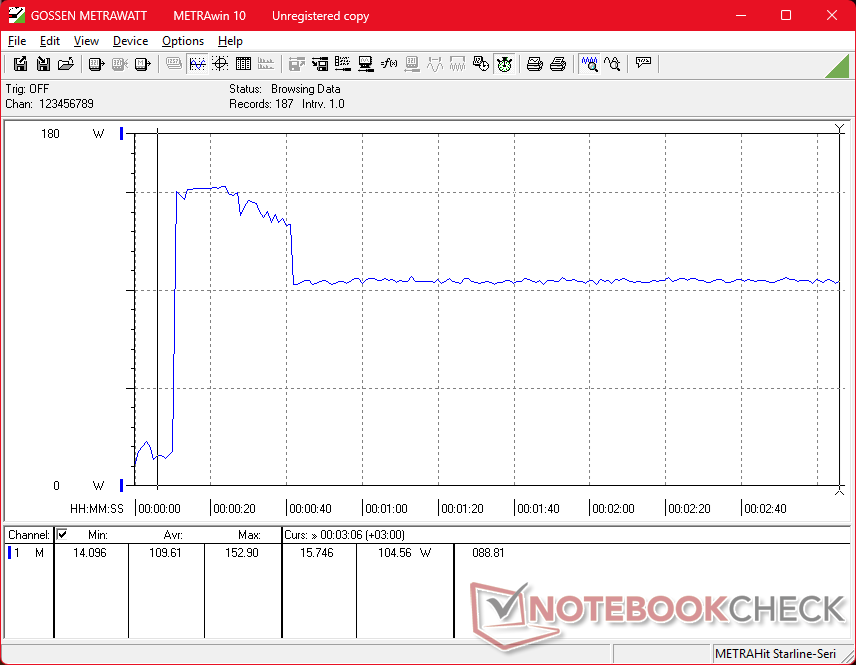
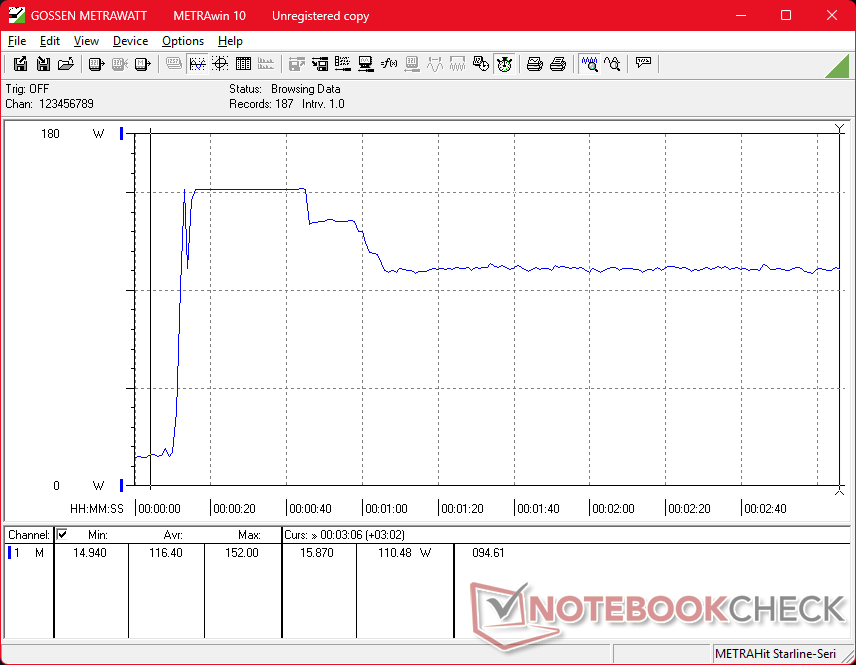
当 CPU 和 GPU 处于满负荷工作状态时,我们可以测量到小巧(约 13.8 x 6.5 x 2.2 厘米)的 150 瓦交流适配器的临时最大功耗为 153 瓦。
| Off / Standby | |
| Idle | |
| Load |
|
Key:
min: | |
| HP ZBook X G1i 16 Ultra 7 265H, RTX PRO 2000 Blackwell Generation Laptop, Samsung PM9A1 MZVL22T0HBLB, IPS, 2560x1600, 16" | HP ZBook Power 16 G11 A R7 8845HS, RTX 2000 Ada Generation Laptop, Samsung PM9A1 MZVL22T0HBLB, IPS, 2560x1600, 16" | HP ZBook Studio 16 G11 Ultra 9 185H, RTX 3000 Ada Generation Laptop, Kioxia XG8 KXG80ZNV1T02, IPS, 3840x2400, 16" | Lenovo ThinkPad P16 Gen 2 i7-14700HX, RTX 4000 Ada Generation Laptop, SK hynix PC801 HFS001TEJ9X162N, IPS, 2560x1600, 16" | Dell Pro Max 16 Plus Ultra 9 285HX, RTX PRO 5000 Blackwell Generation Laptop, SK hynix PCB01 HFS001TFM9X186N, OLED, 3840x2400, 16" | Dell Precision 5690 Ultra 9 185H, RTX 5000 Ada Generation Laptop, 2x Samsung PM9A1 1TB (RAID 0), OLED, 3840x2400, 16" | |
|---|---|---|---|---|---|---|
| Power Consumption | 2% | -85% | -90% | -279% | -72% | |
| Idle Minimum * (Watt) | 4.1 | 4.6 -12% | 14 -241% | 7.9 -93% | 35.1 -756% | 7.9 -93% |
| Idle Average * (Watt) | 9 | 10 -11% | 22.4 -149% | 13.1 -46% | 39.2 -336% | 12 -33% |
| Idle Maximum * (Watt) | 9.4 | 10.6 -13% | 25.7 -173% | 24.2 -157% | 56 -496% | 28.6 -204% |
| Load Average * (Watt) | 86.7 | 60.9 30% | 90.2 -4% | 127.4 -47% | 130.2 -50% | 98.8 -14% |
| Cyberpunk 2077 ultra external monitor * (Watt) | 102 | 92.8 9% | 120.3 -18% | 219 -115% | 213 -109% | |
| Cyberpunk 2077 ultra * (Watt) | 106.1 | 96.8 9% | 125.4 -18% | 225 -112% | 229 -116% | |
| Load Maximum * (Watt) | 152.9 | 154.8 -1% | 142 7% | 248.5 -63% | 285.2 -87% | 174.8 -14% |
| Witcher 3 ultra * (Watt) | 144.5 |
* ... smaller is better
功耗 赛博朋克/压力测试
外部显示器功耗
电池寿命
无线局域网运行时间长达 12.5 小时,比上一代Precision 5690 或 ZBook Power 16 G11 A 各长出几个小时,表现出色。
| HP ZBook X G1i 16 Ultra 7 265H, RTX PRO 2000 Blackwell Generation Laptop, 83 Wh | HP ZBook Power 16 G11 A R7 8845HS, RTX 2000 Ada Generation Laptop, 83 Wh | HP ZBook Studio 16 G11 Ultra 9 185H, RTX 3000 Ada Generation Laptop, 86 Wh | Lenovo ThinkPad P16 Gen 2 i7-14700HX, RTX 4000 Ada Generation Laptop, 94 Wh | Dell Pro Max 16 Plus Ultra 9 285HX, RTX PRO 5000 Blackwell Generation Laptop, 96 Wh | Dell Precision 5690 Ultra 9 185H, RTX 5000 Ada Generation Laptop, 98 Wh | |
|---|---|---|---|---|---|---|
| Battery runtime | -22% | -62% | -80% | -71% | -26% | |
| WiFi v1.3 (h) | 12.5 | 9.7 -22% | 4.8 -62% | 2.5 -80% | 3.6 -71% | 9.2 -26% |
| Reader / Idle (h) | 26.1 | |||||
| Load (h) | 1.7 |
笔记本检查评级
高品质、精益求精的移动工作站,具有中端性能。
HP ZBook X G1i 16
- 10/22/2025 v8
Allen Ngo
 Total Sustainability Score:
 潜在竞争对手比较
Image | Model / Review | Price | Weight | Height | Display |
|---|---|---|---|---|---|
1. 87.4%  | HP ZBook X G1i 16 Intel Core Ultra 7 265H ⎘ NVIDIA RTX PRO 2000 Blackwell Generation Laptop ⎘ 64 GB Memory, 2048 GB SSD | Amazon: List Price: 2700 USD | 2.2 kg | 23 mm | 16.00" 2560x1600 189 PPI IPS |
2. 85.4%  | HP ZBook Power 16 G11 A AMD Ryzen 7 8845HS ⎘ NVIDIA RTX 2000 Ada Generation Laptop ⎘ 64 GB Memory, 2048 GB SSD | Amazon: List Price: 2100 USD | 2.2 kg | 22.9 mm | 16.00" 2560x1600 189 PPI IPS |
3. 84.2%  | HP ZBook Studio 16 G11 Intel Core Ultra 9 185H ⎘ NVIDIA RTX 3000 Ada Generation Laptop ⎘ 64 GB Memory, 1024 GB SSD | Amazon: List Price: 4300 USD | 1.8 kg | 19 mm | 16.00" 3840x2400 283 PPI IPS |
4. 85.9%  | Lenovo ThinkPad P16 Gen 2 Intel Core i7-14700HX ⎘ NVIDIA RTX 4000 Ada Generation Laptop ⎘ 32 GB Memory, 1024 GB SSD | Amazon: List Price: 3500 USD | 3.1 kg | 30.23 mm | 16.00" 2560x1600 189 PPI IPS |
5. 88.4%  | Dell Pro Max 16 Plus Intel Core Ultra 9 285HX ⎘ NVIDIA RTX PRO 5000 Blackwell Generation Laptop ⎘ 128 GB Memory, SSD | Amazon: List Price: 5000 USD | 2.8 kg | 30.9 mm | 16.00" 3840x2400 283 PPI OLED |
6. 88.3% v7 (old)  | Dell Precision 5690 Intel Core Ultra 9 185H ⎘ NVIDIA RTX 5000 Ada Generation Laptop ⎘ 32 GB Memory, 2048 GB SSD | Amazon: List Price: 5900 USD | 2.3 kg | 22.17 mm | 16.00" 3840x2400 283 PPI OLED |
Transparency
The selection of devices to be reviewed is made by our editorial team. The test sample was provided to the author as a loan by the manufacturer or retailer for the purpose of this review. The lender had no influence on this review, nor did the manufacturer receive a copy of this review before publication. There was no obligation to publish this review. As an independent media company, Notebookcheck is not subjected to the authority of manufacturers, retailers or publishers.
This is how Notebookcheck is testing
Every year, Notebookcheck independently reviews hundreds of laptops and smartphones using standardized procedures to ensure that all results are comparable. We have continuously developed our test methods for around 20 years and set industry standards in the process. In our test labs, high-quality measuring equipment is utilized by experienced technicians and editors. These tests involve a multi-stage validation process. Our complex rating system is based on hundreds of well-founded measurements and benchmarks, which maintains objectivity. Further information on our test methods can be found here.

