戴尔Precision 7875 高端工作站评测:配备 96 个核心和 Nvidia RTX 6000 的 AMD Ryzen Threadripper PRO 7995WX
")
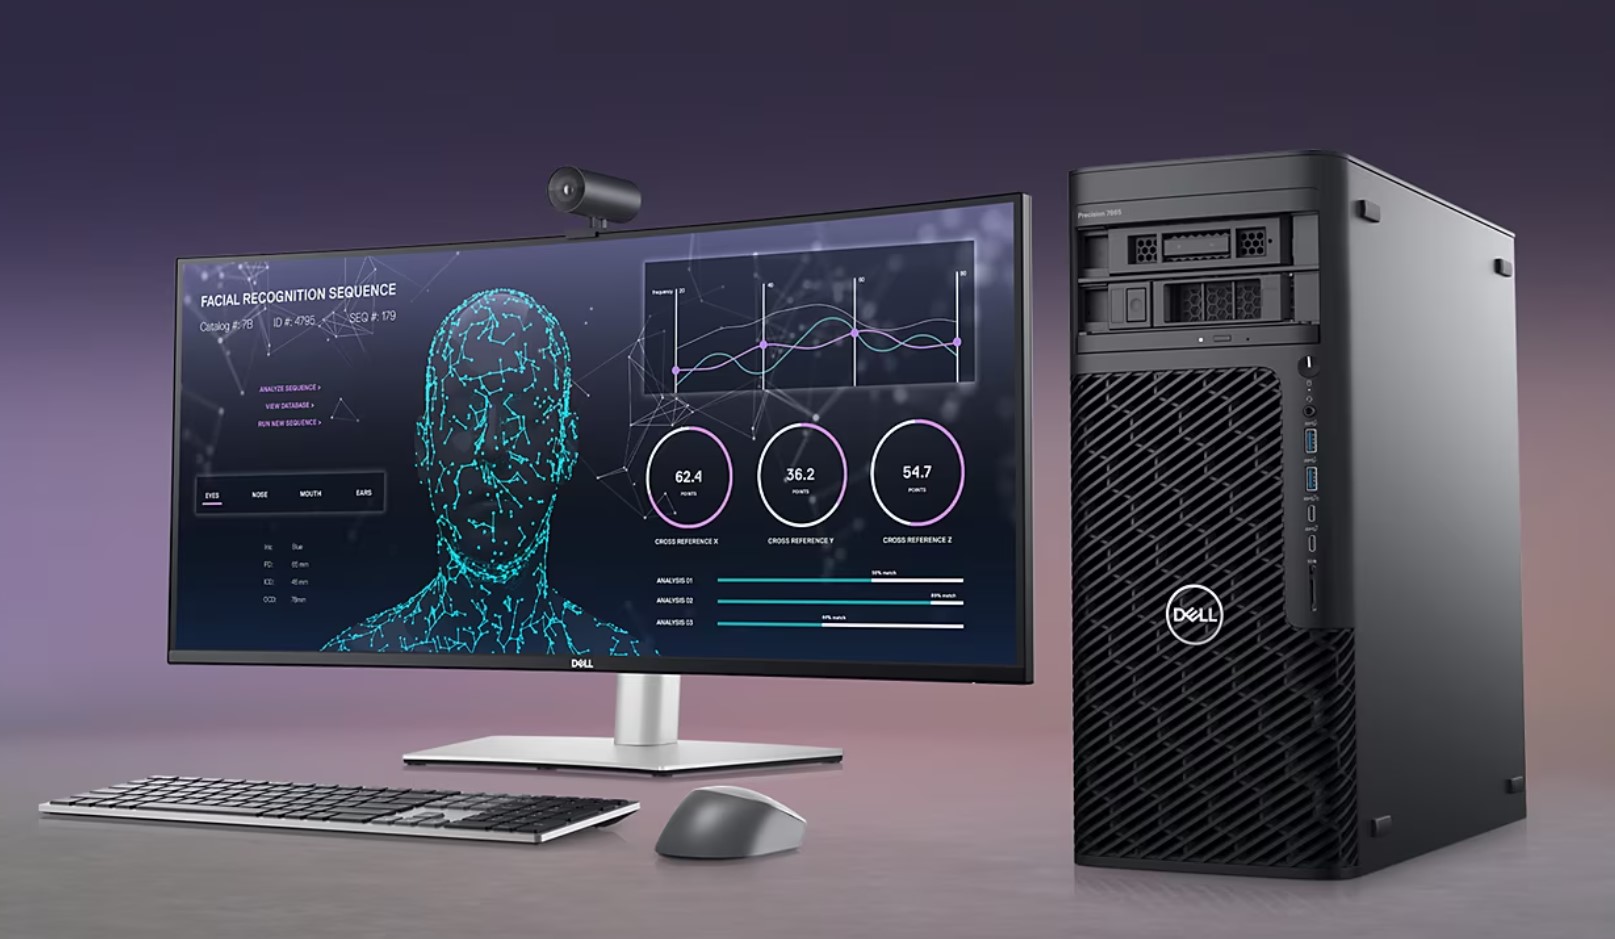
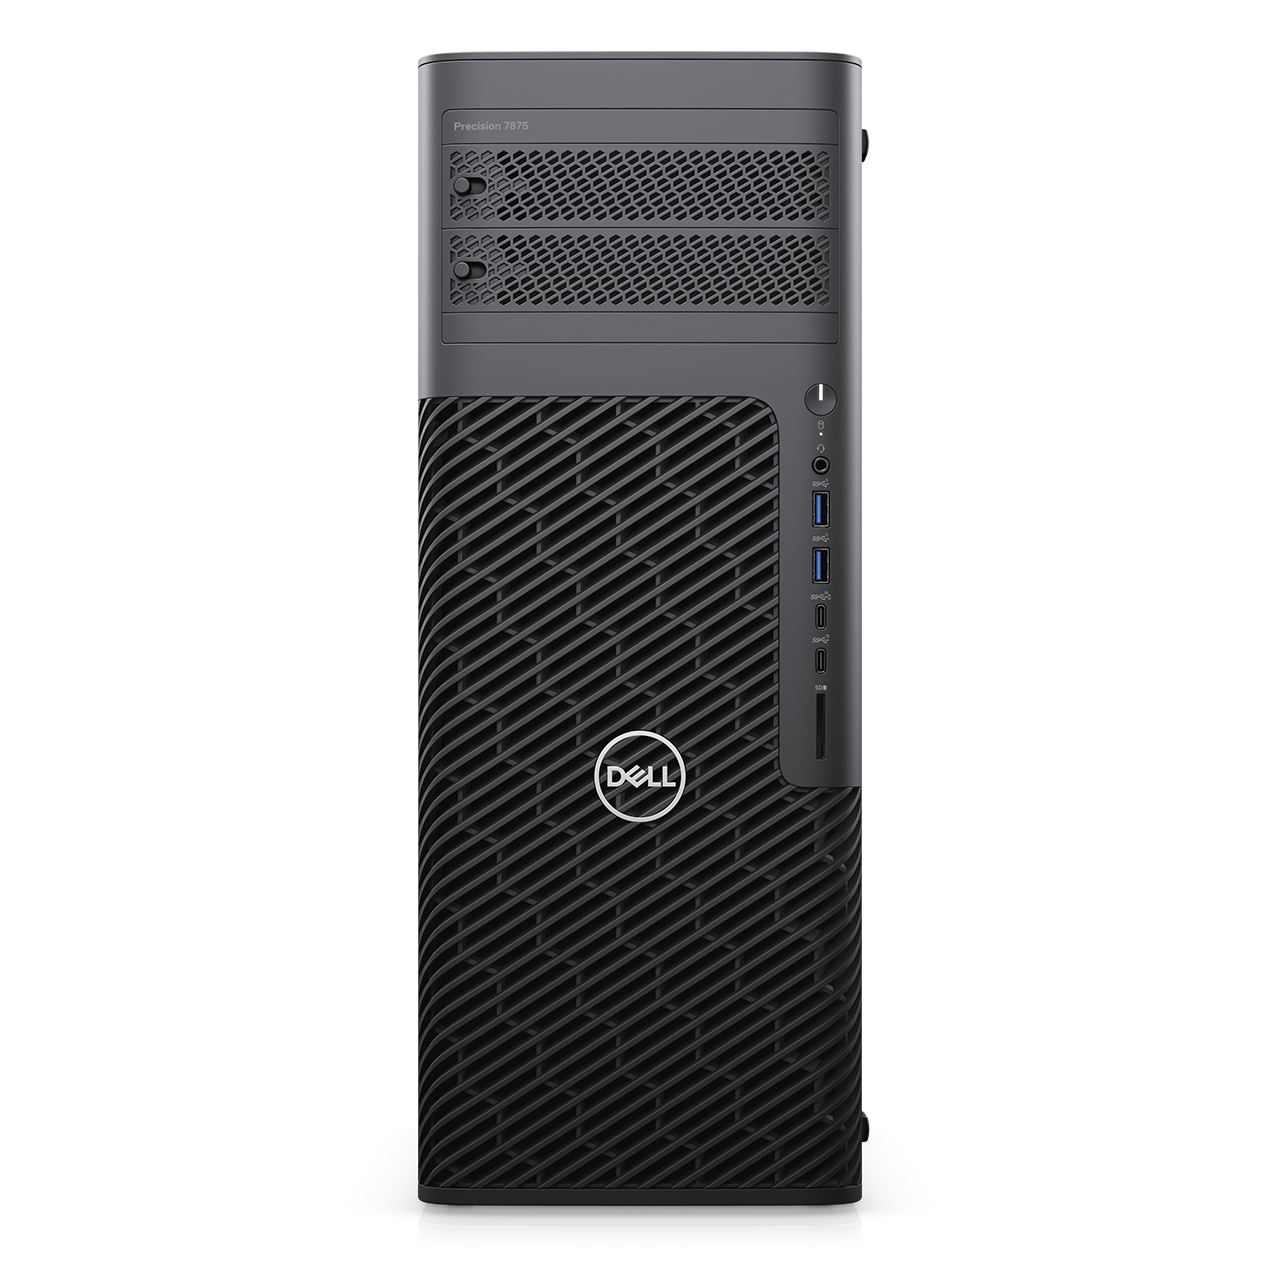
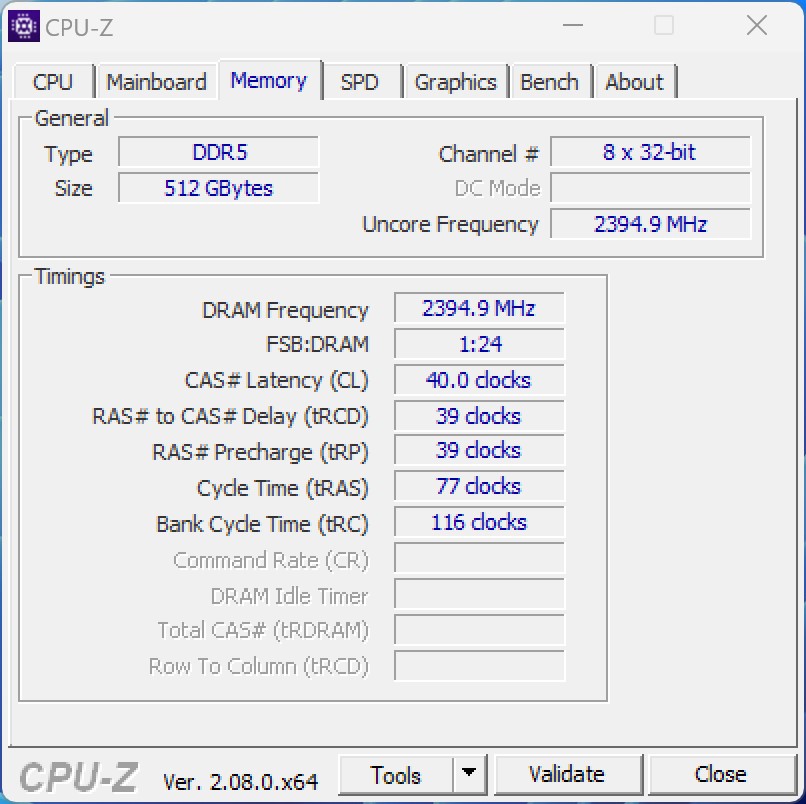
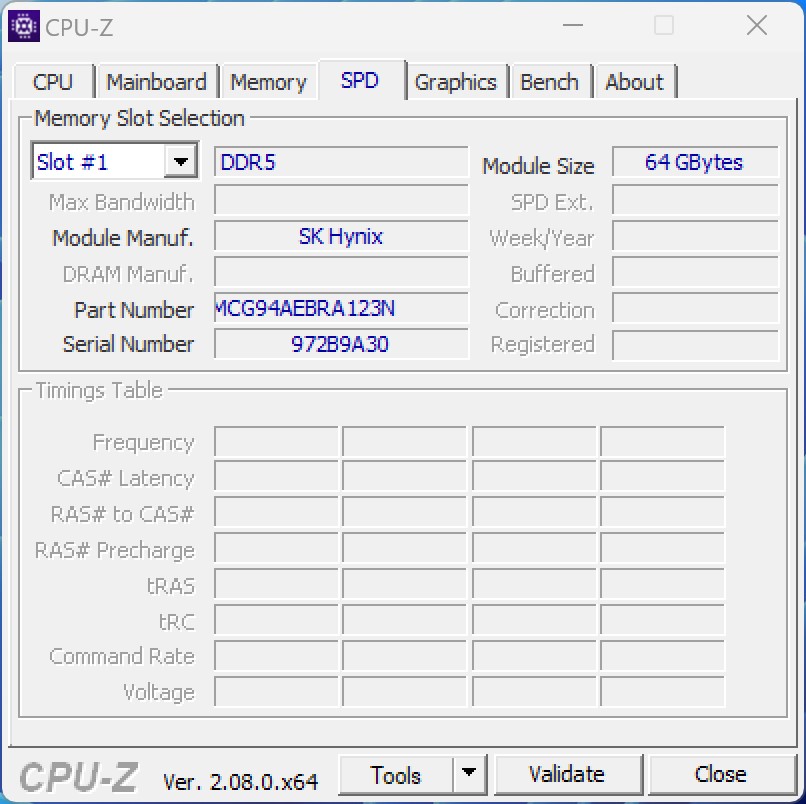
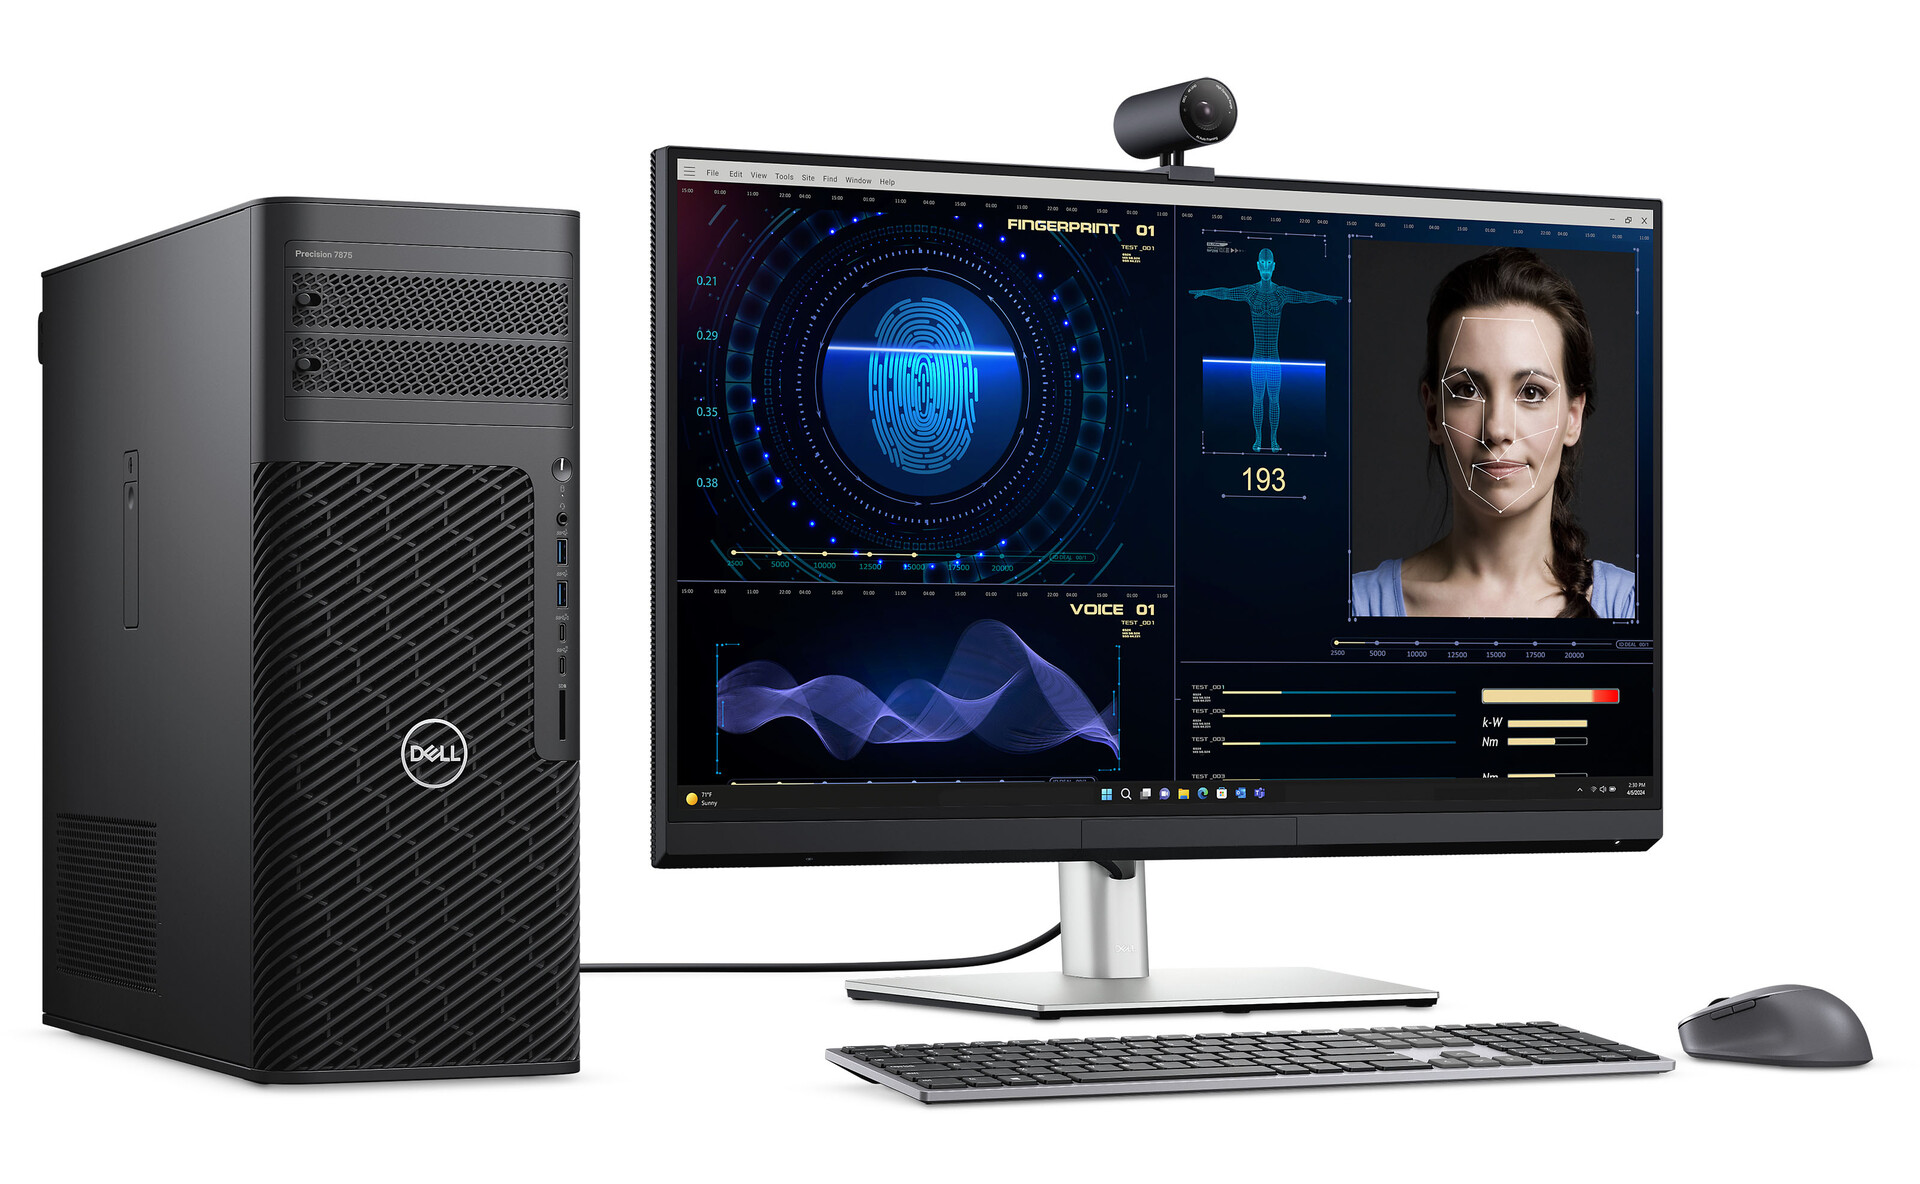
Precision 7865 立式工作站是戴尔推出的一款高性能工作站。由于采用了最新的 AMD Ryzen Threadripper 7000 系列处理器,该工作站现在可支持多达 96 个计算内核和 192 个线程。此外,它还拥有高达 1,024 GB 的内存,并配备了两块高端工作站显卡,非常适合执行要求特别苛刻的任务。
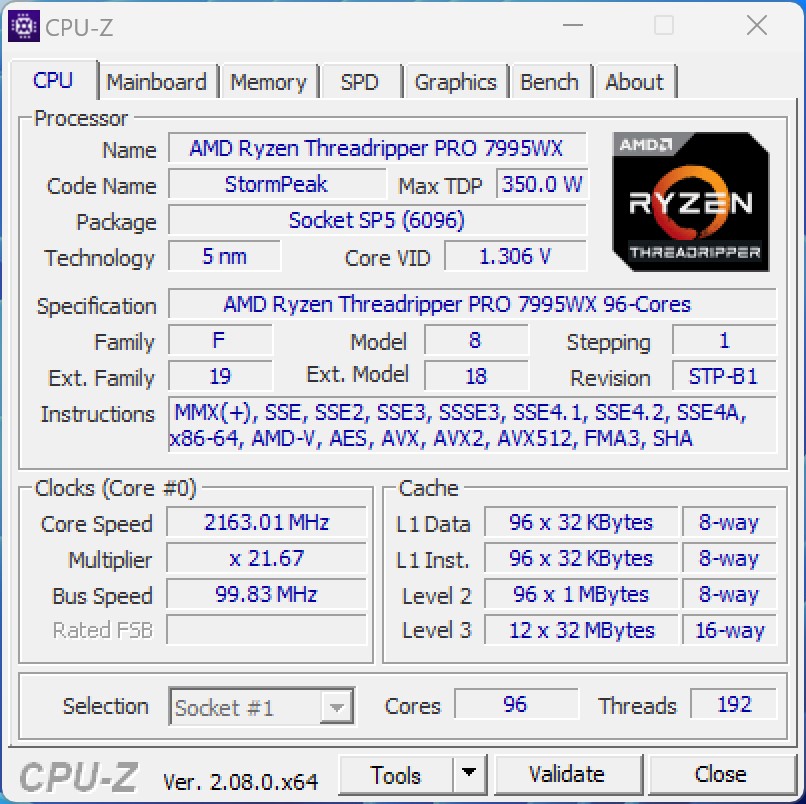
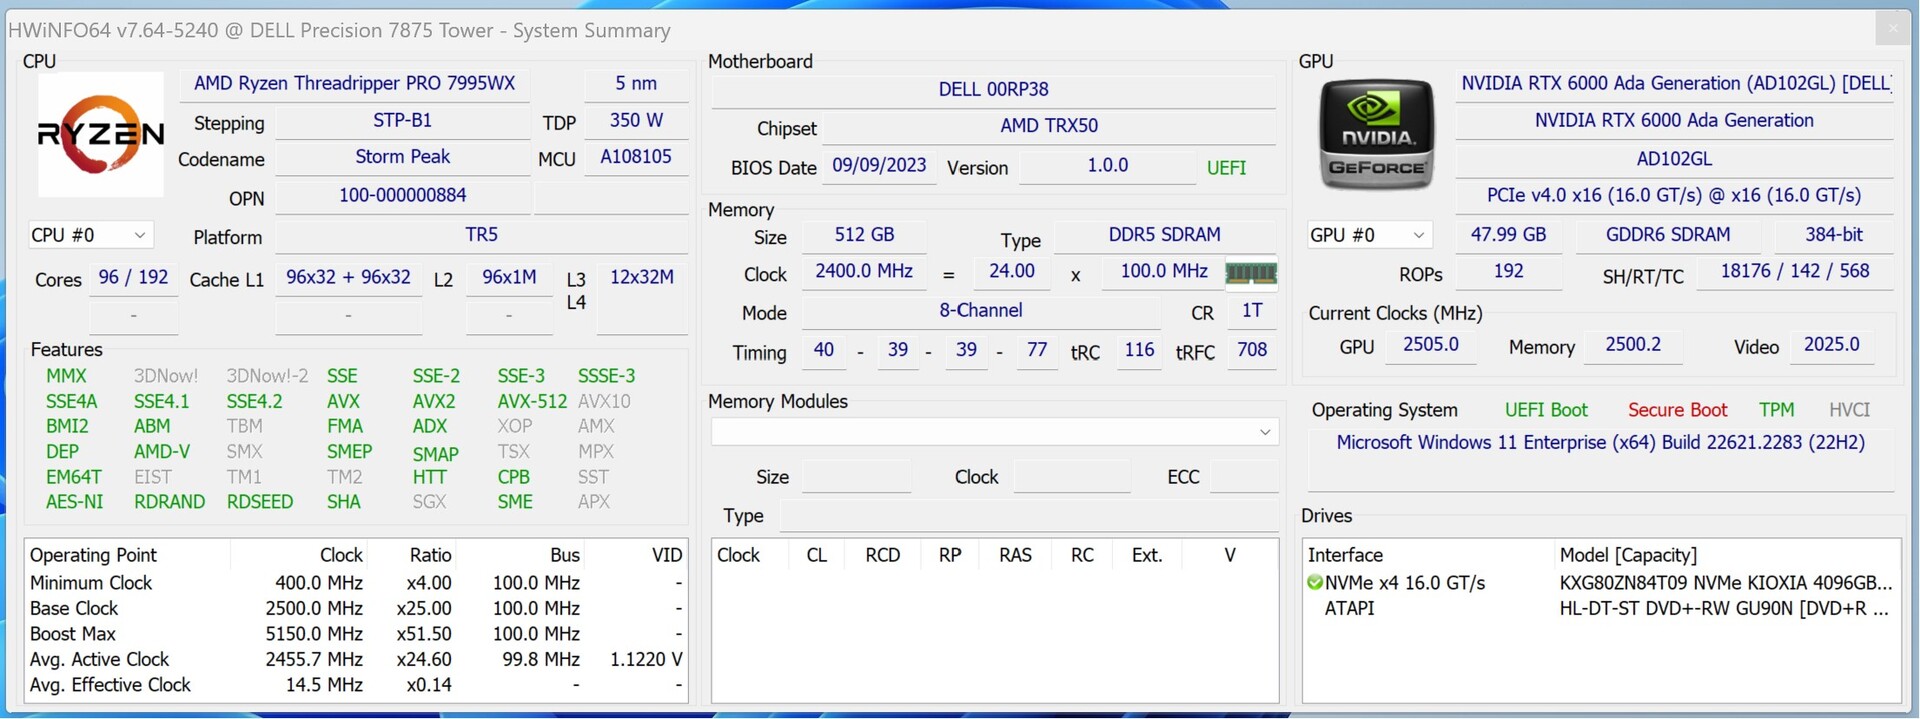
我们有机会测试了新的高端工作站,它采用了 AMD Ryzen Threadripper Pro 7995WX配备 512 GB RDIMM 和 4 TB SSD。此外,该系统还集成了两个 显卡。显卡。虽然没有测试系统的官方价格信息,但详细的价格显示,测试配置的价格范围在五位数左右。这些设备并不适合家庭使用,而是在商业环境中找到了自己的位置,在这些环境中,强大的计算能力必不可少,而时间就是金钱。从长远来看,如果节省的时间能够证明投资是合理的,那么这类系统就会被证明是具有成本效益的。
当然,戴尔不仅提供顶级型号,还可以通过店内的配置选项对系统进行定制,以满足特定需求。
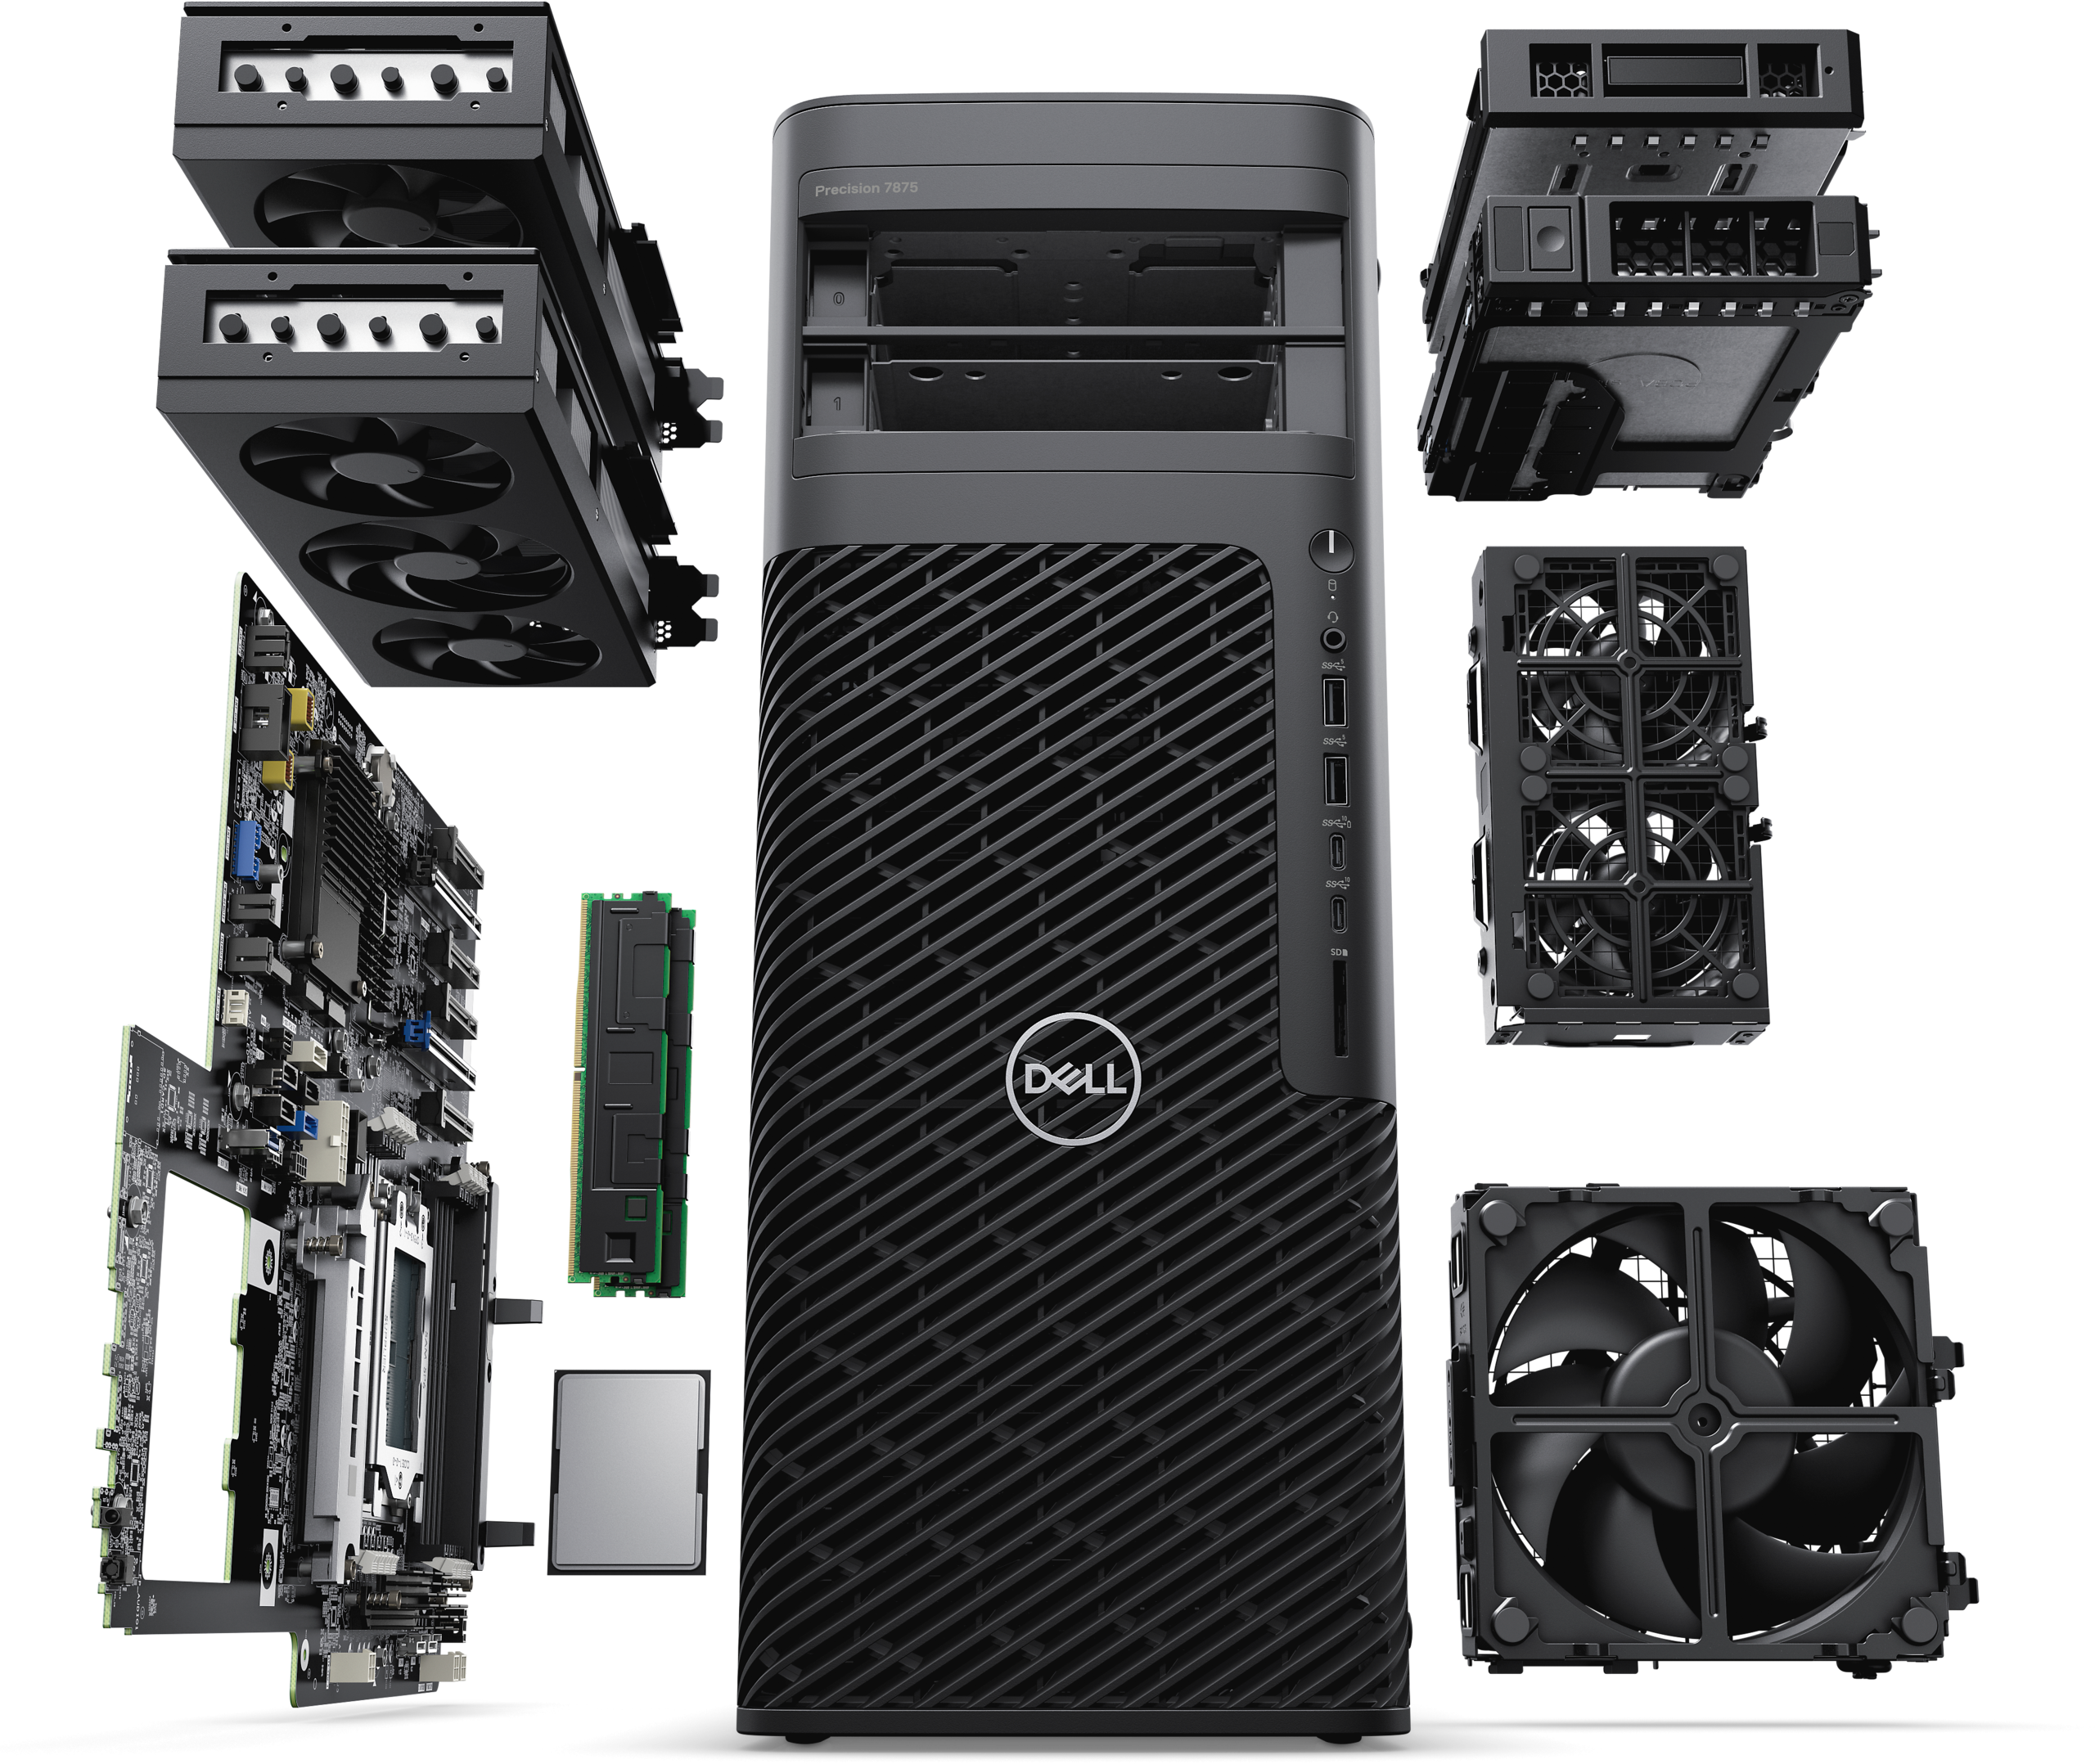
有关 Threadripper-7000-WX 系列的详细信息
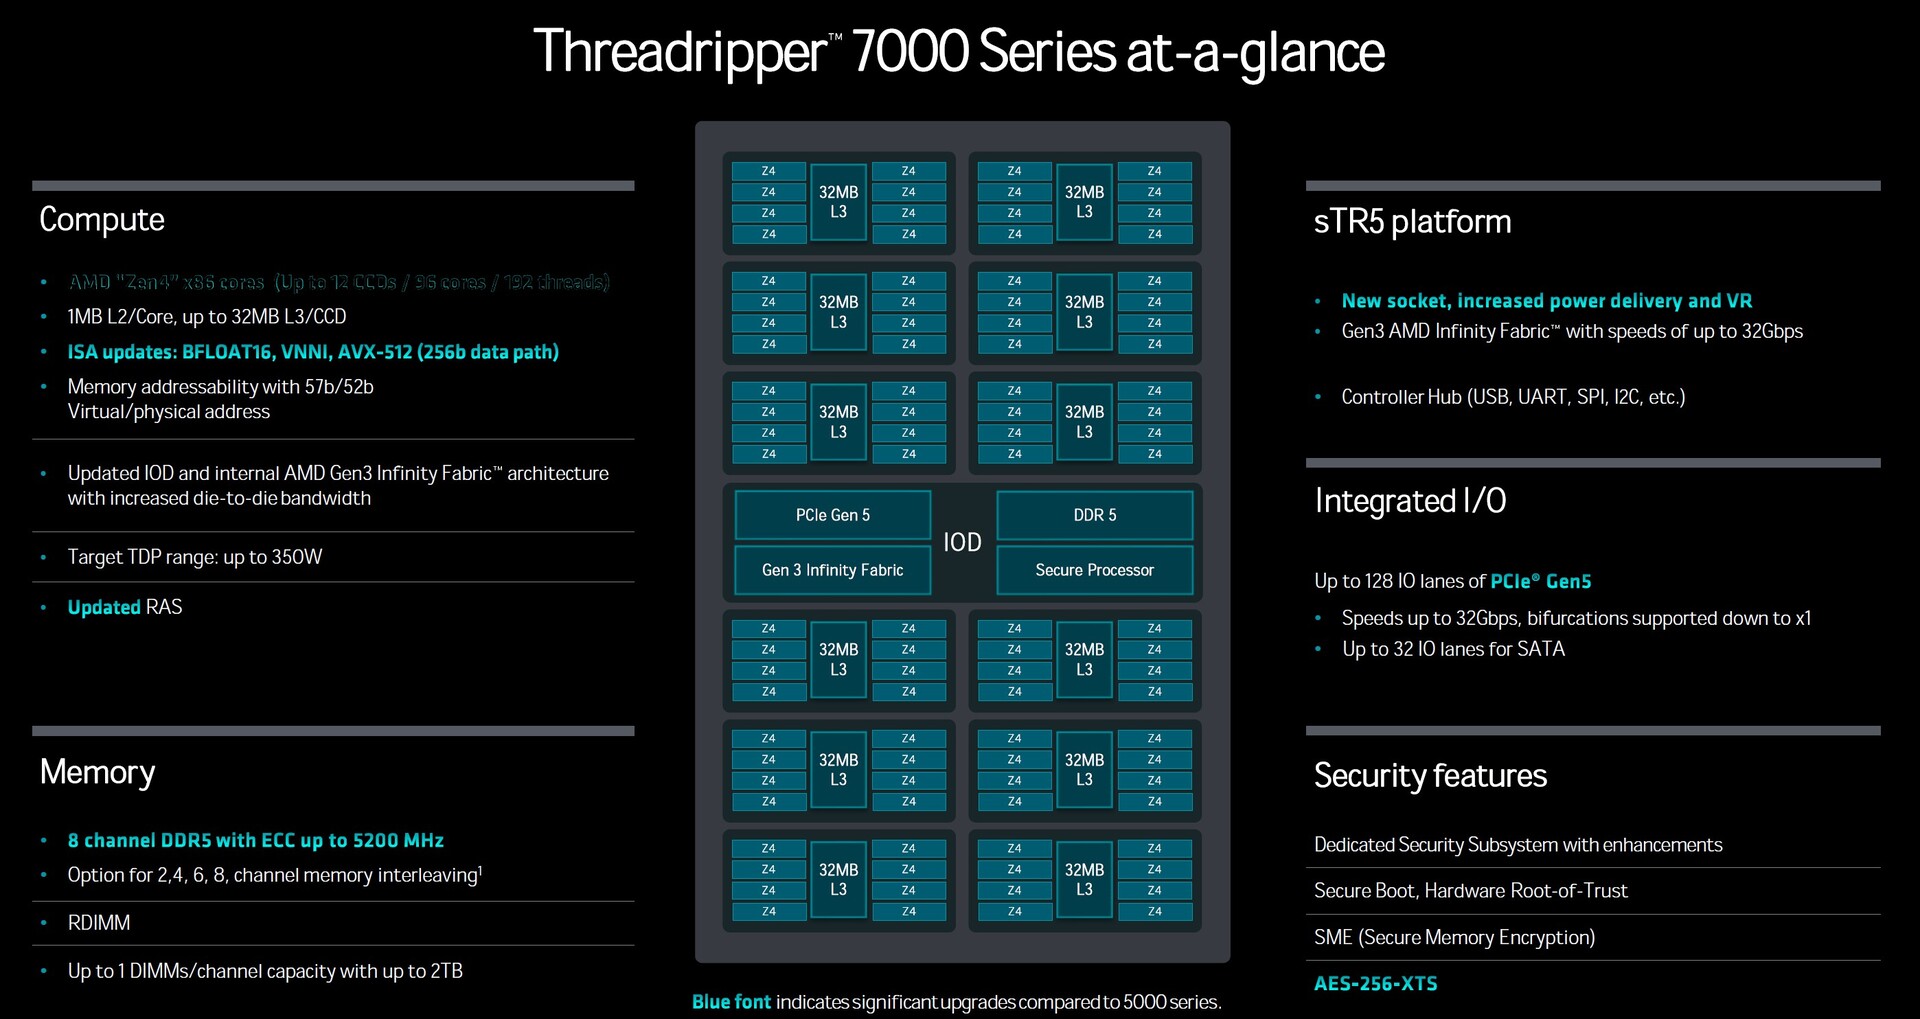
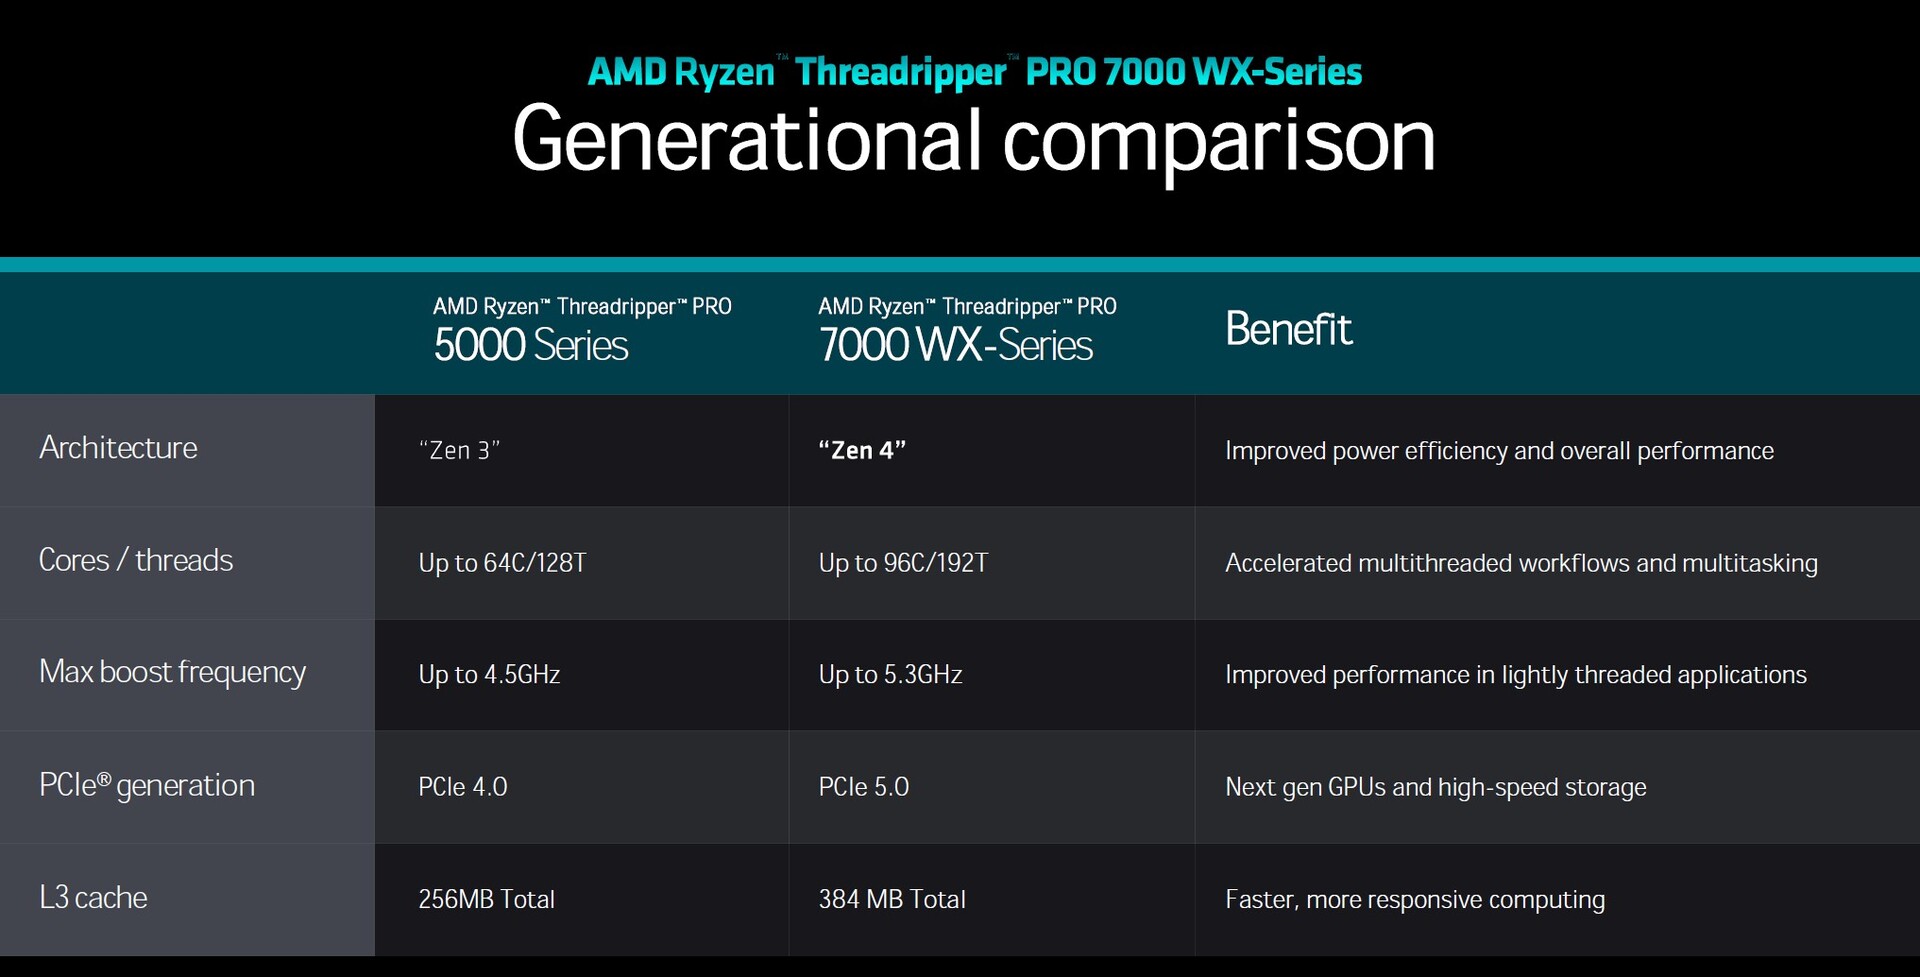
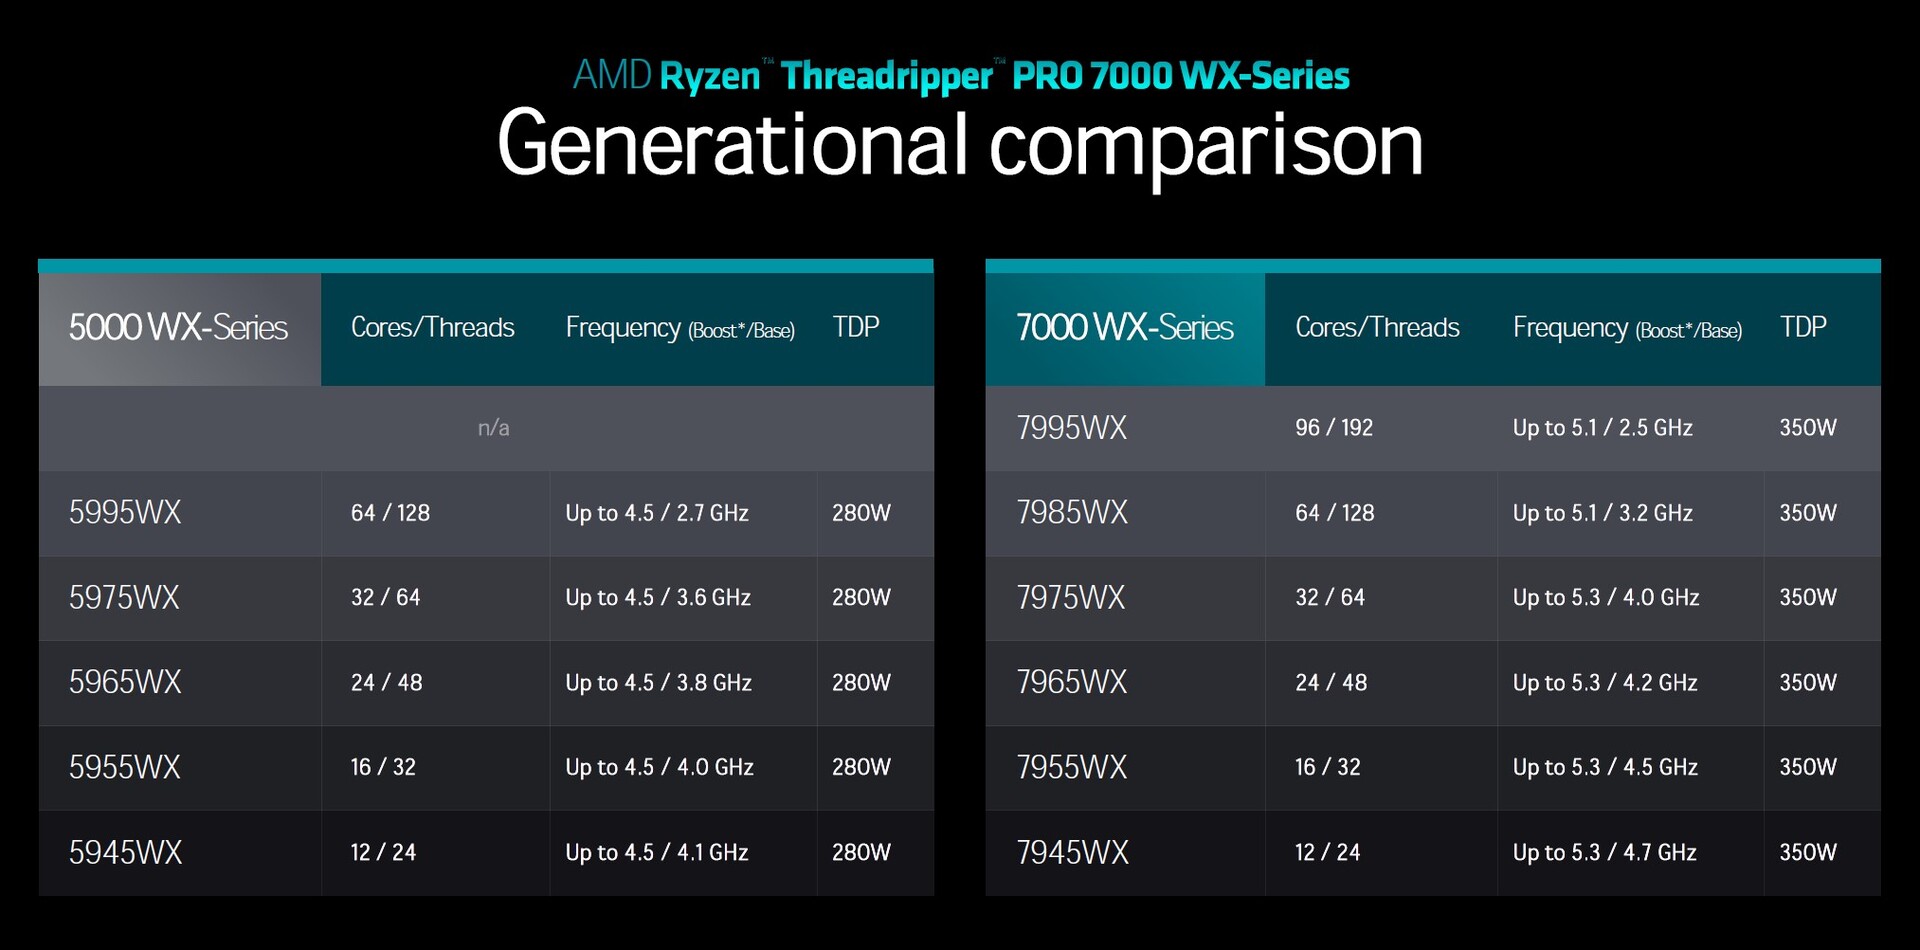
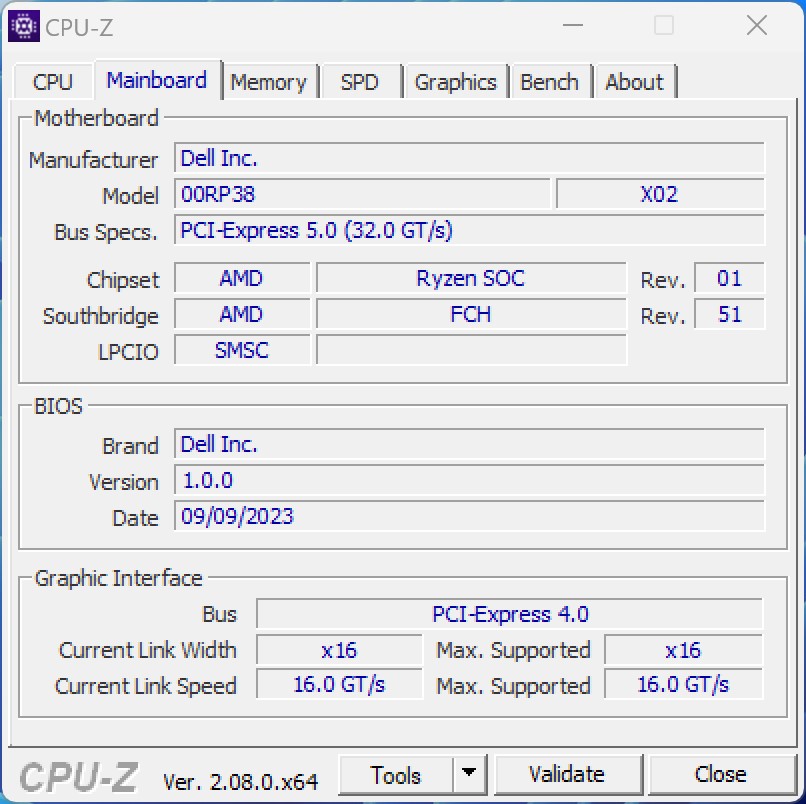
AMD 推出了基于 Zen4 的 Ryzen 7000 CPU,与 Zen3 相比性能大幅提升,并将其重点扩展到服务器和工作站领域。早期的 5000 系列 Threadripper 处理器使用 Zen3 内核,最多拥有 64 个原生内核,而最新的高端版本 AMD Ryzen Threadripper Pro 7995WX 则拥有惊人的 96 个内核。芯片组架构得以保留,12 个 CPU 计算芯片(CCD)位于散热器下方。更高的时钟速度(在提升模式下最高可达 5.1 GHz)和 L3 缓存的增加都是显著的升级。新增的 PCIe 5.0 支持最新的标准,确保未来的图形卡可以最大限度地工作。该标准还通过在服务器和工作站领域使用高速数据来改进大容量存储设备。
有关测试条件的重要信息
戴尔为我们提供了远程测试戴尔Precision 7875 塔式工作站的机会。遗憾的是,这意味着我们无法直接访问硬件。与测试系统的连接是通过 Parsec 建立的,正如戴尔所指出的那样,这会导致性能略有下降。不过,这种损失预计不会超过个位数。主动连接也会影响 3D 性能。遗憾的是,由于通过 Parsec 启动 3D 应用程序往往不切实际,因此无法进行所有测试。此外,我们也无法提供测试装置的发射信息。
处理器基准
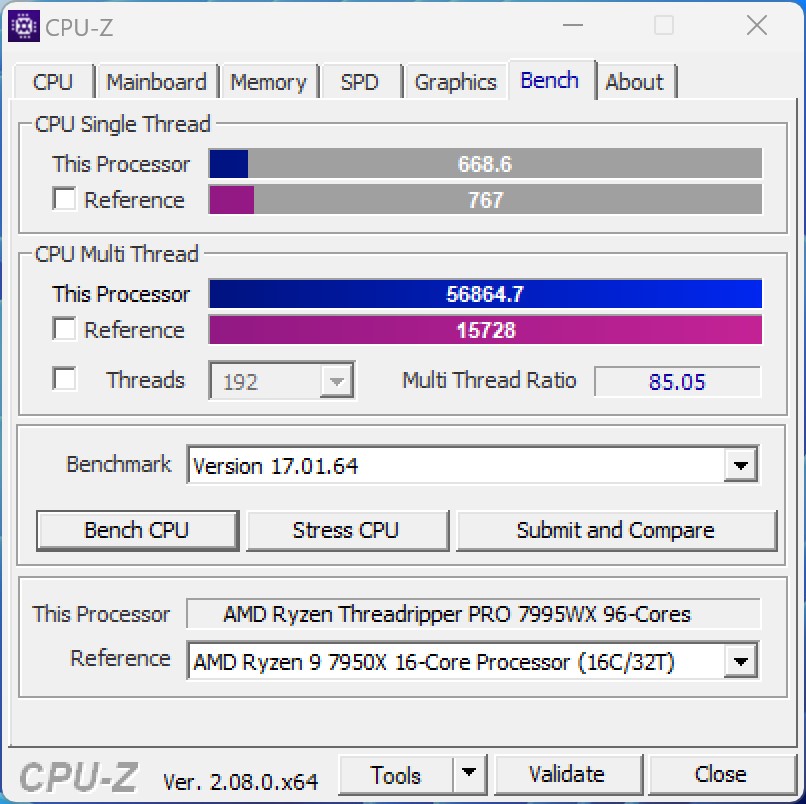
AMD Ryzen Threadripper Pro 7995WX 性能出众,尤其是在软件有效管理大量计算核心的情况下。在我们的测试中,我们遇到了某些软件难以处理大量计算核心的负面例子。尽管如此,AMD Ryzen Threadripper Pro 7995WX 与我们迄今为止测试过的所有处理器相比,仍然具有很强的竞争力。不过,在单核性能方面,它与目前消费领域的英特尔和 AMD 处理器相比还有差距。尽管如此,与其前代产品相比,AMD Ryzen Threadripper 79WX AMD Ryzen Threadripper Pro 3995WX相比,性能大幅提升了 40% 以上。对于英特尔与 AMD Threadripper 型号相对应的蓝宝石 Rapids 型号(目前最多可提供 56 个核心),很遗憾,我们缺乏比较数据。
AMD Ryzen Threadripper Pro 7995WX 的基本主频为 2.5 GHz,在提升模式下有可能达到 5.1 GHz。与前代产品相比,AMD 还提高了最大功耗,目前最高可达 350 瓦,我们在测试过程中确认了这一数值。
有关其他比较和基准,请查阅我们的 CPU 对比表.
| Cinebench R23 | |
| Single Core | |
| Intel Core i9-14900K | |
| AMD Ryzen 9 7950X3D | |
| AMD Ryzen 9 7950X | |
| AMD Ryzen Threadripper PRO 7995WX | |
| AMD Ryzen Threadripper PRO 3995WX | |
| Multi Core | |
| AMD Ryzen Threadripper PRO 7995WX | |
| AMD Ryzen Threadripper PRO 3995WX | |
| Intel Core i9-14900K | |
| AMD Ryzen 9 7950X | |
| AMD Ryzen 9 7950X3D | |
| Cinebench R20 | |
| CPU (Single Core) | |
| Intel Core i9-14900K | |
| AMD Ryzen 9 7950X | |
| AMD Ryzen 9 7950X3D | |
| AMD Ryzen Threadripper PRO 7995WX | |
| AMD Ryzen Threadripper PRO 3995WX | |
| CPU (Multi Core) | |
| AMD Ryzen Threadripper PRO 7995WX | |
| AMD Ryzen Threadripper PRO 3995WX | |
| Intel Core i9-14900K | |
| AMD Ryzen 9 7950X | |
| AMD Ryzen 9 7950X3D | |
| Cinebench 2024 | |
| CPU Multi Core | |
| AMD Ryzen Threadripper PRO 7995WX | |
| Intel Core i9-14900K | |
| CPU Single Core | |
| Intel Core i9-14900K | |
| AMD Ryzen Threadripper PRO 7995WX | |
| Cinebench R15 | |
| CPU Single 64Bit | |
| Intel Core i9-14900K | |
| AMD Ryzen 9 7950X | |
| AMD Ryzen 9 7950X3D | |
| AMD Ryzen Threadripper PRO 7995WX | |
| AMD Ryzen Threadripper PRO 3995WX | |
| CPU Multi 64Bit | |
| AMD Ryzen Threadripper PRO 7995WX | |
| AMD Ryzen Threadripper PRO 3995WX | |
| Intel Core i9-14900K | |
| AMD Ryzen 9 7950X | |
| AMD Ryzen 9 7950X3D | |
| Cinebench R11.5 | |
| CPU Single 64Bit | |
| Intel Core i9-14900K | |
| AMD Ryzen 9 7950X | |
| AMD Ryzen 9 7950X3D | |
| AMD Ryzen Threadripper PRO 7995WX | |
| AMD Ryzen Threadripper PRO 3995WX | |
| CPU Multi 64Bit | |
| AMD Ryzen Threadripper PRO 7995WX | |
| Intel Core i9-14900K | |
| AMD Ryzen 9 7950X | |
| AMD Ryzen 9 7950X3D | |
| AMD Ryzen Threadripper PRO 3995WX | |
| Cinebench R10 | |
| Rendering Single CPUs 64Bit | |
| Intel Core i9-14900K | |
| AMD Ryzen 9 7950X | |
| AMD Ryzen Threadripper PRO 3995WX | |
| AMD Ryzen 9 7950X3D | |
| AMD Ryzen Threadripper PRO 7995WX | |
| Rendering Multiple CPUs 64Bit | |
| Intel Core i9-14900K | |
| AMD Ryzen 9 7950X | |
| AMD Ryzen Threadripper PRO 3995WX | |
| AMD Ryzen 9 7950X3D | |
| AMD Ryzen Threadripper PRO 7995WX | |
| Blender - v2.79 BMW27 CPU | |
| AMD Ryzen 9 7950X3D | |
| AMD Ryzen 9 7950X | |
| Intel Core i9-14900K | |
| AMD Ryzen Threadripper PRO 3995WX | |
| AMD Ryzen Threadripper PRO 7995WX | |
| wPrime 2.10 | |
| 32m | |
| AMD Ryzen Threadripper PRO 7995WX | |
| AMD Ryzen Threadripper PRO 3995WX | |
| Intel Core i9-14900K | |
| AMD Ryzen 9 7950X3D | |
| AMD Ryzen 9 7950X | |
| 1024m | |
| Intel Core i9-14900K | |
| AMD Ryzen 9 7950X3D | |
| AMD Ryzen 9 7950X | |
| AMD Ryzen Threadripper PRO 3995WX | |
| AMD Ryzen Threadripper PRO 7995WX | |
| X264 HD Benchmark 4.0 | |
| Pass 1 | |
| Intel Core i9-14900K | |
| AMD Ryzen 9 7950X3D | |
| AMD Ryzen 9 7950X | |
| AMD Ryzen Threadripper PRO 7995WX | |
| AMD Ryzen Threadripper PRO 3995WX | |
| Pass 2 | |
| Intel Core i9-14900K | |
| AMD Ryzen Threadripper PRO 7995WX | |
| AMD Ryzen 9 7950X | |
| AMD Ryzen 9 7950X3D | |
| AMD Ryzen Threadripper PRO 3995WX | |
| WinRAR - Result | |
| AMD Ryzen Threadripper PRO 7995WX | |
| AMD Ryzen 9 7950X | |
| Intel Core i9-14900K | |
| AMD Ryzen 9 7950X3D | |
| AMD Ryzen Threadripper PRO 3995WX | |
| TrueCrypt | |
| AES Mean 100MB | |
| AMD Ryzen Threadripper PRO 7995WX | |
| AMD Ryzen 9 7950X | |
| AMD Ryzen 9 7950X3D | |
| Intel Core i9-14900K | |
| AMD Ryzen Threadripper PRO 3995WX | |
| Twofish Mean 100MB | |
| Intel Core i9-14900K | |
| AMD Ryzen Threadripper PRO 7995WX | |
| AMD Ryzen Threadripper PRO 3995WX | |
| AMD Ryzen 9 7950X | |
| AMD Ryzen 9 7950X3D | |
| Serpent Mean 100MB | |
| AMD Ryzen Threadripper PRO 7995WX | |
| AMD Ryzen Threadripper PRO 3995WX | |
| AMD Ryzen 9 7950X | |
| AMD Ryzen 9 7950X3D | |
| Intel Core i9-14900K | |
| 3DMark 11 - 1280x720 Performance Physics | |
| AMD Ryzen 9 7950X3D | |
| Intel Core i9-14900K | |
| AMD Ryzen 9 7950X | |
| AMD Ryzen Threadripper PRO 7995WX | |
| AMD Ryzen Threadripper PRO 3995WX | |
| AMD Ryzen Threadripper PRO 3975WX | |
| 7-Zip 18.03 | |
| 7z b 4 | |
| AMD Ryzen Threadripper PRO 7995WX | |
| AMD Ryzen 9 7950X | |
| AMD Ryzen 9 7950X3D | |
| Intel Core i9-14900K | |
| AMD Ryzen Threadripper PRO 3995WX | |
| 7z b 4 -mmt1 | |
| AMD Ryzen 9 7950X | |
| AMD Ryzen 9 7950X3D | |
| Intel Core i9-14900K | |
| AMD Ryzen Threadripper PRO 7995WX | |
| AMD Ryzen Threadripper PRO 3995WX | |
| HWBOT x265 Benchmark v2.2 - 4k Preset | |
| AMD Ryzen Threadripper PRO 7995WX | |
| AMD Ryzen Threadripper PRO 3995WX | |
| AMD Ryzen 9 7950X | |
| Intel Core i9-14900K | |
| AMD Ryzen 9 7950X3D | |
| R Benchmark 2.5 - Overall mean | |
| AMD Ryzen Threadripper PRO 3995WX | |
| AMD Ryzen Threadripper PRO 7995WX | |
| AMD Ryzen 9 7950X3D | |
| AMD Ryzen 9 7950X | |
| Intel Core i9-14900K | |
| LibreOffice - 20 Documents To PDF | |
| AMD Ryzen Threadripper PRO 3995WX | |
| AMD Ryzen Threadripper PRO 7995WX | |
| AMD Ryzen 9 7950X3D | |
| AMD Ryzen 9 7950X | |
| Intel Core i9-14900K | |
| WebXPRT 3 - Overall | |
| AMD Ryzen 9 7950X3D | |
| Intel Core i9-14900K | |
| AMD Ryzen 9 7950X | |
| AMD Ryzen Threadripper PRO 7995WX | |
| AMD Ryzen Threadripper PRO 3995WX | |
| Mozilla Kraken 1.1 - Total | |
| AMD Ryzen Threadripper PRO 3995WX | |
| AMD Ryzen Threadripper PRO 7995WX | |
| AMD Ryzen 9 7950X3D | |
| AMD Ryzen 9 7950X | |
| Intel Core i9-14900K | |
| 3DMark | |
| 3840x2160 Fire Strike Ultra Physics | |
| Intel Core i9-14900K | |
| AMD Ryzen 9 7950X3D | |
| AMD Ryzen 9 7950X | |
| AMD Ryzen Threadripper PRO 7995WX | |
| AMD Ryzen Threadripper PRO 3995WX | |
| AMD Ryzen Threadripper PRO 3975WX | |
| 1920x1080 Fire Strike Physics | |
| Intel Core i9-14900K | |
| AMD Ryzen 9 7950X3D | |
| AMD Ryzen 9 7950X | |
| AMD Ryzen Threadripper PRO 7995WX | |
| AMD Ryzen Threadripper PRO 3995WX | |
| AMD Ryzen Threadripper PRO 3975WX | |
| 2560x1440 Time Spy CPU | |
| Intel Core i9-14900K | |
| AMD Ryzen 9 7950X3D | |
| AMD Ryzen 9 7950X | |
| AMD Ryzen Threadripper PRO 7995WX | |
| AMD Ryzen Threadripper PRO 3975WX | |
| AMD Ryzen Threadripper PRO 3995WX | |
| Geekbench 6.0 | |
| Multi-Core | |
| AMD Ryzen Threadripper PRO 7995WX | |
| Intel Core i9-14900K | |
| Single-Core | |
| Intel Core i9-14900K | |
| AMD Ryzen Threadripper PRO 7995WX | |
| Geekbench 6.7 | |
| Multi-Core | |
| AMD Ryzen Threadripper PRO 7995WX | |
| Intel Core i9-14900K | |
| AMD Ryzen 9 7950X3D | |
| Single-Core | |
| Intel Core i9-14900K | |
| AMD Ryzen 9 7950X3D | |
| AMD Ryzen Threadripper PRO 7995WX | |
* ... smaller is better
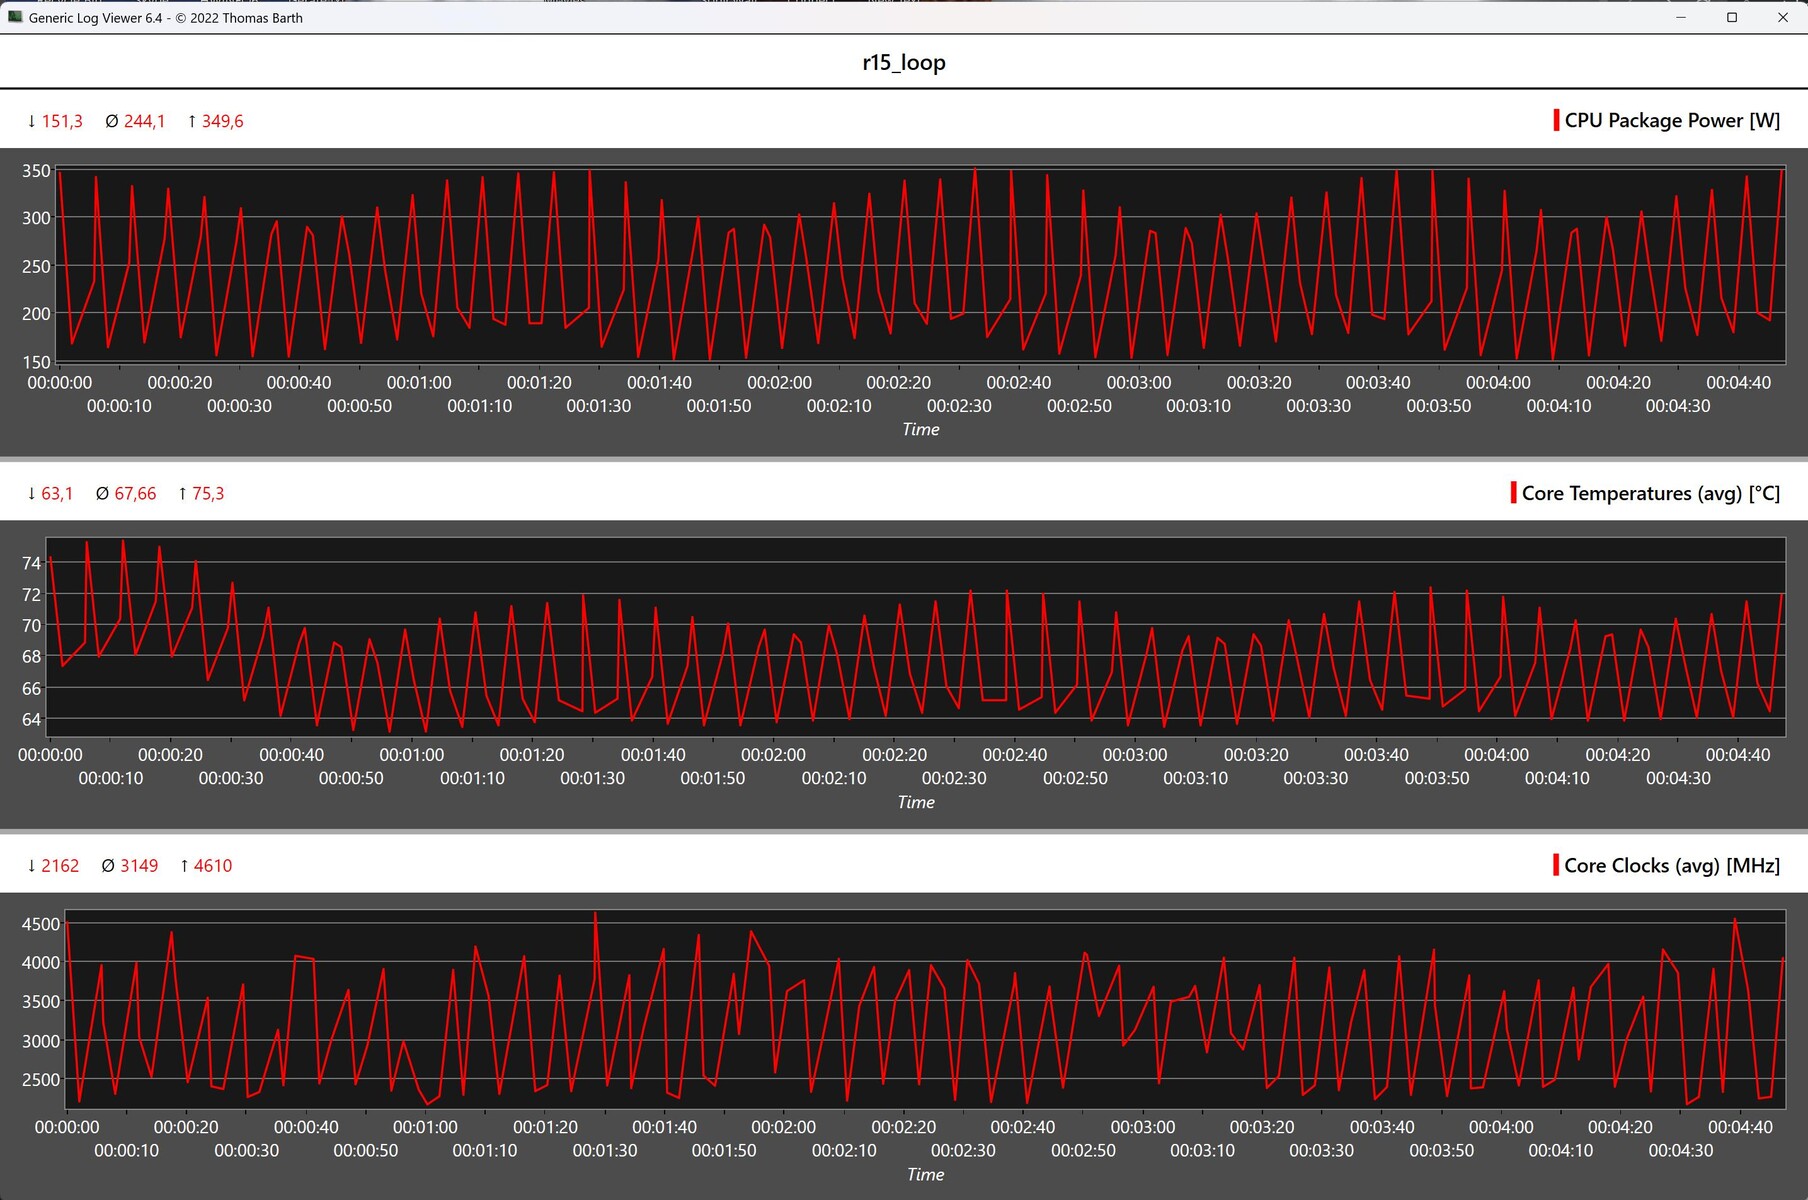
戴尔Precision 7875 立式工作站在 Cinebench R15 多环路中的表现
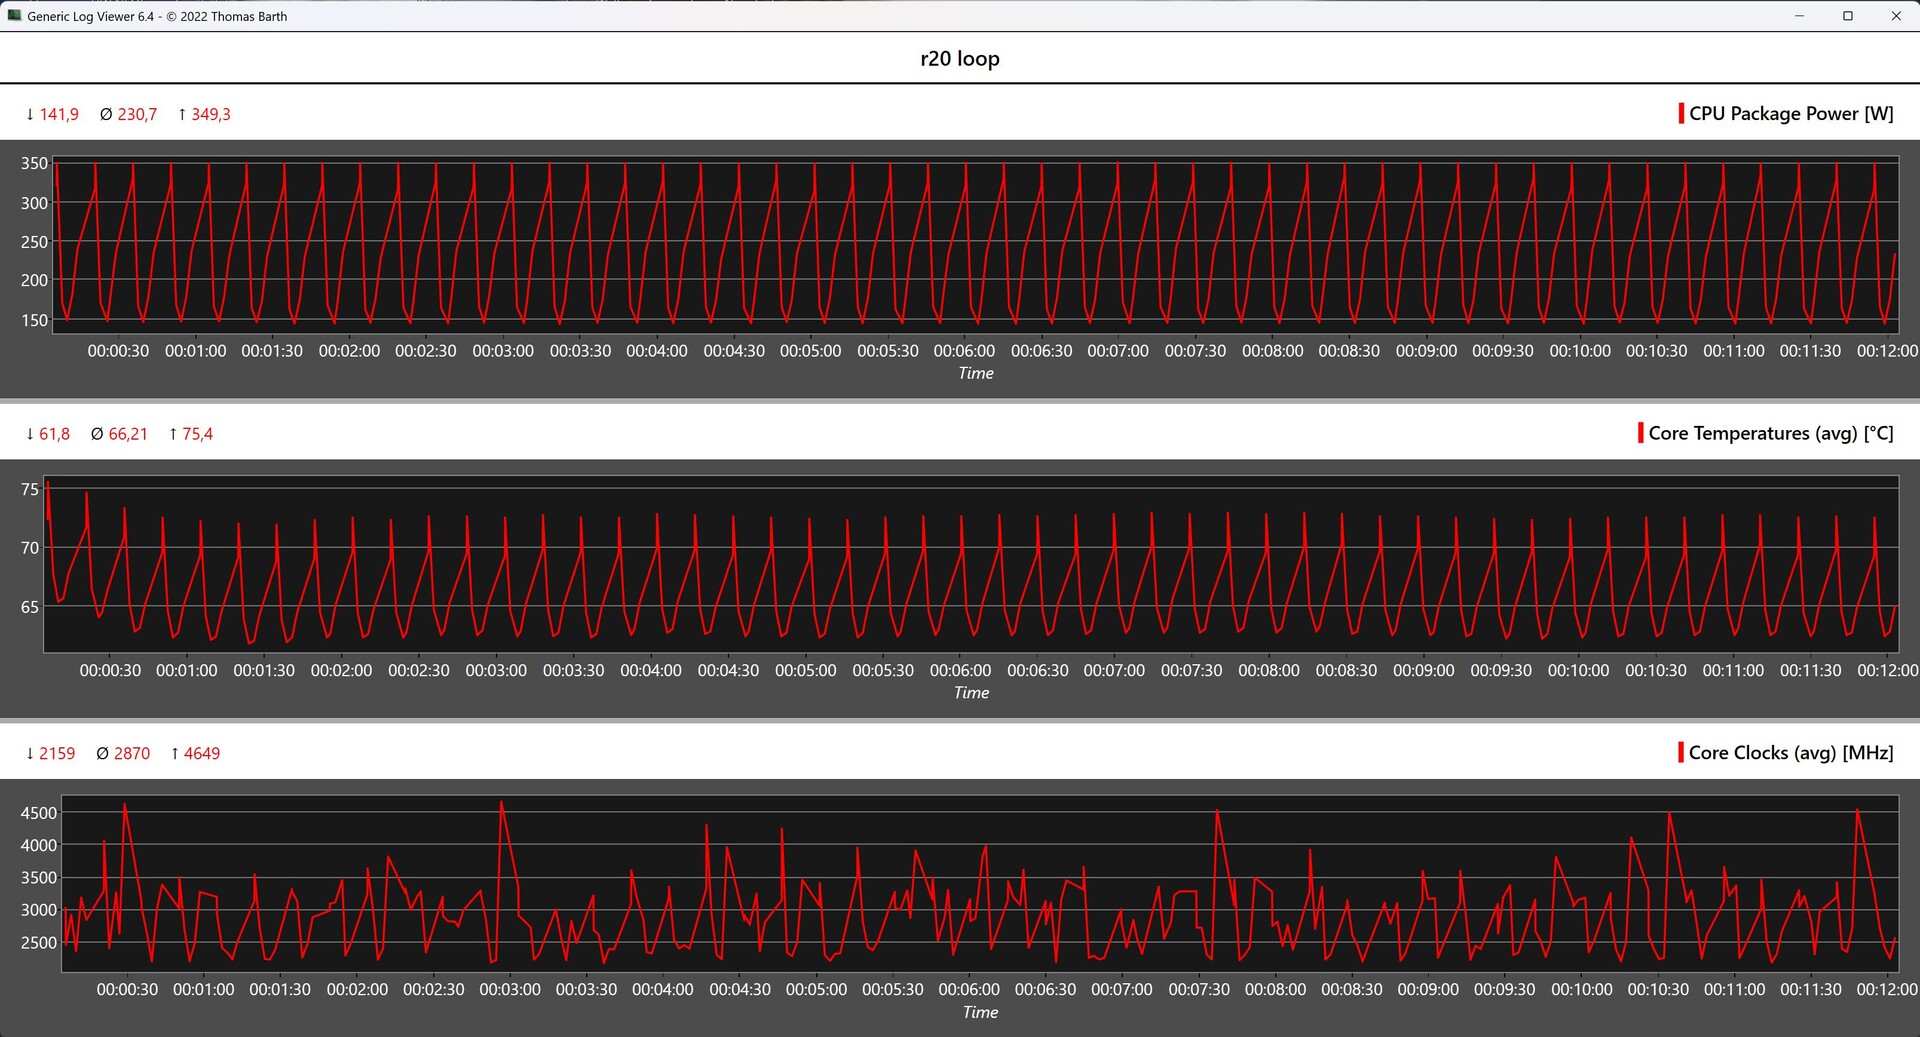
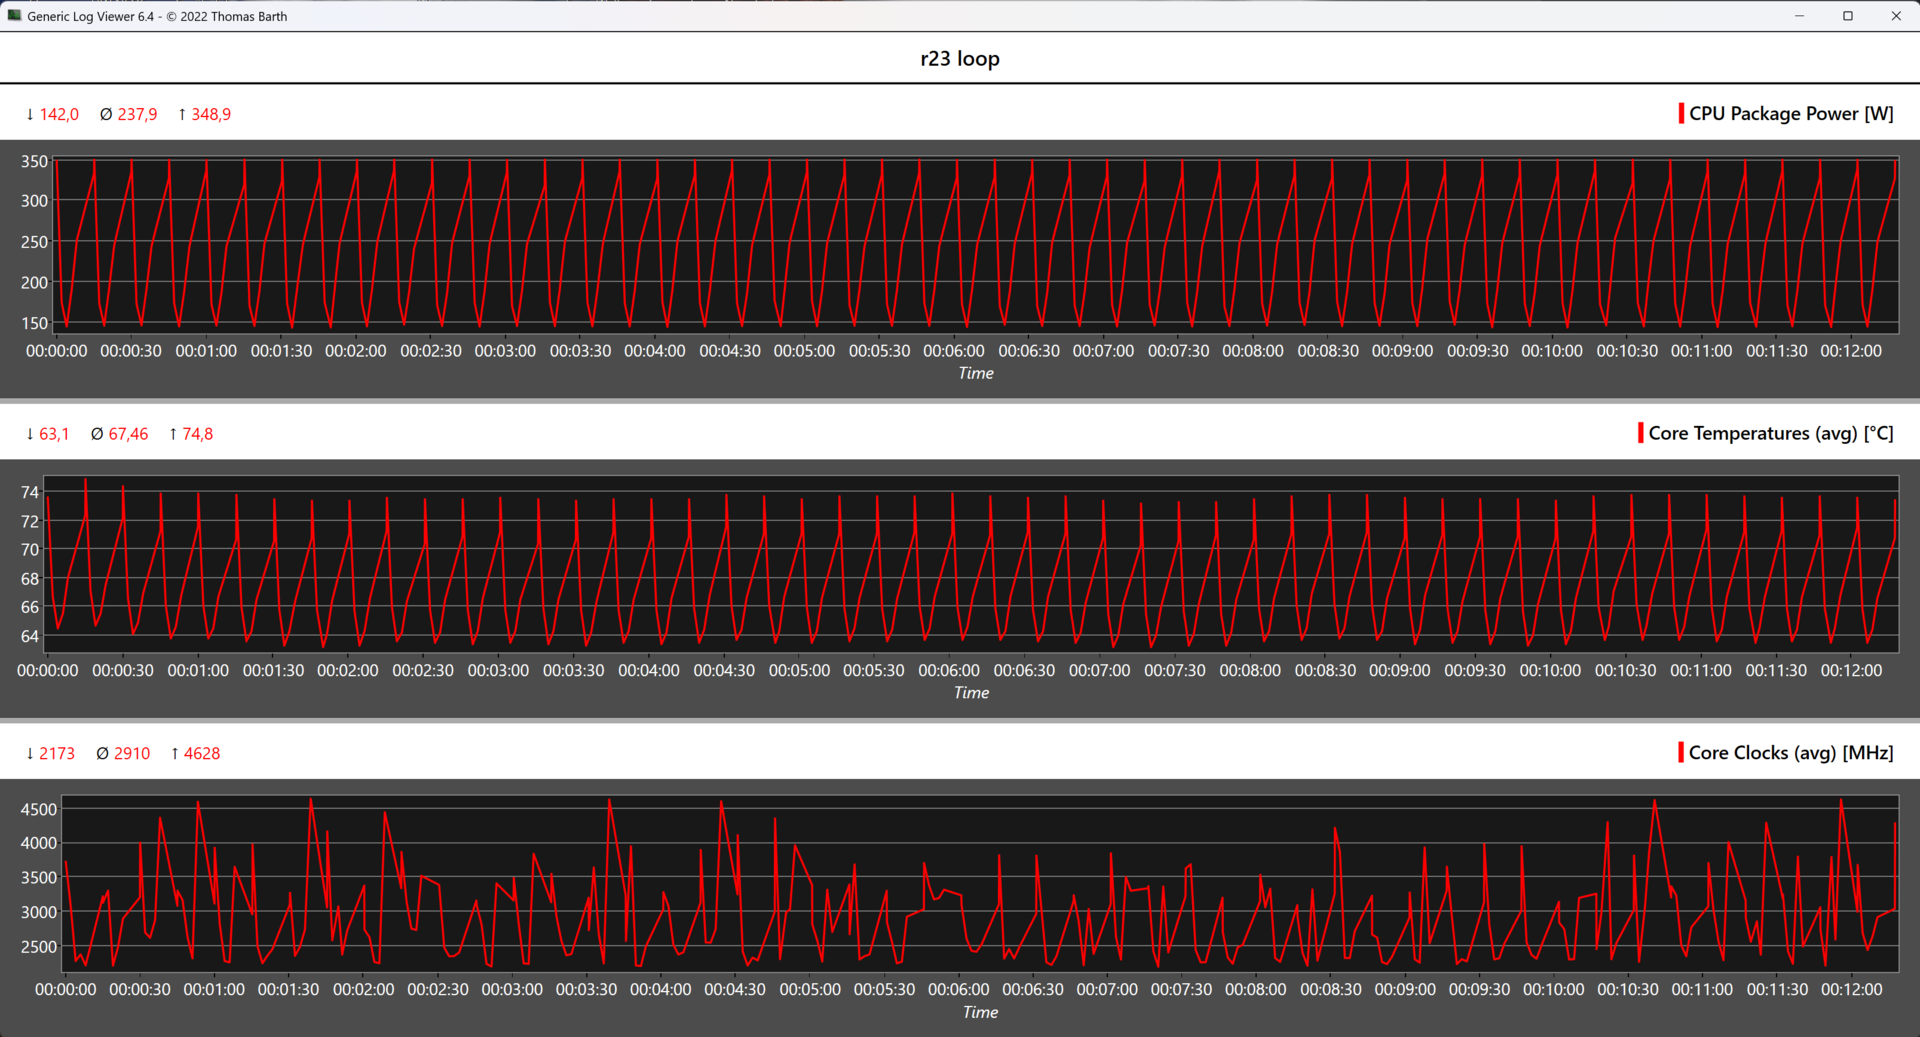
戴尔Precision 7875 立式工作站在 Cinebench R15 多循环压力测试中表现出色,取得了优异的成绩。在整个 50 次运行过程中,我们仅观察到性能的轻微波动,排除了功耗随性能稳步下降而大幅下降的可能性。遥测数据显示,处理器可以在 350 瓦的最大功率下持续运行而不会出现问题。此外,系统在 Cinebench R20 多循环和 Cinebench R23 多循环压力测试中表现稳定。
合成基准和应用性能
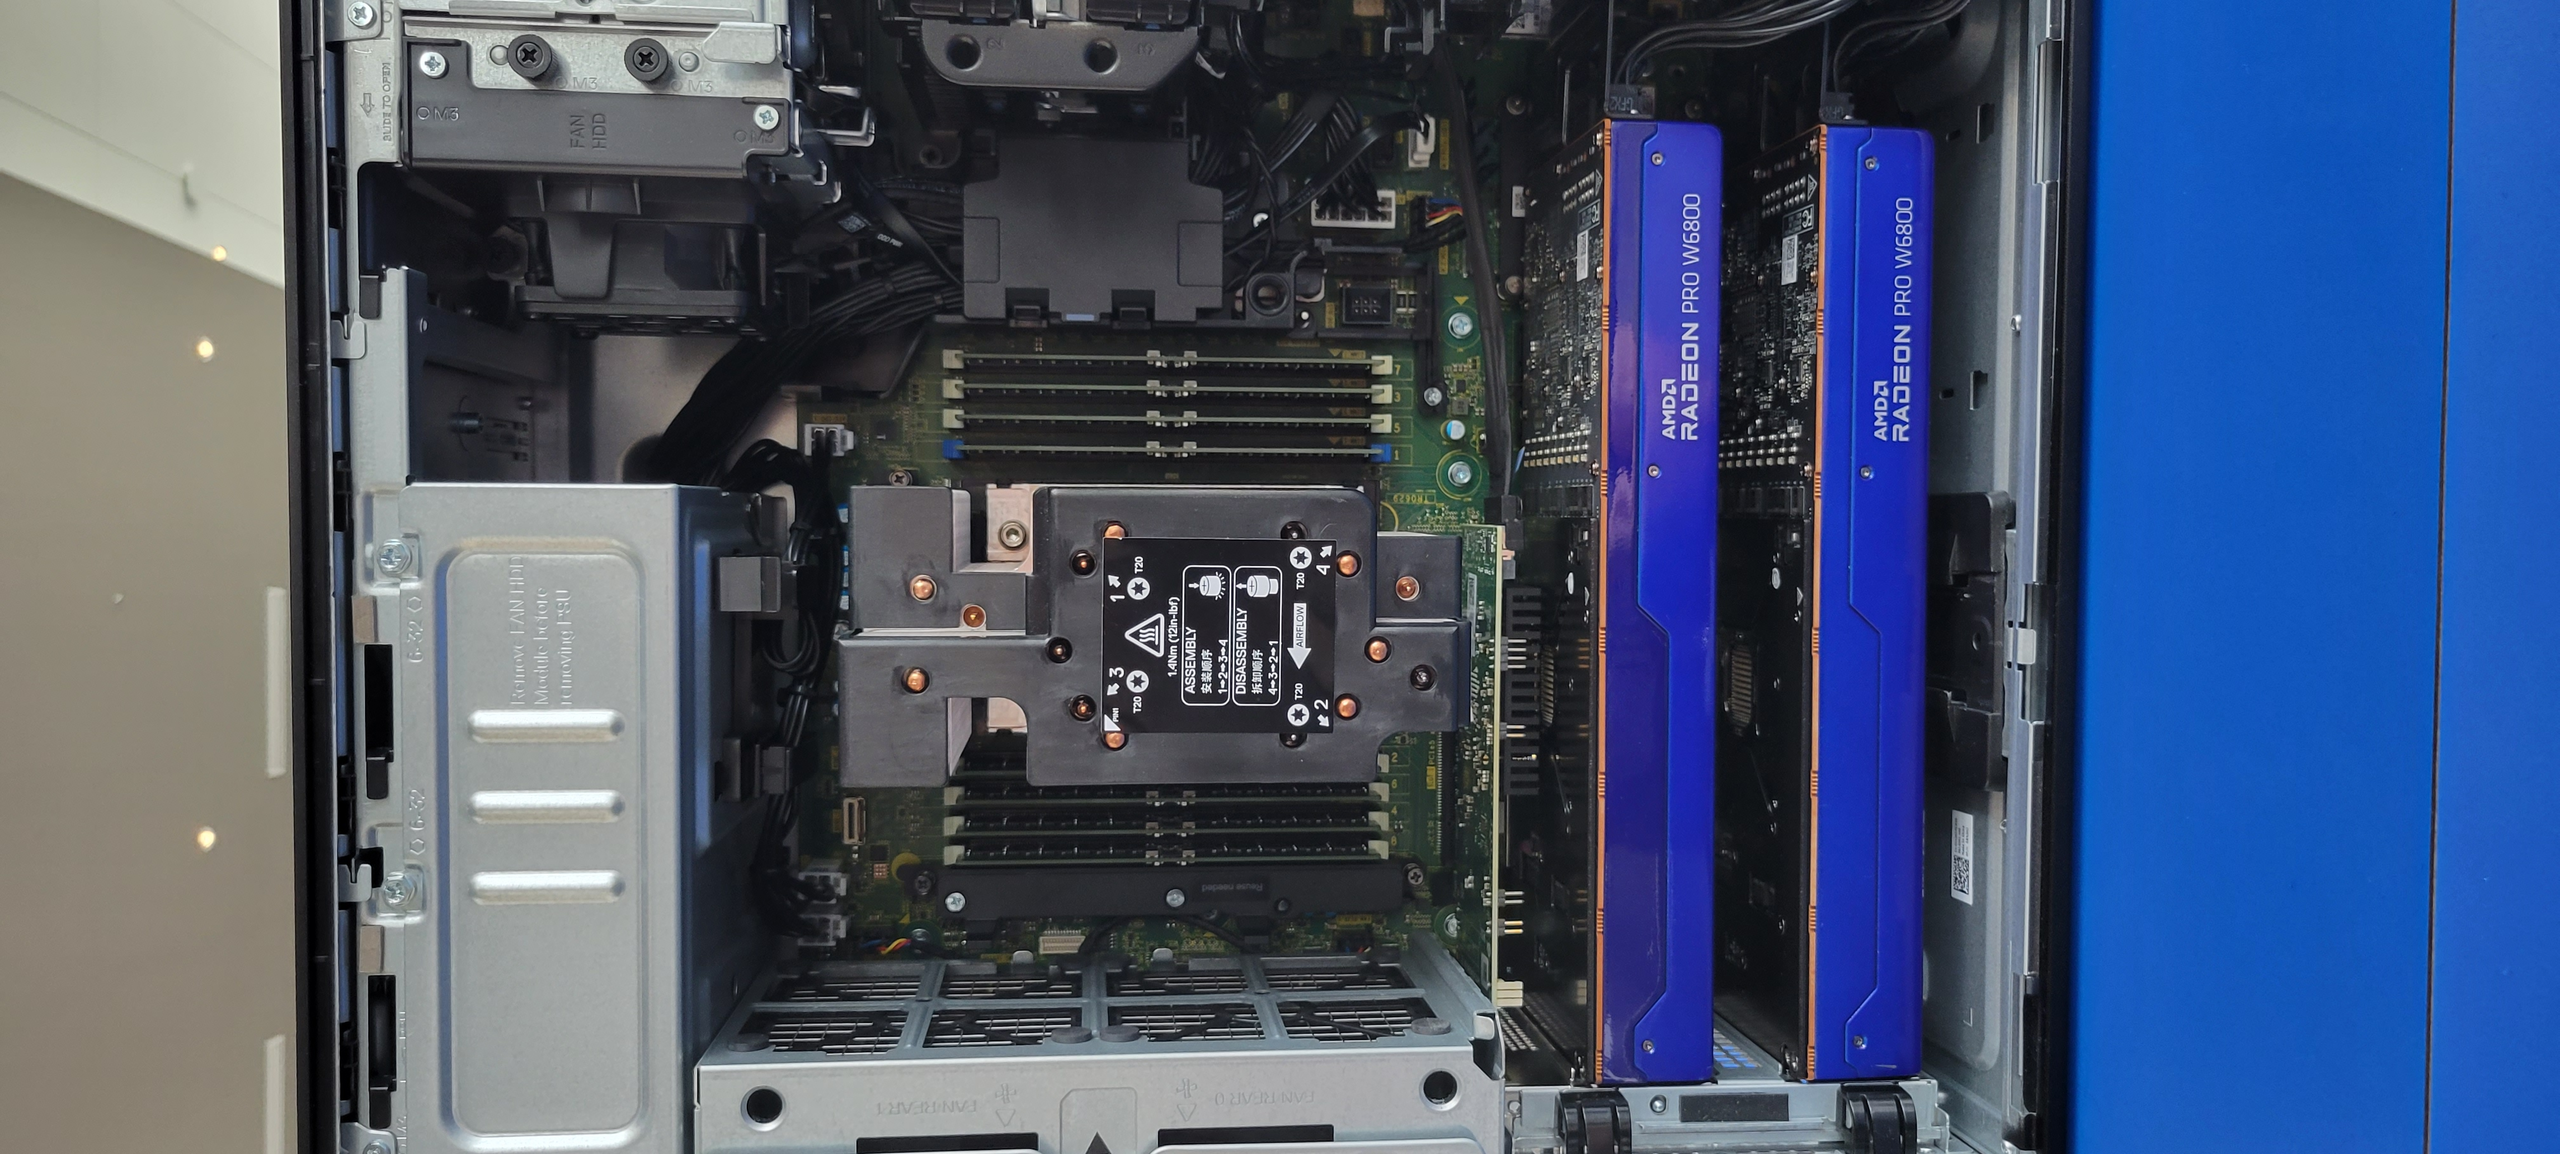
使用测试系统进行的合成测试表明,大量计算内核无法得到充分利用,导致该系统难以超越竞争对手。虽然戴尔Precision 7875 Tower 在与联想 ThinkStation P620(基于 AMD Ryzen Threadripper Pro 3995WX的联想 ThinkStation P620 的直接对比中,戴尔 7875 Tower 的最大优势在于内存测试。我们测试系统的八通道运行使其能够以令人印象深刻的数值明显领先。安装的 RDRAMM 时钟为 4,800 MT/s,容量高达 512 GB。此外,该内存还支持 ECC,这是工作站领域的标准配置。
| 3DMark | |
| 1920x1080 Fire Strike Physics | |
| Intel Core i9-14900K | |
| AMD Ryzen 9 7950X3D | |
| AMD Ryzen 9 7950X | |
| AMD Ryzen Threadripper PRO 7995WX | |
| AMD Ryzen Threadripper PRO 3995WX | |
| AMD Ryzen Threadripper PRO 3975WX | |
| 2560x1440 Time Spy CPU | |
| Intel Core i9-14900K | |
| AMD Ryzen 9 7950X3D | |
| AMD Ryzen 9 7950X | |
| AMD Ryzen Threadripper PRO 7995WX | |
| AMD Ryzen Threadripper PRO 3975WX | |
| AMD Ryzen Threadripper PRO 3995WX | |
| 3DMark 11 - 1280x720 Performance Physics | |
| AMD Ryzen 9 7950X3D | |
| Intel Core i9-14900K | |
| AMD Ryzen 9 7950X | |
| AMD Ryzen Threadripper PRO 7995WX | |
| AMD Ryzen Threadripper PRO 3995WX | |
| AMD Ryzen Threadripper PRO 3975WX | |
| CrossMark - Overall | |
| Intel Core i9-14900K | |
| AMD Ryzen 9 7950X | |
| AMD Ryzen 9 7950X3D | |
| AMD Ryzen Threadripper PRO 7995WX | |
| AIDA64 / Memory Copy | |
| AMD Ryzen Threadripper PRO 7995WX | |
| AMD Ryzen Threadripper PRO 3995WX | |
| Intel Core i9-14900K | |
| Intel Core i9-14900K | |
| AMD Ryzen 9 7950X3D | |
| AMD Ryzen 9 7950X | |
| Average of class (4514 - 234662, n=2213) | |
| AIDA64 / Memory Read | |
| AMD Ryzen Threadripper PRO 7995WX | |
| AMD Ryzen Threadripper PRO 3995WX | |
| Intel Core i9-14900K | |
| Intel Core i9-14900K | |
| AMD Ryzen 9 7950X3D | |
| AMD Ryzen 9 7950X | |
| Average of class (4031 - 271066, n=2175) | |
| AIDA64 / Memory Write | |
| AMD Ryzen Threadripper PRO 7995WX | |
| AMD Ryzen Threadripper PRO 3995WX | |
| AMD Ryzen 9 7950X3D | |
| Intel Core i9-14900K | |
| Intel Core i9-14900K | |
| AMD Ryzen 9 7950X | |
| Average of class (3506 - 242868, n=2180) | |
| AIDA64 / Memory Latency | |
| AMD Ryzen Threadripper PRO 3995WX | |
| Average of class (6.1 - 536, n=2241) | |
| AMD Ryzen Threadripper PRO 7995WX | |
| Intel Core i9-14900K | |
| Intel Core i9-14900K | |
| AMD Ryzen 9 7950X3D | |
| AMD Ryzen 9 7950X | |
* ... smaller is better
三维性能
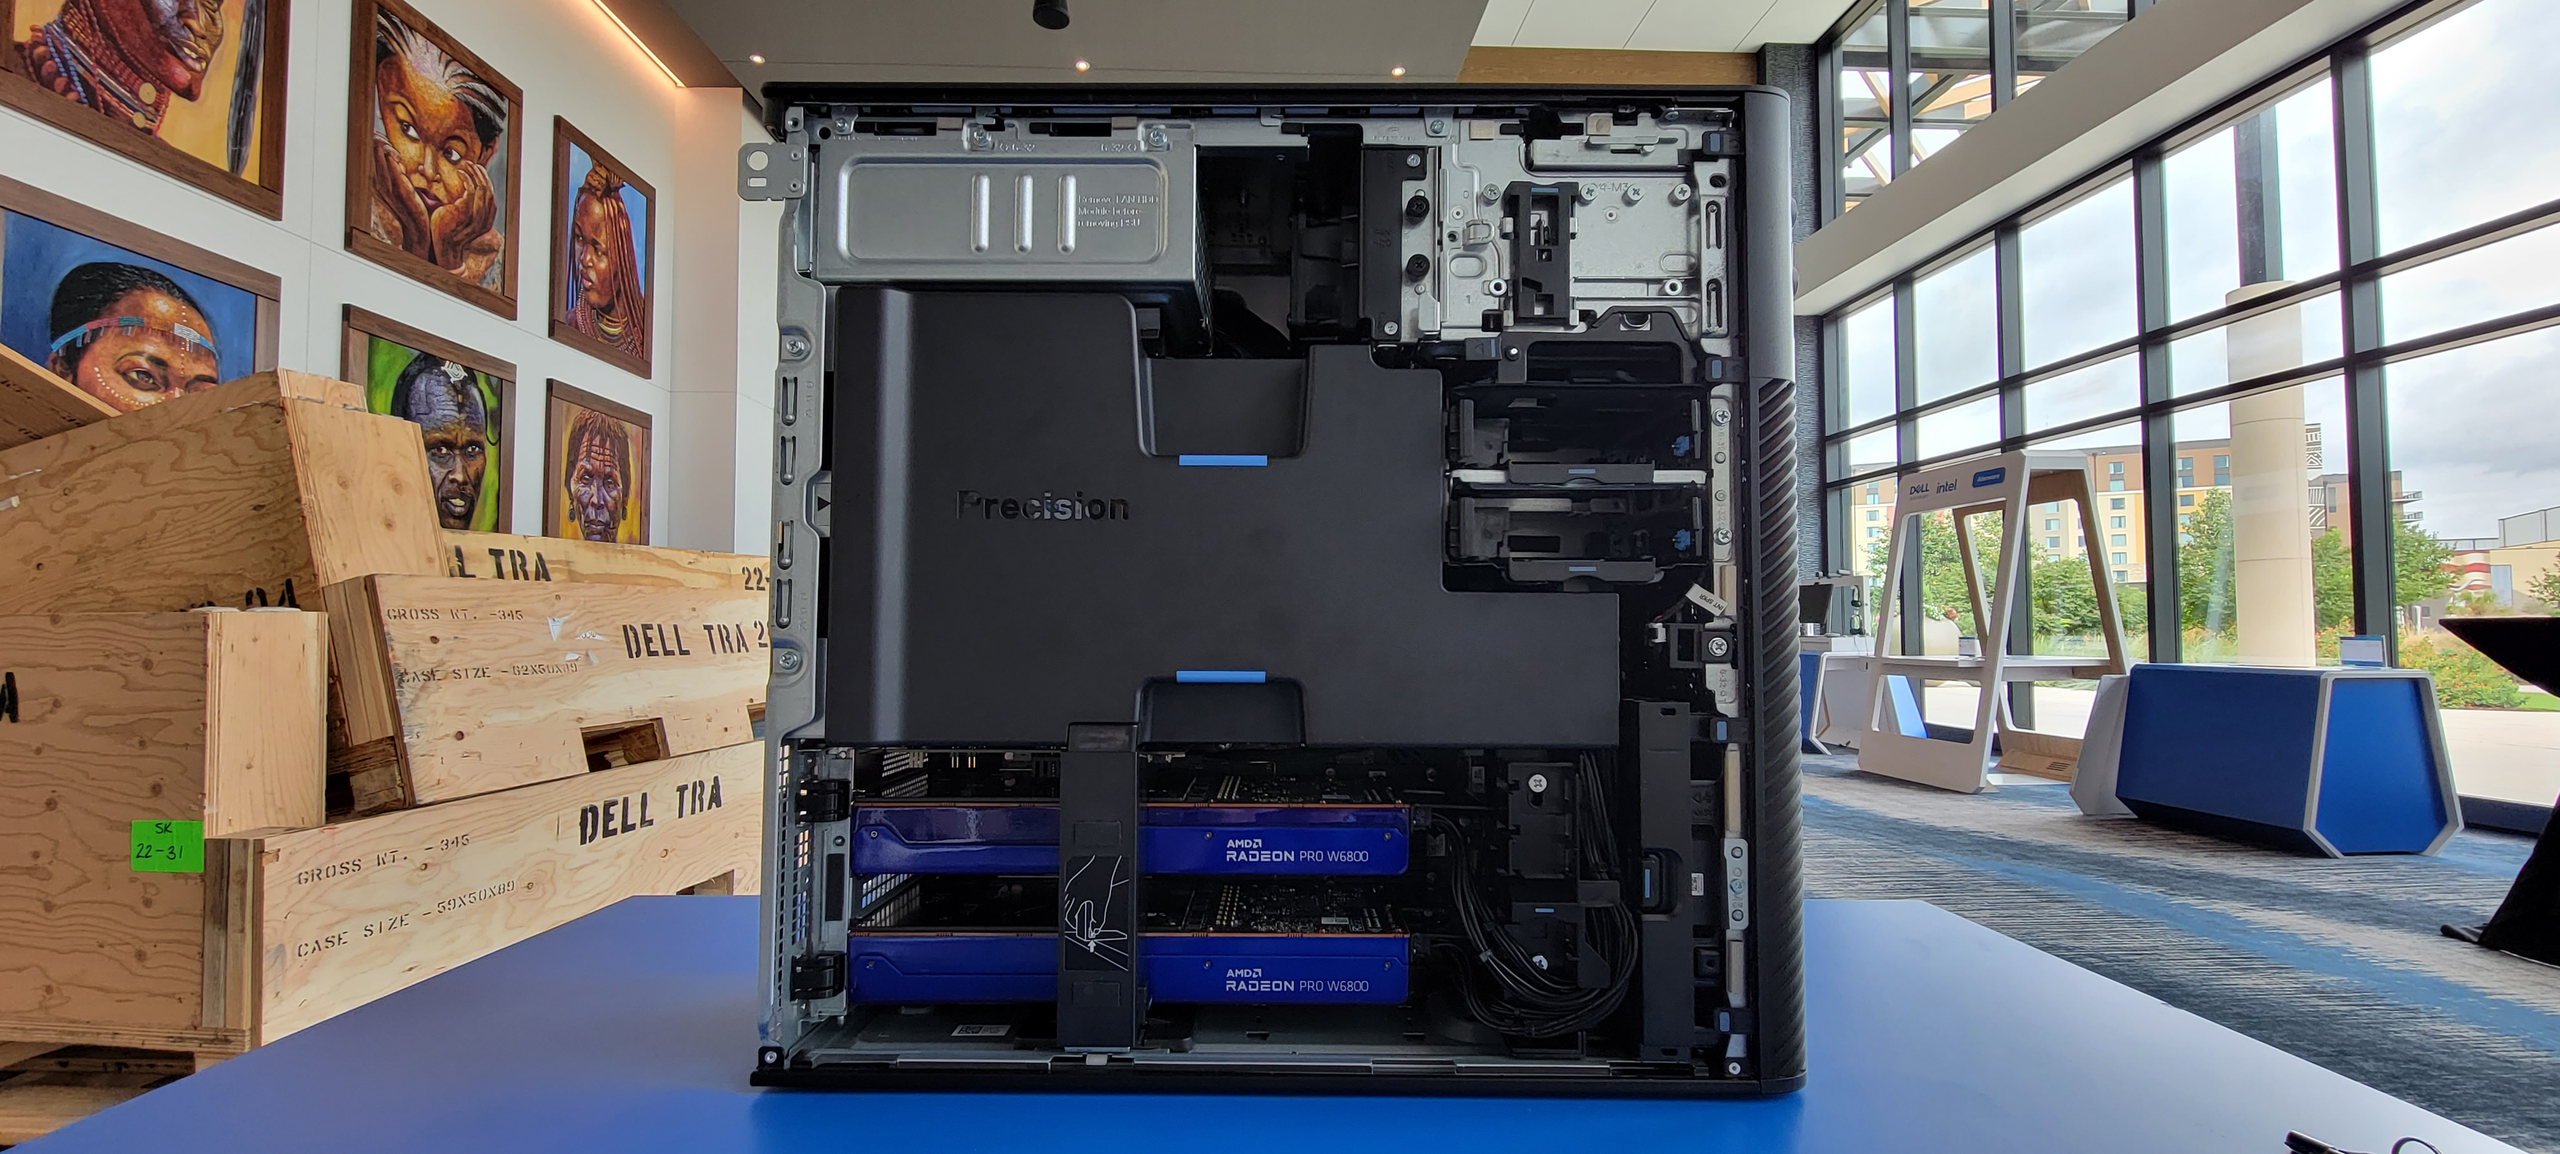
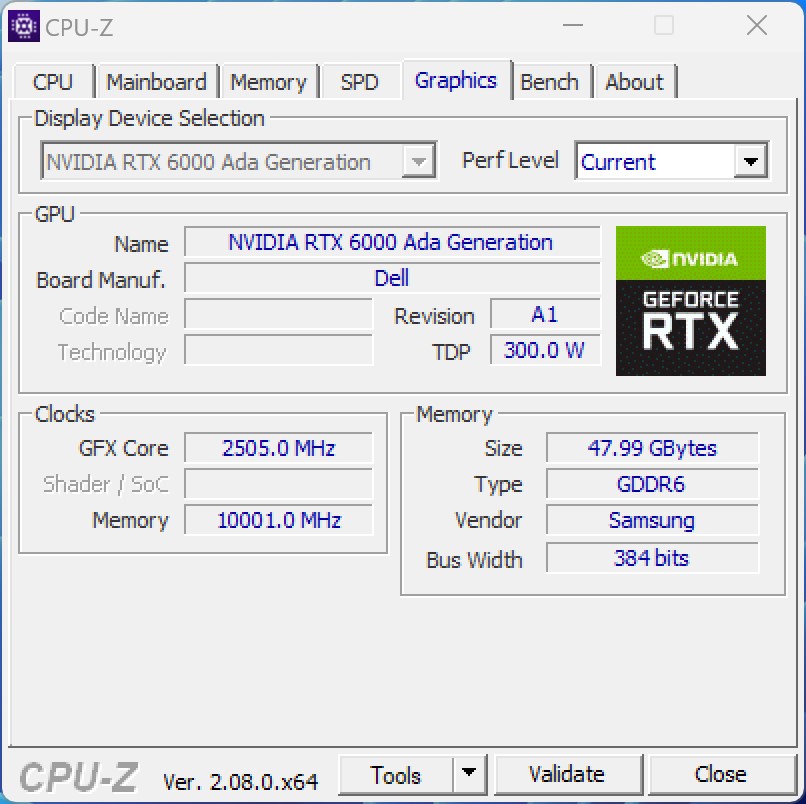
戴尔为戴尔Precision 7875 塔式工作站配备了两块 Nvidia 显卡,特别是当前 Ada 代的 RTX 6000 型号,每块显卡都拥有 48 GB 的 VRAM。由于在某些测试中使用多个 GPU 可能会遇到困难,因此我们使用单块显卡进行了测试。采用的图形芯片是全配置的 AD102,具有 18,176 个着色器。值得注意的是 显卡GeForce RTX 4090采用了稍小的型号,Nvidia 将功耗限制在 300 瓦。与 NvidiaGeForce RTX 4090 相比,RTX 6000 采用标准 GDDR6 VRAM,内存带宽略低。
在我们的测试过程中,结果与其他测试系统相比略显平淡。需要重申的是,由于测试环境的限制,无法复制完整的 3D 性能。不过,Nvidia RTX 6000 Ada Generation 在渲染测试中大放异彩,在某些情况下表现出显著的性能提升。与 NvidiaGeForce RTX 4090 相比,根据不同的评测,我们观察到最多可提高 96% 的功耗。这凸显了驱动程序优化的巨大影响,可惜仅限于专业工作站 GPU。
戴尔Precision 7875 塔式工作站还支持 AMD 的 Radeon PRO 显卡。目前的旗舰产品 AMD Radeon Pro W7900 提供 48 GB 的 VRAM。
有关其他比较和基准,请参阅我们的 GPU 对照表。
| AMD Ryzen Threadripper PRO 7995WX, NVIDIA RTX 6000 Ada Generation RTX 6000 Ada Generation, TR Pro 7995WX | AMD Ryzen Threadripper PRO 3995WX, AMD Radeon Pro W6800 Radeon Pro W6800, TR Pro 3995WX, WDC PC SN720 SDAPNTW-256G | AMD Ryzen Threadripper PRO 3975WX, NVIDIA RTX A6000 RTX A6000, TR Pro 3975WX | AMD Ryzen 9 7950X, NVIDIA Titan RTX Titan RTX, R9 7950X | Intel Core i9-14900K, NVIDIA GeForce RTX 4090 GeForce RTX 4090, i9-14900K, WDC PC SN720 SDAQNTW-512G | AMD Ryzen 9 7950X, NVIDIA GeForce RTX 4090 GeForce RTX 4090, R9 7950X, Corsair MP600 GS | AMD Ryzen 9 7950X3D, NVIDIA GeForce RTX 4090 GeForce RTX 4090, R9 7950X3D | |
|---|---|---|---|---|---|---|---|
| SPECviewperf 2020 | -49% | -51% | -54% | -39% | -43% | -42% | |
| 3840x2160 Siemens NX (snx-04) (fps) | 974 | 434 -55% | 481 -51% | 375 -61% | 47.2 -95% | 41.3 -96% | 42.5 -96% |
| 3840x2160 Medical (medical-03) (fps) | 79 | 52 -34% | 37.9 -52% | 16.5 -79% | 40.3 -49% | 45.9 -42% | 46.2 -42% |
| 3840x2160 Energy (energy-03) (fps) | 457 | 87.7 -81% | 63 -86% | 93.9 -79% | 230 -50% | 141 -69% | 140 -69% |
| 3840x2160 Creo (creo-03) (fps) | 191 | 87.8 -54% | 111 -42% | 135 -29% | 148 -23% | 133 -30% | 140 -27% |
| 3840x2160 CATIA (catia-06) (fps) | 139 | 76.2 -45% | 82.4 -41% | 90.9 -35% | 97.1 -30% | 95.3 -31% | 95.9 -31% |
| 3840x2160 3ds Max (3dsmax-07) (fps) | 207 | 162 -22% | 137 -34% | 118 -43% | 236 14% | 228 10% | 236 14% |
| SPECviewperf 13 | -46% | -38% | -41% | -12% | -16% | -14% | |
| 3ds Max (3dsmax-06) (fps) | 496.95 | 318 -36% | 338 -32% | 321 -35% | 567 14% | 563 13% | 573 15% |
| Catia (catia-05) (fps) | 578.86 | 389 -33% | 371 -36% | 534 -8% | 428 -26% | 402 -31% | 427 -26% |
| Creo (creo-02) (fps) | 590.13 | 366 -38% | 386 -35% | 618 5% | 552 -6% | 577 -2% | |
| Energy (energy-02) (fps) | 230.06 | 87.8 -62% | 132 -43% | 51.8 -77% | 127 -45% | 126 -45% | 127 -45% |
| Maya (maya-05) (fps) | 637.3 | 395 -38% | 415 -35% | 499 -22% | 881 38% | 715 12% | 748 17% |
| Medical (medical-02) (fps) | 331.9 | 116 -65% | 184 -45% | 92 -72% | 180 -46% | 186 -44% | 189 -43% |
| Showcase (showcase-02) (fps) | 430.2 | 216 -50% | 255 -41% | 198 -54% | 400 -7% | 455 6% | 456 6% |
| Siemens NX (snx-03) (fps) | 437 | 638 | 512 | 56.3 | 49.1 | 49.3 | |
| Solidworks (sw-04) (fps) | 278 | 173 -38% | 192 -31% | 218 -22% | 199 -28% | 186 -33% | 191 -31% |
| SPECviewperf 12 | -44% | -39% | -36% | -14% | -28% | -19% | |
| 1900x1060 3ds Max (3dsmax-05) (fps) | 473 | 311 -34% | 336 -29% | 315 -33% | 565 19% | 571 21% | 560 18% |
| 1900x1060 Catia (catia-04) (fps) | 349 | 248 -29% | 229 -34% | 332 -5% | 291 -17% | 257 -26% | 274 -21% |
| 1900x1060 Creo (creo-01) (fps) | 250 | 101 -60% | 136 -46% | 197 -21% | 127 -49% | 115 -54% | 118 -53% |
| 1900x1060 Energy (energy-01) (fps) | 58.2 | 37.8 -35% | 39.8 -32% | 28.8 -51% | 84.7 46% | 54.7 -6% | 80.1 38% |
| 1900x1060 Maya (maya-04) (fps) | 266 | 157 -41% | 144 -46% | 260 -2% | 340 28% | 317 19% | 329 24% |
| 1900x1060 Medical (medical-01) (fps) | 282 | 165 -41% | 159 -44% | 101 -64% | 303 7% | 119 -58% | 212 -25% |
| 1900x1060 Showcase (showcase-01) (fps) | 429 | 215 -50% | 255 -41% | 197 -54% | 398 -7% | 457 7% | 427 0% |
| 1900x1060 Siemens NX (snx-02) (fps) | 677 | 243 -64% | 351 -48% | 283 -58% | 31.4 -95% | 27.1 -96% | 27.4 -96% |
| 1900x1060 Solidworks (sw-03) (fps) | 319 | 185 -42% | 225 -29% | 207 -35% | 139 -56% | 126 -61% | 130 -59% |
| Total Average (Program / Settings) | -46% /
-46% | -43% /
-42% | -44% /
-42% | -22% /
-20% | -29% /
-28% | -25% /
-23% |
游戏基准
| Performance rating - Percent | |
| AMD Ryzen 7 7800X3D, NVIDIA GeForce RTX 4090 | |
| AMD Ryzen 9 7950X3D, NVIDIA GeForce RTX 4090 | |
| Intel Core i9-13900K, NVIDIA GeForce RTX 4090 | |
| AMD Ryzen 9 7950X, NVIDIA GeForce RTX 4090 | |
| AMD Ryzen 5 7600X, NVIDIA GeForce RTX 4090 | |
| Intel Core i7-13700K, NVIDIA GeForce RTX 4090 | |
| Intel Core i7-13700, NVIDIA GeForce RTX 4090 | |
| Intel Core i7-12700, NVIDIA GeForce RTX 4090 | |
| AMD Ryzen Threadripper PRO 7995WX, NVIDIA RTX 6000 Ada Generation | |
| Intel Core i5-13400, NVIDIA GeForce RTX 4090 | |
| Intel Core i5-12400F, NVIDIA GeForce RTX 4090 | |
| Far Cry 5 | |
| 1920x1080 Ultra Preset AA:T | |
| AMD Ryzen 7 7800X3D, NVIDIA GeForce RTX 4090 | |
| AMD Ryzen 9 7950X3D, NVIDIA GeForce RTX 4090 | |
| Intel Core i9-13900K, NVIDIA GeForce RTX 4090 | |
| AMD Ryzen 9 7950X, NVIDIA GeForce RTX 4090 | |
| AMD Ryzen 5 7600X, NVIDIA GeForce RTX 4090 | |
| Intel Core i7-13700, NVIDIA GeForce RTX 4090 | |
| Intel Core i7-13700K, NVIDIA GeForce RTX 4090 | |
| Intel Core i7-12700, NVIDIA GeForce RTX 4090 | |
| Intel Core i5-13400, NVIDIA GeForce RTX 4090 | |
| Intel Core i5-12400F, NVIDIA GeForce RTX 4090 | |
| AMD Ryzen Threadripper PRO 7995WX, NVIDIA RTX 6000 Ada Generation | |
| 1280x720 Low Preset AA:T | |
| AMD Ryzen 7 7800X3D, NVIDIA GeForce RTX 4090 | |
| AMD Ryzen 9 7950X3D, NVIDIA GeForce RTX 4090 | |
| Intel Core i9-13900K, NVIDIA GeForce RTX 4090 | |
| Intel Core i7-13700K, NVIDIA GeForce RTX 4090 | |
| AMD Ryzen 5 7600X, NVIDIA GeForce RTX 4090 | |
| AMD Ryzen 9 7950X, NVIDIA GeForce RTX 4090 | |
| Intel Core i7-13700, NVIDIA GeForce RTX 4090 | |
| Intel Core i7-12700, NVIDIA GeForce RTX 4090 | |
| Intel Core i5-13400, NVIDIA GeForce RTX 4090 | |
| Intel Core i5-12400F, NVIDIA GeForce RTX 4090 | |
| AMD Ryzen Threadripper PRO 7995WX, NVIDIA RTX 6000 Ada Generation | |
| X-Plane 11.11 | |
| 1920x1080 high (fps_test=3) | |
| AMD Ryzen 7 7800X3D, NVIDIA GeForce RTX 4090 | |
| AMD Ryzen 9 7950X3D, NVIDIA GeForce RTX 4090 | |
| Intel Core i9-13900K, NVIDIA GeForce RTX 4090 | |
| AMD Ryzen 9 7950X, NVIDIA GeForce RTX 4090 | |
| AMD Ryzen 5 7600X, NVIDIA GeForce RTX 4090 | |
| Intel Core i7-13700K, NVIDIA GeForce RTX 4090 | |
| Intel Core i7-13700, NVIDIA GeForce RTX 4090 | |
| AMD Ryzen Threadripper PRO 7995WX, NVIDIA RTX 6000 Ada Generation | |
| Intel Core i7-12700, NVIDIA GeForce RTX 4090 | |
| Intel Core i5-13400, NVIDIA GeForce RTX 4090 | |
| Intel Core i5-12400F, NVIDIA GeForce RTX 4090 | |
| 1280x720 low (fps_test=1) | |
| Intel Core i9-13900K, NVIDIA GeForce RTX 4090 | |
| AMD Ryzen 9 7950X3D, NVIDIA GeForce RTX 4090 | |
| Intel Core i7-13700K, NVIDIA GeForce RTX 4090 | |
| AMD Ryzen 9 7950X, NVIDIA GeForce RTX 4090 | |
| AMD Ryzen 7 7800X3D, NVIDIA GeForce RTX 4090 | |
| Intel Core i7-13700, NVIDIA GeForce RTX 4090 | |
| AMD Ryzen 5 7600X, NVIDIA GeForce RTX 4090 | |
| Intel Core i7-12700, NVIDIA GeForce RTX 4090 | |
| AMD Ryzen Threadripper PRO 7995WX, NVIDIA RTX 6000 Ada Generation | |
| Intel Core i5-13400, NVIDIA GeForce RTX 4090 | |
| Intel Core i5-12400F, NVIDIA GeForce RTX 4090 | |
| Final Fantasy XV Benchmark | |
| 1920x1080 High Quality | |
| AMD Ryzen 9 7950X, NVIDIA GeForce RTX 4090 | |
| AMD Ryzen 7 7800X3D, NVIDIA GeForce RTX 4090 | |
| Intel Core i9-13900K, NVIDIA GeForce RTX 4090 | |
| AMD Ryzen 9 7950X3D, NVIDIA GeForce RTX 4090 | |
| Intel Core i7-13700K, NVIDIA GeForce RTX 4090 | |
| AMD Ryzen 5 7600X, NVIDIA GeForce RTX 4090 | |
| Intel Core i7-13700, NVIDIA GeForce RTX 4090 | |
| Intel Core i7-12700, NVIDIA GeForce RTX 4090 | |
| AMD Ryzen Threadripper PRO 7995WX, NVIDIA RTX 6000 Ada Generation | |
| Intel Core i5-13400, NVIDIA GeForce RTX 4090 | |
| Intel Core i5-12400F, NVIDIA GeForce RTX 4090 | |
| 1280x720 Lite Quality | |
| Intel Core i9-13900K, NVIDIA GeForce RTX 4090 | |
| AMD Ryzen 9 7950X, NVIDIA GeForce RTX 4090 | |
| AMD Ryzen 5 7600X, NVIDIA GeForce RTX 4090 | |
| Intel Core i7-13700, NVIDIA GeForce RTX 4090 | |
| Intel Core i7-13700K, NVIDIA GeForce RTX 4090 | |
| AMD Ryzen 7 7800X3D, NVIDIA GeForce RTX 4090 | |
| AMD Ryzen 9 7950X3D, NVIDIA GeForce RTX 4090 | |
| Intel Core i7-12700, NVIDIA GeForce RTX 4090 | |
| AMD Ryzen Threadripper PRO 7995WX, NVIDIA RTX 6000 Ada Generation | |
| Intel Core i5-12400F, NVIDIA GeForce RTX 4090 | |
| Intel Core i5-13400, NVIDIA GeForce RTX 4090 | |
| Dota 2 Reborn | |
| 1920x1080 ultra (3/3) best looking | |
| AMD Ryzen 7 7800X3D, NVIDIA GeForce RTX 4090 | |
| AMD Ryzen 9 7950X3D, NVIDIA GeForce RTX 4090 | |
| AMD Ryzen 9 7950X, NVIDIA GeForce RTX 4090 | |
| Intel Core i9-13900K, NVIDIA GeForce RTX 4090 | |
| AMD Ryzen 5 7600X, NVIDIA GeForce RTX 4090 | |
| Intel Core i7-13700K, NVIDIA GeForce RTX 4090 | |
| Intel Core i7-13700, NVIDIA GeForce RTX 4090 | |
| Intel Core i7-12700, NVIDIA GeForce RTX 4090 | |
| Intel Core i5-13400, NVIDIA GeForce RTX 4090 | |
| Intel Core i5-12400F, NVIDIA GeForce RTX 4090 | |
| AMD Ryzen Threadripper PRO 7995WX, NVIDIA RTX 6000 Ada Generation | |
| 1280x720 min (0/3) fastest | |
| AMD Ryzen 7 7800X3D, NVIDIA GeForce RTX 4090 | |
| AMD Ryzen 9 7950X3D, NVIDIA GeForce RTX 4090 | |
| AMD Ryzen 9 7950X, NVIDIA GeForce RTX 4090 | |
| Intel Core i9-13900K, NVIDIA GeForce RTX 4090 | |
| AMD Ryzen 5 7600X, NVIDIA GeForce RTX 4090 | |
| Intel Core i7-13700K, NVIDIA GeForce RTX 4090 | |
| Intel Core i7-13700, NVIDIA GeForce RTX 4090 | |
| Intel Core i7-12700, NVIDIA GeForce RTX 4090 | |
| Intel Core i5-12400F, NVIDIA GeForce RTX 4090 | |
| Intel Core i5-13400, NVIDIA GeForce RTX 4090 | |
| AMD Ryzen Threadripper PRO 7995WX, NVIDIA RTX 6000 Ada Generation | |
| The Witcher 3 | |
| 1920x1080 Ultra Graphics & Postprocessing (HBAO+) | |
| Intel Core i9-13900K, NVIDIA GeForce RTX 4090 | |
| AMD Ryzen 9 7950X, NVIDIA GeForce RTX 4090 | |
| AMD Ryzen 7 7800X3D, NVIDIA GeForce RTX 4090 | |
| AMD Ryzen 5 7600X, NVIDIA GeForce RTX 4090 | |
| Intel Core i7-13700K, NVIDIA GeForce RTX 4090 | |
| Intel Core i7-13700, NVIDIA GeForce RTX 4090 | |
| AMD Ryzen 9 7950X3D, NVIDIA GeForce RTX 4090 | |
| Intel Core i7-12700, NVIDIA GeForce RTX 4090 | |
| Intel Core i5-13400, NVIDIA GeForce RTX 4090 | |
| Intel Core i5-12400F, NVIDIA GeForce RTX 4090 | |
| AMD Ryzen Threadripper PRO 7995WX, NVIDIA RTX 6000 Ada Generation | |
| 1024x768 Low Graphics & Postprocessing | |
| AMD Ryzen 9 7950X3D, NVIDIA GeForce RTX 4090 | |
| AMD Ryzen 7 7800X3D, NVIDIA GeForce RTX 4090 | |
| AMD Ryzen 9 7950X, NVIDIA GeForce RTX 4090 | |
| Intel Core i9-13900K, NVIDIA GeForce RTX 4090 | |
| AMD Ryzen 5 7600X, NVIDIA GeForce RTX 4090 | |
| Intel Core i7-13700K, NVIDIA GeForce RTX 4090 | |
| Intel Core i7-13700, NVIDIA GeForce RTX 4090 | |
| AMD Ryzen Threadripper PRO 7995WX, NVIDIA RTX 6000 Ada Generation | |
| Intel Core i7-12700, NVIDIA GeForce RTX 4090 | |
| Intel Core i5-13400, NVIDIA GeForce RTX 4090 | |
| Intel Core i5-12400F, NVIDIA GeForce RTX 4090 | |
| Borderlands 3 | |
| 1280x720 Very Low Overall Quality (DX11) | |
| AMD Ryzen 7 7800X3D, NVIDIA GeForce RTX 4090 | |
| AMD Ryzen 9 7950X3D, NVIDIA GeForce RTX 4090 | |
| Intel Core i9-13900K, NVIDIA GeForce RTX 4090 | |
| AMD Ryzen 9 7950X, NVIDIA GeForce RTX 4090 | |
| AMD Ryzen 5 7600X, NVIDIA GeForce RTX 4090 | |
| Intel Core i7-13700, NVIDIA GeForce RTX 4090 | |
| Intel Core i7-13700K, NVIDIA GeForce RTX 4090 | |
| Intel Core i7-12700, NVIDIA GeForce RTX 4090 | |
| AMD Ryzen Threadripper PRO 7995WX, NVIDIA RTX 6000 Ada Generation | |
| Intel Core i5-13400, NVIDIA GeForce RTX 4090 | |
| Intel Core i5-12400F, NVIDIA GeForce RTX 4090 | |
| 1920x1080 Badass Overall Quality (DX11) | |
| AMD Ryzen 9 7950X3D, NVIDIA GeForce RTX 4090 | |
| AMD Ryzen 7 7800X3D, NVIDIA GeForce RTX 4090 | |
| AMD Ryzen 9 7950X, NVIDIA GeForce RTX 4090 | |
| Intel Core i9-13900K, NVIDIA GeForce RTX 4090 | |
| AMD Ryzen 5 7600X, NVIDIA GeForce RTX 4090 | |
| Intel Core i7-13700K, NVIDIA GeForce RTX 4090 | |
| Intel Core i7-13700, NVIDIA GeForce RTX 4090 | |
| Intel Core i7-12700, NVIDIA GeForce RTX 4090 | |
| AMD Ryzen Threadripper PRO 7995WX, NVIDIA RTX 6000 Ada Generation | |
| Intel Core i5-13400, NVIDIA GeForce RTX 4090 | |
| Intel Core i5-12400F, NVIDIA GeForce RTX 4090 | |
| Far Cry New Dawn | |
| 1280x720 Low Preset | |
| AMD Ryzen 7 7800X3D, NVIDIA GeForce RTX 4090 | |
| AMD Ryzen 9 7950X3D, NVIDIA GeForce RTX 4090 | |
| Intel Core i9-13900K, NVIDIA GeForce RTX 4090 | |
| Intel Core i7-13700, NVIDIA GeForce RTX 4090 | |
| Intel Core i7-13700K, NVIDIA GeForce RTX 4090 | |
| AMD Ryzen 9 7950X, NVIDIA GeForce RTX 4090 | |
| AMD Ryzen 5 7600X, NVIDIA GeForce RTX 4090 | |
| Intel Core i7-12700, NVIDIA GeForce RTX 4090 | |
| Intel Core i5-13400, NVIDIA GeForce RTX 4090 | |
| Intel Core i5-12400F, NVIDIA GeForce RTX 4090 | |
| AMD Ryzen Threadripper PRO 7995WX, NVIDIA RTX 6000 Ada Generation | |
| 1920x1080 Ultra Preset | |
| AMD Ryzen 7 7800X3D, NVIDIA GeForce RTX 4090 | |
| AMD Ryzen 9 7950X3D, NVIDIA GeForce RTX 4090 | |
| Intel Core i9-13900K, NVIDIA GeForce RTX 4090 | |
| AMD Ryzen 9 7950X, NVIDIA GeForce RTX 4090 | |
| Intel Core i7-13700K, NVIDIA GeForce RTX 4090 | |
| AMD Ryzen 5 7600X, NVIDIA GeForce RTX 4090 | |
| Intel Core i7-13700, NVIDIA GeForce RTX 4090 | |
| Intel Core i7-12700, NVIDIA GeForce RTX 4090 | |
| Intel Core i5-13400, NVIDIA GeForce RTX 4090 | |
| Intel Core i5-12400F, NVIDIA GeForce RTX 4090 | |
| AMD Ryzen Threadripper PRO 7995WX, NVIDIA RTX 6000 Ada Generation | |
| Shadow of the Tomb Raider | |
| 1280x720 Lowest Preset | |
| AMD Ryzen 7 7800X3D, NVIDIA GeForce RTX 4090 | |
| AMD Ryzen 9 7950X3D, NVIDIA GeForce RTX 4090 | |
| AMD Ryzen 9 7950X, NVIDIA GeForce RTX 4090 | |
| AMD Ryzen 5 7600X, NVIDIA GeForce RTX 4090 | |
| Intel Core i9-13900K, NVIDIA GeForce RTX 4090 | |
| Intel Core i7-13700, NVIDIA GeForce RTX 4090 | |
| Intel Core i7-13700K, NVIDIA GeForce RTX 4090 | |
| AMD Ryzen Threadripper PRO 7995WX, NVIDIA RTX 6000 Ada Generation | |
| Intel Core i7-12700, NVIDIA GeForce RTX 4090 | |
| Intel Core i5-13400, NVIDIA GeForce RTX 4090 | |
| Intel Core i5-12400F, NVIDIA GeForce RTX 4090 | |
| 1920x1080 Highest Preset AA:T | |
| AMD Ryzen 7 7800X3D, NVIDIA GeForce RTX 4090 | |
| AMD Ryzen 9 7950X3D, NVIDIA GeForce RTX 4090 | |
| AMD Ryzen 9 7950X, NVIDIA GeForce RTX 4090 | |
| Intel Core i9-13900K, NVIDIA GeForce RTX 4090 | |
| AMD Ryzen 5 7600X, NVIDIA GeForce RTX 4090 | |
| Intel Core i7-13700K, NVIDIA GeForce RTX 4090 | |
| Intel Core i7-13700, NVIDIA GeForce RTX 4090 | |
| AMD Ryzen Threadripper PRO 7995WX, NVIDIA RTX 6000 Ada Generation | |
| Intel Core i7-12700, NVIDIA GeForce RTX 4090 | |
| Intel Core i5-13400, NVIDIA GeForce RTX 4090 | |
| Intel Core i5-12400F, NVIDIA GeForce RTX 4090 | |
| Tiny Tina's Wonderlands | |
| 1920x1080 Low Preset (DX12) | |
| AMD Ryzen 7 7800X3D, NVIDIA GeForce RTX 4090 | |
| AMD Ryzen 9 7950X3D, NVIDIA GeForce RTX 4090 | |
| AMD Ryzen 9 7950X, NVIDIA GeForce RTX 4090 | |
| AMD Ryzen 5 7600X, NVIDIA GeForce RTX 4090 | |
| Intel Core i9-13900K, NVIDIA GeForce RTX 4090 | |
| Intel Core i7-13700, NVIDIA GeForce RTX 4090 | |
| Intel Core i7-13700K, NVIDIA GeForce RTX 4090 | |
| AMD Ryzen Threadripper PRO 7995WX, NVIDIA RTX 6000 Ada Generation | |
| Intel Core i7-12700, NVIDIA GeForce RTX 4090 | |
| Intel Core i5-13400, NVIDIA GeForce RTX 4090 | |
| Intel Core i5-12400F, NVIDIA GeForce RTX 4090 | |
| 1920x1080 Badass Preset (DX12) | |
| AMD Ryzen 7 7800X3D, NVIDIA GeForce RTX 4090 | |
| AMD Ryzen 9 7950X3D, NVIDIA GeForce RTX 4090 | |
| AMD Ryzen 9 7950X, NVIDIA GeForce RTX 4090 | |
| AMD Ryzen 5 7600X, NVIDIA GeForce RTX 4090 | |
| Intel Core i9-13900K, NVIDIA GeForce RTX 4090 | |
| Intel Core i7-13700, NVIDIA GeForce RTX 4090 | |
| Intel Core i7-13700K, NVIDIA GeForce RTX 4090 | |
| Intel Core i7-12700, NVIDIA GeForce RTX 4090 | |
| AMD Ryzen Threadripper PRO 7995WX, NVIDIA RTX 6000 Ada Generation | |
| Intel Core i5-13400, NVIDIA GeForce RTX 4090 | |
| Intel Core i5-12400F, NVIDIA GeForce RTX 4090 | |
| Metro Exodus | |
| 1280x720 Low Quality AF:4x | |
| AMD Ryzen 7 7800X3D, NVIDIA GeForce RTX 4090 | |
| AMD Ryzen 5 7600X, NVIDIA GeForce RTX 4090 | |
| AMD Ryzen 9 7950X, NVIDIA GeForce RTX 4090 | |
| AMD Ryzen 9 7950X3D, NVIDIA GeForce RTX 4090 | |
| Intel Core i7-13700, NVIDIA GeForce RTX 4090 | |
| Intel Core i9-13900K, NVIDIA GeForce RTX 4090 | |
| Intel Core i7-13700K, NVIDIA GeForce RTX 4090 | |
| Intel Core i7-12700, NVIDIA GeForce RTX 4090 | |
| Intel Core i5-12400F, NVIDIA GeForce RTX 4090 | |
| Intel Core i5-13400, NVIDIA GeForce RTX 4090 | |
| AMD Ryzen Threadripper PRO 7995WX, NVIDIA RTX 6000 Ada Generation | |
| 1920x1080 Ultra Quality AF:16x | |
| AMD Ryzen 7 7800X3D, NVIDIA GeForce RTX 4090 | |
| AMD Ryzen 9 7950X, NVIDIA GeForce RTX 4090 | |
| AMD Ryzen 5 7600X, NVIDIA GeForce RTX 4090 | |
| AMD Ryzen 9 7950X3D, NVIDIA GeForce RTX 4090 | |
| Intel Core i9-13900K, NVIDIA GeForce RTX 4090 | |
| Intel Core i7-13700, NVIDIA GeForce RTX 4090 | |
| Intel Core i7-13700K, NVIDIA GeForce RTX 4090 | |
| Intel Core i7-12700, NVIDIA GeForce RTX 4090 | |
| Intel Core i5-13400, NVIDIA GeForce RTX 4090 | |
| Intel Core i5-12400F, NVIDIA GeForce RTX 4090 | |
| AMD Ryzen Threadripper PRO 7995WX, NVIDIA RTX 6000 Ada Generation | |
| low | med. | high | ultra | QHD | 4K DLSS | 4K | |
|---|---|---|---|---|---|---|---|
| The Witcher 3 (2015) | 661 | 579 | 489 | 260 | 219 | 183.5 | |
| Dota 2 Reborn (2015) | 168.7 | 159 | 164.8 | 153.6 | 153.1 | ||
| Final Fantasy XV Benchmark (2018) | 228 | 228 | 201 | 194.7 | 124.2 | ||
| X-Plane 11.11 (2018) | 163.5 | 155.6 | 123.3 | 100.7 | |||
| Far Cry 5 (2018) | 144 | 130 | 126 | 118 | 118 | 115 | |
| Shadow of the Tomb Raider (2018) | 265 | 250 | 240 | 233 | 219 | 127.9 | |
| Far Cry New Dawn (2019) | 127 | 113 | 109 | 100 | 99 | 98 | |
| Metro Exodus (2019) | 167.6 | 125 | 114.4 | 103.6 | 94.5 | 89.8 | |
| Borderlands 3 (2019) | 181.9 | 156.5 | 153.2 | 141 | 138.1 | 87.7 | |
| Horizon Zero Dawn (2020) | 238 | 220 | 208 | 199 | 192 | 173 | 125 |
| Far Cry 6 (2021) | 177.8 | 159.2 | 143.5 | 142.9 | 138.9 | 109.9 | |
| Tiny Tina's Wonderlands (2022) | 334 | 265 | 232 | 219 | 175.3 | 87.3 | |
| A Plague Tale Requiem (2022) | 183.6 | 169.3 | 160.6 | 131 | 94.2 | 108.4 | 54 |
| The Witcher 3 v4 (2023) | 287 | 248 | 219 | 210 | 208 | 128.1 | |
| Starfield (2023) | 140.5 | 129 | 112.6 | 103.9 | 89.1 | 62.9 | |
| Cyberpunk 2077 (2023) | 164.2 | 162.5 | 155.3 | 147.2 | 131 | 60.3 | |
| Total War Pharaoh (2023) | 330.6 | 215.3 | 157.5 | 140.9 | 140.7 | 112.7 |
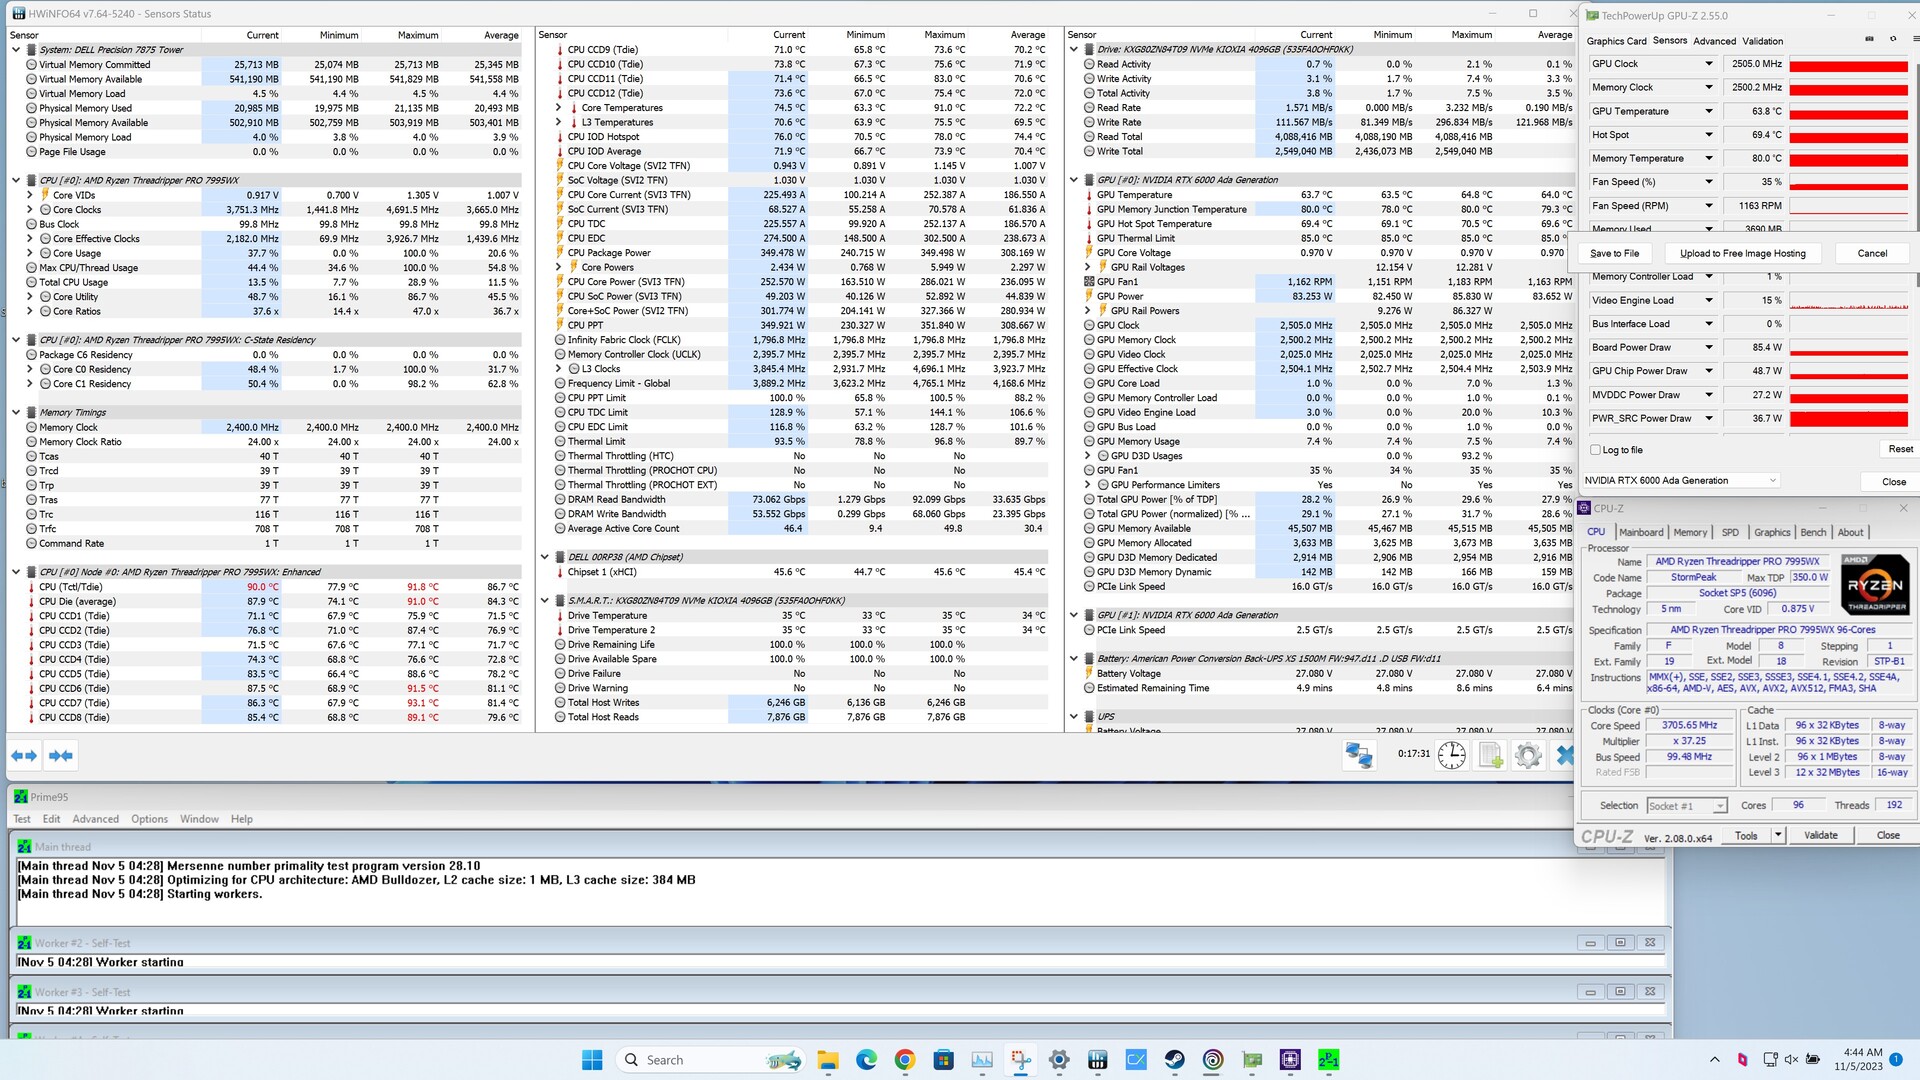
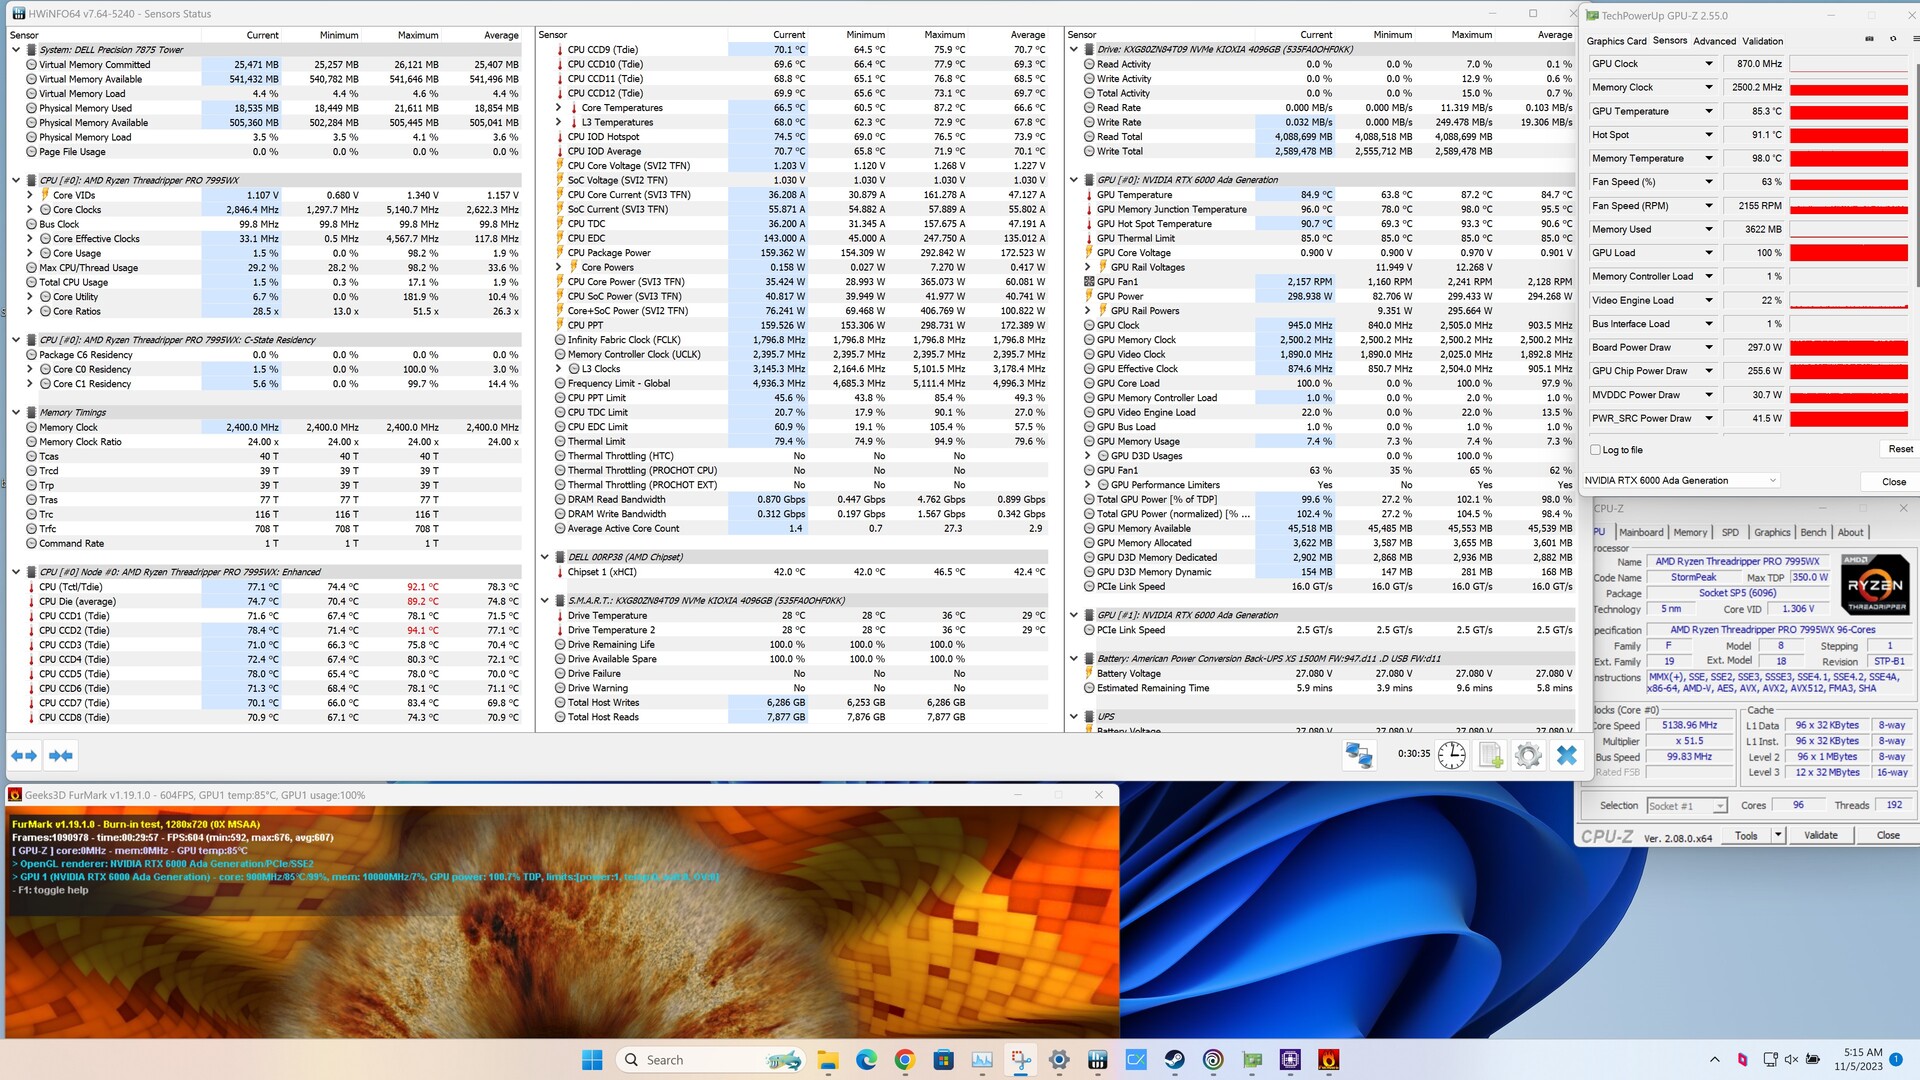
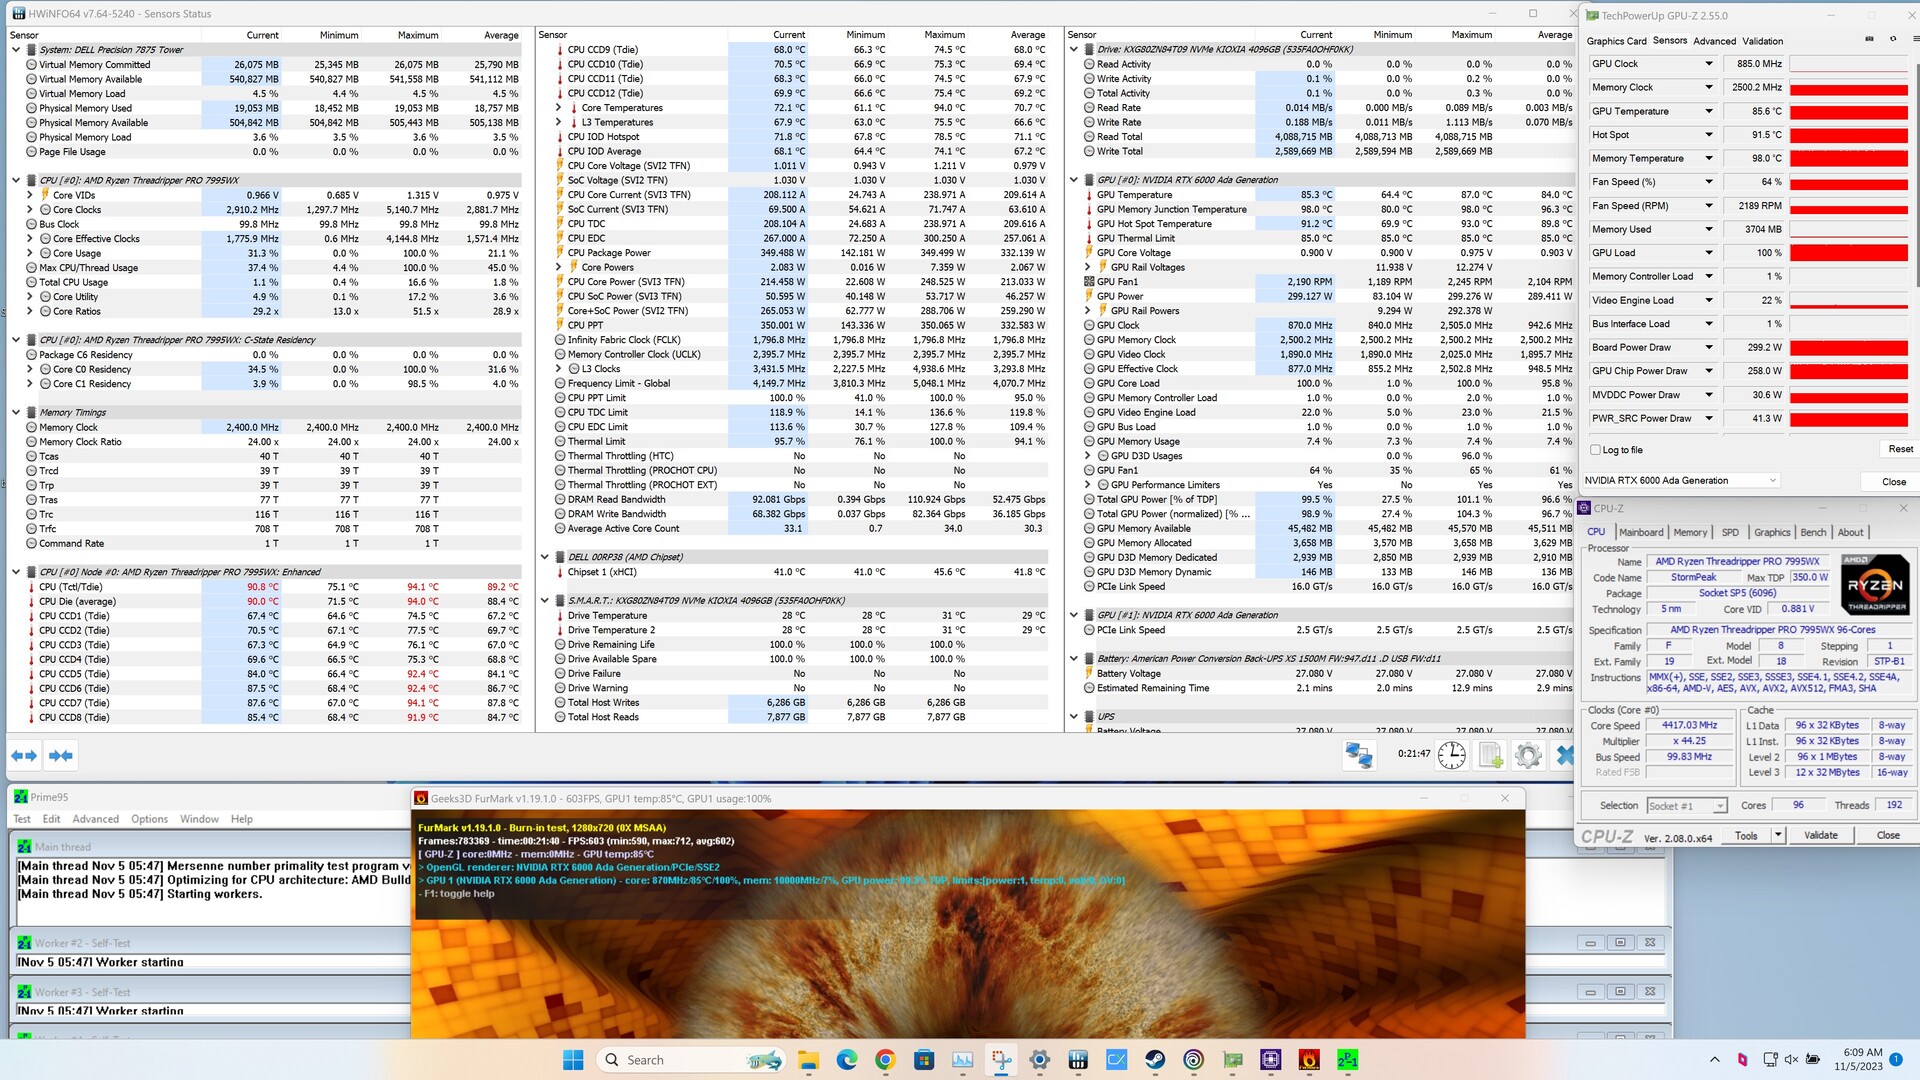
排放量
由于测试条件的限制,排放值完全来自 HWiNFO 的结果。系统在三种不同场景下进行了压力测试。在 Prime95 压力测试中,AMD Ryzen Threadripper Pro 7995WX 表现出稳定的运行状态。处理器以 3.6 GHz 的频率运行,持续超过 2.5 GHz 的基本时钟频率。温度稳定在 87 ℃ 左右,最高温度略低于 92 ℃。在整个压力测试过程中,Nvidia RTX 6000 Ada 一代处理器始终保持最高性能,在 300 瓦功率下没有观察到任何性能损失。不过,我们记录到 GPU 的热点值为 91 °C,而 VRAM 则高达 98 °C。当同时加载 CPU 和 GPU 时,没有明显的差异。AMD Ryzen Threadripper Pro 7995WX 的平均温度略有上升,达到 89 ℃。
戴尔Precision 7875 立式工作站的散热概念采用了腔体设计。上部区域覆盖处理器和内存,将气流直接导入组件进行冷却。两块显卡位于下部区域,通过前置风扇接收新鲜空气。值得注意的是,Nvidia 为 RTX 6000 Ada 配备了鼓风机设计,可直接从外壳排出废热。消费级显卡有时也会采用这一概念。
Pros
Cons
结论 - 中档汽车价格的高端工作站
戴尔Precision 7875 立式工作站集成了 AMD 最快速的工作站处理器,在纯粹的性能方面建立了新的基准。AMD Ryzen Threadripper Pro 7995WX 采用 Zen4 架构,具有强大的计算能力,在散热器下集成了多达 96 个内核,这是一项突破性的成就。因此,该处理器可同时处理多达 192 个线程。配合 512GB 内存和两块 Nvidia RTX 6000 Ada 代显卡,这款工作站可有效处理资源密集型项目。
所有这些组件都安装在一个相对紧凑的塔式机箱内,并配备了精密的冷却系统。在测试过程中,没有出现超过 100°C 的临界温度,这充分证明了冷却概念的有效性,即使在满负荷情况下也能确保平稳运行。
戴尔Precision 7875 塔式工作站配备了 AMD Ryzen Threadripper Pro 7995WX,是目前多核应用中速度最快的处理器。
与处理器相配套,内置显卡也是工作站 PC 的关键要素。来自 Nvidia 的顶级型号 RTX 6000 Ada 可提供充足的动力。与 Nvidia 的GeForce RTX 4090 相比,采用完整版 AD102 的专业型显卡可以提供更高的性能,前提是在各种渲染测试中提供有效的驱动程序支持。
虽然公司尚未最终确定定价细节,但戴尔内部商店允许用户根据自己的喜好配置戴尔Precision 7875 立式工作站。入门级机型的起价仅为 3000 美元。对于那些希望突破极限的用户,可以组装一套超过 5 万美元的系统。
价格和供应情况
戴尔Precision 7875 塔式工作站(此处测试的配置)目前尚未上市。不过,戴尔Precision 7875 塔式工作站的 5000 代 Threadripper 型号在制造商的商店页面上有售。基本型号的起价仅为 ~ 3000 美元。
Transparency
The selection of devices to be reviewed is made by our editorial team. The test sample was provided to the author as a loan by the manufacturer or retailer for the purpose of this review. The lender had no influence on this review, nor did the manufacturer receive a copy of this review before publication. There was no obligation to publish this review. As an independent media company, Notebookcheck is not subjected to the authority of manufacturers, retailers or publishers.
This is how Notebookcheck is testing
Every year, Notebookcheck independently reviews hundreds of laptops and smartphones using standardized procedures to ensure that all results are comparable. We have continuously developed our test methods for around 20 years and set industry standards in the process. In our test labs, high-quality measuring equipment is utilized by experienced technicians and editors. These tests involve a multi-stage validation process. Our complex rating system is based on hundreds of well-founded measurements and benchmarks, which maintains objectivity. Further information on our test methods can be found here.

